Article

Comprehensive Evaluation of High-Resolution Satellite-Based Precipitation Products over China

1
State Key Laboratory of Desert and Oasis Ecology, Xinjiang Institute of Ecology and Geography, Chinese Academy of Sciences, Urumqi 830011, China
2
University of Chinese Academy of Sciences, Beijing 100049, China
3
Key Laboratory of Beibu Gulf Environmental Evolution and Resources Utilization (Guangxi Teachers Education University), Ministry of Education, Nanning 530001, China
4
School of Computer Science, University of Oklahoma, Norman, OK 73072, USA
5
Institute of Remote Sensing and Digital Earth, Chinese Academy of Sciences, Beijing 100094, China
6
School of Meteorology, University of Oklahoma, Norman, OK 73072, USA
*
Author to whom correspondence should be addressed.
Atmosphere 2016, 7(1), 6; https://doi.org/10.3390/atmos7010006
Submission received: 28 October 2015 / Revised: 4 December 2015 / Accepted: 8 December 2015 / Published: 31 December 2015

Abstract

:
Characterizing the errors in satellite-based precipitation estimation products is crucial for understanding their effects in hydrological applications. Six precipitation products derived from three algorithms are comprehensively evaluated against gauge data over mainland China from December 2006 to November 2010. These products include three satellite-only estimates: the Global Satellite Mapping of Precipitation Microwave-IR Combined Product (GSMaP_MVK), the Climate Prediction Center (CPC) MORPHing (CMORPH), and Precipitation Estimation from Remotely Sensed Information using Artificial Neural Networks (PERSIANN), as well as their gauge-corrected counterparts: the GSMaP Gauge-calibrated Product (GSMaP_Gauge), bias-corrected CMORPH (CMORPH_CRT), and PERSIANN Climate Data Record (PERSIANN-CDR). Overall, the bias-correction procedures largely reduce various errors for the three groups of satellite-based precipitation products. GSMaP_Gauge produces better fractional coverage with the highest correlation (0.95) and the lowest RMSE (0.53 mm/day) but also high RB (15.77%). In general, CMORPH_CRT amounts are closer to the gauge reference. CMORPH shows better performance than GSMaP_MVK and PERSIANN with the highest CC (0.82) and the lowest RMSE (0.93 mm/day), but also presents a relatively high RB (−19.60%). In winter, all six satellite precipitation estimates have comparatively poor capability, with the IR-based PERSIANN_CDR exhibiting the closest performance to the gauge reference. Both satellite-only and gauge-corrected satellite products show poor capability in detecting occurrence of precipitation with a low POD (<50%) and CSI (<35%) and a high FAR (>40%).

Graphical Abstract

1. Introduction

Precipitation measurements provide useful information for evaluating the global water cycle and energy balance and also supply crucial input for hydrological applications [1]. However, obtaining reliable surface precipitation measurements is challenging due to the heterogeneity of precipitation at different spatiotemporal scales. Precipitation estimates obtained from rain gauges are generally considered the most accurate estimates since they directly measure the precipitation. Unfortunately, rain gauges tend to be unevenly distributed and gauge coverage is often quite sparse over remote/rural areas. This sparsity constitutes a significant challenge because gauge-based rainfall estimates are often not representative of nearby rainfall rates in precipitation events containing large gradients of precipitation rates [2]. With the development of remote sensing technology, it is possible to obtain Quantitative Precipitation Estimates (QPE) over regional and global scales, which consequently increase our understanding of the energy balance and water cycle. At present, a series of multi-sensor blended global precipitation products have been released that offer improvements over single sensor estimates. Some notable products of this type include the Precipitation Estimation from Remotely Sensed Information using Artificial Neural Networks (PERSIANN) [3,4], the National Oceanic and Atmospheric Administration’s (NOAA) CPC morphing technique (CMORPH) [5], the Global Satellite Mapping of Precipitation (GSMaP) project [6], and the Tropical Rainfall Measuring Mission (TRMM) Multi-satellite Precipitation Analysis (TMPA) [7]. Many studies have investigated the uncertainties of satellite-based precipitation products over varying climatic, geographic and topographic regimes [8,9,10,11,12,13], and these products have been increasingly utilized in natural hazard (e.g., flood and landslide) monitoring, climate research, and hydrology-related fields [14,15,16,17,18,19,20]. Despite the proven utility of these techniques, the error sources associated with these products are generally not well understood. In addition, with the continuing evolution of retrieval algorithms and changes in data sources, the performance of these products continues to change [21,22]. With this variability in mind, the errors and performance of an algorithm must be characterized in order to provide useful estimations [23]. Furthermore, the quantification of error characteristics is necessary for data assimilation [24], development and improvement of the retrieval algorithms, climate analysis [25], hydrological modeling [26,27], as well as hazards’ monitoring and forecasting [1,28].
Much effort has been made to evaluate the TMPA, including comparisons using the near real time CMORPH and PERSIANN over different regions [4,29,30,31,32,33,34,35,36]. Similar comparisons have been made using GSMaP_MVK products over Japan, Nepal, Thailand, Vietnam and the United States [6,37,38,39,40,41,42,43]. However, to the best of our knowledge, there has not yet been a systematic evaluation of the gauge-corrected GSMaP product (GSMaP_Gauge, [44]) over China. Additionally, there have been few studies on the performance of the bias-corrected CMORPH and PERSIANN products (CMORPH_CRT and PERSIANN_CDR). The satellite-only datasets, which include GSMaP_MVK, CMORPH, and PERSIANN, have been extensively evaluated over China in previous studies [45,46,47,48,49,50].
The primary objective of this study is to identify the strengths and weaknesses of the currently popular satellite-based QPE products (i.e., GSMaP, CMORPH, and PERISANN) over China. Herein, GSMaP_MVK, CMORPH, and PERSIANN will refer to the satellite-only precipitation estimates, while GSMaP_Gauge, CMORPH_CRT, and PERSIANN_CDR will denote the corresponding bias-corrected estimates. Specifically, the error structures of each product are characterized as a function of time and space, and therefore, this study may assist in determining the optimal selection of QPE products for hydro-meteorological applications over China.
The remaining parts of this paper are organized as follows: Section 2 introduces the satellite-based and gauge precipitation datasets as well as the evaluation methods. Section 3 provides an analysis of the spatial characteristics and error quantification for different satellite-based QPE products. A summary of analysis results and notable conclusions are given in Section 4.

2. Study Area and Dataset
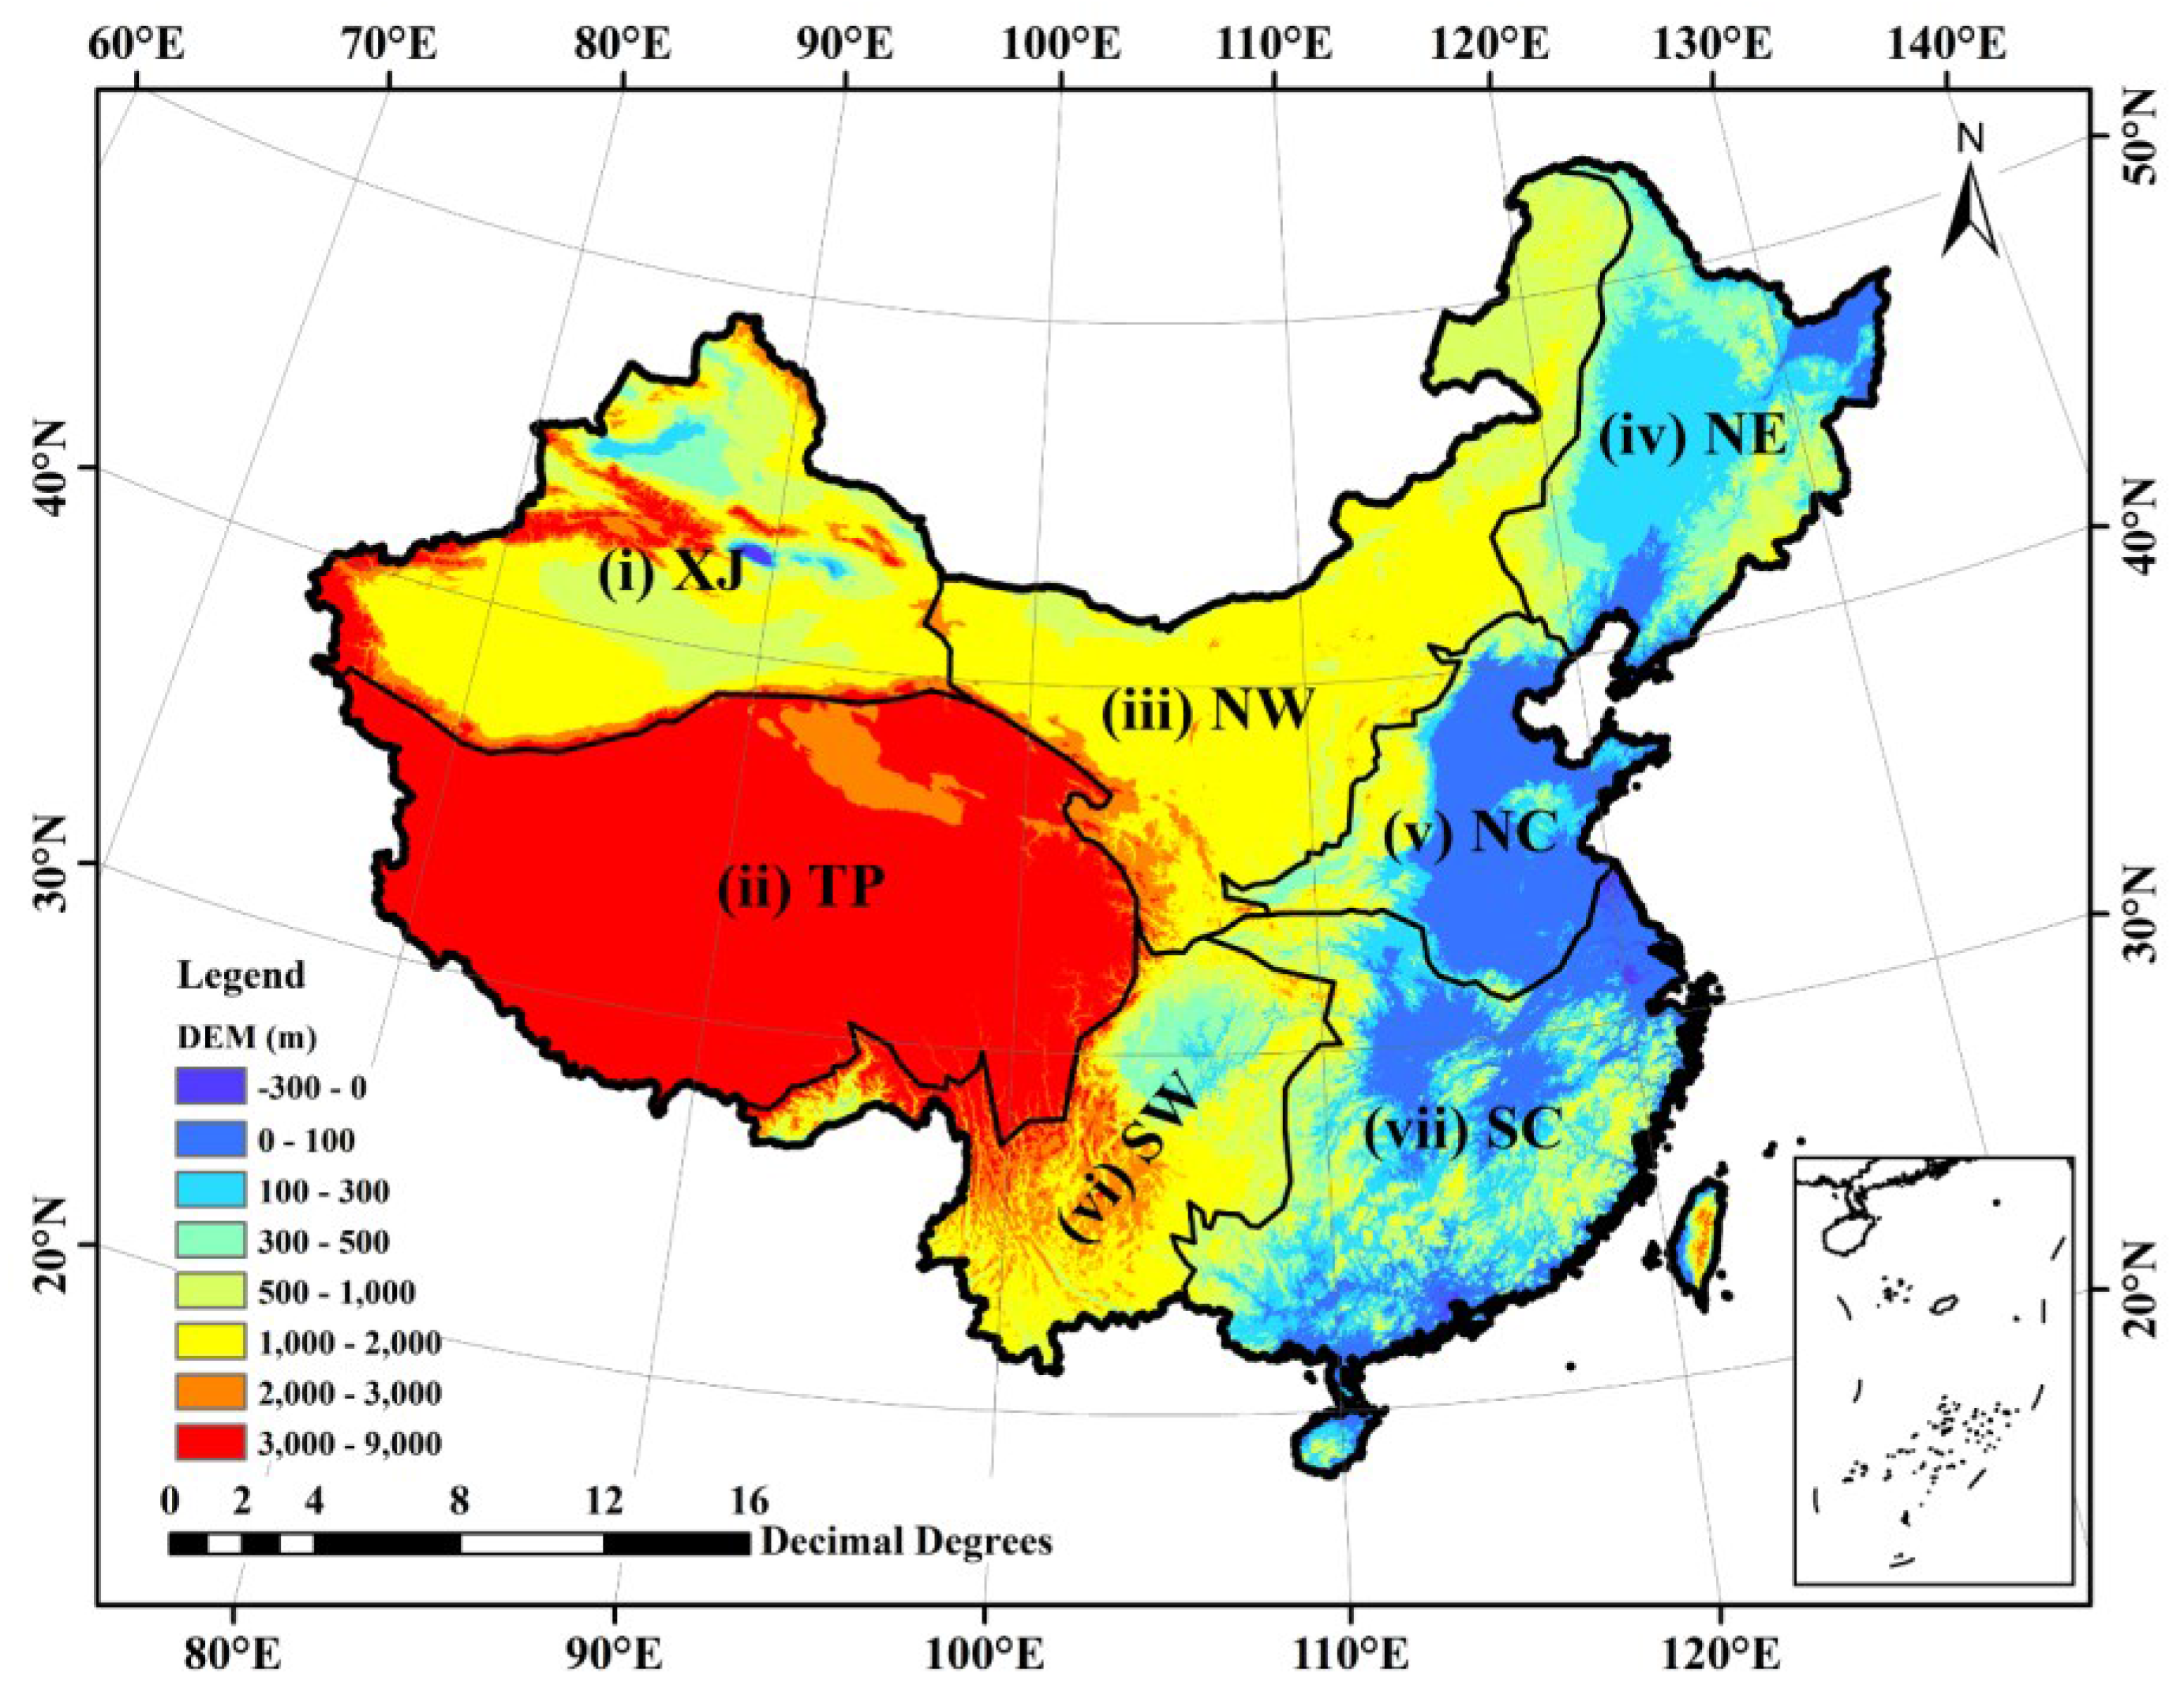
2.1. Study Area

Figure 1 shows the general topography of China via a digital elevation model (DEM). Generally, China can be partitioned into seven sub-regions classified by elevation, mountain ranges [51] and the annual mean precipitation distribution [52]. These sub-regions are shown in Figure 1 and are referred to as: (I) the Xinjiang (XJ) region in central Asia, which has arid and semi-arid climate characteristics; (II) Qinghai-Tibet Plateau (TP) which has an average elevation of about 4500 m; (III) Northwestern China (NW) bounded by the 400 mm annual precipitation isohyet; (IV) Northeastern China (NE) located in the north of the Yan mountain; (V) Northern China (NC) located to the north of Qinling Mountains-Huai River line; (VI) Yunnan-Guizhou Plateau in southwestern China (SW) which is bounded by the Ta-pa Mountains and Wulingshan mountains to the north and east; and (VII) Southern China (SC) south of the Nanling mountains and southeast of the Wuyi Mountains [53].
Figure 1. Topographic map of China. The black solid lines indicate the borders of the seven sub-regions: (i) Xinjiang (XJ); (ii) Qinghai-Tibetan plateau (TP); (iii) Northwest (NW); (iv) Northeast (NE); (v) North (NC); (vi) southwest Yungui Plateau (SW); and (vii) South (SC).
Atmosphere 07 00006 g001
Precipitation in the XJ sub-region is primarily influenced by the mid-latitude westerlies and moisture contributions from the North Atlantic Ocean [54]. The subtropical monsoon, when coupled with orographic effects from complex terrain, results in large amounts of precipitation over southwestern, southeastern, and southern China. The landfall of typhoons [55] and the annual migration of the monsoon [45,46] result in the plum rain during June and July in the south and southeastern areas of China. The precipitation in southwestern China is primarily dominated by the Indian Ocean monsoon, and topographic influences resulting from the Qinghai-Tibet Plateau.

2.2. Satellite-Based Precipitation Dataset

The GSMaP project [6,56,57,58] was originally sponsored by the Japan Science Technology Agency (JST) and is now sponsored by the Japan Aerospace Exploration Agency (JAXA). It uses extensible input streams, including geostationary satellite data, Low Earth Orbit (LEO) satellite data, and some other ancillary data. The LEO passive microwave (PMW) data and infrared retrievals are merged using a Microwave-IR combined algorithm, a backward and forward morphing technique based on IR images [5] and a Kalman filter [6]. The Microwave radiometer algorithm applied in GSMaP uses various attributes from TRMM data to get the PMW retrievals [56,57,59]. Over land, the rain/no-rain classification (RNC) methods [60] have been improved by Radiative Transfer Model (RTM) calculations using hydrometeor profiles retrieved from the TRMM Precipitation Radar (PR), a melting layer model, and a scattering algorithm [61]. Without a bias-correction procedure, GSMaP_MVK is a satellite-only product, while the NOAA Climate Prediction Center (CPC) global rain gauge dataset and the global gauge data analysis by Xie [62] are introduced in GSMaP_Gauge dataset [44]. The version 5 products of GSMaP were selected for evaluation in this study, although the newer version products (version 6) with time period ranging from 2011–2014 have been recently provided by JAXA.
The CMORPH technique propagates rainfall estimates derived from PMW sensors using motion vectors derived from the half-hourly interval geostationary satellite IR imagery [5]. The previous CMORPH versions 0.x only supplied the satellite-only dataset (CMORPH, hereafter), while the latest CMORPH version 1.0 supplies both the satellite-only dataset and the bias-adjusted dataset (CMORPH_CRT, hereafter). The products are available in three spatial and temporal versions: 8 km-30 min, 0.25°-3 hourly and 0.25°-daily. The 0.25°/daily version is used in this paper to facilitate comparison with other products. In CMORPH_CRT, bias correction was conducted by adjusting the CMORPH satellite estimates with daily gauge analysis through PDF matching [63].
PERSIANN utilizes another kind of satellite-based estimation technique that uses local cloud textures from infrared images of the geostationary satellites to estimate surface rainfall rates based on an artificial neural network algorithm [3,4]. PERSIANN primarily uses infrared brightness temperature data from geostationary satellites to estimate rainfall rates, while updating parameters based on LEO satellite PMW observations [64]. To maintain consistency with Global Precipitation Climatology Project (GPCP) products, PERSIANN_CDR is adjusted using the GPCP monthly precipitation product at the 2.5°/monthly scale throughout the entire record [64].
Table 1 gives a brief summary of satellite-based precipitation products. Although the algorithms vary significantly, more or less similar input data are used in these products. GSMaP is similar to CMORPH in that the cloud motion vectors are derived from IR brightness temperature cloud top movement. Also, both GSMaP and CMORPH use a Kalman filter technique to assimilate propagated microwave and IR estimates where instantaneous microwave observations are not available [5]. Both satellite-only and bias-corrected satellite-based precipitation products are evaluated in this paper in order to provide a quantitative evaluation of the bias correction procedures for different applications. In order to eliminate the sampling biases in the evaluation, and to be consistent with the reference dataset, all satellite-based datasets were spatiotemporally aggregated to the 0.25°/daily resolution.
Table 1. Summary of satellite Quantitative Precipitation Estimates (QPE).
NameTemporal ResolutionSpatial ResolutionDomainCorrected by GaugesReferences
GSMaP-MVK1 h0.1°60°S–60°NNo[57,58]
GSMaP-Gauge1 h0.1°60°S–60°NYes[44,57,58]
CMORPH1 day0.25°60°S–60°NNo[5]
CMORPH-CRT1 day0.25°60°S–60°NYes[65]
PERSIANN3 h0.25°60°S–60°NNo[3,4]
PRESIANN-CDR1 day0.25°60°S–60°NYes[3,4,64]

2.3. Ground Reference Data

The China daily Precipitation Analysis Product (CPAP), which is produced and routinely calibrated by the National Meteorological Information Center (NMIC) and the China Meteorological Administration (CMA), was used as a reference to evaluate the satellite-based precipitation products. Approximately 2400 rain gauge observations are gridded with the climatology-based Optimal Interpolation (OI) technique to yield the 0.25°/daily CPAP. The OI technique shows a higher correlation with individual gauge measurements than other techniques [66], and CPAP exhibits a relative bias of 3.21% at the 0.5° scale when compared to independent gauge observations in the validation [67]. It is important to keep in mind that the gauges used in CPAP may not be completely independent from those used in GSMaP_Gauge, CMORPH_CRT and PERSIANN_CDR. According to the China Meteorological Administration (CMA) [68], approximately 500 of the total gauges (~2400) used in CPAP are also potentially adopted in the GPCP data set which is used in PERSIANN_CDR. In addition, the NOAA Climate Prediction Center (CPC) analysis which includes some GTS gauges from CPAP is used in both GSMaP_Gauge [44] and CMORPH_CRT [69]. Furthermore, it should be noted that both CMORPH_CRT and GSMaP_Gauge are calibrated by daily rain gauge analysis while PERSIANN_CDR is calibrated by monthly rain gauge analysis.

2.4. Statistical Evaluation Metrics

GSMaP, CMORPH and PERSIANN products are systematically and quantitatively assessed by using a series of standard statistical evaluation metrics which include: Bias (the difference between the satellite-based products and CPAP), Relative Bias (RB, the bias divided by CPAP), Root-Mean-Square-Error (RMSE) and the Pearson linear correlation coefficient (CC) between satellite precipitation products and CPAP. RB and CC are dimensionless, whereas RMSE is in units of mm/day. When multiplied by 100, RB denotes the percentage of overestimation or underestimation. In order to evaluate the detection capability of these satellite-based precipitation products, three categorical statistical indices are calculated. Namely, the probability of detection (POD), false alarm ratio (FAR), and critical success index (CSI) are used to evaluate the capability in detecting rainfall events. Details of the definitions of these metrics can be found in [70]. Taylor diagrams are also used to visualize and quantify the overall performance of various products. The definition of the Taylor diagram can be found in [71].

3. Results and Discussion

3.1. Four Year Daily Mean Precipitation

Figure 2a shows the distribution of rain gauges over China that form the basis for CPAP. The gauge network is fairly dense in eastern China, while being uneven and sparse in northwestern China, particularly in the areas of XJ, TP, and NW. All satellite-based datasets can generally capture the spatial pattern of four-year mean daily precipitation (Figure 2b–h), but there are pronounced differences between the satellite-only precipitation products and bias-corrected products. GSMaP_Gauge, CMORPH_CRT, and PERSIANN_CDR, capture the spatial pattern of precipitation over China fairly well, while the satellite-only products perform much worse than the bias-corrected products. The satellite-only products exhibit significant underestimation over southwestern, southern, and southeastern China. Additionally, GSMaP_MVK shows a strip of intense precipitation along the northern hillside of the Tibetan Plateau. It is notable that CMORPH has many isolated grid boxes of abnormal overestimation, particularly in the TP and northern Loess Plateau in NW, which cannot be completely removed by the gauge-correction procedure. Consequently, those abnormalities are still evident in the CMORPH_CRT product. These features indicate that the bias-correction procedure in CMORPH_CRT fails to remove such overestimation “speckles”, some of which may be related to the complex mountainous terrain. PERSIANN overestimates precipitation in the southeastern TP and underestimates over the Tianshan Mountains in western XJ. After bias-correction, the PERSIANN_CDR shows a significant improvement over TP, but little improvement over the Tianshan Mountains. Generally, all bias-corrected satellite-based precipitation products agree much better with CPAP than their corresponding satellite-only counterparts according to the pattern of spatial precipitation distribution, and GSMaP_Gauge produces the closest spatial precipitation distribution pattern with CPAP among the bias-corrected products.
Figure 3a–f shows density-colored scatter plots and provide a quantitative comparison of all satellite-based precipitation products versus CPAP in terms of four-year mean precipitation over China. The high CPAP values in each scatterplots are caused by the heavy precipitation events over regions with complicated terrain (e.g., southwestern China) where satellite-based precipitation products struggle to estimate precipitation accurately. In addition, there seems to be odd gaps below the 1-to-1 line for CPAP in all scatterplots at 1–3 mm/day. This odd phenomenon may be related to the quality of CPAP. An additional validation based on four-year-mean precipitation (not shown here) shows that CPAP tends to observe high precipitation frequency from 0.8 mm/day to 2 mm/day over mainland China which may be a potential issue with CPAP. Based on four-year mean daily precipitation, CMORPH and PERSIANN tend to underestimate the precipitation rates by 4.9 mm/day and 1.8 mm/day, while GSMaP_MVK overestimates the precipitation by 1.4 mm/day. GSMaP_MVK shows intermediate performance among the satellite-only products with a moderate CC (0.67), RMSE (1.07 mm/day), and RB (5.65%), while CMORPH significantly underestimates the precipitation by 19.60%. PERSIANN displays a low CC (0.59), highlighting its poor spatial correlation with the CPAP. With bias-correction, CMORPH_CRT and PERSIANN_CDR show much improvement over their satellite-only counterparts with much higher CCs (0.89) and relatively lower RMSEs (<0.7 mm/day). However, GSMaP_Gauge shows increased RB from 5.65%–15.77%, though the CC is increased from 0.67–0.95 and the RMSE decreased from 1.07 mm/day to 0.53 mm/day. This may be because the positive and negative RBs cancel each other out, which leads to relatively lower RB of GSMaP_MVK. The unexpectedly increased RB value from GSMaP_MVK to GSMaP_Gauge indicates that the bias-correction procedure in GSMaP_Gauge may be not beneficial in a mean sense. Normally, when the satellite-only estimate is adjusted to gauges, the bias should become smaller with most points lying along the 1-to-1 line in scatterplots, as in the case of CMORPH and PERSIANN. In particular, GSMaP_Gauge has the highest CC (0.95) and lowest RMSE (0.53 mm/day) among all the bias-corrected products. More detailed comparisons for the seven sub-regions are shown in Table A1. It is evident that both GSMaP_MVK and PERSIANN greatly overestimate the precipitation over the XJ (108.20% and 96.01%, respectively) and NW (56.89% and 25.03%, respectively) regions. However, CMORPH shows much smaller RB (3.15% and −4.26%). Again, this result may stem from a “canceling out” effect between overestimation and underestimation.
Figure 2. (a) A 0.5° × 0.5° density map of gauges over China with 2419 gauges used in CPAP; (bh) Spatial distribution of four year daily mean precipitation (mm/day) derived from (b) GSMaP_MVK; (c) CMORPH; (d) PERSIANN; (e) CPAP; (f) GSMaP_Gauge; (g) CMORPH_CRT; and (h) PERSIANN_CDR over China.
Atmosphere 07 00006 g002
In general, strong evaporation over the arid and semi-arid regions leads to overestimation because hydrometeors that are detected by the space-borne sensors (which generally sample the ice-phase or cloud tops) may partially or totally evaporate before they reach the surface during the warm seasons [72,73]. Additionally, these satellite precipitation estimates tend to underestimate precipitation over mountainous regions, especially for CMORPH [74]. Similarly, SSMI sensors have difficulty in identifying precipitation over arid areas due to the land surface emissivity characteristics which impacts the upwelling microwave radiation [75]. Finally, the relatively sparse and unevenly distributed rain gauges may result in the OI technique averaging out nonzero precipitation estimates. Above all, the ratios between positive RB and negative RB for GSMaP and PERSIANN are relatively larger than CMORPH (Figure 10b,j,r).
The performance of GSMaP, CMORPH, and PERSIANN products are also evaluated on a sub-regional scale. Table A1 and Figure 3 show that PERSIANN and GSMaP_MVK exhibit substantial overestimations of precipitation over TP (67.70% and 68.72%, respectively). Such overestimations are likely the result of ice or snow cover, which tends to complicate PMW-based overland retrievals [76]. In addition, the sparse and uneven distribution of rain gauges and the errors resulting from the aforementioned OI technique may also contribute to the substantial overestimation. Finally, due to factors such as a near-surface freezing level, ground clutter contamination, and bright band contamination, the TRMM Precipitation Radar (PR) has been known to have difficulties in accurately estimating precipitation in high altitude regions [77]. These factors may be substantial considering that TRMM PR products contribute significantly to the GSMaP retrieval algorithm. In general, the CMORPH outperforms the other two satellite-only estimates, and displays a small underestimation (RB, −4.26%). This is primarily because it uses another different retrieval algorithm that results in a more conservative estimate of rainfall area in the presence of snow cover [42]. This pattern is consistent with the results of several previous studies [45,47,48].
Figure 3. Density-colored scatterplots of various products (a) GSMaP_MVK; (b) CMORPH; (c) PERSIANN; (d) GSMaP_Gauge; (e) CMORPH_CRT and (f) PERSIANN_CDR against CPAP rainfall rate shown in Figure 2. The color represents the occurrence frequency. The dark oblique solid line represents 1:1 line.
Atmosphere 07 00006 g003
In order to determine which product more precisely estimates precipitation over mainland China and the seven sub-regions, Taylor diagrams [71] are plotted to visualize the concise statistical summary of how well each single satellite-based product matches the reference data (CPAP) in terms of their correlation coefficient, the ratio of their standard deviation, and their RMSE values (Figure 4). The position of each symbol appearing on the Taylor diagrams quantifies how closely the satellite-based precipitation product matches the reference data. Satellite-based precipitation products that agree with reference data will lie nearest to the solid pentagon denoted with CPAP on the x-axis. The superiority of gauge-corrected products is clearly evident by their closer distance to CPAP, especially for XJ, TP and NW. When compared to the other two satellite-only products, GSMaP_MVK demonstrates similar performance over NE, NC, SW and SC, but has poor performance and relatively lower CCs over XJ, TP, and NW, likely due to the complicated terrain in arid and semi-arid environments. Compared to CMORPH_CRT and PERSIANN_CDR, GSMaP_Gauge shows the best overall performance over contiguous China and the seven sub-regions.
Figure 4. Taylor diagrams showing the correlation coefficients, the normalized standard deviation, and the RMSE of four year daily mean precipitation between six satellite-based precipitation products and the reference data over (a) mainland China and seven sub-regions: (b) XJ; (c) TP; (d) NW; (e) NE; (f) NC; (g) SW; and (h) SC. The radial coordinate is the magnitude of the standard deviation, which is normalized by the standard deviation from CPAP and denoted by black dotted lines. The concentric green semi-circles denote RMSE values. The angular coordinate shows the correlation coefficient (denoted by blue dotted lines). In these Taylor diagrams, the closer the points representing the satellite-based precipitation products are to the CPAP point (marked by the black pentagon), the better the product is with relatively high correlation, low standard deviation and RMSE values. The products from the same algorithm are marked by the same marker with same color and denoted by different characters with the same color. CPAP is marked by a black solid pentagon, while GSMaP_MVK and GSMaP_Gauge are marked by red diamonds and denoted by red A and B, respectively. CMORPH and CMORPH_CRT are marked by orange solid circles and denoted by orange C and D, respectively, whereas PERSIANN and PERSIANN_CDR are marked by purple squares and denoted by purple E and F, respectively.
Atmosphere 07 00006 g004

3.2. Seasonal Daily Mean Precipitation

Precipitation over China varies dramatically geographically and seasonally due to the influences of the Asian monsoon, the Tibetan plateau, and the baroclinic westerlies initiated from North Atlantic Ocean. Figure 5 shows the seasonal pattern of four-year daily mean precipitation, while the corresponding density-colored scatter plots are given in Figure 6. The corresponding statistics of seasonal precipitation for the seven sub-regions are listed in Table A1. As shown by CPAP, the average precipitation decreases from the coastal regions in the southeast towards the semi-arid and arid regions in the northwest. Relative to CPAP, all three bias-corrected products demonstrate much better performance than the satellite-only estimates in every season, with increased CCs, and reduced RBs and RMSEs. GSMaP_Gauge outperforms the other two bias-corrected estimates in each season according to CCs (0.94, 0.94, 0.91 and 0.90), but it also displays a higher RBs (16.44%, 29.83%, 1.47% and −61.83%) and RMSEs (0.64 mm/day, 1.41 mm/day, 0.50 mm/day and 0.49 mm/day). CMORPH_CRT and PERSIANN_CDR have comparable performances in terms of CCs, RBs and RMSEs. Among the satellite-only products, PERSIANN shows the poorest performance in every season with the lowest CC, highest RMSE and high magnitude of RB. This result may primarily be attributed to the substantial overestimation (the highest RB in winter, 1582.36%) in TP. This overestimation may be the result of the poor performance of the IR-based rainfall estimation algorithm over the complex terrain, the limited gauge observations in the region and the corresponding errors resulting from the OI algorithm [36,78,79,80]. GSMaP_MVK overestimates large amounts of precipitation in the mountainous areas over XJ, TP and NW. Expectedly, the bias-correction procedure significantly improves the quality of GSMaP_Gauge over mountainous areas. As previously stated, CMORPH and CMORPH_CRT still suffer from isolated areas of abnormal overestimation in all four seasons. It should also be noted that all products perform worse in winter.
The satellite-only precipitation products without bias-correction (i.e., GSMaP_MVK, CMORPH and PERSIANN) significantly overestimate or underestimate precipitation (by 78.47%, −31.01%, and 160.87%, respectively). The bias-corrected products display much improvement but still show large biases in winter. The causes of this bias may be explained by the following: (1) The accuracy of PMW-based algorithms is influenced by snow and ice on the land surface [76], and specifically the PMW-based retrievals (e.g., AMSR-E, AMSU-B and SSM/I) are degraded by the presence of snow cover [81,82]. Therefore, the PMW-based algorithms may have difficulties in accurately estimating winter precipitation; (2) The PERSIANN overestimation of precipitation in winter may be associated with imperfect screening of cold surfaces from the IR images [45]; (3) The observed low performance from PERSIANN, especially the large overestimation over TP and the underestimation over SW and SC, may be linked to the flaws in the IR-based algorithm, which relies on indirect statistical relationships between IR observations of the cloud-top temperature and precipitation rate. Furthermore, it should be noted that the PERSIANN_CDR exhibits the best performance in winter relative to CPAP and displays the highest CC (0.91), the smallest RB (−0.01%) and RMSE (0.25 mm/day). This is probably due to its use of infrared brightness temperature data, which comes from geostationary satellites and are less influenced by cold climate and snow/ice covered land surfaces in winter [64].
A large region of abnormal zero precipitation estimates is produced by CMORPH and CMORPH_CRT over NE and northern XJ, and GSMaP_MVK displays a relatively smaller area of zero precipitation estimates over northwestern NE. These underestimations are likely due to reasons as follows: (1) The PMW-based algorithms used in GSMaP and CMORPH are good at detecting intense, convective precipitation events, but tend to miss shallow precipitation events [83]; (2) Ice and snow-covered surfaces tend to influence PMW-based accurate retrievals over the land surface [76]; (3) The CMORPH algorithm uses a more conservative estimate of raining areas in the presence of snow cover [42]. CPAP also detects three zero precipitation speckles in XJ and TP. This can be, at least partially, attributed to the sparse and uneven rain gauges in these areas and the flaws in the OI technique as mentioned previously.
Figure 5. Seasonal four-year daily mean precipitation distribution over China for (ad) CPAP; (eh) GSMaP_MVK; (il) GSMaP_Gauge; (mp) CMORPH; (qt) CMORPH_CRT; (ux) PERSIANN; and (yB) PERSIANN_CDR.
Atmosphere 07 00006 g005
Figure 6. Density-colored scatterplots of (ad) GSMaP_MVK; (eh) GSMaP_Gauge; (il) CMORPH; (mp) CMORPH_CRT; (qt) PERSIANN; (ux) PERSIANN_CDR against CPAP rainfall rate shown in Figure 5. The color represents the occurrence frequency.
Atmosphere 07 00006 g006

3.3. Time Series Monthly Precipitation

In order to investigate the temporal behavior of Bias, CC, and RMSE of the satellite-based products over mainland China and the seven sub-regions, comparison statistics are calculated for each month during the four-year period and are displayed in Figure 7. It has been demonstrated that a sparse gauge network degrades the quality of gauge-based analysis [62], and specifically, a substantial magnitude of both bias and random error may occur in the gauge-based analysis over grid boxes with no gauge reports available nearby [66]. Therefore, in this study statistics are computed using monthly-mean data and grid cells only where/when there is at least one reporting gauge, and both CPAP and the satellite-based precipitation estimates are above zero.
Figure 7. Monthly series of Bias in the left column panels, Correlation Coefficient (CC) in the middle column panels, root-mean-square error (RMSE) in the right column panels between various products and CPAP over (ac) continuous China and seven sub-regions for (df) XJ; (gi) TP; (jl) NW; (mo) NE; (pr) NC; (su) SW; (vx) SC on 0.25° lat/lon grid box. Only the cells where there is at least one reporting gauge in CPAP and both CPAP and the satellite-based precipitation estimates are above zero have been selected for computation.
Atmosphere 07 00006 g007
The RMSE and CC (Figure 7c) generally show a season-dependent variation for all satellite-based precipitation products. The RMSE is larger between the satellite-based estimates and CPAP during the monsoon season from April to October. The bias-corrected estimates show fewer season-dependent variations in RMSE (Figure 7b). This implies that the bias-correction processes in the three bias-correction products have the potential to reduce the season-dependent error. GSMaP_Gauge consistently shows the highest CC (>0.7), but also exhibits a relatively higher season-dependent overestimation (underestimation) bias in warm seasons (cold seasons). GSMaP_MVK shows underestimation over China for the whole study period. This may imply that the gauge-adjustment can improve the CC and remove the negative bias [44], but also may generate some season-dependent positive bias. Overall, the gauge adjusted algorithm of GSMaP_Gauge still appears to have some room for improvement. CMORPH also shows a stable underestimation which has been observed in other studies [29,84,85]. Compared to the GSMaP products, CMORPH_CRT and PERSIANN_CDR have more stable (i.e., less fluctuating) seasonal biases. This pattern is consistent with the results shown in Figure 5 and Figure 6.
In the sub-regions, GSMaP_Gauge displays the highest CC for all seasons while CMORPH_CRT displays the worst performance with the lowest and highly fluctuating CCs. Both CMORPH and CMORPH_CRT exhibit inferior performance over XJ and TP with larger RMSE and lower CC. Additionally, these trends show significant seasonal fluctuations with the higher value in warm season and lower value in cold season. In a similar study on CMORPH and the microwave-only product (MWCOMB), Shen [45] found that MWCOMB shows the same bias sign and is close in magnitude with other PMW/IR blended products (CMORPH and PERSIANN) over China. Thus, these biases over XJ and TP regions may result from the deficiencies of the PMW sensors in estimating precipitation. PERSIANN demonstrates the poorest performance with the largest fluctuating bias and RMSE, as well as the lowest fluctuating CC over China and the sub-regions. As expected, the bias-correction procedure in PERSIANN_CDR improves the performance of PERSIANN significantly.
PERSIANN shows abnormally high biases and RMSEs over XJ, TP, NW, and NE during December 2006 and June 2007. After independent verification (not detailed here), we found that PERSIANN tends to significantly overestimate precipitation over semi-arid and arid regions, especially for TP, from October 2006 to July 2007. This may be, at least partly, attributed to the limitation of the PERSIANN algorithm, which is mainly based on IR data. In addition, hydrometeors detected by the microwave and infrared sensors (as well as the TRMM PR) may partially or totally evaporate before reaching the surface in semi-arid areas [53,86]. Therefore, PERSIANN without gauge-correction tends to overestimate precipitation. This can also be explained by the lack of training of the artificial neural network parameters over China, since PERSIANN is only adequately trained over the United States [48].

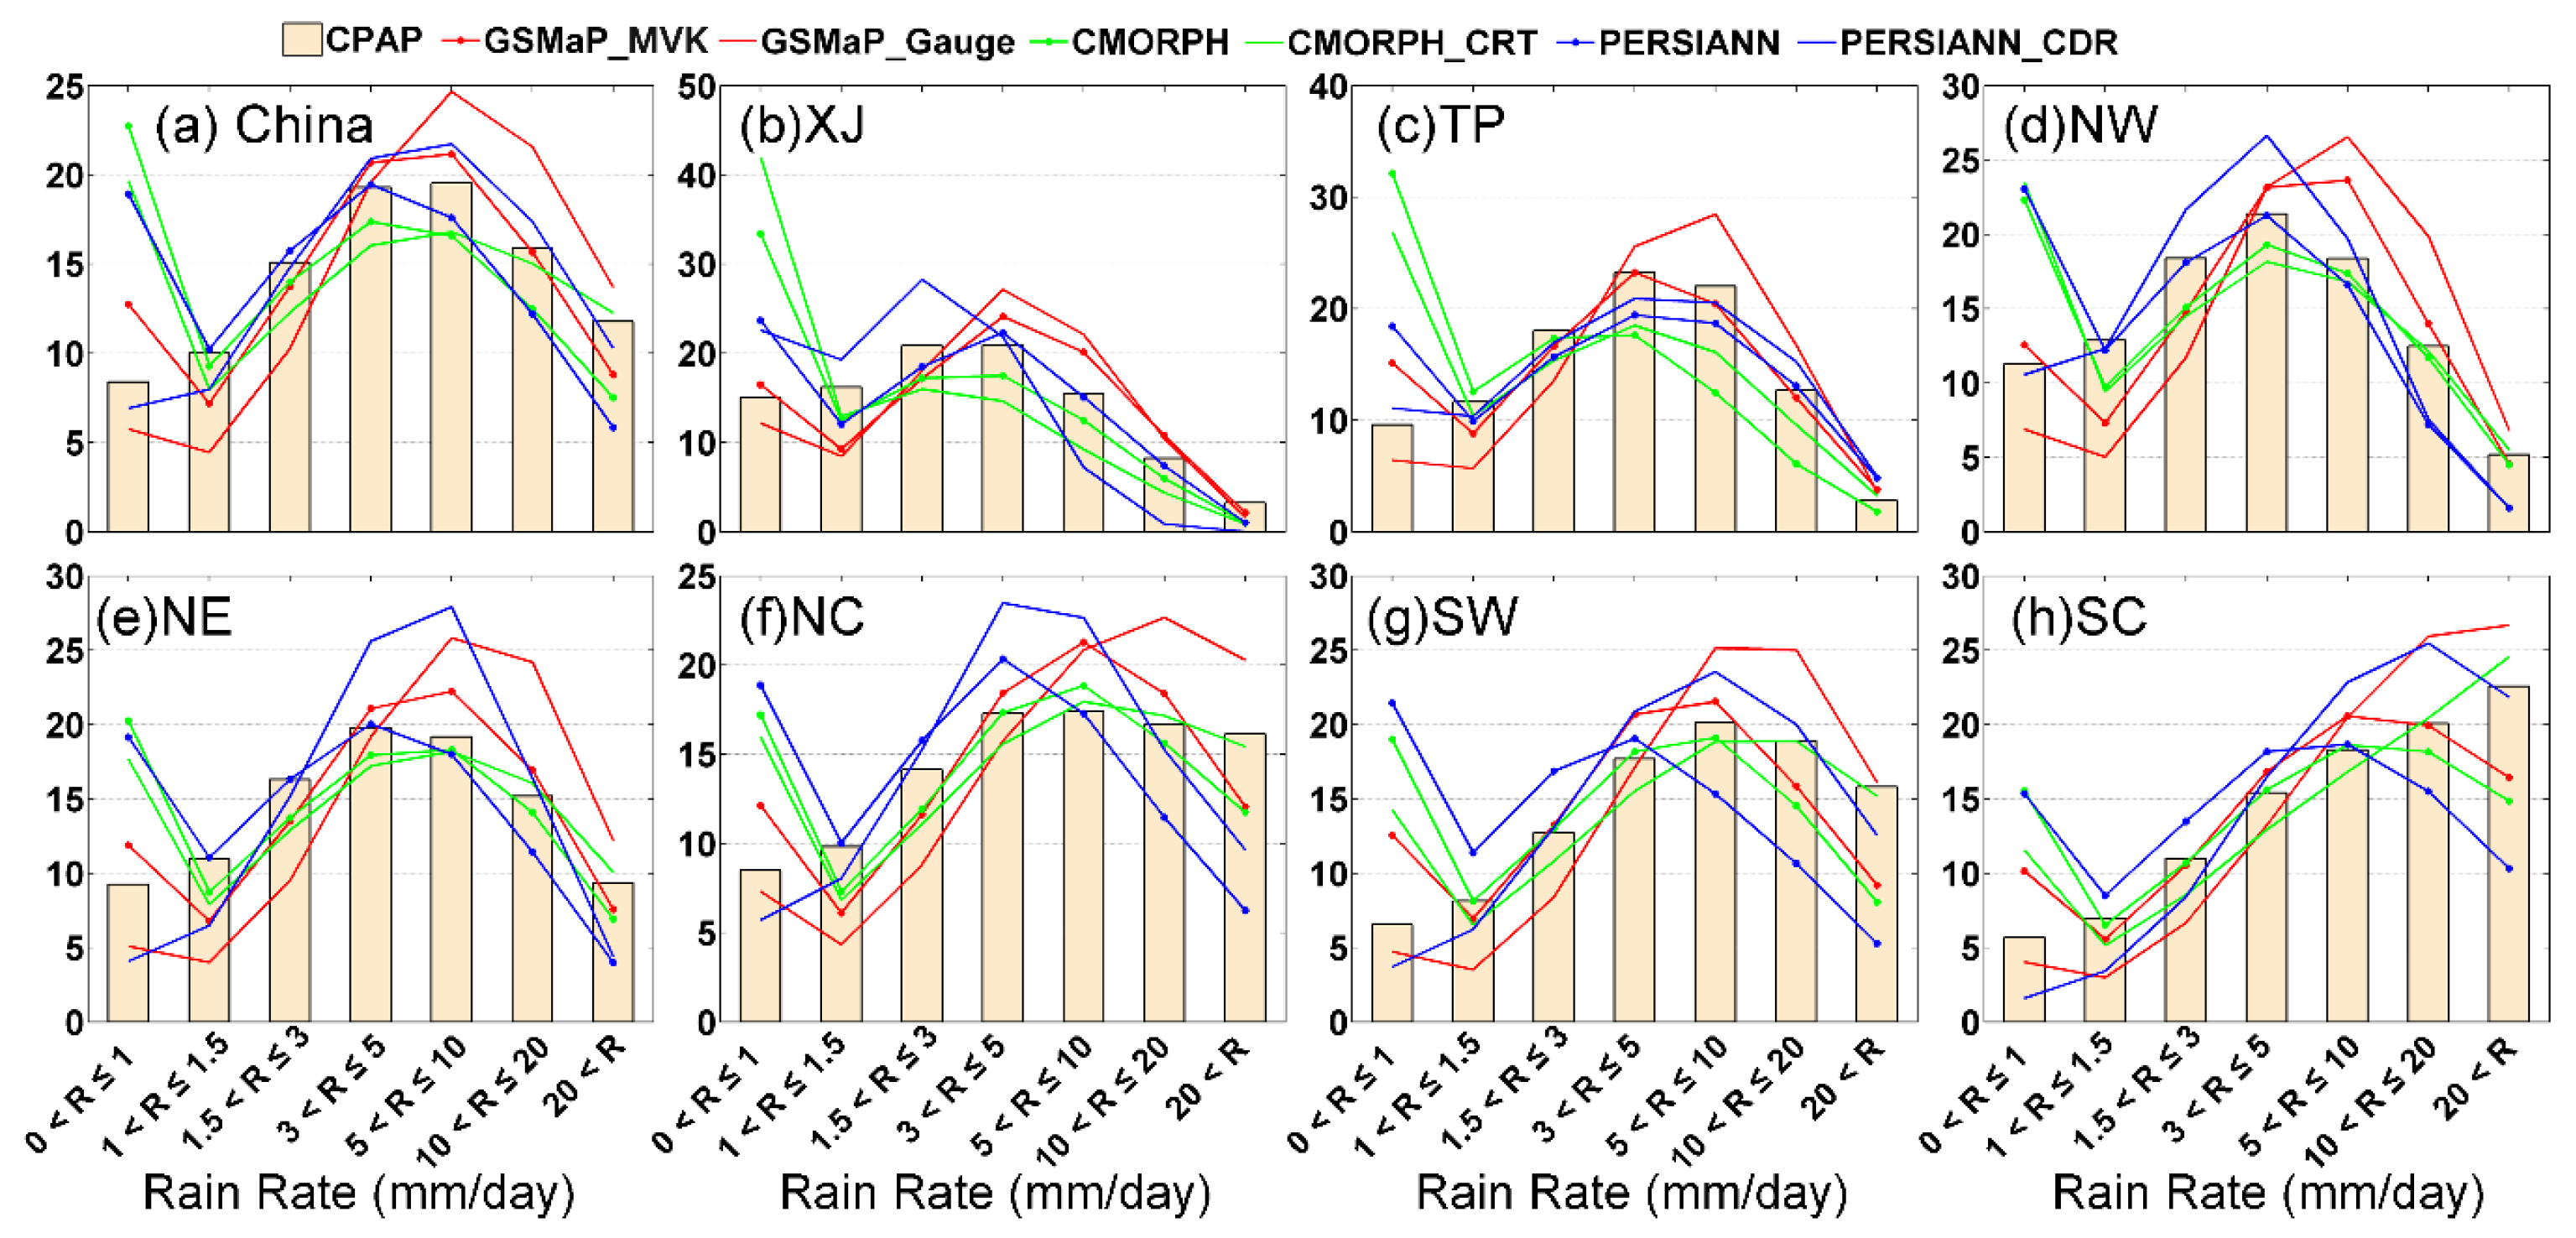
3.4. Probability Distribution by Occurrence

The precipitation rate occurrence distribution of intensities can provide an insight into the characteristics of precipitation rate dependent error and the potential error effect on hydrological applications. Figure 8 shows the Probability distribution functions (PDFs) by precipitation occurrence with different precipitation intensities. The thresholds of precipitation intensity are shown in Table 2. All of the satellite-only precipitation datasets tend to significantly overdetect the occurrence of light precipitation (0 < R ≤ 1 mm/day) over China, especially for the dry climate of western China (i.e., XJ, TP, NW), while tending to underdetect the occurrence of heavy precipitation (more than 20 mm/day) over the wet environment of eastern China (i.e., NE, NC, SW, and SC). This may be related to the fact that the PMW-based algorithms used in the estimates are good at detecting heavy, convective precipitation events, but fail to accurately detect shallow, warm precipitation [87,88]. The substantial evaporation in the dry environments over XJ, TP and NW, as well as the large amount of heavy precipitation over SW and SC, likely are additional contributions to these disparities. In comparison with CMORPH and PERSIANN, GSMaP_MVK shows slightly better performance in detecting light precipitation less than 1 mm/day in all regions and heavy precipitation over 20 mm/day in NE, NC, SW, and SC.
Figure 8. Probability Density Function by occurrence (PDFc) of daily precipitation (mm/day) for cases with different intensities over contiguous China and seven sub-regions for (a) China; (b) XJ; (c) TP; (d) NW; (e) NE; (f) NC; (g) SW; and (h) SC. Only grid cells where there is at least one reporting gauge and both the reference and the satellite-based precipitation estimates are nonzero can be selected for computing the occurrence.
Atmosphere 07 00006 g008
Table 2. Thresholds for precipitation intensity.
IndexR (mm/Day)
10 < R ≤ 1
21 < R ≤ 1.5
31.5 < R ≤ 3
43 < R ≤ 5
55 < R ≤ 10
610 < R ≤ 20
7R > 20
After gauge-correction, GSMaP_Gauge and PERSIANN_CDR tend to underestimate the light rain events, while CMORPH_CRT shows substantial overdetection for events of rain rate less than 1 mm/day. When rain rate is over 5 mm/day, GSMaP_Gauge detects many more events than CPAP, especially for NE, NC and SC. The bias-correction procedure in GSMaP_Gauge is helpful for reducing errors from both overdetection of light precipitation events (<1 mm/day) and underdetection of heavy precipitation (>20 mm/day) events. However, it also seems to yield an overcorrection for detecting heavy precipitation events. Both CMORPH and CMORPH_CRT slightly underdetect events with a rain rate of more than 1 mm/day.

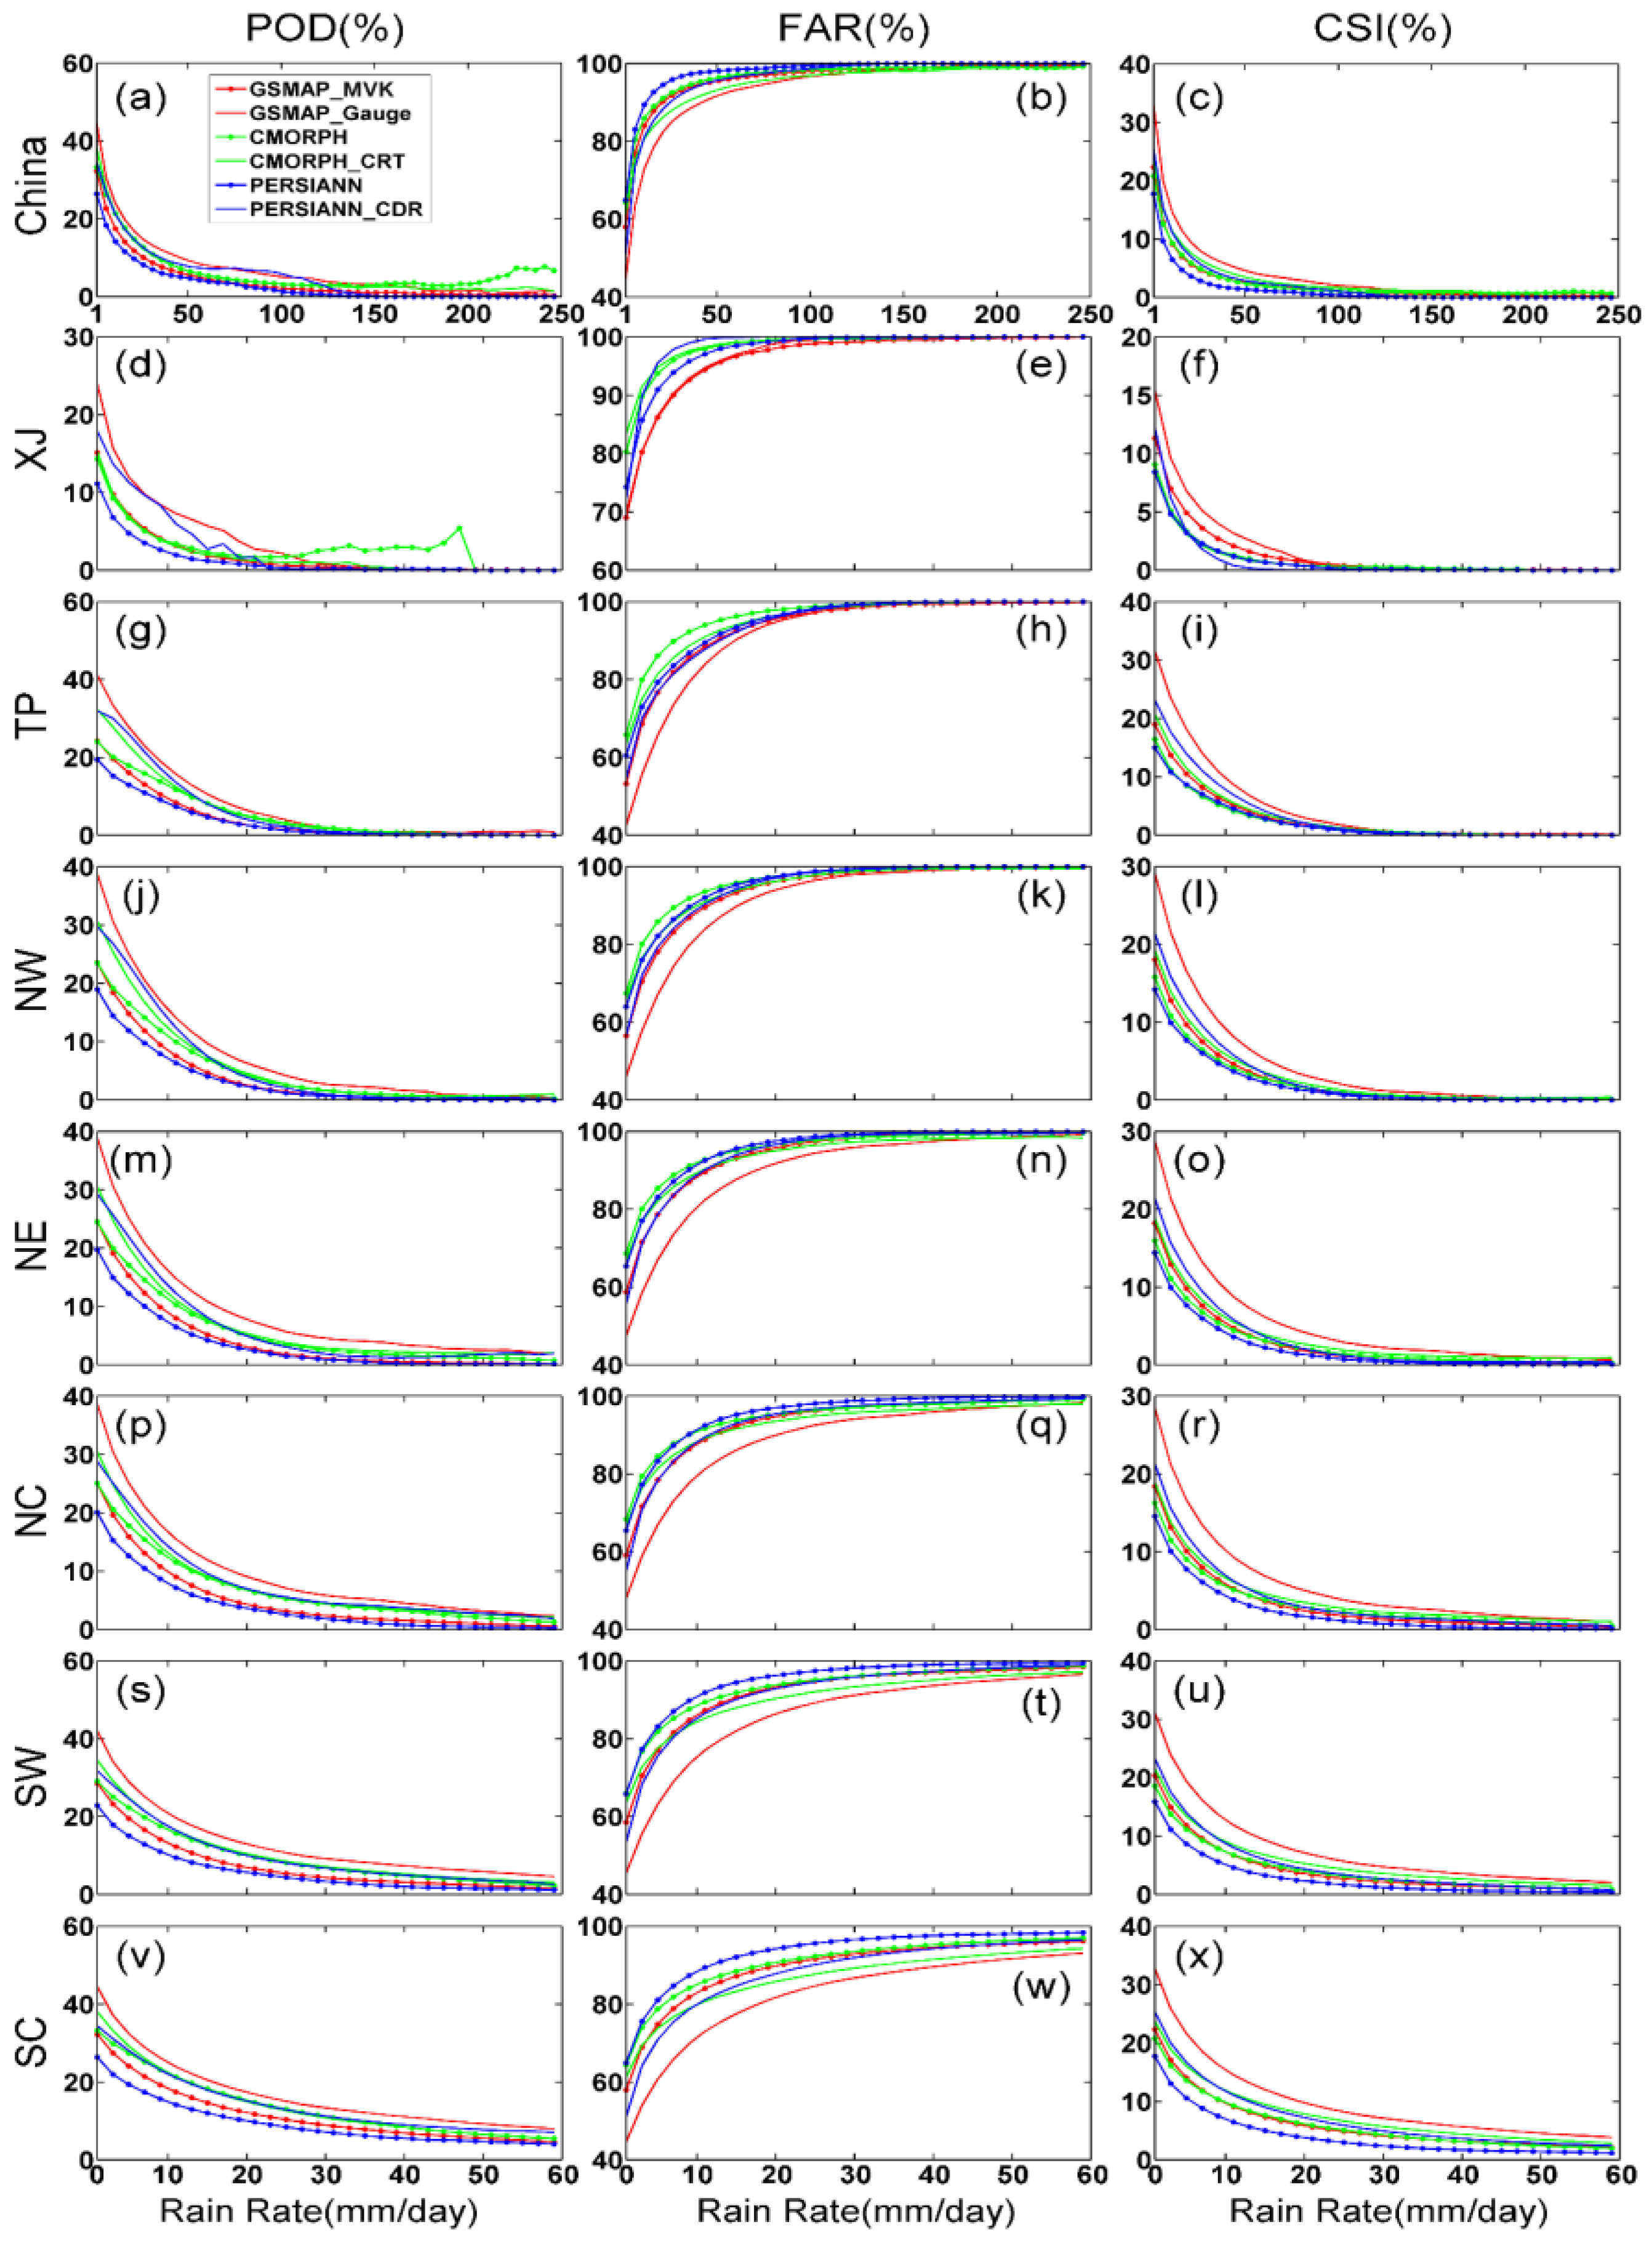
3.5. Contingency Statistics

Probability of detection (POD), False Alarm Ratio (FAR) and Critical successful index (CSI) clarify the nature of the occurrence errors [35]. The contingency statistics (POD, FAR, and CSI) based on daily precipitation rate, with an interval of 5 mm/day from 1 mm/day to 250 mm/day for Mainland China and an interval of 2 mm/day from 1 mm/day to 60 mm/day for the seven sub-regions (Figure 9). All Satellite-based precipitation products display low PODs for rain rate less than 60 mm/day. By comparison, GSMaP_Gauge has a higher POD (up to 50%) and CSI (up to 35%), and lower FAR (down to 40%) for light precipitation. GSMaP_Gauge also has relatively higher POD and CSI, and a lower FAR than the other estimates for the precipitation rates less than 30 mm/day. Interestingly, CMORPH performs better than the other products, including its bias-corrected counterpart for precipitation accumulations ranging from 150 mm/day to 250 mm/day. Regionally, GSMaP_Gauge also shows the best scores among all products with a higher POD and CSI and lower FAR. When rain rates are greater than 30 mm/day, all products give low POD and CSI, and a high FAR in XJ, TP, and NW. Relatively high performances are found over the other regions (i.e., NE, NC, SW and SC). Interestingly, CMORPH exhibits a higher POD than its counterpart with bias-correction during 20 mm/day to 50 mm/day over XJ. CMORPH demonstrates relatively lower POD and CSI, and higher FAR than other satellite-only precipitation products over the semi-arid and arid area (i.e., XJ, TP, NW and NE). PERSIANN shows the lowest POD and CSI, and the highest FAR over SW and SC, which has a relatively humid climate. When the rainfall rate is over 30 mm/day, the percentage of POD and CSI (FAR) becomes higher (lower) from semi-arid and arid climate areas (e.g., XJ, TP and NW) to semi-humid and humid climates (e.g., NC, SW and SC). This may indicate a rainfall intensity dependency of contingency statistics (i.e., POD, FAR and CSI).
Figure 9. Contingency metrics of POD (left column panels), FAR (middle column panels) and CSI (right column panels) for different products over China and seven sub-regions for (ac) China; (df) XJ; (gi) TP; (jl) NW; (mo) NE; (pr) NC; (su) SW; (vx) SC, based on 0.25° lat/lon and daily mean precipitation rates (mm/day) day by day. Vertical axis scales were set according to the maximum of y-axis in different subpanels. The calculation of contingency metrics are derived using a 5 mm/day rain rate interval from 1 mm/day to 250 mm/day for mainland China and 2 mm/day interval from 1 mm/day to 60 mm/day for seven sub-regions. Only grid cells where there is at least one reporting gauge and both the reference and the satellite-based precipitation estimates are nonzero can be selected for computing these metrics.
Atmosphere 07 00006 g009

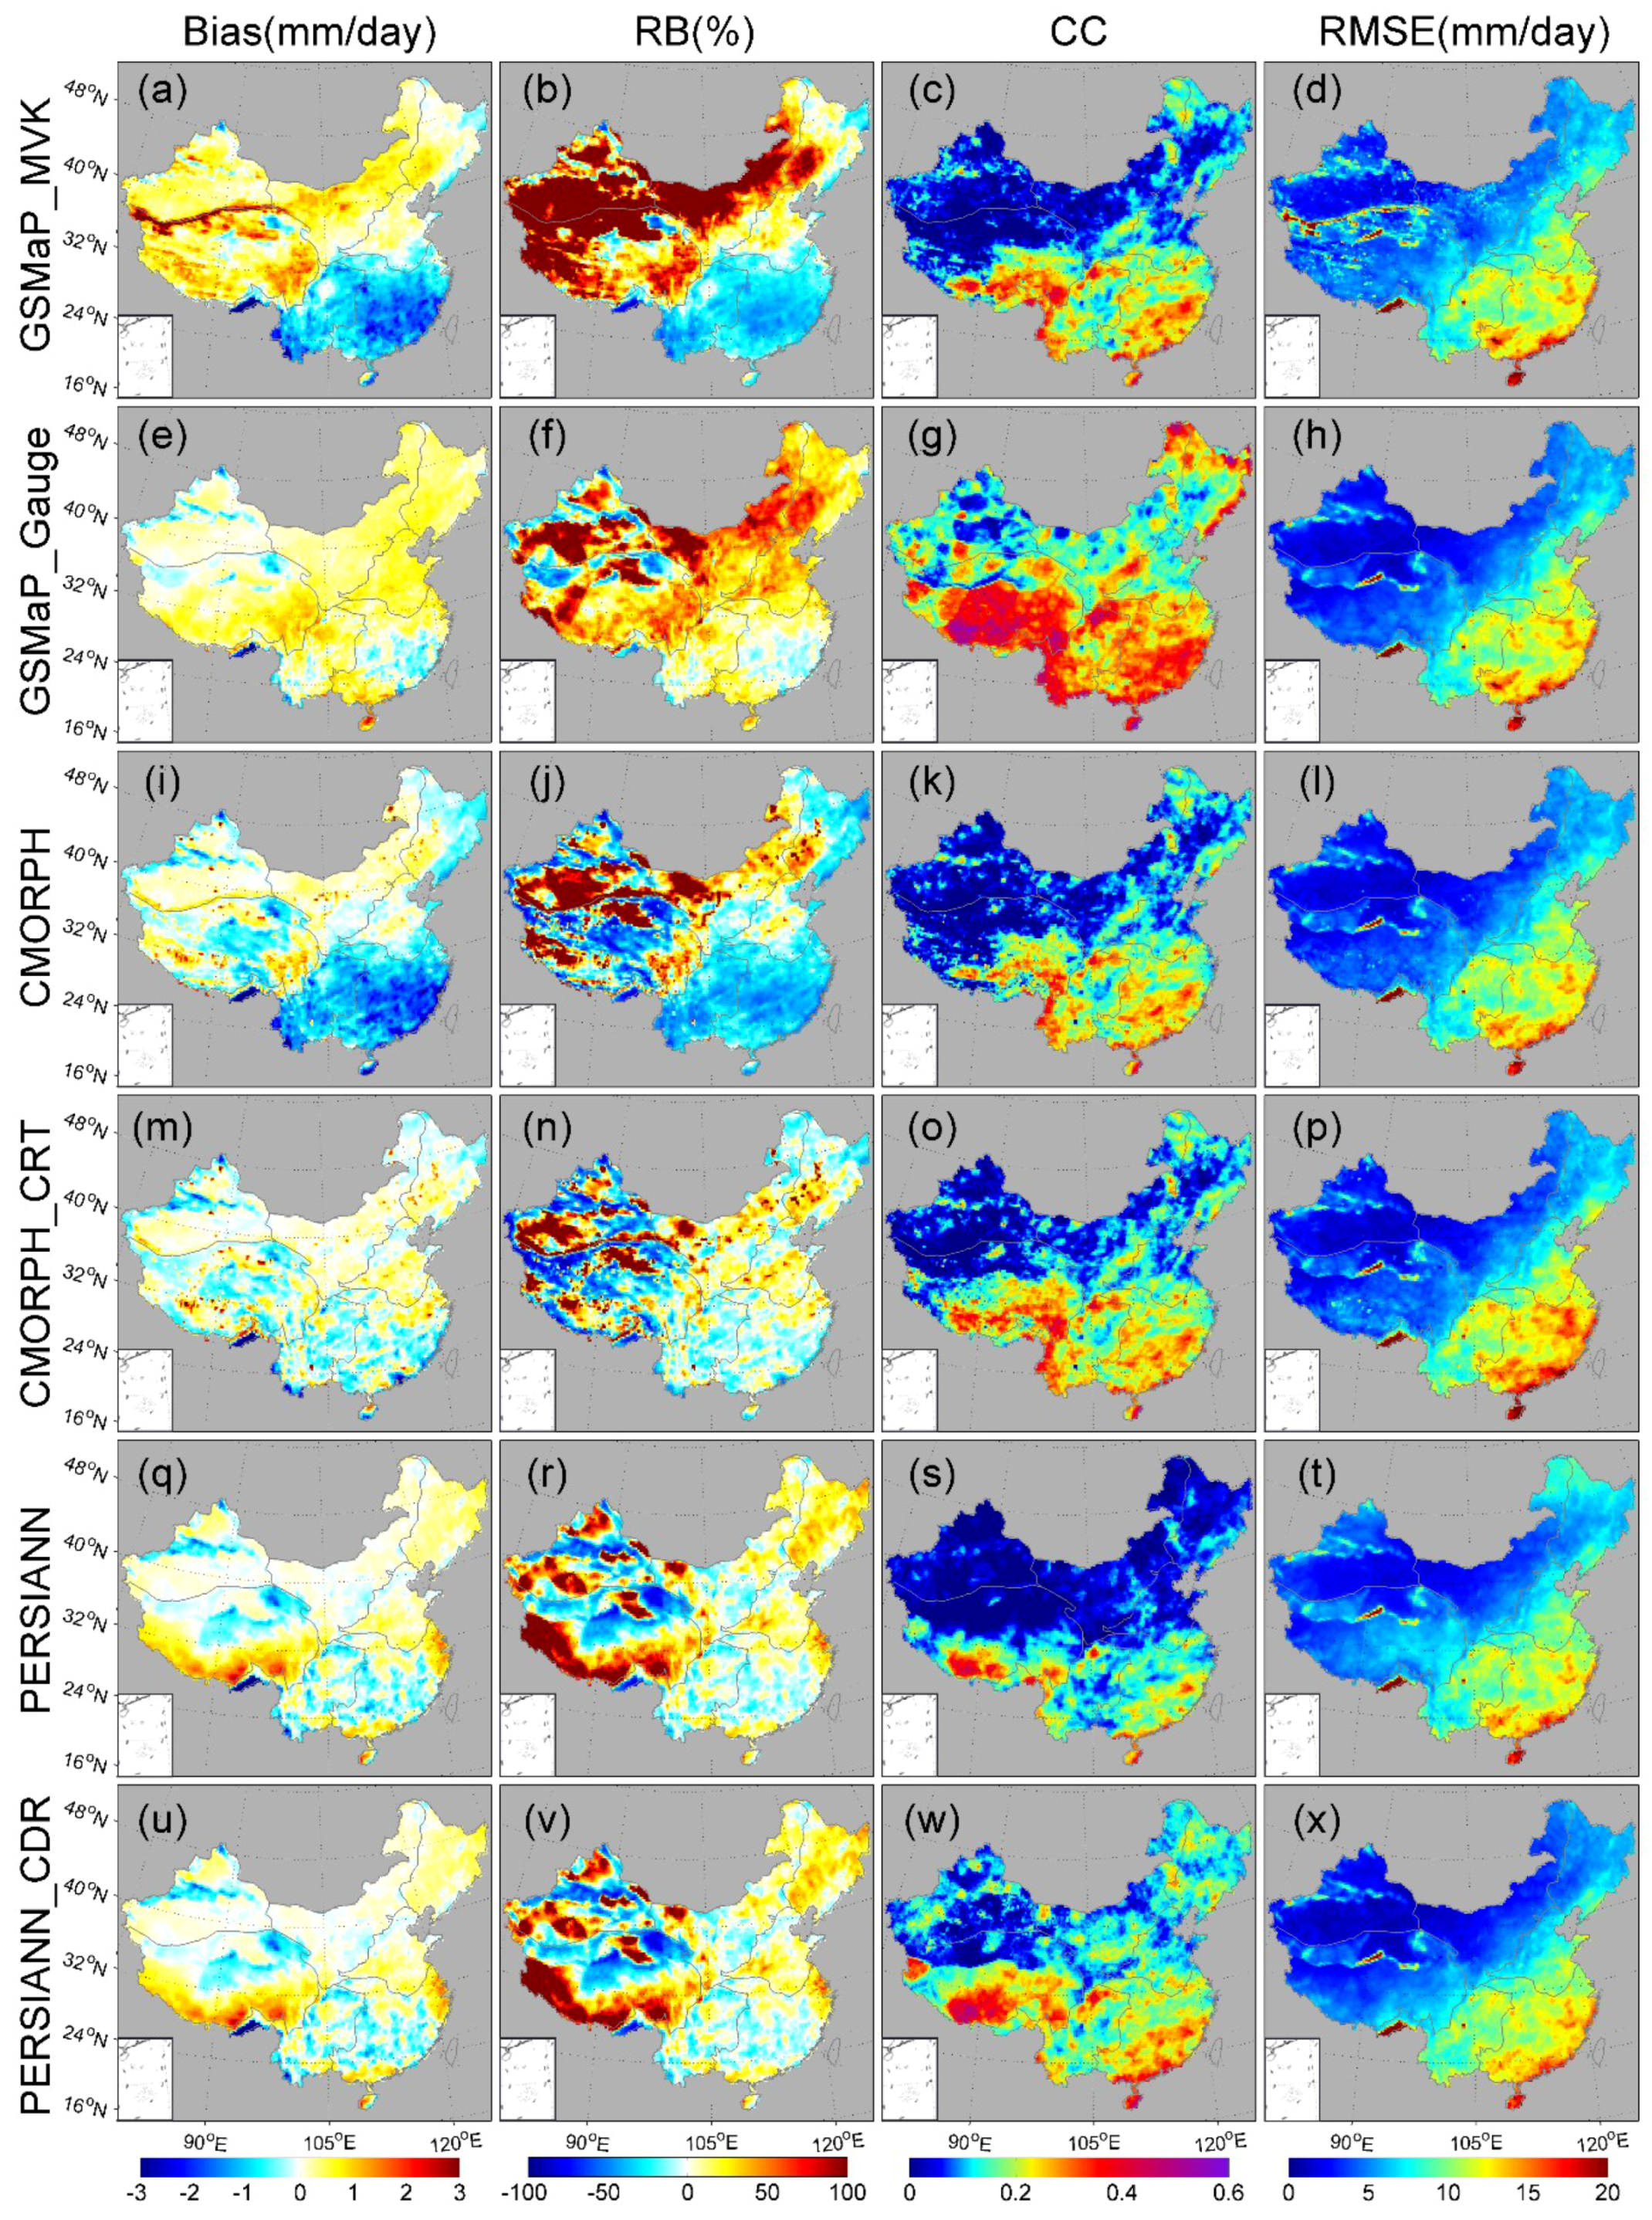
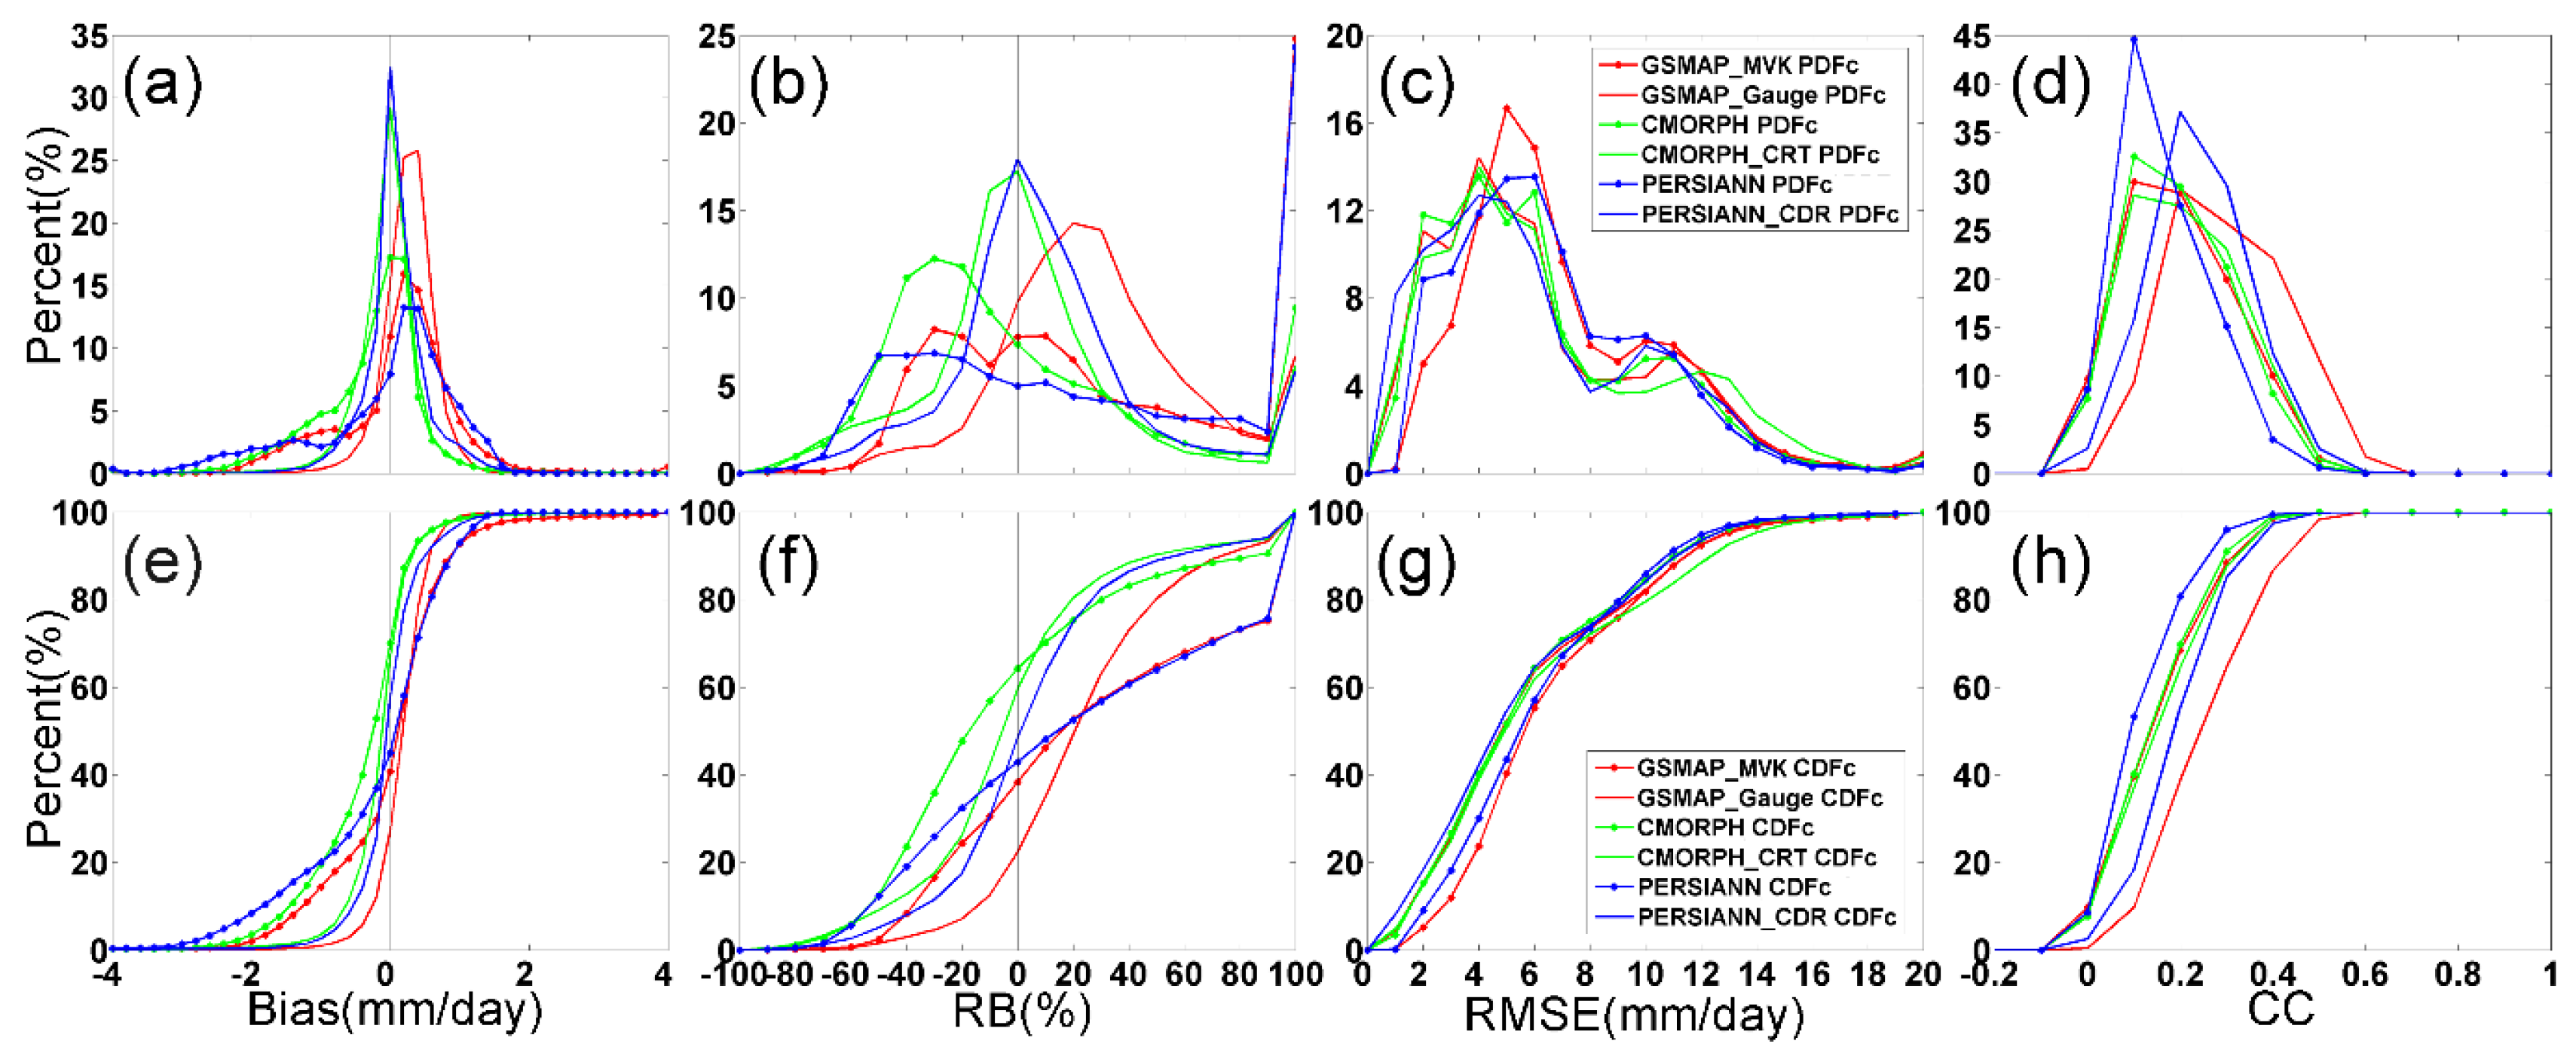
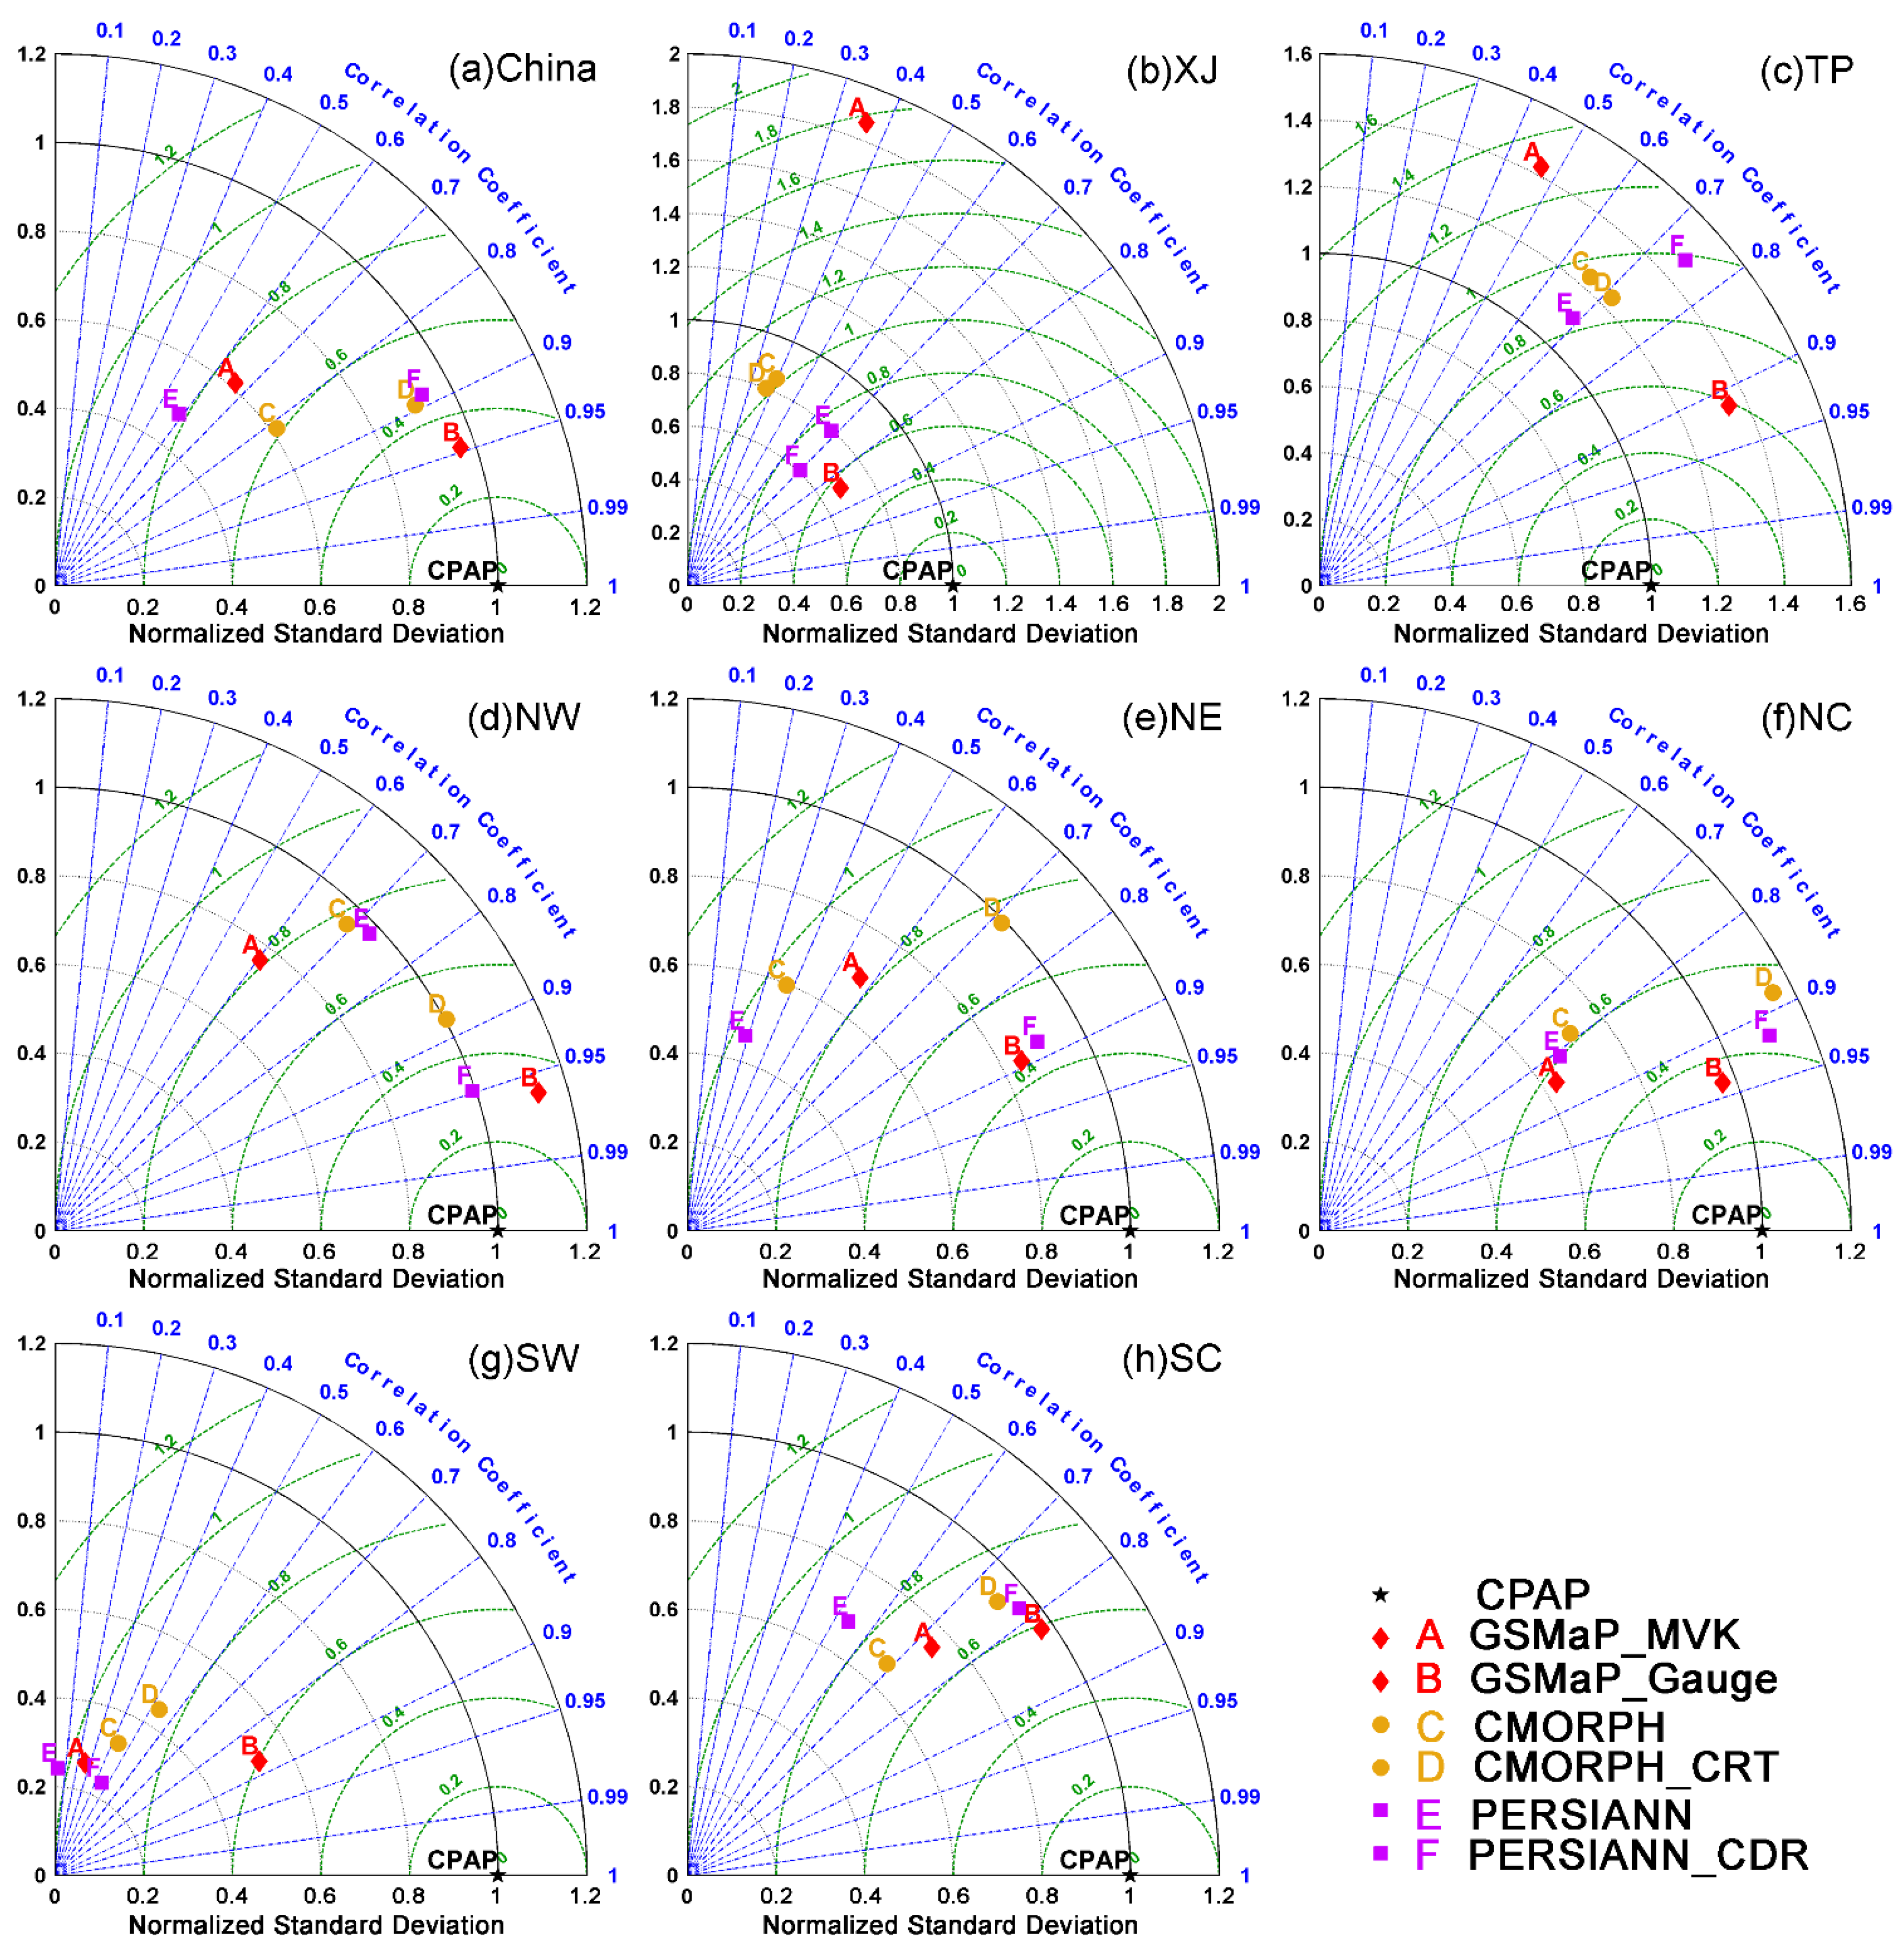
3.6. Spatial Analysis

The spatial distribution of the errors associated with satellite-based precipitation products can provide useful information, particularly for analyzing error propagation in regional hydrological and climatological applications. The spatial distribution maps of Bias, RB, RMSE, and CC of the satellite-based products versus CPAP are given in Figure 10. The Bias, RB, RMSE, and CC are computed grid by grid with four-year daily precipitation rates. Figure 11 shows the corresponding Probability Distribution Function (PDFc) and Cumulative Distribution Function (CDFc) of Bias, RB, RMSE, and CC.
Figure 10. Spatial distribution of Bias, RB, CC, and RMSE between different satellite-based products and CPAP over China on a 0.25° lat/lon grid for (ad) GSMaP_MVK; (eh) GSMaP_Gauge; (il) CMORPH; (mp) CMORPH_CRT; (qt) PERSIANN; and (ux) PERSIANN_CDR.
Atmosphere 07 00006 g010
Figure 11. Probability (Cumulative) Distribution Functions PDFc (CDFc) for spatial (a,e) Bias; (b,f) RB; (c,g) RMSE; and (d,h) CC values shown in Figure 10.
Atmosphere 07 00006 g011
All products tend to underestimate the four-year daily mean precipitation over the southwestern and southern China (i.e., SW and SC), while overestimating the precipitation over the rest of China. This tendency is clearly evident in Bias and RB metrics and is more pronounced for the non-bias-corrected products, especially GSMaP_MVK and CMORPH. The RMSE maps of satellite-based precipitation products present the systematic error amplitude distribution. The amplitude of RMSE declines from southeastern China to northwestern China, which suggests that satellite-based precipitation products tend to yield larger magnitude of errors over humid southeastern China than over the arid northwestern China. This is primarily a result of the greater volume of precipitation over the humid southeast relative to the arid/semi-arid northwest. Generally, the magnitude of errors for all products is higher (lower) over southern and southeastern (northern and northwestern) China with a wet (dry) climate; this result is consistent with previous findings from Shen [45]. The correlation between satellite-based products and CPAP reaches 0.5, and is higher for four-year daily precipitation. Overall, GSMaP_Gauge exhibits the best correlation over most of China (Figure 10, Table A1), suggesting that the bias-correction of GSMaP can effectively reduce errors resulting from complex terrain.
The occurrence Probability Distribution Functions (PDFc) and the occurrence Cumulative Distribution Functions (CDFc) can provide detailed information on the frequency of Bias, RB, RMSE, and CC with different thresholds. Figure 11 shows the statistics of Figure 10 in terms of PDFc and CDFc. CMORPH_CRT and PERSIANN_CDR show symmetrical quasi-Gaussian distributions of Bias and RB, while GSMaP_Gauge displays a right-skewed distribution (Figure 11b). Conversely, the satellite-only precipitation products show left-skewed distributions with much lower peak values. Furthermore, GSMaP_Gauge shows a higher percentage of positive bias for accumulations less than 1 mm/day, which indicates that the bias-correction procedure in GSMaP needs to be improved. All bias-corrected satellite precipitation products show slightly better performance than their satellite-only counterparts in terms of RMSE and CC. The GSMaP_Gauge has a higher percentage of high CC values than other products, which means more areas with higher CC than other products. Generally, the bias-correction procedures show good performance in reducing the magnitudes of Bias and RB, but do not show much improvement in reducing RMSE or improving CC for every grid box [83].

4. Summary and Conclusions

As alternative sources of precipitation information, future developments of satellite precipitation algorithms and utilization of satellite datasets in operational applications rely on a more in-depth understanding of errors and biases across different spatial and temporal scales. This paper provides a comprehensive and quantitative investigation of the error characteristics associated with three groups of high-resolution satellite precipitation products. The analysis is based on daily, seasonal and inter-annual rainfall comparisons with the gauge-based CPAP product for a four-year period over mainland China. In addition to the conventional statistical indices, frequency and spatial analyses have also been conducted in this study. The main findings of this paper can be summarized as follows:
(1)
Generally, the bias-correction procedures successfully reduce errors for all the three groups of satellite-based precipitation products. Specifically, regional overestimation or underestimation of precipitation, season-dependent errors and snow surface induced errors are reduced. However, the bias-correction procedure in GSMaP_Gauge may be not helpful in reducing errors in a mean sense.
(2)
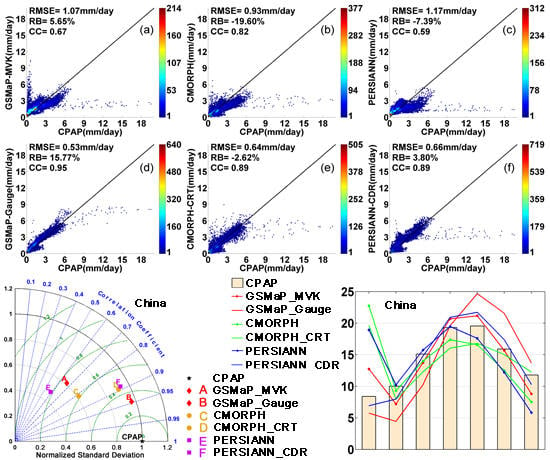
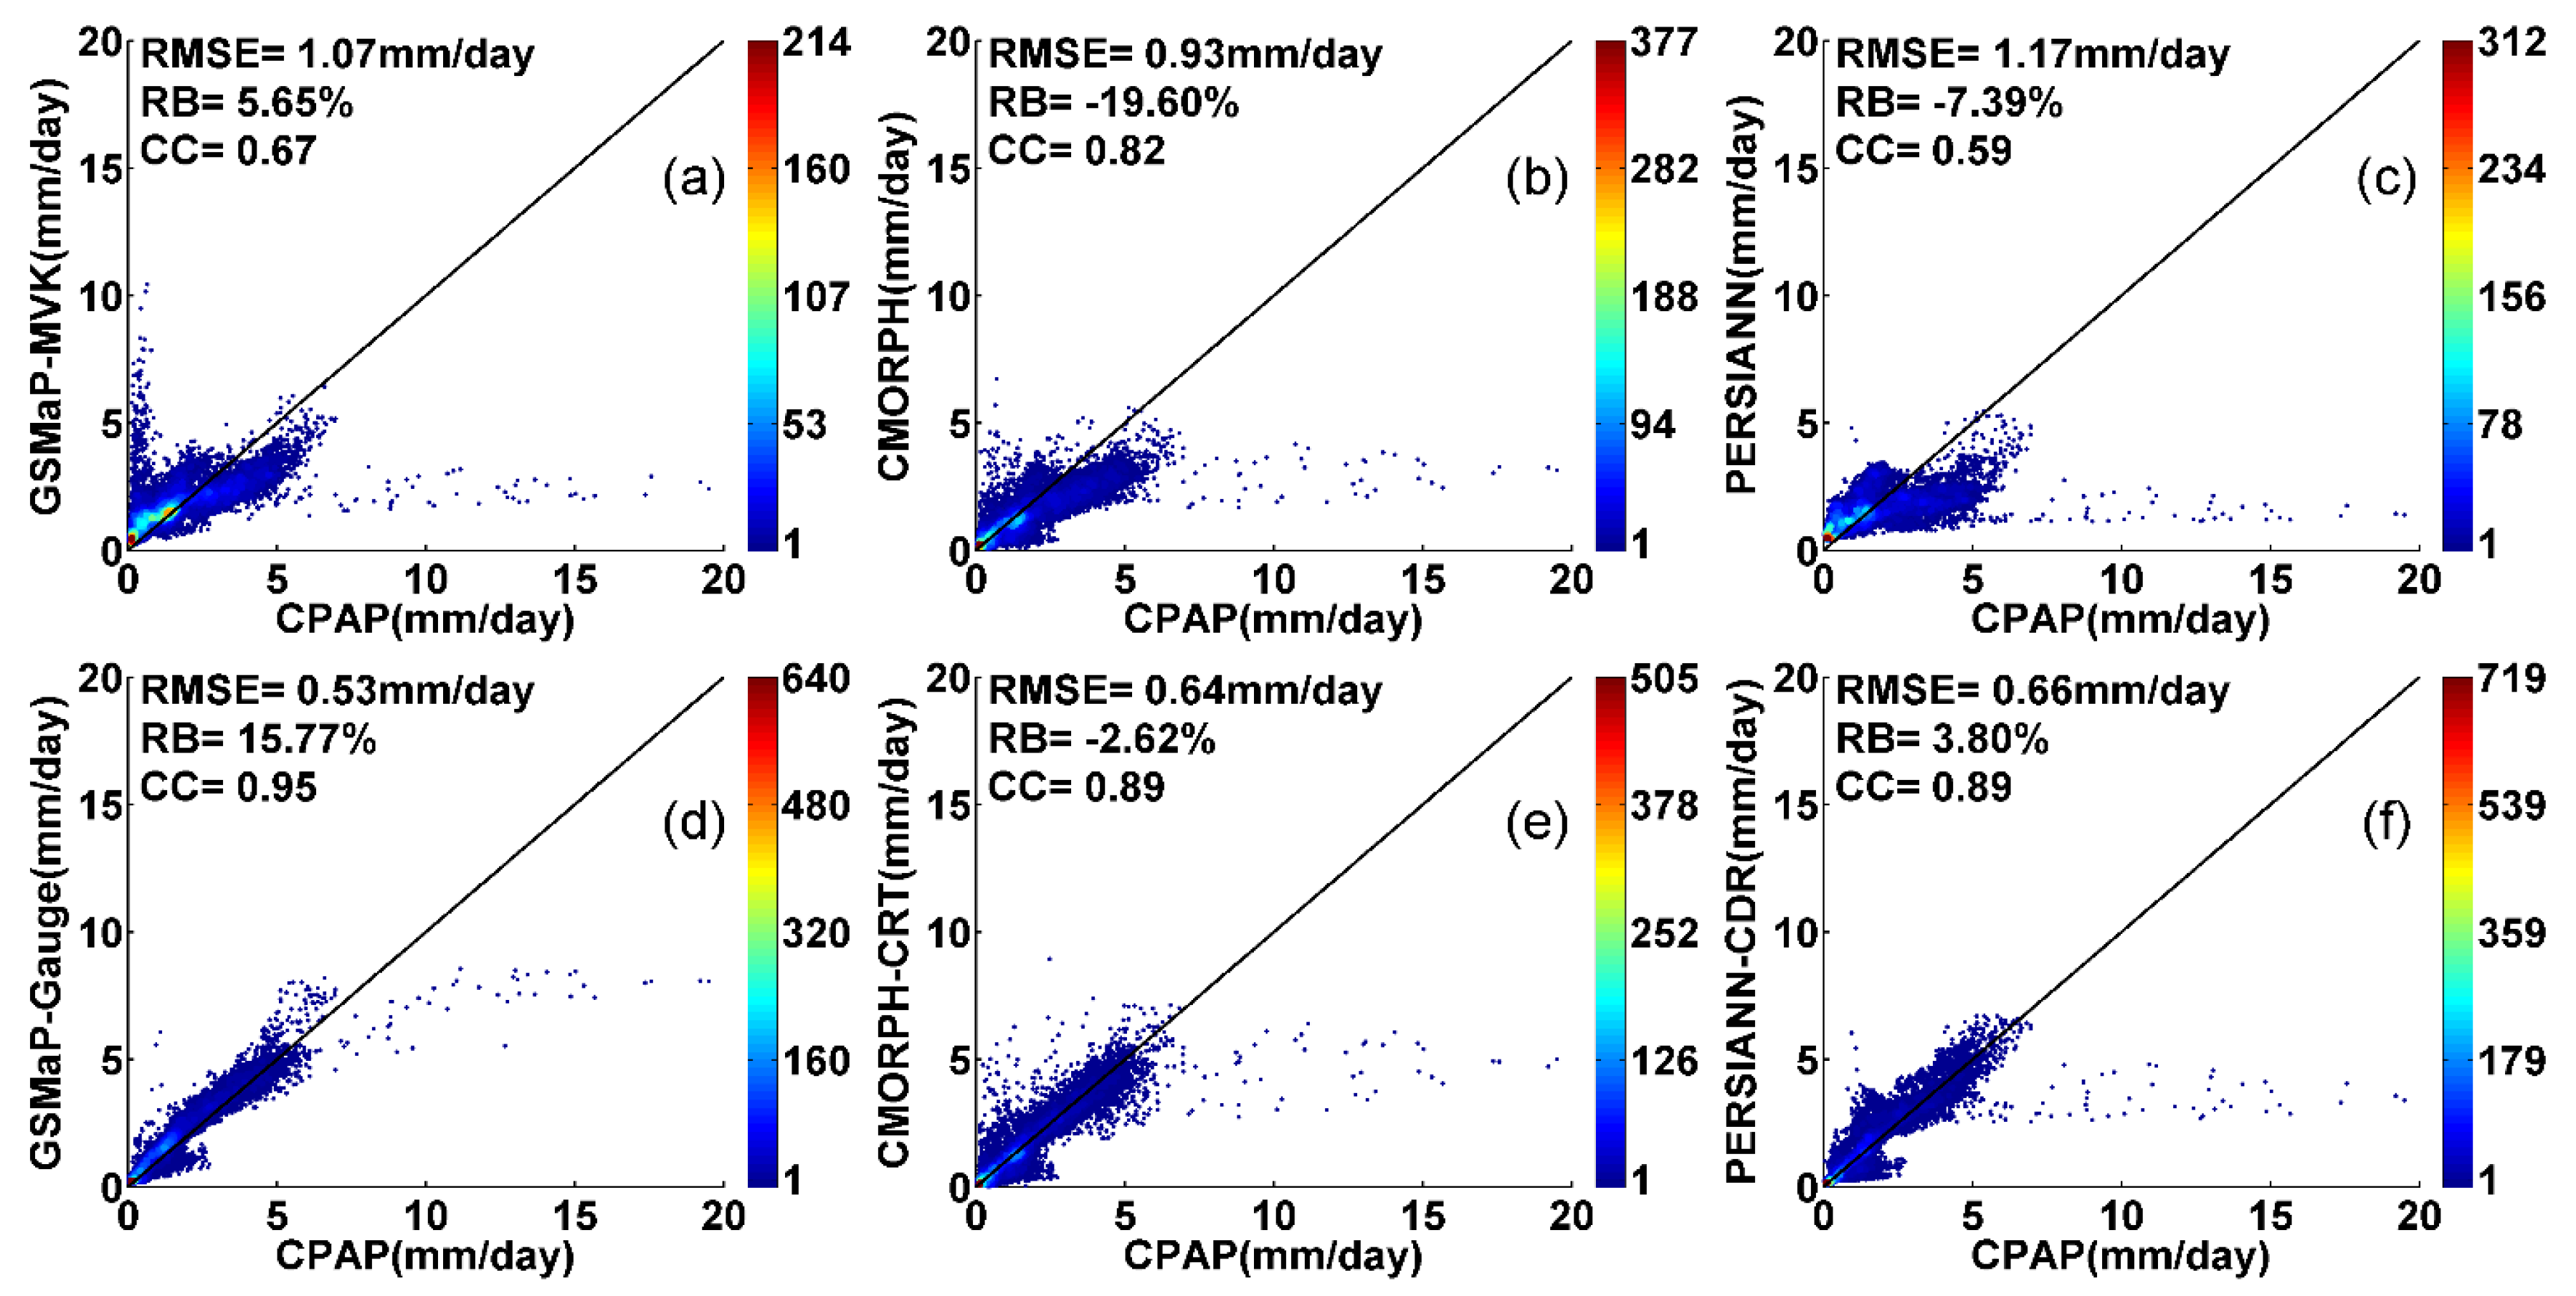
For the four-year mean daily precipitation, all the six satellite products are capable of capturing the overall spatial pattern of precipitation. GSMaP_Gauge produces better fractional coverage with the highest CC (0.95) and lowest RMSE (0.53 mm/day), but also has a relatively high RB (15.77%) over China, while CMORPH_CRT exhibits amounts closer to CPAP. Among the satellite-based precipitation products without bias-adjustment, CMORPH demonstrates the best performance with the highest CC (0.82), and lowest RMSE (0.93 mm/day), but also a relatively higher RB (−19.60%). CMORPH_CRT fails to remove the highlighted overestimation speckles which appear in CMORPH without bias-correction. GSMaP_MVK displays relatively poor performance in XJ, TP and NW with relatively low CCs and shows large overestimation along the northern hillside of Tibetan Plateau. Therefore, it should be used cautiously in mountainous regions. CMORPH and GSMaP perform poorly over ice/snow covered surfaces, while PERSIANN displays a distinct overestimation over TP.
(3)
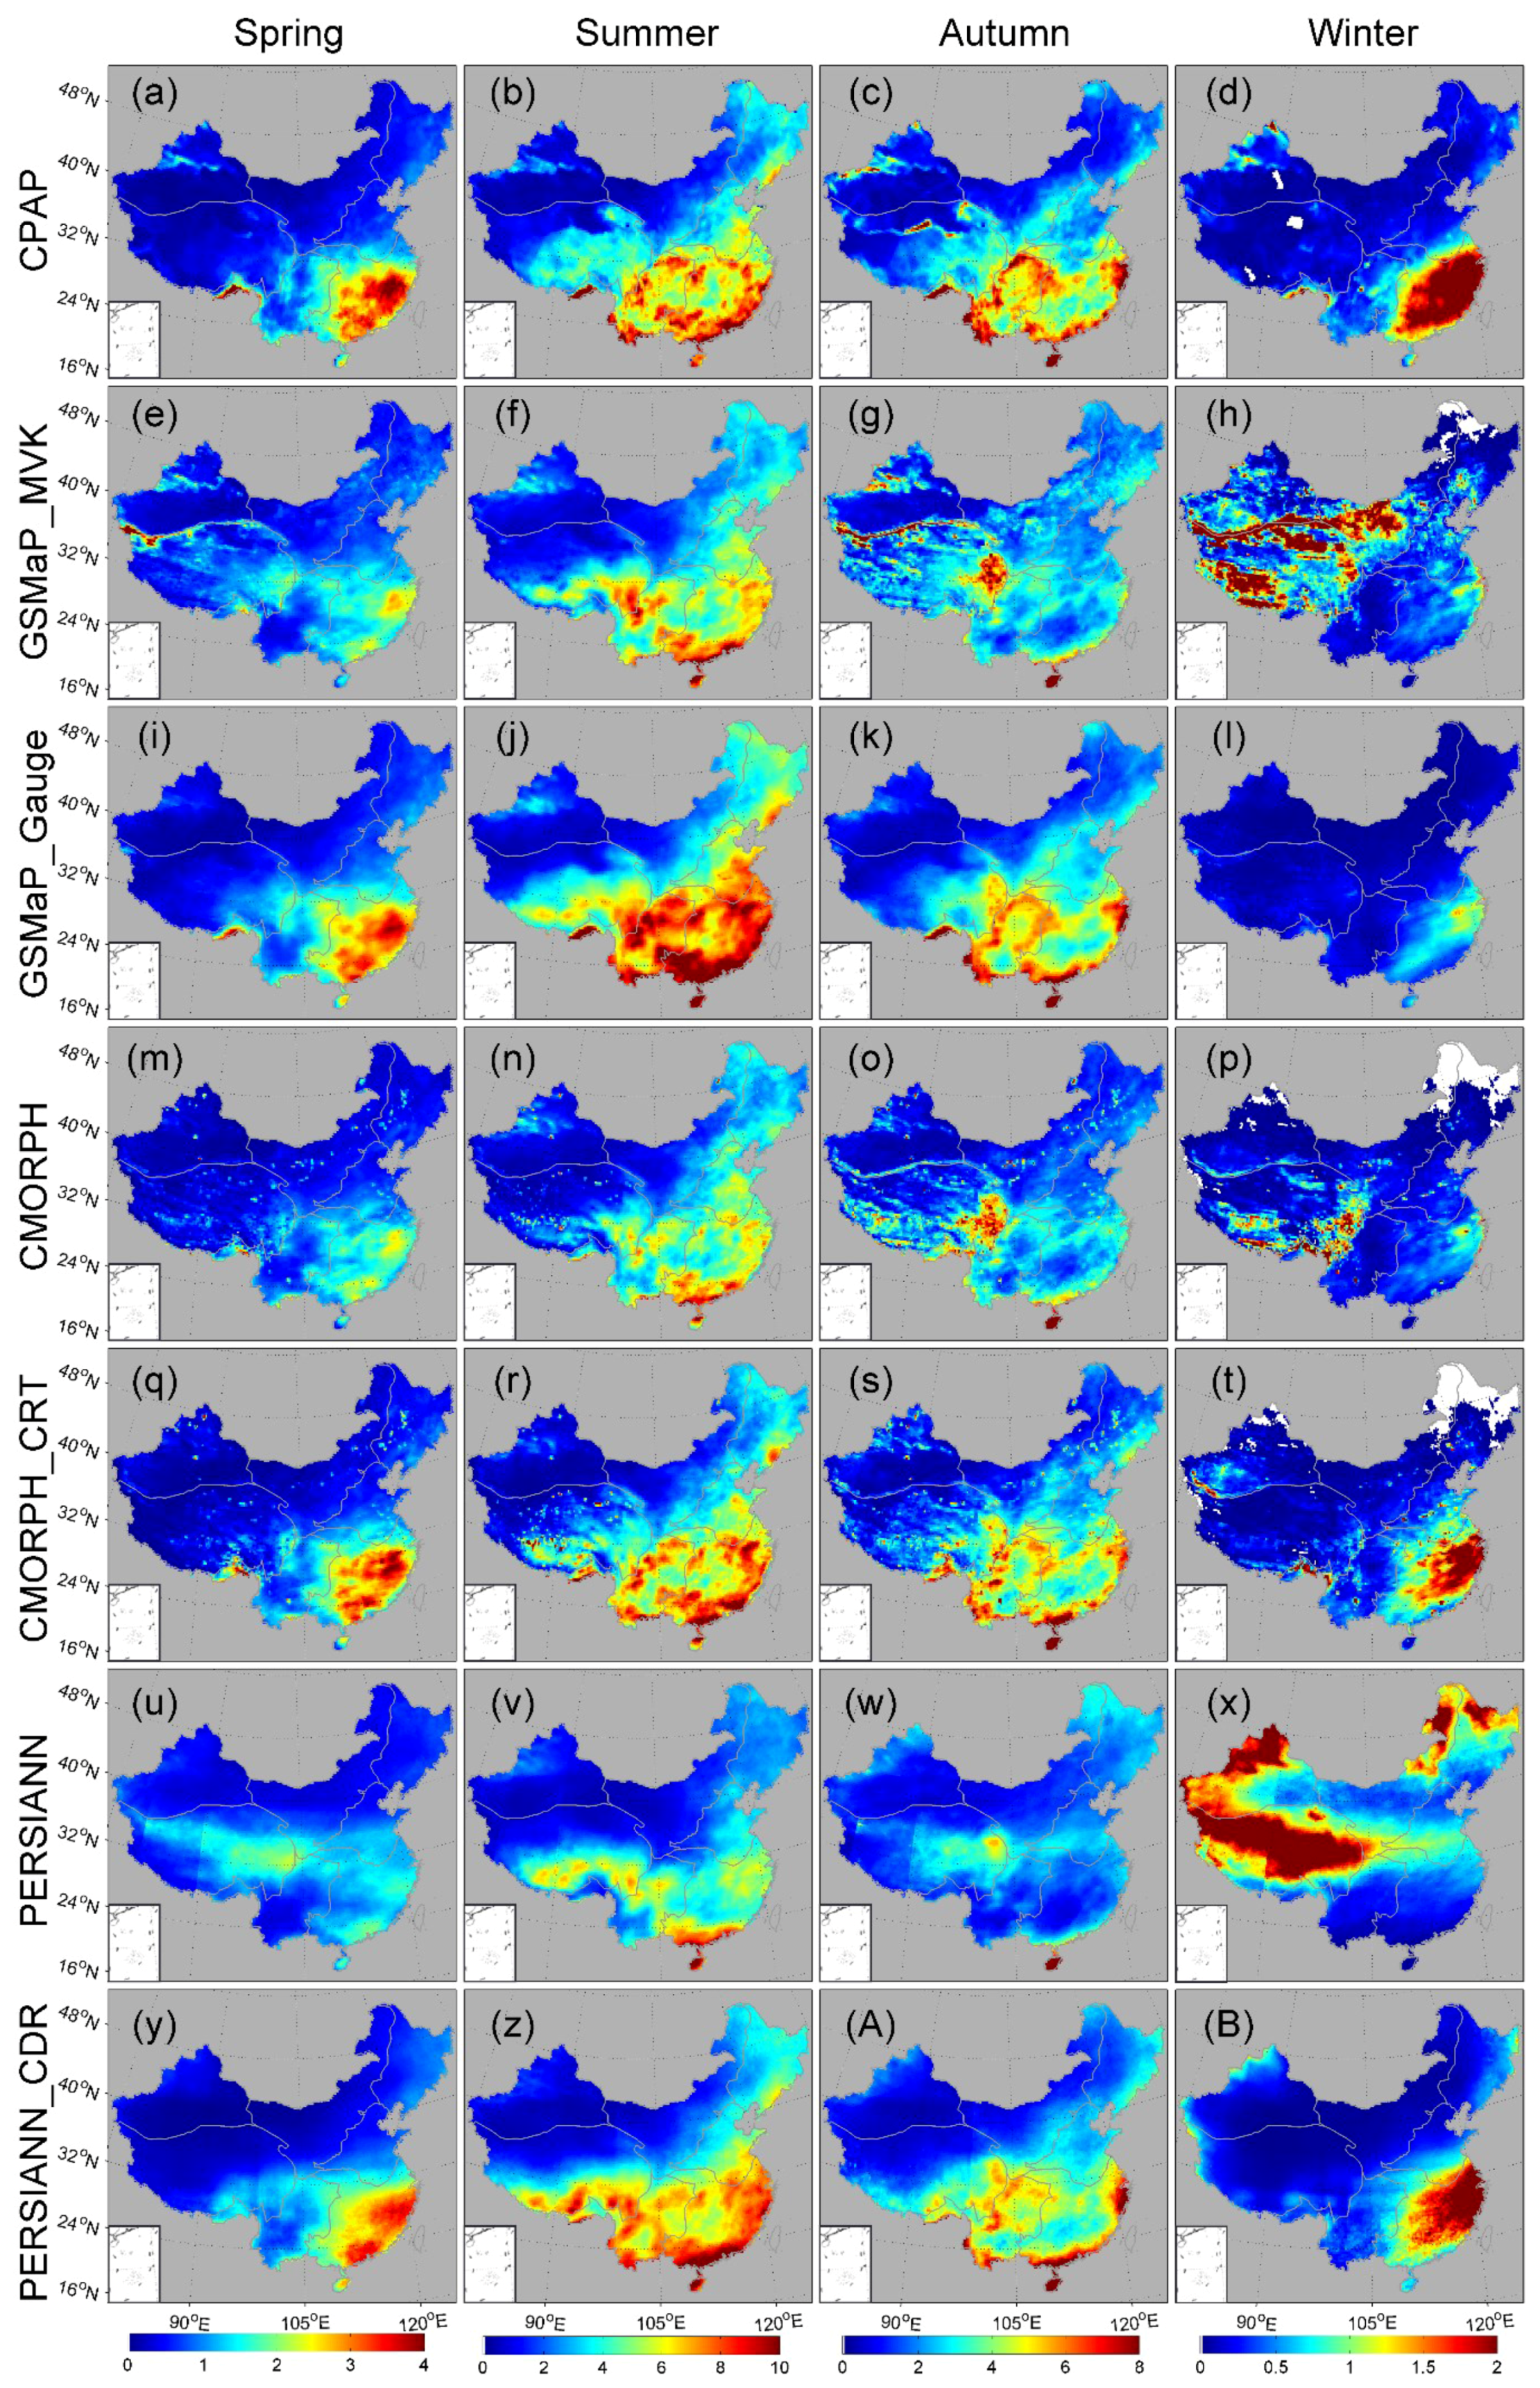
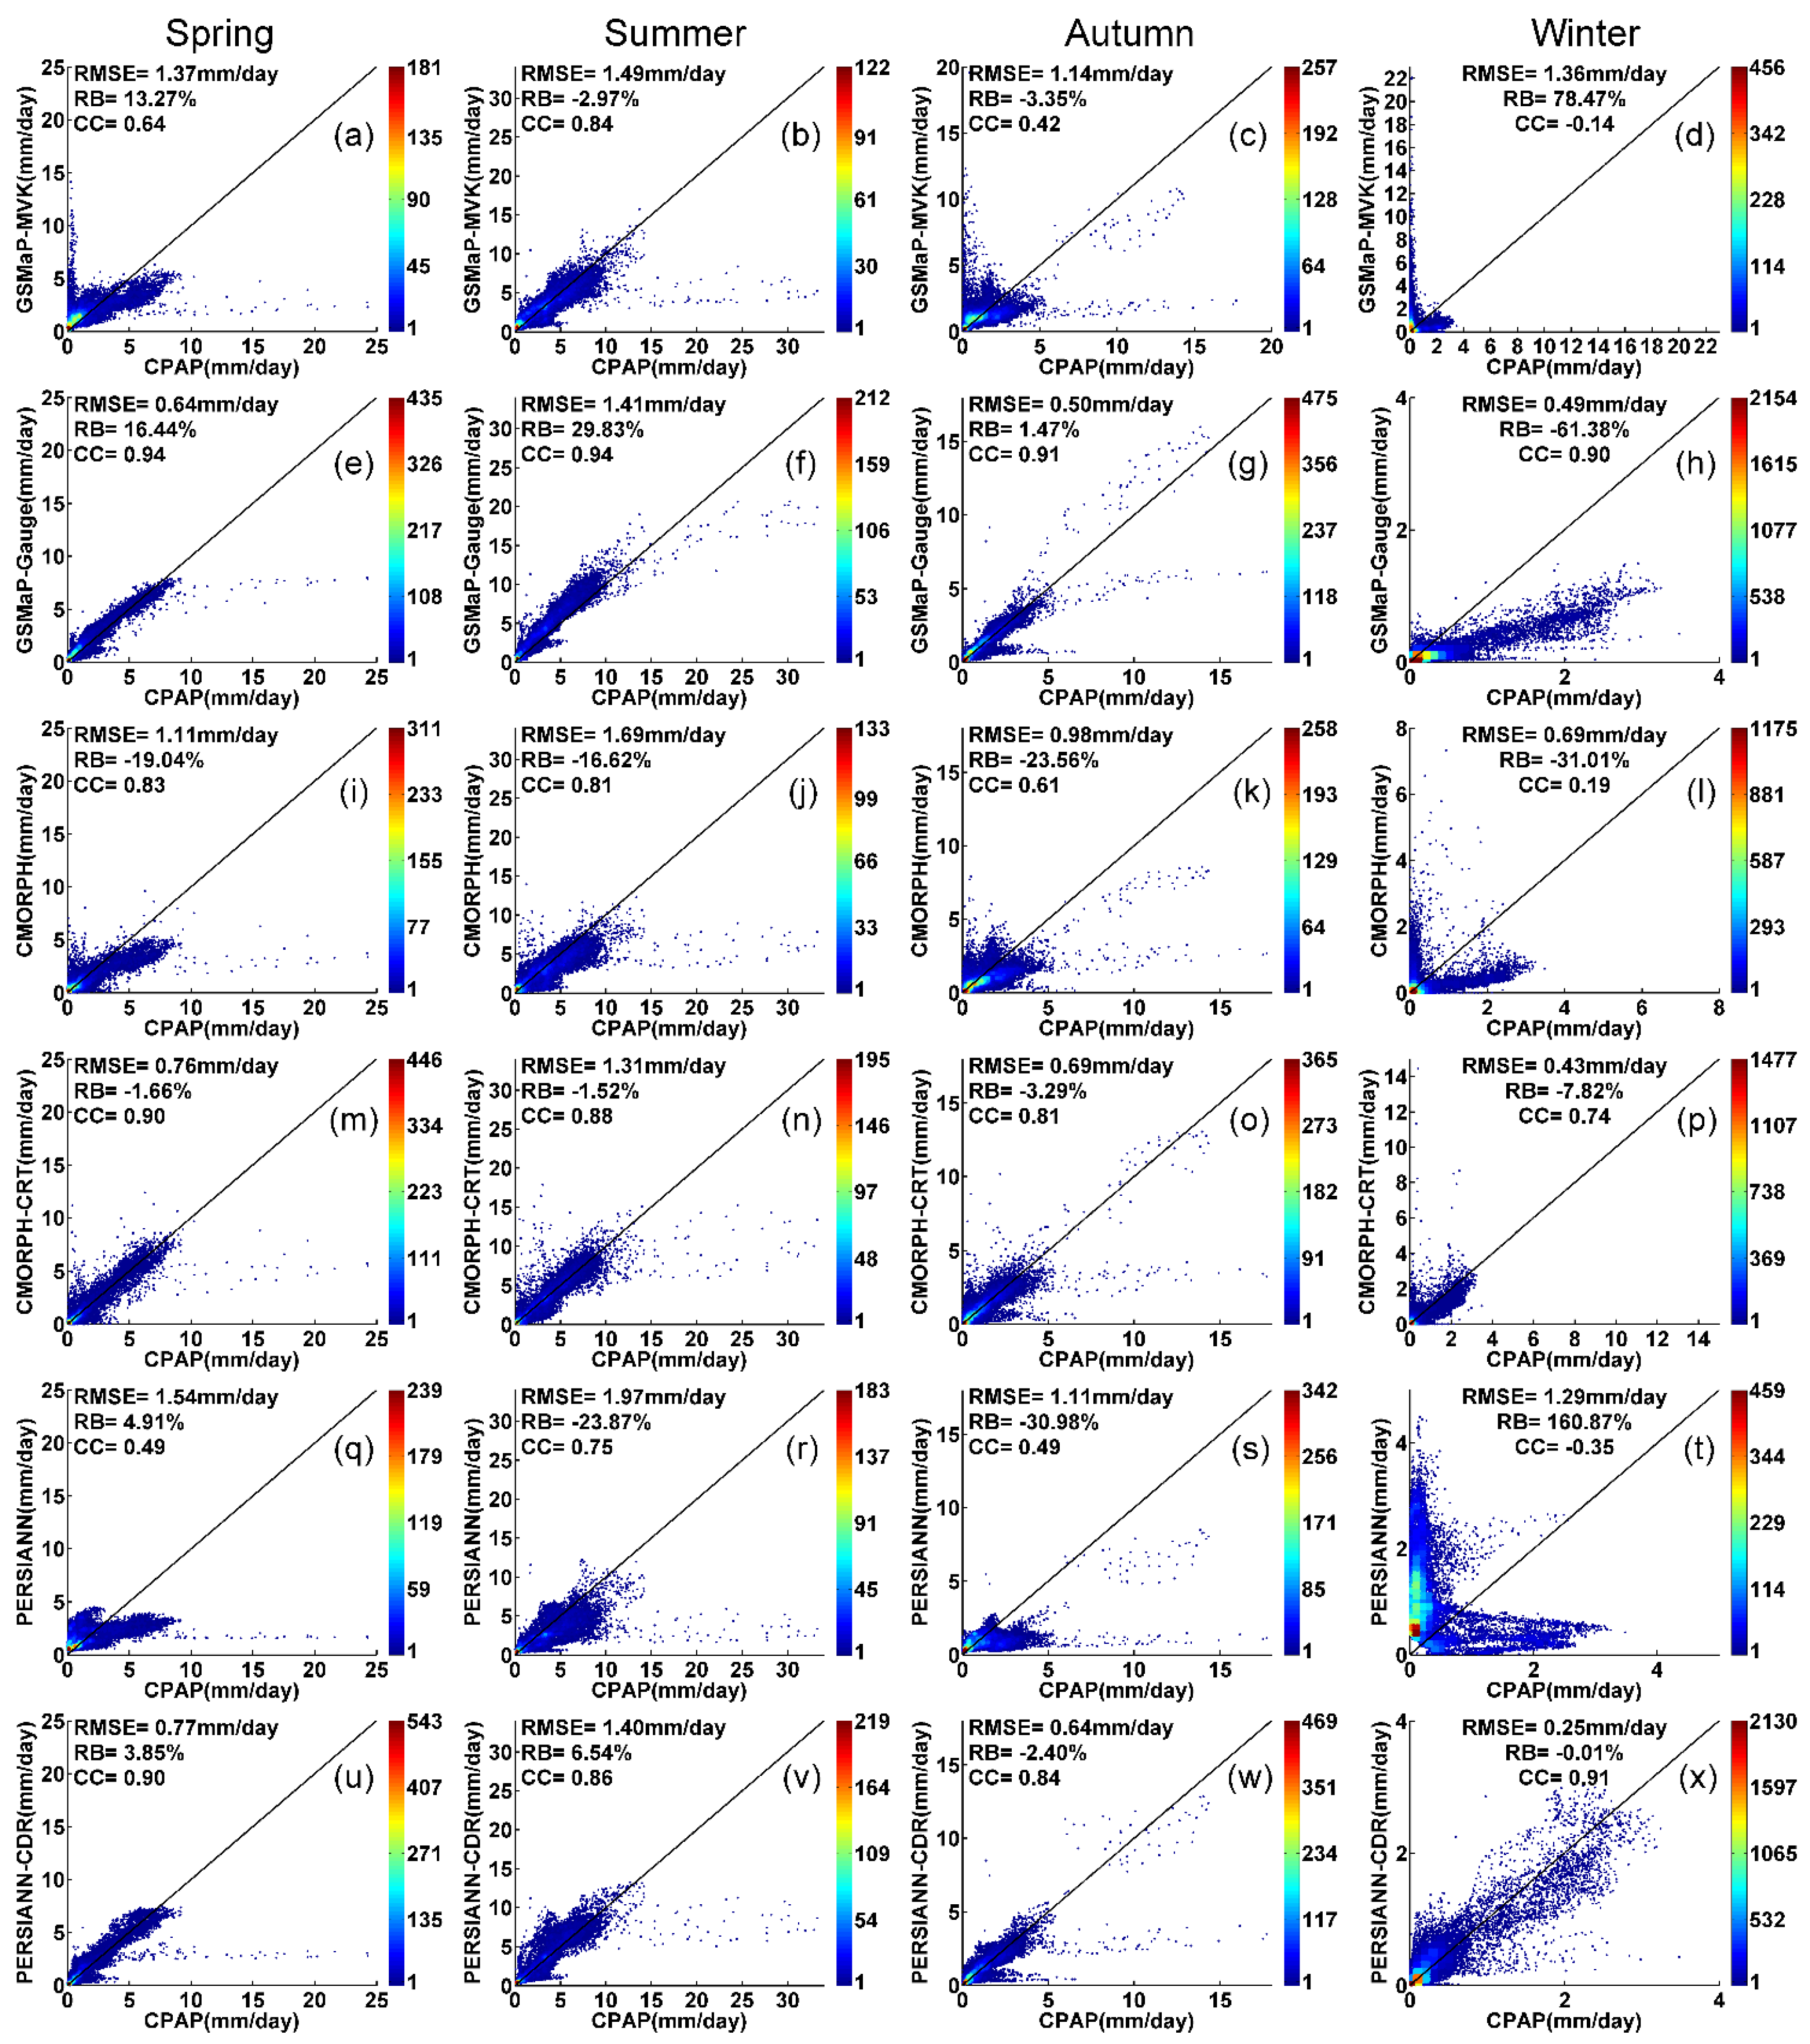
All the bias-corrected products provide improvements over their corresponding satellite-only counterparts. Among the bias-corrected products, GSMaP_Gauge shows the highest CC (0.90–0.94) but also a relatively high RB (−61.38%–16.44%) and RMSE (0.49–1.41 mm/day) for the seasonal four-year daily mean precipitation (Figure 4 and Figure 5, Table A1). Similar to the other precipitation products, it exhibits the worst performance in winter. PERSIANN_CDR shows the closest performance to CPAP in winter among all satellite-based products.
(4)
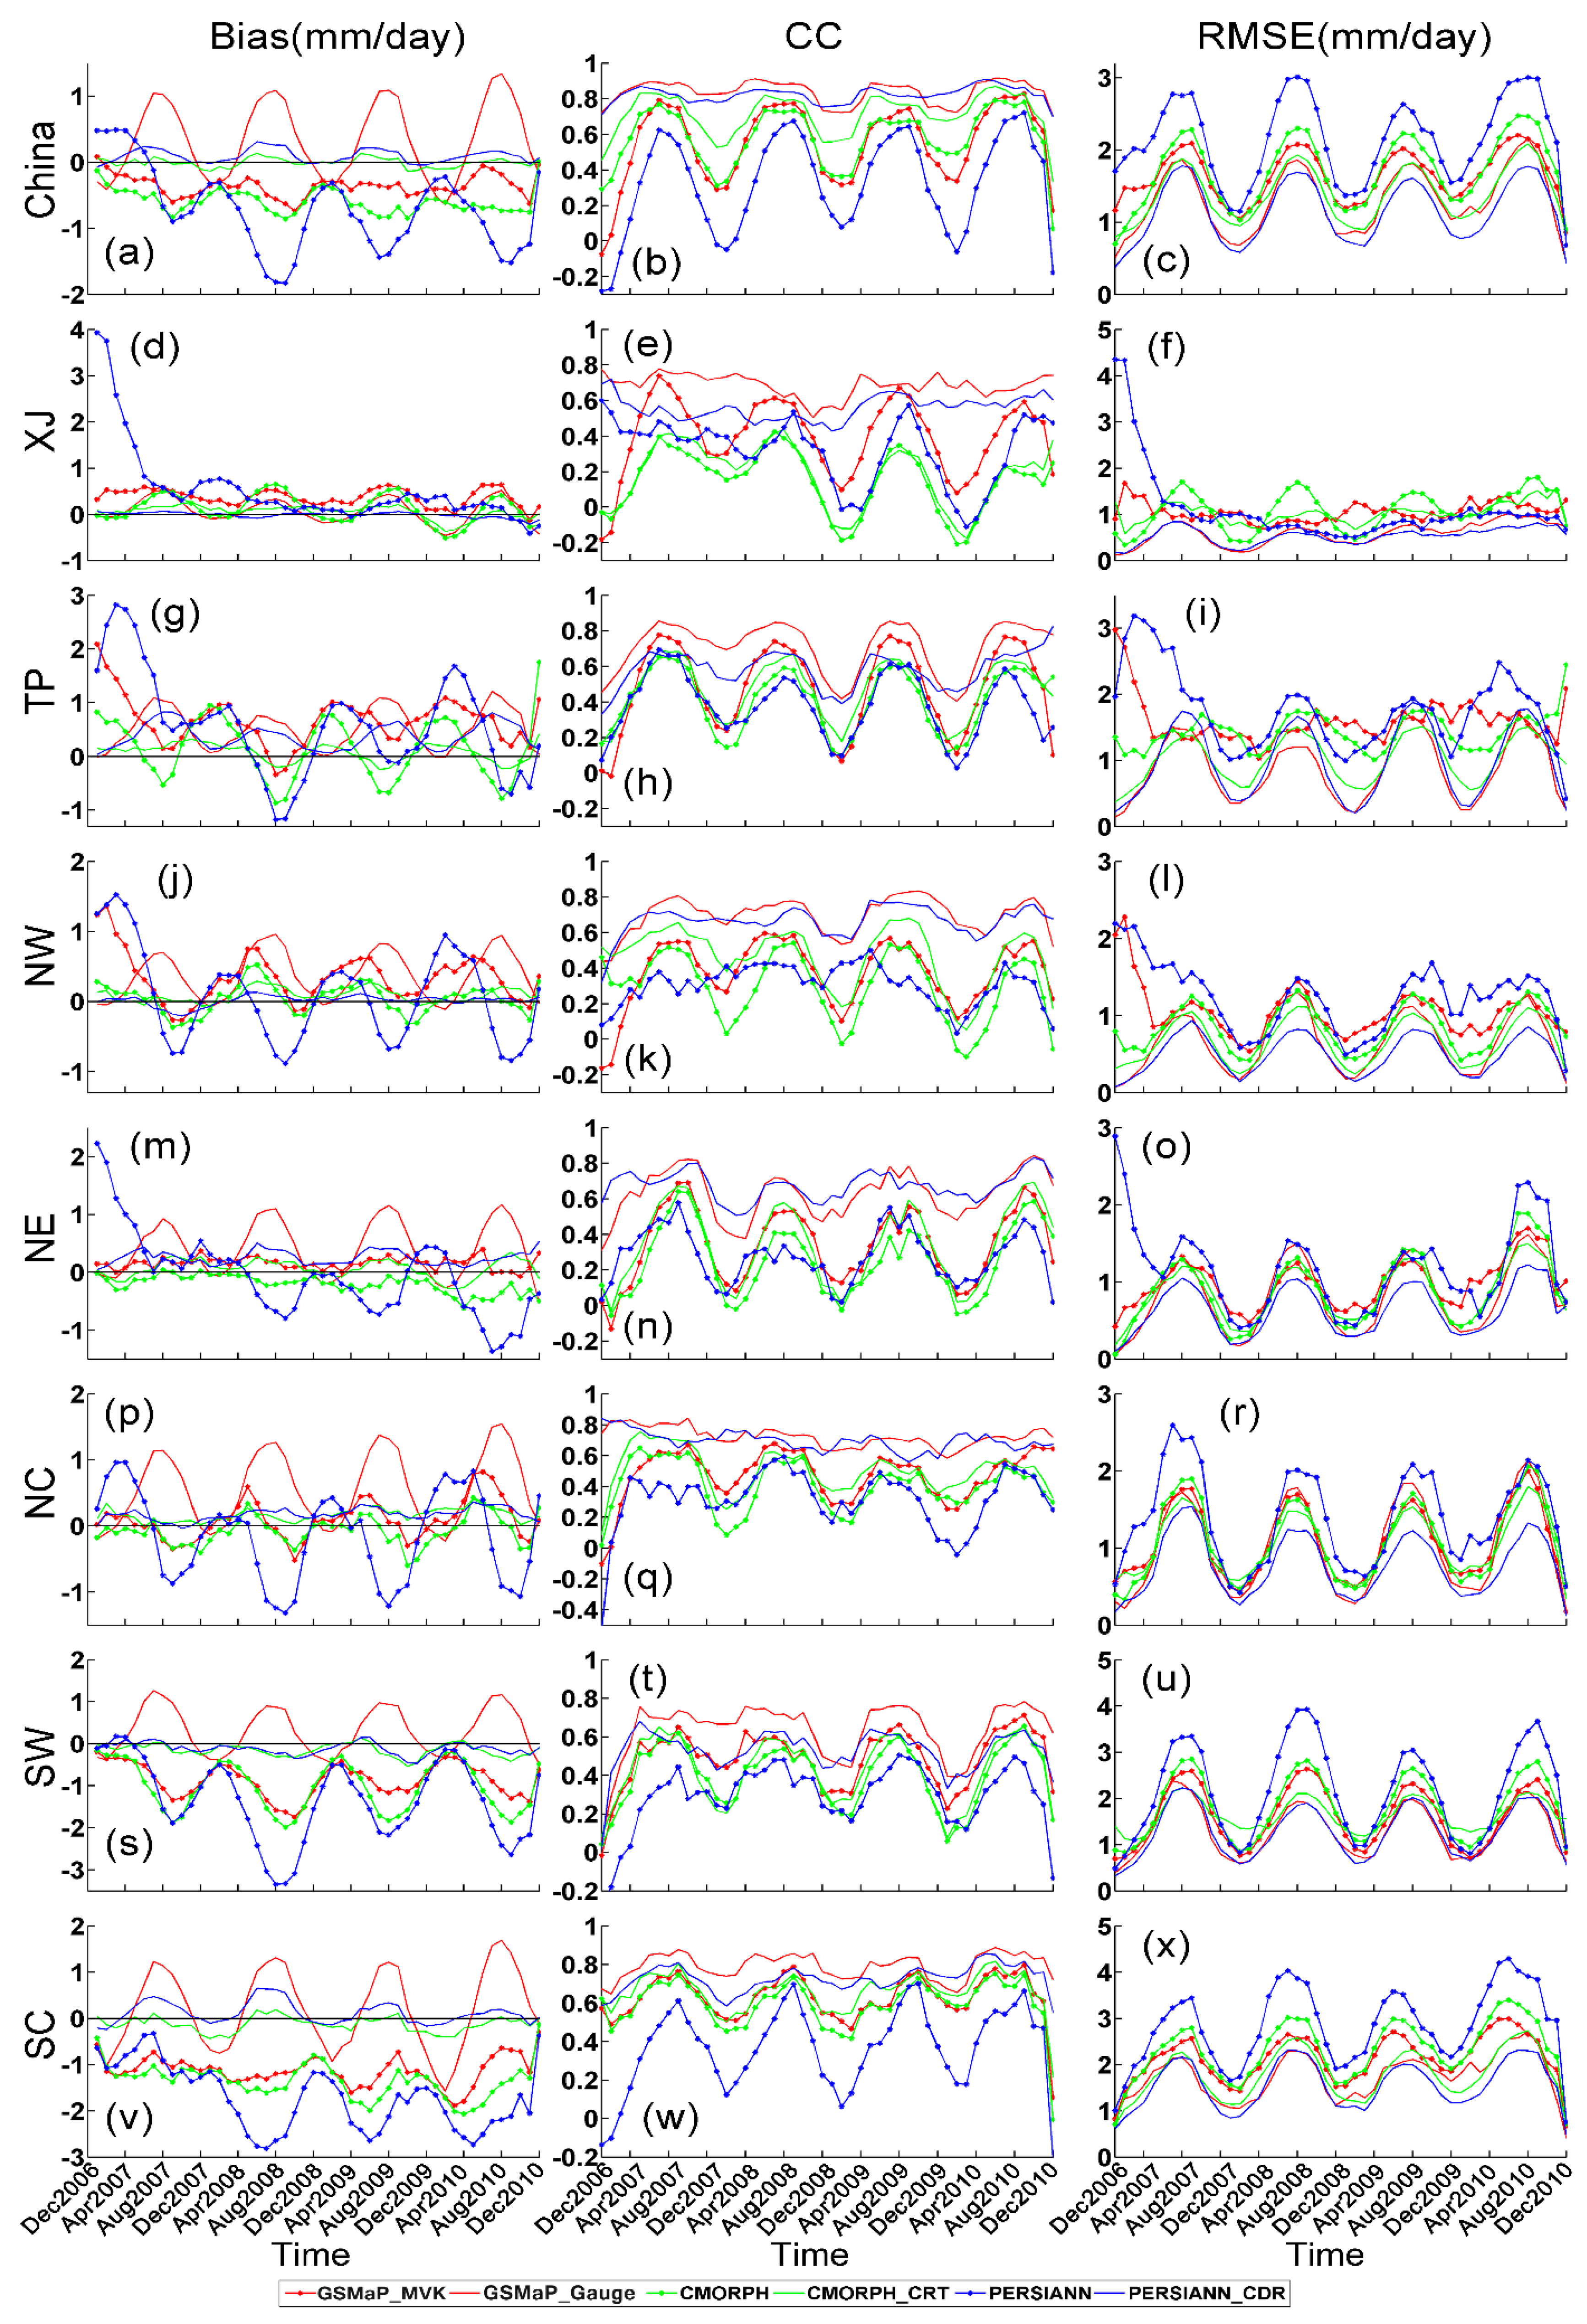
Season-dependent variations of error are present, and in particular, larger error values are observed during the monsoon season (April to October) for satellite-only precipitation products. These season-dependent variations are reduced by bias-adjustment procedures (Figure 7). GSMaP_MVK and CMORPH show underestimations for the entire study period. After bias-correction, GSMaP_Gauge consistently displays the highest CC (>0.7), but displays a relatively higher overestimation in warm seasons and a slight underestimation in cold seasons. This may be evidence for over-correction in the gauge-adjustment algorithm which could be improved in the future.
(5)
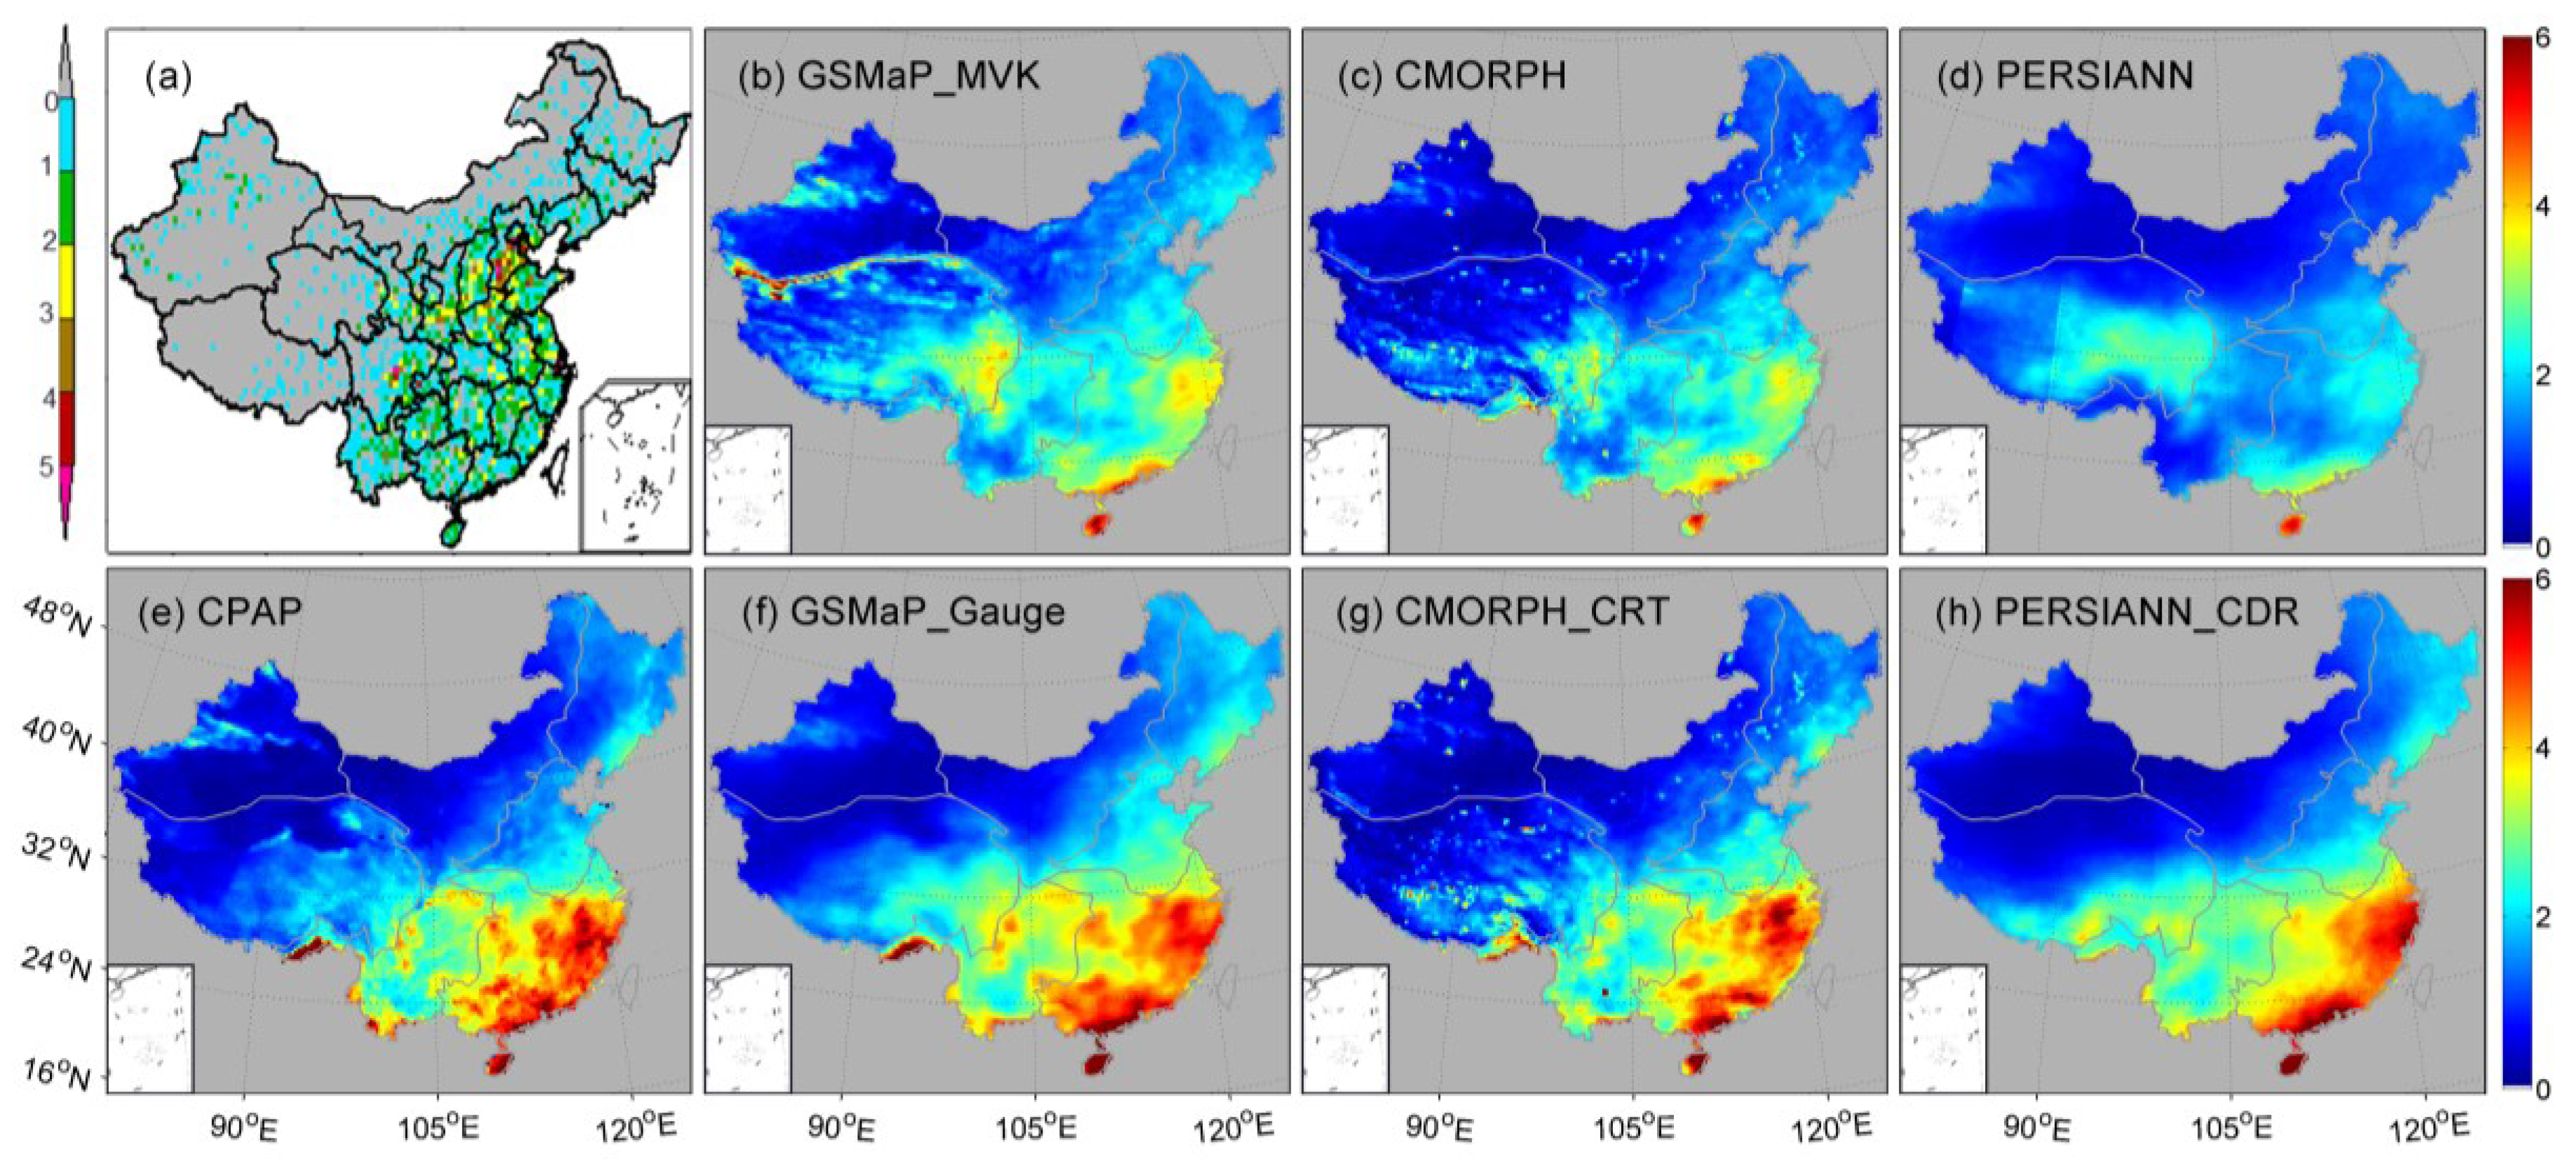
All the satellite-only precipitation products greatly overdetect the occurrence of rain rates less than 1 mm/day over dry regions (e.g., XJ, TP and NW) (Figure 8) and underdetect heavy rain events (>20 mm/day) over eastern China in wet climates. The bias-corrected products show decreased overdetection of light precipitation events. However, the bias-correction in PERSIANN and GSMaP tend to overcorrect the overdetection of light rain events and underdetection of heavy rain events. Moreover, gauge adjustment in CMORPH_CRT has little effect in reducing the light rain overdetection, but manifests detection patterns close to those of CPAP when the rain rate is over 1 mm/day.
(6)
Satellite-based precipitation products display low PODs for rain rates less than 60 mm/day. GSMaP_Gauge outperforms other two bias-corrected precipitation products with a maximum POD (~50%), maximum CSI (about 35%), and minimum FAR (~40%) for the rainfall rates less than 100 mm/day.
(7)
The underestimation by all satellite-based products is primarily distributed over southern and southeastern China while the overestimation is dominant over northern and western China. These satellite-based products exhibit better performance over the south and southeastern parts of China than over the north and northwestern parts of China in terms of Bias and RB (Figure 10 and Figure 11).
The error characteristics of the six high-resolution satellite-based precipitation estimates (GSMaP_MVK and GSMaP_Gauge, CMORPH and CMORPH_CRT, PERSIANN and PERSIANN_CDR) are identified and quantified over contiguous China in this paper. Knowledge of these characteristics will have significant implications for hydrometeorological applications and algorithm development. With the launch of the Global Precipitation Measurement Mission in late February 2014, the new product IMERG that combines the algorithms of CMORPH, PERSIANN, and TMPA has been released after much anticipation. The new version of GSMaP products has also been released recently. The systematic evaluation of CMORPH, PERSIANN, and GSMaP products will provide early and helpful references for algorithms developers and the end users of these future products.

Acknowledgments

The authors acknowledge the GSMaP project scientists and associated agency for the production of the data used in this study. We also would like thank Nicholas Carr for his help in manuscript preparation and all the individuals who participated in this study. Comments and suggestions from anonymous reviewers are acknowledged. This study was supported by the Natural Science Foundation of China under Grant No. 41371419; Special program for International Science & Technology Cooperation under Grant No. 2010DFA92720-04.

Author Contributions

Anming Bao and Sheng Chen conceived the framework of this study; Hao Guo conducted the data processing, Sheng Chen, Anming Bao, Junjun Hu, Banghui Yang, Hao Guo, and Phillip Stepanian contributed together to the writing of this manuscript.

Conflicts of Interest

The authors declare no conflict of interest.

Appendix

Table A1. RB, RMSE, and CC between CPAP and the selected satellite-based products for Annual and Seasonal Precipitation in seven sub-regions (XJ, TP, NW, NE, NC, SW and SC). The best satellite-only product in each season over different sub-regions is highlighted with regular font in gray background and the best gauge-corrected product is highlighted with bold font in gray background.
IndexTimeTypeXJTPNWNENCSWSC
RB (%)4 YearsGSMaP_MVK108.2067.7056.899.362.47−30.87−29.03
GSMaP_Gauge5.2927.0740.9126.2129.157.585.26
CMORPH3.15−4.2613.34−13.69−6.37−35.64−33.81
CMORPH_CRT−12.85−2.626.472.778.83−8.13−3.07
PERSIANN96.0168.7225.030.48−11.59−47.17−43.71
PERSIANN_CDR−13.1619.903.3916.738.93−6.321.73
SpringGSMaP_MVK101.82169.02106.8220.2821.22−29.12−33.00
GSMaP_Gauge−1.2453.8459.9723.2837.167.823.41
CMORPH−13.3224.9935.17−27.820.38−26.75−36.12
CMORPH_CRT−10.750.299.15−2.2412.37−4.52−1.79
PERSIANN83.05205.6079.08−6.5526.49−37.56−46.57
PERSIANN_CDR−22.1130.127.2922.1010.94−6.691.46
SummerGSMaP_MVK77.97−1.2625.441.020.23−22.21−11.79
GSMaP_Gauge51.7230.7150.4734.7537.0218.9424.32
CMORPH40.65−34.1616.06−5.76−0.27−34.92−19.81
CMORPH_CRT−14.13−5.717.964.334.77−7.881.08
PERSIANN27.40−0.85−23.24−25.13−31.06−42.94−28.08
PERSIANN_CDR−4.3921.353.5310.335.77−2.276.61
AutumnGSMaP_MVK74.9558.7027.5036.27−16.21−49.94−40.69
GSMaP_Gauge−28.510.5218.9520.9714.57−6.351.42
CMORPH−15.1320.12−10.29−5.73−27.83−48.42−41.95
CMORPH_CRT−14.310.495.5222.716.08−13.90−4.87
PERSIANN12.16−1.910.8232.39−19.07−70.86−59.89
PERSIANN_CDR−22.925.254.2930.017.99−15.47−3.85
WinterGSMaP_MVK315.481228.02552.85−20.1020.21−49.54−72.91
GSMaP_Gauge−66.162.01−66.26−68.28−51.06−69.72−65.58
CMORPH−50.69332.9722.97−87.49−32.69−20.63−74.32
CMORPH_CRT−9.4727.54−26.91−66.7855.741.88−22.07
PERSIANN583.451582.36753.58308.4099.73−21.53−76.66
PERSIANN_CDR−0.3651.13−27.0136.6844.09−7.17−9.60
RMSE (mm/day)4 YearsGSMaP_MVK0.951.170.590.390.301.581.28
GSMaP_Gauge0.260.490.370.420.580.790.55
CMORPH0.480.610.360.460.351.631.47
CMORPH_CRT0.480.570.220.340.331.170.60
PERSIANN0.570.930.380.430.381.991.87
PERSIANN_CDR0.340.680.140.320.281.220.57
SpringGSMaP_MVK0.871.690.690.430.431.611.98
GSMaP_Gauge0.370.560.390.350.591.050.63
CMORPH0.650.610.490.620.421.512.08
CMORPH_CRT0.720.520.280.530.391.260.89
PERSIANN0.701.640.690.300.651.862.67
PERSIANN_CDR0.460.530.210.350.291.400.81
SummerGSMaP_MVK0.731.120.770.780.723.031.39
GSMaP_Gauge0.591.241.031.281.711.921.95
CMORPH0.811.510.740.910.853.331.82
CMORPH_CRT0.621.430.480.650.752.311.31
PERSIANN0.511.200.841.271.554.022.45
PERSIANN_CDR0.491.680.340.620.642.541.27
AutumnGSMaP_MVK1.271.320.490.420.351.741.19
GSMaP_Gauge0.410.510.200.250.270.710.57
CMORPH0.670.890.530.360.471.731.26
CMORPH_CRT0.630.670.330.400.341.150.59
PERSIANN0.430.580.460.450.442.251.68
PERSIANN_CDR0.450.660.200.310.271.110.59
WinterGSMaP_MVK1.712.021.010.350.370.441.31
GSMaP_Gauge0.290.090.090.190.280.411.16
CMORPH0.370.660.220.270.340.761.32
CMORPH_CRT0.440.210.130.290.370.760.65
PERSIANN1.291.840.990.870.490.441.45
PERSIANN_CDR0.240.170.070.170.210.260.44
CC4 YearsGSMaP_MVK0.370.430.600.560.850.230.74
GSMaP_Gauge0.840.920.960.890.940.850.82
CMORPH0.390.670.690.380.790.350.69
CMORPH_CRT0.370.720.880.710.890.470.76
PERSIANN0.680.700.730.290.81−0.010.52
PERSIANN_CDR0.700.750.950.880.920.370.78
SpringGSMaP_MVK0.540.300.700.570.900.420.70
GSMaP_Gauge0.790.870.940.840.950.760.94
CMORPH0.200.560.430.130.760.510.74
CMORPH_CRT0.230.710.720.360.890.600.85
PERSIANN0.250.490.610.640.660.210.42
PERSIANN_CDR0.620.790.870.820.930.460.88
SummerGSMaP_MVK0.800.820.810.650.780.300.75
GSMaP_Gauge0.800.920.940.880.910.850.82
CMORPH0.550.700.800.510.700.440.67
CMORPH_CRT0.550.690.900.810.820.560.67
PERSIANN0.730.770.730.470.760.100.56
PERSIANN_CDR0.730.740.950.870.880.360.73
AutumnGSMaP_MVK0.230.210.480.620.530.330.90
GSMaP_Gauge0.800.730.960.880.810.840.94
CMORPH0.150.390.360.400.500.280.88
CMORPH_CRT0.260.540.770.640.590.360.90
PERSIANN0.630.550.440.340.160.130.86
PERSIANN_CDR0.620.570.910.870.680.430.90
WinterGSMaP_MVK−0.13−0.06−0.31−0.280.100.140.54
GSMaP_Gauge0.500.490.530.670.920.450.81
CMORPH−0.260.04−0.06−0.290.330.080.59
CMORPH_CRT−0.190.130.21−0.230.660.130.69
PERSIANN0.530.040.380.060.30−0.16−0.20
PERSIANN_CDR0.560.400.650.760.940.340.80

References

  1. Behrangi, A.; Khakbaz, B.; Jaw, T.C.; AghaKouchak, A.; Hsu, K.L.; Sorooshian, S. Hydrologic evaluation of satellite precipitation products over a mid-size basin. J. Hydrol. 2011, 397, 225–237. [Google Scholar] [CrossRef]
  2. Zawadzki, I.; Desrochers, C.; Torlaschi, E.; Bellon, A. A radar-raingauge comparison. In Proceedings of the 23rd Conference on Radar Meteorology, Snowmass, CO, USA, 22–26 September 1986; American Meteorological Society: Snowmass, CO, USA; pp. 121–124.
  3. Hsu, K.L.; Gao, X.G.; Sorooshian, S.; Gupta, H.V. Precipitation estimation from remotely sensed information using artificial neural networks. J. Appl. Meteorol. 1997, 36, 1176–1190. [Google Scholar] [CrossRef]
  4. Sorooshian, S.; Hsu, K.-L.; Gao, X.; Gupta, H.V.; Imam, B.; Braithwaite, D. Evaluation of persiann system satellite-based estimates of tropical rainfall. Bull. Am. Meteorol. Soc. 2000, 81, 2035–2046. [Google Scholar] [CrossRef]
  5. Joyce, R.J.; Janowiak, J.E.; Arkin, P.A.; Xie, P.P. Cmorph: A method that produces global precipitation estimates from passive microwave and infrared data at high spatial and temporal resolution. J. Hydrometeorol. 2004, 5, 487–503. [Google Scholar] [CrossRef]
  6. Ushio, T.; Sasashige, K.; Kubota, T.; Shige, S.; Okamoto, K.; Aonashi, K.; Inoue, T.; Takahashi, N.; Iguchi, T.; Kachi, M.; et al. A kalman filter approach to the global satellite mapping of precipitation (gsmap) from combined passive microwave and infrared radiometric data. J. Meteorol. Soc. Jpn. 2009, 87, 137–151. [Google Scholar] [CrossRef]
  7. Huffman, G.J.; Adler, R.F.; Bolvin, D.T.; Gu, G.J.; Nelkin, E.J.; Bowman, K.P.; Hong, Y.; Stocker, E.F.; Wolff, D.B. The trmm multisatellite precipitation analysis (tmpa): Quasi-global, multiyear, combined-sensor precipitation estimates at fine scales. J. Hydrometeorol. 2007, 8, 38–55. [Google Scholar] [CrossRef]
  8. Casella, D.; Dietrich, S.; di Paola, F.; Formenton, M.; Mugnai, A.; Porcù, F.; Sanò, P. Pm-gcd—A combined ir-mw satellite technique for frequent retrieval of heavy precipitation. Nat. Hazards Earth Syst. Sci. 2012, 12, 231–240. [Google Scholar] [CrossRef]
  9. Milewski, A.; Elkadiri, R.; Durham, M. Assessment and comparison of tmpa satellite precipitation products in varying climatic and topographic regimes in morocco. Remote Sens. 2015, 7, 5697–5717. [Google Scholar] [CrossRef]
  10. Casella, D.; Panegrossi, G.; Sano, P.; Dietrich, S.; Mugnai, A.; Smith, E.; Tripoli, G.J.; Formenton, M.; di Paola, F.; Leung, W.-Y.H. Transitioning from crd to cdrd in bayesian retrieval of rainfall from satellite passive microwave measurements: Part 2. Overcoming database profile selection ambiguity by consideration of meteorological control on microphysics. IEEE Trans. Geosci. Remote Sens. 2013, 51, 4650–4671. [Google Scholar] [CrossRef]
  11. Di Paola, F.; Casella, D.; Dietrich, S.; Mugnai, A.; Ricciardelli, E.; Romano, F.; Sanò, P. Combined mw-ir precipitation evolving technique (pet) of convective rain fields. Nat. Hazards Earth Syst. Sci. 2012, 12, 3557–3570. [Google Scholar] [CrossRef]
  12. Mugnai, A.; Smith, E.A.; Tripoli, G.J.; Bizzarri, B.; Casella, D.; Dietrich, S.; di Paola, F.; Panegrossi, G.; Sanò, P. Cdrd and pnpr satellite passive microwave precipitation retrieval algorithms: Eurotrmm/eurainsat origins and h-saf operations. Nat. Hazards Earth Syst. Sci. 2013, 13, 887–912. [Google Scholar] [CrossRef]
  13. Ricciardelli, E.; Cimini, D.; di Paola, F.; Romano, F.; Viggiano, M. A statistical approach for rain intensity differentiation using meteosat second generation–spinning enhanced visible and infrared imager observations. Hydrol. Earth Syst. Sci. 2014, 18, 2559–2576. [Google Scholar] [CrossRef] [Green Version]
  14. Chen, S.; Liu, H.; You, Y.; Mullens, E.; Hu, J.; Yuan, Y.; Huang, M.; He, L.; Luo, Y.; Zeng, X.; et al. Evaluation of high-resolution precipitation estimates from satellites during july 2012 beijing flood event using dense rain gauge observations. PLoS ONE 2014, 9, e89681. [Google Scholar] [CrossRef] [PubMed]
  15. Yong, B.; Chen, B.; Gourley, J.J.; Ren, L.; Hong, Y.; Chen, X.; Wang, W.; Chen, S.; Gong, L. Intercomparison of the version-6 and version-7 tmpa precipitation products over high and low latitudes basins with independent gauge networks: Is the newer version better in both real-time and post-real-time analysis for water resources and hydrologic extremes? J. Hydrol. 2014, 508, 77–87. [Google Scholar]
  16. Xue, X.; Hong, Y.; Limaye, A.S.; Gourley, J.J.; Huffman, G.J.; Khan, S.I.; Dorji, C.; Chen, S. Statistical and hydrological evaluation of trmm-based multi-satellite precipitation analysis over the wangchu basin of bhutan: Are the latest satellite precipitation products 3b42v7 ready for use in ungauged basins? J. Hydrol. 2013, 499, 91–99. [Google Scholar] [CrossRef]
  17. Stisen, S.; Sandholt, I. Evaluation of remote-sensing-based rainfall products through predictive capability in hydrological runoff modelling. Hydrol. Process. 2010, 24, 879–891. [Google Scholar] [CrossRef]
  18. Puca, S.; Porcu, F.; Rinollo, A.; Vulpiani, G.; Baguis, P.; Balabanova, S.; Campione, E.; Ertürk, A.; Gabellani, S.; Iwanski, R. The validation service of the hydrological saf geostationary and polar satellite precipitation products. Nat. Hazards Earth Syst. Sci. 2014, 14, 871–889. [Google Scholar] [CrossRef]
  19. Di Paola, F.; Ricciardelli, E.; Cimini, D.; Romano, F.; Viggiano, M.; Cuomo, V. Analysis of catania flash flood case study by using combined microwave and infrared technique. J. Hydrometeorol. 2014, 15, 1989–1998. [Google Scholar] [CrossRef]
  20. Dietrich, S.; Casella, D.; di Paola, F.; Formenton, M.; Mugnai, A.; Sanò, P. Lightning-based propagation of convective rain fields. Nat. Hazards Earth Syst. Sci. 2011, 11, 1571–1581. [Google Scholar] [CrossRef]
  21. Su, F.G.; Hong, Y.; Lettenmaier, D.P. Evaluation of trmm multisatellite precipitation analysis (tmpa) and its utility in hydrologic prediction in the la plata basin. J. Hydrometeorol. 2008, 9, 622–640. [Google Scholar] [CrossRef]
  22. Turk, F.J.; Arkin, P.; Ebert, E.E.; Sapiano, M.R.P. Evaluating high-resolution precipitation products. Bull. Am. Meteorol. Soc. 2008, 89, 1911–1916. [Google Scholar] [CrossRef]
  23. Hong, Y.; Hsu, K.L.; Moradkhani, H.; Sorooshian, S. Uncertainty quantification of satellite precipitation estimation and monte carlo assessment of the error propagation into hydrologic response. Water Resour. Res. 2006, 42, W08421. [Google Scholar] [CrossRef]
  24. Maggioni, V.; Reichle, R.H.; Anagnostou, E.N. The efficiency of assimilating satellite soil moisture retrievals in a land data assimilation system using different rainfall error models. J. Hydrometeorol. 2012, 14, 368–374. [Google Scholar] [CrossRef]
  25. Stephens, G.L.; Kummerow, C.D. The remote sensing of clouds and precipitation from space: A review. J. Atmos. Sci. 2007, 64, 3742–3765. [Google Scholar] [CrossRef]
  26. Falck, A.S.; Maggioni, V.; Tomasella, J.; Vila, D.A.; Diniz, F.L.R. Propagation of satellite precipitation uncertainties through a distributed hydrologic model: A case study in the tocantins-araguaia basin in brazil. J. Hydrol. 2015, 527, 943–957. [Google Scholar] [CrossRef]
  27. Maggioni, V.; Vergara, H.J.; Anagnostou, E.N.; Gourley, J.J.; Hong, Y.; Stampoulis, D. Investigating the applicability of error correction ensembles of satellite rainfall products in river flow simulations. J. Hydrometeorol. 2013, 14, 1194–1211. [Google Scholar] [CrossRef]
  28. Hong, Y.; Adler, R.F. Towards an early-warning system for global landslides triggered by rainfall and earthquake. Int. J. Remote Sens. 2007, 28, 3713–3719. [Google Scholar] [CrossRef]
  29. Sapiano, M.R.P.; Arkin, P.A. An intercomparison and validation of high-resolution satellite precipitation estimates with 3-hourly gauge data. J. Hydrometeorol. 2009, 10, 149–166. [Google Scholar] [CrossRef]
  30. Wei, C.C.; Roan, J. Retrievals for the rainfall rate over land using special sensor microwave imager data during tropical cyclones: Comparisons of scattering index, regression, and support vector regression. J. Hydrometeorol. 2012, 13, 1567–1578. [Google Scholar] [CrossRef]
  31. Habib, E.; Haile, A.T.; Tian, Y.; Joyce, R.J. Evaluation of the high-resolution cmorph satellite rainfall product using dense rain gauge observations and radar-based estimates. J. Hydrometeorol. 2012, 13, 1784–1798. [Google Scholar] [CrossRef]
  32. Bitew, M.M.; Gebremichael, M. Evaluation through independent measurements: Complex terrain and humid tropical region in ethiopia. In Satellite Rainfall Applications for Surface Hydrology; Springer Netherlands: Berlin, Germany, 2010; pp. 205–214. [Google Scholar]
  33. Romilly, T.G.; Gebremichael, M. Evaluation of satellite rainfall estimates over ethiopian river basins. Hydrol. Earth Syst. Sci. 2011, 15, 1505–1514. [Google Scholar] [CrossRef]
  34. Hsu, K.-L.; Sorooshian, S. Satellite-based precipitation measurement using persiann system. In Hydrological Modelling and the Water Cycle; Sorooshian, S., Hsu, K.-L., Coppola, E., Tomassetti, B., Verdecchia, M., Visconti, G., Eds.; Springer: Berlin/Heidelberg, Germany, 2008; Volume 63, pp. 27–48. [Google Scholar]
  35. Ebert, E.E.; Janowiak, J.E.; Kidd, C. Comparison of near-real-time precipitation estimates from satellite observations and numerical models. Bull. Am. Meteorol. Soc. 2007, 88, 47–64. [Google Scholar] [CrossRef]
  36. Hirpa, F.A.; Gebremichael, M.; Hopson, T. Evaluation of high-resolution satellite precipitation products over very complex terrain in ethiopia. J. Appl. Meteorol. Climatol. 2010, 49, 1044–1051. [Google Scholar] [CrossRef]
  37. Yamamoto, M.; Ueno, K.I.; Nakamura, K. Comparison of satellite precipitation products with rain gauge data for the khumb region, nepal himalayas. J. Meteorol. Soc. Jpn. 2011, 89, 597–610. [Google Scholar] [CrossRef]
  38. Kubota, T.; Ushio, T.; Shige, S.; Kida, S.; Kachi, M.; Okamoto, K. Verification of high-resolution satellite-based rainfall estimates around japan using a gauge-calibrated ground-radar dataset. J. Meteorol. Soc. Jpn. 2009, 87A, 203–222. [Google Scholar] [CrossRef]
  39. Ngo-Duc, T.; Matsumoto, J.; Kamimera, H.; Bui, H.-H. Monthly adjustment of global satellite mapping of precipitation (gsmap) data over the vugia–thubon river basin in central vietnam using an artificial neural network. Hydrol. Res. Lett. 2013, 7, 85–90. [Google Scholar] [CrossRef]
  40. Shrestha, M.; Takara, K.; Kubota, T.; Bajracharya, S. Verification of gsmap rainfall estimates over the central himalayas. J. Jpn. Soc. Civ. Eng. 2011, 67, I_37–I_42. [Google Scholar] [CrossRef]
  41. Taniguchi, A.; Shige, S.; Yamamoto, M.K.; Mega, T.; Kida, S.; Kubota, T.; Kachi, M.; Ushio, T.; Aonashi, K. Improvement of high-resolution satellite rainfall product for typhoon morakot (2009) over taiwan. J. Hydrometeorol. 2013, 14, 1859–1871. [Google Scholar] [CrossRef]
  42. Tian, Y.D.; Peters-Lidard, C.D.; Adler, R.F.; Kubota, T.; Ushio, T. Evaluation of gsmap precipitation estimates over the contiguous united states. J. Hydrometeorol. 2010, 11, 566–574. [Google Scholar] [CrossRef]
  43. Veerakachen, W.; Raksapatcharawong, M.; Seto, S. Performance evaluation of global satellite mapping of precipitation (gsmap) products over the chaophraya river basin, thailand. Hydrol. Res. Lett. 2014, 8, 39–44. [Google Scholar] [CrossRef]
  44. Mega, T.; Ushio, T.; Kubota, T.; Kachi, M.; Aonashi, K.; Shige, S. Gauge adjusted global satellite mapping of precipitation (gsmap_gauge). In Proceedings of the 2014 XXXIth URSI General Assembly and Scientific Symposium (URSI GASS), Beijing, China, 16–23 August 2014; pp. 1–4.
  45. Shen, Y.; Xiong, A.Y.; Wang, Y.; Xie, P.P. Performance of high-resolution satellite precipitation products over china. J. Geophys. Res. 2010, 115, D02114. [Google Scholar] [CrossRef]
  46. Zhou, T.J.; Yu, R.C.; Chen, H.M.; Dai, A.; Pan, Y. Summer precipitation frequency, intensity, and diurnal cycle over china: A comparison of satellite data with rain gauge observations. J. Clim. 2008, 21, 3997–4010. [Google Scholar] [CrossRef]
  47. Gao, Y.C.; Liu, M.F. Evaluation of high-resolution satellite precipitation products using rain gauge observations over the tibetan plateau. Hydrol. Earth Syst. Sci. 2013, 17, 837–849. [Google Scholar] [CrossRef]
  48. Li, Z.; Yang, D.W.; Hong, Y. Multi-scale evaluation of high-resolution multi-sensor blended global precipitation products over the yangtze river. J. Hydrol. 2013, 500, 157–169. [Google Scholar] [CrossRef]
  49. Yin, Z.Y.; Zhang, X.Q.; Liu, X.D.; Colella, M.; Chen, X.L. An assessment of the biases of satellite rainfall estimates over the tibetan plateau and correction methods based on topographic analysis. J. Hydrometeorol. 2008, 9, 301–326. [Google Scholar] [CrossRef]
  50. Guo, H.; Chen, S.; Bao, A.M.; Hu, J.J.; Gebregiorgis, A.S.; Xue, X.W.; Zhang, X.H. Inter-comparison of high-resolution satellite precipitation products over central asia. Remote Sens. 2015, 7, 7181–7211. [Google Scholar] [CrossRef]
  51. Tang, Z.Y.; Wang, Z.H.; Zheng, C.Y.; Fang, J.Y. Biodiversity in china’s mountains. Front. Ecol. Environ. 2006, 4, 347–352. [Google Scholar] [CrossRef]
  52. Qian, W.; Lin, X. Regional trends in recent precipitation indices in china. Meteorol. Atmos. Phys. 2005, 90, 193–207. [Google Scholar] [CrossRef]
  53. Chen, S.; Hong, Y.; Cao, Q.; Gourley, J.J.; Kirstetter, P.E.; Yong, B.; Tian, Y.D.; Zhang, Z.X.; Shen, Y.; Hu, J.J.; et al. Similarity and difference of the two successive v6 and v7 trmm multisatellite precipitation analysis performance over china. J. Geophys. Res. 2013, 118, 13060–13074. [Google Scholar] [CrossRef]
  54. Bothe, O.; Fraedrich, K.; Zhu, X.H. Precipitation climate of central asia and the large-scale atmospheric circulation. Theor. Appl. Climatol. 2012, 108, 345–354. [Google Scholar] [CrossRef]
  55. Carr, L.E.; Elsberry, R.L. Monsoonal interactions leading to sudden tropical cyclone track changes. Mon. Weather Rev. 1995, 123, 265–289. [Google Scholar] [CrossRef]
  56. Aonashi, K.; Awaka, J.; Hirose, M.; Kozu, T.; Kubota, T.; Liu, G.S.; Shige, S.; Kida, S.; Seto, S.; Takahashi, N.; et al. Gsmap passive microwave precipitation retrieval algorithm: Algorithm description and validation. J. Meteorol. Soc. Jpn. 2009, 87A, 119–136. [Google Scholar] [CrossRef]
  57. Kubota, T.; Shige, S.; Hashizurne, H.; Aonashi, K.; Takahashi, N.; Seto, S.; Hirose, M.; Takayabu, Y.N.; Ushio, T.; Nakagawa, K.; et al. Global precipitation map using satellite-borne microwave radiometers by the gsmap project: Production and validation. IEEE Trans. Geosci. Remote Sens. 2007, 45, 2259–2275. [Google Scholar] [CrossRef]
  58. Okamoto, K.; Ushio, T.; Iguchi, T.; Takahashi, N.; Iwanami, K. The global satellite mapping of precipitation (gsmap) project. In Proceedings of the 2005 IEEE International Geoscience and Remote Sensing Symposium, IGARSS ’05, Seoul, Korea, 25–29 July 2005; pp. 3414–3416.
  59. Shige, S.; Yamamoto, T.; Tsukiyama, T.; Kida, S.; Ashiwake, H.; Kubota, T.; Seto, S.; Aonashi, K.; Okamoto, K. The gsmap precipitation retrieval algorithm for microwave sounders-part i: Over-ocean algorithm. IEEE Trans. Geosci. Remote Sens. 2009, 47, 3084–3097. [Google Scholar] [CrossRef]
  60. Seto, S.; Takahashi, N.; Iguchi, T. Rain/no-rain classification methods for microwave radiometer observations over land using statistical information for brightness temperatures under no-rain conditions. J. Appl. Meteorol. 2005, 44, 1243–1259. [Google Scholar] [CrossRef]
  61. Takahashi, N.; Awaka, J. Introduction of a melting layer model to a rain retrieval algorithm for microwave radiometers. In Proceedings of the 2005 IEEE International Geoscience and Remote Sensing Symposium, IGARSS ’05, Seoul, Korea, 25–29 July 2005; pp. 3404–3409.
  62. Xie, P.P.; Yatagai, A.; Chen, M.Y.; Hayasaka, T.; Fukushima, Y.; Liu, C.M.; Yang, S. A gauge-based analysis of daily precipitation over east asia. J. Hydrometeorol. 2007, 8, 607–626. [Google Scholar] [CrossRef]
  63. Huffman, G.J.; Bolvin, D.T.; Braithwaite, D.; Hsu, K.; Joyce, R.; Xie, P. Integrated Multi-Satellite Retrievals for GPM (IMERG) Technical Documentation. Available online: http://pmm.nasa.gov/sites/default/files/document_files/IMERG_ATBD_V4.4.pdf (accessed on 4 February 2015).
  64. Ashouri, H.; Hsu, K.-L.; Sorooshian, S.; Braithwaite, D.K.; Knapp, K.R.; Cecil, L.D.; Nelson, B.R.; Prat, O.P. Persiann-cdr: Daily precipitation climate data record from multisatellite observations for hydrological and climate studies. Bull. Am. Meteorol. Soc. 2015, 96, 69–83. [Google Scholar] [CrossRef]
  65. Xie, P.; Yoo, S.-H.; Joyce, R.; Yarosh, Y. Bias-Corrected Cmorph: A 13-Year Analysis of High-Resolution Global Precipitation. Available online: http://ftp.cpc.ncep.noaa.gov/precip/CMORPH_V1.0/REF/EGU_1104_Xie_bias-CMORPH.pdf (accessed on 28 October 2014).
  66. Chen, M.Y.; Shi, W.; Xie, P.P.; Silva, V.B.S.; Kousky, V.E.; Higgins, R.W.; Janowiak, J.E. Assessing objective techniques for gauge-based analyses of global daily precipitation. J. Geophys. Res. 2008, 113, D04110. [Google Scholar] [CrossRef]
  67. Shen, Y.; Feng, M.; Zhang, H.; Gao, F. Interpolation methods of china daily precipitation data. J. Appl. Meteorol. Sci. 2010, 21, 279–286. [Google Scholar]
  68. China Meteorological Data Sharing Service System. Available online: http://cdc.nmic.cn/sksj.do?method=ssrjscp (accessed on 10 January 2015).
  69. Xie, P.P. Personal Communication; NOAA Federal: Washington, DC, USA, 2014. [Google Scholar]
  70. Chen, S.; Hong, Y.; Cao, Q.; Kirstetter, P.-E.; Gourley, J.J.; Qi, Y.; Zhang, J.; Howard, K.; Hu, J.; Wang, J. Performance evaluation of radar and satellite rainfalls for typhoon morakot over taiwan: Are remote-sensing products ready for gauge denial scenario of extreme events? J. Hydrol. 2013, 506, 4–13. [Google Scholar] [CrossRef]
  71. Taylor, K.E. Summarizing multiple aspects of model performance in a single diagram. J. Geophys. Res. 2001, 106, 7183–7192. [Google Scholar] [CrossRef]
  72. Story, G.J.; Forecaster, H.; Center, W.G.R.F. Determining WSR-88D Precipitation Algorithm Performance Using the Stage III Precipitation Processing System; West Gulf River Forecast Center: Fort Worth, TX, USA, 2001. [Google Scholar]
  73. Surussavadee, C.; Staelin, D.H. Correcting microwave precipitation retrievals for near-surface evaporation. In Proceedings of the 2010 IEEE International Geoscience and Remote Sensing Symposium (IGARSS), Honolulu, HI, USA, 25–30 July 2010; pp. 1312–1315.
  74. Kamal-Heikman, S.; Derry, L.A.; Stedinger, J.R.; Duncan, C.C. A simple predictive tool for lower brahmaputra river basin monsoon flooding. Earth Interact. 2007, 11, 1–11. [Google Scholar] [CrossRef]
  75. Grody, N.C.; Weng, F. Microwave emission and scattering from deserts: Theory compared with satellite measurements. IEEE Trans. Geosci. Remote Sens. 2008, 46, 361–375. [Google Scholar] [CrossRef]
  76. Tian, Y.; Peters-Lidard, C.D.; Choudhury, B.J.; Garcia, M. Multitemporal analysis of trmm-based satellite precipitation products for land data assimilation applications. J. Hydrometeorol. 2007, 8, 1165–1183. [Google Scholar] [CrossRef]
  77. Fu, Y.F.; Liu, G.S. Possible misidentification of rain type by trmm pr over tibetan plateau. J. Appl. Meteorol. Climatol. 2007, 46, 667–672. [Google Scholar] [CrossRef]
  78. Liu, M.; Xu, X.; Sun, A.Y.; Wang, K.; Yue, Y.; Tong, X.; Liu, W. Evaluation of high-resolution satellite rainfall products using rain gauge data over complex terrain in southwest china. Theor. Appl. Climatol. 2014, 1–17. [Google Scholar] [CrossRef]
  79. Negri, A.J.; Adler, R.F. An intercomparlson of three satellite infrared rainfall techniques over Japan and surrounding waters. J. Appl. Meteorol. 1993, 32, 357–373. [Google Scholar] [CrossRef]
  80. Tuttle, J.D.; Carbone, R.E.; Arkin, P.A. Comparison of ground-based radar and geosynchronous satellite climatologies of warm-season precipitation over the united states. J. Appl. Meteorol. Climatol. 2008, 47, 3264–3270. [Google Scholar] [CrossRef]
  81. Ferraro, R.R.; Smith, E.A.; Berg, W.; Huffman, G.J. A screening methodology for passive microwave precipitation retrieval algorithms. J. Atmos. Sci. 1998, 55, 1583–1600. [Google Scholar] [CrossRef]
  82. Grody, N.C. Classification of snow cover and precipitation using the special sensor microwave imager. J. Geophys. Res. 1991, 96, 7423–7435. [Google Scholar] [CrossRef]
  83. Chen, S.; Hong, Y.; Cao, Q.; Tian, Y.D.; Hu, J.J.; Zhang, X.H.; Li, W.Y.; Carr, N.; Shen, X.Y.; Qiao, L. Intercomparison of precipitation estimates from wsr-88d radar and trmm measurement over continental united states. IEEE Trans. Geosci. Remote Sens. 2015, 53, 4444–4456. [Google Scholar] [CrossRef]
  84. Kidd, C.; Bauer, P.; Turk, J.; Huffman, G.J.; Joyce, R.; Hsu, K.L.; Braithwaite, D. Intercomparison of high-resolution precipitation products over northwest europe. J. Hydrometeorol. 2012, 13, 67–83. [Google Scholar] [CrossRef]
  85. Sohn, B.J.; Han, H.-J.; Seo, E.-K. Validation of satellite-based high-resolution rainfall products over the korean peninsula using data from a dense rain gauge network. J. Appl. Meteorol. Climatol. 2010, 49, 701–714. [Google Scholar] [CrossRef]
  86. Tesfagiorgis, K.; Mahani, S.E.; Khanbilvardi, R. Bias correction of satellite rainfall estimation using a radar-gauge product. Hydrol. Earth Syst. Sci. 2010, 7, 8913–8945. [Google Scholar] [CrossRef]
  87. Andermann, C.; Longuevergne, L.; Bonnet, S.; Crave, A.; Davy, P.; Gloaguen, R. Impact of transient groundwater storage on the discharge of himalayan rivers. Nat. Geosci. 2012, 5, 127–132. [Google Scholar] [CrossRef] [Green Version]
  88. Shige, S.; Kida, S.; Ashiwake, H.; Kubota, T.; Aonashi, K. Improvement of tmi rain retrievals in mountainous areas. J. Appl. Meteorol. Climatol. 2013, 52, 242–254. [Google Scholar] [CrossRef]

