
Characteristics of PM10 Chemical Source Profiles for Geological Dust from the South-West Region of China


Abstract
:1. Introduction
2. Methods
3. Results and Discussion
3.1. Features of Chemical Composition
3.1.1. Similarities and Differences
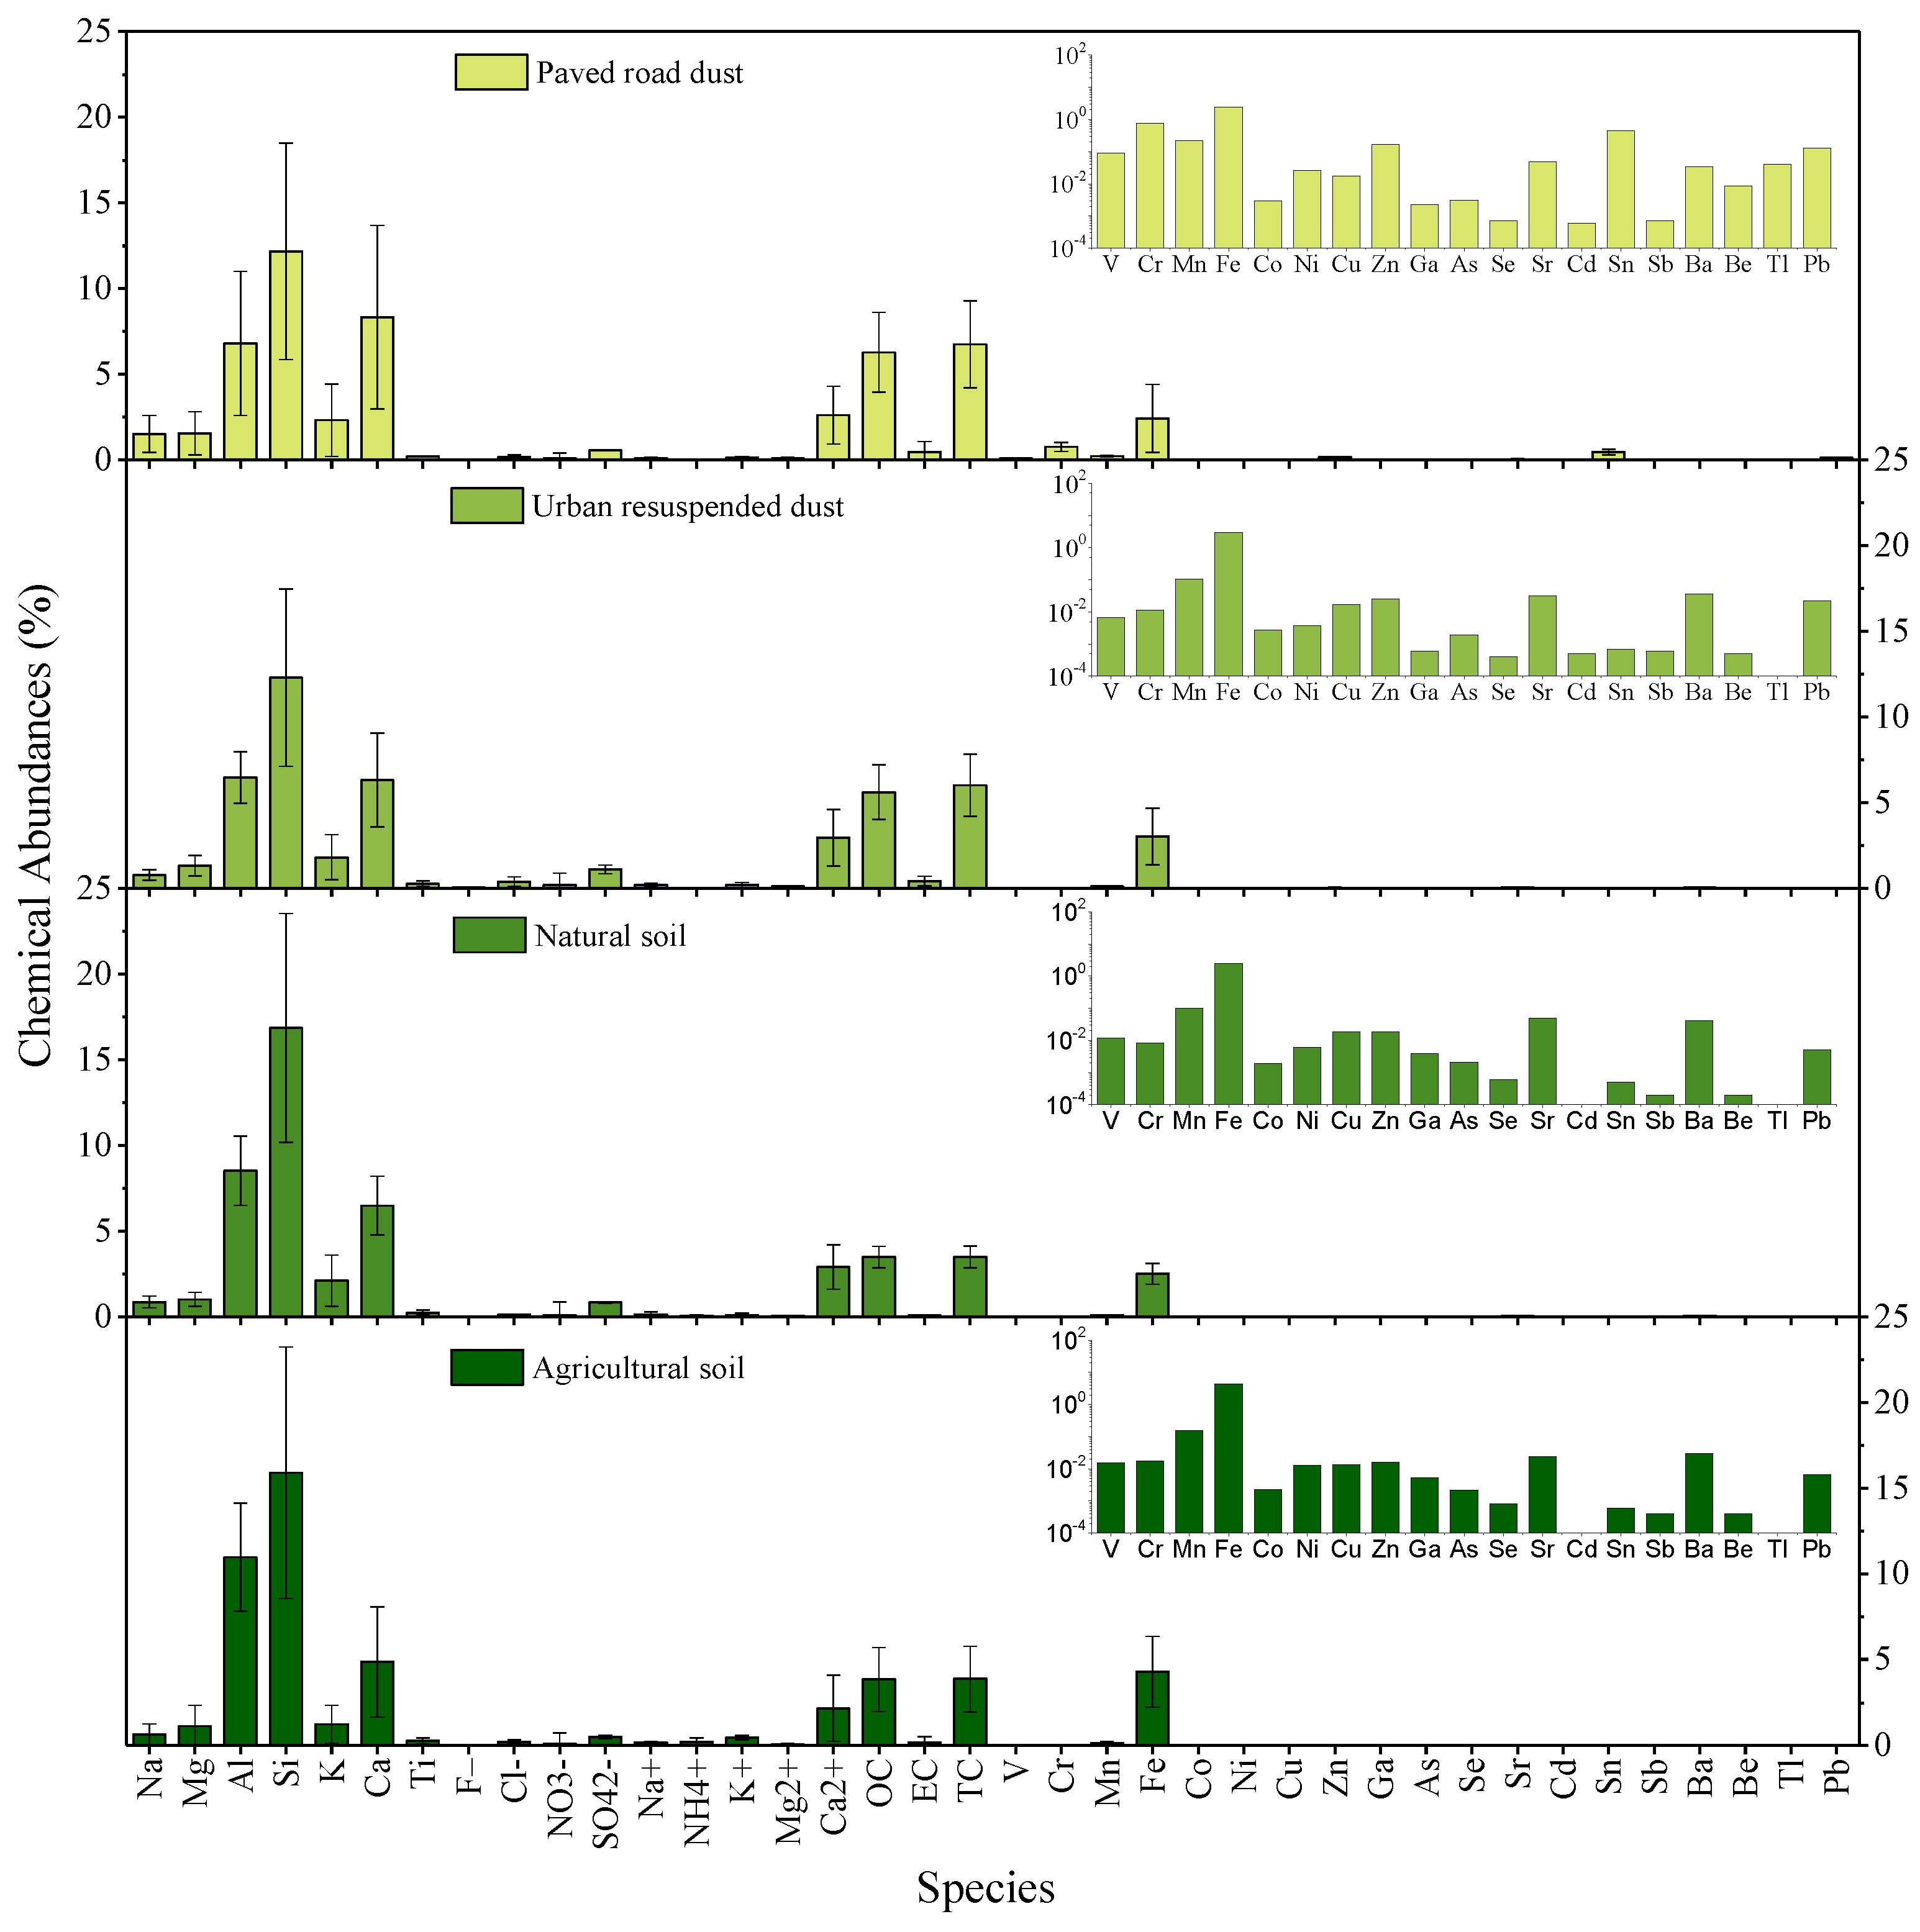
3.1.2. Chemical Abundances
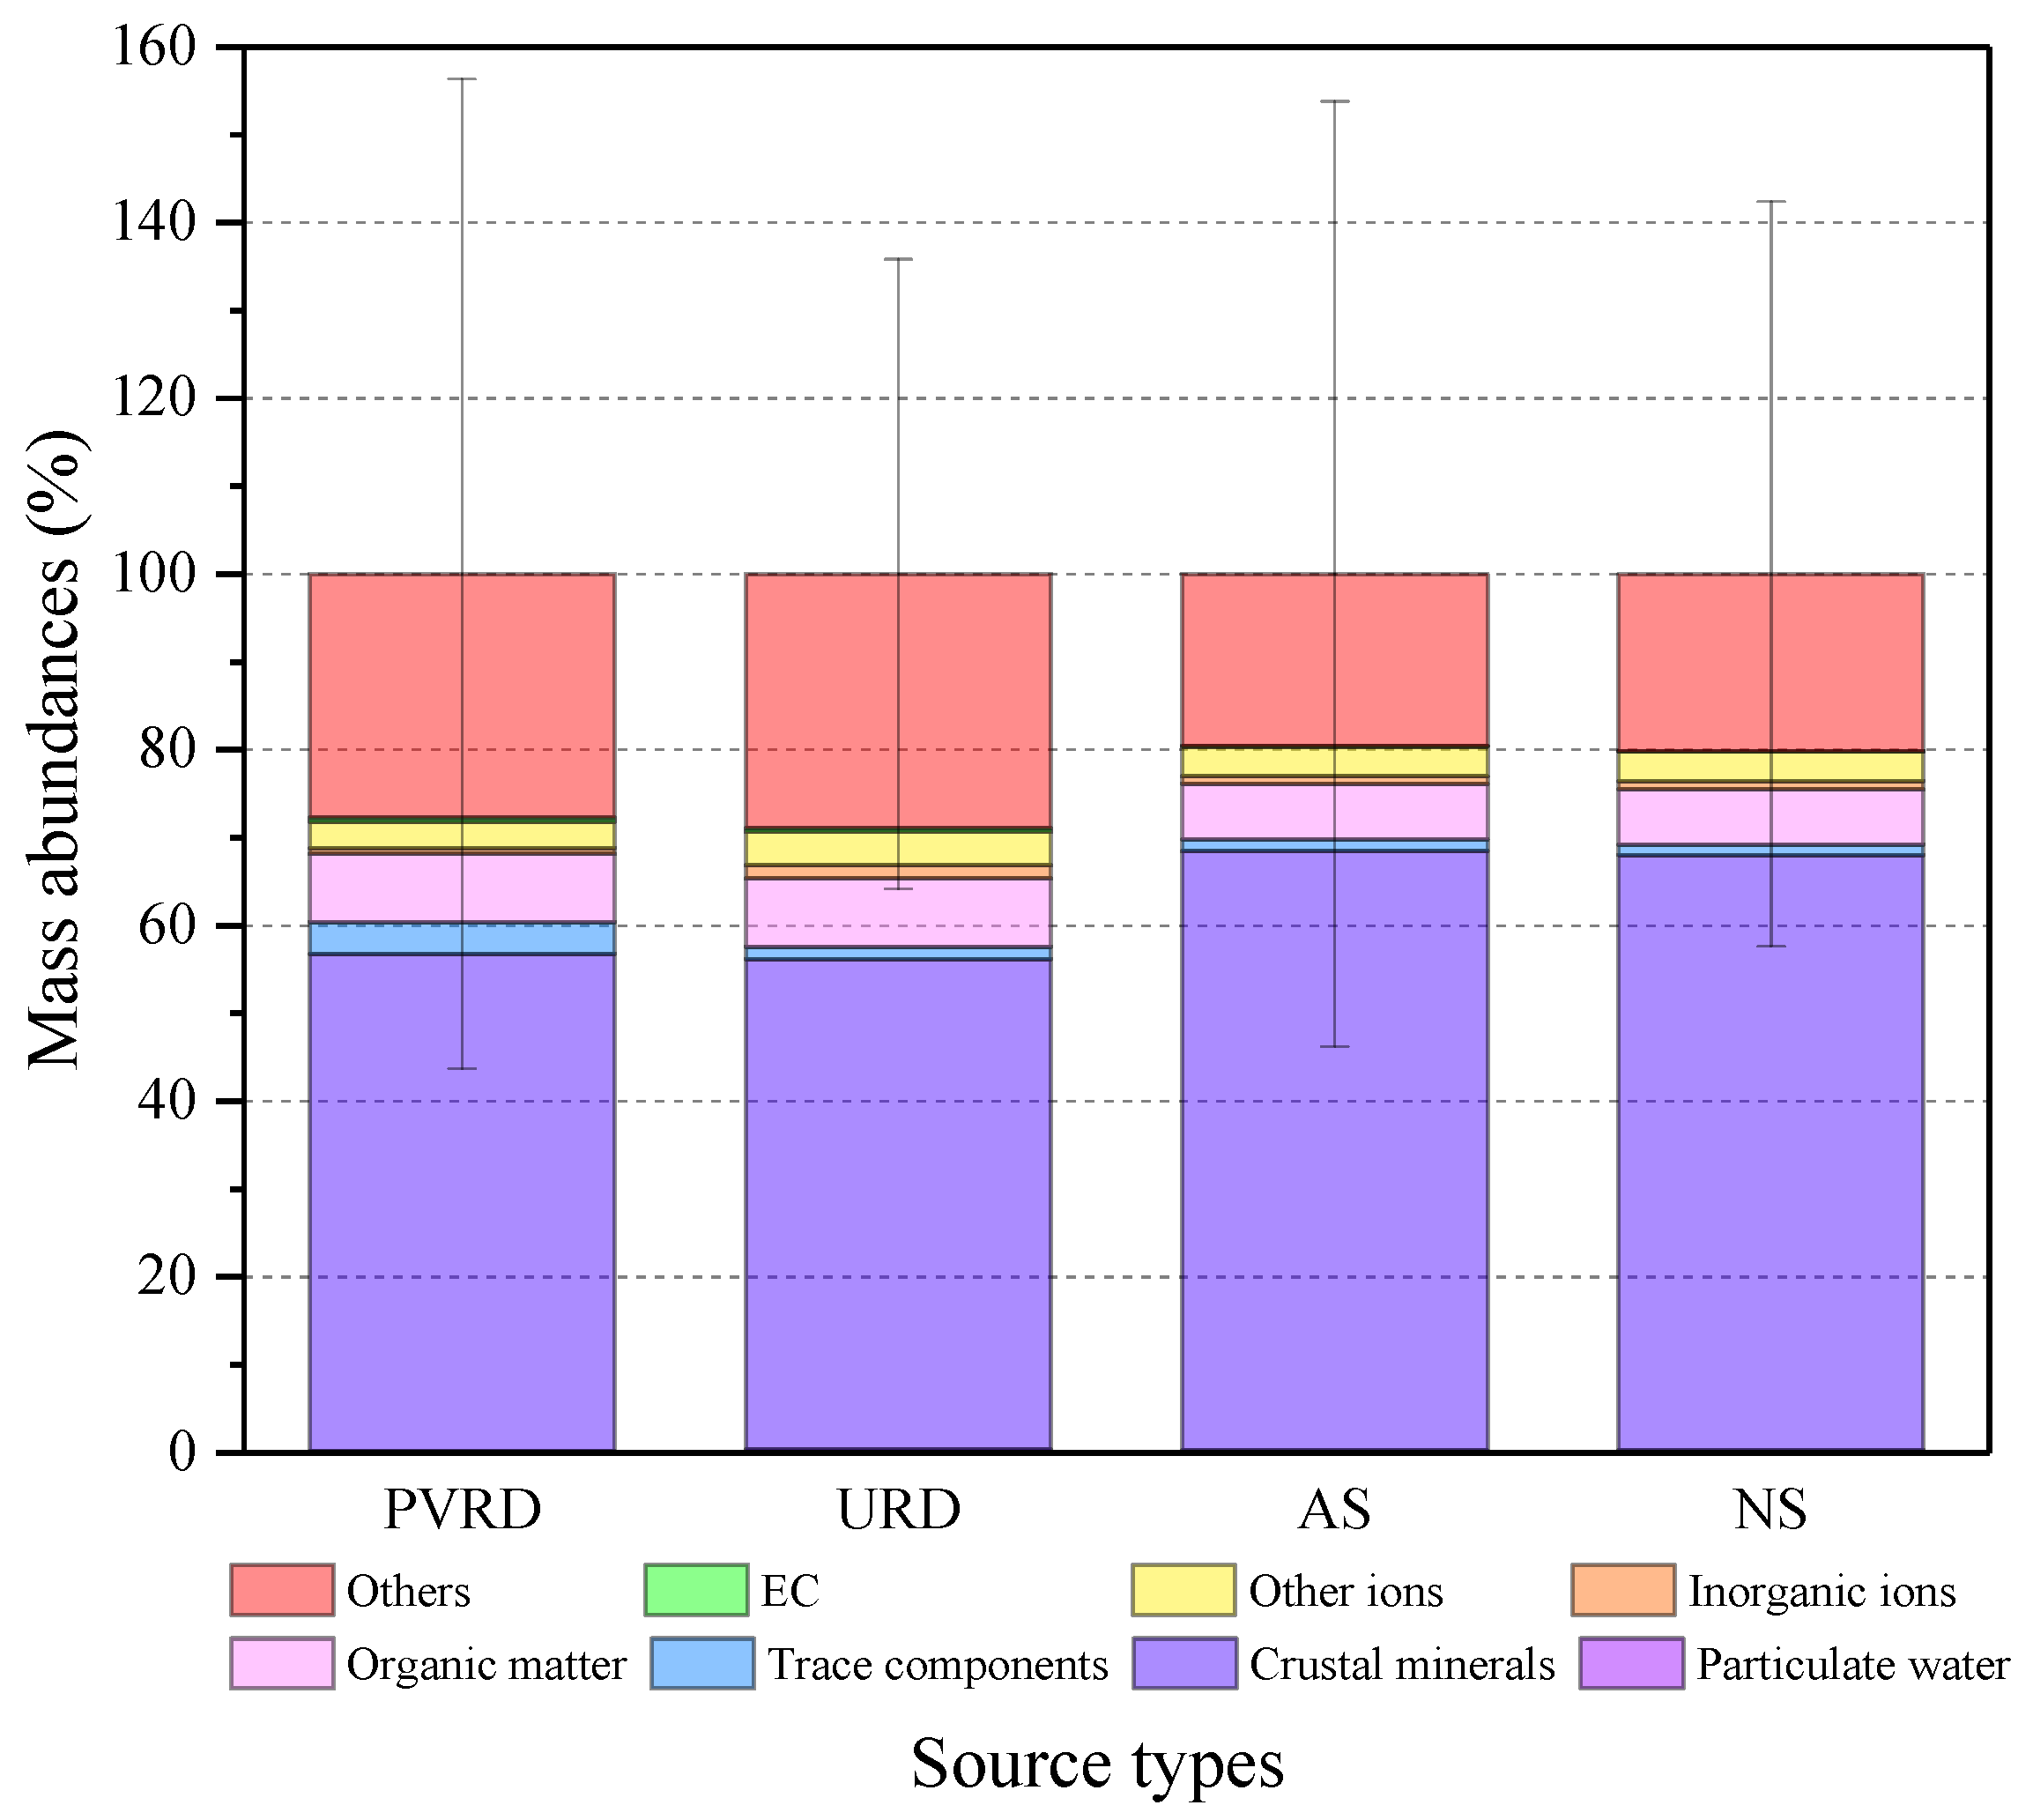
3.2. Contributions of the Major Components
- (1)
- Particulate water on PM was associated with hygroscopic species such as nitrates, sulfates and some organic species [36]. Murillo et al. [37] calculated particulate water associated with PM2.5 from Salamanca by multiplying 0.32 to the sum of NH4+ and SO42−, whereas Frank [38] used the value of 0.24. The ratio of 0.28 was used in this study, which is the median of the values from two researches.
- (2)
- Crustal minerals were expressed as 1.89Al + 2.14 Si + 1.4Ca + 1.2K + 1.43Fe + 1.67Ti, assuming the common oxide forms of Al2O3, SiO2, CaO, K2O, Fe2O3 and TiO2 [39,40]. The IMPROVE recommended soil formula expressed minerals as the sum of the oxides of Al, Si, Ca, Ti and Fe, and other unmeasured compounds were compensated by multiply a factor of 1.16. However, the factor of 1.16 was thought to overestimate crustal fraction [41]. Thus, the first formula was used in our research.
- (3)
- Trace components were determined as sum of trace elements (All elements except for Al, Si, Ca, K, Fe and Ti) and their oxides such as Na2O, CuO, PbO2 and so on. The oxides were calculated by multiplying trace element abundances by corresponding ratios. Each ratio of the element was obtained from research of Reff et al. [42].
- (4)
- Organic matter (OM) was calculated by multiplying OC abundance by ratio of OM/OC. Chow et al. [41] found that multipliers varied from 1.2 to 2.6 depending on the extent of OM oxidation and secondary organic aerosol formation. In this study, the values of 1.4 and 1.8 were applied for urban and non-urban sites, respectively.
- (5)
- SO42−, NO3− and NH4+ are summed without weighting factors for inorganic ions [43].
- (6)
- The other ions include Na+, Mg2+, Ca2+, K+, F− and Cl−.
- (7)
- Others, the remaining mass of PM, may be attributed to unknown sources, measurement errors and improper multipliers.
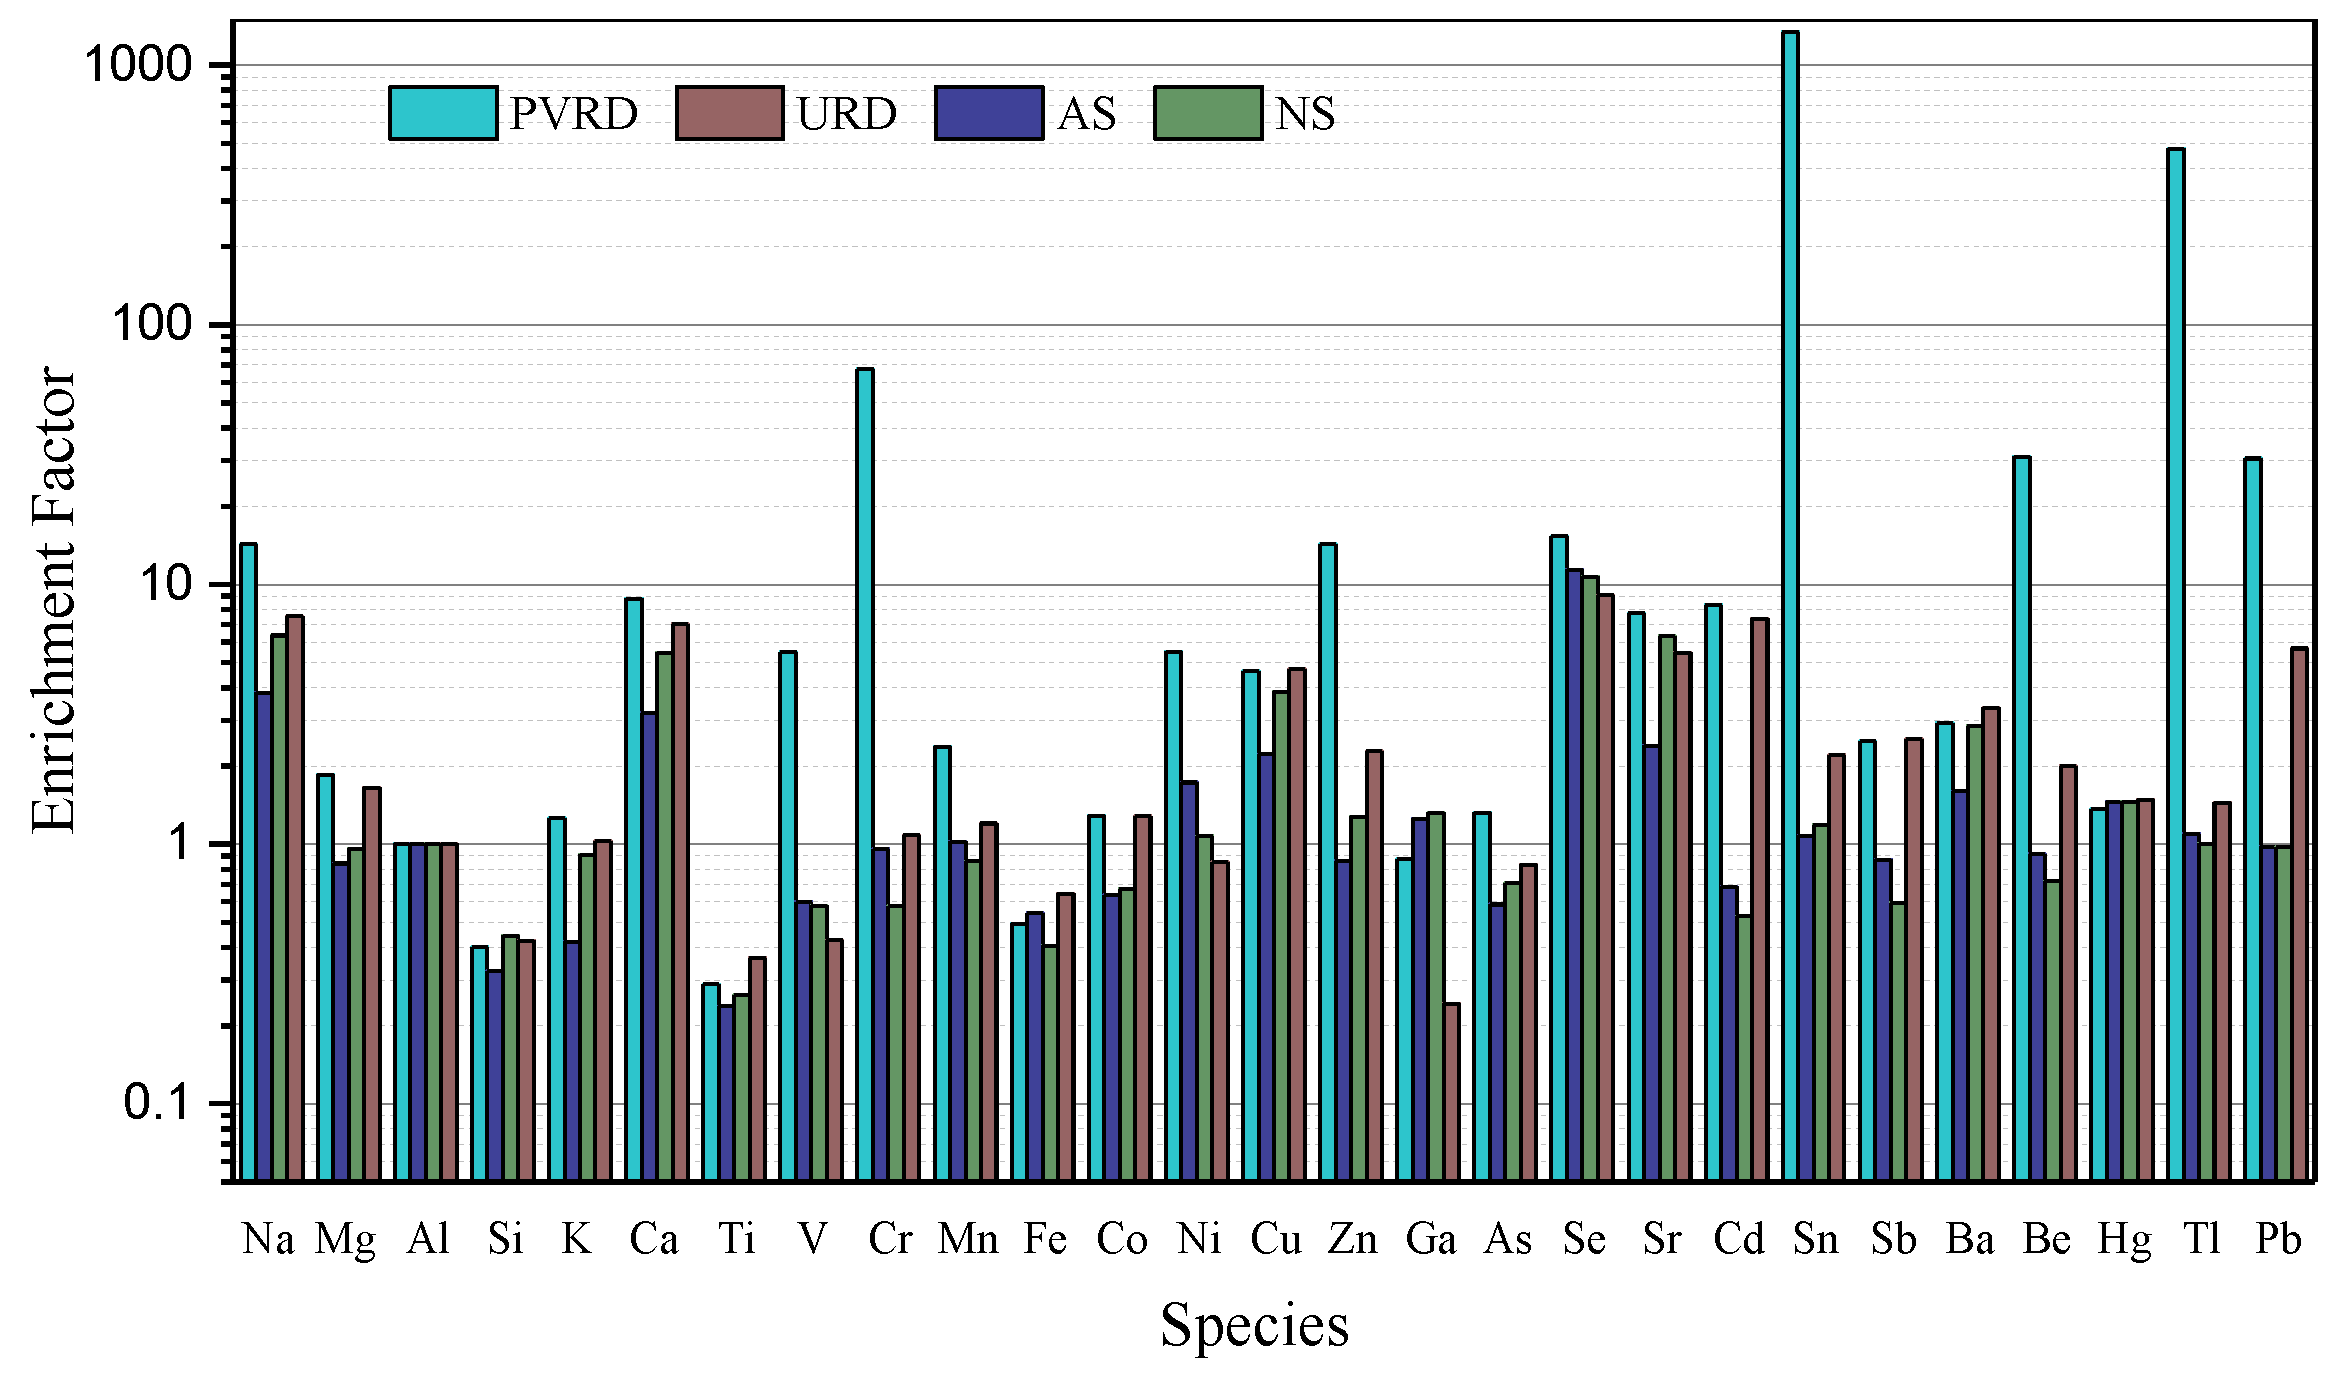
3.3. Enrichment Factor
4. Comparison of Chemical Composition with Other Regions
5. Conclusions
Supplementary Materials
Acknowledgments
Author Contributions
Conflicts of Interest
References
- Huang, R.J.; Zhang, Y.; Bozzetti, C.; Ho, K.F.; Cao, J.J.; Han, Y.; Daellenbach, K.R.; Slowik, J.G.; Platt, S.M.; Canonaco, F. High secondary aerosol contribution to particulate pollution during haze events in China. Nature 2014, 514, 218–222. [Google Scholar] [CrossRef] [PubMed]
- Liu, B.; Song, N.; Dai, Q.; Mei, R.; Sui, B.; Bi, X.; Feng, Y. Chemical composition and source apportionment of ambient PM2.5 during the non-heating period in Taian, China. Atmos. Res. 2015, 170, 23–33. [Google Scholar] [CrossRef]
- Tao, J.; Zhang, L.; Ho, K.; Zhang, R.; Lin, Z.; Zhang, Z.; Lin, M.; Cao, J.; Liu, S.; Wang, G. Impact of PM2.5 chemical compositions on aerosol light scattering in Guangzhou—The largest megacity in South China. Atmos. Res. 2014, 135–136, 48–58. [Google Scholar] [CrossRef]
- Chan, C.K.; Yao, X. Air pollution in mega cities in China. Atmos. Environ. 2008, 42, 1–42. [Google Scholar] [CrossRef]
- Zhang, Q.; He, K.; Huo, H. Policy: Cleaning China’s air. Nature 2012, 484, 161–162. [Google Scholar] [PubMed]
- Chinese State Council. Atmospheric Pollution Prevention and Control Action Plan. Available online: http://www.gov.cn/zwgk/2013-09/12/content_2486773.htm (accessed on 16 November 2016). (In Chinese)
- Cao, J.; Xu, H.; Xu, Q.; Chen, B.; Kan, H. Fine particulate matter constituents and cardiopulmonary mortality in a heavily polluted Chinese city. Environ. Health Perspect. 2012, 120, 373–378. [Google Scholar] [CrossRef] [PubMed]
- Cao, J.J.; Shen, Z.X.; Chow, J.C.; Watson, J.G.; Lee, S.C.; Tie, X.X.; Ho, K.F.; Wang, G.H.; Han, Y.M. Winter and summer PM2.5 chemical compositions in fourteen Chinese cities. J. Air Waste Manag. 2012, 62, 1214–1226. [Google Scholar] [CrossRef]
- Chow, J.C.; Watson, J.G.; Ashbaugh, L.L.; Magliano, K.L. Similarities and differences in PM10 chemical source profiles for geological dust from the San Joaquin Valley, California. Atmos. Environ. 2003, 37, 1317–1340. [Google Scholar] [CrossRef]
- Pant, P.; Baker, S.J.; Shukla, A.; Maikawa, C.; Pollitt, K.J.G.; Harrison, R.M. The PM10 fraction of road dust in the UK and India: Characterization, source profiles and oxidative potential. Sci. Total Environ. 2015, 530–531, 445–452. [Google Scholar] [CrossRef] [PubMed]
- Alam, K. Particulate matter and its source apportionment in Peshawar, Northern Pakistan. Aerosol Air Qual. Res. 2015, 15, 634–647. [Google Scholar] [CrossRef]
- Pernigotti, D.; Belis, C.A.; Spanò, L. SPECIEUROPE: The European data base for PM source profiles. Atmos. Pollut. Res. 2016, 7, 307–314. [Google Scholar] [CrossRef]
- Simon, H.; Bhave, P.V.; Swall, J.L.; Frank, N.H.; Malm, W.C. Determining the spatial and seasonal variability in OM/OC ratios across the US using multiple regression. Atmos. Chem. Phys. 2010, 11, 2933–2949. [Google Scholar] [CrossRef] [Green Version]
- Shen, Z.; Jian, S.; Cao, J.; Zhang, L.; Qian, Z.; Lei, Y.; Gao, J.; Huang, R.J.; Liu, S.; Yu, H. Chemical profiles of urban fugitive dust PM2.5 samples in Northern Chinese cities. Sci. Total Environ. 2016, 569–570, 619–626. [Google Scholar] [CrossRef] [PubMed]
- Upadhyay, N. Size-differentiated chemical composition of re-Suspended soil dust from the desert southwest United States. Aerosol Air Qual. Res. 2015, 15, 387–398. [Google Scholar] [CrossRef]
- Matawle, J.L. Characterization of PM2.5 source profiles for traffic and dust sources in Raipur, India. Aerosol Air Qual. Res. 2015, 15, 2537–2548. [Google Scholar] [CrossRef]
- Wang, X.; Chow, J.C.; Kohl, S.D.; Percy, K.E.; Legge, A.H.; Watson, J.G. Characterization of PM2.5 and PM10 fugitive dust source profiles in the Athabasca oil sands region. J. Air Waste Manag. 2015, 65, 1421–1433. [Google Scholar] [CrossRef] [PubMed]
- Han, J. Chemical caracterizations of PM10 profiles for major emission sources in Xining, northwestern China. Aerosol Air Qual. Res. 2014, 14, 1017–1027. [Google Scholar]
- Kong, S. Similarities and differences in PM2.5, PM10 and TSP chemical profiles of fugitive dust sources in a coastal oilfield city in China. Aerosol Air Qual. Res. 2014, 14, 2017–2028. [Google Scholar] [CrossRef]
- Kong, S.; Ji, Y.; Lu, B.; Chen, L.; Han, B.; Li, Z.; Bai, Z. Characterization of PM10 source profiles for fugitive dust in Fushun—A city famous for coal. Atmos. Environ. 2011, 45, 5351–5365. [Google Scholar] [CrossRef]
- Ho, K.F.; Lee, S.C.; Chow, J.C.; Watson, J.G. Characterization of PM10 and PM2.5 source profiles for fugitive dust in Hong Kong. Atmos. Environ. 2003, 37, 1023–1032. [Google Scholar] [CrossRef]
- Bhaskar, V.S.; Sharma, M. Assessment of fugitive road dust emissions in Kanpur, India: A note. Transp. Res. Part D Transp. Environ. 2008, 13, 400–403. [Google Scholar] [CrossRef]
- Cao, J.J.; Chow, J.C.; Watson, J.G.; Wu, F.; Han, Y.M.; Jin, Z.D.; Shen, Z.X.; An, Z.S. Size-differentiated source profiles for fugitive dust in the Chinese Loess Plateau. Atmos. Environ. 2008, 42, 2261–2275. [Google Scholar] [CrossRef]
- Zhang, Q.; Shen, Z.; Cao, J.; Ho, K.F.; Zhang, R.; Bie, Z.; Chang, H.; Liu, S. Chemical profiles of urban fugitive dust over Xi’an in the south margin of the Loess Plateau, China. Atmos. Pollut. Res. 2014, 5, 421–430. [Google Scholar] [CrossRef]
- Zhang, X.Y.; Wang, Y.Q.; Zhang, X.C.; Guo, W.; Niu, T.; Gong, S.L.; Yin, Y.; Zhao, P.; Jin, J.L.; Yu, M. Aerosol monitoring at multiple locations in China: Contributions of EC and dust to aerosol light absorption. Tellus Ser. B Chem. Phys. Meteorol. 2008, 60, 647–656. [Google Scholar] [CrossRef]
- Fang, M.; Chan, C.K.; Yao, X. Managing air quality in a rapidly developing nation: China. Atmos. Environ. 2009, 43, 79–86. [Google Scholar] [CrossRef]
- Zhao, Q.; He, K.; Rahn, K.A.; Ma, Y. Dust storms come to central and southwestern China, too: Implications from a major dust event in Chongqing. Atmos. Chem. Phys. 2010, 10, 139–146. [Google Scholar] [CrossRef]
- Li, R. Multi-satellite observation of an intense dust event over southwestern China. Aerosol Air Qual. Res. 2015, 15, 263–270. [Google Scholar] [CrossRef]
- Ren, L.; Zhou, Z.; Zhao, X.; Wen, Y.; Yin, B.; Bai, Z.; Ji, Y. Source apportionment of PM2.5 and PM10 in urban areas of Chongqing. Res. Environ. Sci. 2014, 27, 1387–1394. [Google Scholar]
- Cheng, Y.; Lee, S.; Gu, Z.; Ho, K.; Zhang, Y.; Huang, Y.; Chow, J.C.; Watson, J.G.; Cao, J.; Zhang, R. PM2.5 and PM10–2.5 chemical composition and source apportionment near a Hong Kong roadway. Particuology 2015, 18, 96–104. [Google Scholar] [CrossRef]
- Wu, B.; Shen, X.; Cao, X.; Yao, Z.; Wu, Y. Characterization of the chemical composition of PM2.5 emitted from on-road China III and China IV diesel trucks in Beijing, China. Sci. Total Environ. 2016, 551–552, 579–589. [Google Scholar] [CrossRef] [PubMed]
- Watson, J.G.; Chow, J.C.; Houck, J.E. PM2.5 chemical source profiles for vehicle exhaust, vegetative burning, geological material, and coal burning in Northwestern Colorado during 1995. Chemosphere 2001, 43, 1141–1151. [Google Scholar] [CrossRef]
- Zhao, P.; Feng, Y.; Zhu, T.; Wu, J. Characterizations of resuspended dust in six cities of North China. Atmos. Environ. 2006, 40, 5807–5814. [Google Scholar] [CrossRef]
- Gupta, A.K.; Karar, K.; Srivastava, A. Chemical mass balance source apportionment of PM10 and TSP in residential and industrial sites of an urban region of Kolkata, India. J. Hazard. Mater. 2007, 142, 279–287. [Google Scholar] [CrossRef] [PubMed]
- Kang, D.; Pang, S. The leaching pattern of aluminium from soils collected from southwestern China by acid rain. Acta Sci. Circumst. 1987, 2, 013. [Google Scholar]
- Malm, W.C.; Schichtel, B.A.; Pitchford, M.L. Uncertainties in PM2.5 gravimetric and speciation measurements and what we can learn from them. J. Air Waste Manag. 2011, 61, 1131–1149. [Google Scholar]
- Murillo, J.H.; Ramos, A.C.; García, F.Á.; Jiménez, S.B.; Cárdenas, B.; Mizohata, A. Chemical composition of PM2.5 particles in Salamanca, Guanajuato Mexico: Source apportionment with receptor models. Atmos. Res. 2012, 107, 31–41. [Google Scholar] [CrossRef]
- Frank, N.H. Retained nitrate, hydrated sulfates, and carbonaceous mass in federal reference method fine particulate matter for six eastern U.S. cities. J. Air Waste Manag. Assoc. 2006, 56, 500–511. [Google Scholar] [CrossRef] [PubMed]
- Macias, E.S.; Zwicker, J.O.; Ouimette, J.R.; Hering, S.V.; Friedlander, S.K.; Cahill, T.A.; Kuhlmey, G.A.; Richards, L.W. Regional haze case studies in the southwestern U.S—I. Aerosol chemical composition. Atmos. Environ. 1981, 15, 1971–1986. [Google Scholar] [CrossRef]
- Ni, T. Spatial and temporal variation of chemical composition and mass closure of ambient PM10 in Tianjin, China. Aerosol Air Qual. Res. 2013, 13, 1832–1846. [Google Scholar] [CrossRef]
- Chow, J.C.; Lowenthal, D.H.; Chen, L.W.A.; Wang, X.; Watson, J.G. Mass reconstruction methods for PM2.5: A review. Air Qual. Atmos. Health 2015, 8, 243–263. [Google Scholar] [CrossRef] [PubMed]
- Reff, A.; Bhave, P.V.; Simon, H.; Pace, T.G.; Pouliot, G.A.; Mobley, J.D.; Houyoux, M. Emissions inventory of PM2.5 trace elements across the United States. Environ. Sci. Technol. 2009, 43, 5790–5796. [Google Scholar] [CrossRef] [PubMed]
- Chow, J.C.; Watson, J.G.; Fujita, E.M.; Lu, Z.; Lawson, D.R.; Ashbaugh, L.L. Temporal and spatial variations of PM2.5 and PM10 aerosol in the Southern California air quality study. Atmos. Environ. 1994, 28, 2061–2080. [Google Scholar] [CrossRef]
- Protection, M.O.E.; Centre, N.E.M. Background Values of Soil Elements in China; China Environmental Science Press: Beijing, China, 1990. [Google Scholar]
- Zhang, N.; Cao, J.; Liu, S.; Zhao, Z.Z.; Xu, H.; Xiao, S. Chemical composition and sources of PM2.5 and TSP collected at Qinghai Lake during summertime. Atmos. Res. 2014, 138, 213–222. [Google Scholar] [CrossRef]
- Birmili, W.; Allen, A.G.; Bary, F.; Harrison, R.M. Trace metal concentrations and water solubility in size-fractionated atmospheric particles and influence of road traffic. Environ. Sci. Technol. 2006, 40, 1144–1153. [Google Scholar] [CrossRef] [PubMed]
- Chen, J.; Wang, W.; Liu, H.; Ren, L. Determination of road dust loadings and chemical characteristics using resuspension. Environ. Monit. Assess. 2012, 184, 1693–1709. [Google Scholar] [CrossRef] [PubMed]
- Xu, H.M.; Cao, J.J.; Ho, K.F.; Ding, H.; Han, Y.M.; Wang, G.H.; Chow, J.C.; Watson, J.G.; Khol, S.D.; Qiang, J.; et al. Lead concentrations in fine particulate matter after the phasing out of leaded gasoline in Xi’an, China. Atmos. Environ. 2012, 46, 217–224. [Google Scholar] [CrossRef]
- Han, B.; Bai, Z.; Ji, H.; Guo, G.; Wang, F.; Shi, G.; Li, X. Chemical characterizations of PM10 fraction of paved road dust in Anshan, China. Transp. Res. Part D Transp. Environ. 2009, 14, 599–603. [Google Scholar] [CrossRef]
- Chow, J.C.; Watson, J.G.; Lowenthal, D.H.; Countess, R.J. Sources and chemistry of PM10 aerosol in Santa Barbara County, CA. Atmos. Environ. 1996, 30, 1489–1499. [Google Scholar] [CrossRef]
- Watson, J.G.; Chow, J.C.; Kohl, S.D.; Kuhns, H.D.; Robinson, N.F.; Frazier, C.A.; Etyemezian, V. Annual Report for the Robbins Particulate Study: October 1996 through September 1997; Report No. 7100.4F3; Desert Research Institute: Las Vegas, NV, USA, 1999. [Google Scholar]
- Vega, E.; Mugica, V.; Reyes, E.; Sánchez, G.; Chow, J.C. Chemical composition of fugitive dust emitters in Mexico City. Atmos. Environ. 2001, 35, 4033–4039. [Google Scholar] [CrossRef]
- Han, G.; Wu, Q.; Tang, Y. Acid rain and alkalization in southwestern China: Chemical and strontium isotope evidence in rainwater from Guiyang. J. Atmos. Chem. 2012, 68, 139–155. [Google Scholar] [CrossRef]
- Zhao, D.; Xiong, J.; Yu, X.; Chan, W.H. Acid rain in southwestern China. Atmos. Environ. 1988, 22, 349–358. [Google Scholar]
- Arimoto, R.; Zhan, X.Y.; Heubert, B.J. Chemical composition of atmospheric aerosols from Zhenbeitai, China, and Gosan, South Korea, during ACE-Asia. J. Geophys. Res. 2004, 109. [Google Scholar] [CrossRef]
- Zhang, R.; Cao, J.; Tang, Y.; Arimoto, R.; Shen, Z.; Wu, F.; Han, Y.; Wang, G.; Zhang, J.; Li, G. Elemental profiles and signatures of fugitive dusts from Chinese deserts. Sci. Total Environ. 2014, 472, 1121–1129. [Google Scholar] [CrossRef] [PubMed]


| Source Type | Source Subtype | Total Number of Samples | Number of Different Depths | |
|---|---|---|---|---|
| Surface | 20 cm Depth | |||
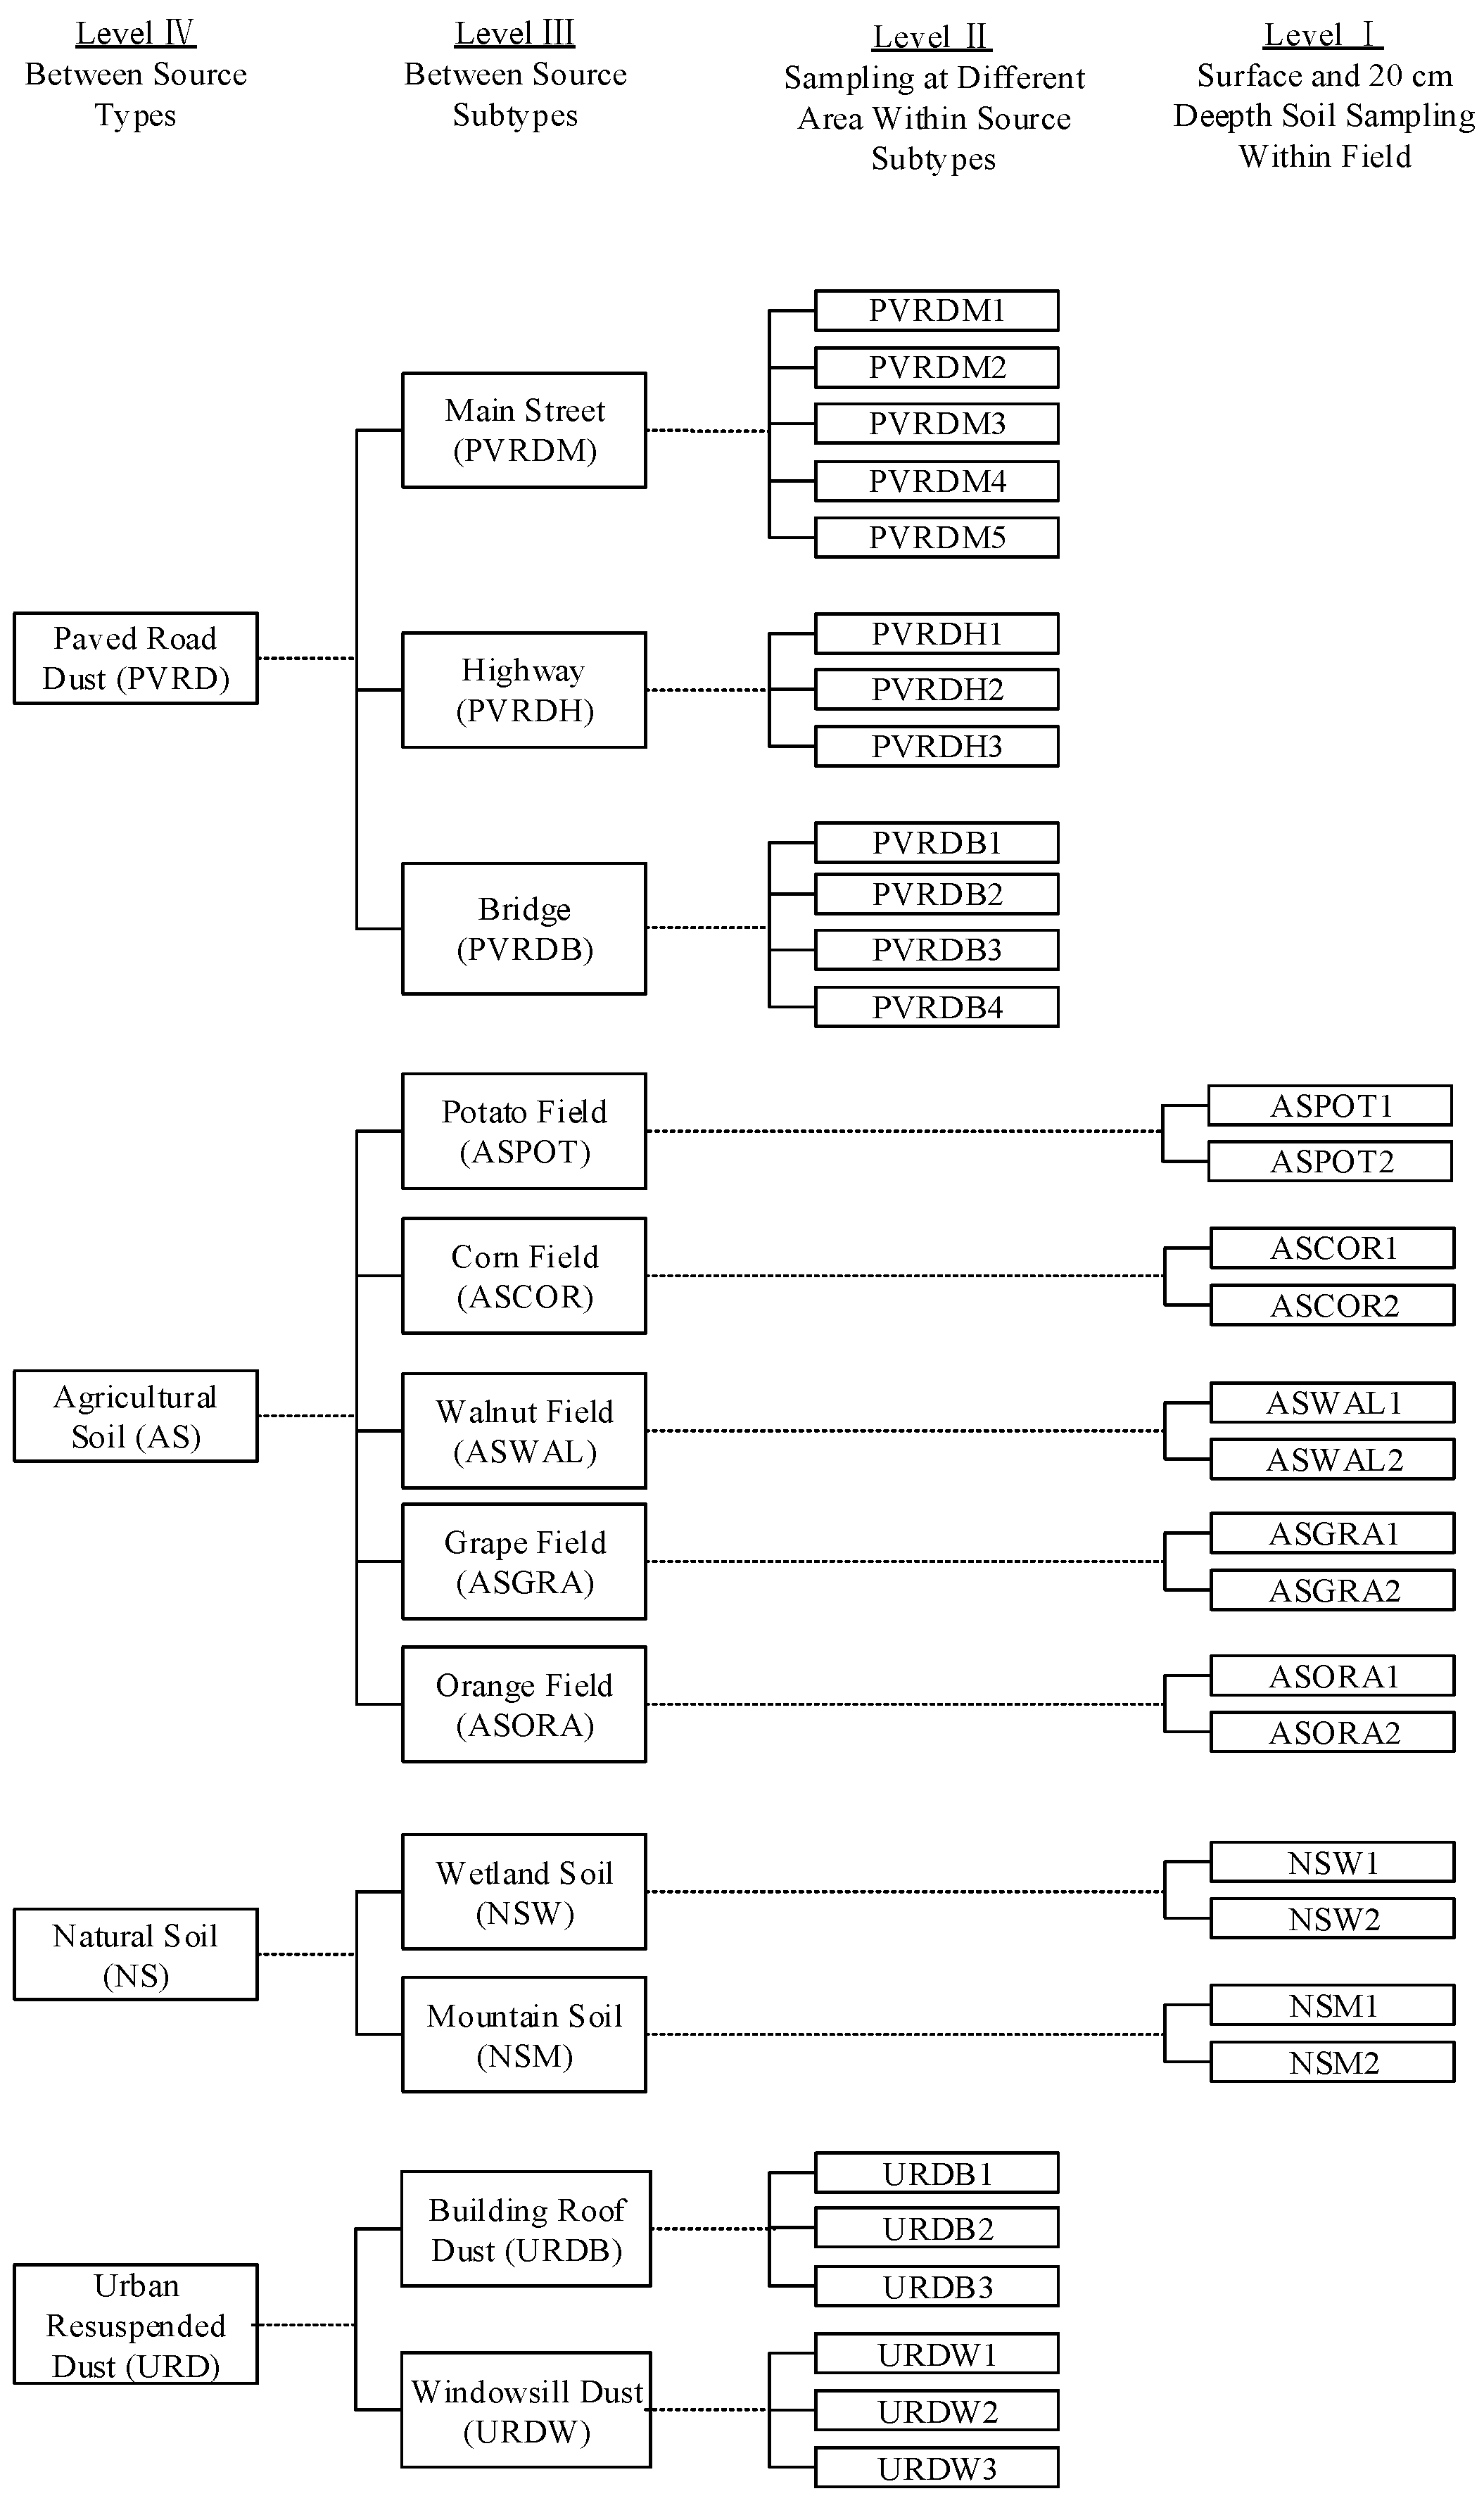
| Urban paved road | Urban main street | 5 | 5 | - |
| Highway road | 3 | 3 | - | |
| Bridge | 4 | 4 | - | |
| Agricultural soil | Potato field | 2 | 1 | 1 |
| Corn field | 2 | 1 | 1 | |
| Walnut field | 2 | 1 | 1 | |
| Grape | 2 | 1 | 1 | |
| Orange | 2 | 1 | 1 | |
| Natural soil | Wetland soil | 2 | 1 | 1 |
| Mountain soil | 2 | 1 | 1 | |
| Resuspended dust | roof of buildings | 3 | 3 | - |
| Window sills | 3 | 3 | - | |
| Total | 32 | 25 | 7 | |
© 2016 by the authors; licensee MDPI, Basel, Switzerland. This article is an open access article distributed under the terms and conditions of the Creative Commons Attribution (CC-BY) license (http://creativecommons.org/licenses/by/4.0/).
Share and Cite
Liu, Y.; Zhang, W.; Bai, Z.; Yang, W.; Zhao, X.; Han, B.; Wang, X. Characteristics of PM10 Chemical Source Profiles for Geological Dust from the South-West Region of China. Atmosphere 2016, 7, 146. https://doi.org/10.3390/atmos7110146
Liu Y, Zhang W, Bai Z, Yang W, Zhao X, Han B, Wang X. Characteristics of PM10 Chemical Source Profiles for Geological Dust from the South-West Region of China. Atmosphere. 2016; 7(11):146. https://doi.org/10.3390/atmos7110146
Chicago/Turabian StyleLiu, Yayong, Wenjie Zhang, Zhipeng Bai, Wen Yang, Xueyan Zhao, Bin Han, and Xinhua Wang. 2016. "Characteristics of PM10 Chemical Source Profiles for Geological Dust from the South-West Region of China" Atmosphere 7, no. 11: 146. https://doi.org/10.3390/atmos7110146