1. Introduction
Tourism, Recreation, and Leisure (TRL), a largely outdoor-oriented economic sector, can be particularly sensitive to weather and climate impacts [
1]. For example, at microscales weather can affect both visitor attendance decisions and how businesses forecast visitor demand. Expanded to macroscales, weather and climate factors can influence seasonal tourist arrivals, impacting the sustainability of regional economic activity [
2,
3,
4,
5,
6,
7,
8,
9,
10,
11]. An improved understanding of human response to various ambient environmental conditions can help the TRL sector better manage both short-term visitor demand and long-term climate change risk-adaptation planning [
12] by contributing to an improved understanding of the tourist-weather interface. This is further emphasized by Rutty and Scott [
13] who recently stated: “there remains an important need to improve current climate change assessments by both basing them on climate data that represent the localized conditions where such tourism activities take place and providing considerations for thermal-physiological comfort.” Before researchers can effectively understand how future climate change scenarios broadly impact tourist behavior, however, many researchers have suggested the importance of establishing present-day baselines for human behavioral response to varied weather conditions [
14,
15,
16,
17,
18].
This paper assesses the varied weather conditions that impact daily visitor attendance at two major Association of Zoos and Aquariums (AZA) accredited zoological parks—the Phoenix Zoo and Zoo Atlanta. Zoological parks and aquariums represent a major subsector of TRL contributing over $16 billion in economic activity to the United States in 2012, supporting $4.7 billion in salaries and wages, generating 142,000 jobs, and attracting 175 million visitors [
19]. While zoos and aquariums represent a significant subsector of TRL, few studies have examined in detail how weather conditions might affect zoo visitor attendance [
1]. In broad terms, Mason [
20] previously observed that, in spite of the importance of zoos as tourist attractions, they remain under-researched. Additionally, Davey [
21], in remarking how zoo attendance patterns are the result of many influencing factors, suggested the need for additional research.
In this paper, we examine how weather impacts daily zoo visitor attendance over a period of approximately one decade by comparing zoological parks in very different climate regimes. The Phoenix Zoo and Zoo Atlanta were chosen to illustrate how differing geographies may create diverse visitor responses resulting from differing regional climates and weather conditions. Specifically, the ambient thermal environment as measured by the Physiologically Equivalent Temperature, PET [
22], is used to assess how thermal conditions visitors physically sense might influence attendance decisions. Additionally, better understanding of how prevailing climates of an area may create different visitor attendance responses to the thermal environment could provide further insight into the broader processes of human acclimatization [
13].
2. Theoretical Background and Context
A growing body of literature assessing the impacts of weather on visitor attendance has emerged in recent years focusing especially on the outdoor sporting industry. Much of this research includes analysis of sports such as the National Football League (NFL) [
23], club cricket [
24], downhill skiing [
14,
25], soccer [
26], baseball [
27], Australian Rules Football [
28], and golf [
15,
18]. Additionally, outdoor nature-parks [
29,
30,
31] and beaches [
12,
32] are commonly analyzed when modeling weather-attendance interactions. Most of this research mentioned adopts a multivariate approach including non-atmospheric predictor variables such as the influence of holidays, day-of-week, month, season [
24], admission price, per-capita income, temporal activity patterns [
33] and the impact of facility capacity [
28] on visitor attendance. Unfortunately, due to the scope of this research, many questions are left unanswered which directly concern weather-attendance interactions in isolation.
Hynds and Smith [
24] addressed the expectation that weather and weather forecasts might partially influence attendance at outdoor cricket matches. Using a data set of 52 cricket matches from 1984 to 1992, the authors created a model to predict match attendance. Among other predictor variables, they included day-of-play weather variables such as hours of sunshine, rainfall amount, and temperature. Hynds and Smith [
24] (p. 105) observed that rain deterred attendance because the presence of rain created a reduction in demand resulting from both the “disutility of sitting in the rain and disrupted match play”. By contrast, other weather variables such as temperature and “variation in hours of sunshine”, were positively related to cricket match attendance, but did not contribute to substantive changes in attendance and were thereby less influential than rainfall.
Butler’s [
27] assessment of baseball attendance involved a central concern with how baseball visitor attendance was influenced by team matchups and scheduling. However, in order to provide a clearer idea of the actual impact on attendance, an analysis of weather variables as control factors was included in a larger regression model. Butler created pre-defined weather scenarios coded as “dummy variables” which included “cold” (less than 55 °F), “hot” (greater than 94 °F) and “bad weather” (weather described as overcast, drizzle, or rain). All weather variables were statistically significant and were inversely related to baseball attendance.
Welki and Zlatoper [
23] conducted a regression analysis to better understand variance in attendance at professional National Football League (NFL) games in the United States. In the regression analysis, the authors included three weather variables: (1) rain as a dummy variable to indicate if rain occurred on game day; (2) temperature as the high temperature on game day; and (3) an index variable combining temperature and rain with the goal of assessing the influence of temperature during rainy conditions. They found that while rain decreased game attendance, the impact of rain on attendance diminished as temperature increased leading to the conclusion that “warm rain” had a less adverse impact on attendance.
Over the period from 1981 to 1986, Borland and Lye [
28] reviewed factors impacting visitor attendance at 132 Australian Rules Football matches. Although weather was not the central focus of this study, they addressed how adverse weather conditions might impact visitor attendance. Borland and Lye [
28] included an undefined dummy variable, “bad weather”, in their analysis which was constructed using newspaper reports that indicated adverse weather conditions on the day of the matches. “Bad weather” was found to be a statistically significant factor in the attendance model leading to the conclusion that attendance was negatively impacted by poor weather conditions.
More detailed research that focuses primarily on the weather-attendance relationship includes Shih
et al. [
34], Grodzik [
29], and Nicholls
et al. [
15] who utilized multiple weather parameters to assess outdoor visitor attendance. Shih
et al. [
34] examined weather impacts on ski lift ticket sales in Michigan by analyzing weather conditions at two ski resort locations. At the ski resort site, the variables included maximum and minimum temperatures, snow depth, and wind chill, while from the surrounding areas (the most likely areas of visitor origination), snowfall and snow depth were analyzed. It was determined that local on-site snow depth and minimum temperatures were the most important weather variables determining downhill ski ticket sales.
By comparison, Grodzik [
29] examined the impacts of temperature, sunshine duration, and precipitation on outdoor nature park tourism in Canada. It was found that temperature was most relevant in modeling recreational participation rates. Grodzik also stated that recreational participation may be better modeled through the use of a human heat budget as it more accurately depicted the personal “experience” a person may have with the ambient thermal conditions.
Nicholls
et al. [
15] advanced the study of weather-attendance relationships in a geographic comparison of how three golf courses in the state of Michigan were impacted by the weather with respect to the number of golf rounds played. Weather was central to the study as maximum temperature, minimum temperature, and precipitation were all assessed; however, weather was not the only variable analyzed as public holidays, gas prices, and the Consumer Confidence Index (CCI) were also included in the analysis. They found that in every case maximum temperature was the most important variable regarding the number of golf rounds played per day where higher temperatures resulted in more rounds played. In comparing the differing geographies of the three courses and the subsequent differences in the relationship between rounds played and weather, Nicholls
et al. [
15] also concluded that the courses which drew their visitors primarily from local or regional clientele were more heavily impacted by weather variability than courses primarily attracting non-local consumers mainly because local residents have the ability to assess the weather conditions they will likely be exposed to simply by looking out their windows. Conversely, nonlocal visitors are not able to directly assess weather conditions at or near the location and have likely planned a trip in advance investing time and money where the investment decreases the ability for tourists to make last-minute decisions regarding the weather. This finding has been further substantiated by the work of Becken and Wilson [
35] who addressed the difficulties of assessing weather-response relationships when working with non-local travelers.
Although there is a growing body of research focused on the weather-attendance relationship in a wide variety of venues, there is little consensus regarding the optimal weather variables for such analysis. According to de Freitas
et al. [
36], biometeorological variables, such as the Physiologically Equivalent Temperature (PET), are able to more accurately capture the physiological conditions a person may experience. PET may, therefore, serve as a “better” weather variable when assessing how tourists react to the outdoor thermal environment. Brandenburg and Ploner [
30] and Ploner and Brandenburg [
31] addressed this when they examined the impact of meteorological variables on different park recreationalists in Austria using precipitation, vapor pressure, cloud cover, air temperature, and the biometeorological index variable PET. Their findings indicated that PET had the highest impact on visitor attendance decisions followed by precipitation and cloud cover. Additionally, they found that highly active park visitors responded more to weather, and particularly PET, as “bikers” and “hikers” displayed stronger weather-attendance relationships than more passive “dog walkers”. The differences that exist between different recreational activities indicate that the weather-human attendance relationship is a product of both the physiological experience (as observed from high PET correlations) and psychological expectations (as found by the varying weather sensitivities by activity group).
The research in this paper builds on the work of Grodzik [
29], Shih
et al. [
34], Nicholls
et al. [
15], Brandenburg and Ploner [
30], and Ploner and Brandenburg [
31] by utilizing multiple weather variables and transforming them into Physiologically Equivalent Temperature (PET) categories that are then linked to specific zoo attendance data over time. Following de Freitas [
36] and Shiue
et al. [
37], we argue in this paper that the use of a biometeorological variable such as PET should help to more accurately capture the physiological conditions a person may experience, and, therefore, allow for an improved understanding of how varied thermal comfort levels might impact visitor attendance decisions.
3. Methods
In this paper, it is broadly hypothesized that peak visitation days at both the Phoenix Zoo and Zoo Atlanta will tend to exhibit similar relationships with respect to the ambient thermal environment. As with most tourist attractions, peak visitation is theorized to occur when temperatures are neither too hot nor too cold (
i.e., “slightly warm”, and “warm” thermal conditions). However, at lower levels of attendance, it is also hypothesized that differing climates and regional definitions of “bad weather” between Phoenix and Atlanta will yield different attendance outcomes. For example, when subjected to extreme heat conditions in Phoenix, rather than being willing to tolerate higher temperatures, it is projected that most Phoenix Zoo visitors will show “heat aversion” due to an unwillingness to tolerate additional exposure to excessive heat. Conversely, in Atlanta, which has a more diverse climate with a lower occurrence of “extreme heat stress” than Phoenix, it is projected that visitors at Zoo Atlanta will display less sensitivity to varied weather conditions because they are more accustomed to implementing adaptive strategies due to the diversity of weather conditions experienced in Atlanta. Much of this logic is tied to de Freitas [
38] who observed that visitor attendance tends to be shaped more by locally-defined thresholds of tolerance than by “ideal” weather conditions.
Furthermore, it is hypothesized that days with varied thermal ranges will tend to experience higher attendances than days with stagnant thermal conditions. At both locations, it is projected that days with broader thermal ranges will be more aligned with cooler morning temperatures that gradually warm to moderate afternoon temperatures. Alternatively, stagnant thermal regimes are expected to generate lower attendance levels in both Phoenix and Atlanta but for differing climatic reasons. Stagnant thermal regimes in Phoenix are likely days that remain hot throughout the daytime; in Atlanta, these regimes are likely associated with cold and/or rainy weather throughout the day.
Daily visitor attendance data were collected by zoo management based on gate admissions. For this research the time period from September 2001 to June 2011 was specifically selected because it represented a time where at each zoo there was no significant infrastructure change regarding the array of attractions. Additionally, incorporating a period of nearly one decade helps control for impacts resulting from anomalous weather events. Holidays and special promotional events causing artificially high or low attendances were excluded from analysis. Following the methodologies of Perkins [
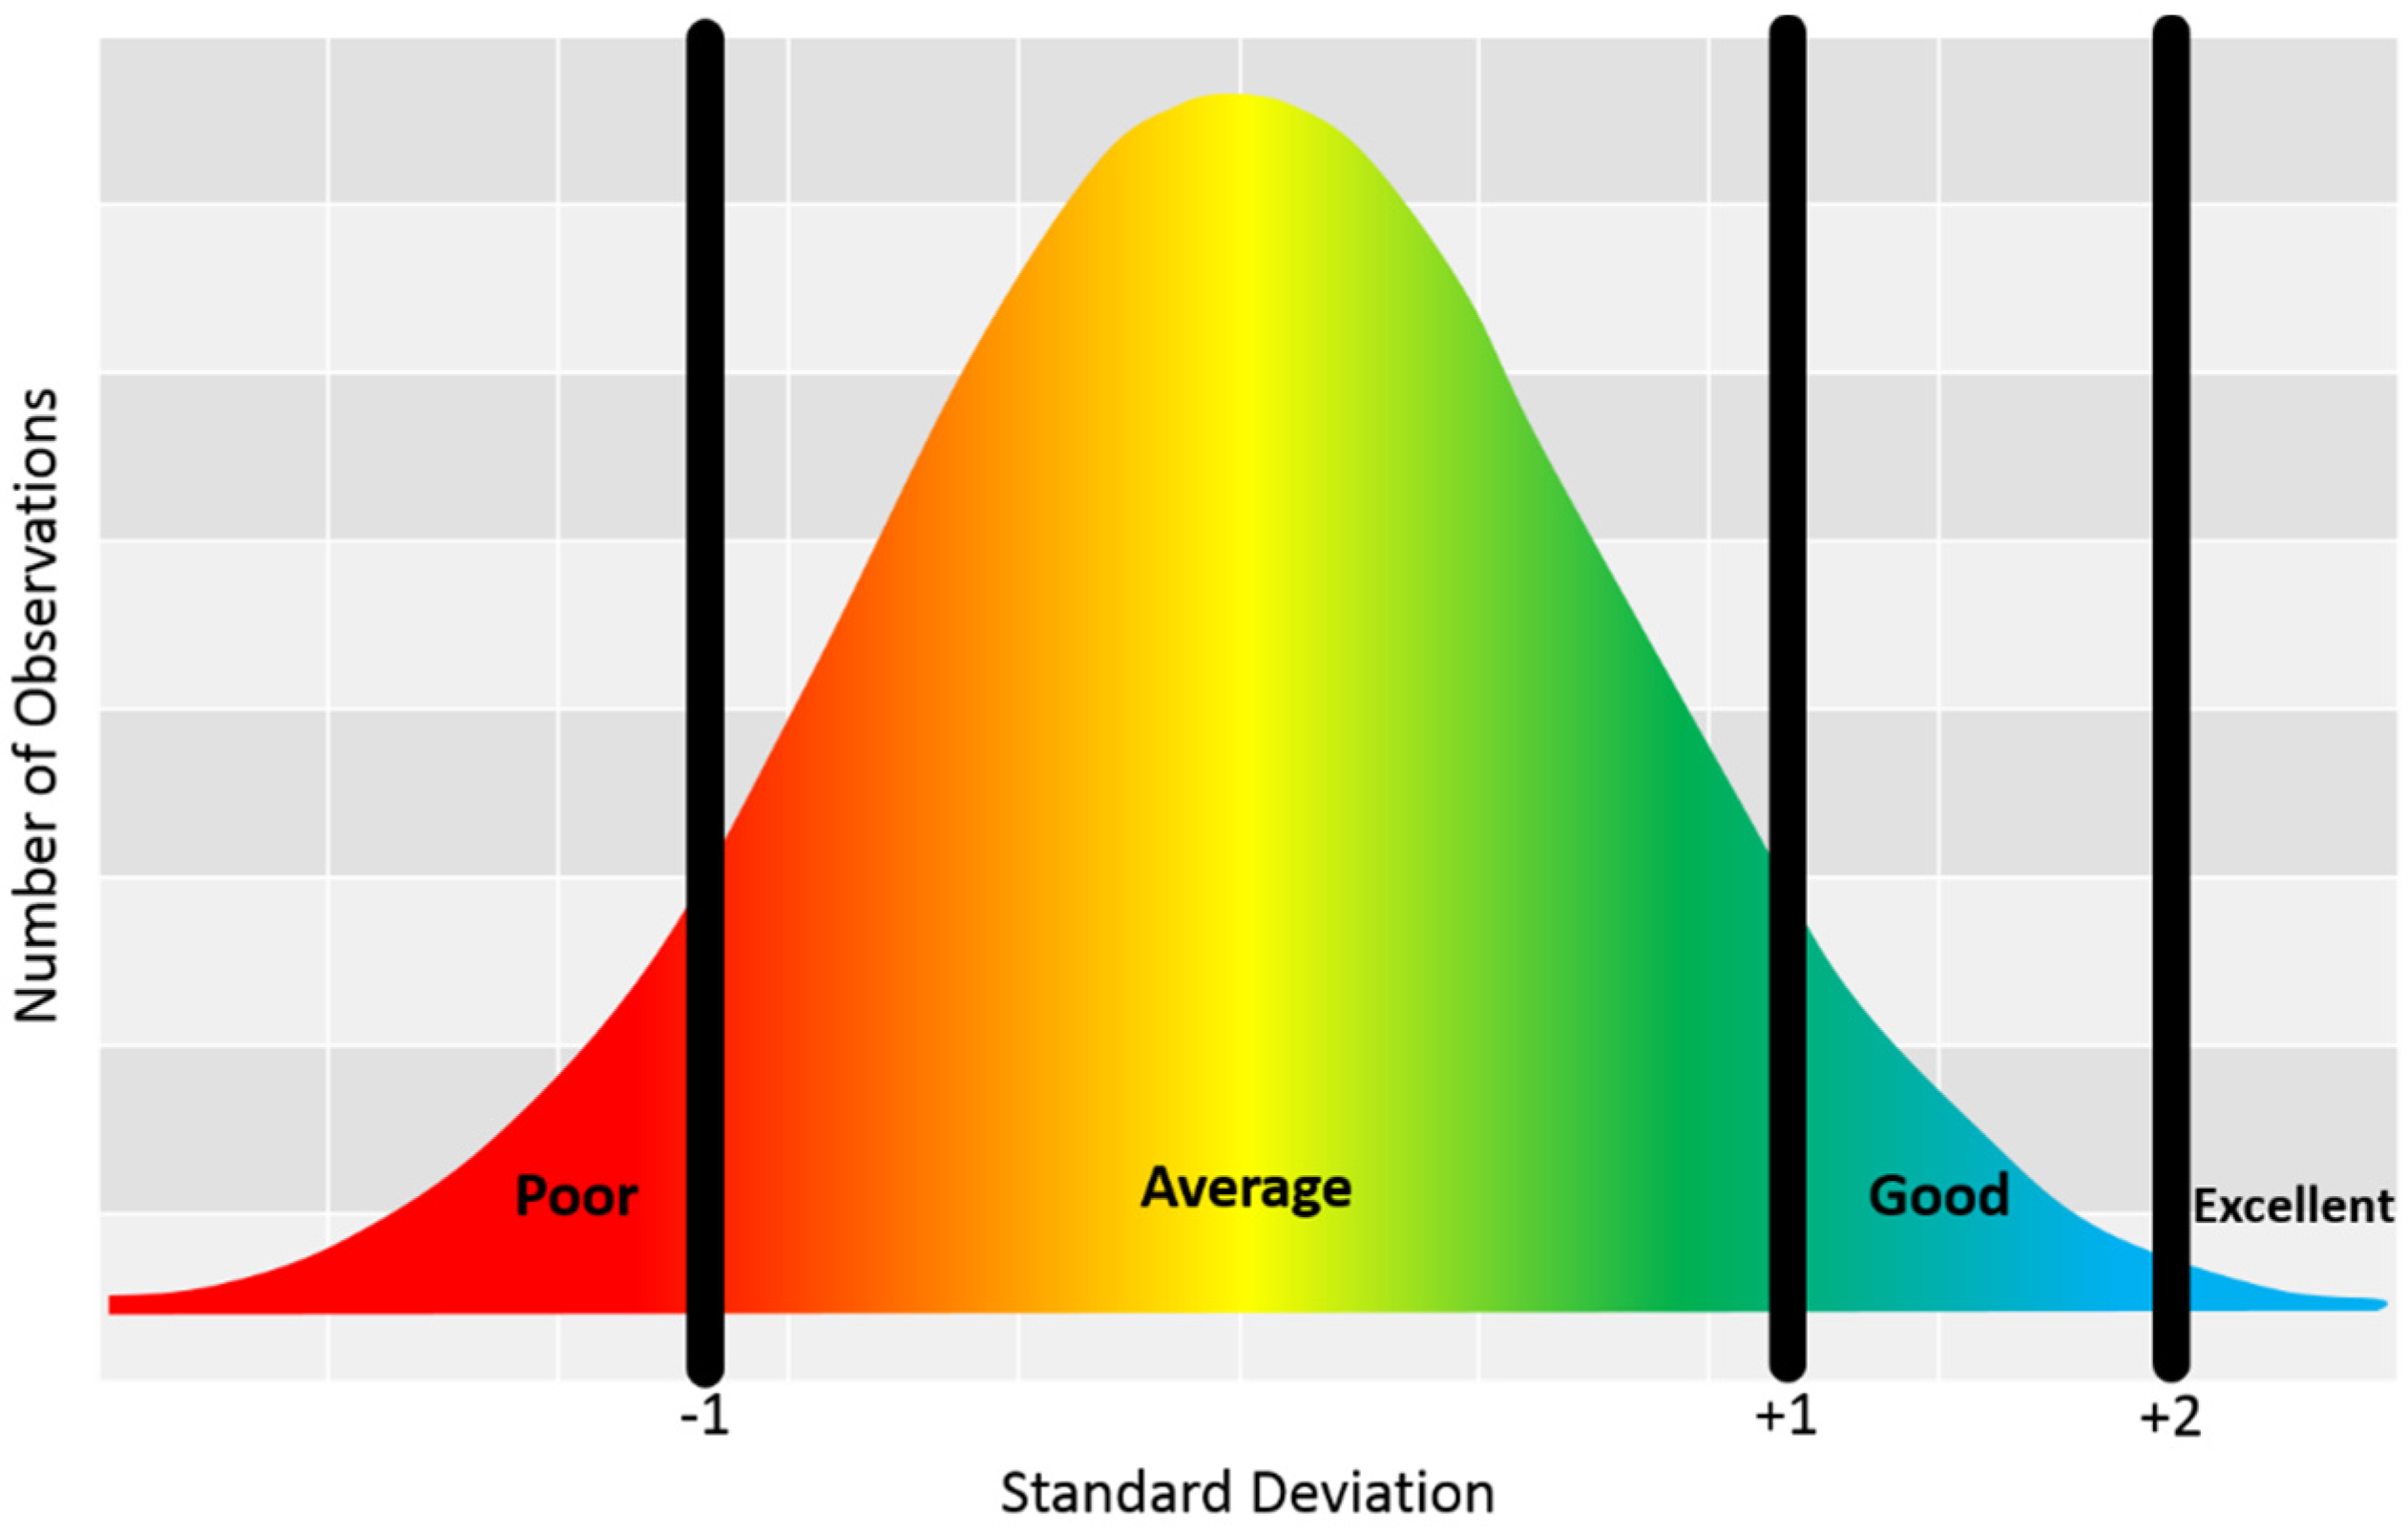
1] regarding visitor segmentation, visitor attendances at each zoo were segmented into four attendance categories or Attendance Day Typologies (ADTs) (
Figure 1). These attendance categories included:
Poor attendance days where daily visitor attendance was less than one standard deviation below the mean daily attendance,
Average attendance days which were within one standard deviation of the mean daily attendance,
Good attendance days that were between one and two standard deviations above the overall daily attendance mean, and
Excellent attendance days where attendance was more than two standard deviations above the daily attendance mean.
Part of the logic for including two categories of attendance more than one standard deviation above the mean attendance (
i.e., “good” and “excellent” days) is their disproportionate impact on overall attendance. For example, while attendance at the Phoenix Zoo and Zoo Atlanta fell within the “good” and “excellent” categories only on an average of one day out of every seven, the total visitor attendance for these ADTs disproportionately accounted for over 39% of total yearly attendance at both zoos. Although this relationship does not completely resemble the theoretical normalized distribution (
Figure 1), it is a result of positively skewed attendance data, a typical occurrence in many TRL contexts.
Weather data at both zoos were obtained from the nearest hourly-data National Weather Service (NWS) Automated Surface Observing Systems (ASOS) station. The ASOS station used for the Phoenix Zoo is located at Phoenix Sky Harbor Airport, 3.9 miles WSW of the zoo while the weather station used for Zoo Atlanta is located at Atlanta Hartsfield Airport, 7.4 miles SSW of the zoo center. During the period of study, these stations did not change locations. Although it is acknowledged that neither weather station is located immediately adjacent to each zoological park, they are close enough to assume that the weather conditions occurring at the stations represented a reasonable proxy for the weather experienced at each zoo. Weather data were collected once every hour for the variables of temperature, humidity, wind speed, and sky cover from 7 a.m. to 7 p.m. local standard time. Nicholls
et al. [
15,
39] have highlighted the importance of utilizing this type of fine resolution weather data to assist more fully in detecting how weather conditions may impact attendances at outdoor locations.
Additionally, this paper utilized a bioclimatic assessment index of the outdoor thermal environment because “thermo-physiologically relevant climatic parameters provide a more precise estimate of the available range of thermal comfort than is inferred from ambient temperature alone” [
13]. Specifically, the Physiologically Equivalent Temperature (PET) was used because it is well-established and commonly used in outdoor tourism studies [
40,
41,
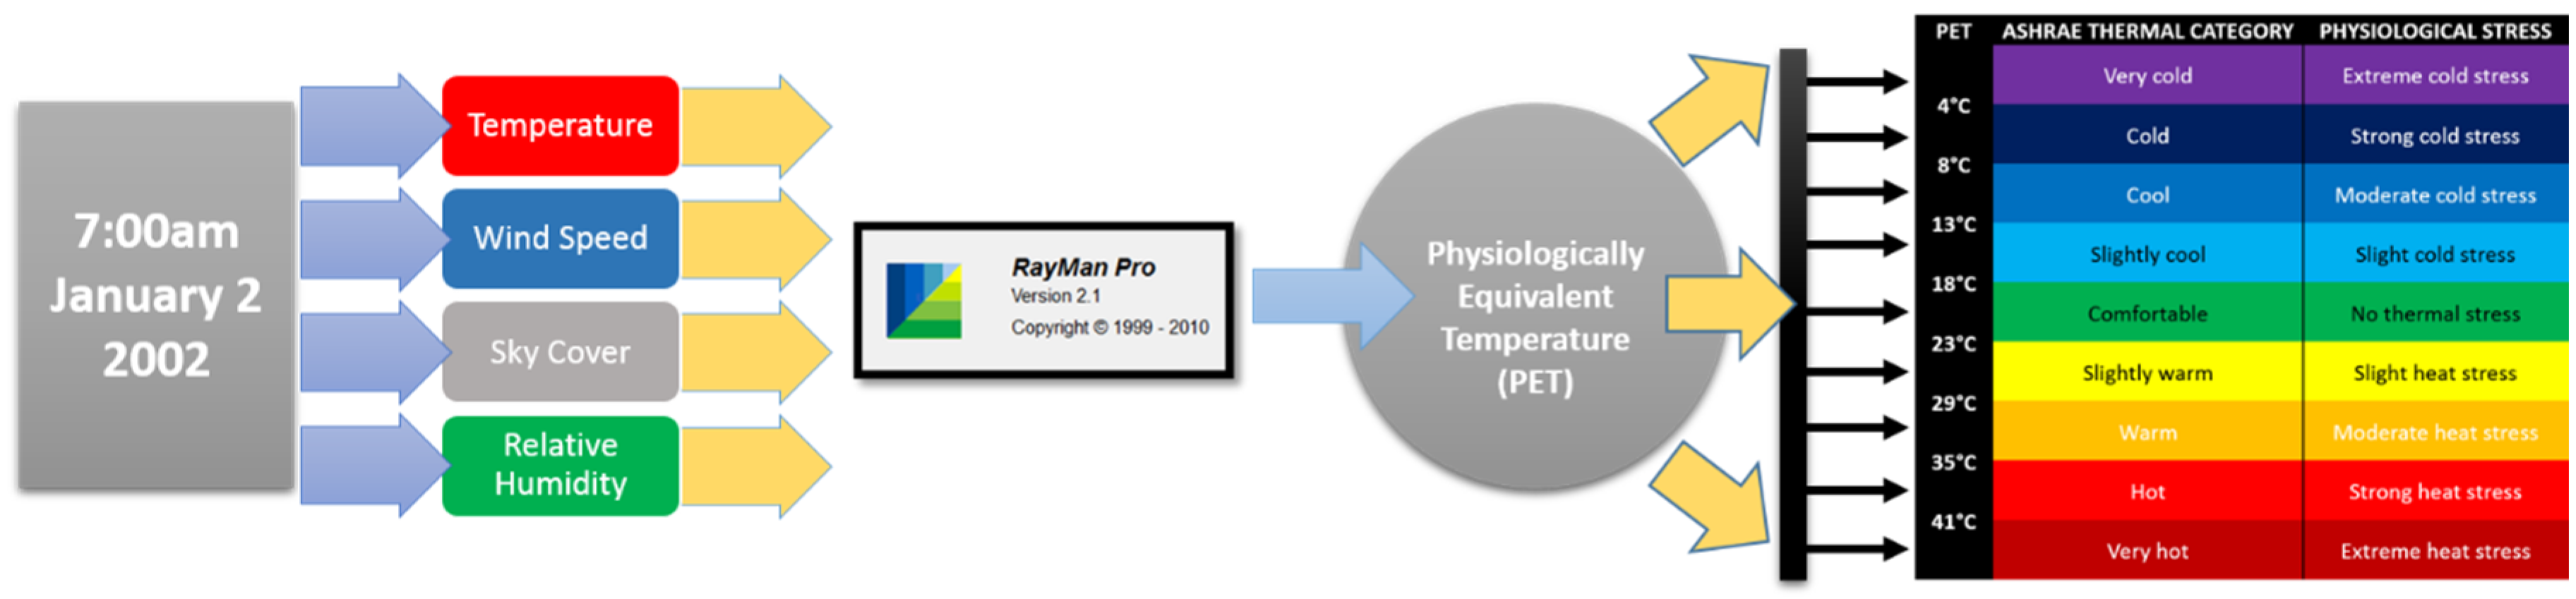
42]. The derived temperature values of PET are often classified into a nine-point thermal sensation scale following standards established by the American Society of Heating, Refrigerating and Air-Conditioning Engineers (ASHRAE) [
43,
44] where the ambient environment is described as “very cold” through “very hot”. For the purposes of this research, the nine categories used were specified using the standard as defined by Matzarakis and Mayer [
40] (
Table 1).
Figure 2 describes the methodological process used in this research where hourly weather data were converted to a derived PET value and then assigned to a PET-based thermal category. PET was calculated thirteen times every day for each hour from 7 a.m. to 7 p.m. where its value was dependent upon atmospheric inputs of temperature, wind speed, sky cover, and relative humidity. To obtain the PET derived value, the RayMan Pro software [
45] was used which yielded a PET-derived temperature variable in degrees Celsius. The RayMan Pro software is commonly used in the calculation of PET, particularly within human bio-climate and tourism research [
36,
46]. Each PET-derived temperature value was assigned to the corresponding PET-based thermal category as defined by Matzarakis and Mayer [
40]. After the thirteen hourly PET categories were determined on a particular day, the warmest and coldest thermal categories for that day were selected to represent the daily high and low PET-based thermal category values.
In previous research, the warmest daily PET-derived value correlated highest with visitor attendance at zoos; additionally, it performed better than the average or low daily PET values in predicting attendance [
47]. The warmest daily high PET worked well in predicting visitor attendance because it represented a particular day’s most extreme thermal condition which tended to occur at the time most visitors were likely to be at the zoo. Furthermore, it is likely that most visitors planning to visit the zoo are attuned to the daytime high thermal condition rather than an abstract average or early-morning low temperature.
As changes in daily weather conditions will likely impact visitor decisions, this research also analyzed how the number of PET-derived thermal categories experienced during a day impacted visitor attendance. Rather than defining the amount of daytime thermal change by measuring the degree difference between the high and low PET values from 7 a.m. to 7 p.m., this research calculated a “perceived” thermal change as measured by the number of PET-based thermal classes (
Table 1) a visitor experienced between the low and high PET from 7 a.m. to 7 p.m. at a particular location. Because thermal category ranges were derived by survey-response techniques in accordance with the ASHRAE thermal perception scale, it was assumed that the number of thermal categories occurring during a day better represented the amount of perceptible change visitors experienced regarding that day’s thermal conditions.
It should also be noted that zoological parks offer several specific advantages when studying visitor behavior and weather-related interrelationships. First, prior to visiting a zoological park, people have certain expectations regarding the reasons why they visit and the outdoor exposure they will likely experience when on site. Although there are differing motivations for zoo patrons [
48], those who visit zoological parks generally go to learn about animals, conservation, and nature, and patrons expect this to occur mostly in an outdoor setting regardless of the geographic location of the zoo. Second, unlike the wide variety of activities potentially engaged in by beach or park visitors [
30,
31,
32,
49,
50], activity at zoos can generally be defined as “slow steady walking” [
51]. Because activity levels contribute to the calculation of the Physiologically Equivalent Temperature (PET), having a comparable visitor activity level across zoo locations allows for a higher level of confidence in any comparison of human thermal comfort and visitor attendance across sites. Third, because most zoos operate as paid-for admission venues, they keep reliable and accurate attendance data over time. Additionally, in order to maintain controlled admissions, zoological park space has well-defined geographic boundaries with fixed entry and exit points. Methodological difficulties can arise when accounting for attendees at open spaces such as botanical gardens and nature parks with multiple entrances, and beach fronts with undefined geographical spaces [
13,
50,
52,
53].
The Phoenix and Atlanta zoological parks are relatively similar in function and purpose. Both zoos are located in major urban metropolitan areas where each zoo is positioned within the urban core and occupies a portion of a larger city park system. Visitor length of stay is comparable at both zoos as the average visitor spends approximately 3.5 h per trip. Furthermore, unlike the San Diego Zoo or Washington National Zoo, which are internationally renowned zoos that attract a large number of out-of-state visitors, the Phoenix and Atlanta zoos largely attract day-trippers from within each respective state. For example, at the Phoenix Zoo, 80% of the visitors are from within the state of Arizona, and at Zoo Atlanta, 67% of the visitors are from within the state of Georgia [
54,
55]. Given the large numbers of local day-trippers at both zoos, it is likely that visitor decisions at the Phoenix Zoo and Zoo Atlanta will be more aligned with weather conditions than they would at zoos in larger tourist venues that might attract more nonlocal visitors. This logic follows Nicholls
et al. [
15] who observed elevated visitor sensitivities to weather conditions at golf courses with larger shares of local visitors. Additionally, both metropolitan areas are comparable in population as the Phoenix Combined Statistical Area (CSA) contained approximately 4.2 million residents while the Atlanta CSA had 5.6 million residents in 2012 [
56]. Also, both zoos are paid-admission zoos with similar costs as parent/child admission rates (as of 2014) were $20/$14 for Phoenix and $22/$17 for Atlanta.
Finally, though the Phoenix Zoo (33.45°N) and Zoo Atlanta (33.73°N) are at equivalent latitudinal locations, their climates are very different. The Köppen-Geiger climate classification system locates the Phoenix Zoo in a dry climate with seasonal precipitation regimes while Zoo Atlanta is located in a humid continental climate with hot summers and no particular dry season [
57]. Average annual precipitation in Phoenix totaled 204 mm while Atlanta totaled 1280 mm. The warmest month in both locations was July when the high temperature averaged 41.2 °C in Phoenix and 37.7 °C in Atlanta. In Phoenix the coldest month was December when the average high temperature was 18.9 °C. The coldest month in Atlanta was January with an average high temperature of 11.3 °C [
58].
4. Findings
Although the Phoenix Zoo and Zoo Atlanta are not regarded as national zoos in the same way as the San Diego Zoo or Washington National Zoo, they are still capable of generating a substantial number of visitors. From September 2001 to June 2011, the two zoos generated a total combined attendance of 17.5 million visitors. During this period, the Phoenix Zoo averaged slightly over one million visitors per year while Zoo Atlanta attracted approximately 0.75 million visitors on an annual basis. The Phoenix Zoo is the largest privately owned non-profit zoo in the United States and has been in operation since 1962. During its recent history, it has attracted national acclaim with “Ruby the elephant” who was widely known for her ability to paint artwork which was subsequently sold for fundraising and charitable purposes. Currently, the Phoenix Zoo is known for its large diversity of animal exhibits, international conservation efforts in species re-introduction, and for a national “sanctuary” which houses both “unwanted” and endangered animals from throughout the world.
In comparison, Zoo Atlanta was established in 1889 and is one of the oldest zoos in the United States. It also gained national recognition for a popular animal as it showcased the well-known “Willie B.” gorilla in its renowned gorilla habitat. Today Zoo Atlanta is highly regarded for its giant panda exhibit as it is one of only four zoos in the United States with this species on exhibit. Clearly, both zoos have well-established histories and sophisticated arrays of attractions; what is less clear is how at each zoo varied weather conditions might impact average daily visitor attendance.
Table 2 illustrates the number of days represented at each zoo for each of the Attendance Day Typologies (“poor”, “average”, “good”, and “excellent”), and
Table 3 illustrates the total visitor attendance within each Attendance Day Typology (ADT) by zoo. In
Table 2, the “average” ADT represented 75.8% of all days at the Phoenix Zoo and 76.1% of all days at Zoo Atlanta. In comparison, the “average” ADT represented 56.7% of the total visitor attendance at the Phoenix Zoo and 61.0% of the total visitor attendance at Zoo Atlanta (
Table 3).
In
Table 2, while the “good” and “excellent” ADTs combined only accounted for 17.1% of the total days represented at the Phoenix Zoo and 14.1% of total days represented at Zoo Atlanta, these days accounted for 42.4% and 38.6% of the total visitor attendances (
Table 3). Consequently, a large portion of total visitor attendance (and thus revenue) occurs on only a select few number of days during the year. By contrast, the “poor” ADT accounted for less than 1% of the total number of visitors at both the Phoenix Zoo and Zoo Atlanta.
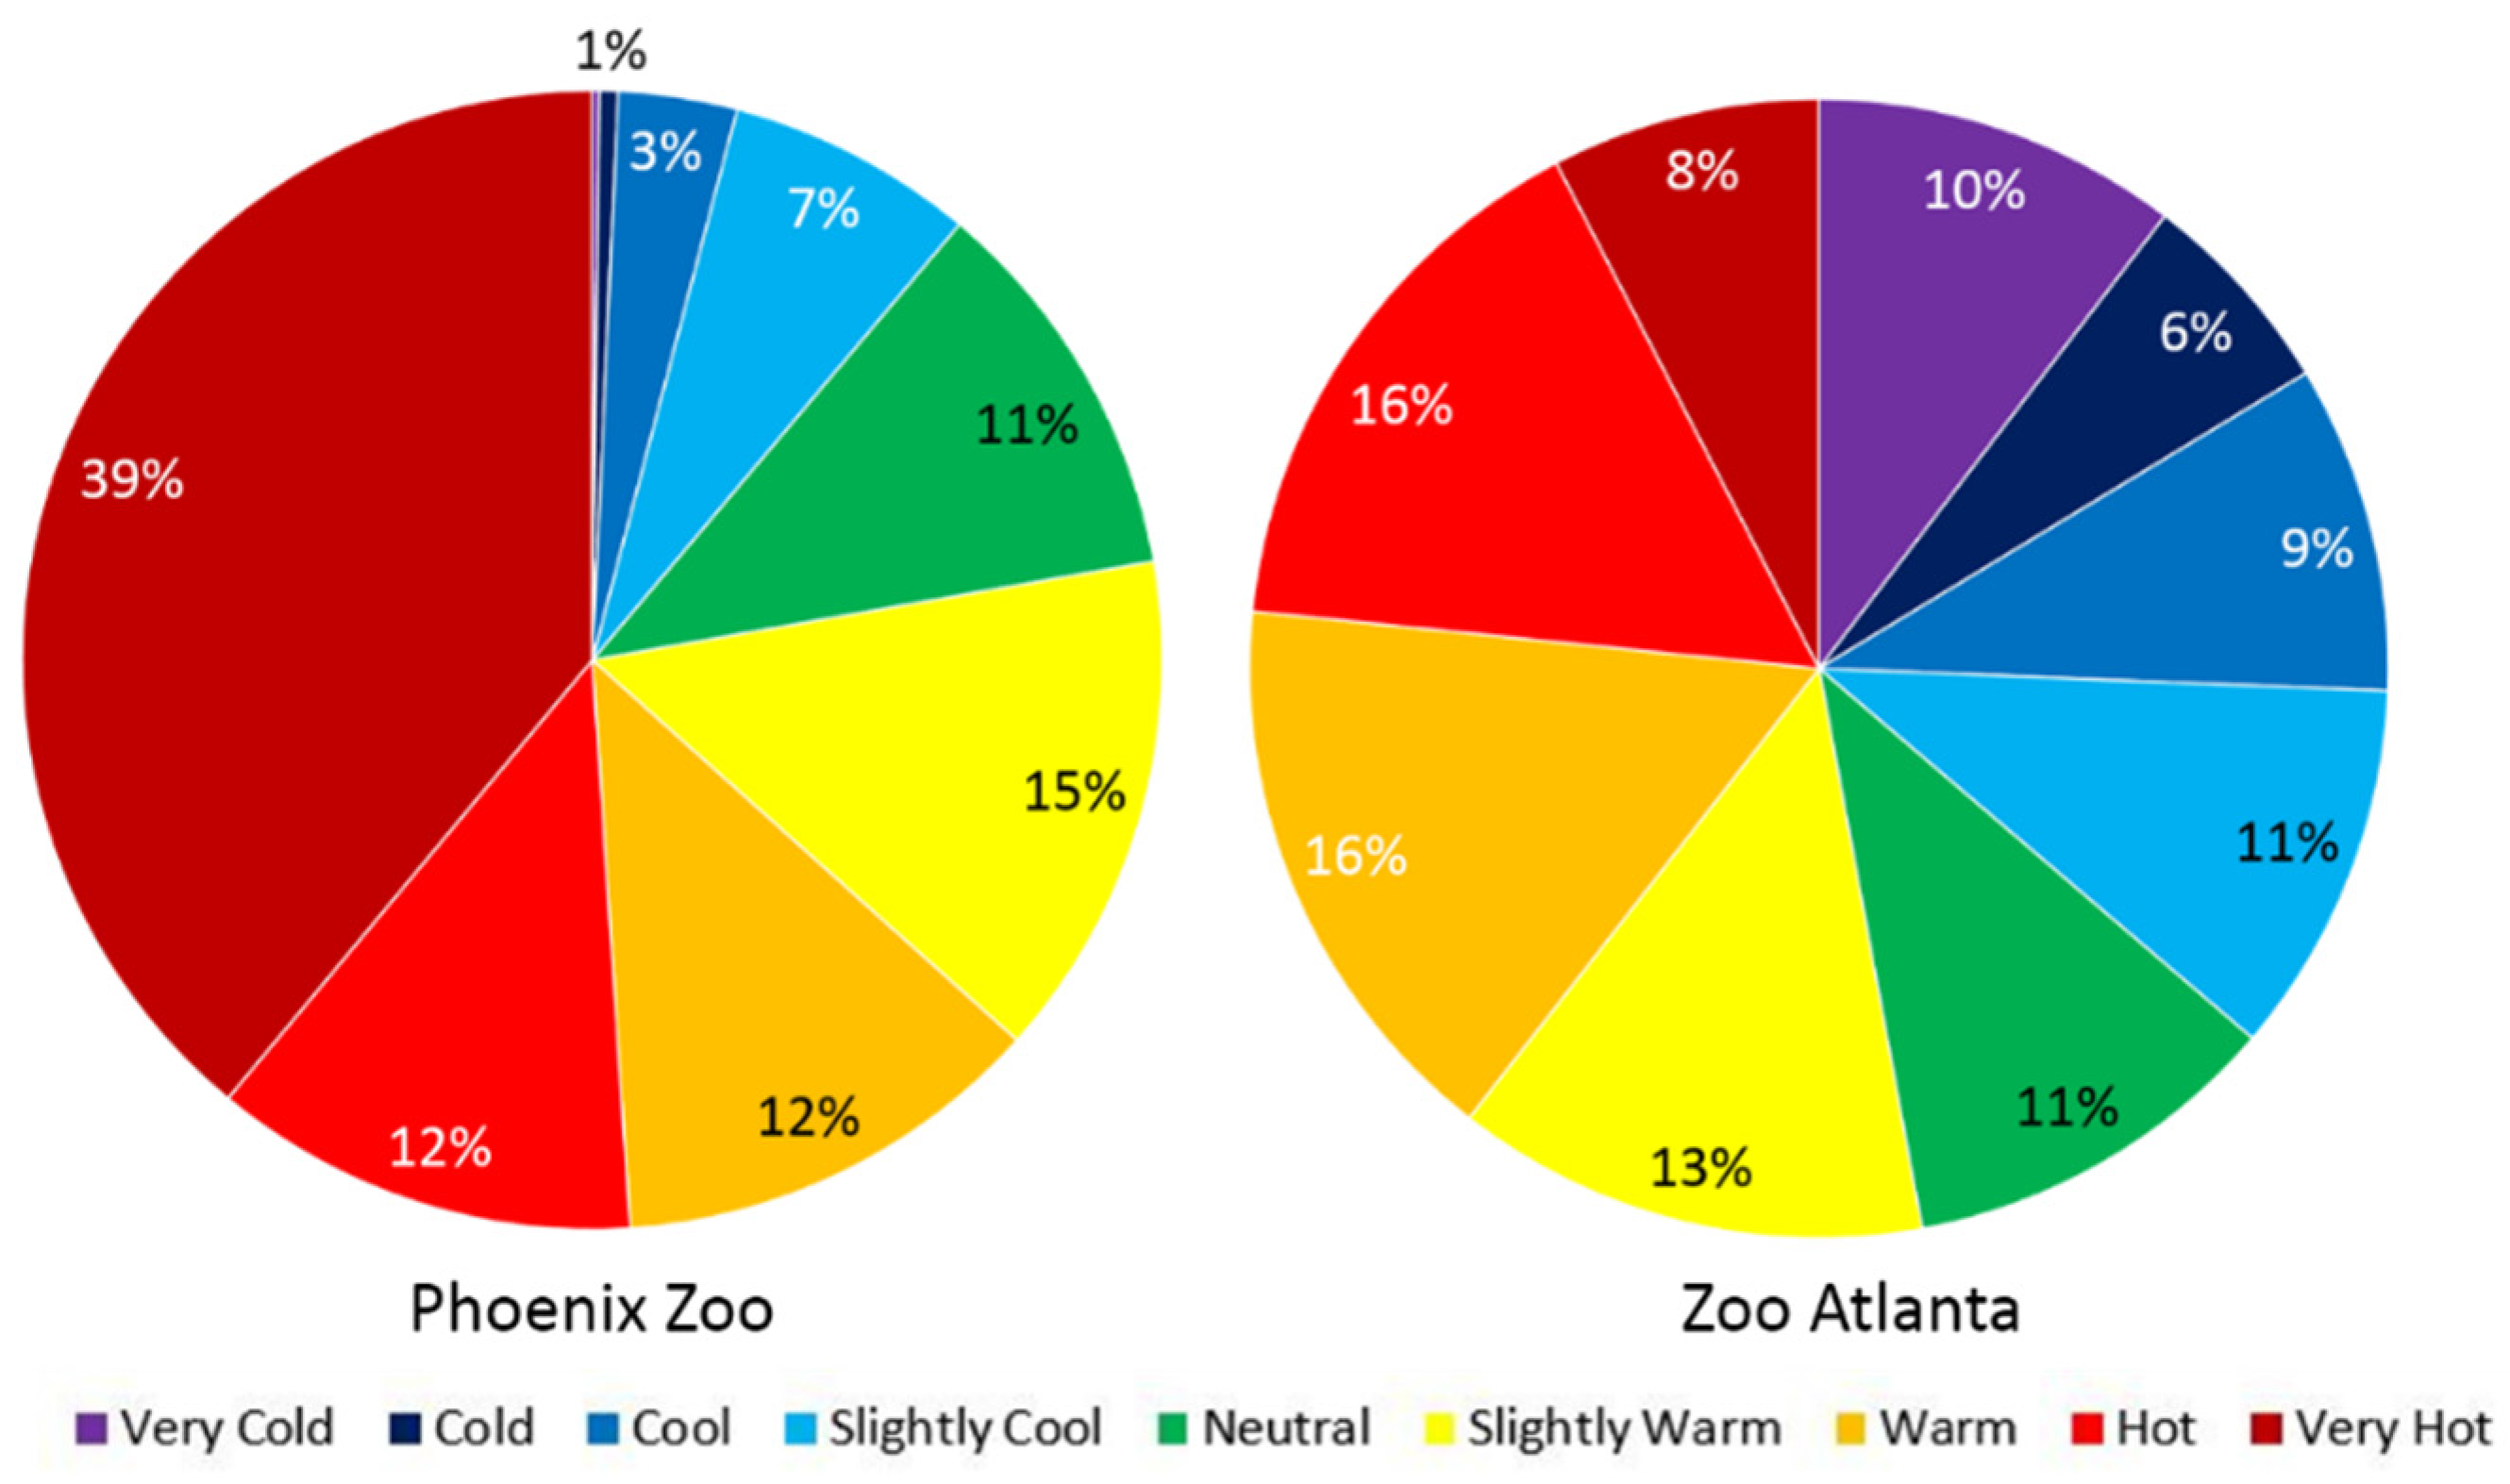
Figure 3 represents the proportion of the number of days at the Phoenix and Atlanta zoos falling within a particular PET-based thermal category from September 2001 to June 2011 where the day in question was represented by the warmest PET-based thermal category that occurred between 7 a.m. and 7 p.m. on each day.
It is clear from
Figure 3 that Phoenix and Atlanta have very distinct thermal profiles. In Phoenix, the “very hot” thermal category occurred 39% of the time, making this the most frequently occurring thermal category. By contrast, this same type of “extreme heat stress” was not observed as frequently in Atlanta where the “very hot” thermal category occurred only 8% of the time. At the other thermal extreme, Phoenix reported a negligible number of “very cold” days, while in Atlanta 10% of all days fell within the “very cold” thermal category. Despite these differences, both Phoenix and Atlanta are comparable regarding the more moderate thermal conditions. The proportion of days falling between the “slightly cool” through “slightly warm” thermal categories was 33% in Phoenix and 35% in Atlanta. Overall, the thermal conditions in Phoenix are largely defined by high proportion of days falling within the “hot” and “very hot” thermal categories. The thermal conditions in Atlanta are largely defined as a relatively even representation of all the thermal categories from “very cold” to “very hot”. Less clear is how these different thermal regimes may shape and influence daily visitor attendance at each zoo during the study period.
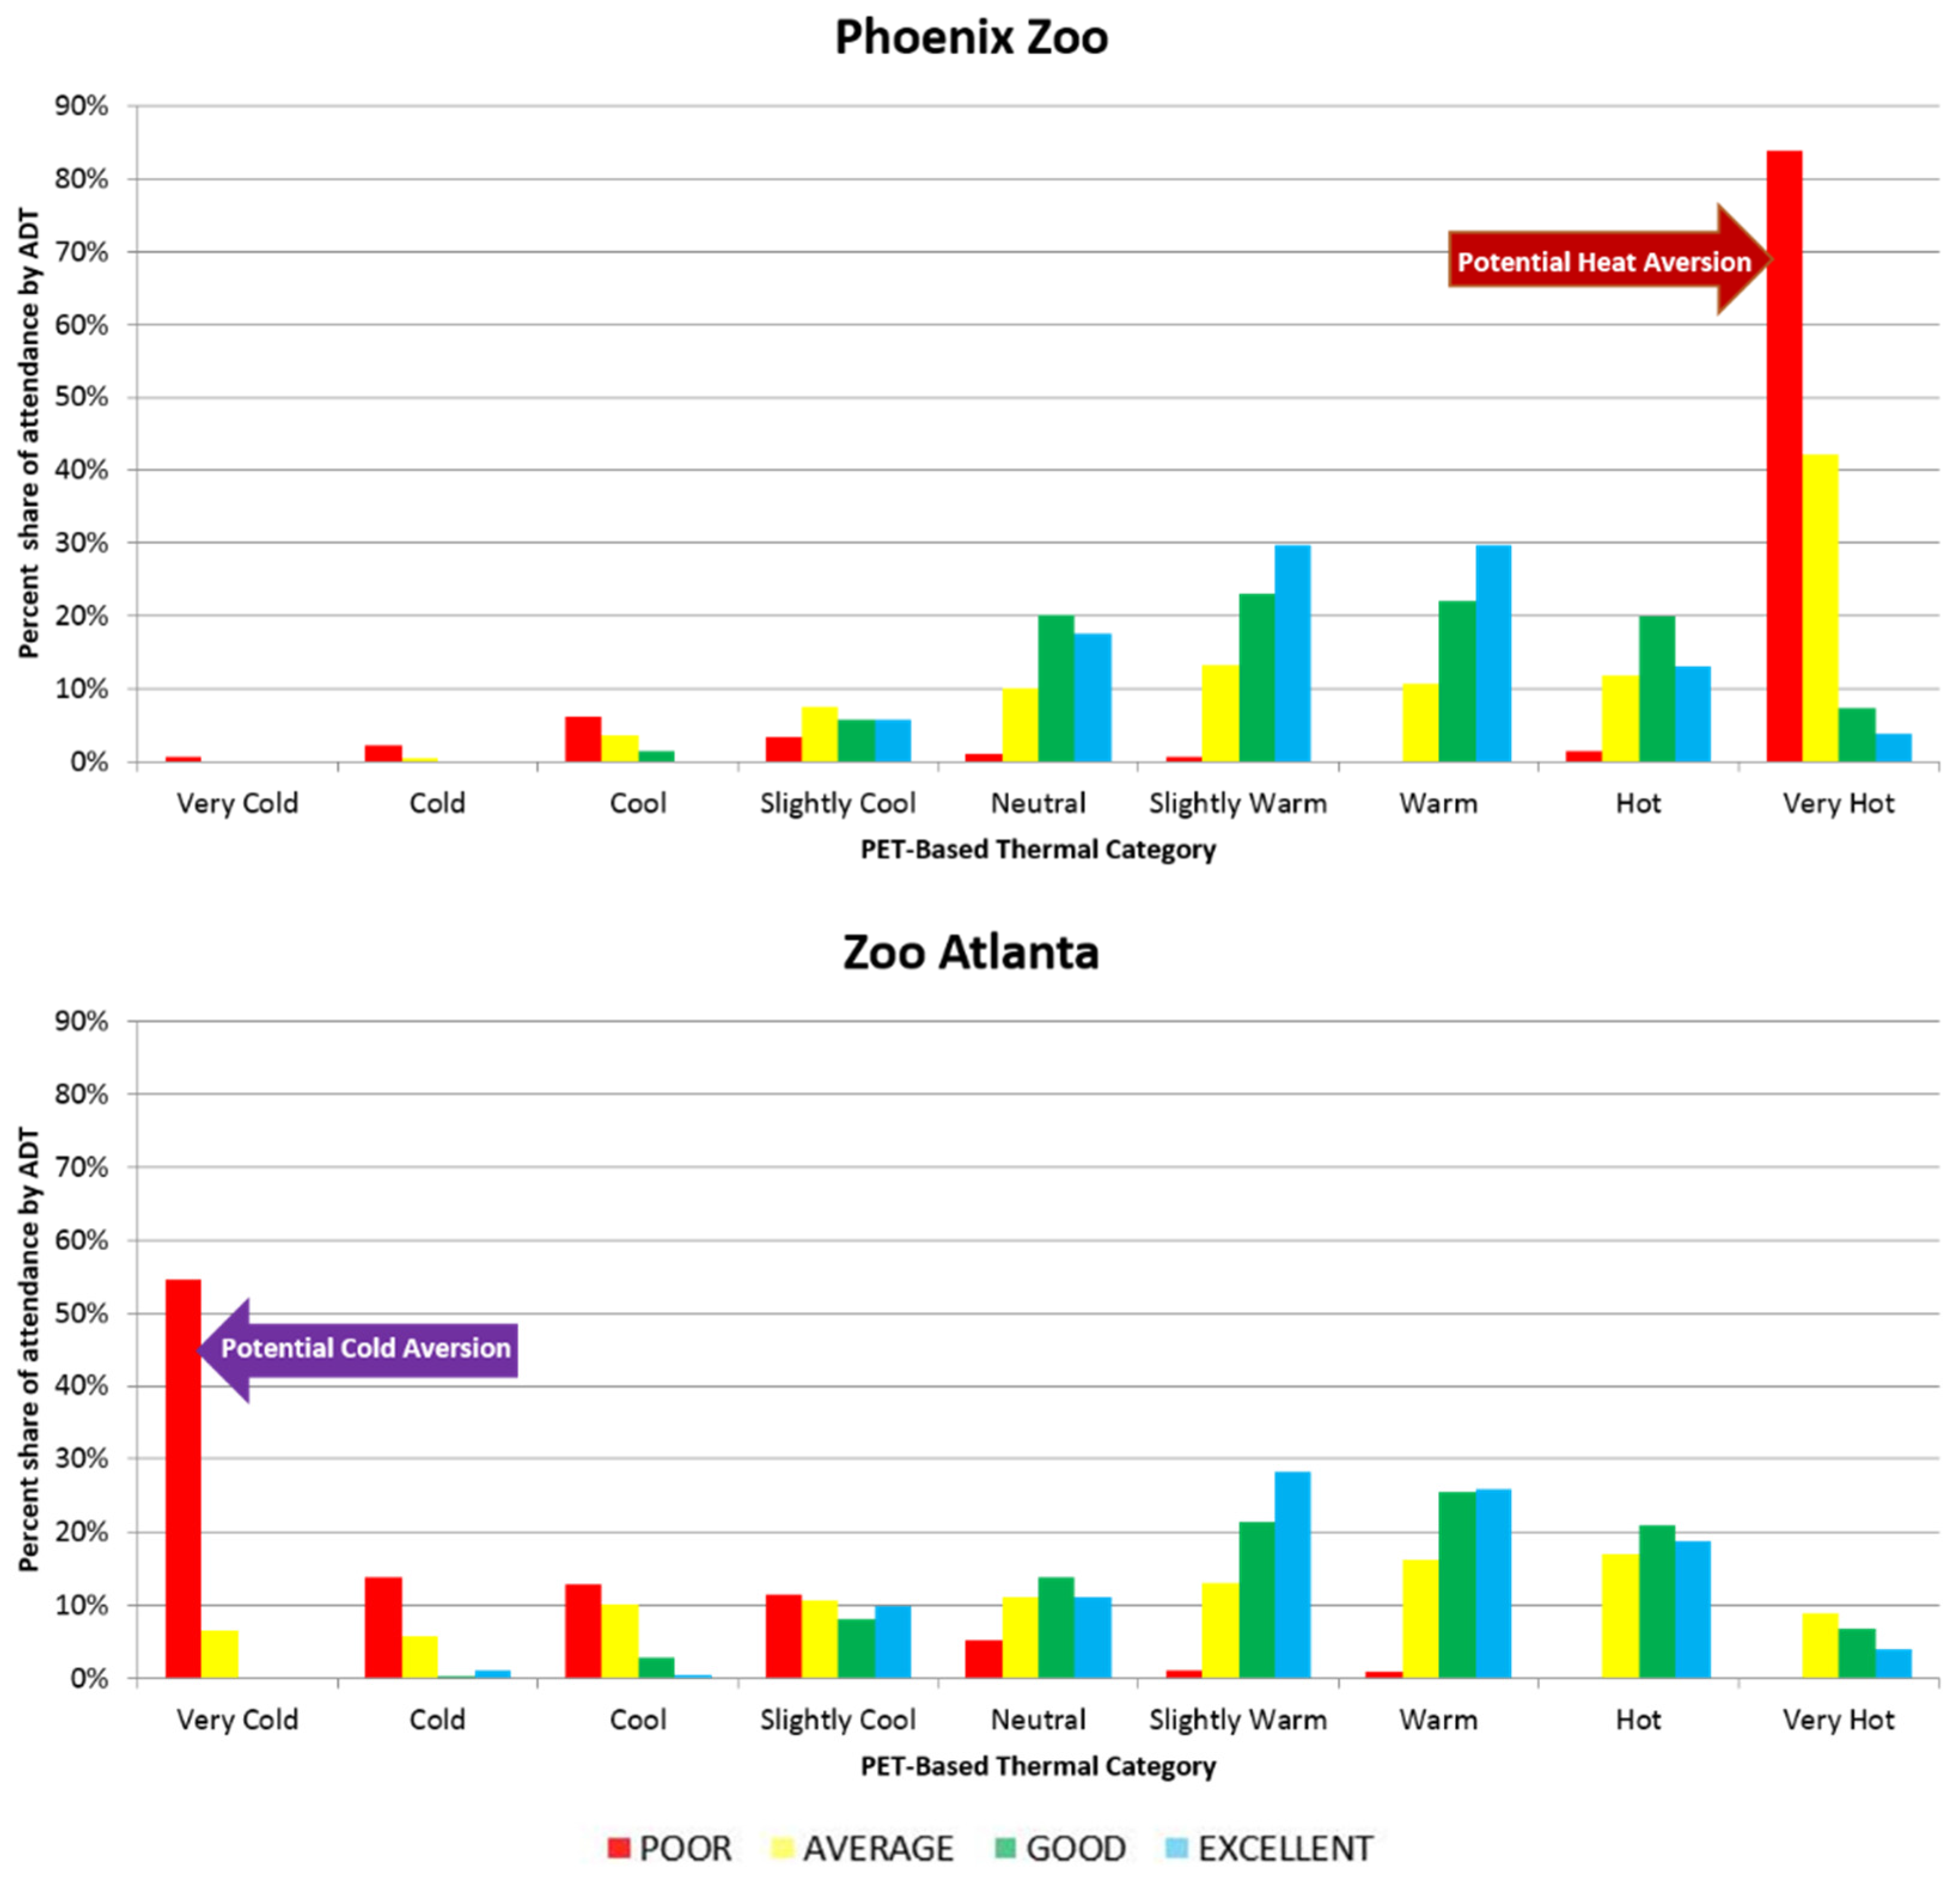
The distribution of PET-based thermal categories based on the percent share of each Attendance Day Typology (ADT) for both zoos is displayed in
Figure 4, where the large share of “poor” attendance days at opposite thermal extremes is vividly illustrated and indicates a potential “thermal aversion effect”.
At the Phoenix Zoo, 84% of the “poor” ADT is represented by the “very hot” thermal category. Conversely, at Zoo Atlanta, 54% of the “poor” ADT occurred within the “very cold” thermal category. Visitors at both zoos appear to show “thermal aversion” to the most frequently occurring form of extreme thermal stress—extreme heat stress in Phoenix and, to a lesser extent, extreme cold stress in Atlanta.
Although most Phoenix Zoo visitors (80% local) [
54] are more accustomed to warmer thermal conditions, and most Zoo Atlanta visitors (67% local) [
55] have more experience with colder thermal profiles, this apparently does not mean that they have adapted to these conditions or that either have developed elevated thermal tolerance levels. In fact, quite the opposite trend appears to be occurring where “very hot” daily thermal classifications are more predictive of “poor” attendance in Phoenix while “very cold” thermal conditions indicate “poor” attendance figures in Atlanta. This finding may suggest that because zoo visitors in Phoenix display potential “heat aversion” and in Atlanta display potential “cold aversion”, visitors could be reacting to a “saturation point” where they choose to no longer tolerate the location’s prevailing thermal extreme regarding their discretionary leisure time.
By contrast, the distribution of PET-based thermal categories across the “excellent” ADT shows a definitive pattern that is shared by both Phoenix and Atlanta zoos. At the Phoenix Zoo, the highest days of attendance on record occur most often within the “slightly warm” and “warm” thermal categories, where both categories combined represented 60% of all the days within the “excellent” ADT. Zoo Atlanta experienced similar trends where the “slightly warm” and “warm” thermal categories combined represented 54% of all the days within the “excellent” ADT. In spite of the differences in prevailing climates and the stark differences observed for the “poor” ADTs, what is apparent in the findings from the “excellent” ADT is that both zoos are very comparable in terms of the preferred thermal conditions on days with the highest attendances. Generally speaking, “thermally optimum” conditions for peak visitor attendance at both zoos appear to be “slightly warm” and “warm”.
It should be noted that not all zoo visitors have the option to make immediate attendance decisions regarding the daily weather conditions since some zoo visitors were part of school groups on fixed, pre-planned schedules. However, many of these group visits tend to be scheduled during periods of the year when “slightly warm” and “warm” conditions are most likely to occur and weather conditions are least likely to disrupt the experience for the students. At the Phoenix Zoo, school groups accounted for 9.7% of total visitor attendance during the study period, and most school group visits tended to occur February through April when the thermal conditions tended to be optimal [
59]. At Zoo Atlanta, most school group visits tended occur March through May during the mild spring months when conditions were most likely to be “thermally optimal” [
60].
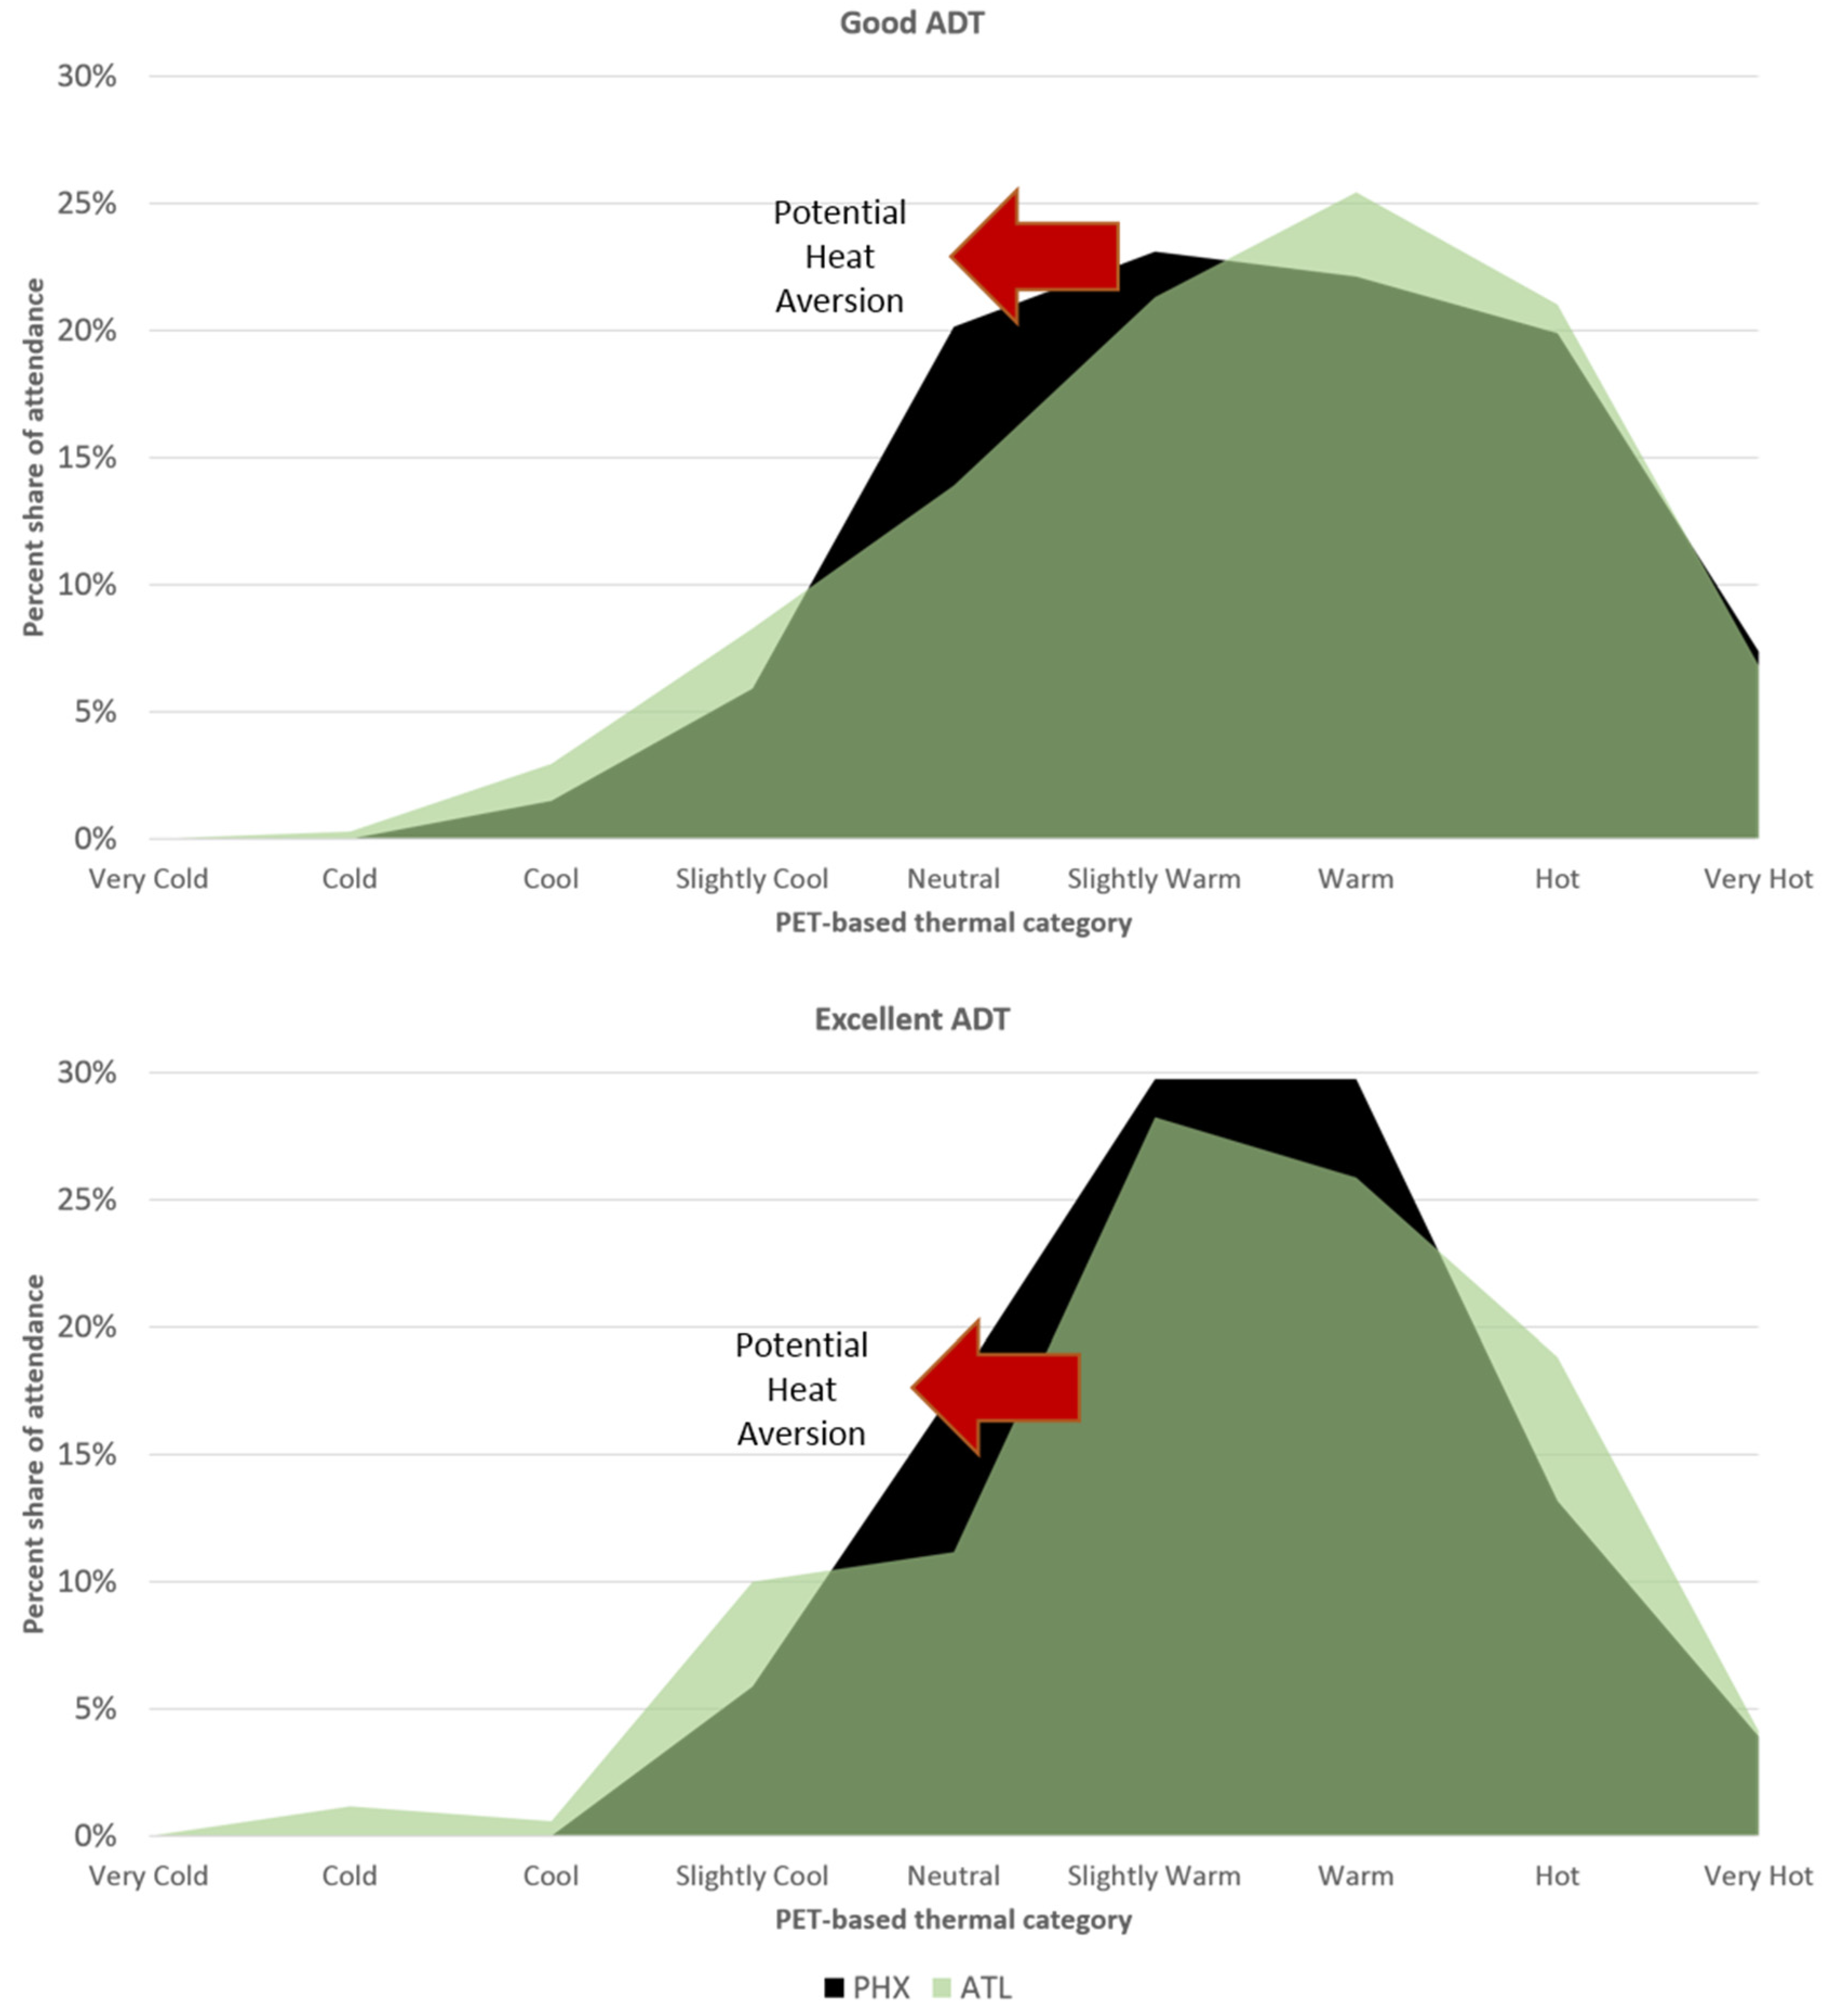
Although the Phoenix Zoo and Zoo Atlanta share several common traits regarding optimal thermal conditions for peak attendance, key differences exist when examining the “good” and “excellent” ADT categories in detail.
Figure 5 provides a direct visual comparison of the “good” and “excellent” ADT categories at the Phoenix Zoo and Zoo Atlanta with respect to the warmest daytime PET-based thermal category. While both zoos generated a disproportionate number of “good” and “excellent” days of attendance during “slightly warm” and “warm” thermal conditions, Phoenix Zoo visitors seemed to show more “heat aversion” since they appeared to favor slightly cooler conditions than visitors at Zoo Atlanta.
Specifically, the Phoenix Zoo experienced a high share of “good” attendance days on “neutral” and to a lesser extent, “slightly warm” days, while Zoo Atlanta experienced a high share of “good” attendance days under “warm”, and to a lesser extent, “hot” thermal conditions. Comparable trends generally occurred when analyzing “excellent” attendance days. Similar to what was observed on “poor” attendance days,
Figure 5 seems to suggest that on peak attendance days, Phoenix Zoo visitors show more “heat aversion” than Zoo Atlanta visitors. In fact, at least concerning discretionary leisure time, Phoenix Zoo visitors appear less willing to tolerate additional heat stress in a setting where 39% of the thermal regime from September 2001 to June 2011, is already classified as “very hot” (
Figure 3).
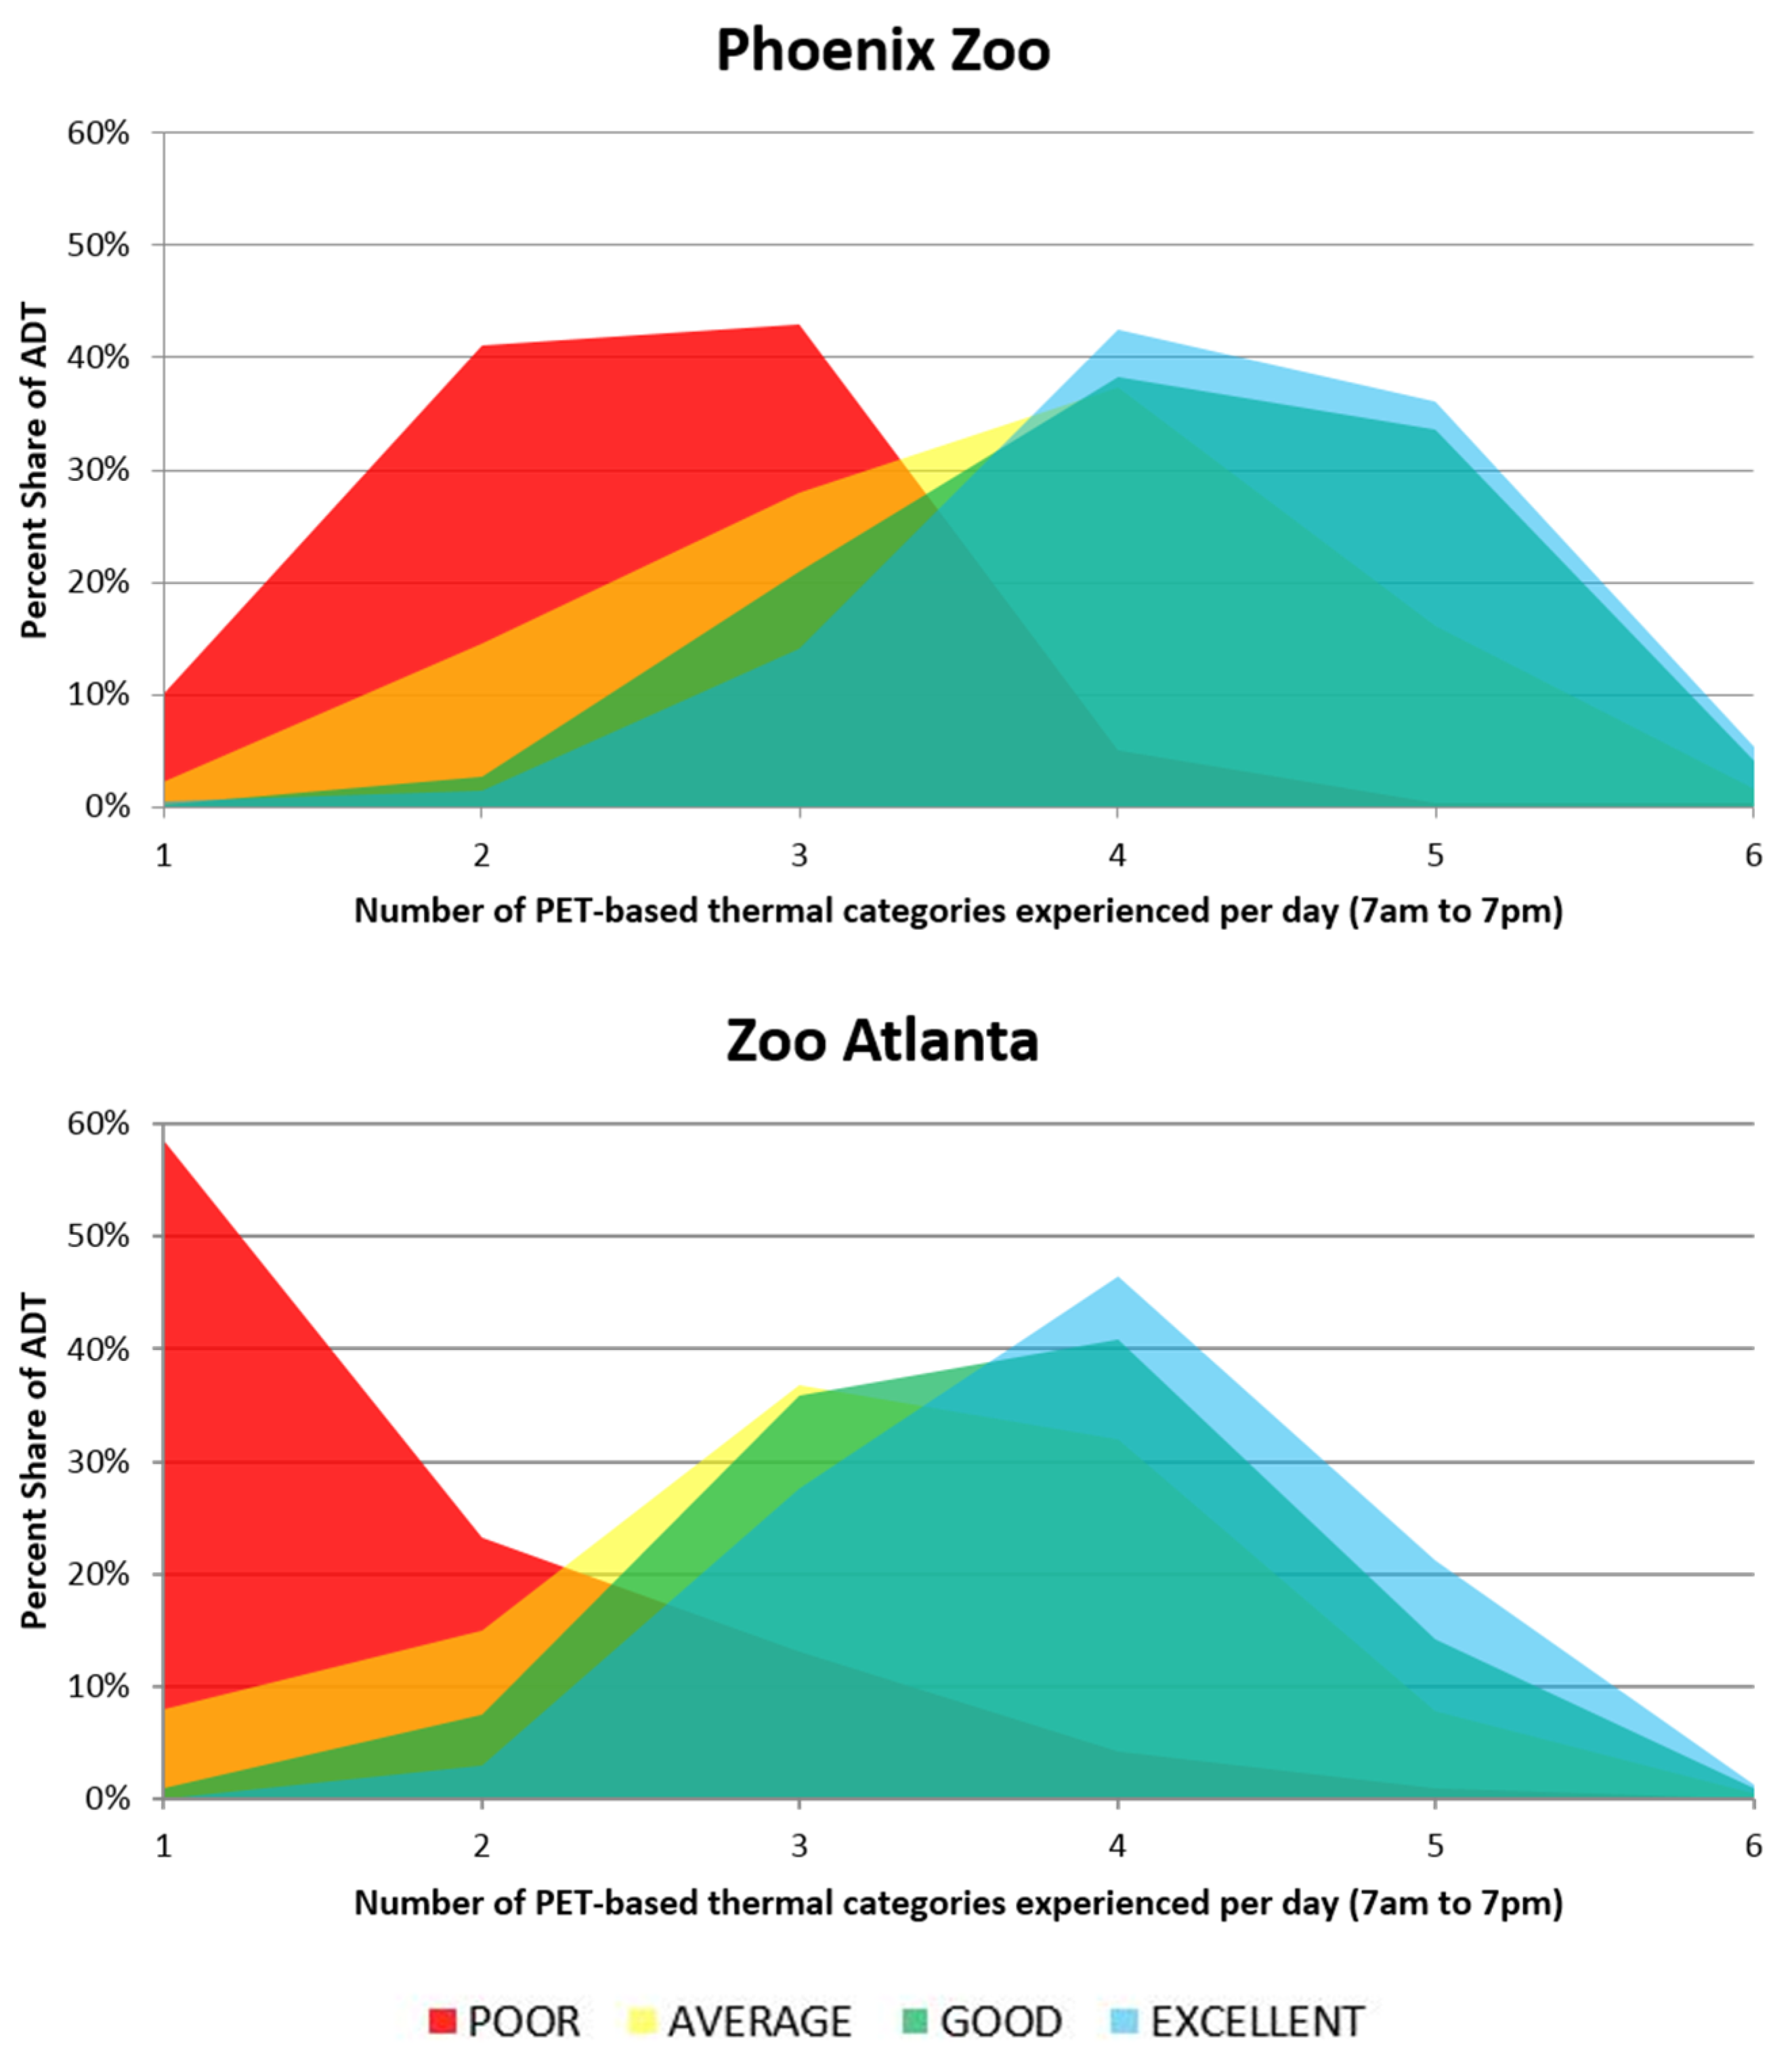
Much of the analysis thus far has focused solely on the connections that exist between zoo visitor attendances and the highest daytime PET-based thermal conditions. However, because visits to both the Phoenix and Atlanta zoos last approximately three hours on average [
54,
55], most visitors likely assess the weather based on the conditions they might experience throughout their entire time at the zoo location. Because of this, conditions throughout the day, particularly any potential changes in the atmospheric environment, may directly influence a decision to visit. To test for this, the average number of PET-based thermal categories experienced during each day (7 a.m. to 7 p.m.) by ADT is shown in
Table 4 at both the Phoenix Zoo and Zoo Atlanta. Additionally,
Figure 6 illustrates the percent share of each ADT by number of PET-based thermal categories experienced by a visitor per day. To illustrate, if the highest PET derived value obtained for the day at one of the zoos occurred in the “very hot” category and the lowest PET derived value occurred in the “neutral” category, it would represent 5 thermal categories based on the Matzarakis and Mayer [
40] thermal scale (
Table 1).
Based on
Table 4, poorly attended days experienced fewer thermal categories during a day while peak attendance was directly related to those days that experienced a larger number of PET-based thermal categories. For example, at the Phoenix Zoo, “poor” attendance days averaged only 2.4 PET-based thermal categories while “excellent” attendance days experienced more than four PET-based thermal categories.
In Phoenix, poorly attended days that experienced a small number of PET-based thermal categories would most likely be representative of an atmospheric condition where early morning low temperatures were already quite warm. After sunrise in a dry desert heating regime, “hot” morning temperatures would quickly warm to the “very hot” thermal category resulting in “extreme heat stress” conditions for most of the day. Such an early-morning condition is likely related to periods of southerly wind flow where hot desert air from the Sonoran and Chihuahuan Deserts in Arizona and Mexico is advected into Phoenix thereby inhibiting significant nighttime cooling. By contrast, peak attendance days tended to occur on days that experienced four or five PET-based thermal categories. Such a scenario likely implies a situation when cooler temperatures were experienced first thing in the morning and gradual warming occurred throughout the day. When potential zoo visitors wake-up to a welcome break from the very hot thermal regimes that predominate in the region, it is more likely that a decision is made to visit the zoo based on the expectation that “very hot” conditions are unlikely to occur later in the day.
Much the same dynamic is happening at Zoo Atlanta, with some notable exceptions. For example, at Zoo Atlanta poor attendances tended to occur on thermally stagnant days when the number of PET-based thermal categories experienced was two or fewer. In Atlanta, the most likely weather conditions contributing to a day with little to no thermal change are either days which begin as “very cold” and do not warm much and/or days with significant cloud cover and possible rain which lead to little daytime warming. Additionally, these cloudy days, regardless of the presence of rainfall, are not aesthetically pleasant conditions for outdoor zoo visits, thereby further decreasing zoo attendance. Much like Phoenix, well attended days tended to occur on days when approximately four thermal categories were experienced. Such days are most likely represented by moderate to fair weather conditions in the early morning which typically evolve to relatively clear skies and ample sunshine by mid-afternoon.
5. Conclusions and Future Direction
In order to better understand how tourism communities can become more resilient to climate change, society must first better understand how weather and climate factors impact visitors today [
4,
14,
15,
16,
17,
18]. This paper has sought to partially address these concerns by examining in detail how daily zoo visitor attendance at the Phoenix and Atlanta zoological parks has corresponded with the ambient atmospheric conditions from September 2001 to June 2011. By focusing on zoological parks, this research has also addressed a large and important part of the tourism industry since annual visitations at U.S. zoos surpass those of all major sporting venues combined [
19]. Additionally, zoos are visited frequently by children and the elderly, an important demographic that can be particularly sensitive to the types of extreme thermal stresses projected to be more common under future climate change scenarios. As a result, zoological parks could be excellent barometers of visitor attendance decisions giving insights into how future generations may respond to climate change scenarios.
Based on an analysis of thermal comfort indices and daily visitor attendance at two major zoological parks, several key findings emerged. First, it was found that the “optimal thermal conditions” regarding peak visitor attendance were relatively consistent across both the Phoenix and Atlanta zoos, despite their differing climates. PET-based thermal categories of “slightly warm” and “warm” were found to best describe the “optimal thermal conditions” for visitor attendance at both zoos. This could indicate that other zoological park venues, regardless of climatic location, may be able to use the “slightly warm” and “warm” thermal categorizations as a rough basis for predicting high-volume attendance days.
Second, “poor” attendance days at each zoo were triggered by very different thermal conditions. At the Phoenix Zoo, “poor” attendances tended to occur on “very hot” days while at Zoo Atlanta “poor” attendances disproportionately occurred on “very cold” days. Visitors to the Phoenix Zoo appeared to be unwilling to tolerate extreme heat, perhaps, in part, because it is the most common thermal extreme, and so at least locally-based visitors to the zoo may be “heat averse”. By contrast, in Atlanta, zoo visitors were more likely to be “cold averse” for similar reasons. Contrary to “optimal conditions” this finding indicates that when predicting low attendance volumes, other zoological park locations must consider their unique climatic situations, and particularly the thermal extremes, prior to making attendance forecasts based on the outdoor thermal component.
Third, it should also be noted that the potential “heat aversion effect” observed at the Phoenix Zoo on poorly attended days also appeared to influence visitor preferences on days of higher attendance. Despite similar preferences for “optimal thermal conditions”, on days with attendances classified as both “good” and “excellent”, visitors at the Phoenix Zoo displayed preferences for slightly cooler thermal conditions when compared with visitors at Zoo Atlanta. In effect, local visitors” aversions to the extreme heat conditions in Phoenix could be creating a situation where the “optimal thermal conditions” are actually depressed simply because local visitors have become “oversaturated” with extreme heat and seek contrast. Future research may want to test this theory to see if visitors in a climatically cold location have slightly warmer “optimal thermal condition” preferences than those in a seasonal location such as Atlanta.
Fourth, regarding daytime changes in the weather, visitors to both zoos seemed well attuned to the dynamic change in thermal categories during a day. Both zoos experienced peak attendance on days when visitors experienced four or more PET-based thermal categories for a given day, and depressed attendances on days with stagnant thermal regimes. Reasoning for this finding clearly coincides with the generalization that days with stagnant thermal regimes usually represent extreme heat, extreme cold or cloudy/rainy days. Conversely, days with significant changes in the thermal regimes generally coincide with clear and sunny days. Practical implications from this finding are much more nuanced and may shed light on new avenues of visitor attendance forecasting. Rather than focusing solely on one daytime high temperature or one thermal condition, zoological parks may realize more accurate visitor attendance forecasting models by quantitatively focusing on both daytime low and daytime high thermal conditions.
While zoological parks can be excellent “test laboratories” in the ongoing assessment of how weather and climate might impact visitor behavior, this paper raises additional research questions. If an “optimal thermal condition” exists regarding peak zoo visitor attendance, how will climate change impact zoo visitor demand at the Phoenix and Atlanta zoos, and other zoological parks? Furthermore, if the “heat aversion effect” demonstrated in Phoenix is replicable in other locations with similar thermal regimes, what might this imply for the geography of zoo attractions in the long-term? And beyond zoological parks, could these findings be applicable to other similar tourist attractions such as amusement parks or nature parks?
Incorporating findings from this paper and initiating future research with a focus on such questions can help build a better understanding of how weather events and thermal regimes influence visitor behavior. In the short-term, findings such as these can help to better inform zoological parks and other outdoor tourist venues regarding attendance forecasting. Having more accurate attendance forecasts on a day-to-day basis can help an organization operate more efficiently by adjusting staffing levels based on an expected number of visitors. Doing so decreases on-site bottlenecks and wait times, thereby resulting in higher degrees of visitor satisfaction and a higher likelihood for repeat visits. This ultimately can improve profits. In a longer temporal frame, better understanding visitor response to outdoor thermal conditions and differences in responses across varying climatic locations can serve as a foundation for more accurate modeling of attendance-response in the future. Such a foundation can only help to improve our assessments of the potential impact broader climate change might have on tourism and lead to more rigorous and resilient long-term tourism planning.


