1. Introduction
Tourism has become one of the largest economic sectors in the world [
1] and is a significant contributor to many national and local economies. The most visited region in the world is Europe, which accounts for 51% of all international arrivals (582 million tourists) and 41% of tourism receipts (US$ 509 billion) [
2]. The European market is expected to continually grow, reaching an estimated 620 million international tourist arrivals by the end of this decade and 744 million arrivals by 2030 [
2]. Countries in Europe also continue to dominate the travel and tourism competitiveness ranking, which measures the attractiveness of developing business in the travel and tourism industry of individual countries, with six of the top 10 economies located in the region (Spain, France, Germany, United Kingdom, Switzerland, and Italy) [
3]. When exploring what motivates tourists to visit Europe, studies reveal climate to be a primary factor, particularly with travel to the Mediterranean region [
4,
5,
6].
The close relationship between climate and tourism has been researched extensively, particularly the influence of climate on tourist motivation and destination choice [
7,
8,
9,
10,
11,
12,
13,
14,
15,
16,
17,
18,
19,
20,
21,
22], as well as the impact of climate on destination attractiveness [
4,
23,
24,
25,
26,
27,
28]. Climatic resources therefore contribute significantly to tourists’ decision-making processes, influencing where and when tourists’ travel, as well as the associated distribution of tourism expenditures.
Climate change will directly impact the tourism sector in Europe by shifting the distribution of climatic resources. This shift is projected to alter the length and quality of tourism seasons in the region, affecting both the temporal and spatial distribution of domestic and international tourism flows and spending [
29,
30]. The latest assessment report by the Intergovernmental Panel on Climate Change (IPCC) concluded that, “after 2050, tourism activity is projected to decrease in Southern Europe (low
confidence) and increase in Northern and Continental Europe (medium c
onfidence)” [
31]. Moreover, the report identified tourism as one of the three sectors in Europe “most likely to be affected by climate change” [
31]. These findings are supported by a number of studies that project that during the summer months, climatic conditions could deteriorate in the Mediterranean but could improve significantly in northern Europe [
32,
33,
34,
35,
36,
37,
38,
39,
40,
41]. Importantly, these studies have not been without criticism [
5,
6,
20,
42,
43,
44,
45,
46] and support the need for new indices such as the HCI that aims to better understand tourist climatic preferences, behavioural thresholds, and resilience to marginal conditions.
While much research has been devoted to assessing the climatic suitability of destinations for tourism, including the projected impact of climate change, the most widely applied approach for quantifying climatic resources has been the Tourism Climate Index (TCI). The TCI was developed by Mieczkowski [
47] and was designed to integrate the main climatic variables relevant to tourism into a single numerical index. The TCI thereby provides a composite measure capable of facilitating a holistic interpretation of destination climate, which can be used to objectively compare destinations. As evidenced in the IPCC, the TCI has been widely applied to assess the future climate suitability of destinations, both in Europe and globally. Despite the TCI’s wide application, it has been subject to substantial critiques [
5,
6,
20,
42,
43,
44,
45,
46]. The four key deficiencies of the TCI include: (1) the subjective rating and weighting system of climatic variables; (2) it neglects the possibility of an overriding influence of physical climatic parameters (e.g., rain, wind); (3) the low temporal resolution of climate data (
i.e., monthly data) has limited relevance for tourist decision-making; and (4) it neglects the varying climatic requirements of major tourism segments and destination types (
i.e., beach, urban, winter sports tourism).
To overcome the above noted limitations of the TCI, a Holiday Climate Index (HCI) was developed to more accurately assess the climatic suitability of destinations for tourism. The word ‘holiday’ was chosen to better reflect what the index was designed for (
i.e., leisure tourism), since tourism is much broader by definition (“Tourism is a social, cultural and economic phenomenon which entails the movement of people to countries or places outside their usual environment for personal or business/professional purposes” [
48]. A major advancement of the HCI is that its variable rating scales and the component weighting system are based on the growing literature of tourists’ stated climatic preferences over the last decade. The HCI is also consistent with the conceptual design recommended by de Freitas
et al. [
45] and thus accounts for the overriding effect of physical variables (wind and rain), while also utilizing daily data to estimate index ratings (including probabilities of preferred and unacceptable conditions). The HCI also takes into consideration that different destination types have varying climatic requirements [
6,
49,
50], with design specifications developed for two major tourism segments—urban and beach.
This paper will first outline Miezkowski’s Tourism Climate Index, including how the index is calculated and its key deficiencies. Next, the design of the HCI is discussed, including a summary of multi-national tourist climate preference surveys used to inform its development. This paper focuses on urban tourism, whereby the city and its attractions are the main destination and place of interest (e.g., architectural buildings, statues, museums), comparing ratings for the HCI:Urban and TCI for six climatically diverse European cities under current (1961–1990) and future (2020s, 2050s, 2080s) climatic conditions, including Barcelona, Istanbul, London, Paris, Rome, and Stockholm. To assess whether the conceptual improvements of the HCI result in a more accurate rating of climatic suitability for tourism compared to the TCI, the ratings from both indices will be examined against available tourism demand data to evaluate validity in the marketplace. The findings from this study are discussed in the context of previous TCI-based analyses of the spatial and temporal impacts of climate change on tourism in Europe, empirically demonstrating that the use of the TCI should be discontinued.
2. Mieczkowski’s Tourism Climate Index
The motivations for evaluating the climatic suitability of a destination for tourism are diverse and useful for a number of applications, serving as an important decision-making tool for both tourists and the tourism industry (see [
18] and [
30] for an overview). Given the multifaceted nature of weather and the complex way climatic variables interact to give meaning for tourism, indices have long been favoured for this task [
45,
51]. Indices are particularly valuable because they allow the integrated effects of a range of climatic variables to be quantified, facilitating an interpretation and rating of climatic conditions at a destination. Another advantage of indices is that they enable the climate of tourism destinations to be objectively compared and are therefore a convenient and more conceptually sound means to assess possible impacts of climate change on the distribution of climatic resources worldwide.
Climate indices for tourism initially evolved from indices developed in the health and agricultural sector (e.g., UV index, drought index) [
45,
51], with data provisions originating from the fields of biometeorology [
47]. The first attempt to develop a numerical index for evaluating climates for tourism purposes was the Tourism Climate Index (TCI) by Mieczkowski [
47]. The purpose of the TCI was to present a quantitative composite measure to evaluate the world’s climate for general tourism activities by integrating all climatic variables relevant to tourism into a single index. The TCI encompasses five weighted sub-indices:
daytime comfort index (CID), which is a combination of maximum daily temperature (°C) and minimum daily relative humidity (%);
daily comfort index (CIA), which is a combination of mean daily temperature (°C) and mean daily relative humidity (%);
precipitation (mm);
sunshine (hrs) and;
wind (km/h or m/s). The highest weight is given to the daytime comfort index (40%) to reflect the fact that tourists are most active during the day. The variables of sunshine and precipitation are given the second highest weight (20% each), followed by the daily comfort index (10%) and wind speed (10%). Each of the sub-indices is assigned a highest rating score of 5.0 to make the maximum score 100 (ideal for tourism) and the minimum score −30 (impossible for tourism) based on the calculated index (Equation (1)):
Since its development 25 years ago, the TCI has been by far the most widely applied index for assessing climate suitability for tourism [
20]. However, as previously noted, the index suffers from a number of limitations. The central weakness of the TCI is that the rating and weighting scheme of the sub-indices are subjectively based on Mieczkowski’s opinion and not empirically tested against the preferences of tourists or any other tourism performance metrics. The results from multiple stated preference surveys have revealed that urban tourists are more accepting of a broader range of climatic conditions than initially conceived by Mieczkowski (
Table 1).
Of particular concern with the rating and weighting system of the TCI is the over-emphasis on thermal comfort, which comprises half of the index’s weight (40% CID and 10% CIA). Within a broad range of moderate to non-extreme thermal conditions, other factors may assume relatively greater importance in determining the attractiveness rating of a given climatic condition [
54]. For example, a number of studies that have surveyed tourists directly have found the absence of rain to be more important than temperature conditions for a sightseeing holiday [
16,
21,
55]. Differences in the relative importance of climatic variables have also been recorded for other tourism environments [
5,
6,
49,
56], as well as between national samples [
57,
58]. Moreover, while the TCI was theoretically based on biometeorological literature on thermal comfort at the time (
i.e., early 1980s) [
47], increasing research has found that psychological factors, such as comfort expectations and perceived thermal control, significantly influence how thermal conditions are evaluated and that preferences for some tourist environments are unique. For example, research has empirically shown that people using outdoor spaces for leisure purposes accept thermal conditions that exceed physiological comfort, revealing thermal thresholds that exceed those used by Miezkowski [
22,
59,
60,
61,
62], which is supported by the higher temperature thresholds recorded in tourist surveys for urban holiday [
52,
53,
57].
The second major deficiency of the TCI is that it does not take into account the potential overriding effects of rain and wind. The total weighting of physical parameters in the TCI is 30% (20% rain, 10% wind), which effectively allows conditions that are physically impossible for tourism (e.g., severe storms) to still be rated as acceptable, good, or even very good. As such, the TCI’s rating scheme does not adequately reflect how poor physical conditions can dominate. Revealed preference studies (e.g., webcams) have also shown that precipitation can significantly deter tourism demand, both during and after the event [
63,
64].
The third major limitation of the TCI is the low temporal scale of the climatic variables used (
i.e., monthly averages). This time scale is largely insufficient for tourism purposes, as tourists react to the integrated effects of climatic conditions on a daily basis. Given that the TCI was developed during the pre-internet era, in which the availability of standardized climatic data was much more difficult to obtain, this limitation is understandable. Despite the fact that daily climate data is now widely available, studies continue to apply the TCI using monthly data [
34,
35,
36,
37,
65,
66,
67]. The use of daily resolution data is important for all climatic variables, but particularly precipitation and wind. Tourists not only want to know the amount of rain in a given month, but also the occurrence (probability) and intensity of rainfall or wind speeds.
Fourth, the TCI was designed to represent all tourism segments, when climatic requirements have been empirically demonstrated to vary significantly across major tourism environments (e.g., beach, urban, and winter sports tourism) [
5,
6,
21,
36,
49,
50]. Scott
et al. [
20] therefore concluded that optimal and unacceptable climatic conditions, such as a universal ideal temperature for tourism, cannot be empirically identified and therefore a single index for tourism is neither appropriate nor theoretically sound.
To overcome some of the aforementioned deficiencies of the TCI, Morgan
et al. [
32] developed the Beach Climate Index (BCI) and de Freitas
et al. [
45] developed the Climate Index for Tourism (CIT). However, both the BCI and CIT are designed for the 3S (sun, sea and sand) tourism segment and not for general leisure tourist activities. These two indices have also had limited empirical testing (
i.e., both are based on results from a single survey sample). Yu
et al. [
68] modified the TCI to develop a Modified Climate Index for Tourism (MCIT) using climatic data from more than 50 years in the US states of Florida and Alaska. The index used hourly observations on temperature and wind, as well as added two new variables deemed relevant to tourism in these study areas (visibility and ‘significant’ weather event data). However, the MCIT did not make use of the available literature on tourists’ preferences to develop the variable rating scales and relative weighting of climatic variables or to determine if the added variables were considered salient to tourist decision making. Moving forward, the design principles of the Holiday Climate Index (HCI) overcome all of these limitations.
3. Design of the Holiday Climate Index (HCI)
Unlike the TCI, the HCI was designed to be specified for major tourism segments and destination types. This paper focuses on the HCI:Urban, which rates urban tourism (see Scott
et al. [
69] for HCI:Beach specifications). Another major advancement of the HCI is that its variable rating scales and the component weighting system were designed based on the available literature on tourist climatic preferences that have been obtained from a range of surveys over the last ten years (
Table 1). This overcomes the main criticisms of the TCI, as the design of the HCI is not subjective, but rather the HCI is empirically validated in the tourist market place. As the body of stated preference research increases, it will be imperative to continue incorporating these findings to further refine and validate the HCI.
The HCI incorporates all three facets [
54] of climate important to leisure tourism activities:
thermal comfort (TC), which is a combination of daily maximum temperature (°C) and mean relative humidity (%);
aesthetic (A) (cloud cover %); and
physical (P), which is a combination of precipitation (mm) and wind speed (km/h). The combined HCI: Urban index is calculated using Equation (2):
Each climatic variable is rated on a scale from 0 to 10, with an overall HCI:Urban index score of 0 (potentially dangerous for tourists) to 100 (ideal for tourism), which corresponds with the descriptive categories ascribed to the TCI (see
Table 2). An ideal rating signifies that all three facets are within the range of conditions most preferred by the majority of tourists. Excellent and very good categories can still have some facets within the range of conditions ranked highest by the majority of tourists. HCI scores of less than 40 represent conditions that were deemed unacceptable to the majority of tourists. The HCI does not define any condition as ‘impossible’ for tourism, as some tourists actively seek out adverse weather conditions (e.g., high winds for wind surfing, storm watching,
etc.). It instead defines the lowest category as dangerous for tourists, because to achieve scores this low, dangerous thermal conditions (heat/cold stress, very high winds, or high precipitation) must occur. These types of conditions rarely last for more than one or two days at a destination.
Of the four weighted sub-indices, the physical facet (precipitation and wind) is given equal weight (40%) to thermal comfort (40%) (Equation (2)). This ensures that a high HCI score cannot be achieved when the physical index rating is low, as poor physical climatic conditions override pleasant thermal and aesthetic conditions [
63,
64,
70]. This equal weighting also reduces the emphasis on thermal comfort, which is less important when physical climatic variables dominate. For comparison to TCI, here the thermal comfort component of the HCI uses effective temperature, which is a combination of air temperature and relative humidity. However, the HCI can utilize other measures of thermal comfort such as the humidex or universal thermal climate index. The HCI: Urban eliminates evening temperature (a sub-index of the TCI) to reflect that in the 30 years since the TCI was developed, air conditioning has become almost universal in tourist accommodations in developed countries and major tourism destinations in developing countries. As such, evening temperatures are much less relevant to sleeping comfort. Daytime temperatures instead serve as a reasonable proxy for early evening conditions so that high daily thermal comfort scores reflect thermal comfort throughout the majority of the time when tourism activities take place. By comparing the thermal comfort rating of the HCI:Urban with the TCI (
Table 3), the greatest difference occurs at categories of extreme hot (>34 °C) and extreme cold (<−5 °C), with the remaining categories fairly consistent. These HCI:Urban ratings are more reflective of the stated higher thermal tolerance of leisure tourists (
Table 1).
For the aesthetic facet, the HCI: Urban uses percentage of cloud cover as a variable instead of hours of sunshine (used by the TCI) because the latter data is not widely available from standard meteorological stations. Similar to thermal comfort, the greatest rating difference between the two indices is evident at the highest and lowest score (
Table 4). The TCI gives the highest score when there are more than 10 hours of sunshine, and rating scores become lower with the decreased hours of sunshine. The highest rating score of the HCI:Urban aesthetic scheme reflects tourist preferences obtained from surveys (
Table 1), which indicates that most tourists prefer 11%–20% cloud cover as an ‘ideal’ aesthetic experience for urban tourism instead of clear sky (0% cloud cover). For the lowest rating of the aesthetic facet, the TCI assigns a score of 0 to daily sunshine hours less than one hour, whereas survey results from the literature reveal that tourists are accepting of all cloud cover conditions (
i.e., even 100% cloud cover), and, therefore, there is no score of 0 in the HCI scale.
For precipitation, there are significant differences in the ratings of the two indices because the HCI:Urban takes into account reported impacts of precipitation on holiday experience. Since the TCI utilizes mean monthly amount of precipitation (mm) and the HCI utilizes daily amounts, Miezkowski’s rating system has been converted to a daily amount by dividing each rating category by 30 to allow for comparison between the two indices. This underscores the limitation of using monthly data as it is unknown if the rain is evenly distributed across the month (e.g., frequent light rain) or concentrated in short/intense events that tourists can more readily adapt to [
27]. As shown in
Table 5, with the exception of the lowest amount of daily precipitation (0–0.49 mm), the HCI assigns a higher score for all other amounts up to >25 mm. In the rating of daily precipitation less than 3 mm, the HCI gives a score of 9, whereas the TCI assigns scores ranging from 5 to 9. The biggest rating difference occurs when daily precipitation ranges from 3 to 5 mm. The HCI gives a score of 8 to any daily rain amount within the range of 3 to 5 mm; the TCI, on the other hand, assigns a much lower score as only a 1 to 4 score was given to the same daily amount. Furthermore, the TCI considers any amount of daily precipitation higher than 5 mm as the most unfavorable condition for urban tourism activities, and a score of 0 is given. However, a score of 5 is assigned by the HCI to a daily rain amount of 6 to 8 mm. Only when a daily amount of precipitation is more than 12 mm is a score of 0 given by the HCI. At this higher intensity, precipitation also has an overriding effect in the HCI that it does not have in the TCI.
For wind, the TCI includes four separate rating systems, including normal, trade wind, hot climate and wind chill system to rate wind speed. The rationale of developing four rating systems for wind for the TCI is that the effects of wind on tourist thermal comfort level change with temperature. The four wind schemes are used separately for different temperature ranges. The normal system is used when mean daily maximum temperature is between 15–24 °C; the trade wind system is used when there is a high temperature of 24–33 °C; when temperature is higher than 33 °C, the hot climate system is adopted; in the situation of a wind chill in which temperature is lower than 15 °C and wind speed is faster than 8 km/h, the wind chill rating system is used. In contrast, the HCI uses one rating system for wind because tourists are more so influenced by the physical impacts of wind (e.g., blowing clothing and hair, disrupting outdoor dining and markets, blowing sand and other particles) than the differential impact of wind on thermal comfort [
22,
49,
70]. When comparing the TCI and HCI scores for wind, none of the four rating systems for the TCI are similar to the HCI ratings (
Table 6). When wind is primarily relevant to thermal comfort (e.g., wind chill), thermal ratings in both indices are already marginal. Similar to precipitation, disruptive strong winds also have an overriding effect in the HCI that the TCI does not contain.
4. Study Area and Climate Data
Europe was selected as the study region for this paper because of its primary importance as a global tourism destination, in addition to the availability of higher temporal resolution geospatial data required for current and future climate analysis. Within the 27 nations of the European Union, five cities covering a variety of temperate European climates, including dry and hot summers (Barcelona, Istanbul, Rome) and warm summers without a dry season (London, Paris), as well as one city with a cold (continental) climate (Stockholm), were selected for this study. These urban destinations also rank in the top 10 most visited cities in Europe (based on international tourism arrivals) [
71].
The dataset for present climate (1961–1990) and future climate change scenarios were obtained from the EU-funded project ENSEMBLES [
72]. This dataset was chosen for two key reasons. First, the aim of ENSEMBLES is to produce probabilistic climate projections for Europe across a range of temporal and spatial scales to help researchers, decision makers, businesses and the public with climate information. Second, the ENSEMBLES data is one of the biggest downscaled climate change datasets available, and it is currently the standard for climate change scenarios for impact studies in Western Europe. The Research Theme 2B (RT2B) is one of the ENSEMBLE project’s 10 interlinked Research Themes (RTs) and was used for this study. The purpose of the RT2B is to: “construct probabilistic high-resolution regional climate scenarios using dynamical and statistical downscaling methods to add value to the model output from RT1 and RT2A and to exploit the full potential of the Regional Climate Models (RCMs) developed in RT3” [
72]. For the climate change analysis, the Global Climate Model (GCM) ECHAM5 is combined with Regional Climate Models (RCMs) to generate daily climate data in four time periods: the 1970s (1961–1990), 2020s (2010–2030), 2050s (2040–2069), and 2080s (2070–2099), under the A1B greenhouse gas (GHG) emission scenario from the IPCC Special Report on Emissions Scenarios [
73]. The RCMs use a 25 km horizontal grid-length resolution that covers all of Europe. The use of this higher resolution RCM based scenario is also an important improvement over previous TCI based climate change impact studies that utilized coarse scale GCMs, as it better reflects local physiology of the region (e.g., elevation, bodies of water).
5. Results
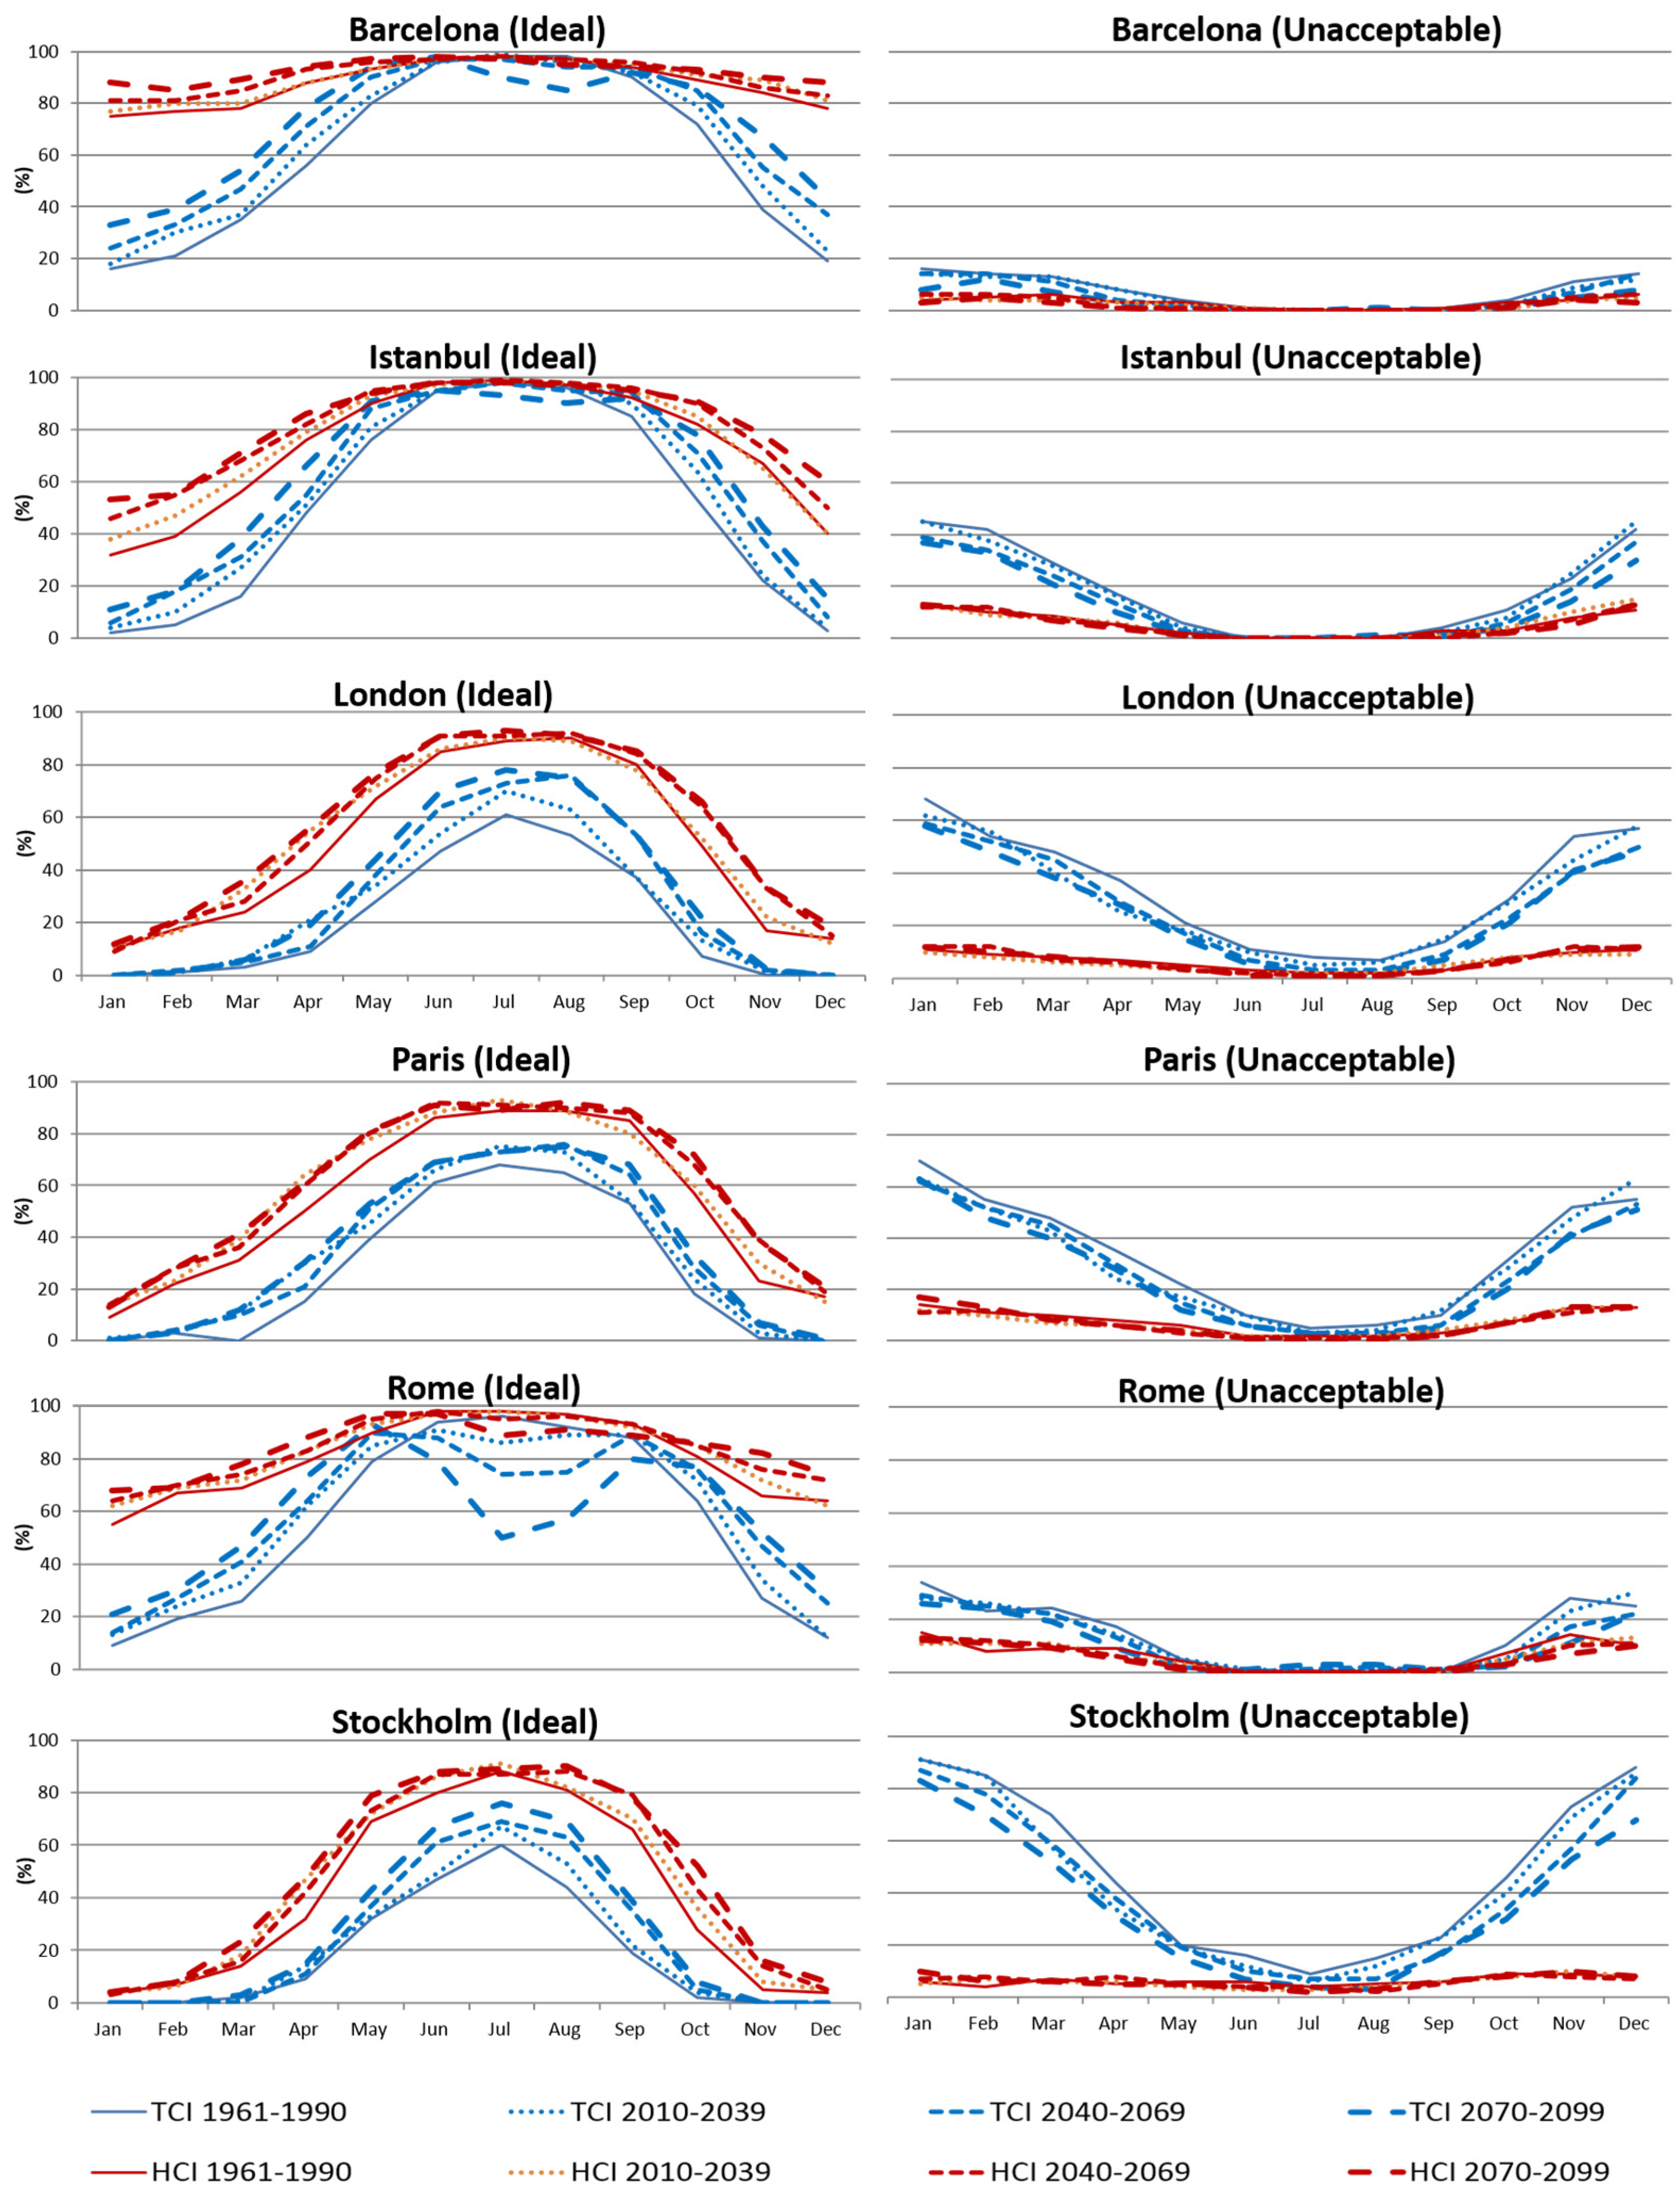
To assess the climatic suitability of Barcelona, Istanbul, London, Paris, Rome, and Stockholm for an urban holiday, mean monthly HCI:Urban and TCI scores were calculated and compared (
Figure 1). The monthly probability (%) was obtained by calculating how many times daily index scores in the ideal and unacceptable categories occurred for the six city destinations. An ideal climate for urban tourism is defined as days with scores of 90–100 and unacceptable climatic conditions are defined as days with scores of <40.
Under current climatic conditions (1961–1990), all six of the city destinations have a well-defined ‘summer peak’ climate resource distributions [
20], whereby ideal conditions occur mid-year during the summer months of June, July, and August and are lowest during the winter months of December, January and February. The rating difference between the HCI:Urban and TCI is smallest during this summer peak, with Barcelona, Istanbul and Rome all scoring similarly high with both indices, but with slightly higher HCI:Urban ratings for Paris, London and Stockholm compared to the TCI. The higher HCI:Urban ratings also result in a less prominent summer peak across all six city destinations, as the majority (>50%) of the shoulder months (e.g., May, September, October) are also considered climatically ideal for urban tourism—which is not the case for TCI. In Barcelona, there is virtually no summer peak evident with the HCI (
i.e., Barcelona is rated as ideal all-year-round), which is very different from the TCI scores. For example, using the TCI, <40% of November–March are rated as ideal
versus ≥75% with HCI:Urban. In addition to more frequent ideal conditions with the HCI:Urban, there are also fewer days considered unacceptable for urban tourism. The greatest gap in rating scores between the two indices occurs during the winter season, particularly for the urban destinations in higher latitudes, such as Stockholm, Paris and London. For example, in Stockholm, 91% of January would be considered unacceptable for urban tourism using the TCI
versus just 5% with the HCI: Urban. This very high unacceptable frequency of the TCI does not match tourism demand observations.
For the six European city destinations, climate change is projected to increase the number of days with ideal conditions for urban tourism when rated with the HCI:Urban (
Figure 1). The greatest HCI:Urban score improvements are projected by the end of the century (2080s) during the winter months in Istanbul (≥20% score increase November–January), Rome (16% in November and ≥10% December–January) and Barcelona (≥10% December–January), with improvements also recorded in Stockholm for much of the shoulder seasons (24% October, ≥10% April–May and September–October). In sharp contrast, the TCI projects a decrease in ideal conditions across half of the destinations examined. While London, Paris and Stockholm are projected to improve throughout the year when calculated with the TCI, Rome is projected to have a decrease in ideal summer conditions by as early as the 2020s (−10% in July), as well as a decrease in ideal summer conditions by the end of the century (2080s) in Barcelona (−13% August, −8% July) and Istanbul (−5% July–August). The decrease in ideal conditions projected by the TCI changes Rome, Barcelona, and Istanbul from a ‘peak summer’ to a ‘biomodal shoulder peak’ tourism resource distribution, with ideal conditions only occurring outside of the summer months in April to May and September to October.
In addition to higher ideal ratings by the HCI:Urban under projected climate change, there are also fewer months rated as unacceptable for urban tourism compared to TCI ratings. However, it is important to note that, unlike the TCI, climate change is projected to have little impact on unacceptable conditions, with limited or no change in HCI:Urban ratings throughout the 21st century. The opposite is projected with the TCI, as the number of months considered unacceptable for urban tourism decreases for all six European city destinations. The one exception is Rome, which is projected to have a slight increase (3%) in unacceptable conditions during July and August by the 2080s. Nevertheless, the HCI:Urban rates fewer months as unacceptable for urban tourism compared to the TCI for all three future time periods (2020s, 2050s, 2080s).
To assess whether the conceptual improvements of the HCI: Urban result in a more accurate rating of climatic suitability for tourism compared to the TCI, the ratings from both indices are examined against available tourism demand data to evaluate validity in the marketplace. It is recognized that climate is only one of the key determinants of tourist travel decisions, with other well established non-climate factors that influence holiday type and destination choice (e.g., motives, benefits sought, attitudes, budget, time, cognitive distance, prior experience) [
74,
75,
76,
77]. Nevertheless, it is helpful to compare actual visitation patterns to climatic ratings to better understand the relative merits of the two indices.
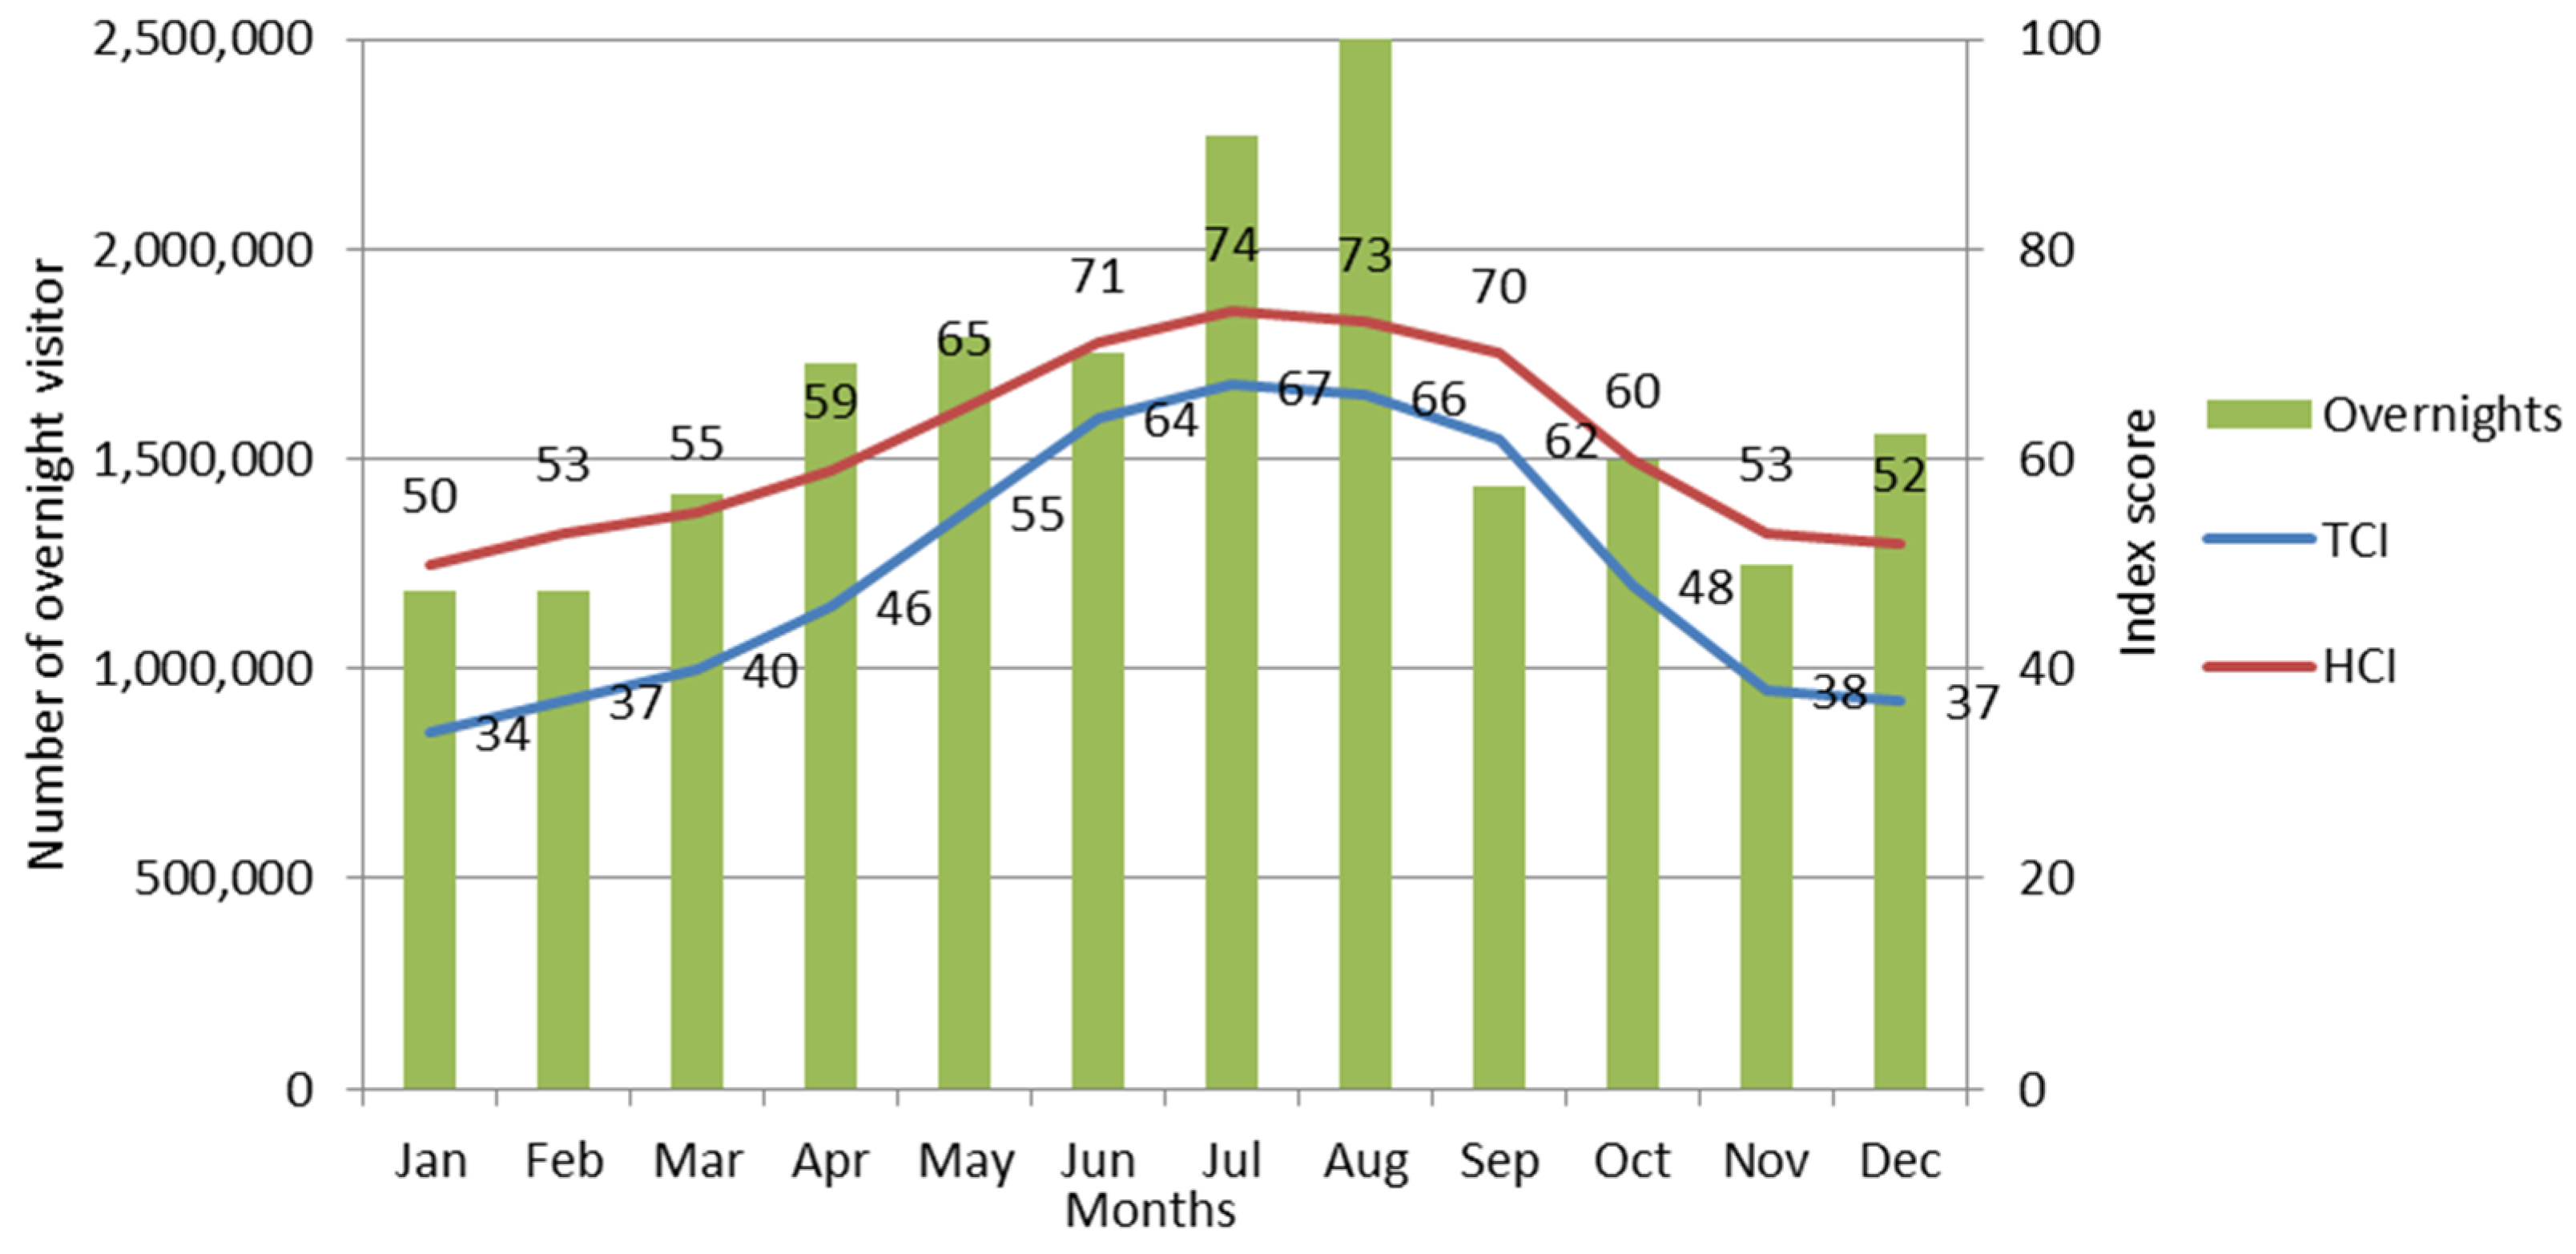
Both the TCI and HCI: Urban mean monthly scores were compared with monthly tourist arrivals from 2000 to 2010 staying at hotels in the most visited European city destination, Paris (France) (
Figure 2). Similar city scale monthly data were not available for other destinations. The seasonal variation in monthly overnights in Paris hotels reveals a similar summer peak trend displayed by both TCI and HCI: Urban ratings, but display major differences during the winter months. For example, the HCI ratings show that climatic conditions in December, January and February can still be considered acceptable (50–59) for urban tourism, whereas the TCI indicates the climatic conditions are unsuitable (<40). The higher HCI: Urban rating more accurately captures the mean monthly visitation trends in Paris during the low season, which maintained a steady number of overnights (>1 million) during the cooler months. This implies that climatic conditions in the winter can be considered ‘acceptable’ for leisure tourism, which is reflected in the HCI: Urban ratings and not in the TCI ratings.
6. Discussion
The TCI is the most widely used tourism climate index for the assessment of climatic suitability for tourism, including widespread use to project the impacts of redistributed climatic resources on tourism demand as a result of climate change [
34,
35,
36,
37,
38,
39,
40,
65,
66,
67,
78,
79]. However, major deficiencies of the TCI have been widely cited [
5,
6,
19,
20,
30,
42,
43,
44,
45,
46,
54,
68], raising important concerns regarding the reliability and accuracy of these studies that have adopted the TCI in its original form or with only minor modifications.
The key deficiencies of the TCI include: (1) the subjectivity in index weighting and rating systems; (2) over-concentration on the thermal component and absence of an overriding effect of physical variables; (3) low temporal resolution; and (4) tourism wide application without recognition of specific climatic requirements of different major tourism segments. In turn, many scholars have underscored the need to develop a new climate index for tourism [
20,
43,
45,
54,
63,
68,
80]. Specifically, de Freitas
et al. [
45] stated that a newly developed index should adhere to six essential elements: be theoretically sound, integrate the effects of thermal, physical and aesthetic climatic variables, be simple to calculate, be easy to use and understand, recognize the overriding effect of certain weather conditions, and be empirically tested. The newly developed HCI was designed to both overcome the limited deficiencies of the TCI and meet each of these six recommended elements of a tourism climate index.
First, the HCI is theoretically sound, integrating all three facets of climate that are relevant to tourists’ holiday experience based on empirical findings of tourists’ stated climatic preferences (
Table 1). The HCI is also simple to calculate, requiring only standard meteorological data that is readily available from national climate datasets. The index is also easy to use and understand, with a simple rating system (0–100) and an associated descriptor of climatic conditions (impossible–ideal) that ascribe to the recognisable system of the TCI. The HCI also recognizes the overriding effect of physical weather parameters (precipitation and wind), and, in its urban specification, the HCI assigns equal weight (40%) to thermal comfort, such that an overall rating declines rapidly when severe physical conditions (e.g., high winds, storms) persist. The HCI was also empirically tested, comparing mean monthly HCI scores with overnight hotel visits in Paris, revealing rating scores that are more reflective of tourists’ climatic preferences for a city destination
versus the TCI. Additional validation against tourism performance metrics is encouraged, including visitor satisfaction.
When the HCI was compared with the TCI in assessing current climatic conditions for six of the top-visited city destinations in Europe, HCI:Urban ratings were consistently higher year-round, with more frequent ideal conditions and fewer months identified as unacceptable for urban tourism. Seasonally, a major disagreement between the two indices exists in the rating of winter climate conditions. This difference is particularly prominent in the higher latitude destinations (London, Paris, Stockholm). The structural design of the two indices (
i.e., the weighting and rating of the climate variables) is the cause for this rating difference, particularly the difference in the thermal comfort sub-index. Both the TCI and HCI:Urban adopt effective temperatures for the thermal facet, but the TCI gives half of its total weighting (50%) to thermal comfort, making it the most important factor in determining climatic suitability of an urban destination for tourism. However, survey results have consistently found other factors to assume relatively greater importance in determining the pleasantness rating of a given climatic condition [
5,
6,
16,
21,
36,
49,
54,
55], thereby reducing the importance of thermal comfort and assigning greater importance to physical parameters. Moreover, empirical studies of thermal comfort have found that people using outdoor spaces for leisure purposes accept thermal conditions that exceed normal indoor physiological comfort thresholds [
22,
59,
60,
61,
62], which is also supported by the broader range of temperature conditions that tourists state are acceptable for an urban holiday [
52,
53,
57].
Future climatic conditions for the 2020s (2010–2039), 2050s (2040–2069) and 2080s (2070–2099) were also explored, with the HCI:Urban similarly rating each of the six destinations higher year-round versus the TCI. While both indices project an overall increase in ideal climatic conditions during spring, fall and winter seasons, by as early as the 2020s, Rome is projected to have a decrease in ideal summer conditions using the TCI, followed by Barcelona and Istanbul by the end of the century. None of these decreases were projected with the HCI:Urban. The TCI also projects an increase in unacceptable summer conditions in Rome, which is also not supported by the HCI:Urban. Similar to the current climatic conditions, the greatest rating differences between the HCI:Urban and TCI occur during the winter months, with fewer months rated as unacceptable by the HCI: Urban.
Overall, the findings from this study have important implications for the demand response of tourists to climate change. Unlike studies that have used the TCI to examine the impacts of climate change for tourism demand, the HCI:Urban does not support the contention that summer conditions in Southern Europe will significantly and rapidly deteriorate in the future. This finding is in keeping with observed and stated preference studies that have similarly questioned a pronounced shift in tourism climate resources away from sub-tropical and tropical destinations [
5,
6,
22,
46,
62,
64].
This study marks a starting point for index comparison research, with more efforts needed to apply HCI specifications in other geographic and climatically diverse locations. While stated preference research is growing, it remains unclear whether and to what degree differences exist across study samples (e.g., by market segment, age or place of origin), requiring additional research to expound existing differences [
46]. Further research is also needed to compare HCI ratings with observed visitation patterns at the city or attraction scale in order to test the validity with tourists and tourism industry performance indicators. As research on tourists’ stated preferences continues to advance, it will also be important to incorporate this growing body of literature into other HCI specifications. While the HCI specification applied in this paper was developed for sightseeing and other general tourism activities in urban destinations, future studies may seek to apply and validate beach specifications set out by Scott
et al. (2015) or design specifications for other major tourism segments like winter sports tourism, golf tourism or mountaineering.
7. Conclusions
This paper proposes a new climate index for tourism: the Holiday Climate Index (HCI). The HCI overcomes the main limitations of the widely used Mieczkowski Tourism Climate Index (TCI): the index is founded on stated tourist climate preferences, it takes the overriding influence of rain and wind into account, it uses daily data to estimate the probability of decision relevant conditions, and it is tailored to specific tourism segments. Given that the specific conditions sought by tourists are the foundation of the HCI:Urban design, it is a more robust representation of urban tourists perceptions and experiences, with the results empirically demonstrating that the use of the TCI should be discontinued.
Focusing on urban tourism, the paper illustrates the considerable difference between HCI and TCI scores. HCI scores are consistently higher than TCI scores, and do not echo the detrimental effects of climate change on summer conditions projected for southern European destinations by TCI-based studies. While the HCI:Urban does provide evidence that climatic conditions will improve in Northern and Continental Europe, Southern Europe will continue to have the most ideal conditions, with higher year-round ratings, including the summer season for decades to come. It is therefore uncertain whether the improved conditions in the northern latitudes will be significant enough to enhance their competiveness relative to the currently popular Mediterranean region.


