Article

Water-Soluble Ionic Composition of Aerosols at Urban Location in the Foothills of Himalaya, Pokhara Valley, Nepal

1
State Key Laboratory of Cryospheric Sciences, Northwest Institute of Eco-Environment and Resources, Chinese Academy of Sciences, Lanzhou 730000, China
2
Laboratory of Green Chemistry, Lappeenranta University of Technology, Sammonkatu 12, FI-50130 Mikkeli, Finland
3
Himalayan Environment Research Institute (HERI), 44602 Kathmandu, Nepal
4
CAS Center for Excellence in Tibetan Plateau Earth Sciences, Chinese Academy of Sciences, Beijing 100101, China
5
Key Laboratory of Tibetan Environment Changes and Land Surface Processes, Institute of Tibetan Plateau Research, Chinese, Academy of Sciences, Beijing 100101, China
*
Author to whom correspondence should be addressed.
Atmosphere 2016, 7(8), 102; https://doi.org/10.3390/atmos7080102
Submission received: 21 June 2016 / Revised: 28 July 2016 / Accepted: 29 July 2016 / Published: 5 August 2016

Abstract

:
The total suspended particulate (TSP) samples were collected from April 2013 to April 2014 at the urban location of Pokhara valley in western Nepal. The major aims were to study, quantify, and understand the concentrations and variations of TSP and major water-soluble inorganic ions (WSIIs) in the valley with limited data. The annual average TSP mass concentration was 135.50 ± 62.91 µg/m3. The average analyzed total WSIIs accounted for 14.4% of total TSP mass. Major anions and cations in TSP samples were SO42− and Ca2+, respectively. Seasonal differences in atmospheric conditions explain the clear seasonal variations of ions, with higher concentrations during pre-monsoon and winter and lower concentrations during the monsoon period. Neutralization factor calculations suggested that Ca2+ in the Pokhara valley mostly neutralizes the acidity in the atmosphere. Principle component analysis, NO3/SO42− ratio, and non-sea salt fraction calculations suggested that the WSIIs in the valley were mostly derived from anthropogenic activities and crustal mineral dust, which was also supported by the results from precipitation chemistry over the central Himalayas, Nepal. In addition, back trajectories analysis has suggested that the air pollution transported from and through Indo-Gangetic Plains (IGP) during the dry periods, which has resulted in high ionic loadings during this period. Average NO3/SO42− ratio was found to be 0.69, indicating the dominance of stationary sources of TSP in Pokhara valley. Secondary inorganic aerosols can have an adverse health impact on the human population in the valley. The data set from this one-year study provides new insights into the composition of WSIIs in the foothills of the Himalayas, which can be of great importance for understanding the atmospheric environment in the region.

Graphical Abstract

1. Introduction

Airborne particulate matter plays a vital role among their sources, transport, and deposition mechanisms of various pollutants in the atmosphere [1]. In addition, numerous atmospheric processes—including visibility differences and cloud formation—are highly influenced by atmospheric aerosols [2], and hence can affect Earth’s climate [3,4]. Moreover, studies on atmospheric aerosols are very important because of their effects on biogeochemical cycles and human and ecosystem health [5,6,7].
In the past decades, the urban air quality is getting widespread concern due to rapid industrialization, urbanization, and increasing populations, which are responsible for polluting the basic resources needed to sustain life [8,9]. There is a need for comprehensive knowledge of aerosol chemistry in the foothills of the Himalayas, where the data is limited, in order to assess the anthropogenic influences and sources of aerosols. So far, very few previous studies on aerosol inorganic composition have been carried out over the southern side of Himalayas, Nepal and most of the studies mainly focused on the higher Himalayas, for example Langtang, Nepal [10], Everest region [11], Dhaulagiri region of western Nepal [12], at the remote Himalayan site in the Everest region, and a rural Middle-Mountain site Jiri in Nepal [13], suggesting lower concentrations in the higher Himalayas. Nevertheless, the chemical composition of aerosols in an urban location at Kathmandu valley during the winter dry period was performed [14]; however, systematic long-term aerosol chemistry studies are still limited in the urban cities in Nepal. Therefore, this study will provide the dataset for major water-soluble ionic species in atmospheric aerosol for a yearlong period in the second largest valley in the foothills of the Himalayas, Pokhara valley, Nepal.
In this study, for the first time, total suspended particulate (TSP) samples were systematically collected for a year, from April 2013 to April 2014, at an urban residential area of the core city in the Pokhara valley with the aim of investigating the ambient suspended particles and related chemical composition with a focus on water-soluble inorganic ions. The results from this study are useful to extend the knowledge on major water-soluble ionic species of TSP in the urban Himalayan environment and their temporal distribution (variability) and differences depending on the sources.

2. Sampling and Analysis

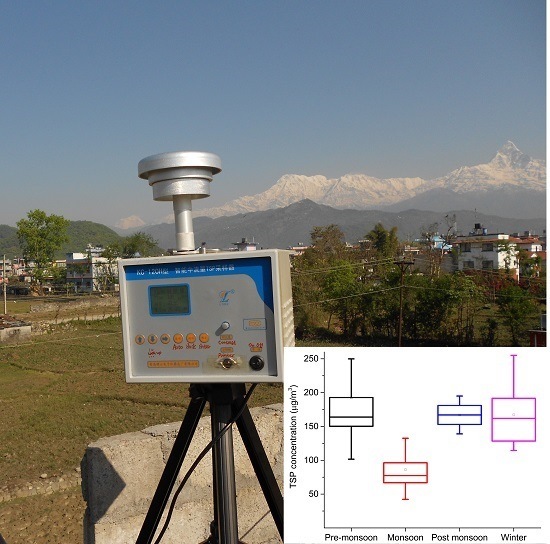
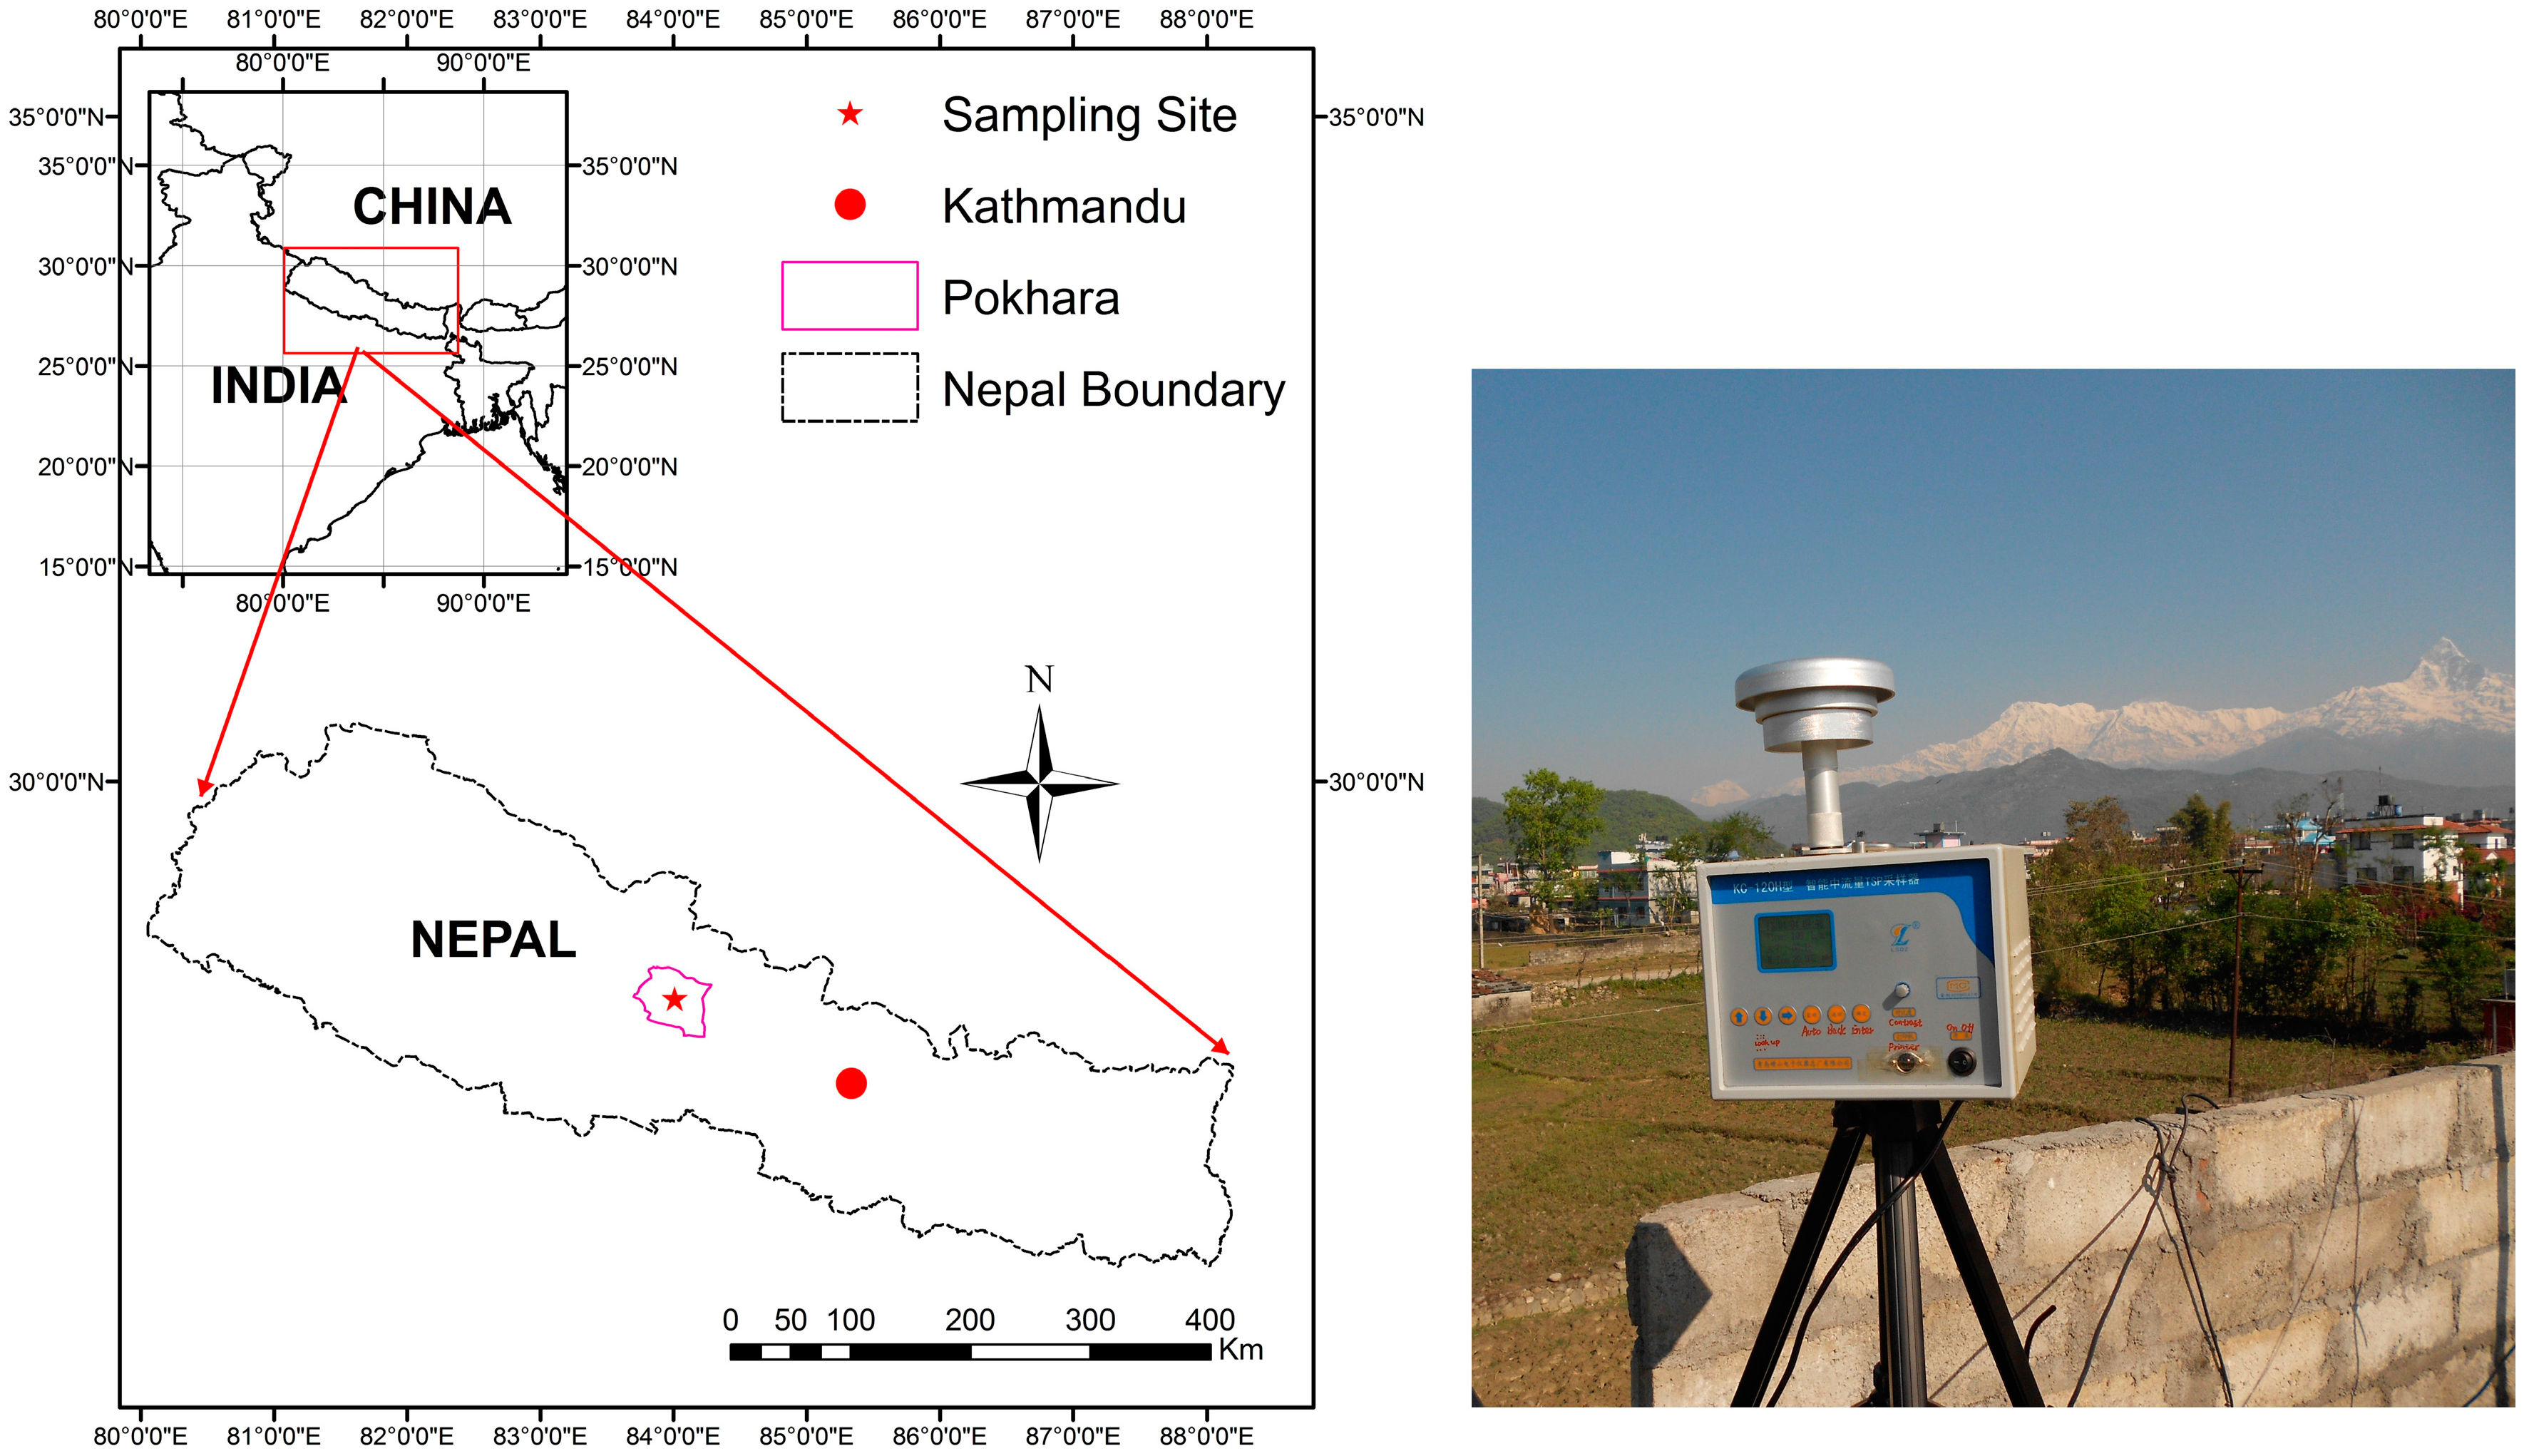
2.1. Overview of the Study Area

Pokhara is a sub-metropolitan urban city in the foothills of the Himalayas, Nepal that is one of the famous tourist destinations. About 250,000 tourists visited Pokhara during the year 2013. Pokhara is also the second biggest valley in Nepal after the Kathmandu valley (Capital of Nepal) and is about 200 km west of Kathmandu valley. The total area of Pokhara sub-metropolitan is 55.66 km2 with a population of about 350,000. TSP sampling was carried out at 28.18°N and 83.98°E with an altitude of 813 m a.s.l. on the rooftop of a residential building about 6 m high (Figure 1). Pokhara valley is located in the humid climatic zone and has one of the highest precipitation rates (about 3000 mm per year) in Nepal [15]. Summer is humid, with most rainfall occurring during the monsoon season (July–September). During winter and spring, the sky is generally clear and sunny [16]. However, the site is increasingly affected by haze transported from the Indo-Gangetic Plain (IGP), mostly during the dry periods as explained by prior studies [17,18] from the IGP site.

2.2. Sampling and Laboratory Analysis

For a yearlong period (April 2013–April 2014), a total of 69 TSP samples were collected weekly at the rooftop of a residential building about 6 m high. There were no samples collected during May 2013 due to a mechanical problem in the TSP. Medium-volume samplers (KC-120H, Qingdao Laoshan Applied Technology Institute, Qingdao City, China, flow rate: 100 L·min−1 at standard condition) was used for the sampling. Overall structural diagram of the sampler has been shown in Figure S1. The sampling duration for each sample was 24 h continuously (day and night time). Aerosols were collected using pre-weighed 90 mm diameter quartz filters (QM/A, Whatman plc, Maid-stone, UK), which were pre-combusted at 550 °C for 6 h. After the sampling, the filters were kept in the disc and wrapped with aluminum foil. All the samples were kept frozen until laboratory analysis. Field blank filter samples were obtained by placing the filter in the sampler without drawing the air. The collected filters’ weight was measured twice before and after sampling and the net accumulation mass was calculated as the difference between the pre- and post-sampling weight. The pre- and post-sampling weights of all quartz filters were measured with a microbalance, after equilibration at constant temperature and humidity (20 °C, 39%) for at least 24 h. For calculating the TSP mass concentration, the volume of air passing through each filter was converted into standard atmospheric condition by utilizing the atmospheric pressure and temperature measured at the site.
An aliquot of the filter (1.6 cm2) was extracted with 10 mL ultrapure water (18.2 MΩ/cm resistivity). Then the extract was sonicated for 30 min. The samples were shaken using a mechanical shaker for 1 h to completely extract the ionic compounds and the extracted solutions were filtrated with syringe-driven filters (Millex-GV PVDF, 0.22 µm; Millipore, Carrigtwohill City, Ireland) to remove the quartz fiber debris and other insoluble impurities. Then the water-soluble ionic components (Cl, SO42−, NO3, Ca2+, Na+, K+, Mg2+, and NH4+) were analyzed by ion chromatography (IC) systems at the State Key Laboratory of Cryospheric Sciences, Chinese Academy of Sciences. Five cations (Ca2+, Na+, K+, Mg2+, and NH4+) were analyzed using ICS-320 and three anions (Cl, SO42−, NO3) were analyzed using an ICS-1500 (Dionex; Sunnyvale, CA, USA). The details on laboratory analysis have been explained elsewhere [19]. The detection limit for cations and anions was 0.01 µg/m3 for all the measured ions. Field blank filters were subjected to similar extraction and preparation procedures as was done for the actual particulate sample filters.

2.3. Data Quality

Proper care was taken both during the collection and preservation of the samples until the analysis. Field blanks and duplicates for few samples were also analyzed. Concentrations measured in the field blanks were generally found to be lower than 10% of those in the TSP samples. Laboratory blanks and duplicate samples indicated that sample contamination during sample collection and transport was negligible. In addition, the strong correlation (r = 0.87, p < 0.001) between total equivalent cations and anions (µEq/m3) also supports the good data quality (Figure S2).

3. Results and Discussion

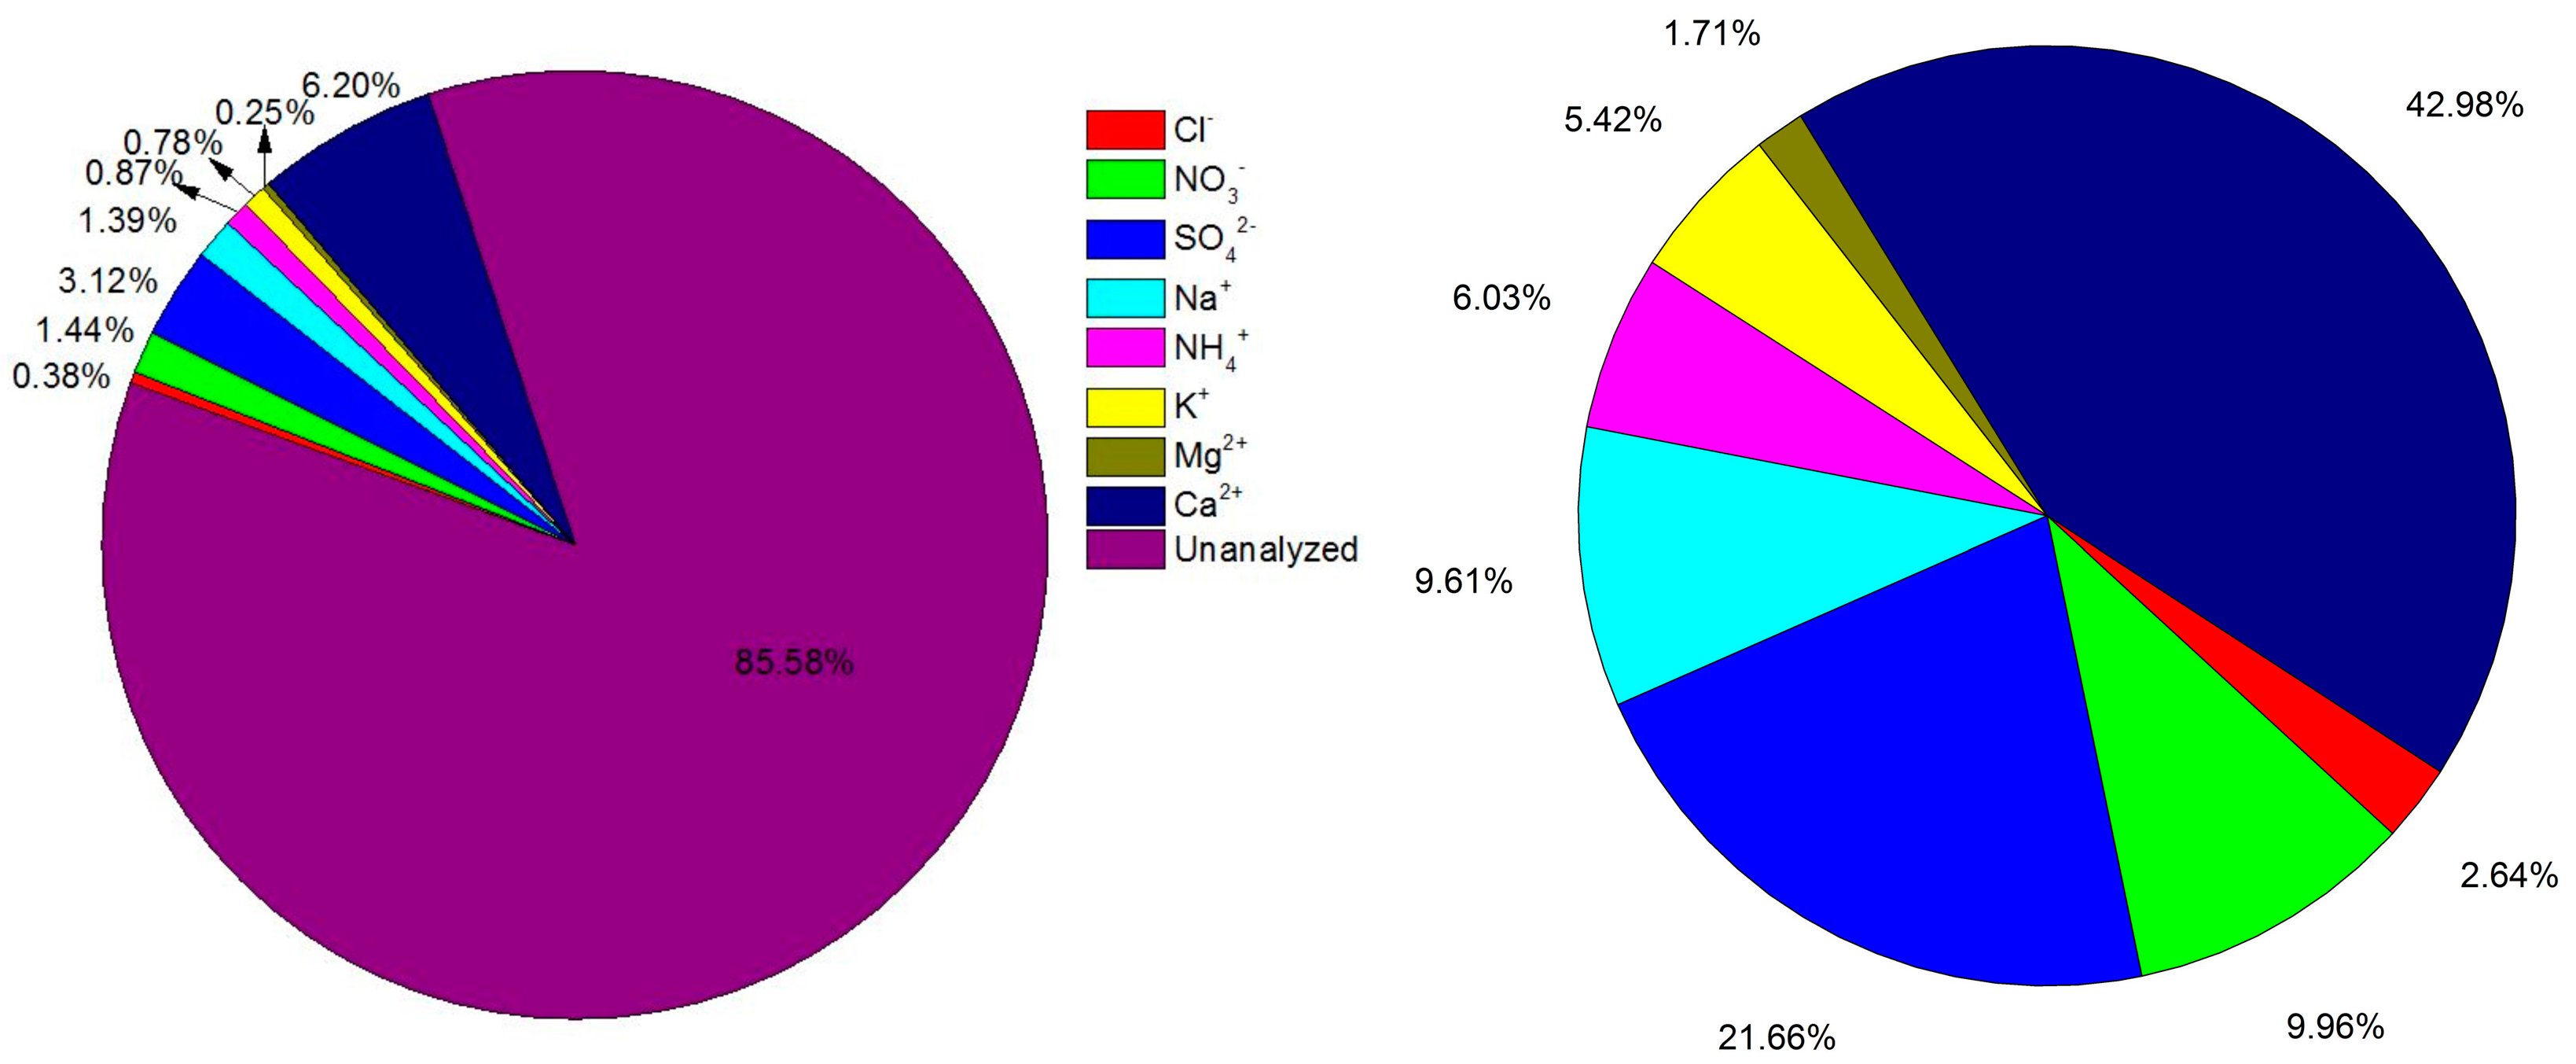
3.1. Summary of Concentrations of Aerosol Mass and Water-Soluble Inorganic Ions

The annual mean aerosol mass concentration is shown in Table 1. The annual arithmetic annual mean TSP-mass concentration was 135.50 ± 62.91 µg/m3, and it ranged between 42.26 and 355.02 µg/m3. These values are within the range of World Health Organizations (WHO) regulation limits (150–230 µg/m3) as presented in previous work [2]. In addition, the values of TSP mass concentration throughout the year have been presented in Figure S3, in which five analyzed samples exceeded the WHO regulation limits which were during pre-monsoon and winter. The TSP mass concentrations in Pokhara were found to be relatively lower than in a big city like Xi’an (200–400 µg/m3), north-west China [21], and comparable to Guiyang (153.55 µg/m3), south-west China [2].
The annual average concentrations of water-soluble inorganic ions (WSIIs) in TSP have been presented in Table 1 and mass percentage of ionic species in the Pokhara valley have been shown in Figure 2. Water-soluble inorganic ions ranged from 3.32 to 45.61 µg/m3 with an average of 19.54 µg/m3. The average analyzed WSIIs accounted for 14.4% of total TSP mass in the Pokhara valley. The dominant anion was SO42− followed by NO3 and Cl with average concentrations of 4.23, 1.94, and 0.51 µg/m3, respectively (Table 1). On average, SO42− and NO3 accounted for 21.7% and 9.9% of the total mass percentage of WSIIs analyzed in TSP, respectively (Figure 2). Previous studies have revealed that SO42− and NO3 in the atmosphere are formed by the oxidation of their gaseous precursors; SO2 and NOx, emitted from various anthropogenic sources [22,23].
The cations were found to be in the order Ca2+ > Na+ > NH4+ > K+ > Mg2+ in the Pokhara Valley. Mg2+ was found to have lower concentrations, with an average of 0.33 µg/m3. Ca2+ and NH4+ accounted for 42.98% and 6.03%, respectively, of total water-soluble inorganic ions analyzed in the Pokhara valley. Meanwhile, the rest of the cations (K+, Na+, and Mg2+) accounted for 16.74% of the total WSIIs analyzed (Figure 2). It is confirmed from this study that SO42−, NO3, NH4+, and Ca2+ are the major inorganic ions in the Pokhara valley.
WSIIs concentrations from this study were compared with the data from the neighboring cities of India and China and presented in Table 2. Concentrations of anthropogenic WSIIs SO42−, NO3, and NH4+ in Pokhara valley Nepal were lower than that in the big cities Agra, Raipur, Durg, and Delhi in India and Xian, Beijing and Wuhan in China. Such a result suggests heavy pollution in the Indian plains and East Asia. The concentration of NH4+ was lowest at our site compared to other cities in India and China (Table 2). Moreover, K+ concentration in Pokhara city was comparable to Raipur and Durg in India and Wuhan in China but was higher at other cities from IGP where biomass burning is common. In Pokhara, Mg2+ had the lowest concentration compared with the cities in India and China. In the case of Ca2+, the concentration at our site was higher than the cities in India but slightly lower than Xian and Beijing in China, suggesting higher loadings of calcium rich dust particles in the atmosphere in Pokhara than in the Indian cities.

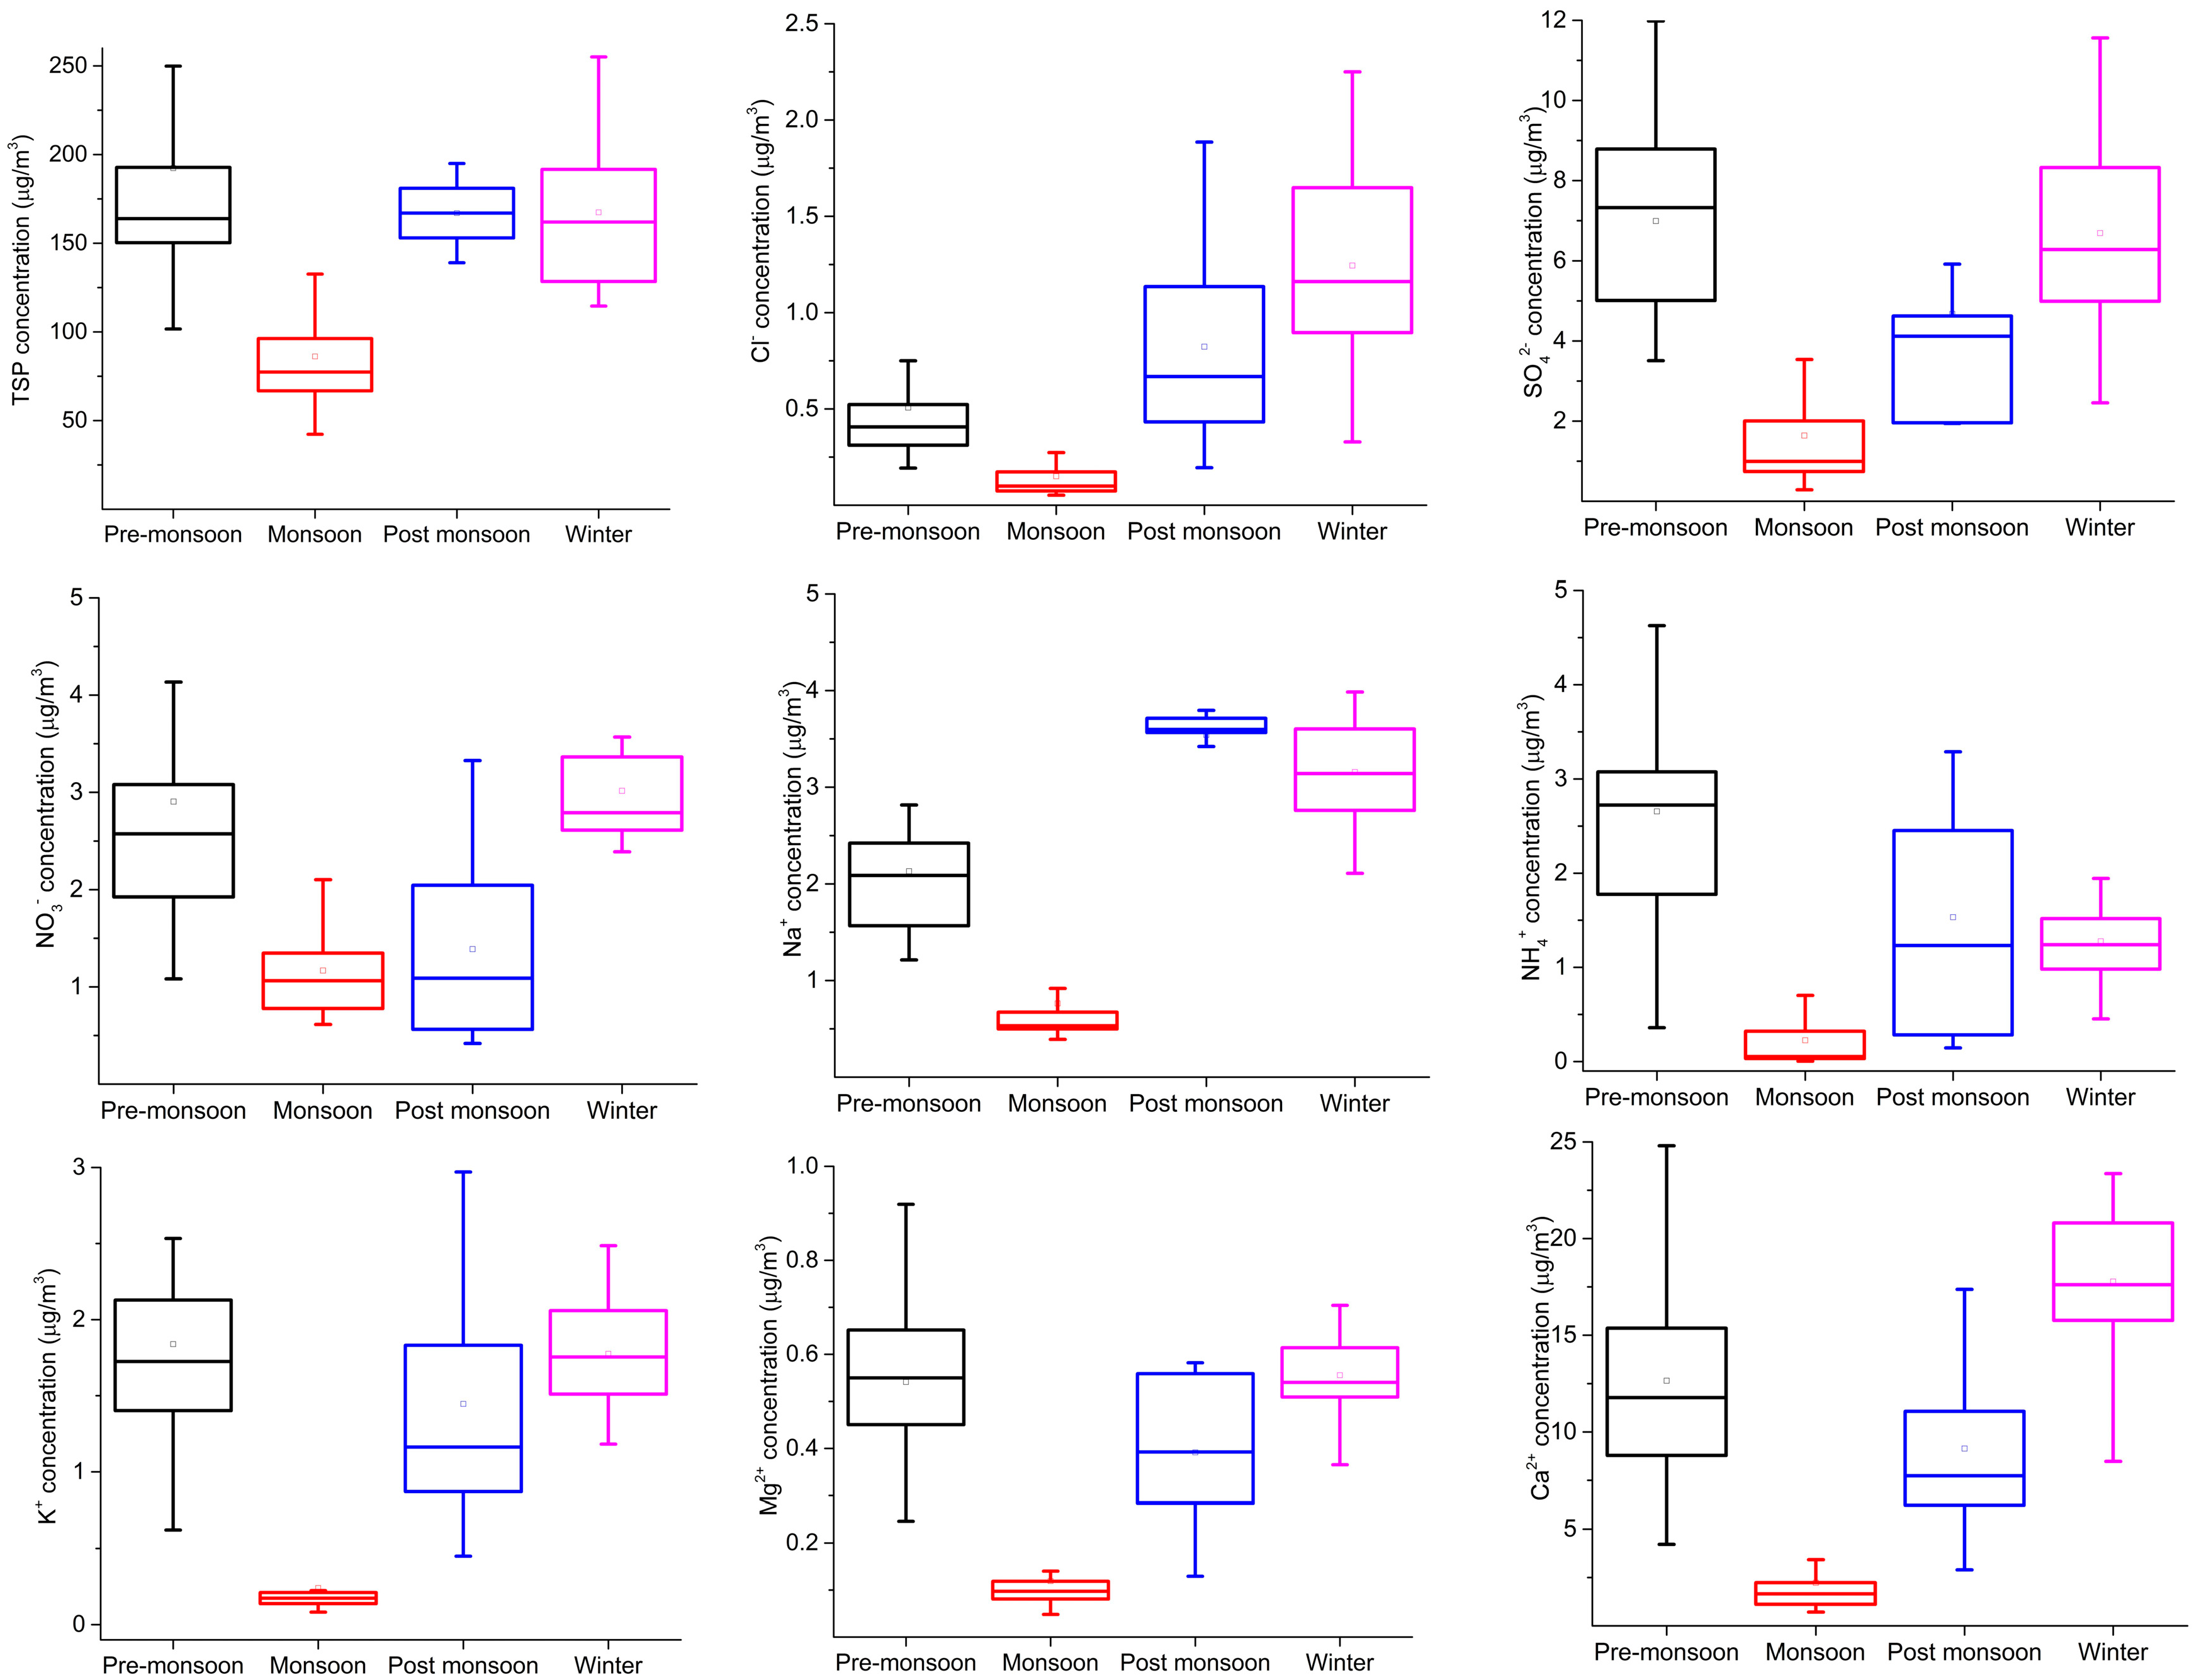
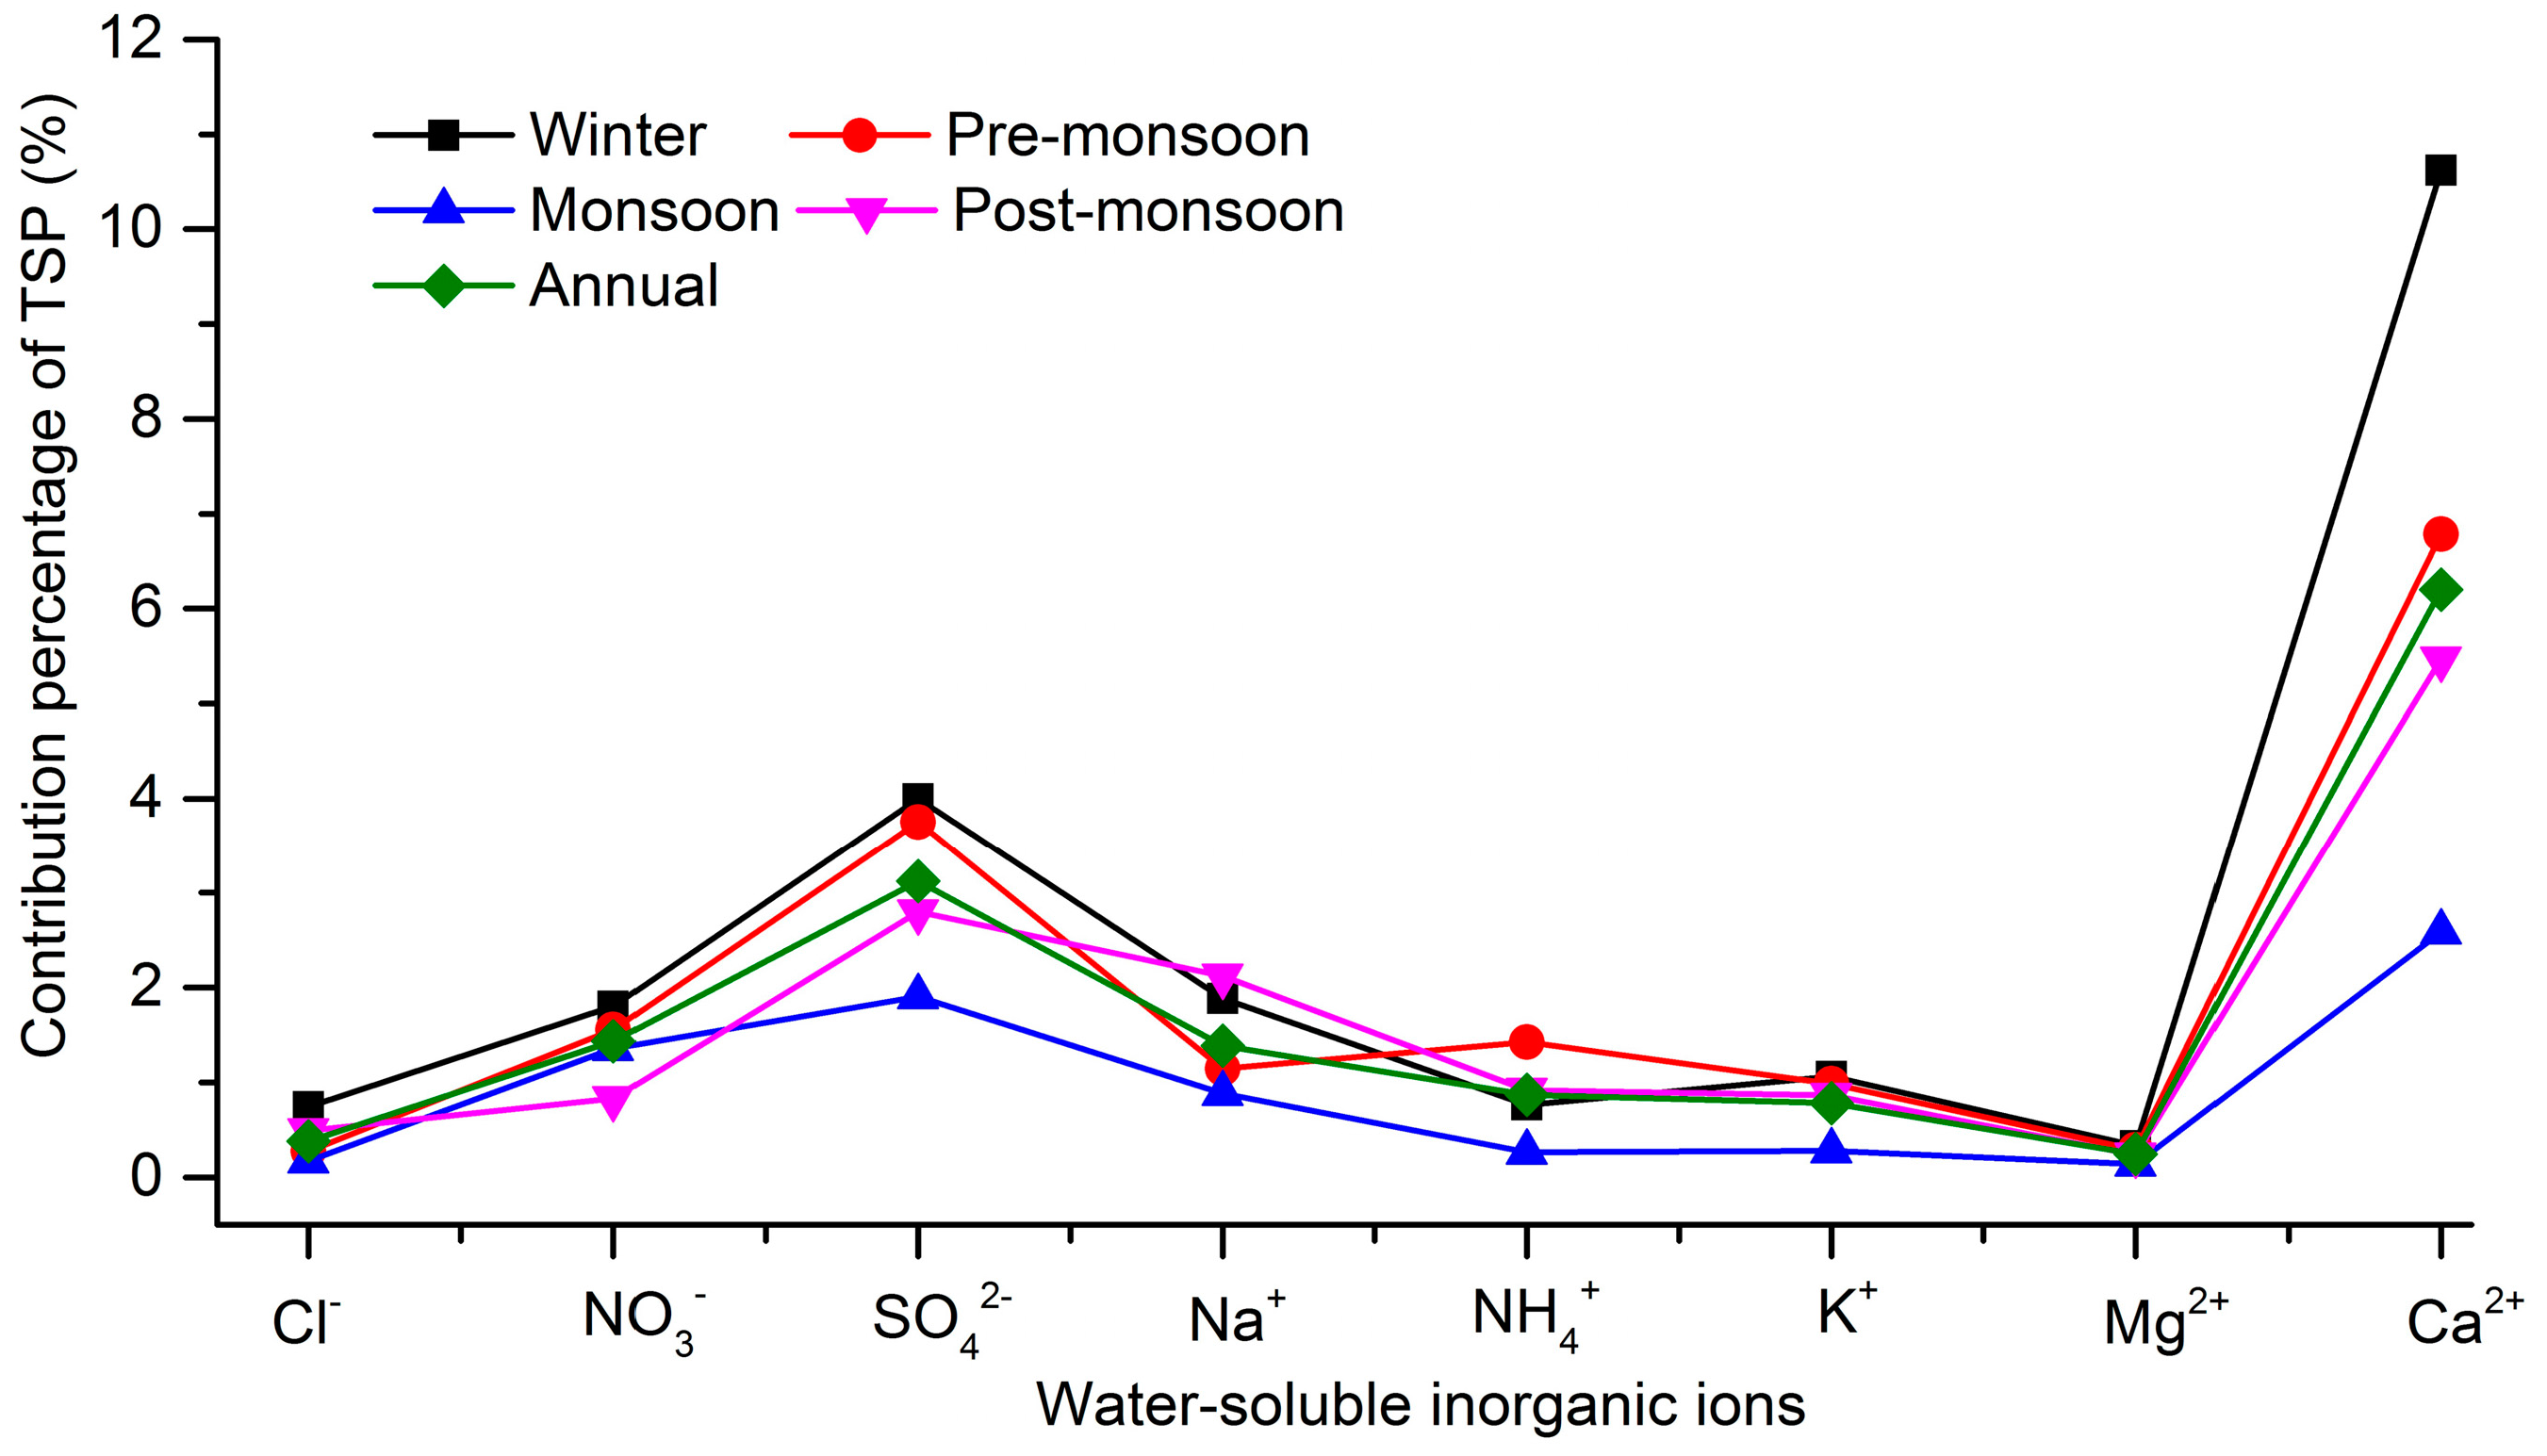
3.2. Seasonal Variations of TSP and Water-Soluble Inorganic Ions
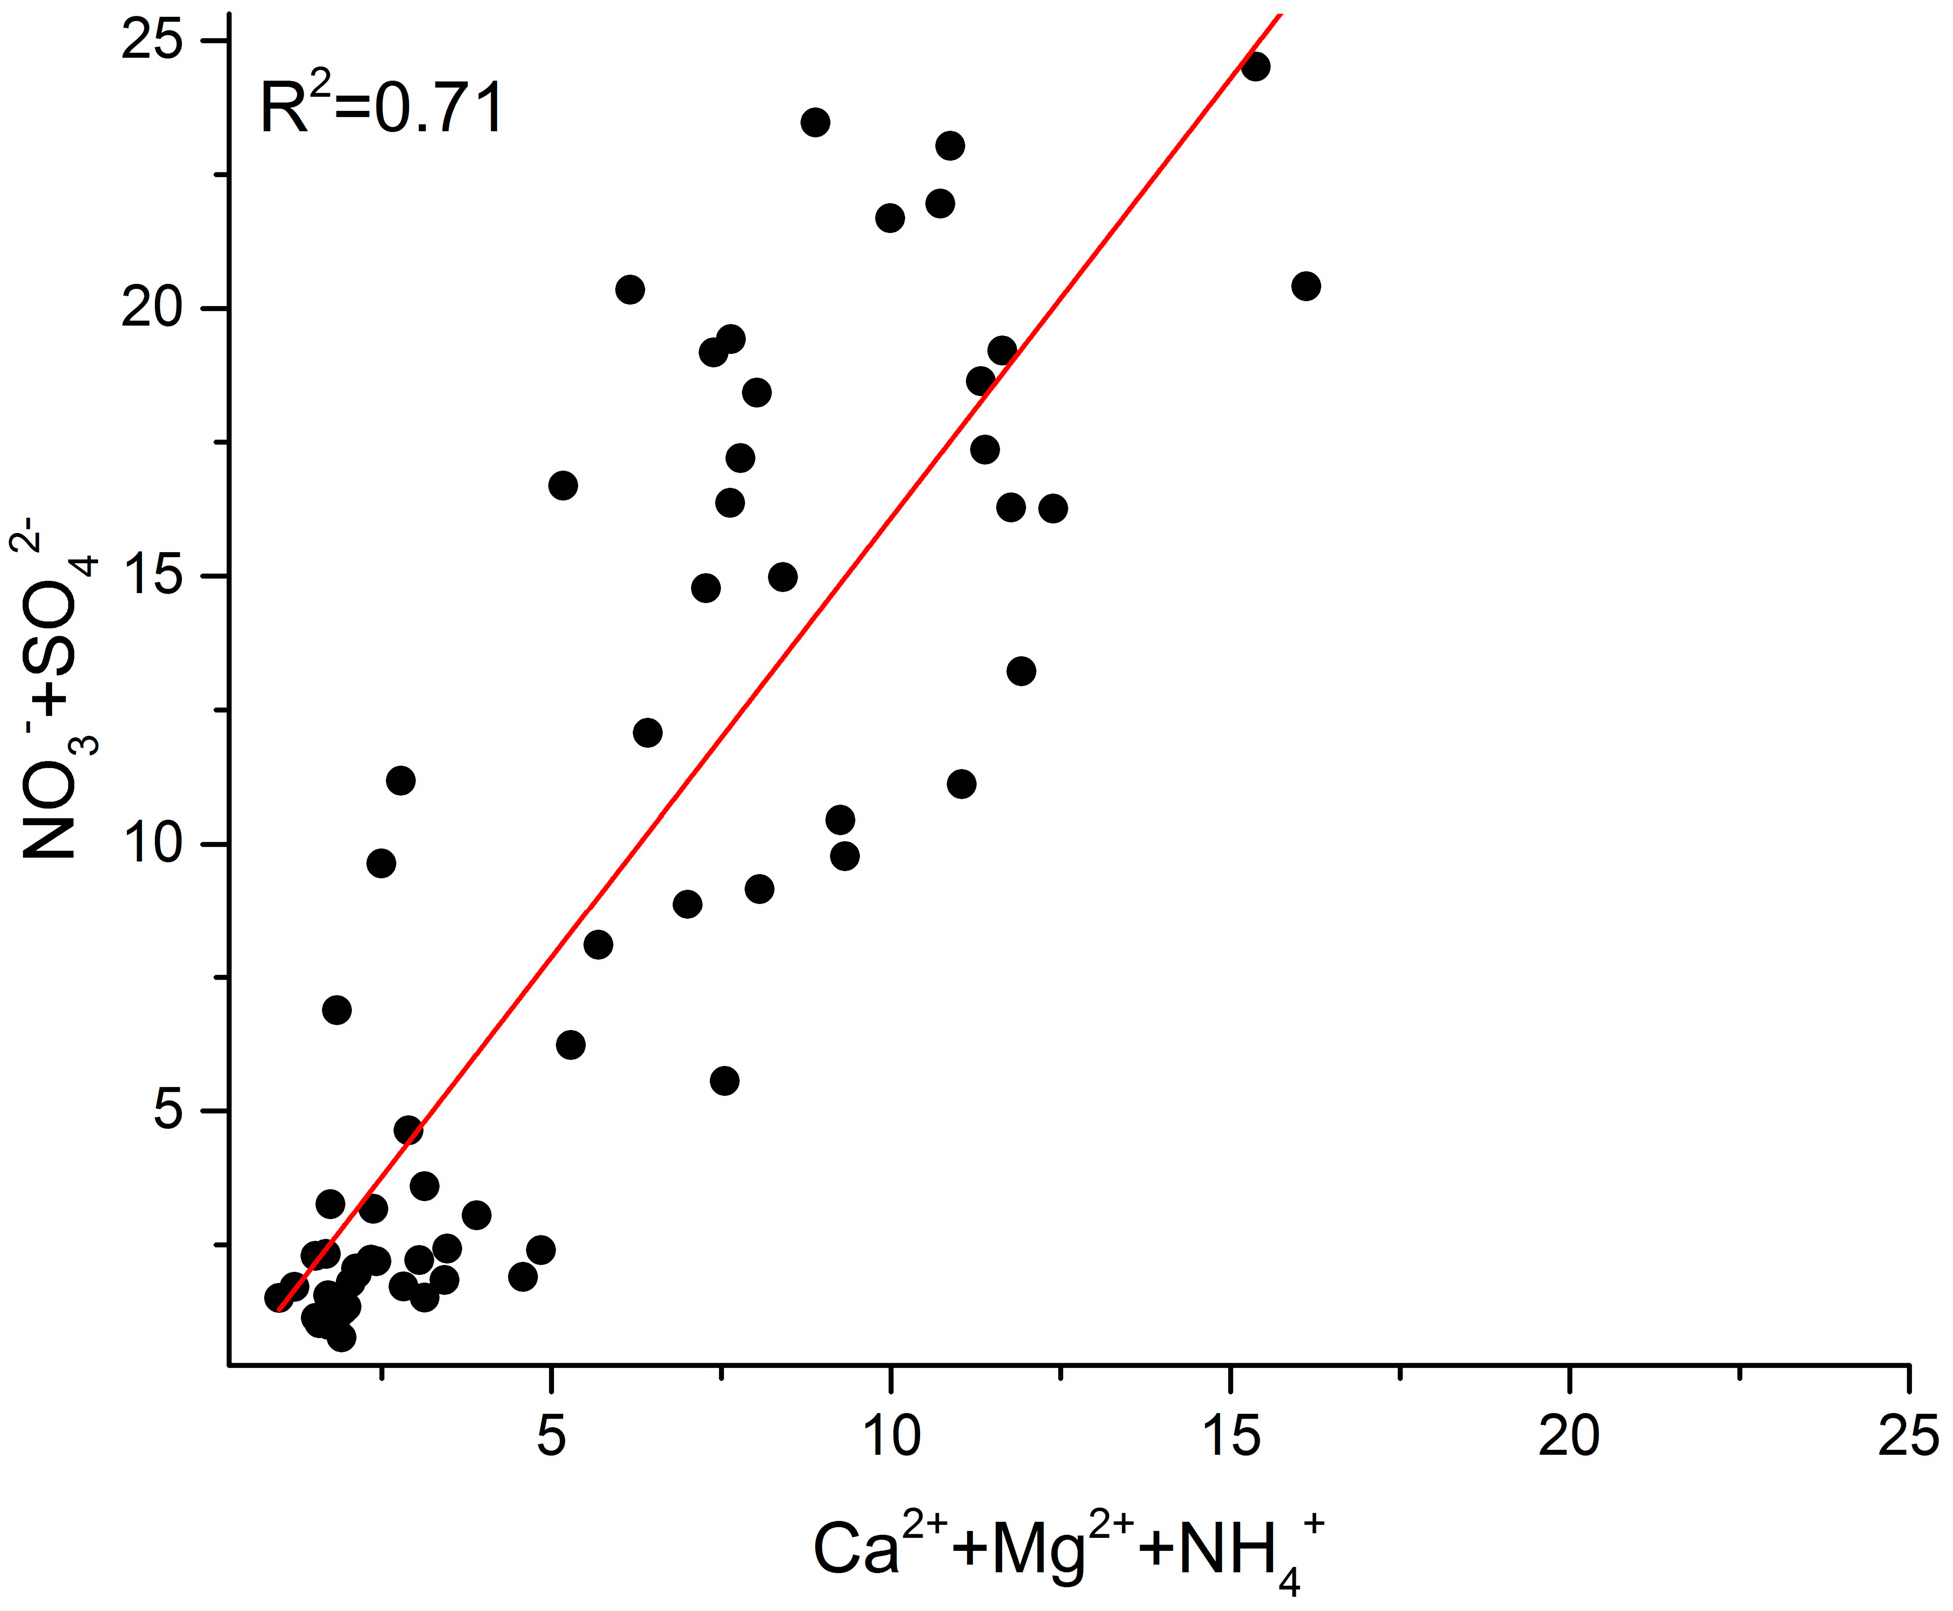
The TSP concentrations during pre-monsoon (March–May), monsoon (mid-June–September), post-monsoon (October and November), and winter (December–February) were 192.29, 86.11, 166.96, and 167.37 µg/m3, respectively, in the Pokhara valley. In comparison with the levels during monsoon, the aerosol levels in the pre-monsoon and winter were larger by about a factor of 2, suggesting a clear seasonality in the region. The seasonal variations of TSP and WSIIs are presented in Figure 3, which showed evidence of seasonal variation in mass concentrations of aerosols, and the WSIIs in the Pokhara valley. In addition, the seasonal variations for TSP and WSIIs for all the samples have been shown in Figure S3, which clearly shows the seasonality with lowest concentrations during monsoon. Influence of meteorological factors and different sources of emissions in different seasons may be responsible for the variation of the WSIIs. High concentrations for most of the ions (Ca2+, Mg2+, K+, NH4+, SO42−, and NO3) were observed during pre-monsoon and winter, suggesting higher loadings of anthropogenic and crustal ions in dry periods. Prior studies have suggested that westerlies prevail during non-monsoon seasons in Nepal that bring little precipitation and more aerosols, and during predominant westerlies, dust aerosols could be transported to Nepal from arid regions [10,23], which may be responsible for higher concentrations of crustal-derived aerosols. In addition, atmospheric brown cloud (ABC) builds up during the non-monsoon period and is observed to be concentrated around the Himalayas [23,28], which is responsible for loading higher concentrations of anthropogenic ions during this period. Moreover, during winter enhanced emissions from heating sources and stationary atmospheric conditions (e.g., low temperature, low wind speed, low mixing height) could also enhance the concentration of anthropogenic aerosols (e.g., SO42−, NO3, NH4+, Ca2+, and K+) in the atmosphere [24]. Furthermore, the shift from the gas phase of nitric acid to particle phase of nitrate is favored at low temperature, which might lead to high concentration of NO3 during winter season [8]. Meanwhile, about 2–3 fold lower concentrations of TSP mass and major ions observed during monsoon period was likely due to the higher precipitation (wet scavenging) amount that washes out aerosols [29].
Furthermore, the percentage contribution of mass concentration in TSP with the WSIIs at different seasons (pre-monsoon, monsoon, post-monsoon, and winter) has been presented in Figure 4. The proportion of concentration contribution of two main anions was of same order (SO42− (4%) > NO3 (1.8%)) during winter and pre-monsoon but was 2 times less (SO42− (1.8%) > NO3 (0.8%)) during monsoon, implying concentration values decreased during monsoon. The percentage contribution of Ca2+ was the highest of all the measured ions in TSP during all seasons, with a peak of 11% during winter and 7% during pre-monsoon, suggesting higher dust loadings during the dry period. It can be noted that higher mass percentage of TSP and WSIIs was during the non-monsoon period and lower during monsoon period, and more risk of atmospheric pollution during those dry periods at our sampling sites.

3.3. Ionic Balance

Ion balance method has been commonly used to understand the acid–base balance of the aerosol particles [7,30,31,32]. In order to calculate the cations/anion balance of TSP, the following equations were used:
C (cations micro Equivalents) = Na+/23 + NH4+/18 + K+/39 + Mg2+/12 + Ca2+/20
A (anion micro Equivalents) = Cl/35.5 + NO3/62 + SO42−/48
The ratios of the sum of equivalent concentrations of anions to cations (A/C) were used as an indicator to analyze the acidity of the different environments [7]. During the study period, A/C ratio varied between 0.1 and 0.68 with an average of 0.27 at our site indicating an alkaline environment. Meanwhile, the seasonal ratio (A/C ratio) followed the order of monsoon (0.37) > pre-monsoon (0.22) > winter (0.18) > post-monsoon (0.16), indicating the monsoon aerosols are comparatively less alkaline (more acidic) when comparing with other seasons. A previous study [7] has suggested that the same sample collected with TSP were found to have lower A/C ratios than PM2.5 samplers, which may be the reason for lower ratios of A/C at our sampling site. In addition, the difference in the ionic balance could be attributed to various air masses that arrived the sampling site via different regions throughout the year [31].
A strong correlation (r = 0.87, p < 0.001) was observed between ∑cations and ∑anions equivalent during the sampling period (Figure S2). The annual average equivalent ratio of total cations to total anions was found to be 4.58 (range: 1.48–11.50). However, lower values have been reported over the remote sites like Lulang and Mt. Bogda [31,33], suggesting the alkaline nature of aerosols at Pokhara compared to these sites. Anion deficiency was observed at the sampling site, which is more likely due to exclusion of HCO3 and non-determination of organic acid present in the samples [23].

3.4. Neutralization Factors

The oxidation of the gaseous precursors (SO2 and NOx) in the atmosphere produces SO42− and NO3 ions that are mainly neutralized by crustal aerosols (e.g., Ca2+ and Mg2+) and ammonia [24]. The correlation coefficient between the sum of anions (NO3 + SO42−) and cations (Ca2+ + NH4+ + Mg2+) is shown in Figure 5. The good correlation between their sums (R2 = 0.71), suggests that Ca2+, Mg2+, and NH4+ neutralize the acidity in TSP. Moreover, the equivalent ratios of NH4+/(NO3 + SO42−) were also calculated. If the ratio value is 1.0, it would indicate the neutralization of HNO3 and H2SO4 by NH4+ [34]. At our site, the average ratio in TSP was 0.16, which varied from 0.01 to 0.58, indicating that there could be cations other than NH4+ which neutralize acidity [34]. In addition, acid neutralization capacity of different cations can also be estimated by calculating the neutralization factors (NF). The calculation is based on the fact that, in aerosols, the major acidifying anions are SO42− and NO3 and the major acid neutralizing cations are Ca2+, NH4+, and Mg2+. NF was calculated from the following equations:
NF (Ca2+) = [Ca2+]/[SO42−] + 2 [NO3]
NF (Mg2+) = [Mg2+]/[SO42−] + 2 [NO3]
NF (NH4+) = [NH4+]/2 [SO42−] + [NO3]
The results of neutralization factors in Pokhara valley were NF (Ca2+) = 1.04, NF (NH4+) = 0.06, and NF (Mg2+) = 0.04, suggesting Ca2+ was the dominant acid neutralizing agent followed by NH4+ and Mg2+. However, from this result it can be noted that Mg2+ has a negligible role on acid neutralizing in Pokhara valley, and this result is supported by the neutralization factor in precipitation chemistry from the central Himalayas, Nepal [23].

3.5. Sources of Water-Soluble Inorganic Ions (WSIIs) in Pokhara Valley

3.5.1. Determination of Non-Sea Salt Aerosols

It is important to understand the sea salt and non-sea salt contributions of ionic species to evaluate their actual source contributions in the atmosphere. These calculations are based on the assumption that the chemical composition of the sea salt particle is same as that of seawater and the source of soluble Na+ in particulate samples is only from sea salts [32,35]. The non-sea salt (nss) fractions for SO42−, K+, Ca2+, and Mg2+ were calculated using the following equations:
nss-SO42− = [SO42−] − [Na+] × 0.2516
nss-K+ = [K+] − [Na+] × 0.037
nss-Ca2+ = [Ca2+] − [Na+] × 0.0385
nss-Mg2+ = [Mg2+] − [Na+] × 0.0370
The average nss-SO42−, nss-K+, nss-Ca2+, and nss-Mg2+ concentrations (non-sea salt percentage) at our site were 3.41 µg/m3 (80.6%), 0.94 µg/m3 (89.5%), 8.337 µg/m3 (99.4%), and 0.30 µg/m3 (90.9%), respectively. These results indicate that these ions were mostly from anthropogenic and crustal sources rather than from the sea source contribution. Furthermore, averages (sea salt percentages) for different seasons have been shown in Table S1. The highest percentage of sea salt contribution for sulfate (32.2%) and potassium (19.9%) was found during the monsoon period, which indicated monsoon brings the maximum amount of these ions. However, it is interesting to note that for ions like Ca2+ and Mg2+, no significant contribution (from sea salt) was observed at different seasons with less percentage, suggesting that these ions were mainly from natural crustal sources in the region.

3.5.2. Principal Component Analysis (PCA)

To investigate the possible sources of pollutants in the region, multivariate statistical method principal component analysis (PCA) can be significant [28,36]. For this study, PCA analysis for water-soluble ions in Pokhara was performed using SPSS 16.0 software and is presented in Table 3. Four PCs were obtained, indicating that these PCs have a significant influence on the air quality in Pokhara valley, Nepal. Factor 1 with 30.6% of the variance was loaded with Cl, Na+, and K+ with values of 0.82, 0.89, and 0.61, respectively, indicating the mixed dominance of sea salt aerosol and those from biomass burning origin. K+ is regarded as the tracer of biomass burning [8,22]; only 10.47% of K+ was from sea salt contributions according to the calculations of the non-sea salt fraction for this study. Therefore, at our site, the major source for the K+ is from biomass burning and this result is consistent with the previous study in the central Himalayas, Nepal [23]. Meanwhile, Factor 2 with 24.8% of variance had a high loading of NH4+, indicating its unique anthropogenic source from volatilization of animal manure and human excreta, agricultural activities, and natural loss by the plants [23,37]. Factor 3 with 23.0% of variance had high loadings of secondary aerosols SO42− and NO3 which were clearly from the anthropogenic emissions, mostly formed during the process of coal combustion and vehicular emissions. Finally, Factor 4 with 14.9% of the variance was dominated by high loadings of Mg2+ and Ca2+, for which the major sources are natural minerals and fugitive dust. This finding is consistent with the previous study of ionic composition in precipitation from the central Himalayas, Nepal [23].

3.5.3. Source Identification by NO3/SO42− Ratio

Emissions of nitrogen oxides from various mobile sources are an important contributor for particulate NO3 in the atmosphere [38]. Previous studies have suggested that the mass ratio of nitrate to sulfate ([NO3/SO42−]) can be used to evaluate the stationary (coal combustion, biomass burning) versus mobile (vehicular emissions) sources of sulfur and nitrogen in the atmosphere [27,38,39,40]. If the mass ratio of [NO3/SO42−] is >1, then it indicates the dominance of mobile source over the stationary sources [41]. Average nitrate to sulfate ratio in Pokhara was found to be 0.69 which indicates the dominance of stationary sources, which is lower than the ratio observed over Chinese cities like Hefei (1.10) [38] and comparable with a megacity like Beijing (0.71) [42] indicating the dominance of stationary source of pollution in these regions. Moreover, this ratio indicates the influence of sulfuric acid, reflecting the contribution of acidity in the atmosphere. Furthermore, a recent study from north-western Himalaya, India [43] suggested that the ratio of such acids >1 means free acidity due to nitric and hydrochloric acid. Meanwhile, seasonally the ratios were found in the order of monsoon (1.01) > winter (0.50) > pre-monsoon (0.43) > post-monsoon (0.31). This suggests the higher contribution of mobile compared to stationary source during the monsoon season. A recent study [23] also concluded the higher nitrate to sulfate ratio (>1) in precipitation from central Himalayas, Nepal during monsoon season compared to the non-monsoon season.

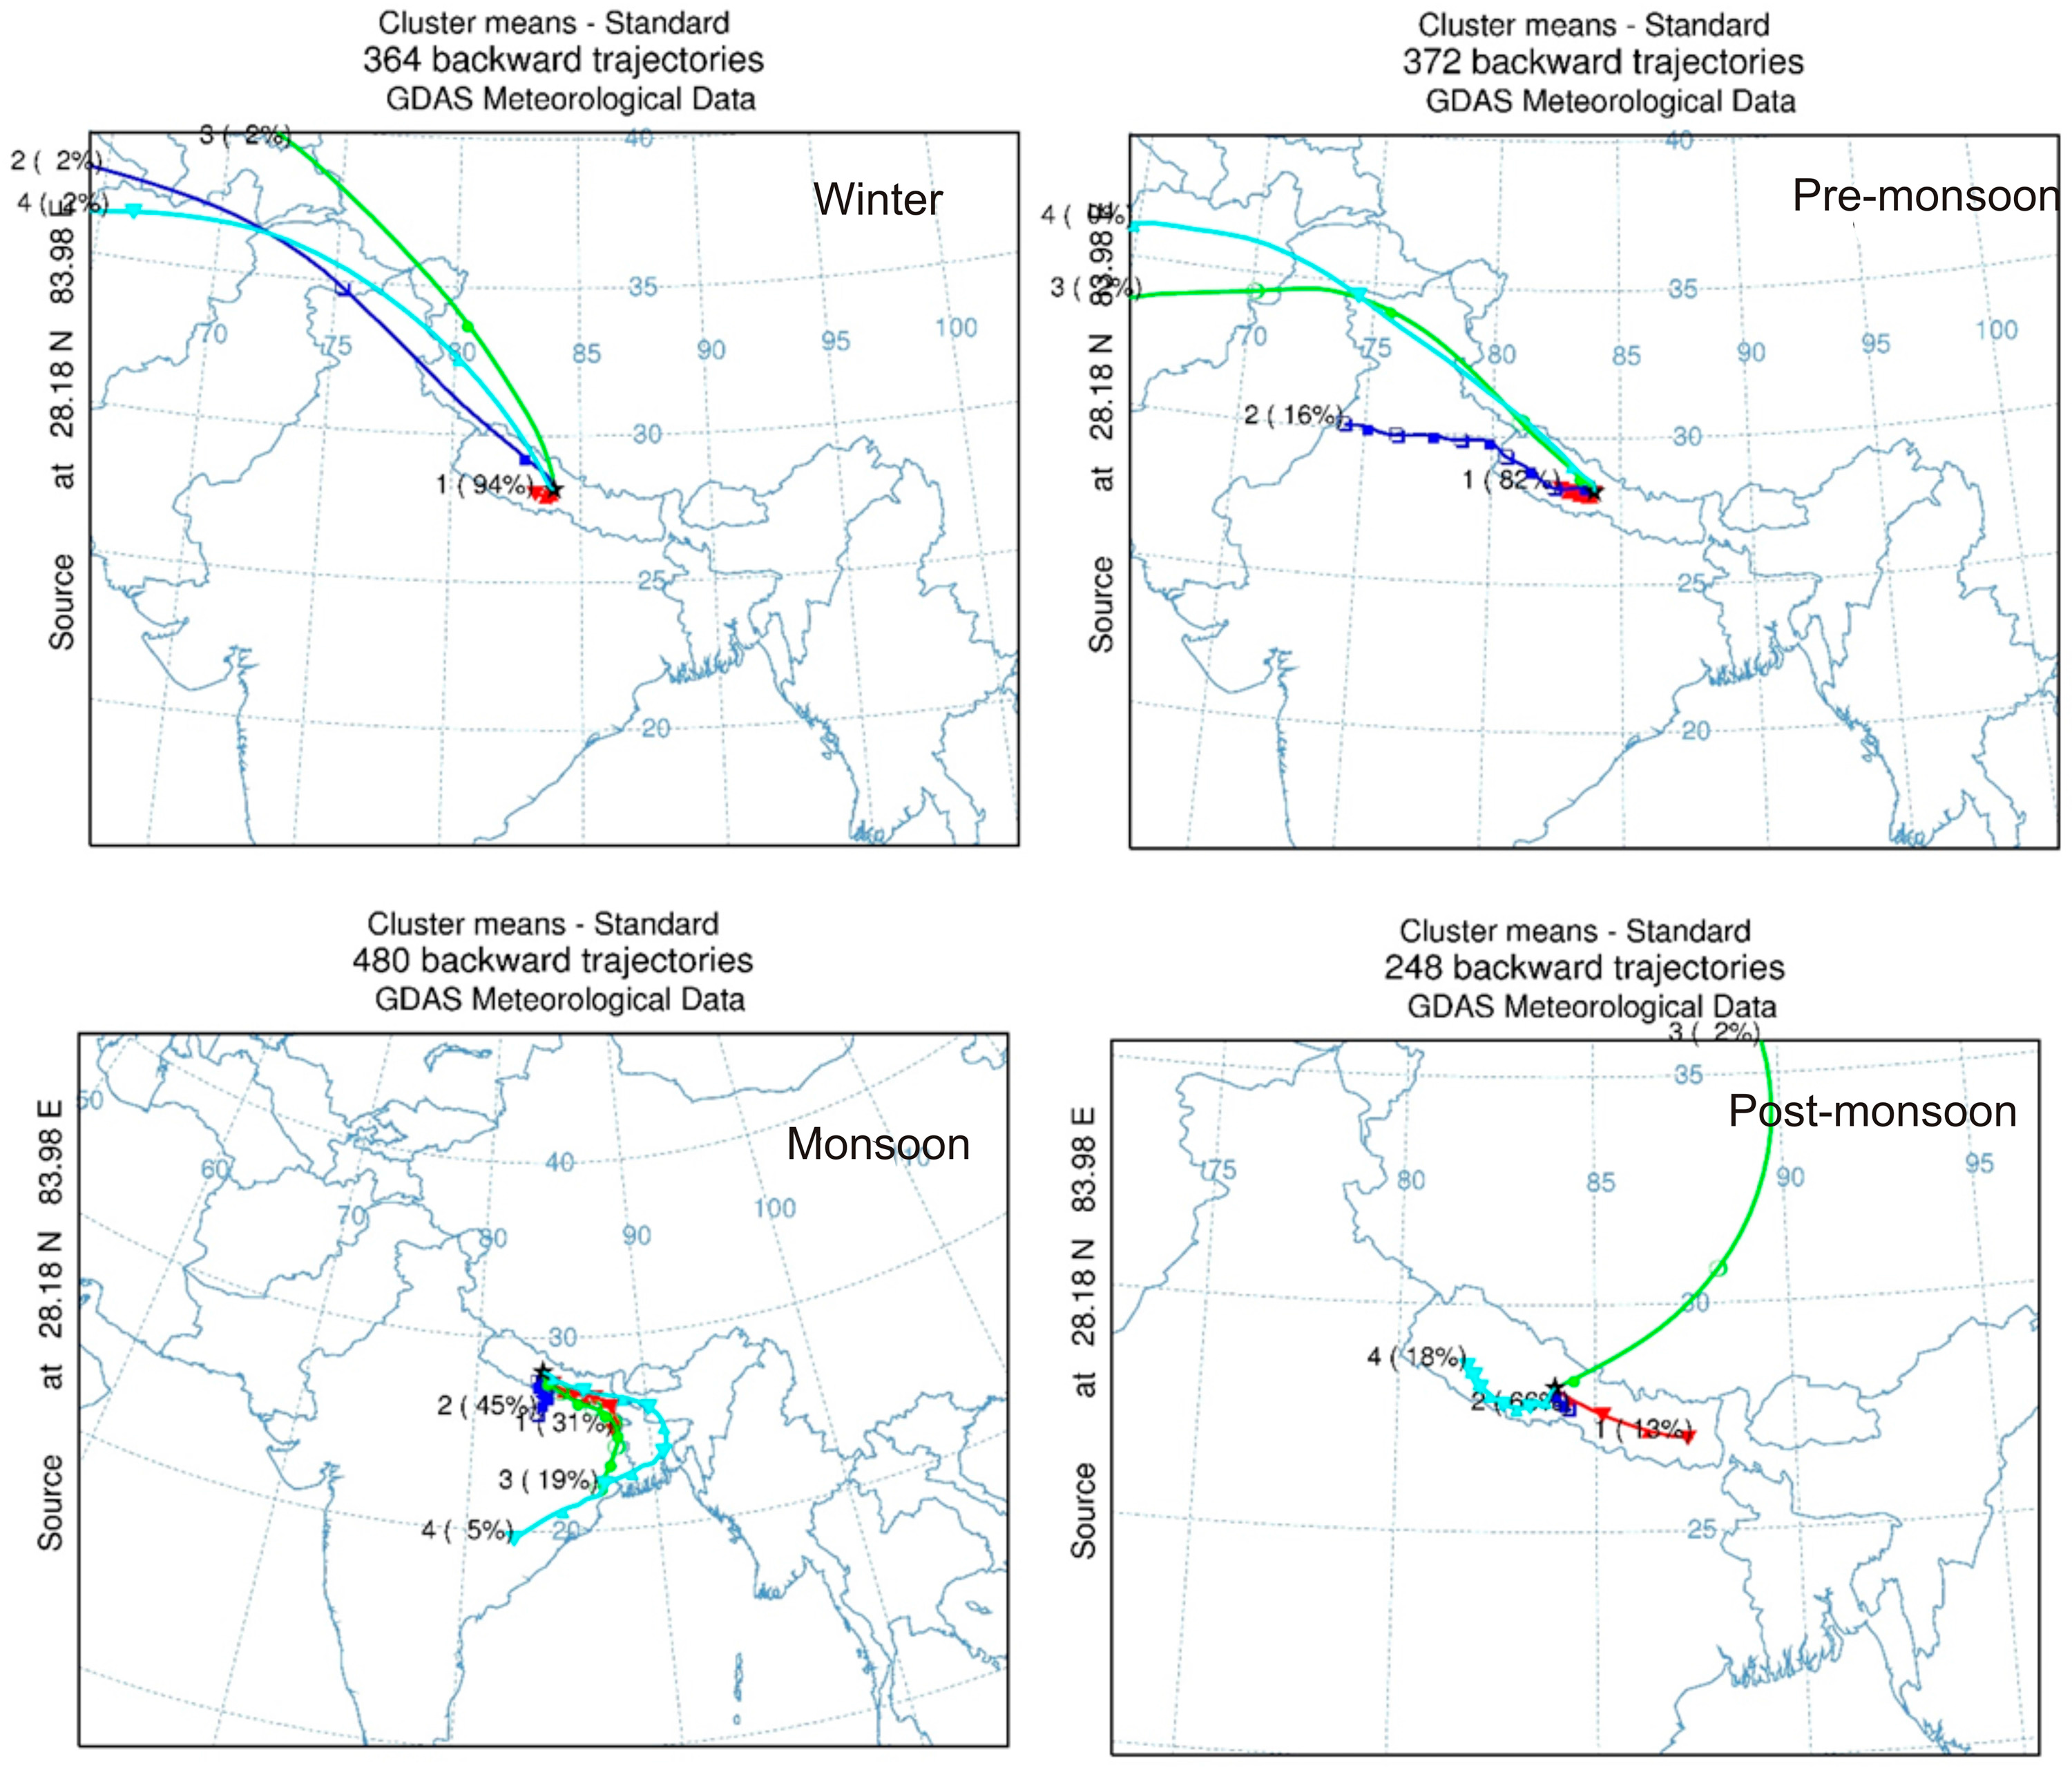
3.5.4. HYSPLIT Back Trajectory Analysis

Hybrid Single-Particle Lagrangian Integrated Trajectory or HYSPLIT model from Air Resources Lab of National Oceanic and Atmospheric Administration (NOAA) has been widely used [20,31,44,45] to understand the potential transport pathways and potential source regions of aerosols. Seasonal transport pathways for air masses reaching the study site have been presented in Figure 6. The majority of air masses during winter and pre-monsoon seasons were of local origin with some air masses coming from the Middle East Asian regions. A significant portion (16%) of the air mass, during pre-monsoon, originated from the IGP region. These air masses could carry the biomass burning emission from the IGP region at our site since agro residue burning is common during this season of the year over northwestern IGP region [46]. A recent study [18] has shown that the site over Himalayan foothills gets influenced by biomass burning on either side (east or west) of Indo-Gangetic Plain. The highest value of K+ or biomass burning tracer observed in the pre-monsoon season could be related to the air mass coming from the IGP region. During the monsoon season, the air mass changed the direction and is dominant from the eastern side, which is responsible for precipitation in the country. Back trajectory analysis clearly showed most of the air masses arriving in Pokhara from IGP regions during the monsoon season. These air masses might also have contributed to the pollutants emitted from mobile sources like vehicles to obtain a high nitrate to sulfate ratio during this season. Meanwhile, for the post-monsoon season, the air masses were local, i.e., originated within the western part of the country, suggesting the local sources of pollutants dominated during this period.

4. Conclusions

For the first time, continuous observations of TSP composition for a yearlong period (from April 2013 to April 2014), were conducted and analyzed for the major WSIIs in the Pokhara valley, Nepal. The annual average TSP mass concentration was 135.50 ± 62.91 µg/m3. The highest seasonal values of TSP and major ions were observed during the non-monsoon period, while the lowest concentrations occurred during the monsoon period. Back trajectories analyses have suggested the air mass transported through Indo-Gangetic Plains during the dry periods, which have resulted in high ion loading during this period. Furthermore, seasonal difference in atmospheric conditions explains this clear seasonal variation of ions. The [NO3/SO42−] ratio suggested that their sources are mostly from a stationary source in Pokhara valley. The PCA results showed three different sources of ions: (a) mixed sea salt and combustion; (b) secondary anthropogenic aerosols; and (c) natural mineral aerosol and fugitive dust in the valley. Moreover, further research is needed to better understand the sources and transport of aerosols’ particles from different regions and their potential climatic and environmental impacts to further understand the atmospheric environment in the region where the data is limited.

Supplementary Materials

The following are available online at www.mdpi.com/2073-4433/7/8/102/s1. Table S1: Seasonal concentrations contribution (%) of sea salt aerosols, Figure S1: Overall structural diagram of the sampler, Figure S2: The ∑cations and ∑anions equivalents scatter plot, Figure S3: Daily TSP mass concentrations and TWSIIs variation over the sampling period (WHO regulation limit for TSP).

Acknowledgments

This study was supported by the Strategic Priority Research Program (B) of the Chinese Academy of Sciences (XDB03030504), the National Natural Science Foundation of China (41421061, 41225002), and Academy of Finland (264307). Lekhendra Tripathee is supported by Chinese Academy of Sciences, President’s International Fellowship Initiative (PIFI, Grant No.: 2016PE007). The authors would like to acknowledge the efforts made by Arnico K. Panday, ICIMOD for collaborating with us as a local partner from Nepal and Anil Patel and Gupta Giri at Pokhara site for sampling work.

Author Contributions

Shichang Kang and Qianggong Zhang designed the project. Lekhendra Tripathee and Dipesh Rupakheti performed the field, lab work and data analysis. Lekhendra Tripathee wrote the manuscript. All the coauthors coordinated the data analysis and revised the manuscript and accepted the submission.

Conflicts of Interest

The authors declare no conflicts of interest.

References

  1. Safai, P.D.; Rao, P.S.P.; Momin, G.A.; Ali, K.; Chate, D.M.; Praveen, P.S.; Devara, P.C.S. Variation in the chemistry of aerosols in two different winter seasons at Pune and Sinhagad, India. Aerosol Air Qual. Res. 2005, 5, 115–126. [Google Scholar]
  2. Xiao, H.-Y.; Liu, C.-Q. Chemical characteristics of water-soluble components in tsp over guiyang, SW China, 2003. Atmos. Environ. 2004, 38, 6297–6306. [Google Scholar] [CrossRef]
  3. Charlson, R.J.; Schwartz, S.; Hales, J.; Cess, R.D.; Coakley, J.; Hansen, J.; Hofmann, D. Climate forcing by anthropogenic aerosols. Science 1992, 255, 423–430. [Google Scholar] [CrossRef] [PubMed]
  4. Russell, L.M.; Pandis, S.N.; Seinfeld, J.H. Aerosol production and growth in the marine boundary layer. J. Geophys. Res. 1994, 99, 20989–21003. [Google Scholar] [CrossRef]
  5. Schichtel, B.A.; Husar, R.B.; Falke, S.R.; Wilson, W.E. Haze trends over the united states, 1980–1995. Atmos. Environ. 2001, 35, 5205–5210. [Google Scholar] [CrossRef]
  6. Lee, C.-G.; Yuan, C.-S.; Chang, J.-C.; Yuan, C. Effects of aerosol species on atmospheric visibility in Kaohsiung city, Taiwan. J. Air Waste Manag. 2005, 55, 1031–1041. [Google Scholar] [CrossRef]
  7. Shen, Z.; Cao, J.; Arimoto, R.; Han, Z.; Zhang, R.; Han, Y.; Liu, S.; Okuda, T.; Nakao, S.; Tanaka, S. Ionic composition of tsp and PM2.5 during dust storms and air pollution episodes at Xi’an, China. Atmos. Environ. 2009, 43, 2911–2918. [Google Scholar] [CrossRef]
  8. Deshmukh, D.K. Characterization of dicarboxylates and inorganic ions in urban PM10 aerosols in the Eastern Central India. Aerosol Air Qual. Res. 2012, 12, 592–607. [Google Scholar] [CrossRef]
  9. Pandey, P.; Khan, A.H.; Verma, A.K.; Singh, K.A.; Mathur, N.; Kisku, G.C.; Barman, S.C. Seasonal trends of PM2.5 and PM10 in ambient air and their correlation in ambient air of Lucknow City, India. Bull. Environ. Contam. Toxicol. 2012, 88, 265–270. [Google Scholar] [CrossRef] [PubMed]
  10. Carrico, C.M.; Bergin, M.H.; Shrestha, A.B.; Dibb, J.E.; Gomes, L.; Harris, J.M. The importance of carbon and mineral dust to seasonal aerosol properties in the Nepal Himalaya. Atmos. Environ. 2003, 37, 2811–2824. [Google Scholar] [CrossRef]
  11. Decesari, S.; Facchini, M.C.; Carbone, C.; Giulianelli, L.; Rinaldi, M.; Finessi, E.; Fuzzi, S.; Marinoni, A.; Cristofanelli, P.; Duchi, R.; et al. Chemical composition of PM10 and PM1 at the high-altitude Himalayan station nepal climate observatory-pyramid (NCO-P) (5079 m a.S.L.). Atmos. Chem. Phys. 2010, 10, 4583–4596. [Google Scholar] [CrossRef] [Green Version]
  12. Shrestha, A.B.; Wake, C.P.; Dibb, J.E. Chemical composition of aerosol and snow in the high Himalaya during the summer monsoon season. Atmos. Environ. 1997, 31, 2815–2826. [Google Scholar] [CrossRef]
  13. Shrestha, A.B.; Wake, C.P.; Dibb, J.E.; Mayewski, P.A.; Whitlow, S.I.; Carmichael, G.R.; Ferm, M. Seasonal variations in aerosol concentrations and compositions in the Nepal Himalaya. Atmos. Environ. 2000, 34, 3349–3363. [Google Scholar] [CrossRef]
  14. Shakya, K.M. Characteristics and sources of carbonaceous, ionic, and isotopic species of wintertime atmospheric aerosols in Kathmandu valley, Nepal. Aerosol Air Qual. Res. 2010, 10, 219–230. [Google Scholar] [CrossRef]
  15. Sigdel, M.; Ma, Y. Evaluation of future precipitation scenario using statistical downscaling model over humid, subhumid, and arid region of Nepal—A case study. Theor. Appl. Climatol. 2016, 123, 453–460. [Google Scholar] [CrossRef]
  16. Kansakar, S.R.; Hannah, D.M.; Gerrard, J.; Rees, G. Spatial pattern in the precipitation regime of Nepal. Int. J. Climatol. 2004, 24, 1645–1659. [Google Scholar] [CrossRef]
  17. Chen, P.; Li, C.; Kang, S.; Yan, F.; Zhang, Q.; Ji, Z.; Tripathee, L.; Rupakheti, D.; Rupakheti, M.; Qu, B. Source apportionment of particle-bound polycyclic aromatic hydrocarbons in Lumbini, Nepal by using the positive matrix factorization receptor model. Atmos. Res. 2016, 182, 46–53. [Google Scholar] [CrossRef]
  18. Rupakheti, D.; Adhikary, B.; Praveen, P.S.; Rupakheti, M.; Kang, S.; Mahata, K.S.; Naja, M.; Zhang, Q.; Panday, A.K.; Lawrence, M.G. Pre-monsoon air quality over Lumbini, a world heritage site along the himalayan foothills. Atmos. Chem. Phys. Discuss. 2016. [Google Scholar] [CrossRef]
  19. Xu, J.; Wang, Z.; Yu, G.; Qin, X.; Ren, J.; Qin, D. Characteristics of water soluble ionic species in fine particles from a high altitude site on the northern boundary of tibetan plateau: Mixture of mineral dust and anthropogenic aerosol. Atmos. Res. 2014, 143, 43–56. [Google Scholar] [CrossRef]
  20. Cong, Z.; Kang, S.; Kawamura, K.; Liu, B.; Wan, X.; Wang, Z.; Gao, S.; Fu, P. Carbonaceous aerosols on the south edge of the Tibetan Plateau: Concentrations, seasonality and sources. Atmos. Chem. Phys. 2015, 15, 1573–1584. [Google Scholar] [CrossRef]
  21. Zhang, X.Y.; Cao, J.; Li, L.; Arimoto, R.; Cheng, Y.; Huebert, B.; Wang, D. Characterization of atmospheric aerosol over Xi’an in the south margin of the Loess Plateau, China. Atmos. Environ. 2002, 36, 4189–4199. [Google Scholar] [CrossRef]
  22. Deshmukh, D.K.; Tsai, Y.I.; Deb, M.K.; Zarmpas, P. Characteristics and sources of water-soluble ionic species associated with PM10 particles in the ambient air of central India. Bull. Environ. Contam. Toxicol. 2012, 89, 1091–1097. [Google Scholar] [CrossRef] [PubMed]
  23. Tripathee, L.; Kang, S.; Huang, J.; Sillanpaa, M.; Sharma, C.M.; Luthi, Z.L.; Guo, J.; Paudyal, R. Ionic composition of wet precipitation over the southern slope of central Himalayas, Nepal. Environ. Sci. Pollut. Res. Int. 2014, 21, 2677–2687. [Google Scholar] [CrossRef] [PubMed]
  24. Satsangi, A.; Pachauri, T.; Singla, V.; Lakhani, A.; Kumari, K.M. Water soluble ionic species in atmospheric aerosols: Concentrations and sources at Agra in the indo-gangetic plain (IGP). Aerosol Air Qual. Res. 2013, 13, 1877–1889. [Google Scholar] [CrossRef]
  25. Chelani, A.; Gajghate, D.; ChalapatiRao, C.; Devotta, S. Particle size distribution in ambient air of Delhi and its statistical analysis. Bull. Environ. Contam. Toxicol. 2010, 85, 22–27. [Google Scholar] [CrossRef] [PubMed]
  26. Wang, Y.; Zhuang, G.; Sun, Y.; An, Z. The variation of characteristics and formation mechanisms of aerosols in dust, haze, and clear days in Beijing. Atmos. Environ. 2006, 40, 6579–6591. [Google Scholar] [CrossRef]
  27. Huang, T.; Chen, J.; Zhao, W.; Cheng, J.; Cheng, S. Seasonal variations and correlation analysis of water-soluble inorganic ions in PM2.5 in Wuhan, 2013. Atmosphere 2016, 7, 49. [Google Scholar] [CrossRef]
  28. Tripathee, L.; Kang, S.; Huang, J.; Sharma, C.M.; Sillanpää, M.; Guo, J.; Paudyal, R. Concentrations of trace elements in wet deposition over the central Himalayas, Nepal. Atmos. Environ. 2014, 95, 231–238. [Google Scholar] [CrossRef]
  29. Kang, S.; Chen, P.; Li, C.; Liu, B.; Cong, Z. Atmospheric aerosol elements over the inland Tibetan Plateau: Concentration, seasonality, and transport. Aerosol Air Qual. Res. 2016, 16, 789–800. [Google Scholar] [CrossRef]
  30. Zhang, T.; Cao, J.J.; Tie, X.X.; Shen, Z.X.; Liu, S.X.; Ding, H.; Han, Y.M.; Wang, G.H.; Ho, K.F.; Qiang, J.; et al. Water-soluble ions in atmospheric aerosols measured in Xi’an, China: Seasonal variations and sources. Atmos. Res. 2011, 102, 110–119. [Google Scholar] [CrossRef]
  31. Zhao, S.; Li, Z.; Zhou, P. Ion chemistry and individual particle analysis of atmospheric aerosols over Mt. Bogda of eastern Tianshan mountains, central Asia. Environ. Monit. Assess. 2011, 180, 409–426. [Google Scholar] [CrossRef] [PubMed]
  32. Arakaki, T.; Azechi, S.; Somada, Y.; Ijyu, M.; Nakaema, F.; Hitomi, Y.; Handa, D.; Oshiro, Y.; Miyagi, Y.; Tsuhako, A.; et al. Spatial and temporal variations of chemicals in the tsp aerosols simultaneously collected at three islands in Okinawa, Japan. Atmos. Environ. 2014, 97, 479–485. [Google Scholar] [CrossRef]
  33. Zhao, Z.; Cao, J.; Shen, Z.; Xu, B.; Zhu, C.; Chen, L.W.A.; Su, X.; Liu, S.; Han, Y.; Wang, G.; et al. Aerosol particles at a high-altitude site on the southeast Tibetan Plateau, China: Implications for pollution transport from South Asia. J. Geophys. Res. 2013, 118, 11,360–11,375. [Google Scholar] [CrossRef]
  34. Kumar, P.; Yadav, S. Seasonal variations in water soluble inorganic ions, oc and ec in pm10 and PM > 10 aerosols over delhi: Influence of sources and meteorological factors. Aerosol Air Qual. Res. 2016, 16, 1165–1178. [Google Scholar] [CrossRef]
  35. Wang, H.; Shooter, D. Water soluble ions of atmospheric aerosols in three new zealand cities: Seasonal changes and sources. Atmos. Environ. 2001, 35, 6031–6040. [Google Scholar] [CrossRef]
  36. Dewan, N.; Wang, Y.-Q.; Zhang, Y.-X.; Zhang, Y.; He, L.-Y.; Huang, X.-F.; Majestic, B.J. Effect of pollution controls on atmospheric pm2. 5 composition during universiade in Shenzhen, China. Atmosphere 2016, 7. [Google Scholar] [CrossRef]
  37. Migliavacca, D.; Teixeira, E.; Wiegand, F.; Machado, A.; Sanchez, J. Atmospheric precipitation and chemical composition of an urban site, guaiba hydrographic basin, Brazil. Atmos. Environ. 2005, 39, 1829–1844. [Google Scholar]
  38. Deng, X.L.; Shi, C.E.; Wu, B.W.; Yang, Y.J.; Jin, Q.; Wang, H.L.; Zhu, S.; Yu, C. Characteristics of the water-soluble components of aerosol particles in Hefei, China. J. Environ. Sci. 2016, 42, 32–40. [Google Scholar] [CrossRef] [PubMed]
  39. Javid, M.; Bahramifar, N.; Younesi, H.; Taghavi, S.M.; Givehchi, R. Dry deposition, seasonal variation and source interpretation of ionic species at Abali, Firouzkouh and Varamin, Tehran province, Iran. Atmos. Res. 2015, 157, 74–90. [Google Scholar] [CrossRef]
  40. Park, S.-M.; Seo, B.-K.; Lee, G.; Kahng, S.-H.; Jang, Y.W. Chemical composition of water soluble inorganic species in precipitation at Shihwa Basin, Korea. Atmosphere 2015, 6, 732–750. [Google Scholar] [CrossRef]
  41. Arimoto, R.; Duce, R.A.; Savoie, D.L.; Prospero, J.M.; Talbot, R.; Cullen, J.D.; Tomza, U.; Lewis, N.F.; Ray, B.J. Relationships among aerosol constituents from asia and the north pacific during PEM-WEST A. J. Geophys. Res. 1996, 101, 2011–2023. [Google Scholar] [CrossRef]
  42. Wang, Y.; Zhuang, G.; Tang, A.; Yuan, H.; Sun, Y.; Chen, S.; Zheng, A. The ion chemistry and the source of PM2.5 aerosol in Beijing. Atmos. Environ. 2005, 39, 3771–3784. [Google Scholar] [CrossRef]
  43. Kuniyal, J.C. Water soluble ionic components in particulate matter (PM10) during high pollution episode days at Mohal and Kothi in the north-western Himalaya, INDIA. Aerosol Air Qual. Res. 2015, 15, 529–543. [Google Scholar] [CrossRef]
  44. Chen, P.; Kang, S.; Bai, J.; Sillanpää, M.; Li, C. Yak dung combustion aerosols in the Tibetan Plateau: Chemical characteristics and influence on the local atmospheric environment. Atmos. Res. 2015, 156, 58–66. [Google Scholar] [CrossRef]
  45. Tiwari, S.; Srivastava, A.K.; Bisht, D.S.; Bano, T.; Singh, S.; Behura, S.; Srivastava, M.K.; Chate, D.M.; Padmanabhamurty, B. Black carbon and chemical characteristics of PM10 and PM2.5 at an urban site of north India. J. Atmos. Chem. 2010, 62, 193–209. [Google Scholar] [CrossRef]
  46. Kumar, V.; Sarkar, C.; Sinha, V. Influence of post harvest crop residue fires on surface ozone mixing ratios in the NW IGP analyzed using two years of continuous in-situ trace gas measurements. J. Geophys. Res. Atmos. 2016, 121, 3619–3633. [Google Scholar] [CrossRef]
Figure 1. Map showing the location of sampling site (Pokhara valley) (left) and the total suspended particulate (TSP) used for aerosol sampling (right).
Atmosphere 07 00102 g001
Figure 2. Percentage distribution of water-soluble inorganic ions in overall TSP mass.
Atmosphere 07 00102 g002
Figure 3. Seasonal variations of TSP and water-soluble inorganic ions (WSIIs) concentrations.
Atmosphere 07 00102 g003
Figure 4. Seasonal variation of WSIIs accounting for the total TSP mass concentration in Pokhara valley.
Atmosphere 07 00102 g004
Figure 5. Scatter plot between [NO3 + SO42−] and [Ca2++ NH4+ + Mg2+] at Pokhara valley.
Atmosphere 07 00102 g005
Figure 6. Five-day air mass back trajectories (500 m height) at different seasons (Winter: December–February, Pre-monsoon: March–May, Monsoon: June–September, Post-monsoon: October–November) arriving the sampling site.
Atmosphere 07 00102 g006
Table 1. Annual statistics of water-soluble inorganic ions concentration (µg/m3) between April 2013 and April 2014 in Pokhara Valley, Nepal.
SpeciesTSPClNO3SO42−Na+NH4+K+Mg2+Ca2+Total IonsTotal CationsTotal Anions
Mean135.500.511.944.231.871.171.050.338.3919.5412.846.69
SD62.910.531.443.391.281.240.930.237.1313.859.834.81
Min42.260.0520.410.280.390.0050.080.040.713.321.331.22
Max355.022.2410.0214.714.324.624.030.9124.8045.6132.0522.68
Table 2. Comparison of average concentration (µg/m3) of water-soluble inorganic ions in TSP at different cities in the nearby region.
Study AreaSize FractionStudy PeriodClNO3SO42−Na+NH4+K+Mg2+Ca2+References
Pokhara, NepalTSPApril 2013–April 20140.511.944.231.871.171.060.338.39This Study
Agra, IndiaTSPJanuary 2009–December 20104.66.75.942.73.51.46.7[24]
Raipur, IndiaPM10July 2009–June 20103.465.529.981.752.920.760.843.02[8]
Durg, IndiaPM10July 2009–June 20103.235.638.881.765.180.870.82.53[22]
Delhi, IndiaPM10September 2005–January 20068.2315.1316.745.766.064.111.36.82[25]
Xi’an, ChinaTSPOctober 2006–Sepyember 20074.616.1341.48.32.30.911.4[7]
Beijing, ChinaTSPSpring 2001–20048.2222.7627.252.0512.41.840.812.16[26]
Wuhan, ChinaPM2.5January 2013–December 20131.2411.2816.780.249.671.080.140.54[27]
Table 3. Varimax rotated principal component analysis (PCA) loadings for water-soluble ions of TSP.
SpeciesFactors
1234
Cl0.82−0.070.210.39
NO30.090.170.930.25
SO42−0.370.590.660.05
Na+0.890.350.040.13
NH4+0.110.890.190.23
K+0.610.520.460.23
Mg2+0.480.510.370.56
Ca2+0.460.360.290.73
% of Variance30.6324.8023.0114.94

