
Contemporary Temperature Fluctuation in Urban Areas of Pakistan

Abstract
:1. Introduction
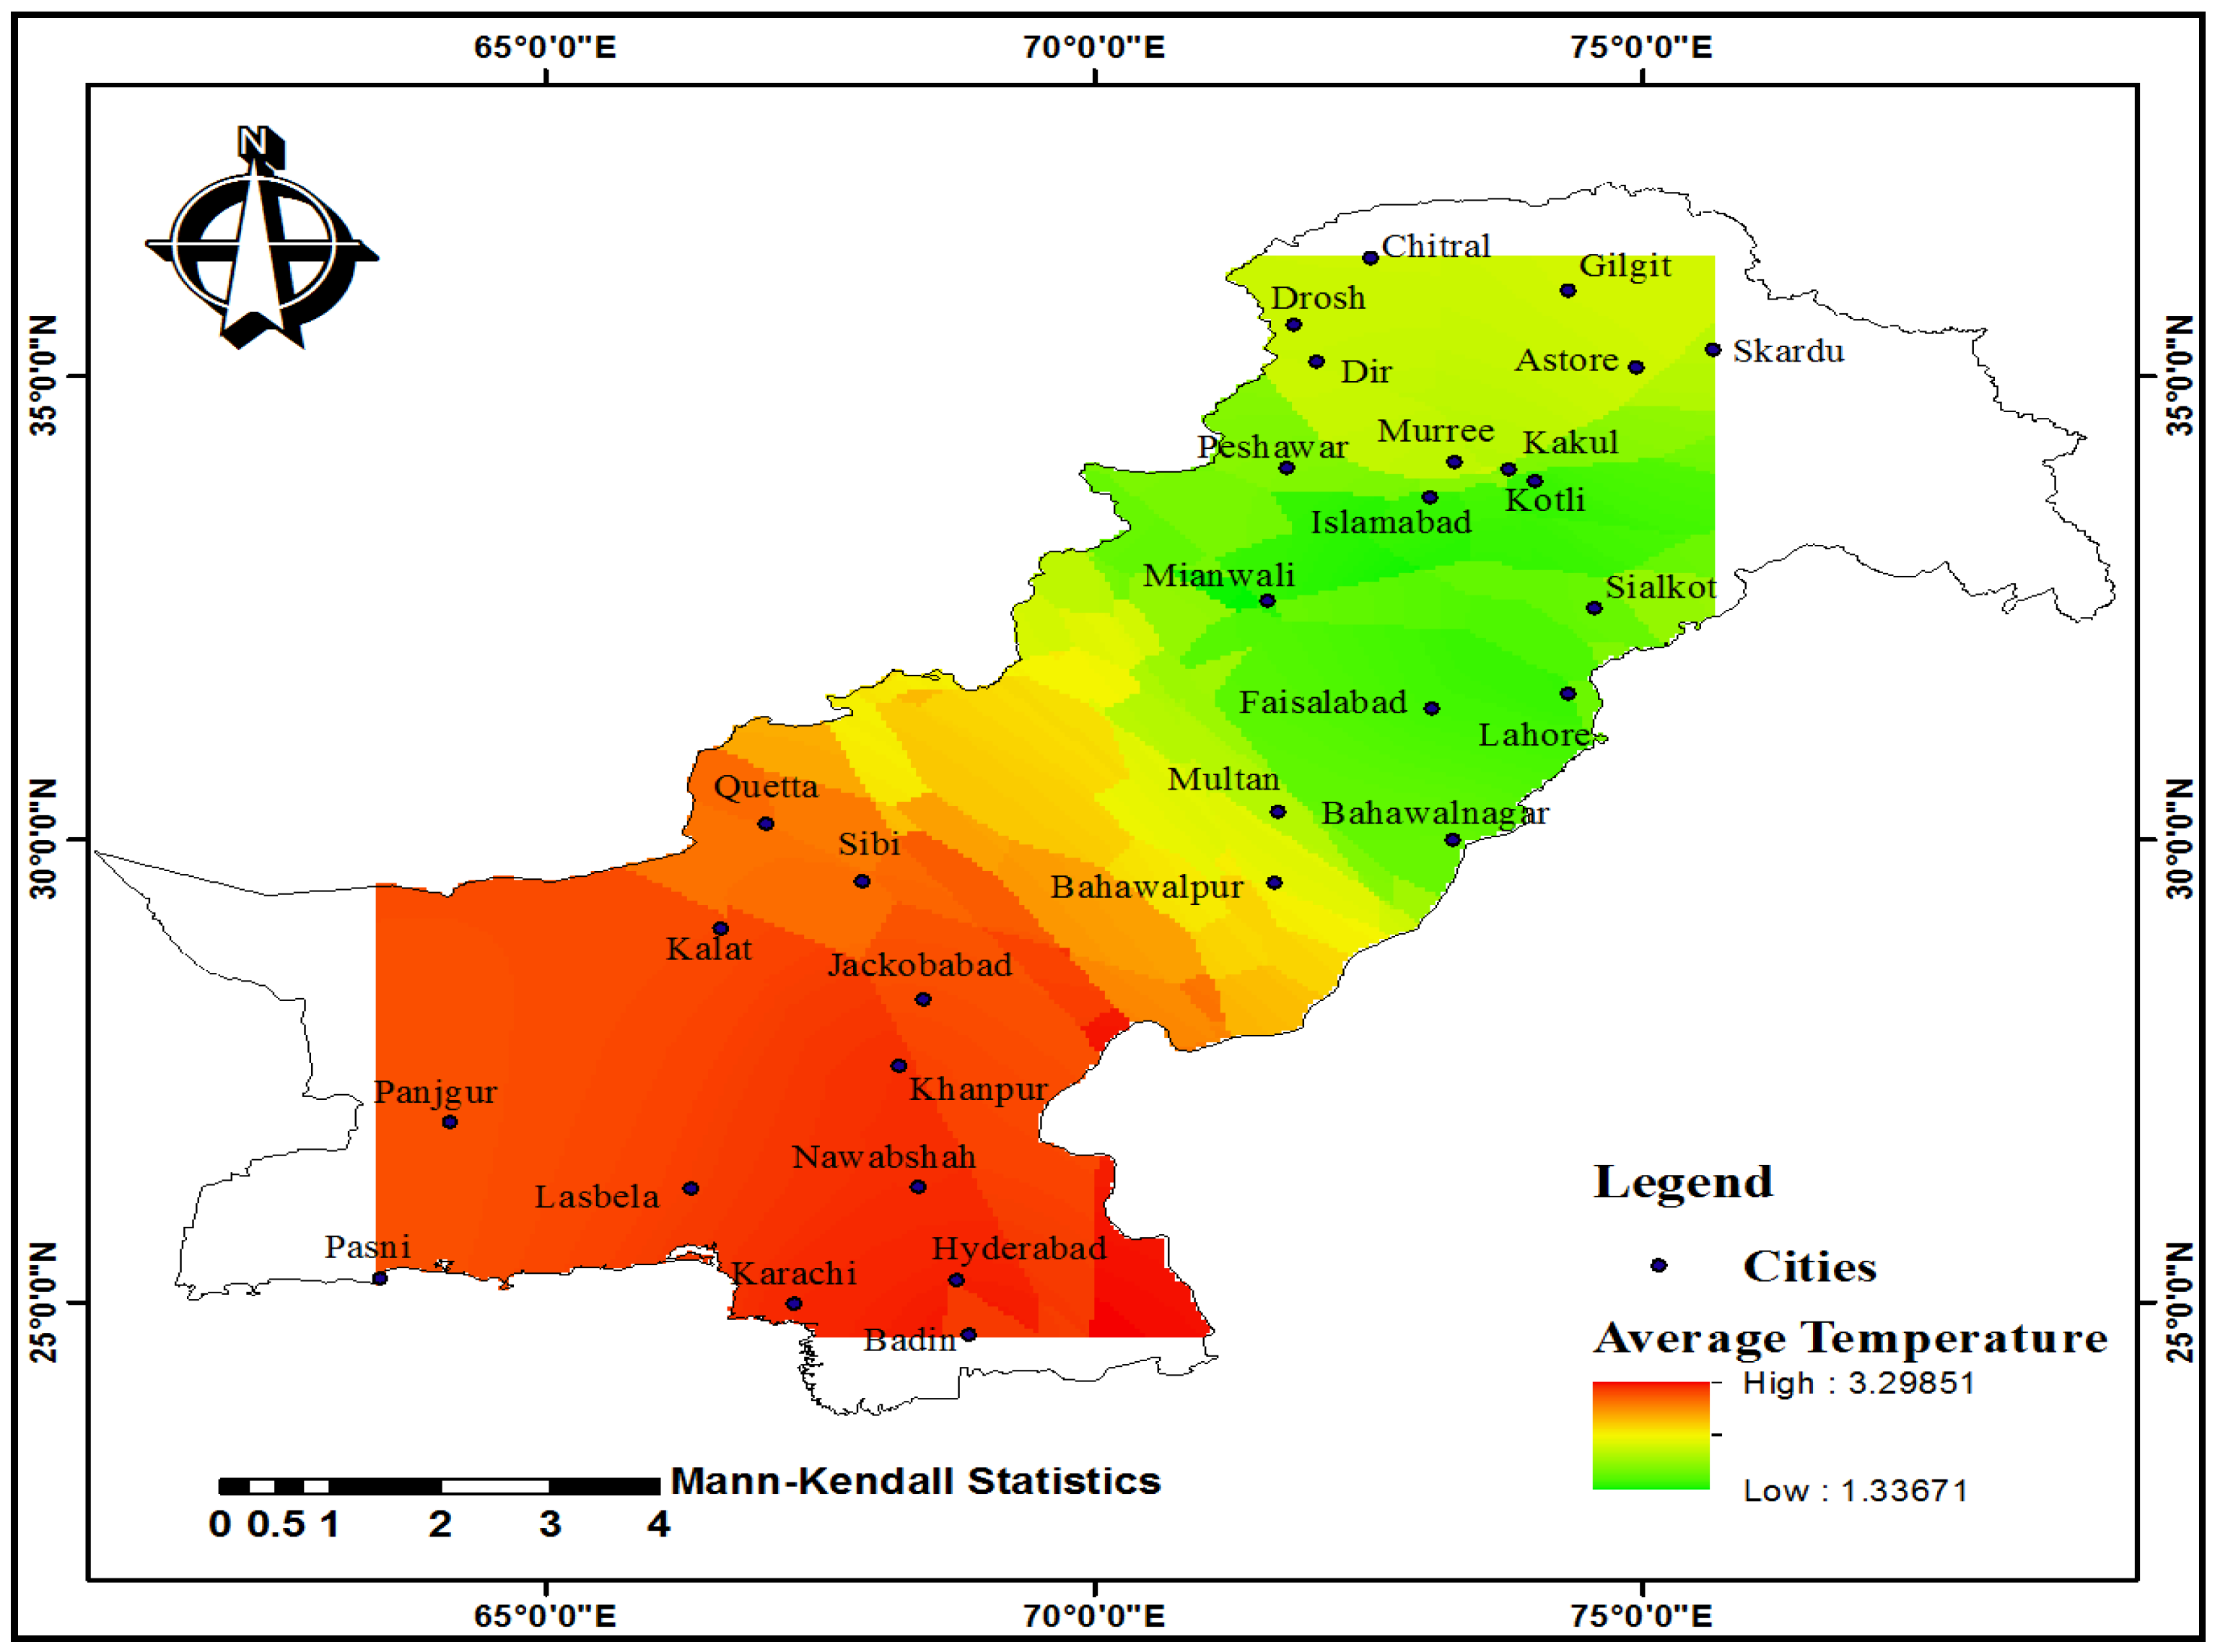
2. Profile of the Study Area
3. Materials and Methods
3.1. Data
3.2. Statistical Tests for Trend Detection
3.2.1. Mann-Kendall Trend Test
3.2.2. Sen’s Slope Estimator
3.2.3. Linear Regression Method
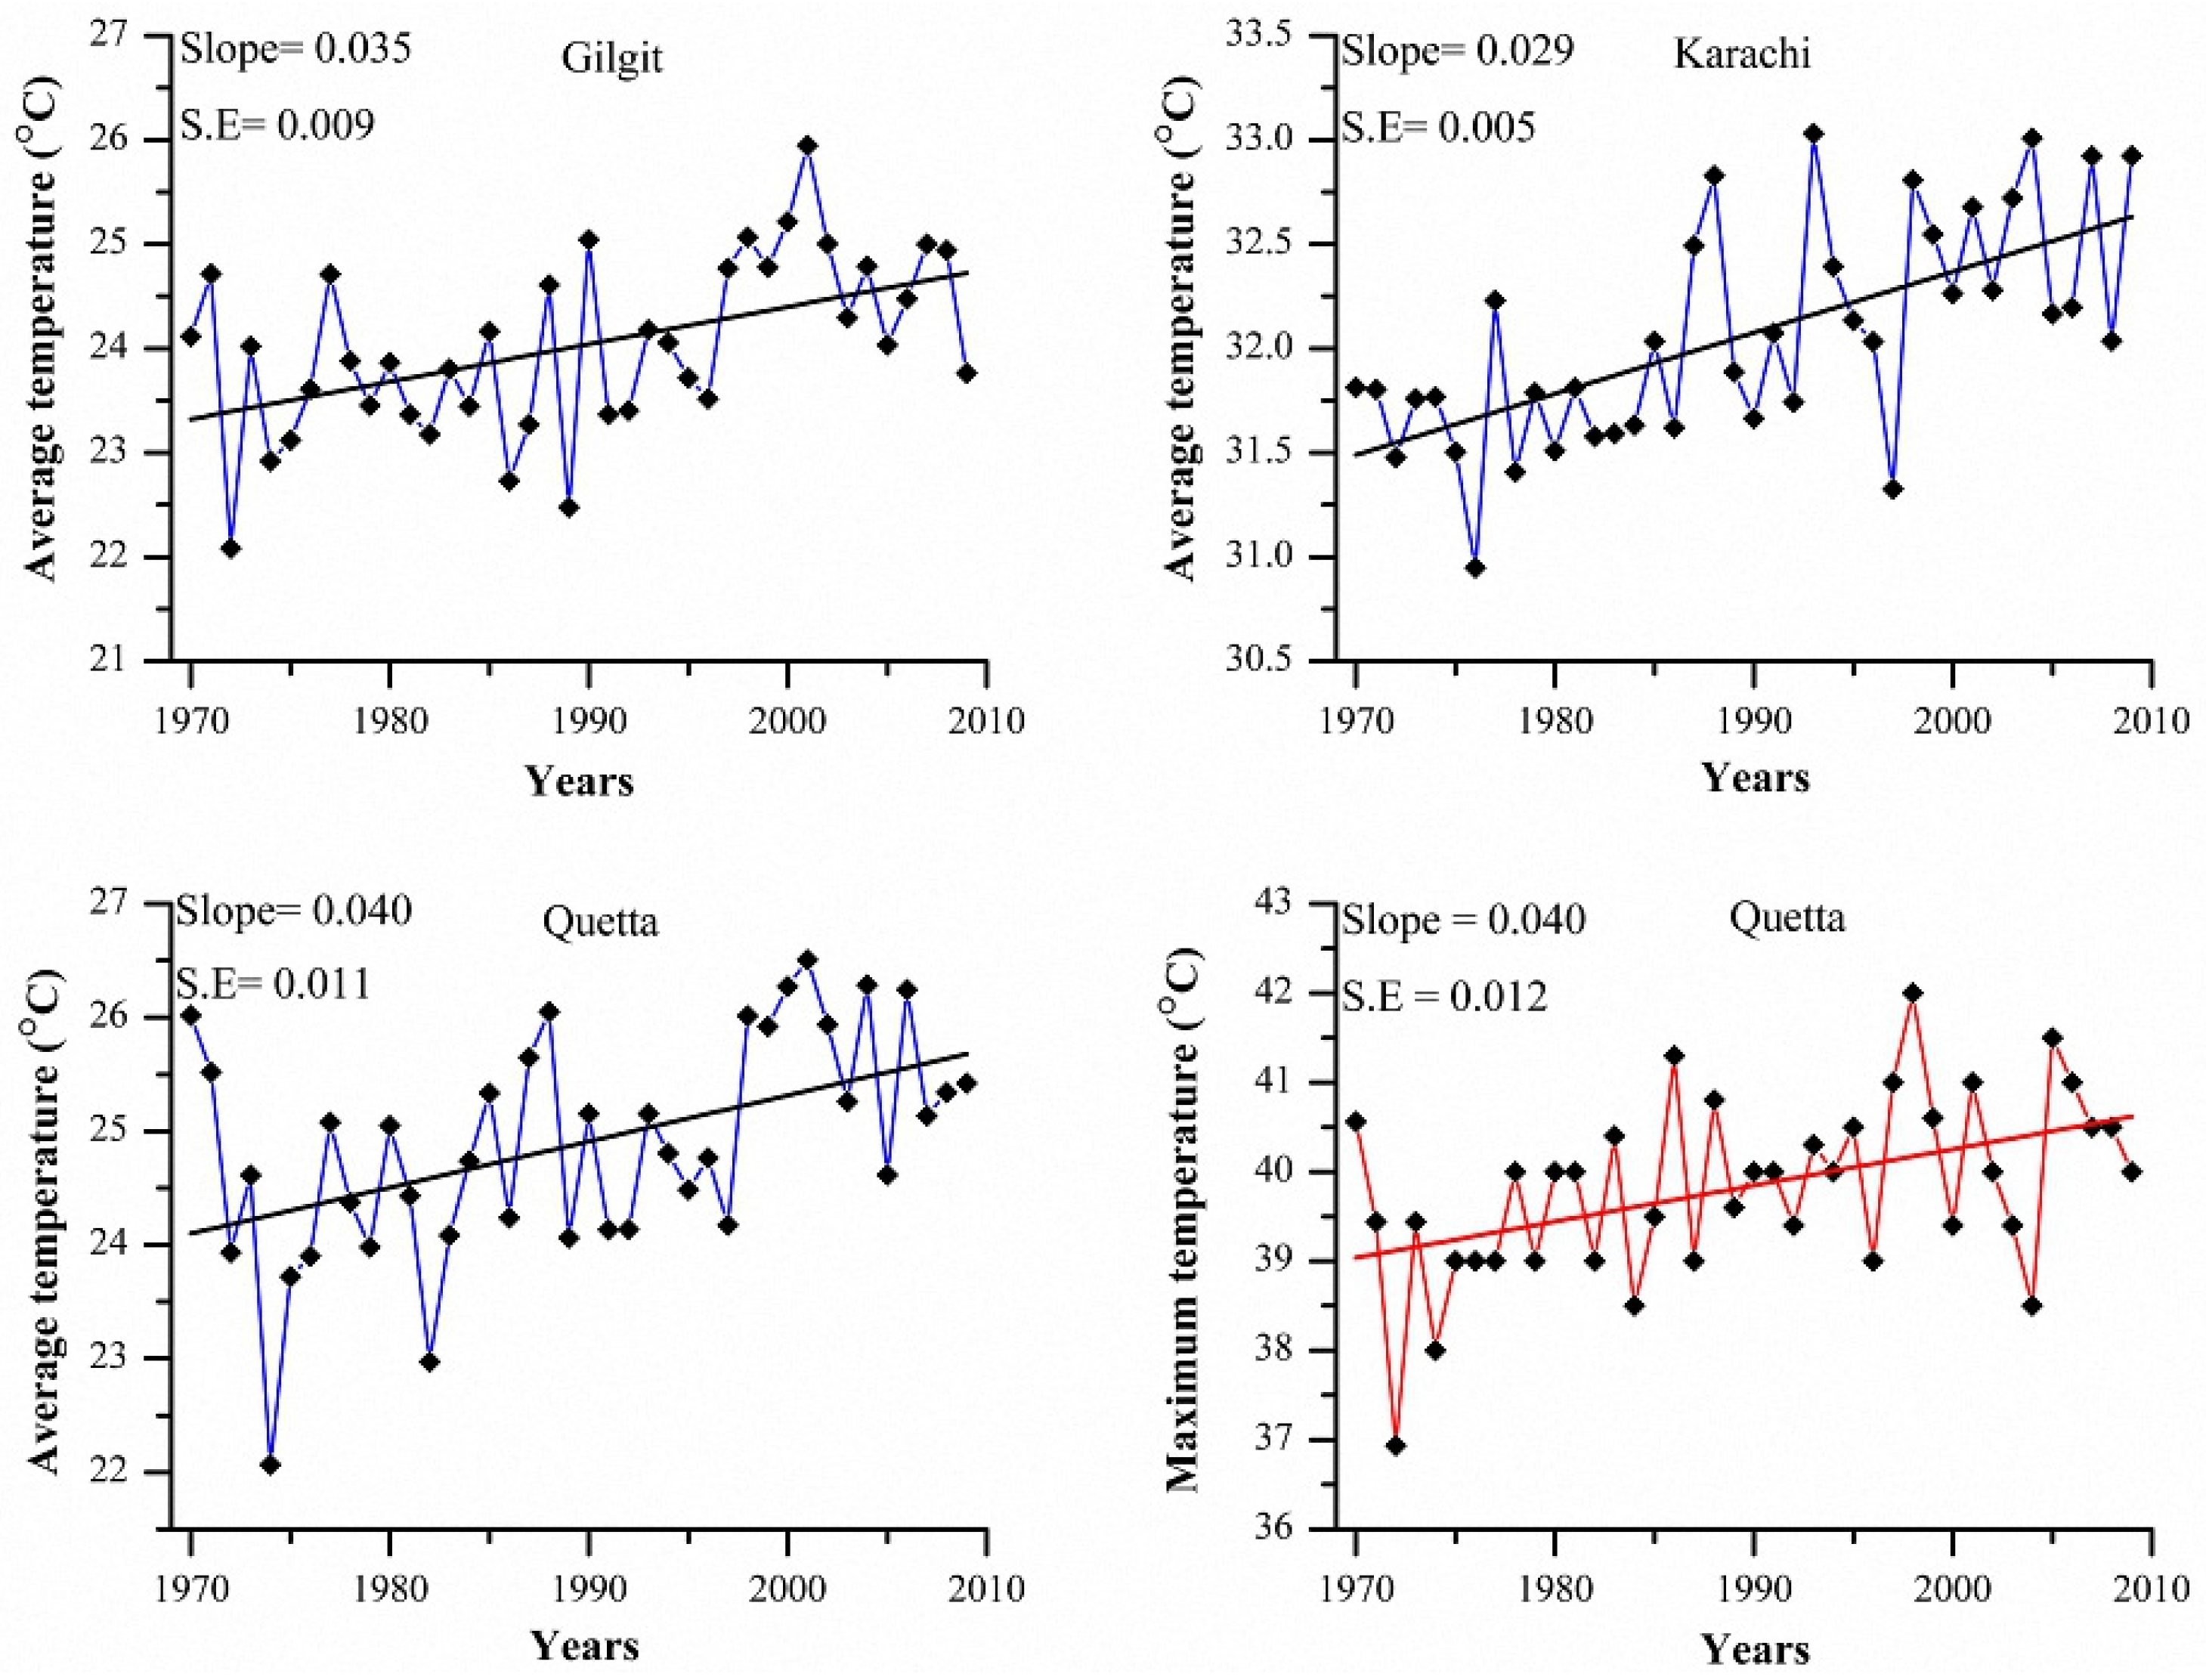
4. Results and Discussion
5. Conclusions
Acknowledgments
Author Contributions
Conflicts of Interest
References
- Tabari, H.; Hosseinzadeh Talaee, P. Recent trends of mean maximum and minimum air temperatures in the western half of Iran. Meteorol. Atmos. Phys. 2011, 111, 121–131. [Google Scholar] [CrossRef]
- Tabari, H.; Hosseinzadeh Talaee, P. Analysis of trends in temperature data in arid and semi-arid regions of Iran. Glob. Planet. Chang. 2011, 79, 1–10. [Google Scholar] [CrossRef]
- Abolverdi, J.; Ferdosifar, G.; Khalili, D.; Kamgar-Haghighi, A.; Abdolahipour Haghighi, M. Recent trends in regional air temperature and precipitation and links to global climate change in the Maharlo watershed, Southwestern Iran. Meteorol. Atmos. Phys. 2014, 126, 177–192. [Google Scholar] [CrossRef]
- Jeganathan, A.; Andimuthu, R. Temperature trends of Chennai City, India. Theor. Appl. Climatol. 2013, 111, 417–425. [Google Scholar] [CrossRef]
- Climate Change: The Physical Science Basis; Cambridge University Press: Cambridge, UK, 2007; pp. 32–33.
- Punia, M.; Nain, S.; Kumar, A.; Singh, B.; Prakash, A.; Kumar, K.; Jain, V.K. Analysis of temperature variability over north-west part of India for the period 1970–2000. Nat. Hazards 2015, 75, 935–952. [Google Scholar] [CrossRef]
- Duhan, D.; Pandey, A.; Gahalaut, K.P.S.; Pandey, R.P. Spatial and temporal variability in maximum, minimum and mean air temperatures at Madhya Pradesh in central India. C. R. Geosci. 2013, 345, 3–21. [Google Scholar] [CrossRef]
- Sonali, P.; Nagesh Kumar, D. Review of trend detection methods and their application to detect temperature changes in India. J. Hydrol. 2013, 476, 212–227. [Google Scholar] [CrossRef]
- Gadgil, A.; Dhorde, A. Temperature trends in twentieth century at Pune, India. Atmos. Environ. 2005, 39, 6550–6556. [Google Scholar] [CrossRef]
- Kumar, K.R.; Hingane, L.S. Long-term variations of surface air temperature at major industrial cities of India. Clim. Chang. 1988, 13, 287–307. [Google Scholar] [CrossRef]
- Turkes, M.; Sumer, U.M. Spatial and temporal patterns of trends and variability in diurnal temperature ranges of Turkey. Theor. Appl. Climatol. 2004, 77, 195–227. [Google Scholar] [CrossRef]
- Roy, S.S.; Balling, R.C. Analysis of trends in maximum and minimum temperature, diurnal temperature range, and cloud cover over India. Geophys. Res. Lett. 2005, 32, 12702. [Google Scholar] [CrossRef]
- Fan, X.H.; Wang, M.B. Change trends of air temperature and precipitation over Shanxi Province, China. Theor. Appl. Climatol. 2011, 103, 519–531. [Google Scholar] [CrossRef]
- Siddik, M.A.; Rahman, M. Trend analysis of maximum, minimum, and average temperatures in Bangladesh: 1961–2008. Theor. Appl. Climatol. 2014, 116, 721–730. [Google Scholar] [CrossRef]
- Sajjad, S.H.; Hussain, B.; Ahmed Khan, M.; Raza, A.; Zaman, B.; Ahmed, I. On rising temperature trends of Karachi in Pakistan. Clim. Chang. 2009, 96, 539–547. [Google Scholar] [CrossRef]
- Sadiq, N.; Qureshi, M.S. Climatic Variability and Linear Trend Models for the Five Major Cities of Pakistan. J. Geogr. Geol. 2010, 2, 83–92. [Google Scholar] [CrossRef]
- Khattak, M.S.; Babel, M.S.; Sharif, M. Hydro-meteorological trends in the upper Indus River basin in Pakistan. Clim. Res. 2011, 46, 103–119. [Google Scholar] [CrossRef]
- Ahmad, W.; Fatima, A.; Awan, U.K.; Anwar, A. Analysis of long term meteorological trends in the middle and lower Indus Basin of Pakistan—A non-parametric statistical approach. Glob. Planet. Chang. 2014, 122, 282–291. [Google Scholar] [CrossRef]
- Hussain, S.S.; Mudasser, M.; Sheikh, M.M.; Manzoor, N. Climate change and variability in mountain regions of Pakistan implications for water and agriculture. Pak. J. Meteorol. 2005, 2, 75–90. [Google Scholar]
- Sultana, H.; Ali, N.; Iqbal, M.M.; Khan, A. Vulnerability and adaptability of wheat production in different climatic zones of Pakistan under climate change scenarios. Clim. Chang. 2009, 94, 123–142. [Google Scholar] [CrossRef]
- Zahid, M.; Rasul, G. Changing trends of thermal extremes in Pakistan. Clim. Chang. 2012, 113, 883–896. [Google Scholar] [CrossRef]
- Kostopoulou, E.; Jones, D.P. Assessment of climate extremes in the Eastern Mediterranean. Meteorol. Atmos. Phys. 2005, 89, 69–85. [Google Scholar] [CrossRef]
- Ambreen, R.; Ahmad, I.; Sultan, S.; Sun, Z.B.; Nawaz, M. A Study of Decadal December Temperature Variability in Pakistan. Am. J. Clim. Chang. 2014, 3, 429–437. [Google Scholar] [CrossRef]
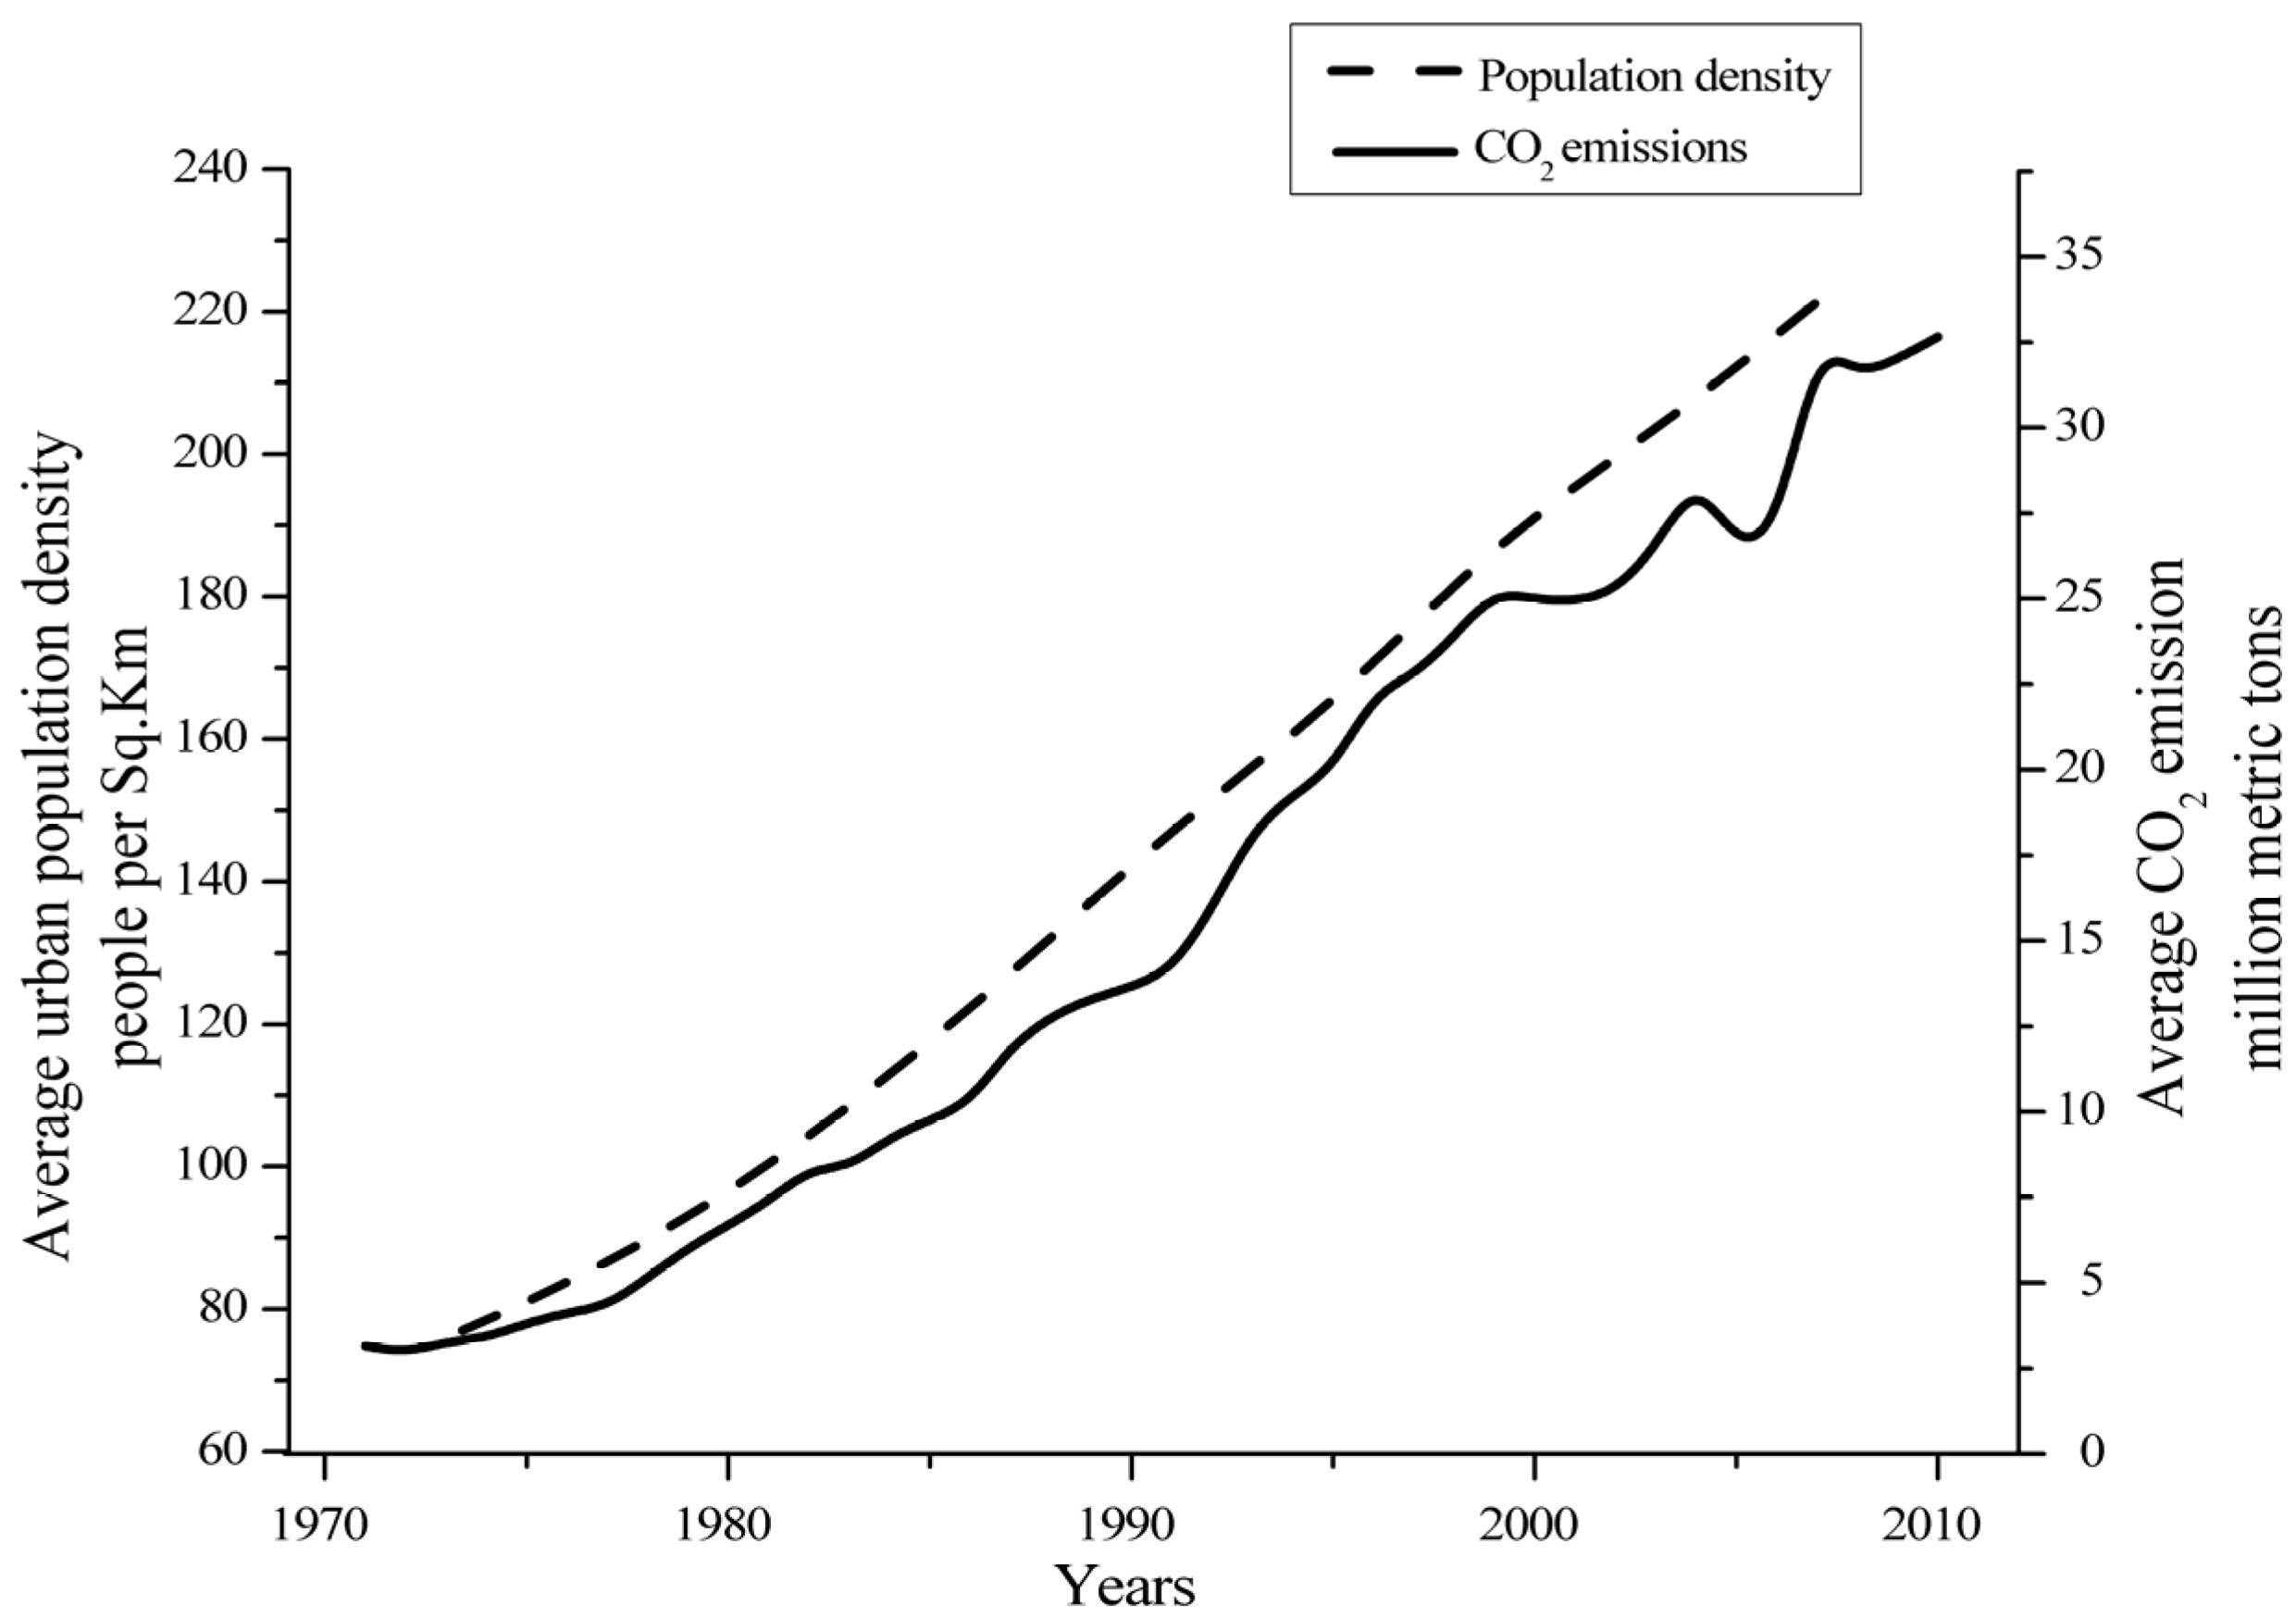
- Shabbir, R.; Ahmad, S.S. Monitoring urban transport air pollution and energy demand in Rawalpindi and Islamabad using leap model. Energy 2010, 35, 2323–2332. [Google Scholar] [CrossRef]
- Von Schneidemesser, E.; Stone, E.A.; Quraishi, T.A.; Shafer, M.M.; Schauer, J.J. Toxic metals in the atmosphere in Lahore, Pakistan. Sci. Total Environ. 2010, 408, 1640–1648. [Google Scholar] [CrossRef] [PubMed]
- Sami, M.; Waseem, A.; Akbar, S. Quantitative estimation of dust fall and smoke particles in Quetta Valley. J. Zhejiang Univ. 2006, 7, 542–547. [Google Scholar] [CrossRef] [PubMed]
- Ilyas, S.Z.; Khattak, A.I.; Nasir, S.M.; Qurashi, T.; Durrani, R. Air pollution assessment in urban areas and its impact on human health in the city of Quetta, Pakistan. Clean. Technol. Environ. Policy 2010, 12, 291–299. [Google Scholar] [CrossRef]
- Government of Pakistan. Population, Labour Force & Employment, Pakistan Federal Bureau of Statistics; Economic Suevey of Pakistan: Islamabad, Pakistan, 2006; pp. 187–199.
- Duhan, D.; Pandey, A. Statistical analysis of long term spatial and temporal trends of precipitation during 1901–2002 at Madhya Pradesh, India. Atmos. Res. 2013, 122, 136–149. [Google Scholar] [CrossRef]
- Gocic, M.; Trajkovic, S. Analysis of changes in meteorological variables using Mann-Kendall and Sen‘s slope estimator statistical tests in Serbia. Glob. Planet. Chang. 2013, 100, 172–182. [Google Scholar] [CrossRef]
- Tabari, H.; Marofi, S.; Aeini, A.; Talaee, P.H.; Mohammadi, K. Trend analysis of reference evapotranspiration in the western half of Iran. Agric. For. Metrol. 2011, 151, 128–136. [Google Scholar] [CrossRef]
- Sen, Z. Innovative Trend Analysis Methodology. J. Hydrol. Eng. 2012, 17, 1042–1046. [Google Scholar] [CrossRef]
- Feng, X.; Zhang, G.; Yin, X. Hydrological Responses to Climate Change in Nenjiang River Basin, Northeastern China. Water Resour. Manag. 2011, 25, 677–689. [Google Scholar] [CrossRef]
- Khaliq, M.N.; Ouarda, T.B.M.J.; Gachon, P.; Sushama, L.; St-Hilaire, A. Identification of hydrological trends in the presence of serial and cross correlations: A review of selected methods and their application to annual flow regimes of Canadian rivers. J. Hydrol. 2009, 368, 117–130. [Google Scholar] [CrossRef]
- Fischer, T.; Gemmer, M.; Lüliu, L.; Buda, S. Temperature and precipitation trends and dryness/wetness pattern in the Zhujiang River Basin, South China, 1961–2007. Quatern. Int. 2011, 244, 138–148. [Google Scholar] [CrossRef]
- Zhang, A.; Zheng, C.; Wang, S.; Yao, Y. Analysis of streamflow variations in the Heihe River Basin, northwest China: Trends, abrupt changes, driving factors and ecological influences. J. Hydrol. 2015, 3, 106–124. [Google Scholar] [CrossRef]
- Sen, P.K. Estimates of the Regression Coefficient Based on Kendall’s Tau. J. Am. Stat. Assoc. 1968, 63, 1379–1389. [Google Scholar] [CrossRef]
- Pingale, S.M.; Khare, D.; Jat, M.K.; Adamowski, J. Spatial and temporal trends of mean and extreme rainfall and temperature for the 33 urban centers of the arid and semi-arid state of Rajasthan, India. Atmos. Res. 2014, 138, 73–90. [Google Scholar] [CrossRef]
- Kahya, E.; Kalaycı, S. Trend analysis of streamflow in Turkey. J. Hydrol. 2004, 289, 128–144. [Google Scholar] [CrossRef]
- Chen, H.; Guo, S.L.; Xu, C.Y.; Singh, V.P. Historical temporal trends of hydro-climatic variables and runoff response to climate variability and their relevance in water resource management in the Hanjiang basin. J. Hydrol. 2007, 344, 171–184. [Google Scholar] [CrossRef]
- Galdies, C. Temperature trends in Malta (central Mediterranean) from 1951 to 2010. Meteorol. Atmos. Phys. 2012, 117, 135–143. [Google Scholar] [CrossRef]
- Ambreen, R.; Qiu, X.; Ahmad, I. Distributed modeling of extraterrestrial solar radiation over the rugged terrains of Pakistan. J. Mt. Sci. 2011, 8, 427–436. [Google Scholar] [CrossRef]
- Chema, M.A.; Farooq, M.; Ahmad, R.; Munir, H. Climatic Trends in Faisalabad (Pakistan) Over the Last 60 Years (1945–2004). J. Agric. Soc. Sci. 2006, 2, 42–45. [Google Scholar]
- Singh, D.; Jain, S.; Gupta, R. Trend in observed and projected maximum and minimum temperature over N-W Himalayan basin. J. Mt. Sci. 2015, 12, 417–433. [Google Scholar] [CrossRef]
- Oguntunde, P.G.; Abiodun, B.J.; Lischeid, G. Spatial and temporal temperature trends in Nigeria, 1901–2000. Meteorol. Atmos. Phys. 2012, 118, 95–105. [Google Scholar] [CrossRef]
- Chen, X.L.; Li, L.W.; Zhu, Q.W.; Zhou, J.X.; Zhou, J.Z.; Liu, L.H. Seasonal trends of climate change in the Yangtze Delta and its adjacent regions and their formation mechanisms. Meteorol. Atmos. Phys. 2005, 92, 11–23. [Google Scholar] [CrossRef]
- Araghi, A.; Mousavi-Baygi, M.; Adamowski, J. Detection of trends in days with extreme temperatures in Iran from 1961 to 2010. Theor. Appl. Climatol. 2015, 125, 213–225. [Google Scholar] [CrossRef]
- Xu, Z.; Liu, Z.; Fu, G.; Chen, Y. Trends of major hydroclimatic variables in the Tarim River basin during the past 50 years. J. Arid Environ. 2010, 74, 256–267. [Google Scholar] [CrossRef]
- Qian, W.; Lin, X. Regional trends in recent precipitation indices in China. Meteorol. Atmos. Phys. 2005, 90, 193–207. [Google Scholar] [CrossRef]
- Qian, W.; Lin, X. Regional trends in recent temperature indices in China. Clim. Res. 2004, 27, 119–134. [Google Scholar] [CrossRef]
- Cheema, S.B.R.G.; Kazmi, H.D. Evaluation of Projected Minimum Temperatures for Northern Pakistan. Pak. J. Meteorol. 2010, 7, 63–70. [Google Scholar]
- Tahir, A.A.; Adamowski, J.F.; Chevallier, P.; Haq, A.U.; Terzago, S. Comparative assessment of spatiotemporal snow cover changes and hydrological behavior of the Gilgit, Astore and Hunza River basins (Hindukush–Karakoram–Himalaya region, Pakistan). Meteorol. Atmos. Phys. 2016, 128, 1–19. [Google Scholar] [CrossRef]


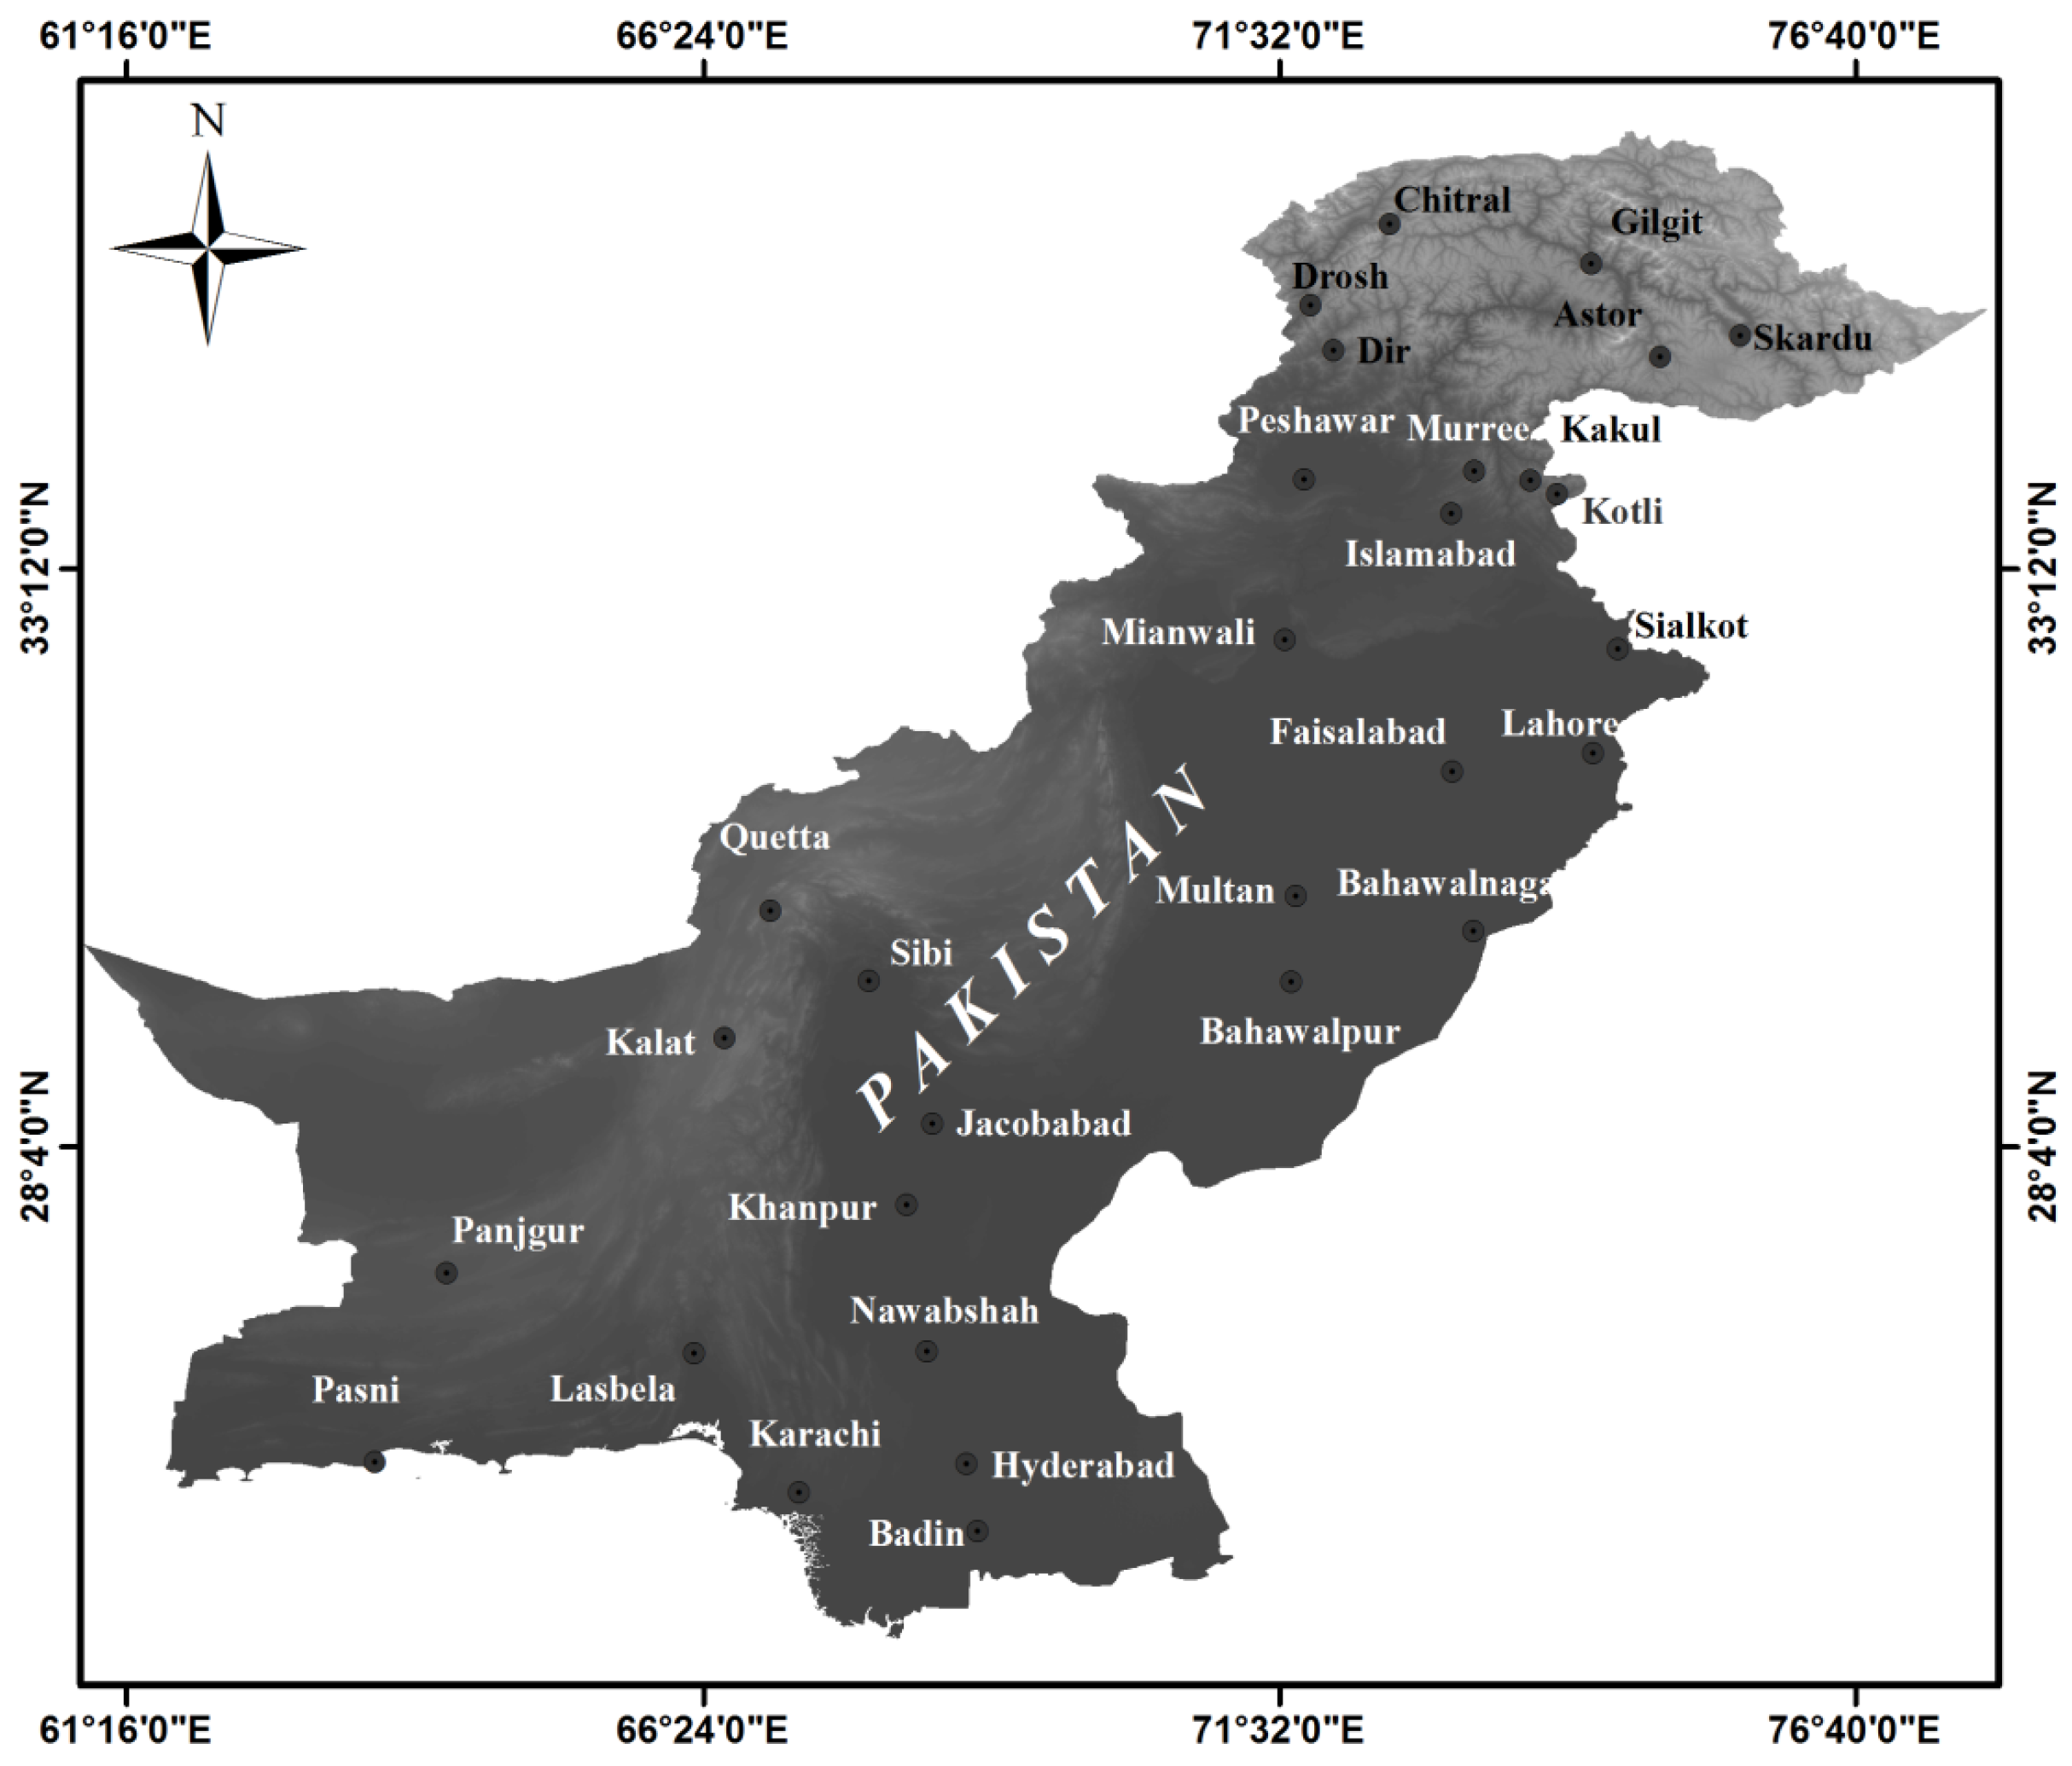
| Station No | Station | Latitude (E) | Longitude (N) | Elevation (m a.s.l *) | Climatic Zone |
|---|---|---|---|---|---|
| 1 | Skardu | 35°30′ | 75°68′ | 2317 | Humid to arid |
| 2 | Chitral | 35°85′ | 71°83′ | 1498 | Humid to arid |
| 3 | Gilgit | 35°55′ | 74°20′ | 1460 | Humid to arid |
| 4 | Drosh | 35°56′ | 71°85′ | 1464 | Humid to arid |
| 5 | Dir | 35°20′ | 71°85′ | 1375 | Humid to arid |
| 6 | Astor | 35°33′ | 74°90′ | 2168 | Humid to arid |
| 7 | Peshawar | 34°02′ | 71°56′ | 327 | Humid to arid |
| 8 | Kakul | 34°18′ | 73°25′ | 1308 | Humid to arid |
| 9 | Kotli | 33°51′ | 73°90′ | 614 | Humid to arid |
| 10 | Murree | 33°91′ | 73°38′ | 2167 | Humid to arid |
| 11 | Sialkot | 32°51′ | 74°53′ | 255 | Tropical to continental |
| 12 | Multan | 30°20′ | 71°43′ | 122 | Tropical to continental |
| 13 | Faisalabad | 31°43′ | 73°13′ | 186 | Tropical to continental |
| 14 | Lahore | 31°33′ | 74°20′ | 214 | Tropical to continental |
| 15 | Bahawalpur | 29°20′ | 71°47′ | 110 | Tropical to continental |
| 16 | Bahawalnagar | 29°20′ | 73°51′ | 161 | Tropical to continental |
| 17 | Mianwali | 32°91′ | 71°85′ | 212 | Tropical to continental |
| 18 | Islamabad | 33°72′ | 73°04′ | 579 | Tropical to continental |
| 19 | Badin | 24°38′ | 68°54′ | 9 | Arid |
| 20 | Hyderabad | 25°23′ | 68°25′ | 28 | Arid |
| 21 | Nawabshah | 26°15′ | 68°22′ | 37 | Arid |
| 22 | Jacobabad | 28°18′ | 68°28′ | 55 | Arid |
| 23 | Khanpur | 27°53′ | 68°23′ | 53 | Arid |
| 24 | Karachi | 24°54′ | 66°56′ | 22 | Coastal |
| 25 | Sibi | 28°95′ | 66°91′ | 133 | Hyper arid |
| 26 | Panjgur | 26°96′ | 64°10′ | 968 | Hyper arid |
| 27 | Lasbela | 26°23′ | 66°16′ | 87 | Hyper arid |
| 28 | Pasni | 25°26′ | 63°48′ | 9 | Hyper arid |
| 29 | Quetta | 30°11′ | 66°57′ | 1626 | Dry |
| 30 | Kalat | 29°02′ | 66°35′ | 2015 | Hyper arid |
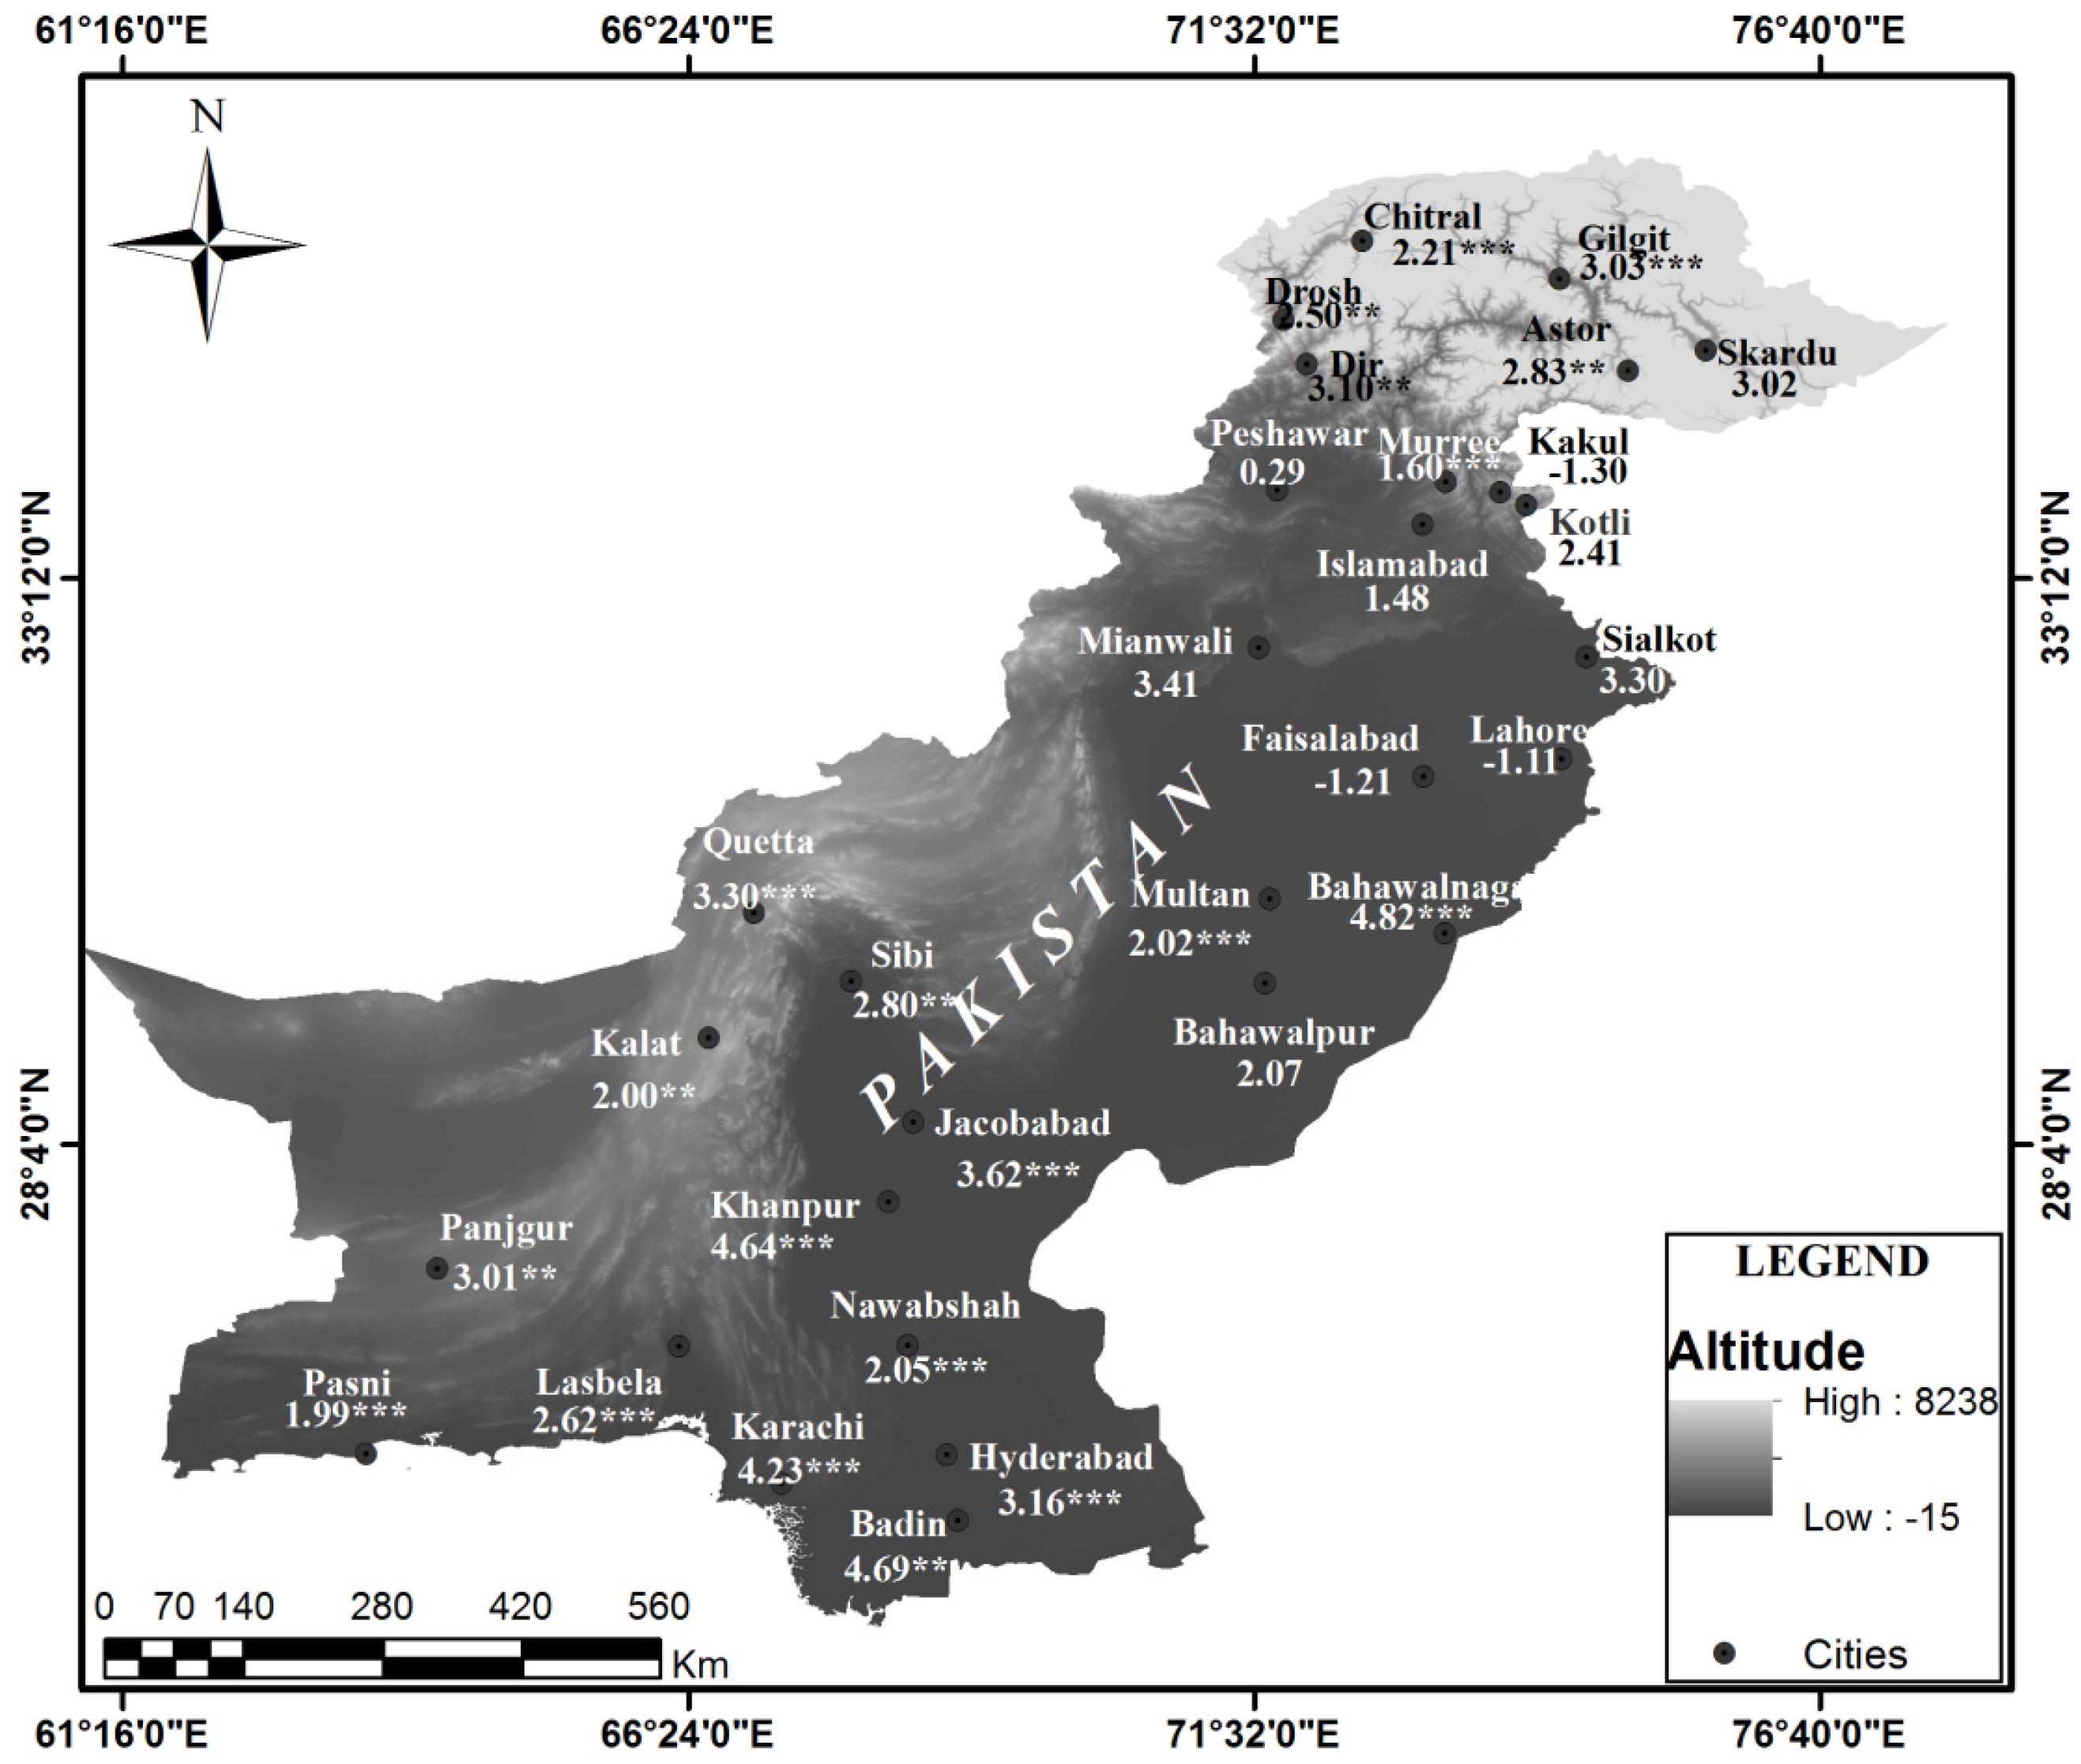
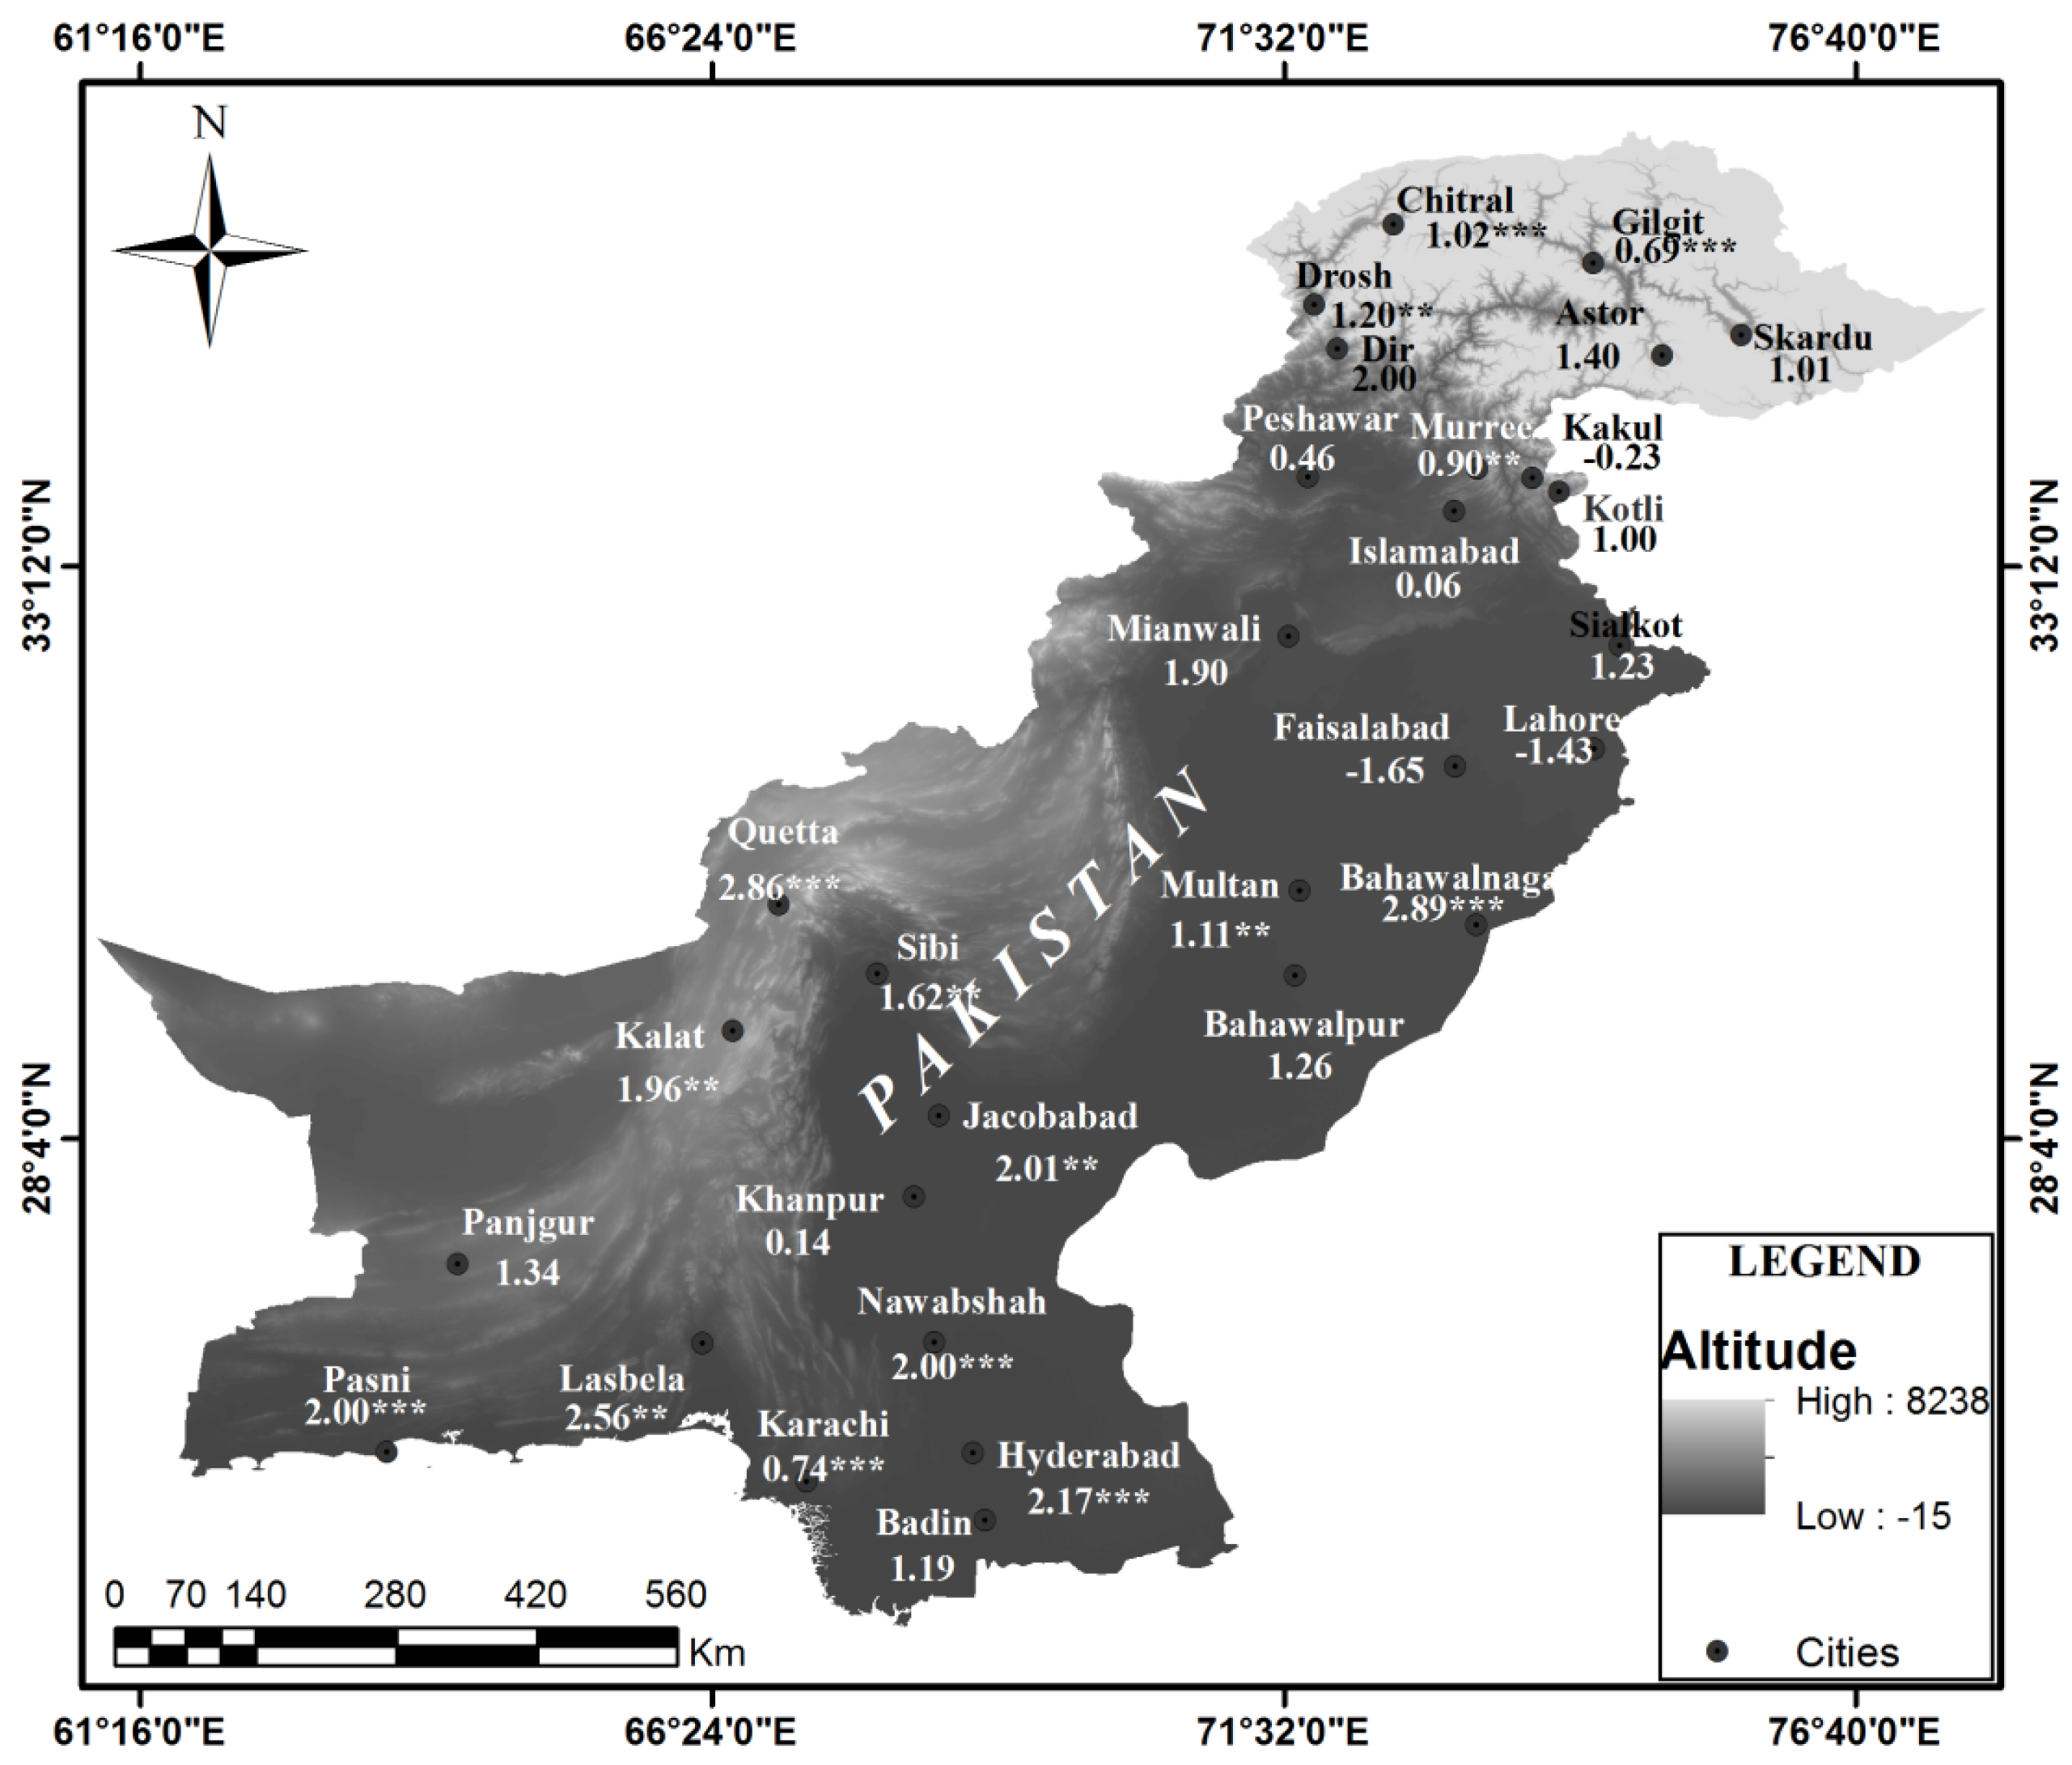
| Station No | Station | Annual Tavg | Annual Tmax | ||||
|---|---|---|---|---|---|---|---|
| Mann-Kendall (Z) | Sen’s Slope (Q) | Regression Slopes (r) | Mann-Kendall (Z) | Sen’s Slope (Q) | Regression Slopes (r) | ||
| 1 | Skardu | 3.02 | 0.02 | 0.015 | 1.01 | 0.02 | 0.027 |
| 2 | Chitral | 2.21 *** | 0.03 | 0.04 *** | 1.02 *** | 0.031 | 0.048 *** |
| 3 | Gilgit | 3.06 *** | 0.049 | 0.035 *** | 0.69 *** | 0.031 | 0.013 |
| 4 | Drosh | 2.50 ** | 0.02 | 0.04 ** | 1.20 ** | 0.01 | 0.014 ** |
| 5 | Dir | 3.10 ** | 0.02 | 0.01 ** | 2.00 | 0.03 | 0.051 |
| 6 | Astor | 2.83 ** | 0.03 | 1.92 ** | 1.40 | 0.02 | 0.034 |
| 7 | Peshawar | 0.29 | 0.02 | 0.003 | 0.46 | 0.01 | 0.008 |
| 8 | Kakul | −1.30 | −0.01 | −0.002 | −0.23 | −0.01 | −0.030 |
| 9 | Kotli | 2.41 | 0.03 | 0.24 | 1.00 | 0.01 | 0.024 |
| 10 | Murree | 1.60 *** | 0.01 | 0.2 *** | 0.90 ** | 0.03 | 0.045 ** |
| 11 | Sialkot | 3.30 | 0.03 | 0.043 | 1.23 | 0.03 | 0.043 |
| 12 | Multan | 2.02 *** | 0.02 | 0.14 *** | 1.11 ** | 0.02 | 0.031 ** |
| 13 | Faisalabad | −1.21 | −0.02 | −0.019 | −1.65 | −0.03 | −0.025 |
| 14 | Lahore | −1.11 | −0.01 | −0.009 | −1.43 | −0.02 | −0.023 |
| 15 | Bahawalpur | 2.07 | 0.03 | 0.06 | 1.26 | 0.03 | 0.0281 |
| 16 | Bahawalnagar | 4.82 *** | 0.03 | 0.054 *** | 2.89 *** | 0.02 | 0.034 *** |
| 17 | Mianwali | 3.41 | 0.02 | 0.031 | 1.90 | 0.03 | 0.041 |
| 18 | Islamabad | 1.48 | 0.01 | 0.014 | 0.06 | 0.01 | 0.002 |
| 19 | Badin | 4.69 ** | 0.03 | 0.043 ** | 1.19 | 0.01 | 0.02 |
| 20 | Hyderabad | 3.16 *** | 0.049 | 0.054 *** | 2.17 *** | 0.02 | 0.025 ** |
| 21 | Nawabshah | 2.05 *** | 0.026 | 0.035 *** | 2.00 *** | 0.031 | 0.036 *** |
| 22 | Jacobabad | 3.62 *** | 0.03 | 0.041*** | 2.01 ** | 0.01 | 0.02 ** |
| 23 | Khanpur | 4.64 *** | 0.03 | 0.039 *** | 0.14 | 0.01 | 0.023 |
| 24 | Karachi | 4.23 *** | 0.03 | 0.029 *** | 0.74 *** | 0.017 | 0.025 |
| 25 | Sibi | 2.80 ** | 0.03 | 0.05 *** | 1.62 ** | 0.02 | 0.03 |
| 26 | Panjgur | 3.01 ** | 0.03 | 0.029 ** | 1.34 | 0.03 | 0.029 |
| 27 | Lasbela | 2.62 *** | 0.049 | 0.042 *** | 2.56 ** | 0.03 | 0.034 ** |
| 28 | Pasni | 1.99 *** | 0.03 | 0.041 *** | 2.00 *** | 0.02 | 0.013 *** |
| 29 | Quetta | 3.30 *** | 0.049 | 0.0405 ** | 2.86 *** | 0.031 | 0.041 ** |
| 30 | Kalat | 2.00 ** | 0.02 | 0.3 ** | 1.96 ** | 0.01 | 0.03 ** |
© 2017 by the authors; licensee MDPI, Basel, Switzerland. This article is an open access article distributed under the terms and conditions of the Creative Commons Attribution (CC-BY) license (http://creativecommons.org/licenses/by/4.0/).
Share and Cite
Anjum, R.; He, X.; Tanoli, J.I.; Raza, S.T. Contemporary Temperature Fluctuation in Urban Areas of Pakistan. Atmosphere 2017, 8, 12. https://doi.org/10.3390/atmos8010012
Anjum R, He X, Tanoli JI, Raza ST. Contemporary Temperature Fluctuation in Urban Areas of Pakistan. Atmosphere. 2017; 8(1):12. https://doi.org/10.3390/atmos8010012
Chicago/Turabian StyleAnjum, Raheel, Xiubin He, Javed Iqbal Tanoli, and Syed Turab Raza. 2017. "Contemporary Temperature Fluctuation in Urban Areas of Pakistan" Atmosphere 8, no. 1: 12. https://doi.org/10.3390/atmos8010012