Article

Effects of N Fertilizer Application on Soil N2O Emissions and CH4 Uptake: A Two-Year Study in an Apple Orchard in Eastern China

1
Key Laboratory of Coastal Zone Environmental Processes and Ecological Remediation, CAS, Shandong Provincial Key Laboratory of Coastal Environmental Processes, Yantai Institute of Coastal Zone Research, Chinese Academy of Sciences, Yantai 264003, China
2
College of Natural Resources and Environment, Northwest A&F University, Yangling 712100, China
3
College of Resources and Environmental Engineering, Ludong University, Yantai 264025, China
4
State Key Laboratory of Atmospheric Boundary Layer Physics and Atmospheric Chemistry, Institute of Atmospheric Physics, Chinese Academy of Sciences, Beijing 100029, China
5
Agricultural Resources and Environment Institute, Shandong Academy of Agricultural Sciences, Jinan 250100, China
*
Authors to whom correspondence should be addressed.
Atmosphere 2017, 8(10), 181; https://doi.org/10.3390/atmos8100181
Submission received: 18 August 2017 / Revised: 11 September 2017 / Accepted: 14 September 2017 / Published: 21 September 2017
(This article belongs to the Special Issue C and N Cycling and Greenhouse Gases Emission in Agroecosystem)

Abstract

:
Land use changes from cropland to orchards in Eastern China have raised serious concerns about the regional nitrogen (N) cycle and greenhouse gas balance. We measured soil nitrous oxide (N2O) emissions and methane (CH4) uptake using manual static chambers in an apple orchard. The primary aims were to assess the effect of N fertilizer application on gas fluxes and quantify the site-specific N2O emission factor (EFd). Field experiments were arranged in a randomized block design with three N input rates (0, 800 and 2600/2000 kg N ha−1 year−1). We found that orchard soils were a negligible CH4 sink (−1.1 to −0.4 kg C ha−1 year−1). Annual N2O emissions responded positively to N input rates, ranging from 34.1 to 60.3 kg N ha−1 year−1. EFd ranged from 1.00% to 1.65% with a mean of 1.34%. The extremely large background emissions of N2O (34.1–34.3 kg N ha−1 year−1) most likely originated from nitrate accumulation in the soil profile because of historical overuse of N fertilizer. We conclude that (1) site-specific EFd is suitable for assessing regional direct N2O emissions from upland orchards; and (2) conventional fertilization regimes must be avoided, and reduced N input rates are recommended in the study region.

1. Introduction

Nitrous oxide (N2O) and methane (CH4) are potent greenhouse gases. Together, they are responsible for 30% of global radiative forcing [1]. Atmospheric concentrations of N2O and CH4 have increased by 20% and 150%, respectively, since 1750, most likely due to human activities related to agriculture [1]. Reducing N2O emissions from and enhancing CH4 uptake by upland agricultural ecosystems could help mitigate anthropogenic contributions to global warming [2].
Agricultural soils are responsible for 60–80% of anthropogenic N2O sources [3,4]. Soil N2O is primarily produced through microbial processes such as nitrification, denitrification, and nitrifier denitrification, which may occur simultaneously in soil aggregates if inorganic nitrogen (NH4+ and NO3) substrates are available and soils are aerated [5,6]. Denitrification becomes the major source of N2O when oxygen concentrations in soil air are limited, primarily when a soil’s water-filled pore space (WFPS) is greater than 60% [7,8]. In field measurements, large N2O emissions usually occur when nitrogen (N) fertilizer applications are accompanied by rainfall or irrigation events [9,10,11,12,13,14]. Annual N2O emissions have been shown to increase with N input rates; this fact led to the development of the direct emission factor (EFd) concept [15,16,17]. EFd is the fraction of N fertilizer lost as N2O for a given year or season and has been widely used to calculate global and regional N2O emissions [3,4,18]. To compile national N2O emissions inventories, IPCC Guidelines [19] provide a default EFd of 1% and a large uncertainty range (from 0.3% to 3%) for cultivated mineral soils. Such uncertainty is primarily due to the complex relationships between N2O emissions and soil properties, climate, and artificial practices [11,12,20,21]. Although the N2O flux data recorded has increased in recent years, there is still a great deal of uncertainty in the assessment of EFd, and therefore N2O, emissions [15,18,20]. The quantification of site-specific EFd is critical to the accurate assessment of N2O emissions in a given region [18,21,22].
Agricultural activities, notably fermentative digestion by ruminant livestock, manure management, and rice grown under flooded conditions, account for approximately 60% of anthropogenic CH4 emissions [1]. Upland agricultural soils also remove CH4 from the atmosphere through oxidation by aerobic methanotrophic bacteria, but this effect is small. Large soil water and NH4+ quantities significantly inhibit CH4 uptake [23,24].
In Eastern and Northwestern China, large amounts of cropland have been converted to orchards and vegetable fields for economic benefits [25]. Together, these two regions account for 87.8% and 88.7% of the national apple acreage and yield, respectively [26]. This land use change raises serious concerns about the regional N cycle and greenhouse gas balance [27,28]. In Eastern China, the mean N application rate was 603 kg N ha−1 year−1 for cropland in 2006, while the rate was an average 842 and 3239 kg N ha−1 year−1 for orchards and greenhouse vegetables, respectively [27]. Previous research has revealed that the overuse of N fertilizer leads to excessive N substrates in the soil profile beneath cereals and is associated with NO3 leaching and N2O emissions [9,29,30]. However, the impact of intensive N management on N2O and CH4 fluxes in upland orchards is not well understood because quantitative information on this topic is scarce. Reported N2O emissions from orchard soils range from 0.5 to 8.6 kg N ha−1 year−1 and vary in response to climate, land use, and management practices [14,31,32,33,34,35]. These observations are similar to most cropland-related N2O emissions reviewed in Stehfest and Bouwman [20]. These results are reasonable because the N input rates analyzed in these studies were largely within 200–300 kg N ha−1 year−1, which is similar to input rates in most croplands. However, it is unclear whether these previous observations can be extrapolated more generally to Eastern China due to the extremely large N input rates.
With respect to local soil management, we hypothesized that annual N2O losses and EFd were significant in an upland orchard in Eastern China. We measured soil N2O emissions and CH4 uptake regularly in an irrigated apple orchard between 2010 and 2011. The primary aims of this study were to assess the effect of N input rates on gas fluxes and quantify site-specific EFd.

2. Experiments

2.1. Site Description

The experimental sites were located in an orchard (37°49′ N, 120°45′ E) dominated by Fuji apple trees in the suburb of Penglai County, Shandong province, one of the major apple-producing regions in Eastern China. This region is characterized by a warm, temperate, continental monsoon climate, with a mean long-term (1961–1990) annual precipitation value of 664 mm, an annual mean air temperature of 11.9 °C, and an annual frost-free period of 206 days. The orchard is approximately 2 ha square and was converted from a winter wheat field in 2002. Apples were first harvested from the orchard in October 2005. The tree density was 620 tree ha−1, and the size of the canopy of an adult apple tree was approximately 16 m2. Topsoil properties (0–20 cm layer) at the beginning of the study (October 2009) are listed in Table 1.

2.2. Experimental Design

Field measurements were conducted from January 2010 to December 2011. Three N fertilizer rate treatments for each year (0, 800, and 2600 kg N ha−1 year−1 in 2010 and 0, 800, and 2000 kg N ha−1 year−1 in 2011, hereafter referred to as CK, LN, and HN, respectively) were arranged in a randomized block design. Each treatment was replicated three times. HN represents the conventional treatment or sites where the soils have been under similar management since 2002. LN represents sites where the recommended management practice was instituted. In both the LN and HN treatments, urea was applied in separate applications of 50%, 15%, and 35%, the first in early April (basal application), the second in late June (first topdressing), and the last in late August (second topdressing), respectively. The basal fertilizers were buried in ditches (length × width × depth = 1.0 m × 0.3 m × 0.2 m) that were evenly arranged around each apple tree like a cross. The positions of the fertilizer ditches were changed every year. The dressing fertilizers were applied at the surface under the tree canopies one day after a rainfall or irrigation event. The proportion of the fertilizer ditches and bare soil areas at the field scale was 15% and 85%, respectively. All three treatments received a single application of phosphorus (400 kg P2O5 ha−1 year−1) and two separate applications of potassium (800 kg K2O ha−1 year−1). The soils were flood irrigated with underground water three to five times each year, depending on the precipitation pattern. The water input rate for each irrigation event was similar to a rainfall event of 40 mm. More information about the fertilization and irrigation regimes can be found in Table 2. Pesticides and fungicides were applied as a foliar spray two or three times each year to control pests and diseases.
Treatment CK was not fertilized with N fertilizer in the studied years. Treatment LN was fertilized with urea at 800 kg N ha−1 year−1 in both years. Treatment HN was fertilized with urea at 2600 and 2000 kg N ha−1 year−1 in 2010 and 2011, respectively. All treatments were fertilized with phosphorus (400 kg P2O5 ha−1 year−1) and potassium (800 kg K2O ha−1 year−1) and flood irrigated.

2.3. Measurement of N2O and CH4 Fluxes

Manual static chambers were used to measure gas fluxes [36]. Considering the spatial heterogeneity of the basal fertilizer applications, we sampled gases at both fertilizer ditches (FD) and the bare soil (BS) under selected tree canopies in each replicate. A stainless-steel frame (length × width × depth = 0.5 m × 0.5 m × 0.2 m) was permanently inserted approximately 15 cm deep in the soil at each sampling site. During gas flux measurements, a stainless-steel chamber (length × width × height = 0.5 m × 0.5 m × 0.5 m) was mounted on the frame for 30 min, and five gas samples (20 mL) were taken with plastic syringes at 6 min intervals. The sampling process was always completed between 8:00 and 10:00 (local time) on each sampling date, and the sites were monitored in a random order. Gases were usually sampled once a week and up to four times a week for one week after each fertilization event. Previous research has shown that weekly N2O flux measurements complemented by additional event-related flux determinations provide accurate annual emission estimates [10,37,38]. N2O and CH4 concentrations were analyzed within 12-h of sampling using a gas chromatograph (7890A, Agilent Technologies Inc., Santa Clara, CA, USA) equipped with an electron capture detector and a hydrogen flame ionization detector [39].
Gas flux was calculated from the initial change rate of N2O and CH4 concentrations during deployment in the chamber [40]. Only when the linear regression of the gas concentrations and the enclosure time was statistically significant at p < 0.05 was the initial change rate was accepted to calculate a valid flux value. Annual N2O emissions and CH4 uptake were estimated via the linear interpolation of data points. Fluxes were extrapolated to the field scale using the ratio of FD to BS areas (0.38). EFd was the fraction of the differences between annual N2O emissions from the fertilized and unfertilized treatments to the N input rate at the field scale in the analyzed year.

2.4. Ancillary Measurements

Local weather conditions were provided by the China Meteorological Administration. Soil temperatures and volumetric soil water content (VSWC) at 10 cm depth were measured automatically once an hour (SMSC04 soil moisture station, Beijing Unism Technologies Inc., Beijing, China) across a 100 m2 region. Daily soil temperature and VSWC were calculated as the mean of the time series for the three replicates and presented as the mean condition within the experimental orchard. The VSWC measurements were converted to WFPS with an assumed soil particle density of 2.65 g cm−3.
In 2010, three augers of soil (0–10 cm layer) were randomly collected near each chamber once every two weeks and mixed into one sample until thoroughly combined (approximately 1–2 kg of fresh soil). The fresh soil samples were divided into two sub-samples. One sub-sample (5 g) was extracted with deionized water (soil:water = 1:5). The extracts were immediately filtered through a polyethersulfone membrane (45 μm pore size) and analyzed for dissolved organic carbon (DOC) using an organic carbon analyzer (TOC-5000A, Shimadzu, Kyoto, Japan). The other sub-sample (5 g) was extracted with a KCl solution (2 mol L−1) to determine the NH4+ and NO3 contents using an automated discrete photometric analyzer (AA2, BRAN & Lubbe, Nordstedt, Germany).
Towards the end of October in each year, we harvested and weighed fresh apples from randomly selected trees in each treatment. The orchard’s production was extrapolated to the field scale using the tree density.

2.5. Statistical Analysis

Statistical analyses were performed using SYSTAT for Windows (version 12.0 Systat Software Inc., Chicago, IL, USA). Differences in N2O and CH4 emissions and soil parameters among various treatments were determined statistically using one-way ANOVA analysis. Linear regressions were used to assess the relationships between gas fluxes and selected soil parameters.

3. Results

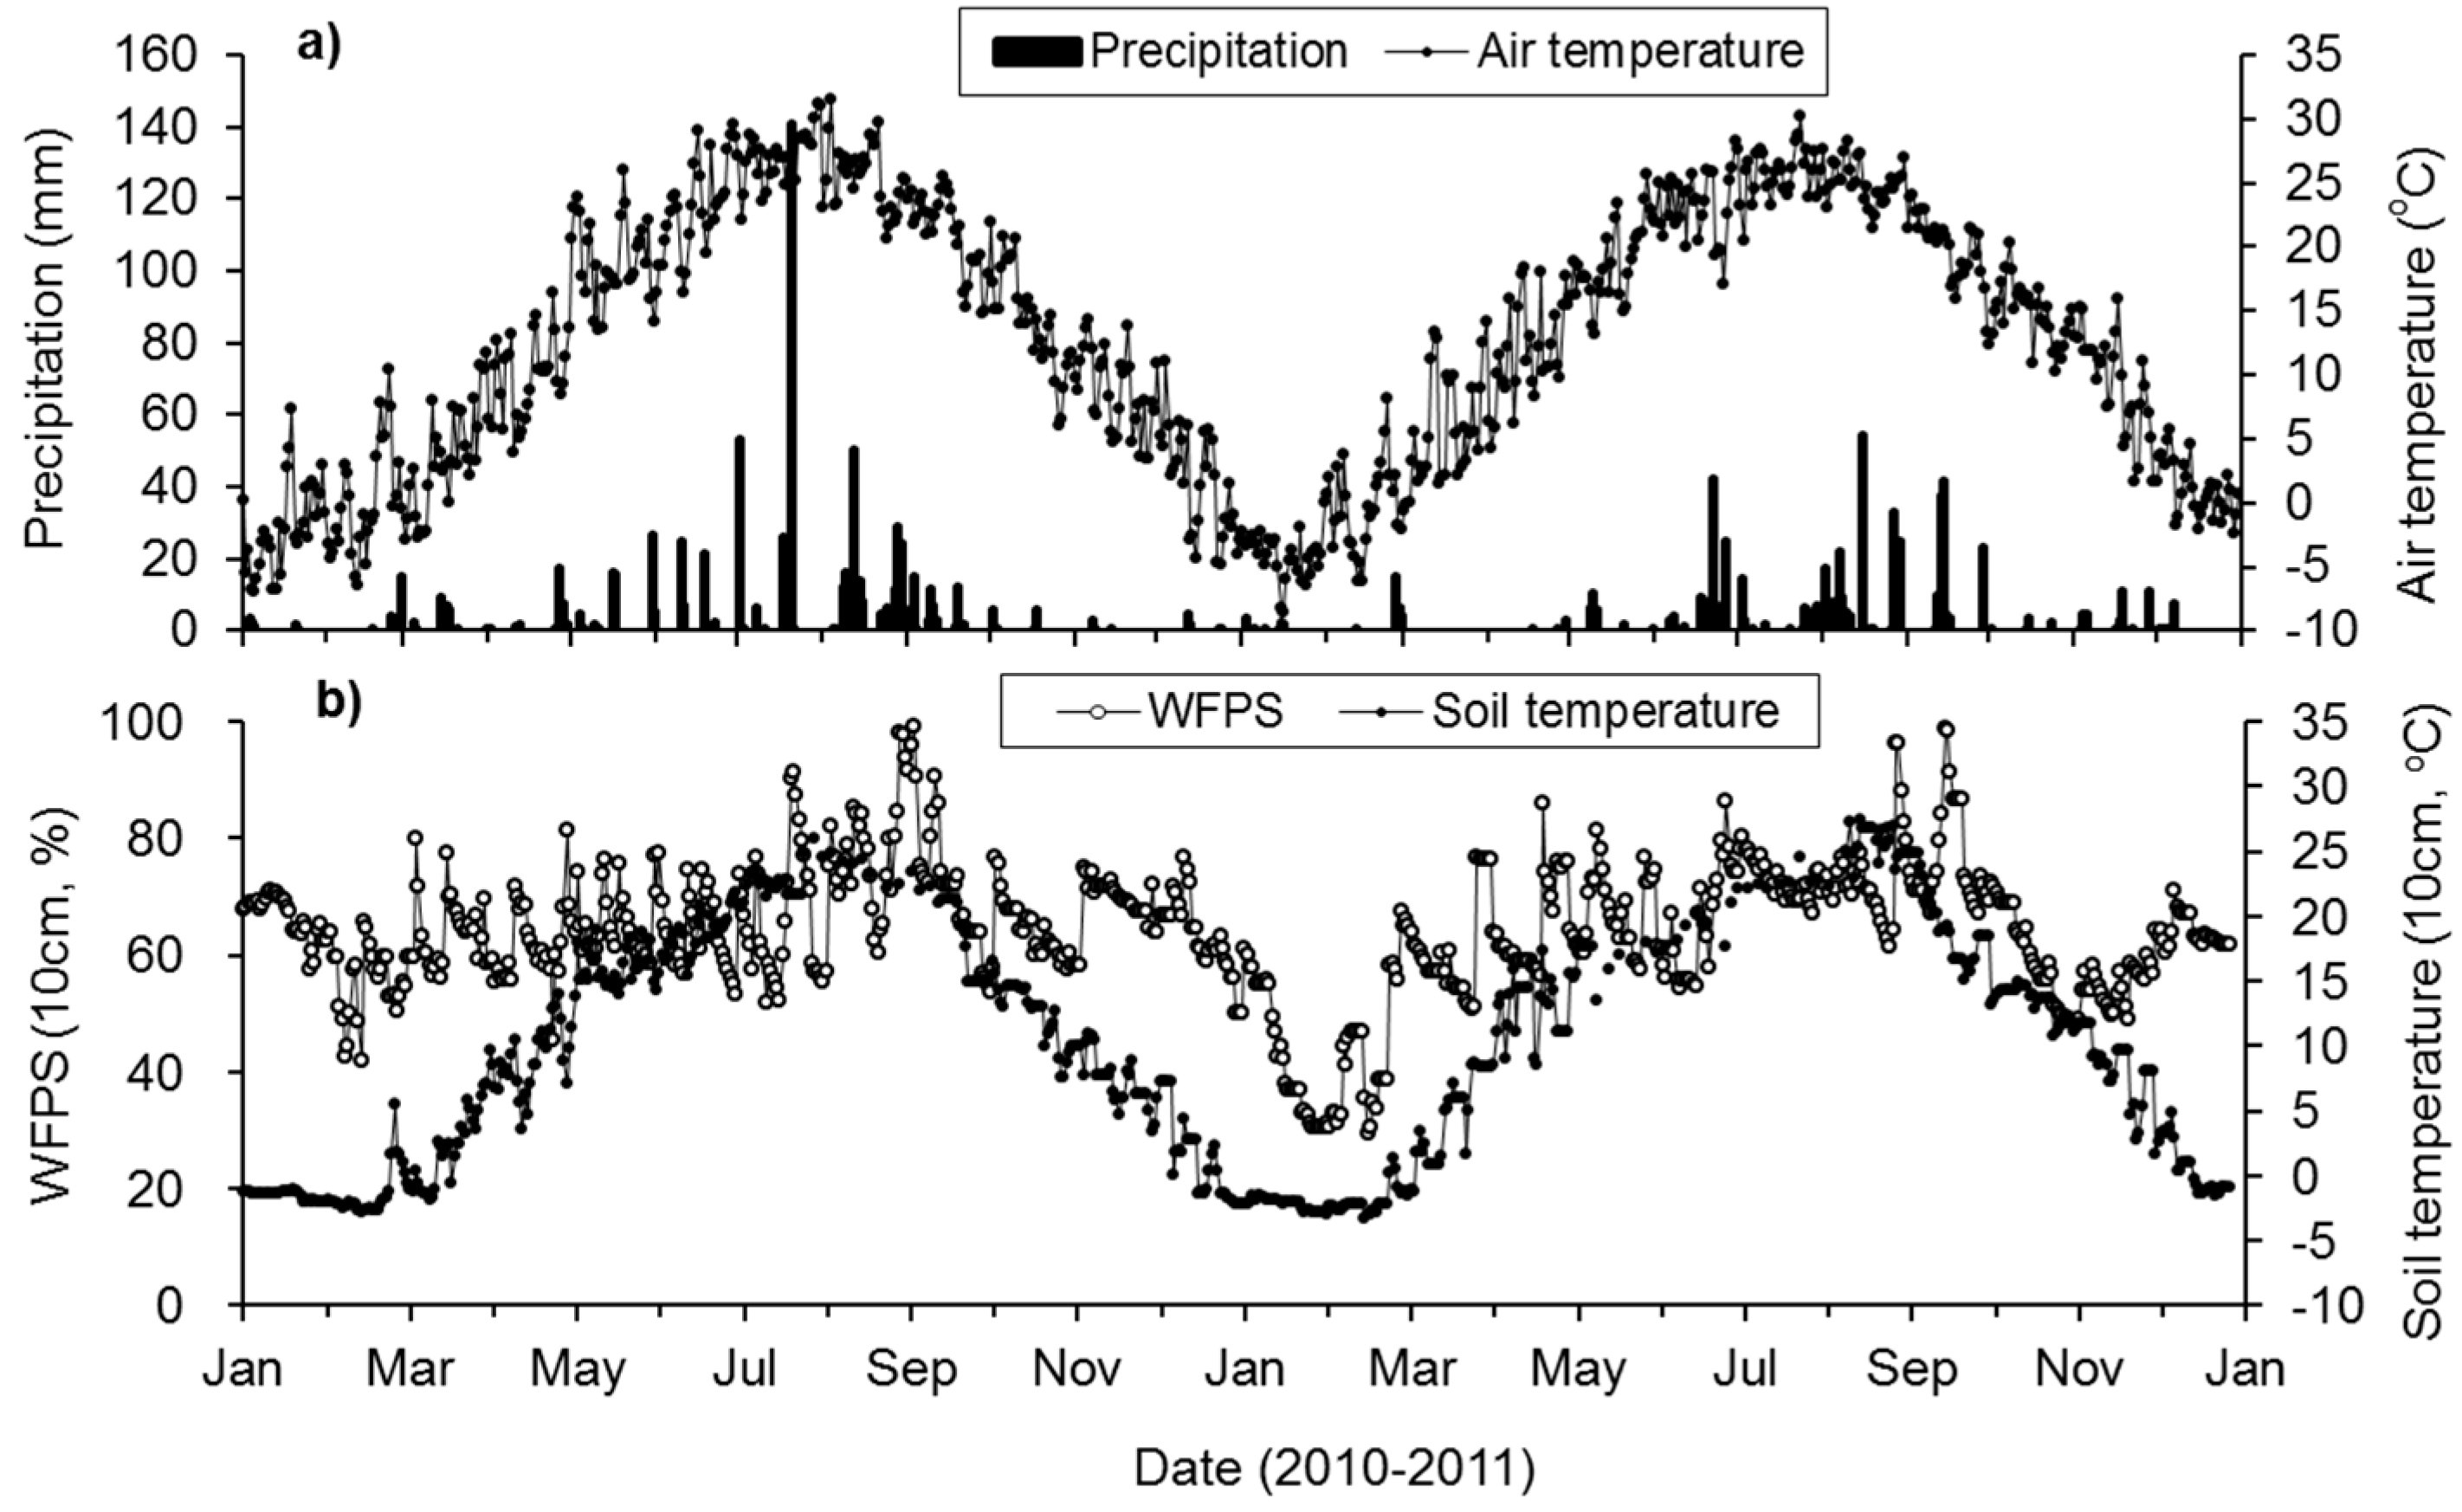
3.1. Climate, Soil Temperature, and WFPS
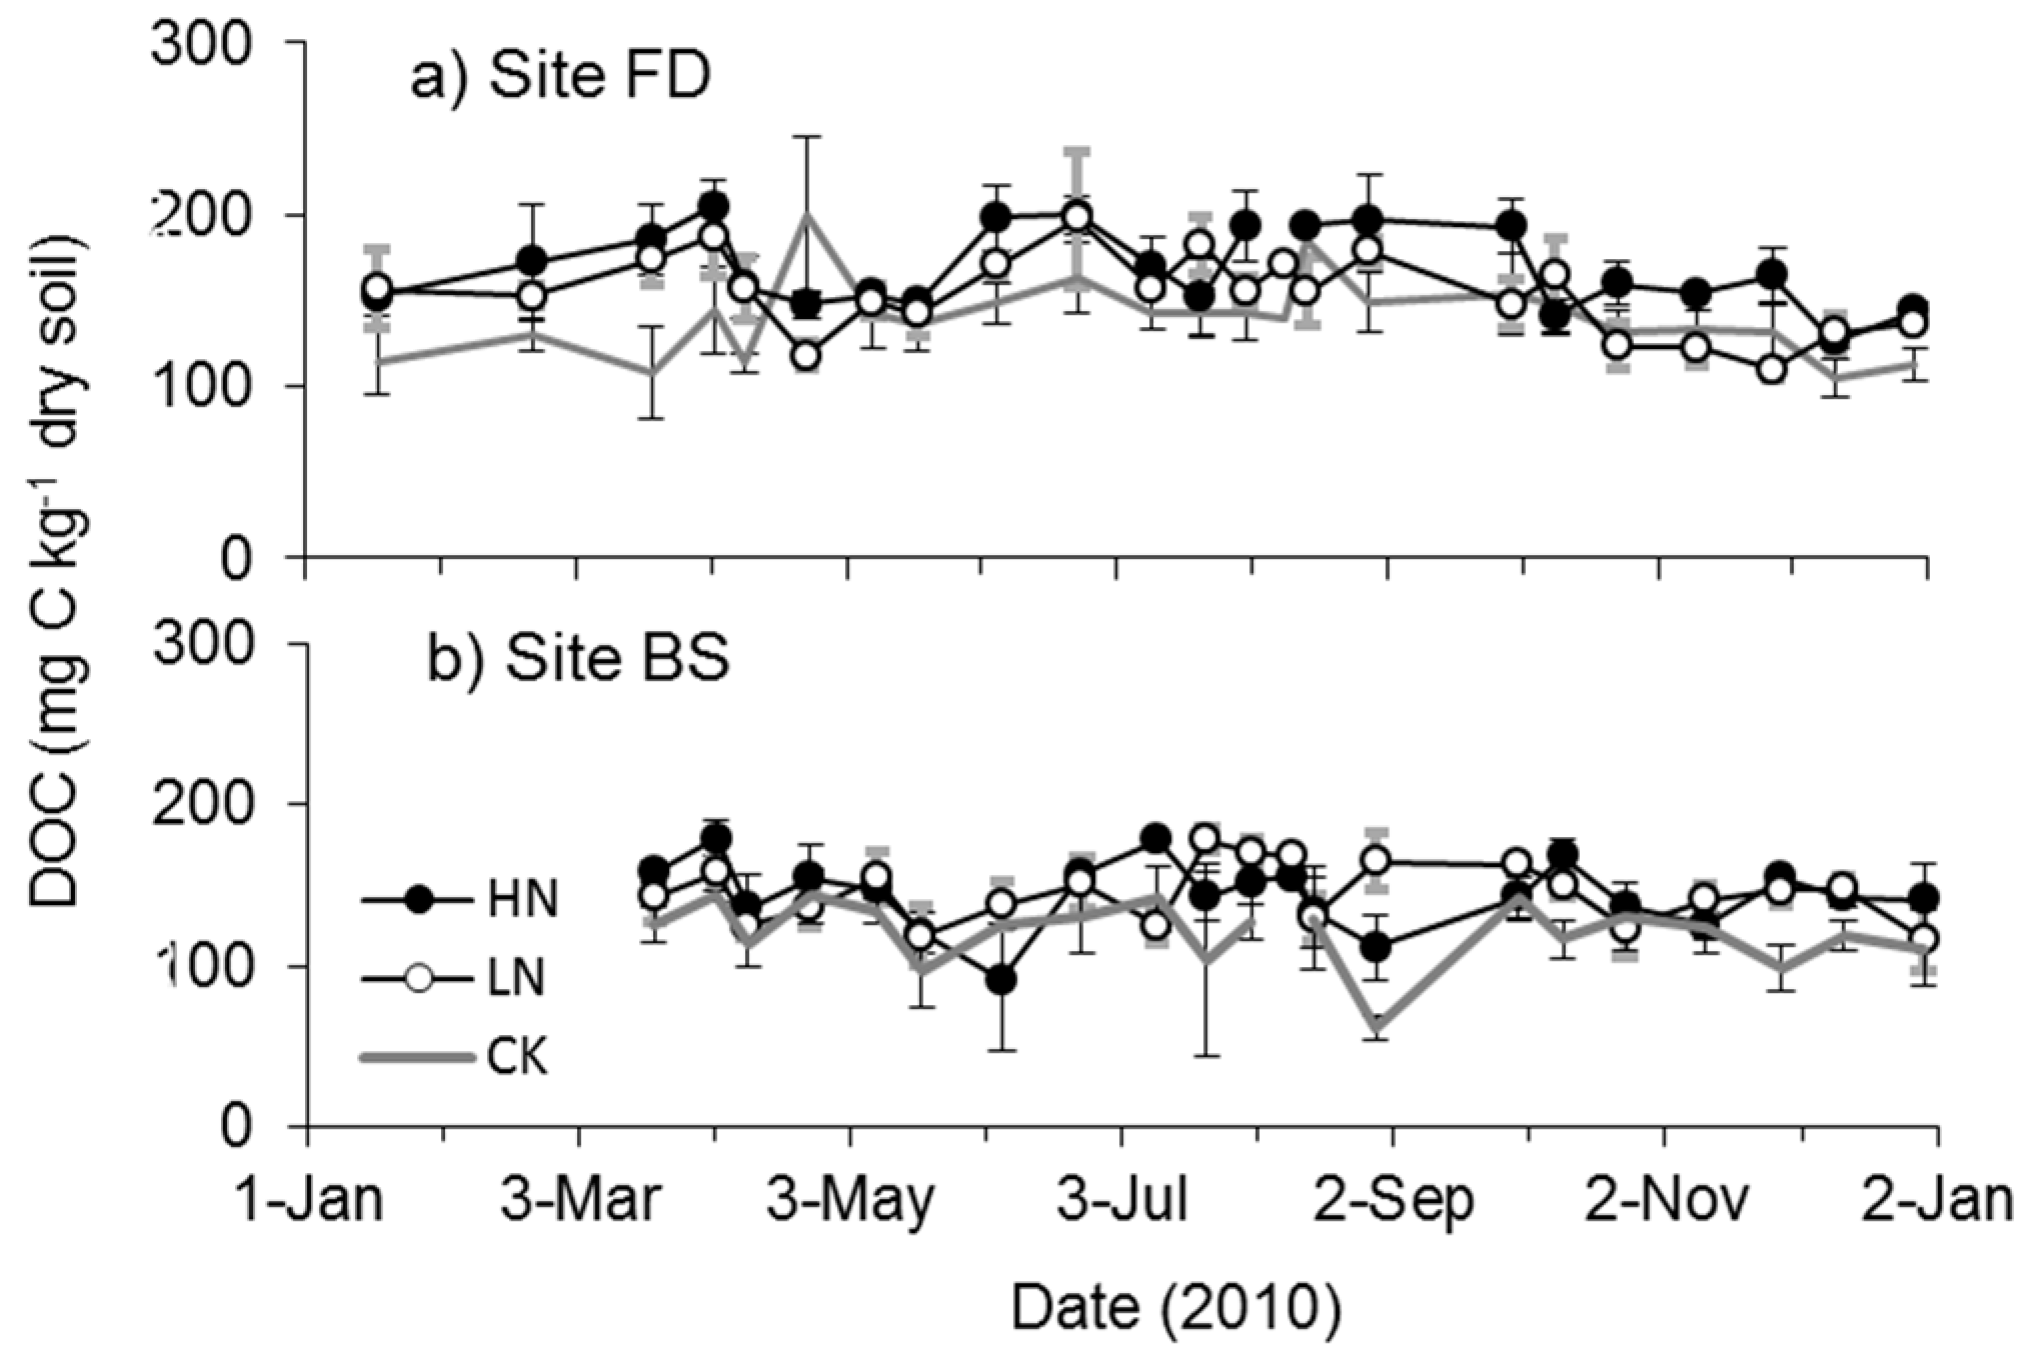
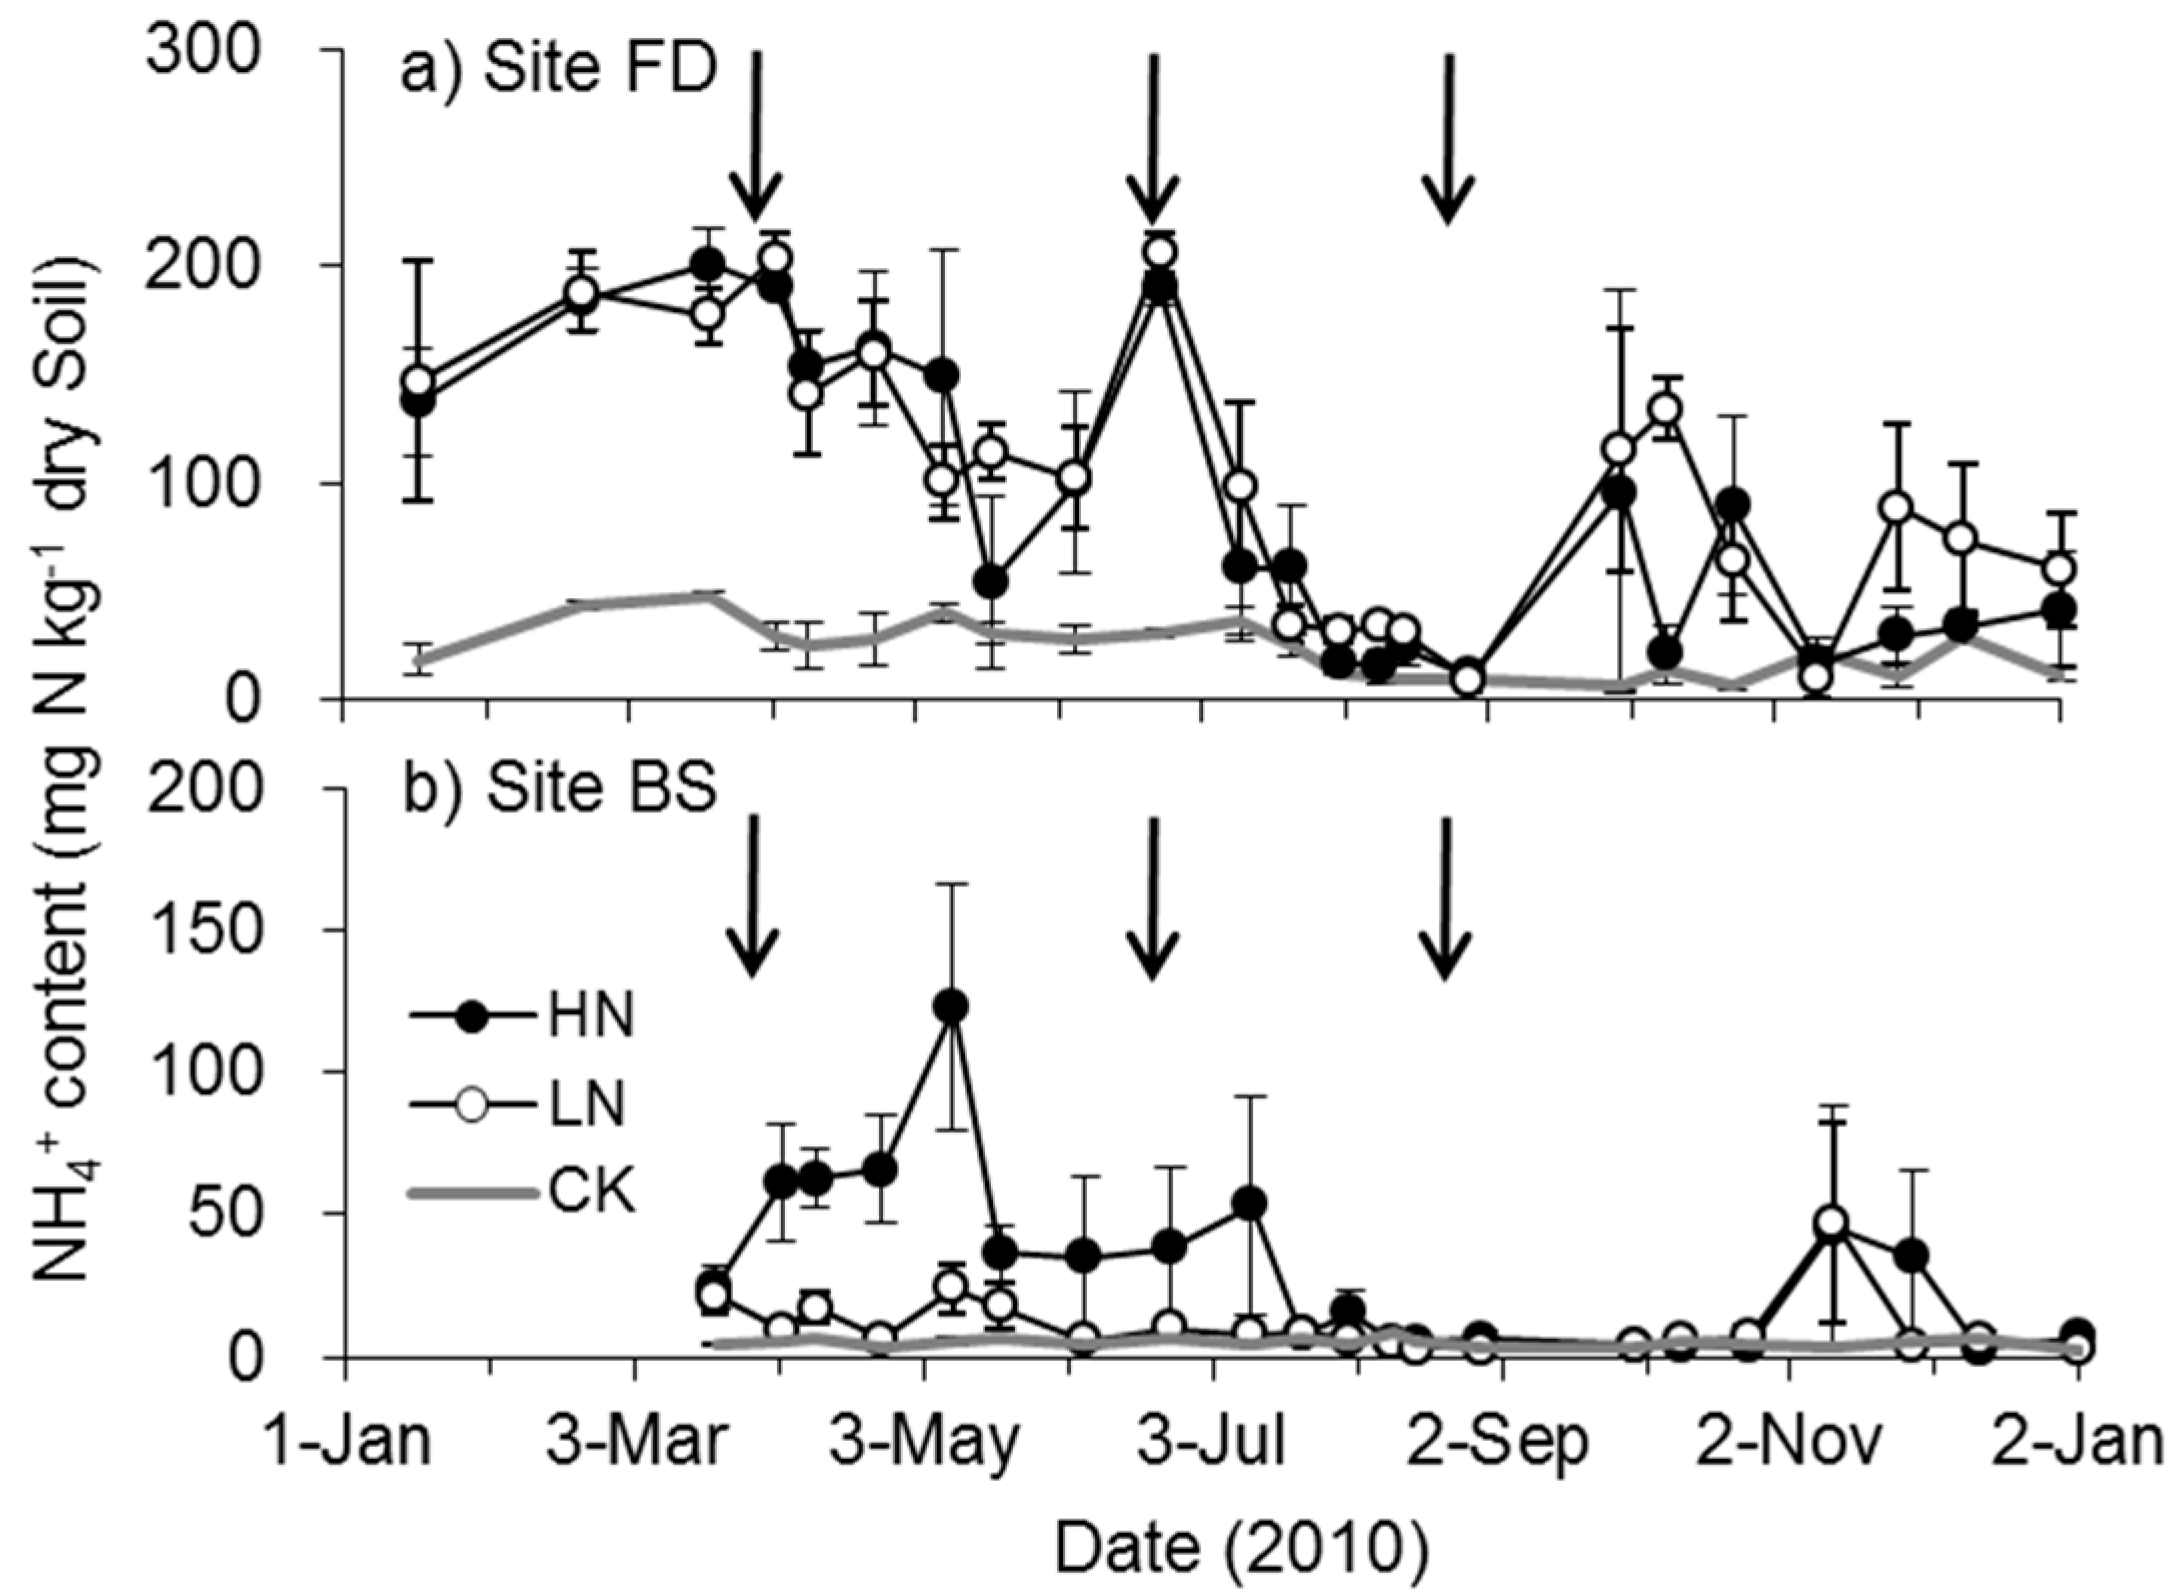
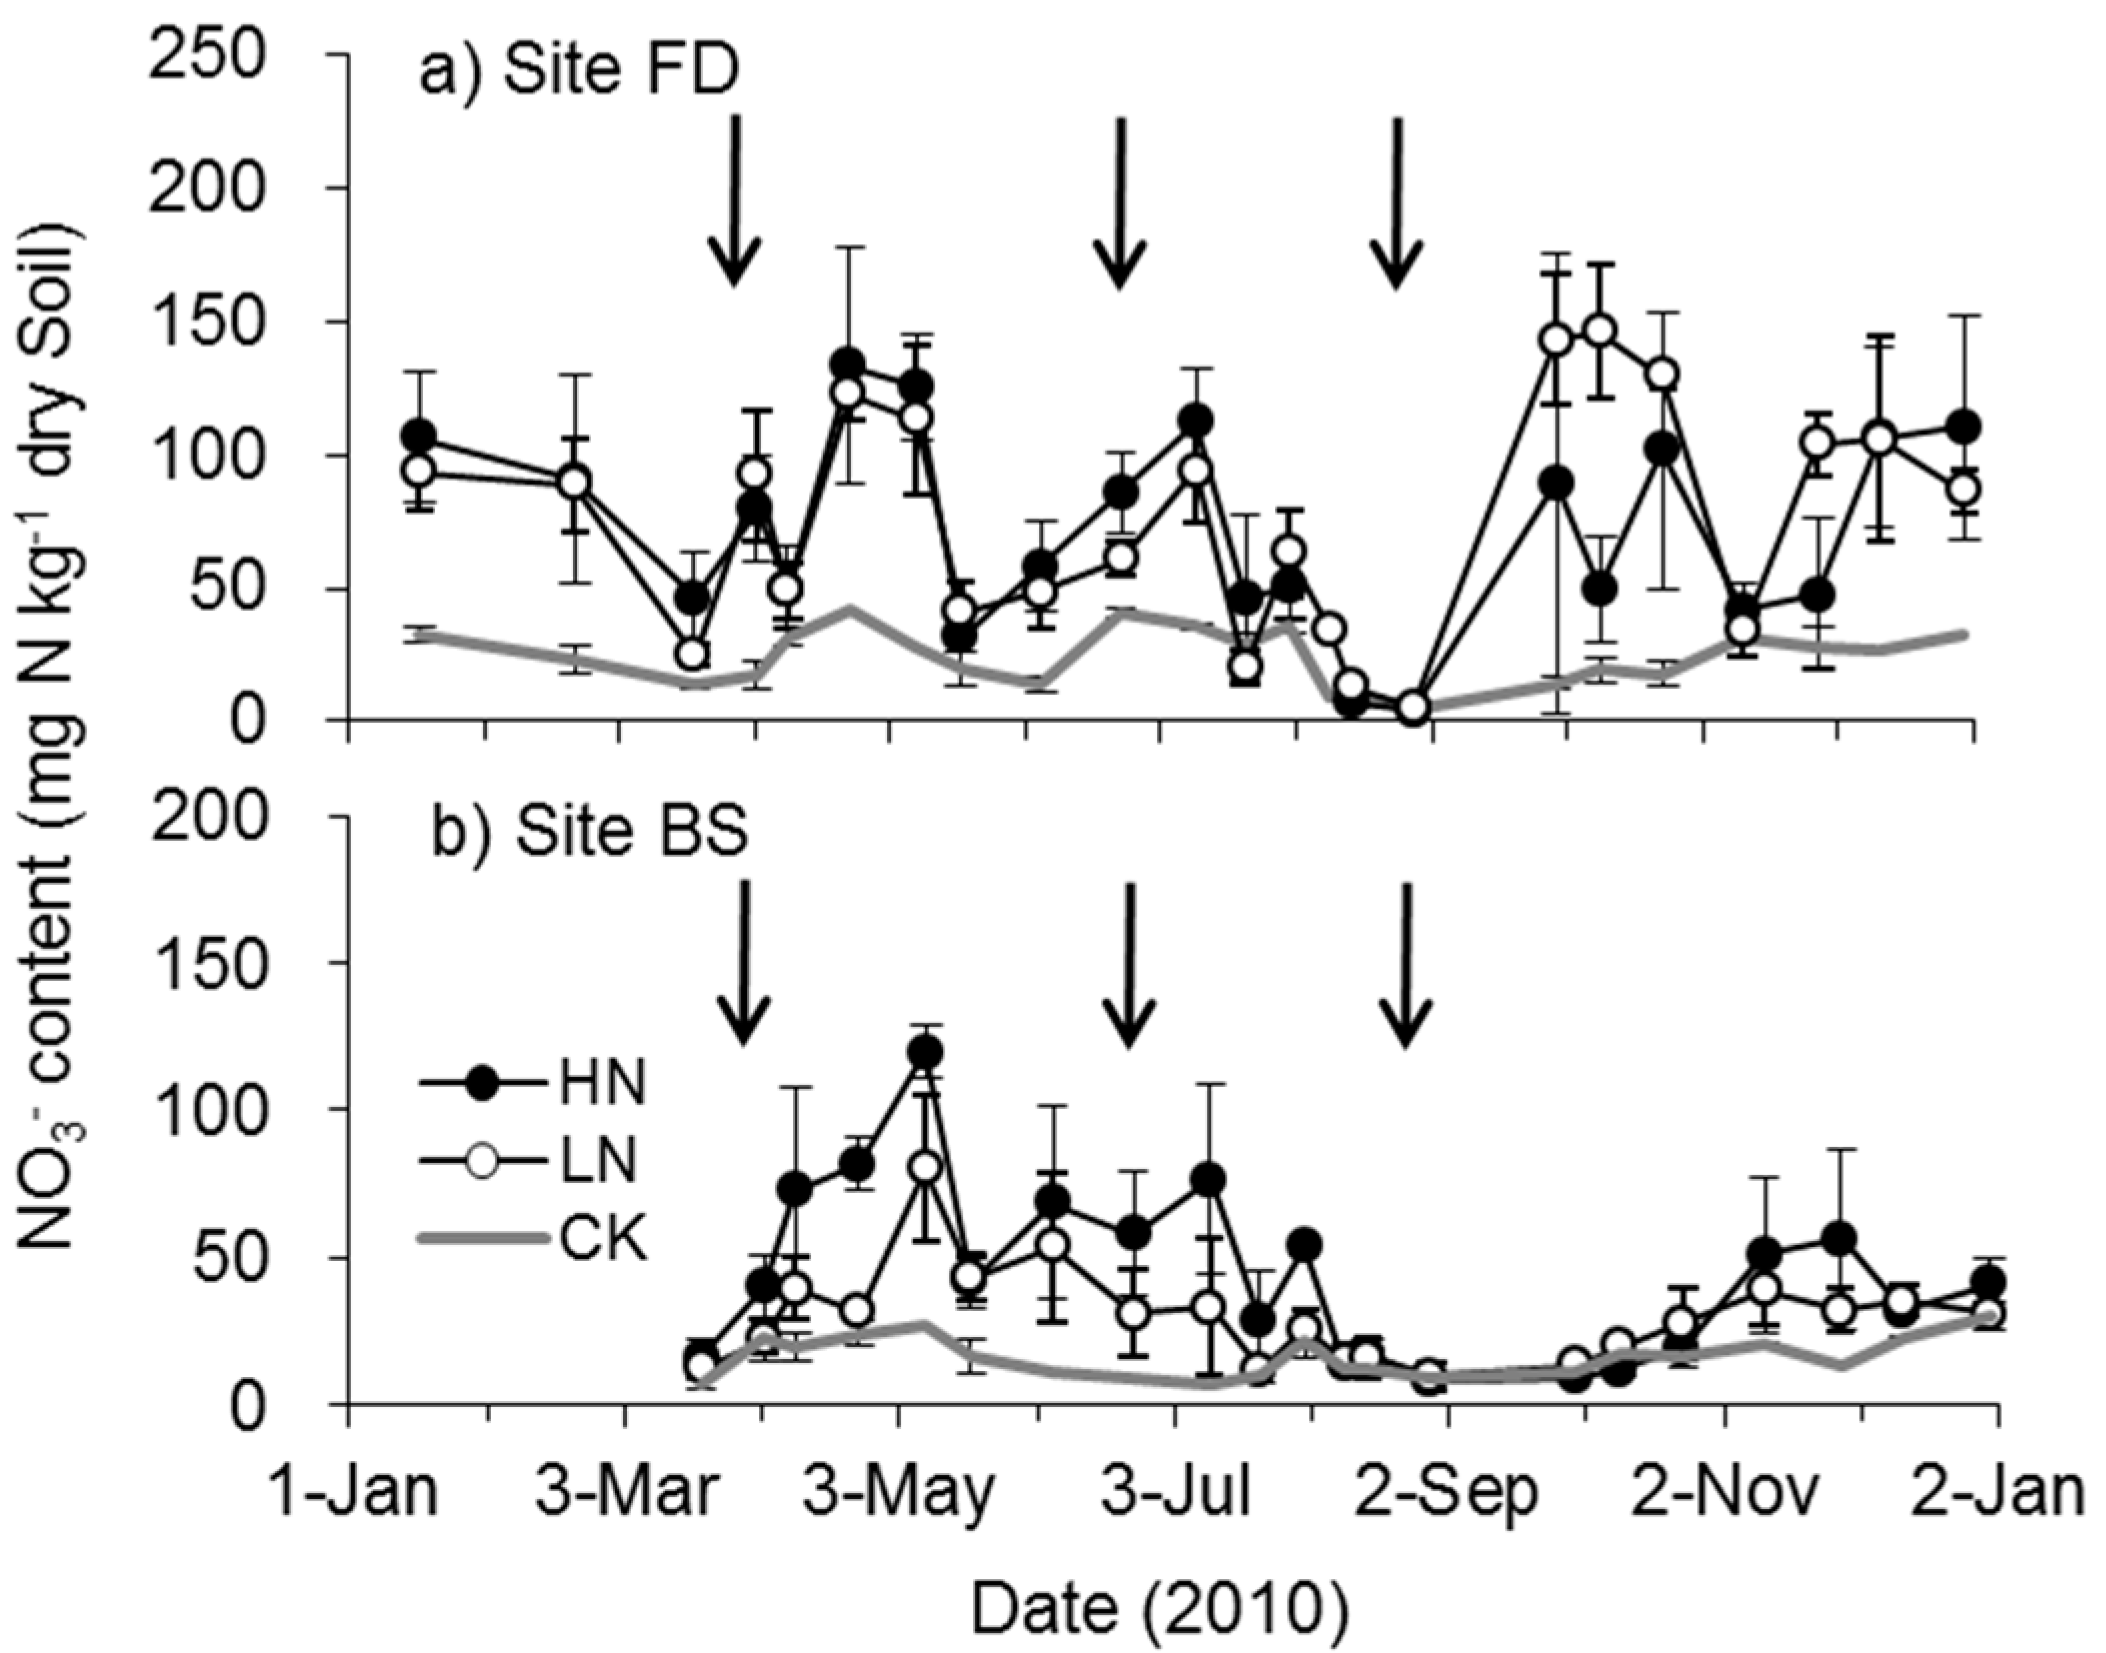
The annual mean air temperature was approximately 12.6 °C in both years (Figure 1a). Annual precipitation rates in 2010 and 2011 were 13% higher and 9% lower than the long-term historical average, respectively. More than 85% of the precipitation in the area occurred from May to October in both years. Soil temperature (10 cm depth) ranged from −3.2 °C to 27.3 °C during the experimental period, with a mean of approximately 9.2 °C in both years (Figure 1b). Soil WFPS (10 cm depth) was mostly above 60% during the wet season and averaged 64% over the entire experimental period.

3.2. Soil DOC, NH4+ and NO3 Content

Soil DOC values were largely within 100–200 mg C kg−1 across all treatments and sampling sites (Figure 2) with relatively small temporal variations (CV ranging from 12% to 22%).
Soil NH4+ content was between 6.4–47.3, 9.0–206.0, and 11.2–200.9 mg N kg−1 for the CK, LN, and HN treatments, respectively (Figure 3). The NH4+ contents from the fertilized treatments were significantly larger than CK treatments (p < 0.01). At the BS site, soil NH4+ content was between 2.3–8.6, 2.9–47.5, and 3.2–122.7 mg N kg−1 for the CK, LN, and HN treatments, respectively (Figure 3). The NH4+ contents from HN treatments were significantly larger than those from the LN (p < 0.05) and CK treatments (p < 0.01).
Soil NO3 content at the FD site was between 4.3–41.8, 5.6–143.1, and 4.1–147.1 mg N kg−1 for the CK, LN, and HN treatments, respectively (Figure 4). At the BS site, soil NO3 content was between 6.6–29.7, 9.7–80.0, and 8.3–119.8 mg N kg−1 for the CK, LN, and HN treatments, respectively. The NO3 contents from the fertilized treatments were significantly larger than CK treatment at both FD and BS sites (p < 0.05).

3.3. Apple Production
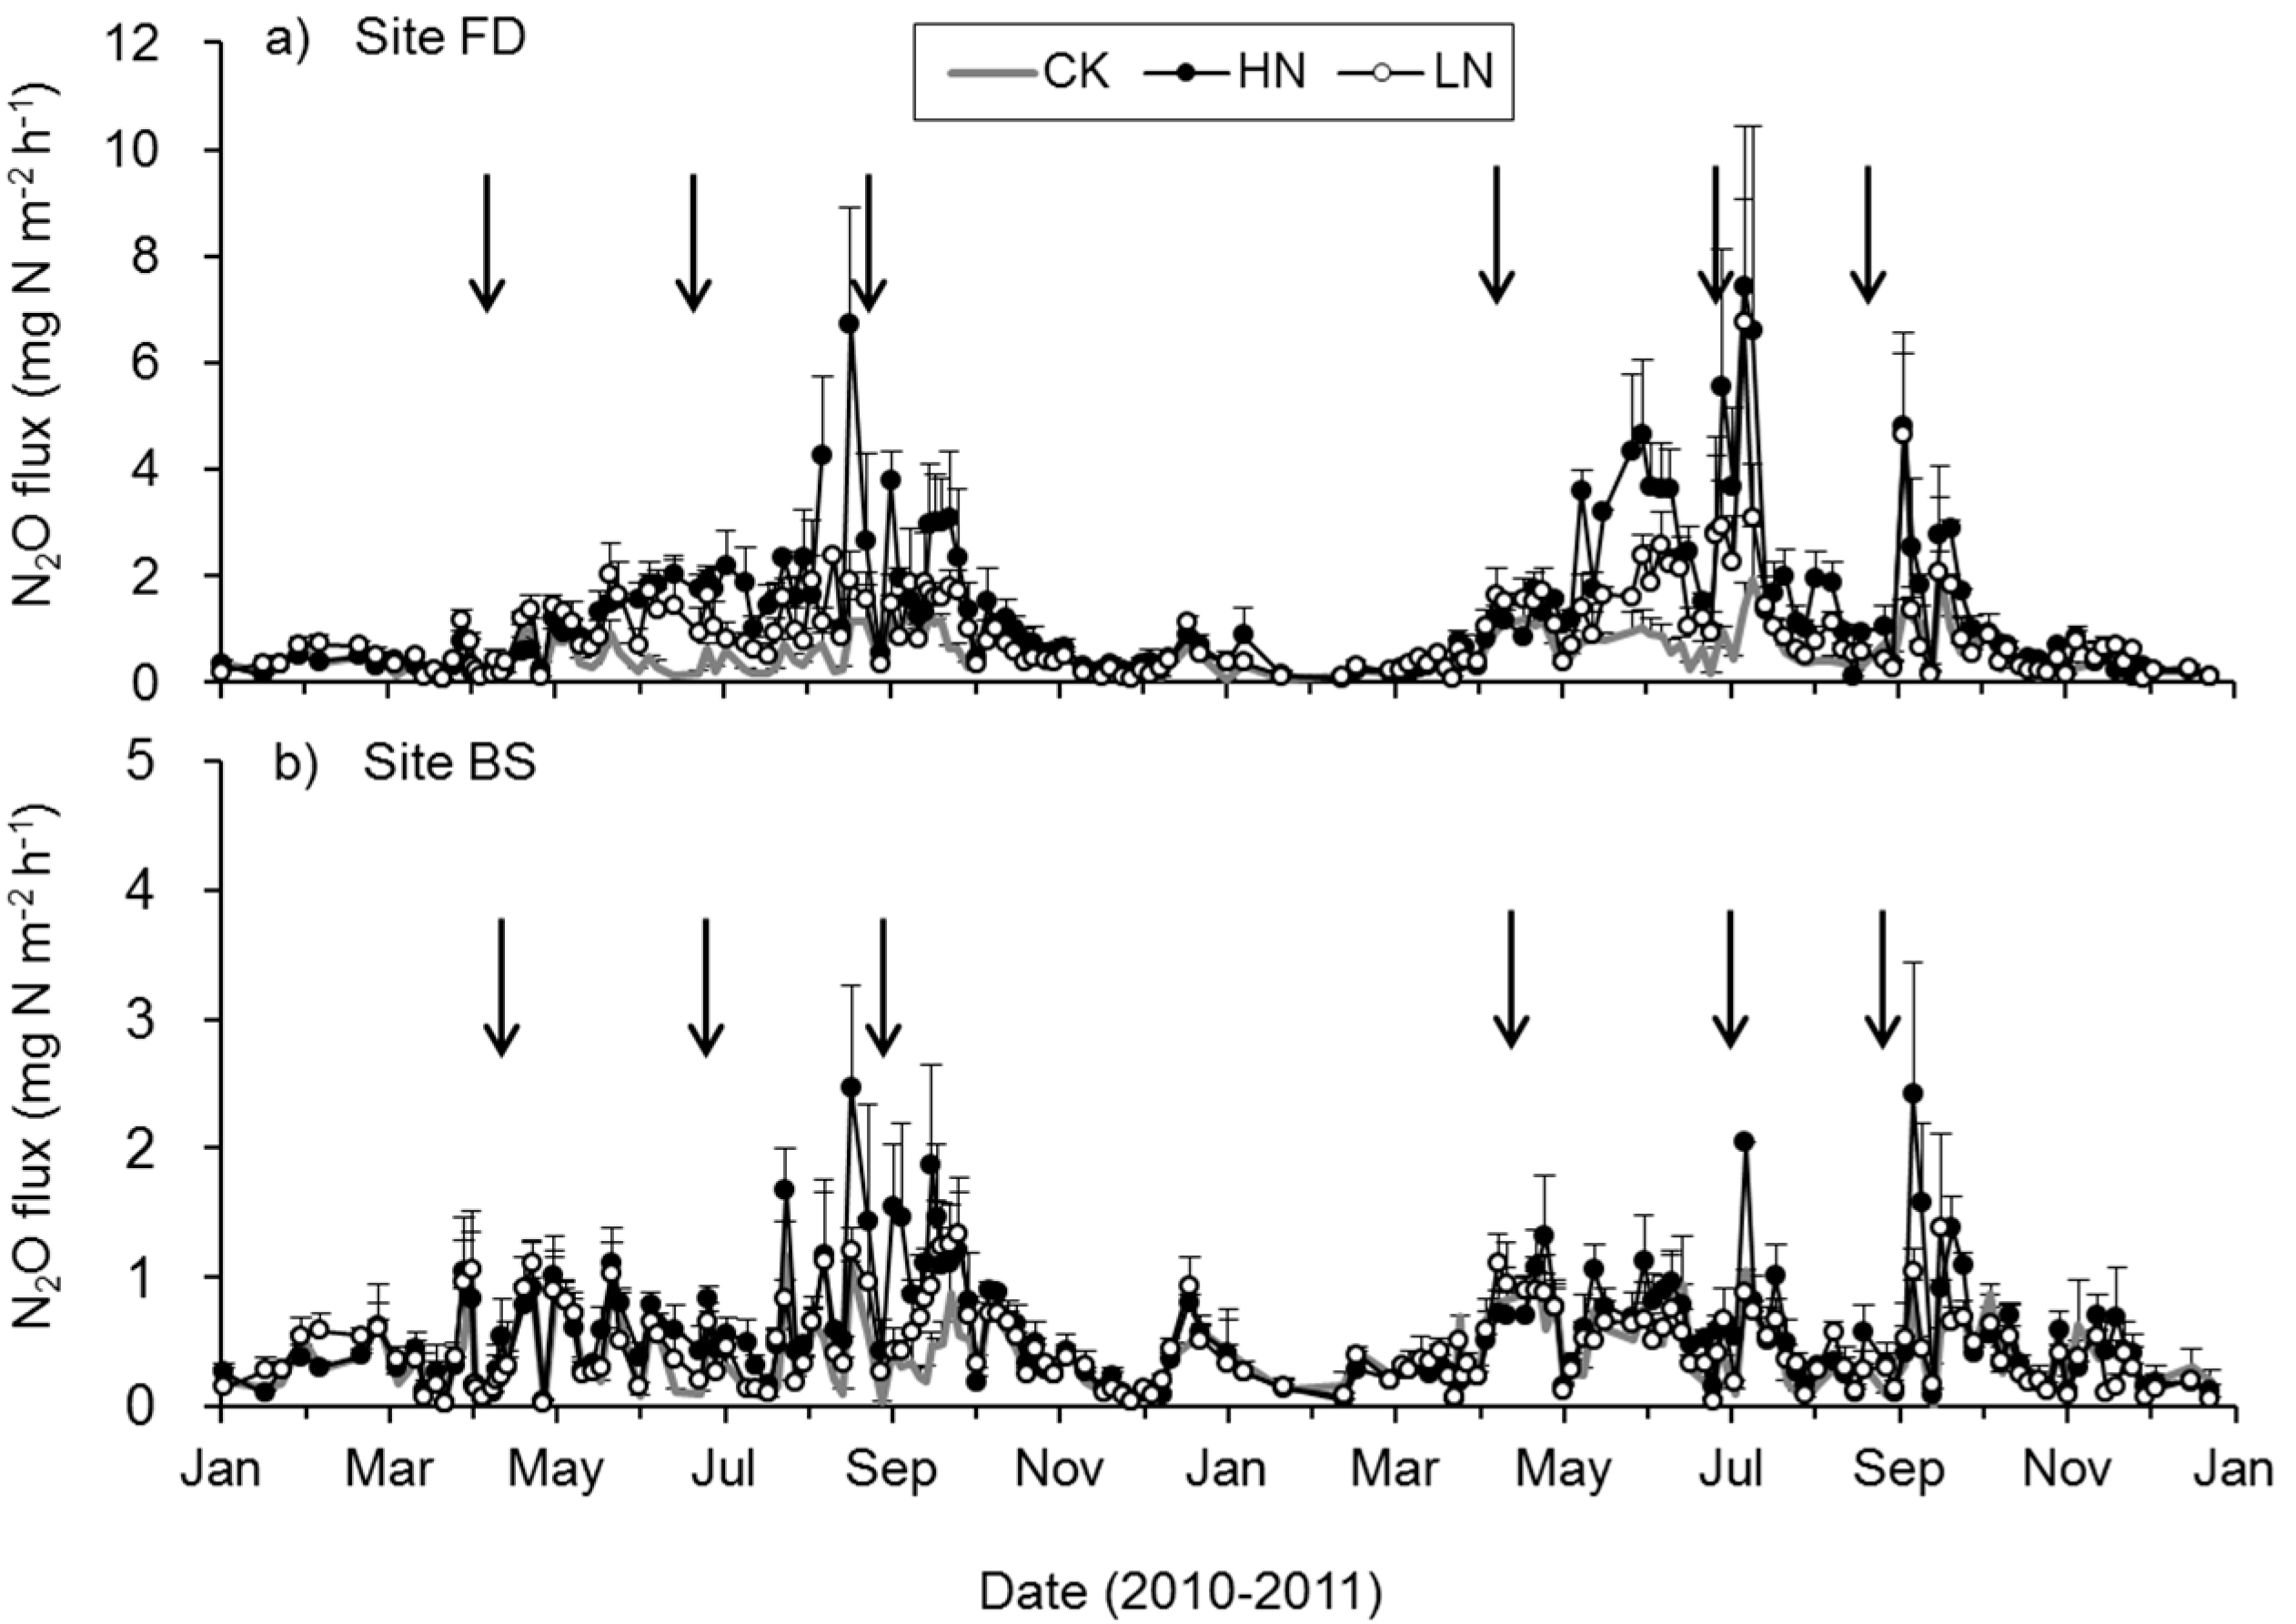
Apple production ranged from 26.2 to 35.6 t ha−1 (n = 6, CV = 11%) across the treatments and experimental years (Table 3). Production in the fertilized treatments tended to be larger (ranging from 14% to 19%) than that in the unfertilized treatment areas; however, the differences were not significant (p > 0.05) in most cases. Apple production in the LN treatment was 32% higher than the CK treatment in 2011 (p < 0.01).
FD, fertilizer ditches; BS, bare soils. Apple production measured as fresh weight. Annual N2O emissions and CH4 uptake were extrapolated to the field scale using the ratio of fertilizer ditches (FD) to bare soil (BS) areas at 0.38. EFd was calculated at the field scale. Treatment CK was not fertilized in the analyzed years. Treatment LN was fertilized at 800 kg N ha−1 year−1 in both years. Treatment HN was fertilized at 2600 and 2000 kg N ha−1 year−1 in 2010 and 2011, respectively. Values outside and inside paired-brackets are mean and standard deviation (n = 3), respectively. Values within the same column followed by the same letter do not differ at p < 0.05.

3.4. N2O Fluxes

At the FD site, the seasonal variations in N2O fluxes from the fertilized treatments were similar between the two experimental years, with large emissions from May to October (Figure 5a). The largest flux was always observed in the HN treatment, with maxima of 6.7 and 7.4 mg N m−2 h−1 in 2010 and 2011, respectively. The N2O emissions from the CK treatment were always below 2.0 mg N m−2 h−1 during the experimental period and significantly lower than the fertilized treatments (p < 0.01). The difference in N2O emissions between the LN and HN treatments was not significant (p > 0.05).
At the BS site, the seasonal variations in N2O fluxes were similar between the treatments during both experimental years (Figure 5b). The largest flux was 2.5 mg N m−2 h−1, which occurred in the HN treatment. The N2O emissions from the HN treatment were significantly higher than the CK treatments (p < 0.01) in 2010. The differences of N2O emissions between various treatments were not significant in 2011 (p > 0.05).

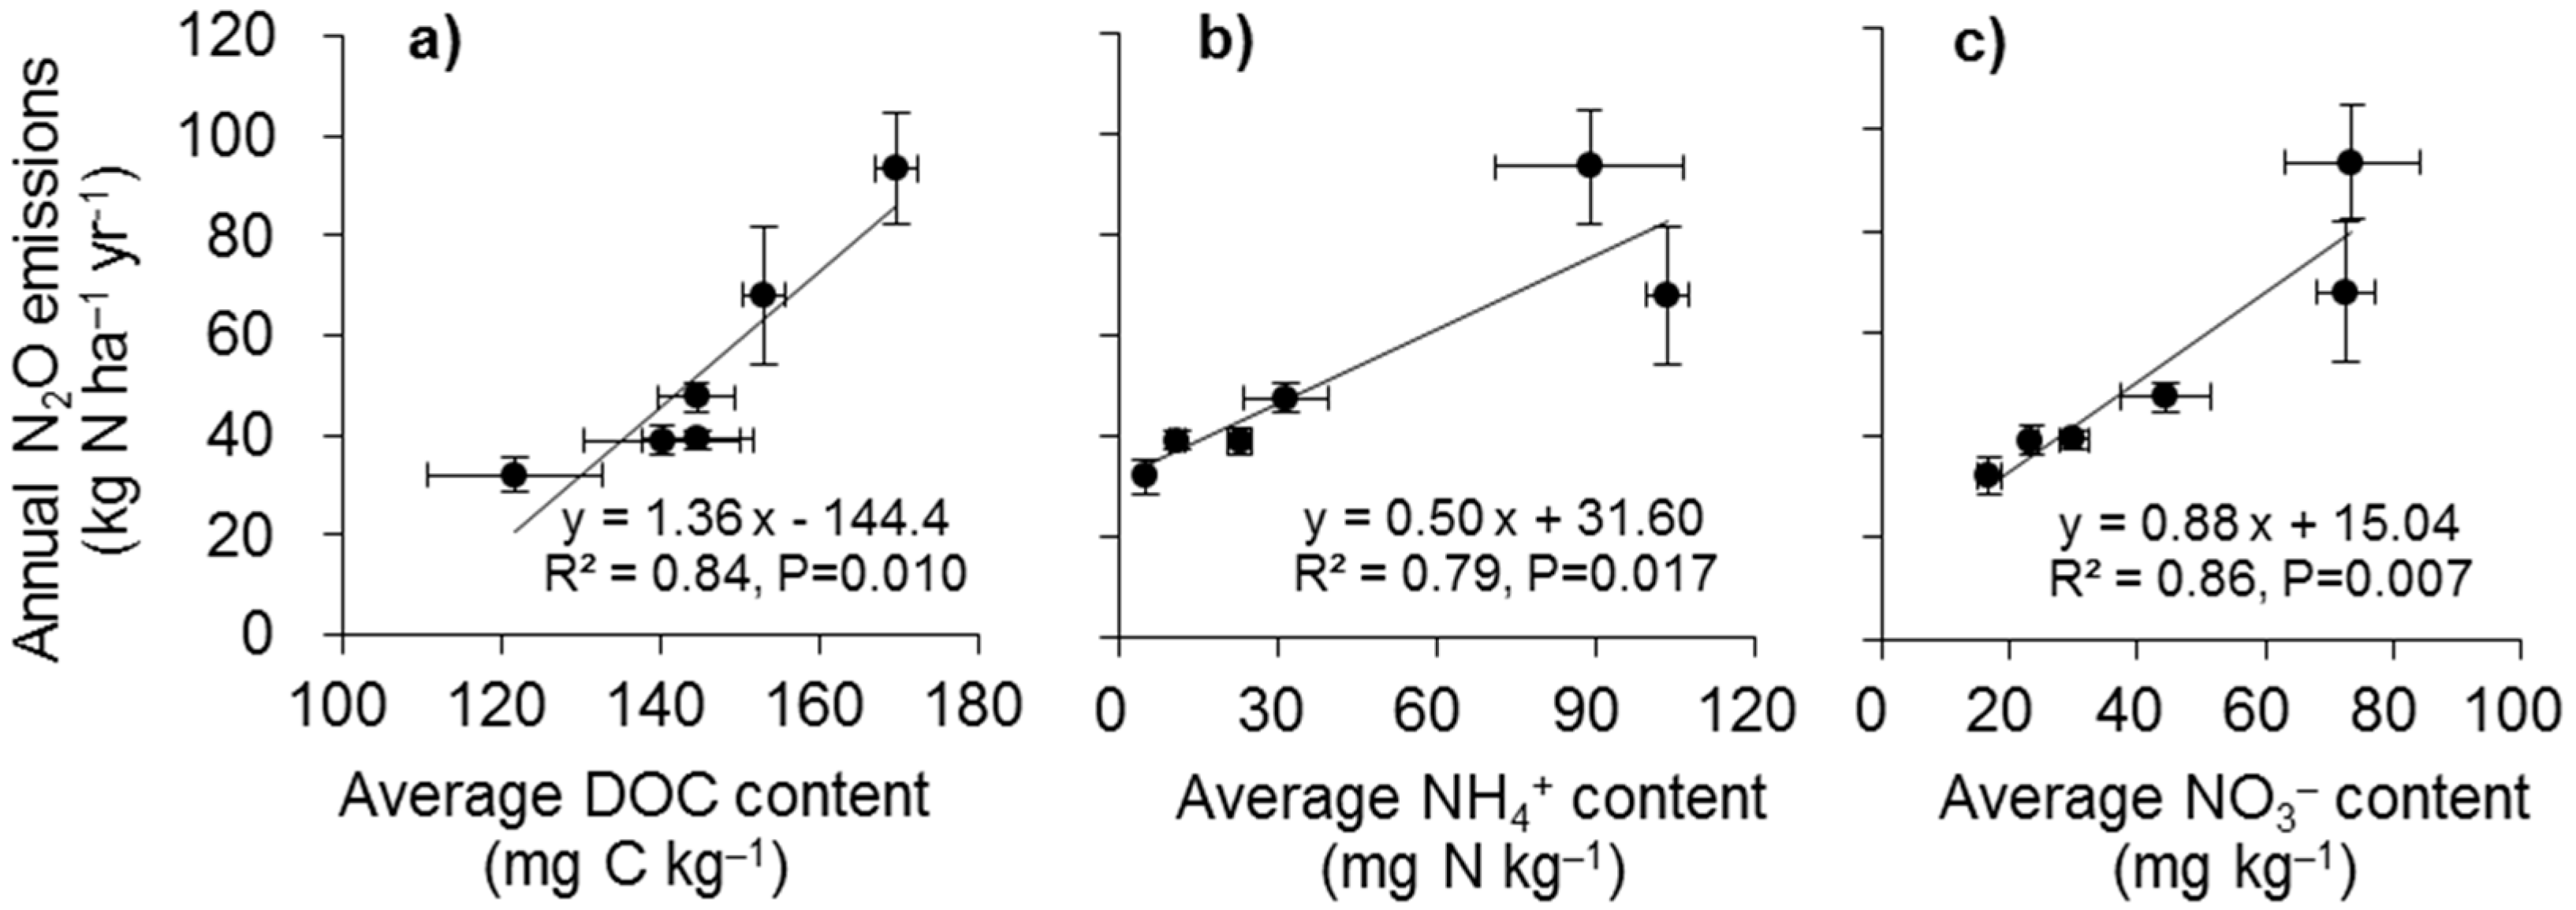
3.5. Annual N2O Emissions and EFd
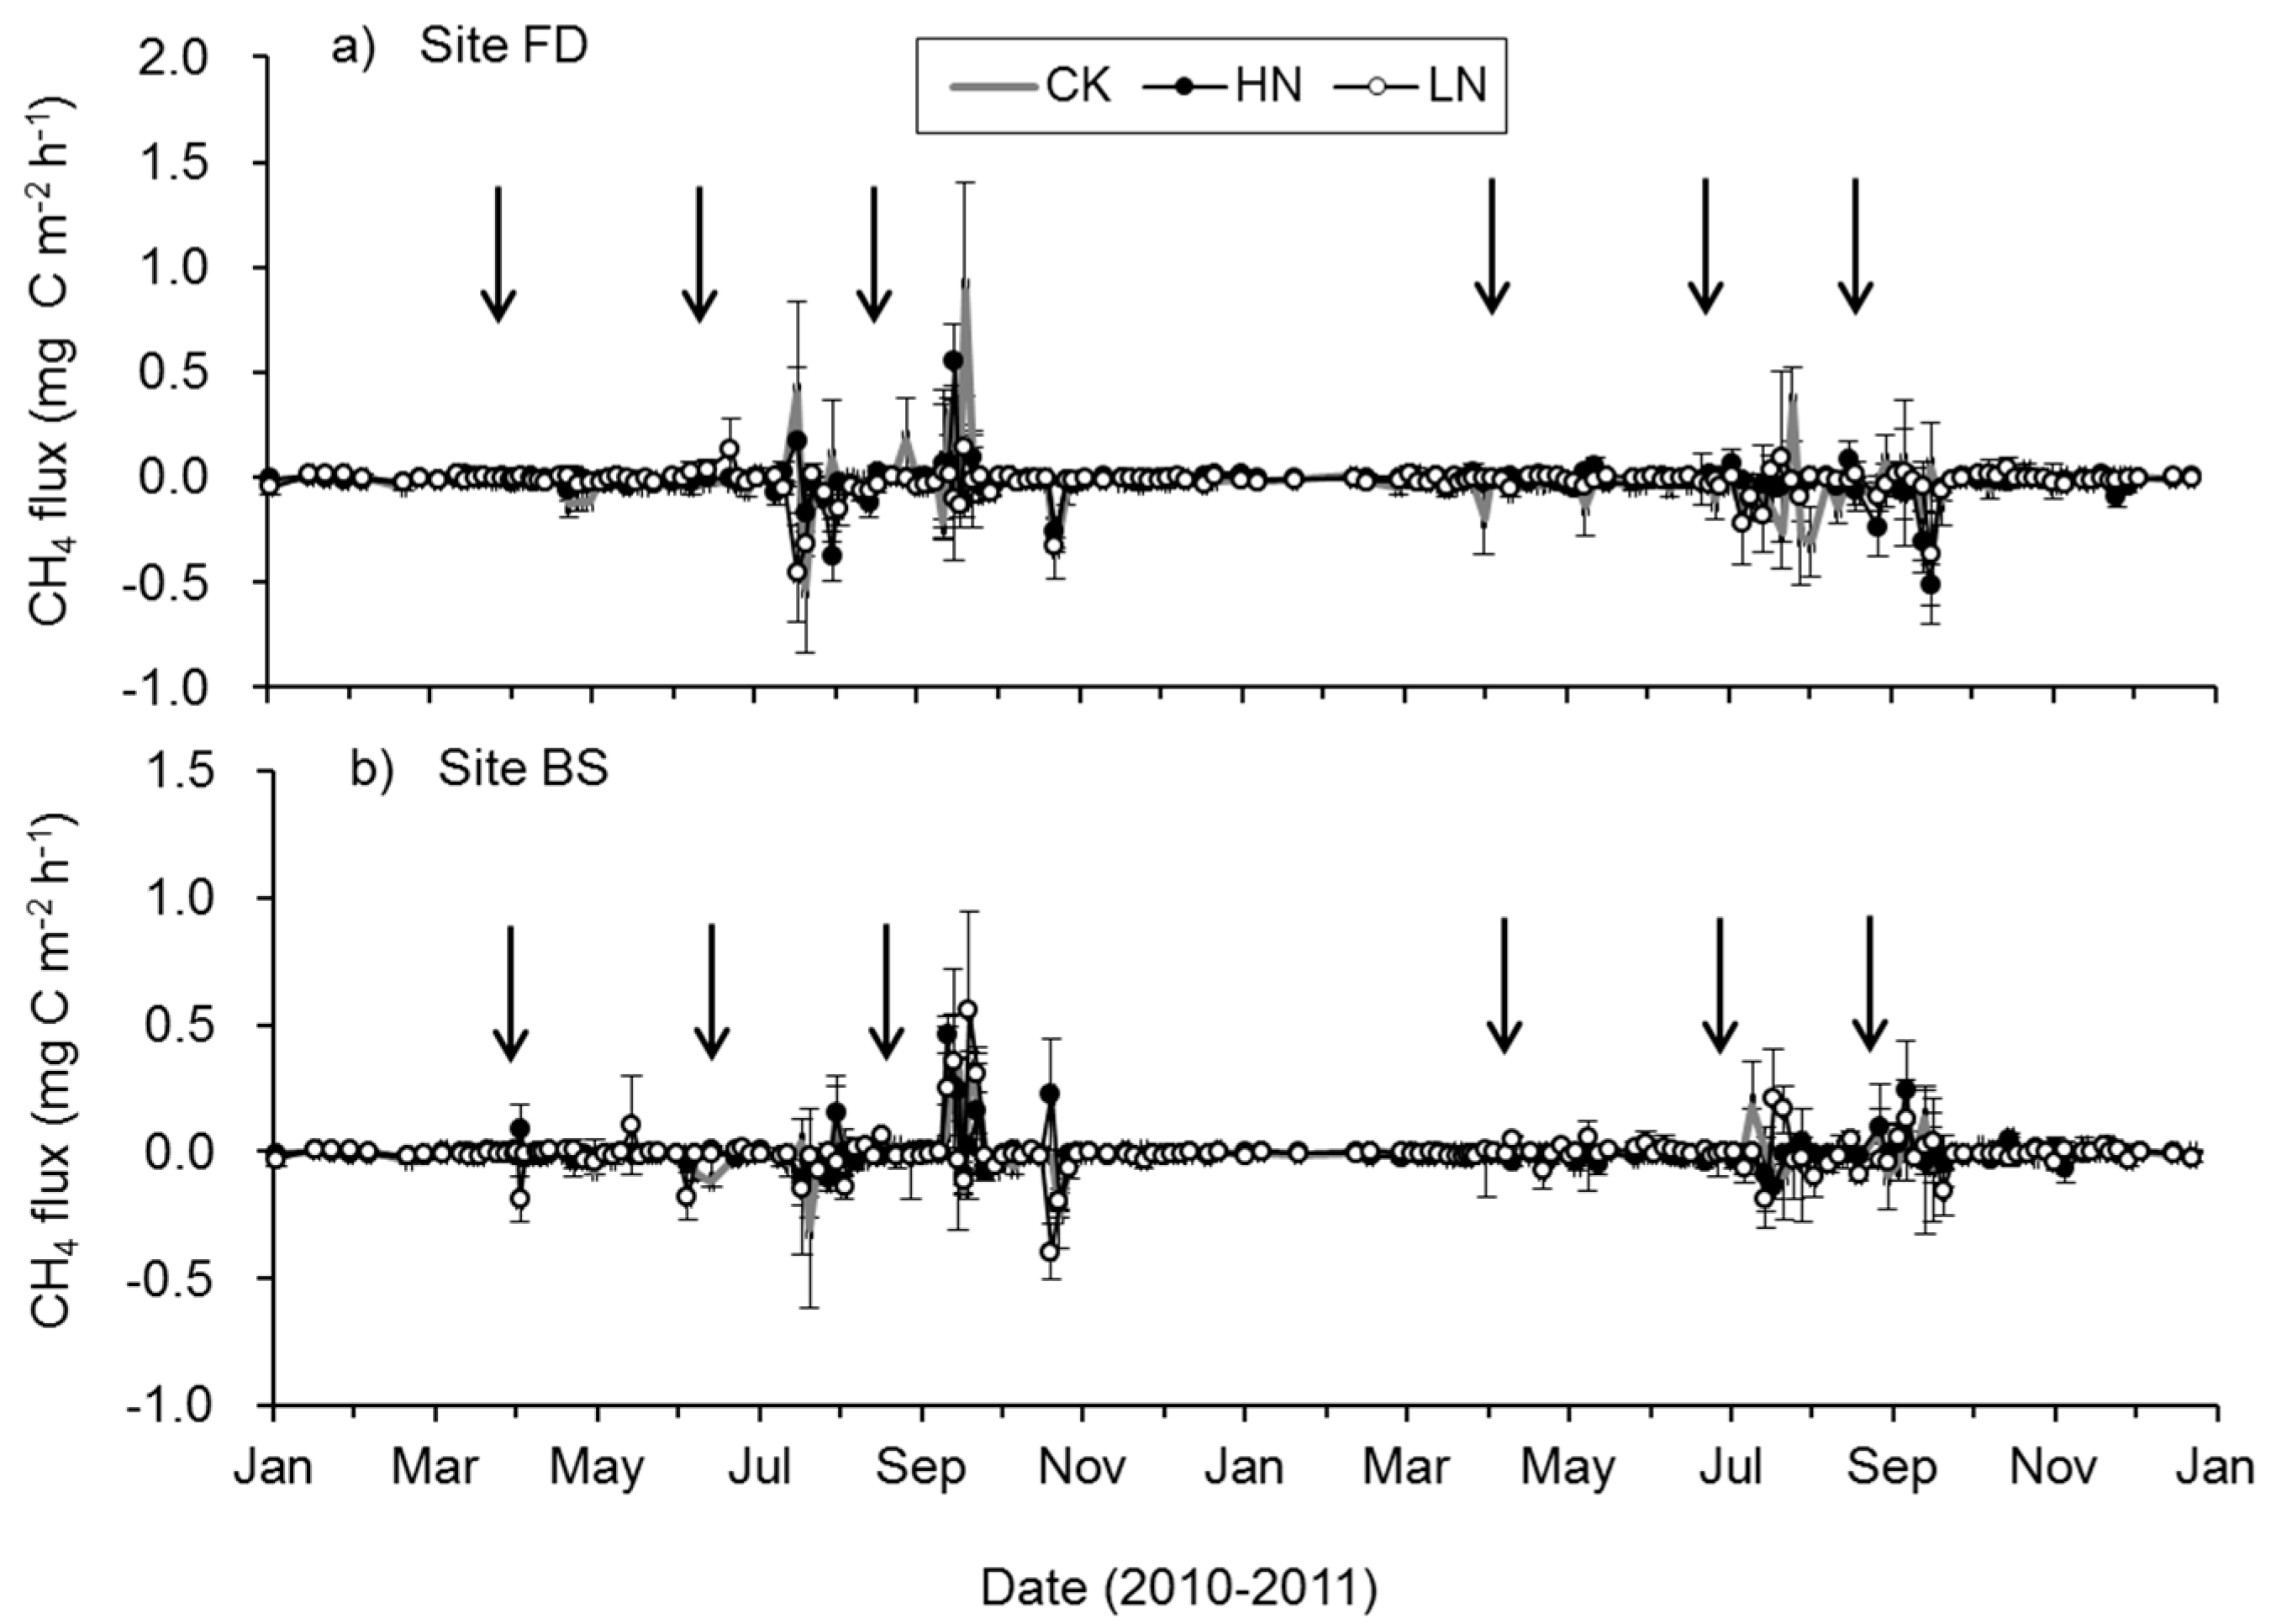
At the FD site, annual N2O emissions ranged from 39.1 to 112.7 kg N ha−1 year−1 across the treatments and experimental years (Table 3). The annual emissions from the HN treatment were significantly higher than the CK treatment by 140% (p < 0.01) and 161% (p < 0.01) in 2010 and 2011, respectively (Table 3). The annual emissions from the LN treatment tended to be higher than the CK treatment by 75% (p = 0.09) and 79% (p = 0.07) in 2010 and 2011, respectively.
At the BS site, annual N2O emissions ranged from 30.9 to 47.6 kg N ha−1 year−1 across the treatments and experimental years (Table 3). The annual emissions from the fertilized treatments tended to be higher than the CK treatment by 9–48%. However, the differences were not significant except for the difference between the HN and CK treatments in 2010 (p < 0.01).
At the field scale, annual N2O emissions ranged from 34.1 to 60.3 kg N ha−1 year−1 (n = 6, CV = 24%) over the two experimental years (Table 3). The annual N2O emissions from the HN treatment were significantly higher than the CK treatment by 73–77% (p < 0.01) in the experimental years. The annual N2O emissions from the LN treatment were significantly higher than the CK treatment by 33–39% (p < 0.05) in the experimental years. The difference in annual emissions between the HN and LN treatments was also significant (p < 0.05). Based on these estimates, the site-specific EFd ranged from 1.00% to 1.65% with a mean of 1.34% (n = 4, CV = 21%).

3.6. CH4 Uptake

Soil CH4 fluxes ranged from −0.53 to 0.89 mg C m−2 h−1 during the experimental period (Figure 6). The seasonal variations were quite similar between treatments and sampling sites in each year. Annual CH4 uptake ranged from 0.4 to 1.1 kg C ha−1 year−1 with non-significant differences across treatments and experimental years (Table 3).

4. Discussion

We captured both soil CH4 production and consumption across the treatments over two experimental years (Figure 6). The net annual CH4 fluxes indicated that all treatments were slight sinks (Table 3), which was similar to previous results obtained for various upland agricultural ecosystems [23]. Alsina et al. [34] reported that an almond orchard’s soil was a minor source of CH4, mostly due to the effect of fertigation. However, the quantities of the sink or source in those studies were negligible compared to N2O emissions in terms of global warming potential. Our results show that the effect of N input rates on annual CH4 uptake is not significant (Table 3).
The fact is that large N2O fluxes, generally followed the application of N, irrigation, and precipitation, have been widely reported for various agroecosystems previously [10,34,41] and were also observed in the present study (Figure 5). We observed that the seasonal variations in N2O fluxes related significantly to soil temperature, WFPS, DOC, NH4+, and NO3 content with small R2 values (ranging from 0.05 to 0.2, p < 0.01). Given that soil WFPS was above 60% during two-thirds of the experimental period (Figure 1b), denitrification was most likely the primary N2O source [7,8]. Soil DOC content averaged 121.6 to 169.6 mg C kg−1 across the sampling sites and related significantly (R2 = 0.84, n = 6, p = 0.01) to annual N2O emissions at the site scale (Figure 7a). Soil NH4+ and NO3 content averaged 121.6 to 169.6 5.0 to 103.4 mg N kg−1 and 16.8 to 73.6 mg N kg−1 across the sampling sites, respectively, and related significantly (R2 > 0.79, n = 6, p < 0.02) to annual N2O emissions at the site scale (Figure 7). The results indicated that the ability of C and N substrates regulated long-term N2O emissions. Additionally, annual N2O emissions at the field scale exhibited positive correlations with N input rates across the two experimental years (R2 = 0.95, n = 6, p < 0.01).
Our measurements show that annual N2O emissions from the fertilized treatments ranged from 45.7 to 60.3 kg N ha−1 year−1 (Table 3), which is substantially greater than previous observations in upland orchards (ranging from 0.6 to 8.6 kg N ha−1 year−1; [31,32,34]). Large emissions from mineral soils have also been reported up to 66.6 kg N ha−1 year−1 [41,42] based on crop type (cereal and vegetable) and N input rates (ranging from 1100 to 1700 kg N ha−1 year−1, mostly in the form of dairy manure and sewage sludge). Chang et al. [42] and Mei et al. [41] reported that the annual emissions from unfertilized treatments were relatively small (0.5 to 4.1 kg N ha−1 year−1); therefore, the majority (92% to 99%) of the N2O emissions from fertilized treatments originated from the application of N fertilizer in the analyzed year. These results were reasonable because organic manure imported large N and C substrate quantities and favored microbial activities. However, in our study the large N2O losses did not appear to be caused by N fertilization in the studied year. Our results show that the fertilizer-induced N2O emissions contributed only 25–44% to annual losses, with background emissions accounting for the majority of emissions (ranging from 34.1 to 34.3 kg N ha−1 year−1; Table 3). Generally, background N2O emissions from mineral soils are limited by the availability of N substrates and originate from N sources such as the decomposition of soil organic matter, atmospheric deposition, and N substrates remaining within the soil profile due to N inputs in previous years or seasons [15,43]. Globally, background emissions from mineral soils occur at a mean 1 kg N ha−1 year−1 (ranging from −0.6 to 3.2 kg N ha−1 year−1; [15]). Gu et al. [43,44] reported that background emissions from cropland averaged 1.21 kg N ha−1 year−1 (ranging from 0.1 to 2.63 kg N ha−1 year−1) and responded to SOC content (ranging from 4.5 to 50.3 g C kg−1). However, this does not explain the results in our study because the site-specific SOC content was only 10.6 g C kg−1 (Table 1). Instead, the background emissions were most likely due to NO3 accumulation in the soil profile resulting from the overuse of N fertilizer throughout the area’s history. Ju et al. [25] reported that the NO3 stored within the top 1 m of soil profiles in the study region averaged 600 kg N ha−1 in typical winter wheat-maize crop rotation fields and up to 1410 kg N ha−1 in some lands cultivated with apple trees and vegetables after the long-term overuse of N fertilizer. These NO3 stocks may contribute to background emissions when they are denitrified. Jahangir et al. [45] (2012) reported that denitrification potential in subsoils (deep to 1.2–1.3 m) under temperate grassland was stimulated by 450–830%, given adequate C sources. In the present study, the tree roots likely readily provided C substrates to feed microbes within the orchard’s soil profile. In addition, irrigation may also introduce significant NO3 substrates (approximately 100–200 kg N ha−1 year−1), particularly given that the NO3 content in the underground water averaged approximately 100 mg N L−1.
In the present study, although N2O emissions from the orchard were very high, the site-specific EFd (averaged 1.34%) was similar to the IPCC default of 1% [19]. The results suggested we can use the IPCC default of 1% to estimate N2O emissions for the fertilized orchards. N input rates average 842 kg N ha−1 year−1 in apple orchards [27], and the apple orchard area covered 0.30 Mha in Shandong Province in 2015 [46]. Regional direct N2O emissions from orchards were estimated at 3.4 Gg N year−1. Pang et al. [32] found a smaller EFd (0.66%) for region-specific apple orchards in Northwestern China and estimated the regional direct N2O emissions at 2.5 Gg N year−1. Therefore, the total direct emissions from apple orchards in the two regions were approximately 5.9 Gg N year−1, which accounts for 2.1% of the total direct N2O emissions from cropland in China [18]. That said, background emissions were not included in those regional assessments and could be much larger (such as 4–5 times in our study, assuming an N input rate of 842 kg N ha−1 year−1) than the direct emissions. Reducing background emissions rather than direct emissions appears critical to the mitigation of regional N2O emissions. More background emission data are therefore needed in the study region.
Our results indicate that high rates of N fertilization led to increasing N2O losses without economic gains in apple yields (Table 3). Although apple production in the fertilized treatment areas was 14–32% larger than that in the unfertilized treatment areas during the two experimental years, the differences were mostly not significant (Table 3). Given that the N content within a fresh apple is approximately 0.6% (unpublished data in this study), approximately 23–27% and 7–9% of the N fertilizer was recovered in the apple harvest from the LN and HN treatments, respectively. Taking into account the production in the unfertilized treatments, we estimated that approximately 94–99% of the N input in the analyzed year was lost to the environment. Overuse of N fertilizer in China has resulted in serious environmental issues such as NO3 leaching, soil acidification, and greenhouse gas emissions [27,30,41,47]. The framework of “integrated nutrient management” was recently developed with incredible potential to simultaneously increase crop yields and nutrient use efficiency [28,48]. We strongly advise that conventional fertilization regimes be avoided or reduced and a much lower N input rate is recommended in the study region. The environmental and economic benefits (such as reducing N2O emissions and increasing apple yields) of reducing N input rates may be not significant (Table 3), but economic savings (such as reduced N fertilizer costs) are certain. Still, much work is needed to determine the fate of N substrates stored in the soil profile as a result of historical fertilization.

5. Conclusions

We measured N2O and CH4 fluxes regularly between 2010 and 2011 in an irrigated apple orchard in Eastern China. The soil was a significant N2O source and a minor CH4 sink. The contribution of fertilizer-induced N2O emissions to annual losses was moderate, resulting in an EFd of 1.34%. Large background emissions were most likely related to historically accumulated NO3 in the soil profile because of the overuse of N fertilizer in past decades. Further studies on the fate of NO3 accumulation are urgent because reducing background emissions appears to be critical to the mitigation of regional N2O emissions. Considering that high rates of N fertilization have led to increasing N2O losses without economic gains in apple yields, we strongly advise that the conventional fertilization regimes be avoided, and reduced N input rates must be recommended in the study region.

Acknowledgments

This study was financially supported by the Non-profit Research Foundation for Agriculture (201103039), the Project of the Cultivation Plan of Superior Discipline Talent Teams of Universities in Shandong Province: “the Coastal Resources and Environment team for Blue-Yellow Area”, and the National Natural Science Foundation of China (41205118, 41475128).

Author Contributions

B.X., J.Y. and X.Z. conceived and designed the experiments; B.X., G.H., H.L. and Y.X. performed the experiments; B.X., J.G., J.Y., Z.X. and G.H. analyzed the data; B.X. and J.G. wrote the paper. All authors have read and approved the final manuscript.

Conflicts of Interest

The authors declare no conflict of interest.

References

  1. Team, C.W.; Pachauri, R.K.; Meyer, L.A. IPCC, 2014: Climate Change 2014: Synthesis Report. Contribution of Working Groups I, II and III to the Fifth Assessment Report of the Intergovernmental Panel on Climate Change; IPCC: Geneva, Switzerland, 2014; p. 151. [Google Scholar]
  2. Smith, P.; Martino, D.; Cai, Z.; Gwary, D.; Janzen, H.; Kumar, P.; McCarl, B.; Ogle, S.; O’Mara, F.; Rice, C.; et al. Greenhouse gas mitigation in agriculture. Philos. Trans. R. Soc. B 2008, 363, 789–813. [Google Scholar] [CrossRef] [PubMed]
  3. Davidson, E.A. The contribution of manure and fertilizer nitrogen to atmospheric nitrous oxide since 1860. Nat. Geosci. 2009, 2, 659–662. [Google Scholar] [CrossRef]
  4. Syakila, A.; Kroeze, C. The global nitrous oxide budget revisited. Greenh. Gas Meas. Manag. 2011, 1, 17–26. [Google Scholar] [CrossRef]
  5. Firestone, M.; Davidson, E. Microbiological basis of NO and N2O production and consumption in soil. In Exchange of Trace Gases between Terrestrial Ecosystems and the Atmosphere; John Wiley and Sons Ltd.: Hoboken, NJ, USA, 1989; pp. 7–21. [Google Scholar]
  6. Wrage, N.; Velthof, G.L.; van Beusichem, M.L.; Oenema, O. Role of nitrifier denitrification in the production of nitrous oxide. Soil Biol. Biochem. 2001, 33, 1723–1732. [Google Scholar] [CrossRef]
  7. Linn, D.M.; Doran, J.W. Effect of water-filled pore space on carbon dioxide and nitrous oxide production in tilled and nontilled soils. Soil Sci. Soc. Am. J. 1984, 48, 1267–1272. [Google Scholar] [CrossRef]
  8. Bateman, E.J.; Baggs, E.M. Contributions of nitrification and denitrification to N2O emissions from soils at different water-filled pore space. Biol. Fertil. Soils 2005, 41, 379–388. [Google Scholar] [CrossRef]
  9. Matson, P.A.; Naylor, R.; Ortiz-Monasterio, I. Integration of environmental, agronomic, and economic aspects of fertilizer management. Science 1998, 280, 112–115. [Google Scholar] [CrossRef] [PubMed]
  10. Liu, C.; Zheng, X.; Zhou, Z.; Han, S.; Wang, Y.; Wang, K.; Liang, W.; Li, M.; Chen, D.; Yang, Z. Nitrous oxide and nitric oxide emissions from an irrigated cotton field in Northern China. Plant Soil 2010, 332, 123–134. [Google Scholar] [CrossRef]
  11. Gu, J.; Nicoullaud, B.; Rochette, P.; Pennock, D.J.; Henault, C.; Cellier, P.; Richard, G. Effect of topography on nitrous oxide emissions from winter wheat fields in Central France. Environ. Pollut. 2011, 159, 3149–3155. [Google Scholar] [CrossRef] [PubMed]
  12. Gu, J.; Nicoullaud, B.; Rochette, P.; Grossel, A.; Henault, C.; Cellier, P.; Richard, G. A regional experiment suggests that soil texture is a major control of N2O emissions from tile-drained winter wheat fields during the fertilization period. Soil Biol. Biochem. 2013, 60, 134–141. [Google Scholar] [CrossRef]
  13. Garland, G.M.; Suddick, E.; Burger, M.; Horwath, W.R.; Six, J. Direct N2O emissions from a Mediterranean vineyard: Event-related baseline measurements. Agric. Ecosyst. Environ. 2014, 195, 44–52. [Google Scholar] [CrossRef]
  14. Decock, C.; Garland, G.; Suddick, E.C.; Six, J. Season and location-specific nitrous oxide emissions in an almond orchard in California. Nutr. Cycl. Agroecosyst. 2017, 107, 139–155. [Google Scholar] [CrossRef]
  15. Bouwman, A.F. Direct emission of nitrous oxide from agricultural soils. Nutr. Cycl. Agroecosyst. 1996, 46, 53–70. [Google Scholar] [CrossRef]
  16. Zou, J.; Huang, Y.; Zheng, X.; Wang, Y. Quantifying direct N2O emissions in paddy fields during rice growing season in mainland China: Dependence on water regime. Atmos. Environ. 2007, 41, 8030–8042. [Google Scholar] [CrossRef]
  17. Webb, J.; Thorman, R.E.; Fernanda-Aller, M.; Jackson, D.R. Emission factors for ammonia and nitrous oxide emissions following immediate manure incorporation on two contrasting soil types. Atmos. Environ. 2014, 82, 280–287. [Google Scholar] [CrossRef]
  18. Zheng, X.H.; Han, S.H.; Huang, Y.; Wang, Y.S.; Wang, M.X. Re-quantifying the emission factors based on field measurements and estimating the direct N2O emission from Chinese croplands. Glob. Biogeochem. Cycles 2004, 18. [Google Scholar] [CrossRef]
  19. IPCC 2006. 2006 IPCC Guidelines for National Greenhouse Gas Inventories–A Primer, Prepared by the National Greenhouse Gas Inventories Programme; Eggleston, H.S., Buendia, L., Miwa, K., Ngara, T., Tanabe, K., Eds.; IGES: Hayama, Japan, 2006. [Google Scholar]
  20. Stehfest, E.; Bouwman, L. N2O and NO emission from agricultural fields and soils under natural vegetation: Summarizing available measurement data and modeling of global annual emissions. Nutr. Cycl. Agroecosyst. 2006, 74, 207–228. [Google Scholar] [CrossRef]
  21. Shepherd, A.; Yan, X.; Nayak, D.; Newbold, J.; Moran, D.; Dhanoa, M.S.; Goulding, K.; Smith, P.; Cardenas, L.M. Disaggregated N2O emission factors in China based on cropping parameters create a robust approach to the IPCC Tier 2 methodology. Atmos. Environ. 2015, 122, 272–281. [Google Scholar] [CrossRef] [PubMed] [Green Version]
  22. Berdanier, A.B.; Conant, R.T. Regionally differentiated estimates of cropland N2O emissions reduce uncertainty in global calculations. Glob. Chang. Biol. 2012, 18, 928–935. [Google Scholar] [CrossRef]
  23. Mosier, A.; Schimel, D.; Valentine, D.; Bronson, K.; Parton, W. Methane and nitrous-oxide fluxes in native, fertilized and cultivated grasslands. Nature 1991, 350, 330–332. [Google Scholar] [CrossRef]
  24. Liu, X.; Zhang, Q.; Li, S.; Zhang, L.; Ren, J. Simulated NH4+-N Deposition Inhibits CH4 Uptake and Promotes N2O Emission in the Meadow Steppe of Inner Mongolia, China. Pedosphere 2017, 27, 306–317. [Google Scholar] [CrossRef]
  25. Ju, X.T.; Liu, X.J.; Zhang, F.S.; Roelcke, M. Nitrogen fertilization, soil nitrate accumulation, and policy recommendations in several agricultural regions of China. Ambio 2004, 33, 300–305. [Google Scholar] [CrossRef] [PubMed]
  26. Zhai, H.; Dachuang, S.; Huairui, S. Current status and developing trend of apple industry in China. J. Fruit Sci. 2007, 24, 355–360. (In Chinese) [Google Scholar]
  27. Ju, X.T.; Kou, C.L.; Zhang, F.S.; Christie, P. Nitrogen balance and groundwater nitrate contamination: Comparison among three intensive cropping systems on the North China Plain. Environ. Pollut. 2006, 143, 117–125. [Google Scholar] [CrossRef] [PubMed] [Green Version]
  28. Ma, L.; Velthof, G.L.; Wang, F.H.; Qin, W.; Zhang, W.F.; Liu, Z.; Zhang, Y.; Wei, J.; Lesschen, J.P.; Ma, W.Q.; et al. Nitrogen and phosphorus use efficiencies and losses in the food chain in China at regional scales in 1980 and 2005. Sci. Total Environ. 2012, 434, 51–61. [Google Scholar] [CrossRef] [PubMed]
  29. Hoben, J.P.; Gehl, R.J.; Millar, N.; Grace, P.R.; Robertson, G.P. Nonlinear nitrous oxide (N2O) response to nitrogen fertilizer in on-farm corn crops of the US Midwest. Glob. Chang. Biol. 2011, 17, 1140–1152. [Google Scholar] [CrossRef]
  30. Chen, X.; Cui, Z.; Fan, M.; Vitousek, P.; Zhao, M.; Ma, W.; Wang, Z.; Zhang, W.; Yan, X.; Yang, J.; et al. Producing more grain with lower environmental costs. Nature 2014, 514, 486–489. [Google Scholar] [CrossRef] [PubMed]
  31. Liu, H.; Zhao, P.; Lu, P.; Wang, Y.S.; Lin, Y.B.; Rao, X.Q. Greenhouse gas fluxes from soils of different land-use types in a hilly area of South China. Agric. Ecosyst. Environ. 2008, 124, 125–135. [Google Scholar] [CrossRef]
  32. Pang, J.; Wang, X.; Mu, Y.; Ouyang, Z.; Liu, W. Nitrous oxide emissions from an apple orchard soil in the semiarid Loess Plateau of China. Biol. Fertil. Soils 2009, 46, 37–44. [Google Scholar] [CrossRef]
  33. Lin, S.; Iqbal, J.; Hu, R.; Ruan, L.; Wu, J.; Zhao, J.; Wang, P. Differences in nitrous oxide fluxes from red soil under different land uses in mid-subtropical China. Agric. Ecosyst. Environ. 2012, 146, 168–178. [Google Scholar] [CrossRef]
  34. Alsina, M.M.; Fanton-Borges, A.C.; Smart, D.R. Spatiotemporal variation of event related N2O and CH4 emissions during fertigation in a California almond orchard. Ecosphere 2013, 4. [Google Scholar] [CrossRef]
  35. Fentabil, M.M.; Nichol, C.F.; Jones, M.D.; Neilsen, G.H.; Neilsen, D.; Hannam, K.D. Effect of drip irrigation frequency, nitrogen rate and mulching on nitrous oxide emissions in a semi-arid climate: An assessment across two years in an apple orchard. Agric. Ecosyst. Environ. 2016, 235, 242–252. [Google Scholar] [CrossRef]
  36. De Klein, C.A.M.; Harvey, M.J. Nitrous Oxide Chamber Methodology Guidelines; Livestock Research Group: London, UK, 2013. [Google Scholar]
  37. Parkin, T.B. Effect of sampling frequency on estimates of cumulative nitrous oxide emissions. J. Environ. Qual. 2008, 37, 1390–1395. [Google Scholar] [CrossRef] [PubMed]
  38. Reeves, S.; Wang, W.; Salter, B.; Halpin, N. Quantifying nitrous oxide emissions from sugarcane cropping systems: Optimum sampling time and frequency. Atmos. Environ. 2016, 136, 123–133. [Google Scholar] [CrossRef]
  39. Zheng, X.H.; Mei, B.L.; Wang, Y.H.; Xie, B.H.; Wang, Y.S.; Dong, H.B.; Xu, H.; Chen, G.X.; Cai, Z.C.; Yue, J.; et al. Quantification of N2O fluxes from soil-plant systems may be biased by the applied gas chromatograph methodology. Plant Soil 2008, 311, 211–234. [Google Scholar] [CrossRef]
  40. Kroon, P.; Hensen, A.; van den Bulk, W.C.M.; Jongejan, P.; Vermeulen, A. The importance of reducing the systematic error due to non-linearity in N2O flux measurements by static chambers. Nutr. Cycl. Agroecosyst. 2008, 82, 175–186. [Google Scholar] [CrossRef]
  41. Mei, B.; Zheng, X.; Xie, B.; Dong, H.; Yao, Z.; Liu, C.; Zhou, Z.; Wang, R.; Deng, J.; Zhu, J. Characteristics of multiple-year nitrous oxide emissions from conventional vegetable fields in southeastern China. J. Geophys. Res. Atmos. 2011, 116. [Google Scholar] [CrossRef]
  42. Chang, C.; Janzen, H.; Cho, C. Nitrous oxide emission from long-term manured soils. Soil Sci. Soc. Am. J. 1998, 6, 677–682. [Google Scholar] [CrossRef]
  43. Gu, J.; Zheng, X.; Wang, Y.; Ding, W.; Zhu, B.; Chen, X.; Wang, Y.; Zhao, Z.; Shi, Y.; Zhu, J. Regulatory effects of soil properties on background N2O emissions from agricultural soils in China. Plant Soil 2007, 295, 53–65. [Google Scholar] [CrossRef]
  44. Gu, J.; Zheng, X.; Zhang, W. Background nitrous oxide emissions from croplands in China in the year 2000. Plant Soil 2009, 320, 307–320. [Google Scholar] [CrossRef]
  45. Li, X.; Hu, C.; Delgado, J.A.; Zhang, Y.; Ouyang, Z. Increased nitrogen use efficiencies as a key mitigation alternative to reduce nitrate leaching in north China plain. Agric. Water Manag. 2007, 89, 137–147. [Google Scholar] [CrossRef]
  46. National Bureau of Statistics of China. China Statistical Yearbook; China Statistics Press: Beijing, China, 2016; pp. 390–418. ISBN 9787503779176.
  47. Qu, Z.; Wang, J.; Almoy, T.; Bakken, L.R. Excessive use of nitrogen in Chinese agriculture results in high N2O/(N2O+N2) product ratio of denitrification, primarily due to acidification of the soils. Glob. Chang. Biol. 2014, 20, 1685–1698. [Google Scholar] [CrossRef] [PubMed]
  48. Chen, X.-P.; Cui, Z.-L.; Vitousek, P.M.; Cassman, K.G.; Matson, P.A.; Bai, J.-S.; Meng, Q.-F.; Hou, P.; Yue, S.-C.; Roemheld, V.; et al. Integrated soil-crop system management for food security. Proc. Natl. Acad. Sci. USA 2011, 108, 6399–6404. [Google Scholar] [CrossRef] [PubMed]
Figure 1. Seasonal dynamics between (a) air temperature (°C) and precipitation (mm); and (b) soil temperature (10 cm depth, °C) and water-filled pore space (WFPS; 10 cm depth, %) in the studied apple orchard during 2010–2011.
Atmosphere 08 00181 g001
Figure 2. Seasonal dynamics in dissolved organic carbon (DOC) content (mg C kg−1 dry soil) across the sampling sites and treatments in 2010. (a) Fertilizer ditches; (b) Bare soil; Data points indicate the mean of the three replicates; error bars indicate the standard error (SE).
Atmosphere 08 00181 g002
Figure 3. Seasonal dynamics of soil NH4+ content (mg N kg−1) across the sampling sites and treatments in 2010. (a) Fertilizer ditches; (b) Bare soil; Data points indicate the mean of the three replicates; error bars indicate the standard error (SE). Black arrows indicate nitrogen fertilizer applications.
Atmosphere 08 00181 g003
Figure 4. Seasonal dynamics of soil NO3 content (mg N kg−1) across the sampling sites and treatments in 2010. (a) Fertilizer ditches; (b) Bare soil; Data points indicate the mean of the three replicates; error bars indicate the standard error (SE). Black arrows indicate nitrogen fertilizer applications.
Atmosphere 08 00181 g004
Figure 5. Seasonal variations in N2O flux across the sampling sites and treatments during 2010–2011. (a) Site FD, (b) Site BS. FD, fertilized ditch. BS, bare soil with none ferltilizers. Data points indicate the mean of the three replicates; error bars indicate the standard error (SE). Black arrows indicate nitrogen fertilizer applications.
Atmosphere 08 00181 g005
Figure 6. Seasonal variations in CH4 flux across the sampling sites and treatments during 2010–2011. FD, fertilized ditch. BS, bare soil with none ferltilizers. (a) Fertilizer ditches; (b) Bare soil; Data points indicate the mean of the three replicates; error bars indicate the standard error (SE). Black arrows indicate nitrogen fertilizer applications.
Atmosphere 08 00181 g006
Figure 7. Relationships between annual N2O emissions (kg N ha−1) and (a) annual mean DOC content (mg C kg−1); (b) annual mean NH4+ content (mg N kg−1); and (c) annual mean NO3 content (mg N kg−1) at the site scale in 2010. Error bars indicate the standard error (SE).
Atmosphere 08 00181 g007
Table 1. Selected soil properties (0–20 cm layer).
Soil PropertiesMean
pH (H2O)6.7
Bulk density (g cm−3)1.39
Soil organic carbon (g C kg−1)10.6
Total nitrogen (g N kg−1)1.2
Total phosphorus (g P kg−1)1.9
Total potassium (g K kg−1)15.8
Available phosphorus (mg P kg−1)50.7
Available potassium (mg K kg−1)155.2
Clay (<2 µm, %)7.0
Silt (2–200 µm, %)39.6
Sand (>200 µm, %)53.4
Table 2. Management practices in the apple orchard between 2010 and 2011.
YearFertilization DateMethodFertilizerDate of Irrigation
20101 AprilBuried in ditches50% N11 May; 2 August; 1 October; 13 November; 7 December
100% P
50% K
24 JuneSurface application15% N
22 AugustSurface application35% N
50% K
20111 AprilBuried in ditches50% N27 March; 20 April; 27 May
100% P
50% K
24 JuneSurface application15% N
22 AugustSurface application35% N
50% K
Table 3. Apple production, annual N2O emissions, EFd, and CH4 uptake during 2010 and 2011.
YearTreatmentProduction (t ha−1)N2O (kg N ha−1 Year−1)EFd (%)CH4 (kg C ha−1 Year−1)
FDBSFieldField
2010CK26.2 (2.4)a39.1 (2.0)a32.1 (3.5)a34.1 (3.1)a-−0.9 (0.4)a
LN31.2 (5.1)a68.2 (13.7)ab39.2 (1.9)ab47.2 (5.2)b1.65−1.1 (0.6)a
HN30.2 (0.8)a93.6 (11.3)b47.6 (2.9)b60.3 (5.2)c1.46−0.4 (0.7)a
2011CK27.1 (2.6)a43.1 (1.1)a30.9 (3.4)a34.3 (2.7)a-−1.1 (0.6)a
LN35.6 (1.8)b77.1 (12.3)ab33.7 (3.8)a45.7 (6.1)b1.00−1.1 (0.4)a
HN30.9 (3.3)ab112.7 (14.2)b38.7 (5.4)a59.2 (7.8)c1.24−0.7 (0.2)a

