Article

Summertime Day-Night Differences of PM2.5 Components (Inorganic Ions, OC, EC, WSOC, WSON, HULIS, and PAHs) in Changzhou, China

1
College of Chemistry and Environmental Engineering, Jiangsu University of Technology, Changzhou 213001, China
2
Jiangsu Key Laboratory of Atmospheric Environment Monitoring and Pollution Control, Collaborative Innovation Center of Atmospheric Environment and Equipment Technology, School of Environmental Sciences and Engineering, Nanjing University of Information Science and Technology, Nanjing 210044, China
*
Author to whom correspondence should be addressed.
Atmosphere 2017, 8(10), 189; https://doi.org/10.3390/atmos8100189
Submission received: 2 August 2017 / Revised: 20 September 2017 / Accepted: 22 September 2017 / Published: 25 September 2017
(This article belongs to the Special Issue Carbonaceous Aerosols in Atmosphere)

Abstract

:
This work reports the day-night differences of a suite of chemical species including elemental carbon (EC), organic carbon (OC), water-soluble organic carbon (WSOC), water-soluble organic nitrogen (WSON), selected polycyclic aromatic hydrocarbons (PAHs), and secondary inorganic ions (NO3, SO42−, NH4+) in ambient fine particles (PM2.5) collected from 23 July to 23 August 2016 in Changzhou, China. Mass concentrations of PM2.5 and SO42− show a 10–20% increase during daytime, while NO3 concentration decreases by a factor of three from nighttime to daytime due to its semi-volatile nature. PAHs, EC, and WSON show higher mass concentration in the night too. Mass ratios of WSOC to OC are high in both day and night, indicating that secondary organic aerosol (SOA) formation could occur throughout the day, while the slightly higher ratio during daytime suggests a more significant contribution from daytime photochemical oxidation. Strong positive correlations between HULIS-C and WSOC, and HULIS-C with O3 both in day and night, imply that HULIS-C, similar to WSOC, is mainly composed of secondary species. HULIS-C accounted for a large fraction of WSOC, with an average of ~60%. Moreover, the average WSON concentrations are 1.08 and 1.46 µg/m3, constituting ~16% and ~18% of water-soluble total nitrogen in day and night, respectively. Correlation analyses suggest that WSON is also predominantly produced from secondary processes. PAHs concentrations are found to be very low in summer aerosols. Overall, our findings highlight the dominant contribution of secondary processes to the major aerosol components in Changzhou, suggesting proper measures to effectively reduce gaseous precursors are also important to improve air quality.

1. Introduction

Atmospheric fine aerosols (PM2.5), derived from natural and anthropogenic sources, can significantly affect air quality, visibility, human health and the earth’s climate. Organic aerosol (OA), constituting a large fraction (~20–90%) of PM2.5, contains multiple species that are potentially mutagenic and carcinogenic (such as polycyclic aromatic hydrocarbons (PAHs)) and therefore is particularly harmful to human health [1,2]. As a significant fine aerosol component, OA also contributes to the formation and evolution of atmospheric haze [3]. Despite the increasing number of studies on OA in PM2.5 around the world [4,5,6,7], not as many of them focused on the differences of its physical characteristics, chemical compositions, and sources among day and night. In particular, meteorological conditions and anthropogenic activities in urban areas can vary significantly from day to night [8], especially summer has strong solar radiation during the day, which in turn affects the formation and evolution of atmospheric aerosols. However, investigations on day-to-night variation [9,10] are not fully clarified. Daytime photochemical reactions facilitate the oxidation of volatile organic compounds (VOCs) to form secondary organic aerosols (SOA), which increases the water-soluble organic carbon (WSOC) and secondary OC (SOC), as well as the WSOC/OC ratios [11]. Chan et al. [12] estimated that the photochemical products in summer can contribute ~22.5% to the total PM2.5 mass. Investigations on the day-night variation of PM2.5 and its components are thus valuable to better understand the origin, formation, and chemical transformation of airborne particulate matter.
Humic-like substances (HULIS), comprising a considerable fraction of OA, include components with strong polar, weak acidic, and chromophoric properties. HULIS can influence aerosol properties such as hygroscopicity and cloud condensation nuclei (CCN) activity, and thereby the climate [13]. The carbon content of HULIS (HULIS-C) constitutes a significant portion of WSOC (25–75%) [14,15]. Qiao et al. [16] has pointed out that HULIS might be very important for haze pollution. Previous studies [17,18] reveal that HULIS can have both primary (such as biomass burning, marine emission) and secondary sources (aqueous-phase and photochemical productions). A large number of previous studies have been conducted to probe the sources, characteristics, and optical properties of HULIS [19,20]. However, large discrepancies exist, due to a large variety of measurement approaches used in different studies [21,22]. For example, the split of organic carbon (OC) and elemental carbon (EC) can be influenced by HULIS. These differences between HULIS features might be attributed to differences of either analytic techniques (UV-Vis, FTIR, 1H-NMR) or isolation methods with different cartridges (HLB, ENVI-18, XAD-8, DEAE). Utilization of a suite of techniques to analyze multiple other aerosol species (WSOC, WSON, PAHs) in parallel may allow us to gain more insights into the properties and possible sources of HULIS.
Water-soluble organic nitrogen (WSON), very important in the atmospheric nitrogen cycle [23,24,25], has important impacts on aerosol properties via altering their toxicity and chemical properties. WSON contributes 10–39% of water-soluble total nitrogen (WSTN) in particulate matter [26,27], and the WSON/WSTN ratio depends upon many factors including emission sources and chemical formation pathways, etc. Claeys et al. [28] show that WSON can be associated with high molecular weight compounds (e.g., HULIS). To date, the properties of both HULIS and WSON are still not well understood due to limitations of the analytical methods. Chemical characteristics of both HULIS and WSON in PM2.5 in Changzhou, an important city in the densely populated Yangtze River Delta region of China, have not been investigated.
In this regard, this study presents results on OC, EC, WSOC, HULIS-C, WSON, PAHs, and other major inorganic constituents in Changzhou PM2.5 using samples collected during day and night in summer, respectively. To our knowledge, this is the first study that investigates systematically the day-night differences of PM2.5 in Changzhou, China.

2. Experiments

2.1. Sample Collection

The sampling site was set on the rooftop of a nine-story building inside the campus of Jiangsu University of Technology in Changzhou (31.7° N, 119.9° E). Details of the site and its surroundings are described in our previous work [29]. Aerosol sampling was conducted onto quartz fiber filters (20.3 × 25.4 cm, Whatman QM-A) using a high volume sampler (KB-1000, Qingdao Jinsida Ltd., Qingdao, China) with a flow rate of 1.05 m3/min during 23 July to 23 August 2016. Daytime and nighttime samples were collected from 08:00 to 19:00 and 20:00 to 7:00 of the next day (local time), respectively. The filters were prebaked at 450 °C for 4 h prior to sampling. A total of 48 PM2.5 samples were collected. Before and after sampling, the filters were conditioned under constant temperature (22 ± 1 °C) and relative humidity (45 ± 5%) for 48 h and weighed by a microbalance (precision of 0.01 mg). The sampled filters were wrapped, sealed in aluminum foil envelopes separately, and stored in a freezer at −20 °C until analysis. Note the samples were analyzed immediately after the campaign, so all samples were analyzed within one month after sampling. Of course, quartz filters can absorb organic gases and hence introduce artifacts, so we used back-to-back blank filters that were treated in the same manner to minimize the influences especially on the carbonaceous species and gravimetric measurements [30].
Meteorological parameters and gaseous O3 concentrations were recorded at the air quality monitoring station inside the campus, which is about 500 m from the sampling site. The temperature varied from 15.4 to 32.4 °C and the relative humidity (RH) varied from 30 to 100% during the sampling period. The mean temperatures in day and night were 27.5 °C and 18.3 °C, respectively. The average O3 concentrations were 120.2 and 54.9 µg/m3, and the wind speeds (WS) were 2.5 and 1.5 m/s in day and night, respectively.

2.2. Chemical Analysis

Water soluble species (WSOC, WSTN/WSON, and inorganic ions): A quarter of each filter was cut into pieces by using a ceramic scissor, then extracted by 100 mL Milli-Q water (18.2 MΩ cm) under ultra-sonication for 45 min. The extracted solution was filtered through a syringe with 0.2 μm pore size (Whatman, Anotop 25). Then, the extracts were analyzed by a Shimadzu TOC-VCPH analyzer with a TNM-1 unit for the total organic carbon (referred here as WSOC) and total nitrogen (referred here as WSTN) using a thermo-catalytic oxidation approach, as described previously [31]. The major inorganic ions (SO42−, NH4+, NO3, NO2, and K+) of the extracts were analyzed by an ion chromatograph (Aquion, ThermoFisher Scientific, Waltham, MA, USA). Ion chromatograph equipped with a Dionex CS12A column was used for cation analysis (20 mM methanesulfonic acid as eluent), and a Dionex AS23 column was employed for the anions (4.5 mM NaHCO3 and 0.8 mM Na2CO3 as eluent). The detection limits are determined as three times the standard deviation of blank filters (0.06 mg/L for WSOC, 0.08 mg/L for WSTN, 0.19, 0.20, 0.23, 0.11, and 0.11 mg/L for NH4+, K+, NO3, NO2, and SO42−). More details regarding the analytical methods can be found in our previous work [29].
The concentration of WSON was determined by subtracting the water soluble inorganic nitrogen (WSIN) from the WSTN as follows:
WSON = WSTN-WSIN
WSIN = NH4+ × 14/18 + NO2 × 14/46 + NO3 × 14/62 = NH4+-N + NO2-N + NO3-N
OC and EC: OC and EC were measured using a thermal/optical carbon analyzer (DRI Model 2001A, Desert Research Institute, Las Vegas, NV, USA) following the temperature protocol described by Chow et al. [32]. A punch of each filter was measured stepwise at temperatures of 140 °C (OC1), 280 °C (OC2), 480 °C (OC3), and 580 °C (OC4) in a helium atmosphere, and 580 °C (EC1), 740 °C (EC2), and 840 °C (EC3) in a 2% oxygen/98% helium gas atmosphere. OC is calculated as OC1 + OC2 + OC3 + OC4 + OP and EC as EC1 + EC2 + EC3 − OP, where OP is the optical pyrolyzed OC [33]. Detection limits of OC and EC were 0.82 μgC/cm2 and 0.20 μgC/cm2, respectively.
HULIS-C: In this work we focused on measurements of the carbon contained in HULIS (HULIS-C) rather than HULIS. The HULIS fraction was isolated from PM2.5 sample by solid phase extraction (SPE) technique, as previously described [13,34]. In brief, 1/4 filter was extracted in 50 mL Milli-Q water with ultrasonication for 45 min and then filtered through the syringe with 0.2 μm pore size (Whatman, Maidstone, UK, Anotop 25) to obtain the water extract (WE). The WE was adjusted to pH ≈ 2 using 2 M HCl (Sigma-Aldrich, Saint Louis, MO, USA), and passed through pre-conditioned ENVI-18 SPE cartridges (60 mg/cartridge, CNW, ANPEL laboratory Technologies (Shanghai) Inc., Shanghai, China) with a flow rate of 1 mL/min. Thus, hydrophilic HULIS was retained by SPE cartridge. Note that the ENVI-18 was pre-conditioned with 3 mL methanol and 3 mL water. Then, 2 mL Milli-Q was injected into the SPE cartridge to rinse column in order to remove residues of inorganic constituents, then 5 mL 2% ammonia/methanol mixture (CNW, ANPEL laboratory Technologies (Shanghai) Inc., Shanghai, China) was introduced into the SPE cartridge to elute retained organics (HULIS). Finally, the eluted HULIS was dried under nitrogen gas flow until full dryness; subsequently, it was diluted with 25 mL Milli-Q and then measured by the same TOC analyzer used for WSOC determination (referred here as HULIS-C).
Two standard humic-like substances (Suwannee River fulvic acid, SRFA, 2S101F; Pahokee Peat Humic Acid, PPHA, 1S103H, St. Paul, MN, USA) were purchased from the International Humic Substances Society. We verified the method by adding 20 mL of 10 mgC/L SRFA solutions to blank filters to assess the recovery efficiency and reproducibility. The results showed that our SPE method yielded recovery ratios of 82–90% for SRFA with excellent reproducibility. These results indicate that the ENVI-18 SPE method can efficiently recover HULIS from filters.
The ultraviolet-visible (UV-Vis) spectra of both WSOC and HULIS in each sample were measured by using a UV-Vis spectrometer. We recorded the absorbance at λ = 250 nm (E250) and λ = 365 nm (E365) and E250/E365 ratio.
Polycyclic aromatic hydrocarbons (PAHs): The PAH compounds were analyzed with a gas chromatography-mass spectrometer (GC-MS) (Agilent 7890-7000B, City of Santa Clara, CA, USA) using a DB-5ms capillary column (30 m × 0.25 mm × 0.5 µm), following the standard procedure detailed in our previous work [29]. 18 PAH compounds including naphthalene (NaP), acenaphthylene (Acy), acenaphthene (Ace), fluorene (Flu), phenanthrene (Phe), anthracene (Ant), fluoranthene (Flua), pyrene (Pyr), benzo(a)anthracene (BaA), chrysene (Chr), benzo(b)fluoranthene (BbF), benzo(k)fluoranthene (BkF), benzo(a)pyrene(BaP), Benzo(e)pyrene (BeP), benzo(j)fluoranthene (BjF), benzoperylene (BghiP), indeno(1,2,3-cd)pyrene (InP), and dibenz(a,h)anthracene (DBA) were measured. The total PAH concentration (ΣPAHs) was calculated as the sum of the concentrations of 18 individual PAH species.
As mentioned earlier, back-to-back blank filters were treated in the same manner as for the samples, and it is worth to mention that all results reported here were subjected to blank corrections.

3. Results and Discussions

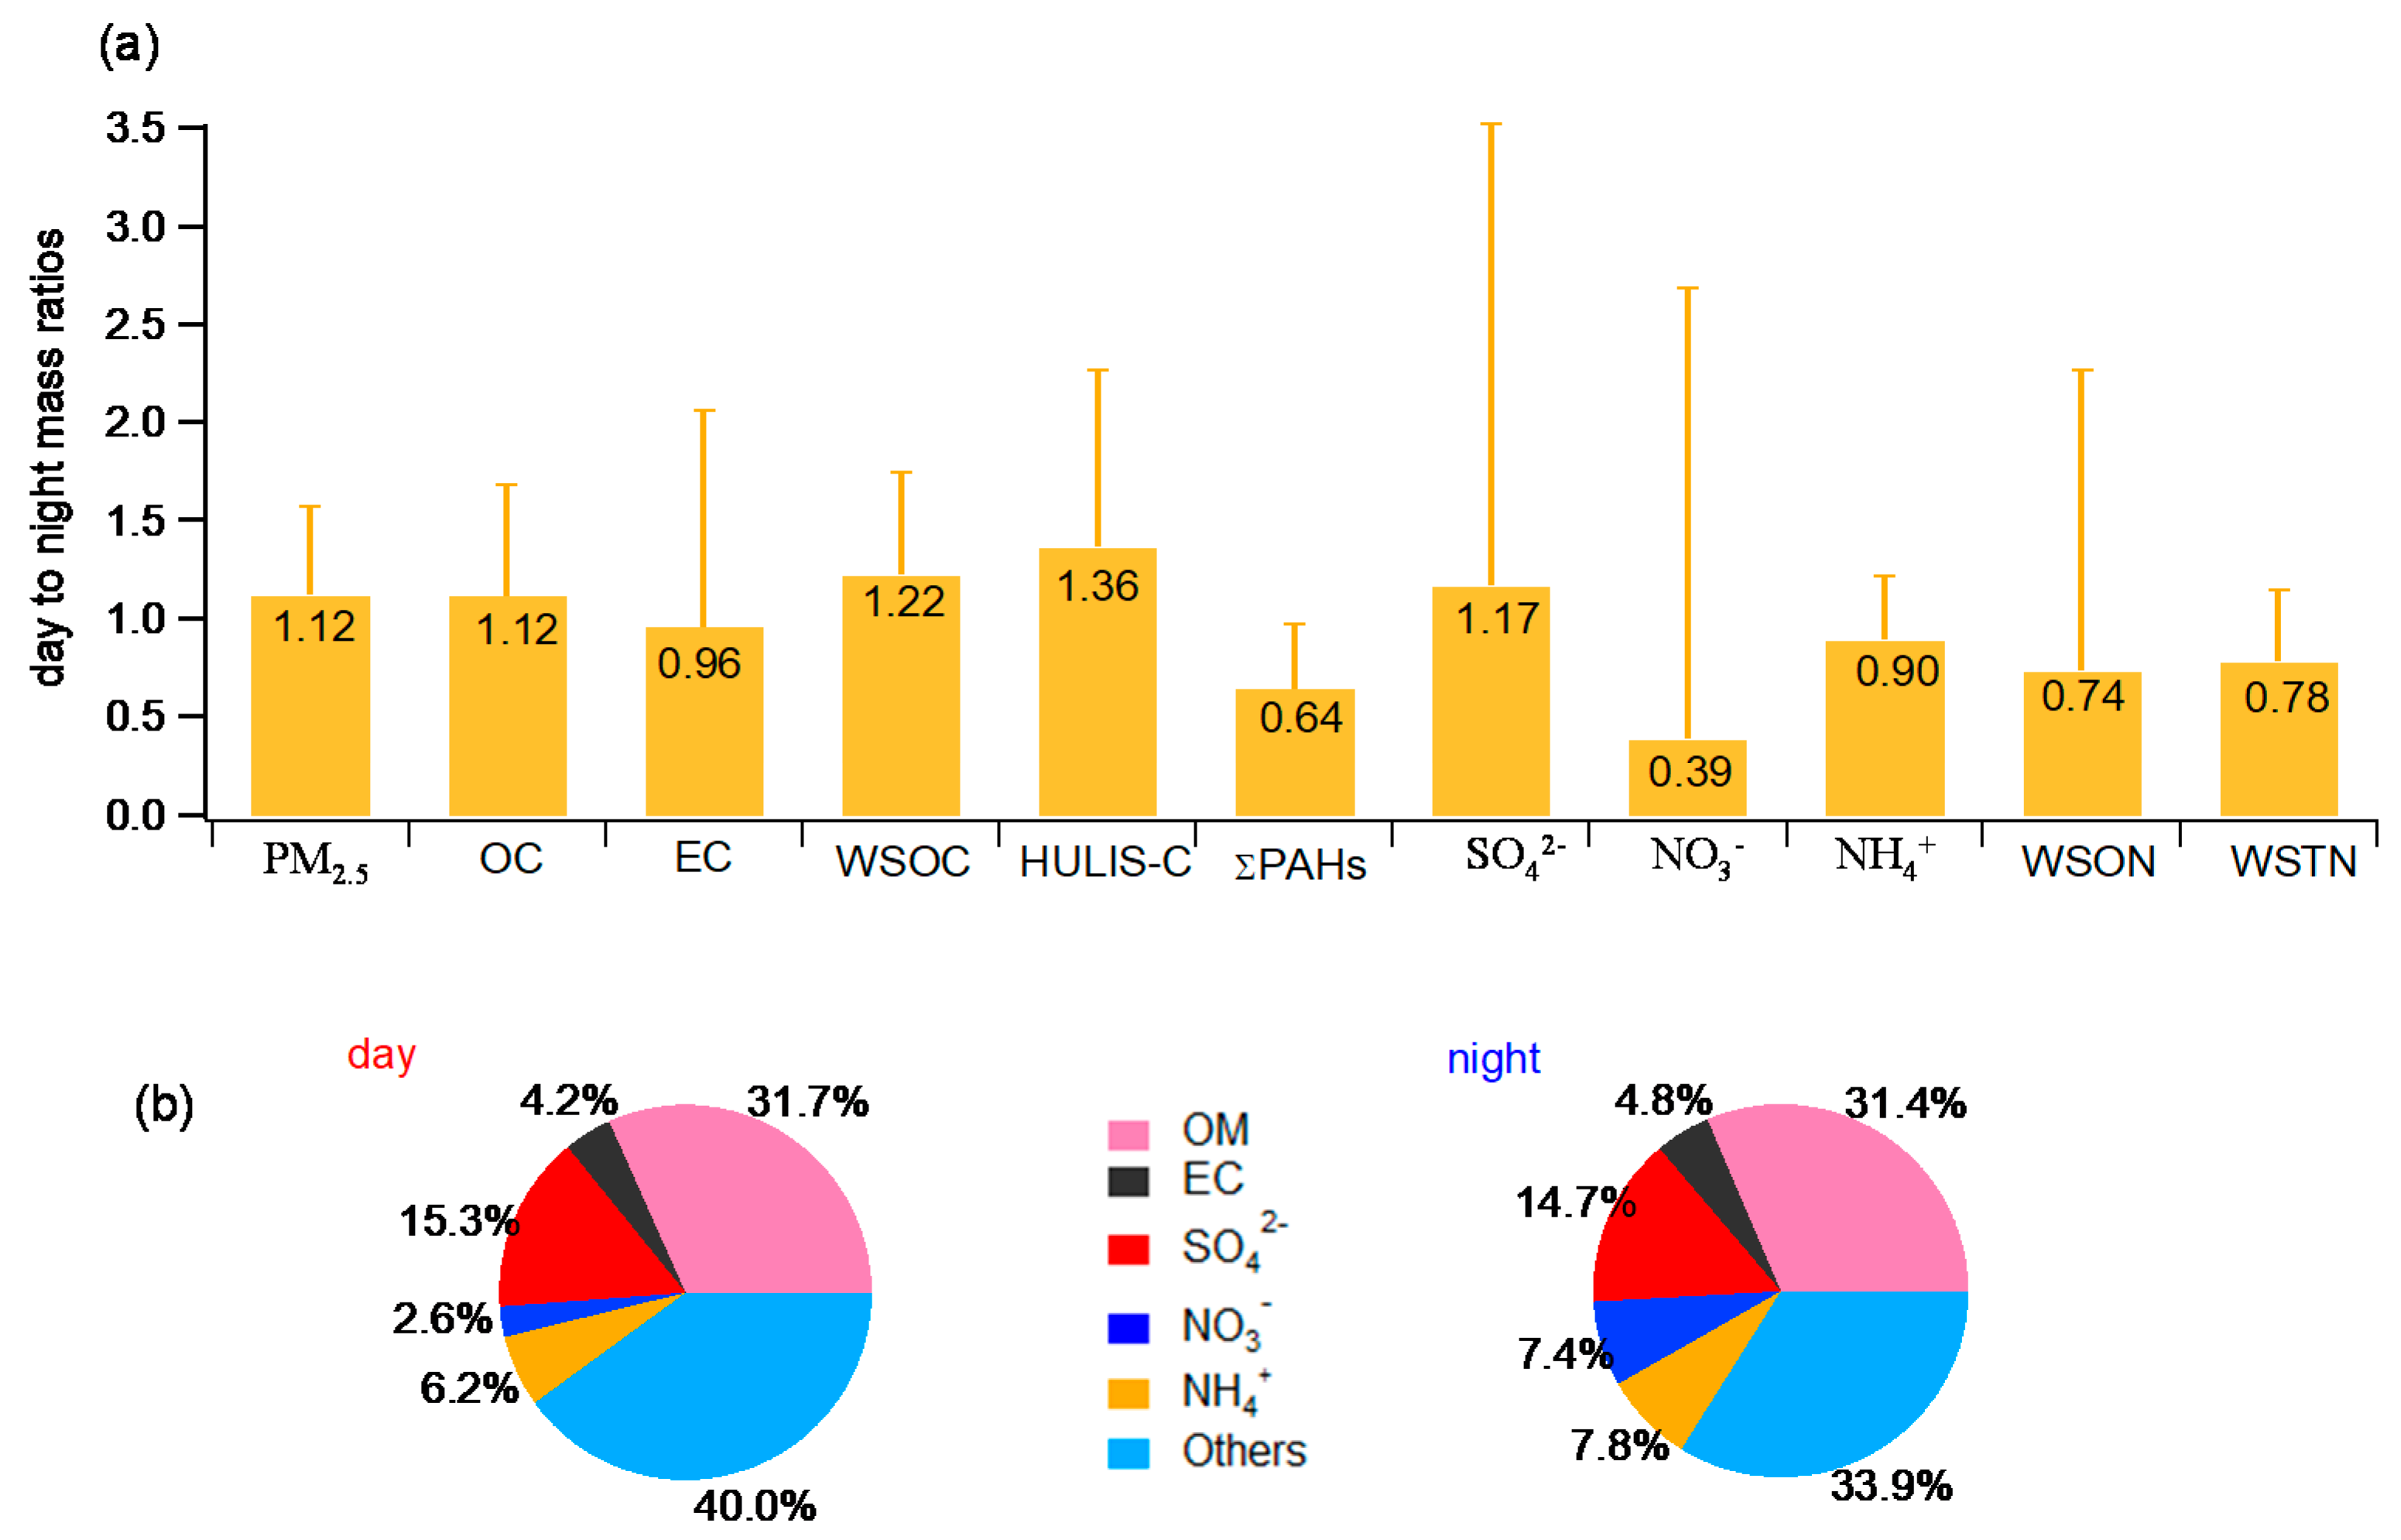
3.1. Total Concentration and Compositions of PM2.5

Table 1 summarizes the concentrations of PM2.5, OC, EC, WSOC, HULIS-C, WSTN, WSON, ΣPAHs, the major inorganic ionic species (ammonium, sulfate, and nitrate), as well as the (OC + EC)/PM2.5, WSOC/OC, HULIS-C/WSOC, WSON/WSTN ratios in day and night. The PM2.5 concentrations in day vary from 40.9 to 136.3 µg/m3 with an average of 77.3 µg/m3, whereas they vary from 33.3 to 119.3 µg/m3 in night with average value of 68.9 µg/m3. These values are generally close to 75 μg/m3—the second-grade national air quality standard (NAAQS) (GB 3095-2012).
In Figure 1a, we present the day-to-night mass ratios of some selected chemical species in PM2.5. On average, the PM2.5 mass, OC, WSOC, and HULIS-C are relatively higher (12–36%) in day than those in night, while ΣPAHs, EC, WSTN, and WSON show opposite day-night variation trends. As for the inorganic species, SO42 concentration is ~17% higher during daytime, and the difference between day and night samples regarding NO3 is very striking, being consistent with day-night variability of nitrate observed in Kanpur, India [35]. The remarkably low levels of nitrate in the day are likely attributed to the evaporation of NH4NO3 due to higher temperature during daytime and/or condensation of nitrate under relatively low temperatures and high RH during nighttime [36]. Overall, the enhancement of secondary aerosol formation is likely a dominant cause for the increase of PM2.5 concentrations during daytime.
The average WSOC/OC ratio for samples collected during daytime (60.3%) is higher than that for the nighttime samples (54.8%), similar to results observed in Kanpur, India [35]. The slightly higher WSOC/OC in daytime samples can be attributed to the enhanced SOA formation from atmospheric oxidation of VOCs under strong solar irradiation.
The mass proportions of OM (estimated as 1.6 × OC), EC, and secondary inorganic ions (SO42, NH4+ and NO3) to the PM2.5 mass are illustrated in Figure 1b. On average, OM accounts for ~31% of PM2.5 mass in both daytime and nighttime samples. A large proportion of PM2.5 mass is unidentified, which means other constituents, such as other heteroatoms bound in organic matters (oxygen, hydrogen, and nitrogen), other organic species (in particular the water-insoluble species), mineral dust, heavy metals, and other inorganic species are also important. The water uptake by the aerosol components (especially ammonium nitrate and sulfate) [37] can also influence the mass closure. The relatively high HULIS-C contents (that will be shown later) may be in part responsible for the low reconstituted fraction since HULIS usually has a higher OM/OC ratio (>1.9) than 1.6 [38]. In addition, the WSTN concentrations (day: 5.39 µg/m3, night: 6.92 µg/m3) can also contribute to the unquantified PM2.5 mass.

3.2. Carbonaceous Species

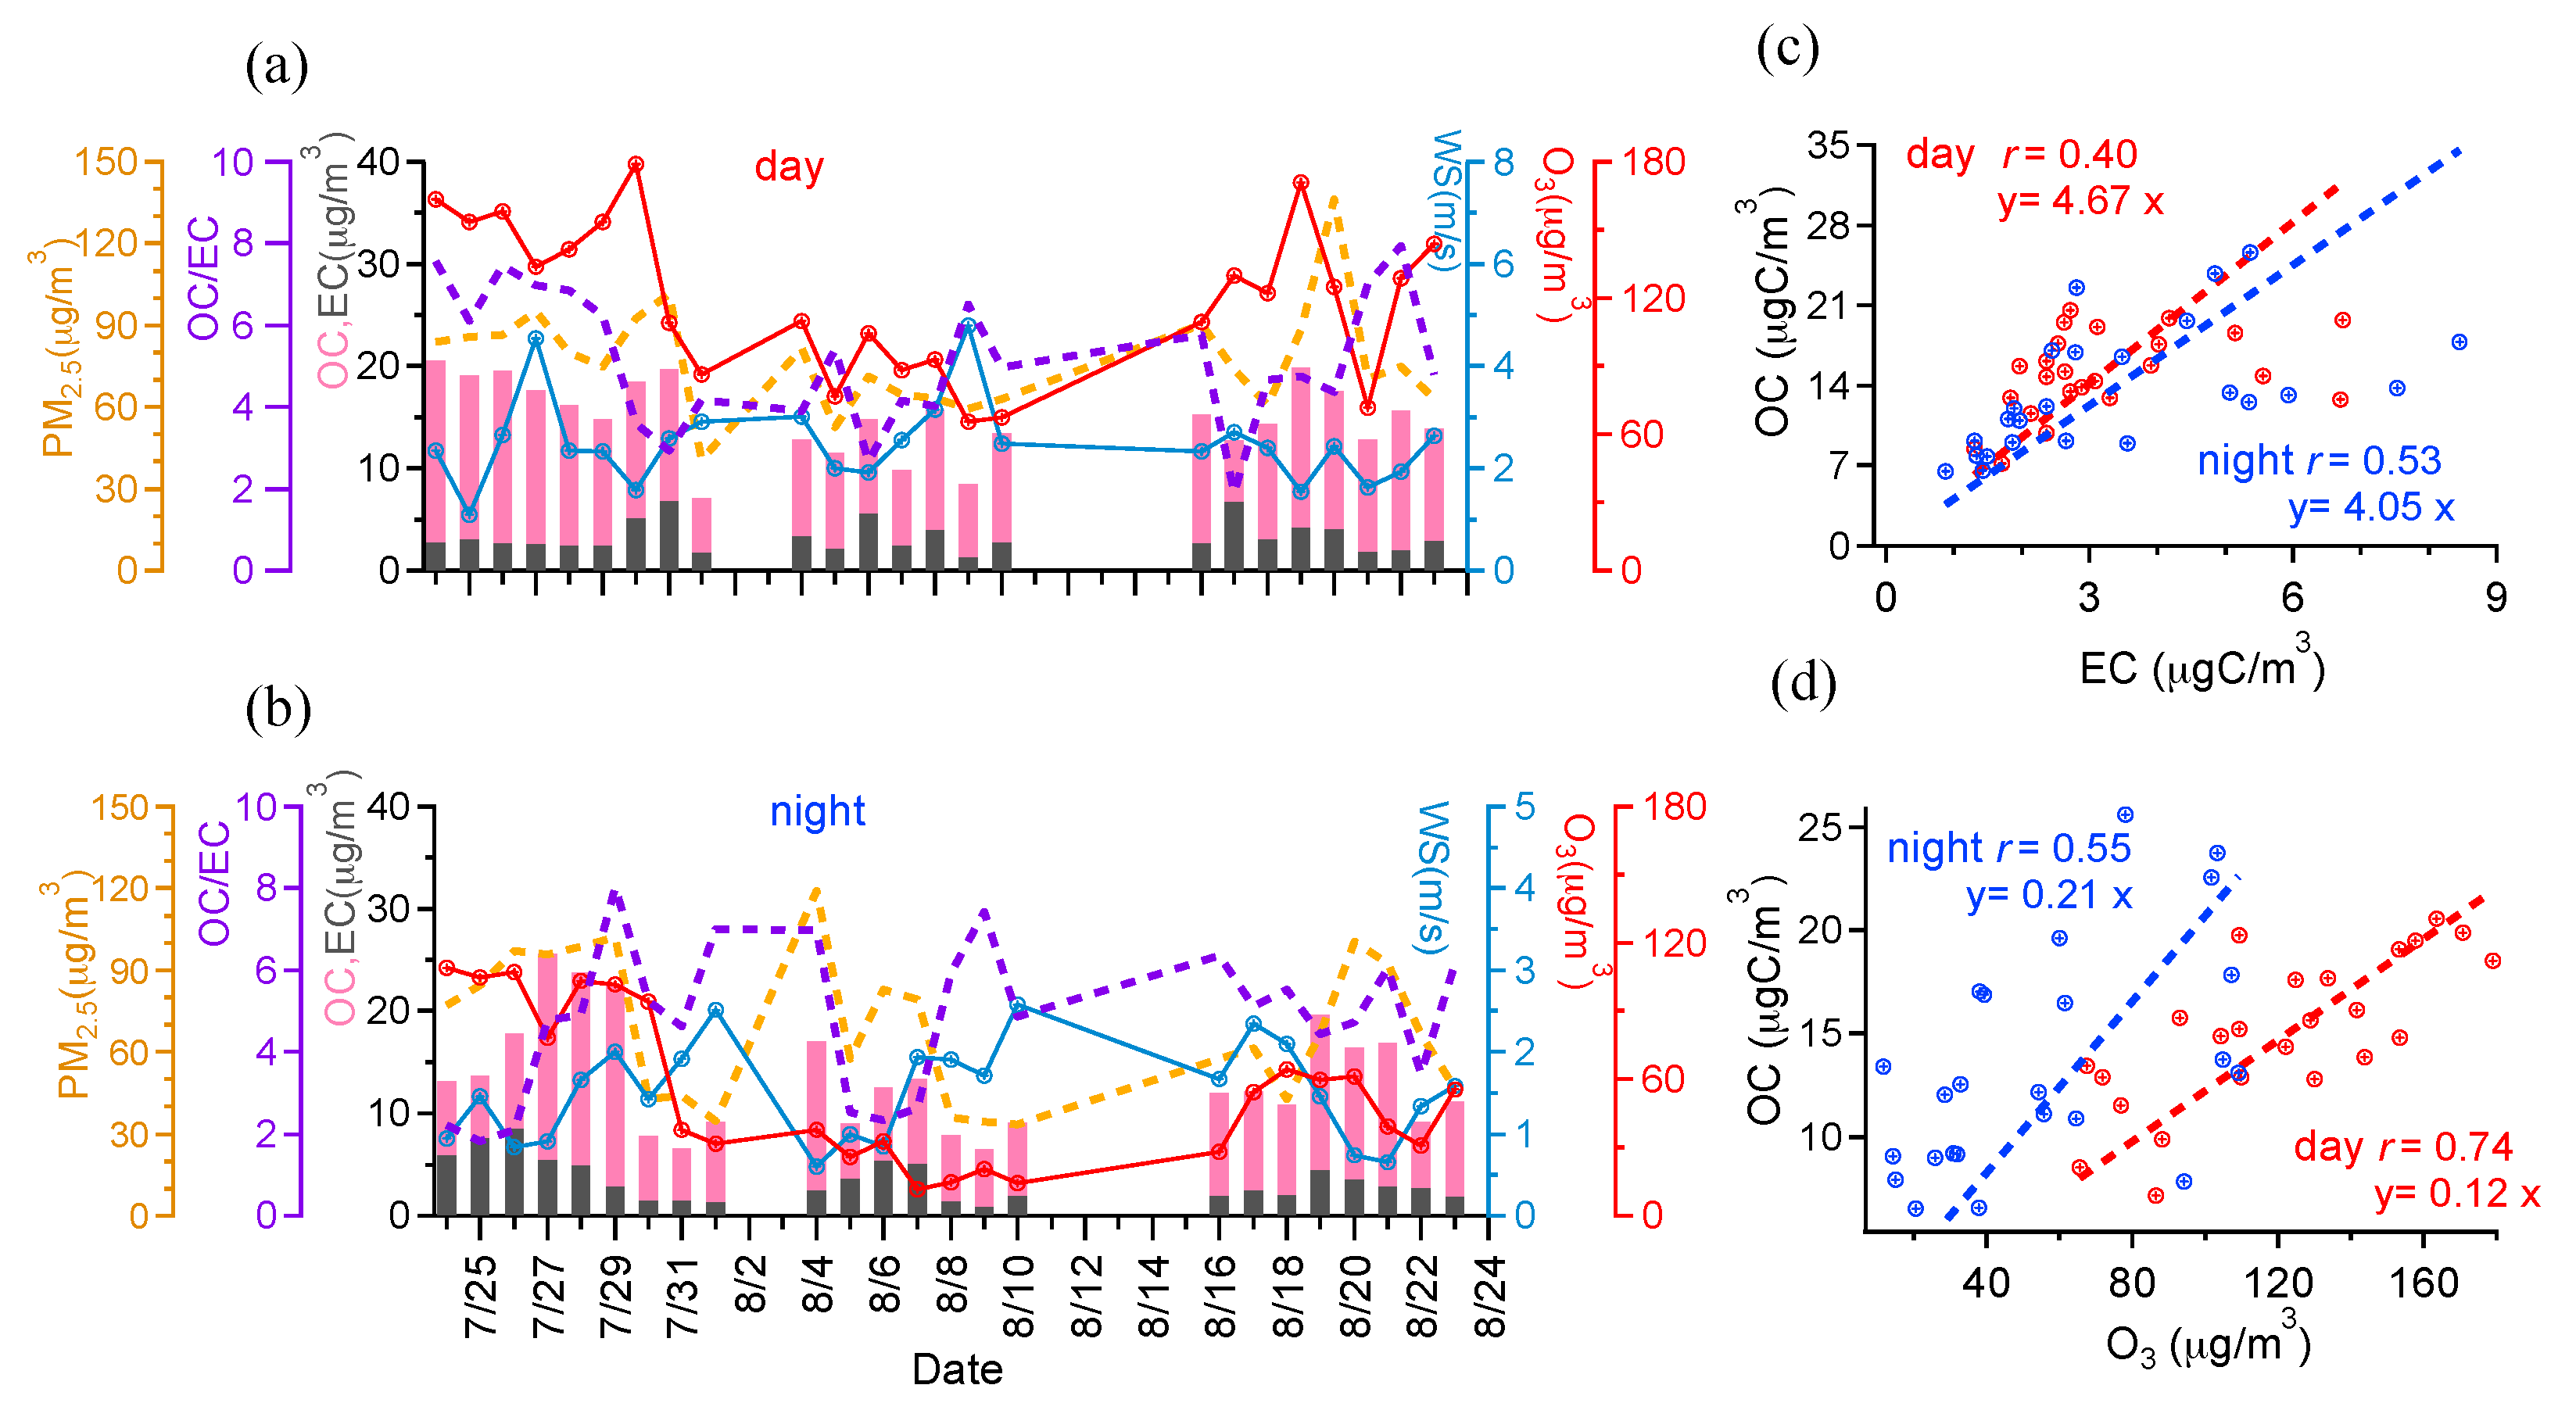
3.2.1. OC/EC Ratios and Correlation between OC and EC

The time series of concentrations of PM2.5, EC, OC, and O3, as well as OC/EC ratios and WS, are plotted in Figure 2a,b. Table 2 shows Pearson’s correlation (r) among various components, and their correlations with O3 and WS for both day and night samples. As presented in Table 2, all species negatively correlate with WS both in day and night, indicating high WS can dilute and reduce the accumulation of all particle-phase pollutants. PM2.5, OC, and EC all show positive correlations with O3, suggesting that the secondary formation of aerosols through the atmospheric oxidation processes may be considerable. The average OC and EC mass concentrations are 15.1 and 3.2 μg/m3 during daytime and 13.5 and 3.3 μg/m3 during nighttime (Table 1). Scatter plots of OC and EC and their correlation coefficients (r) are shown in Figure 2c. The correlations between OC and EC are relatively weak (r of 0.40 and 0.53 for day and night), suggesting additional secondary sources of OC other than the primary sources as for EC. Average OC/EC ratios are >4, likely supporting the assumption of secondary OC formation. But we need to be aware that the justification of secondary OC based on the OC/EC ratios alone is valid only after careful inspection of local sources of OC and EC [39], as some primary OA (such as biomass burning emissions) may have high OC/EC ratios as well.
Furthermore, as presented in Figure 2d, OC and O3 show better correlation (r of 0.74) for daytime samples than that of nighttime samples (r of 0.55), likely indicating that more secondary OC is produced during daytime as O3 is exclusively a secondary photochemical product. Of course, the positive correlation between OC and O3 in night might also imply that partial OC observed in the night are products of daytime oxidation.

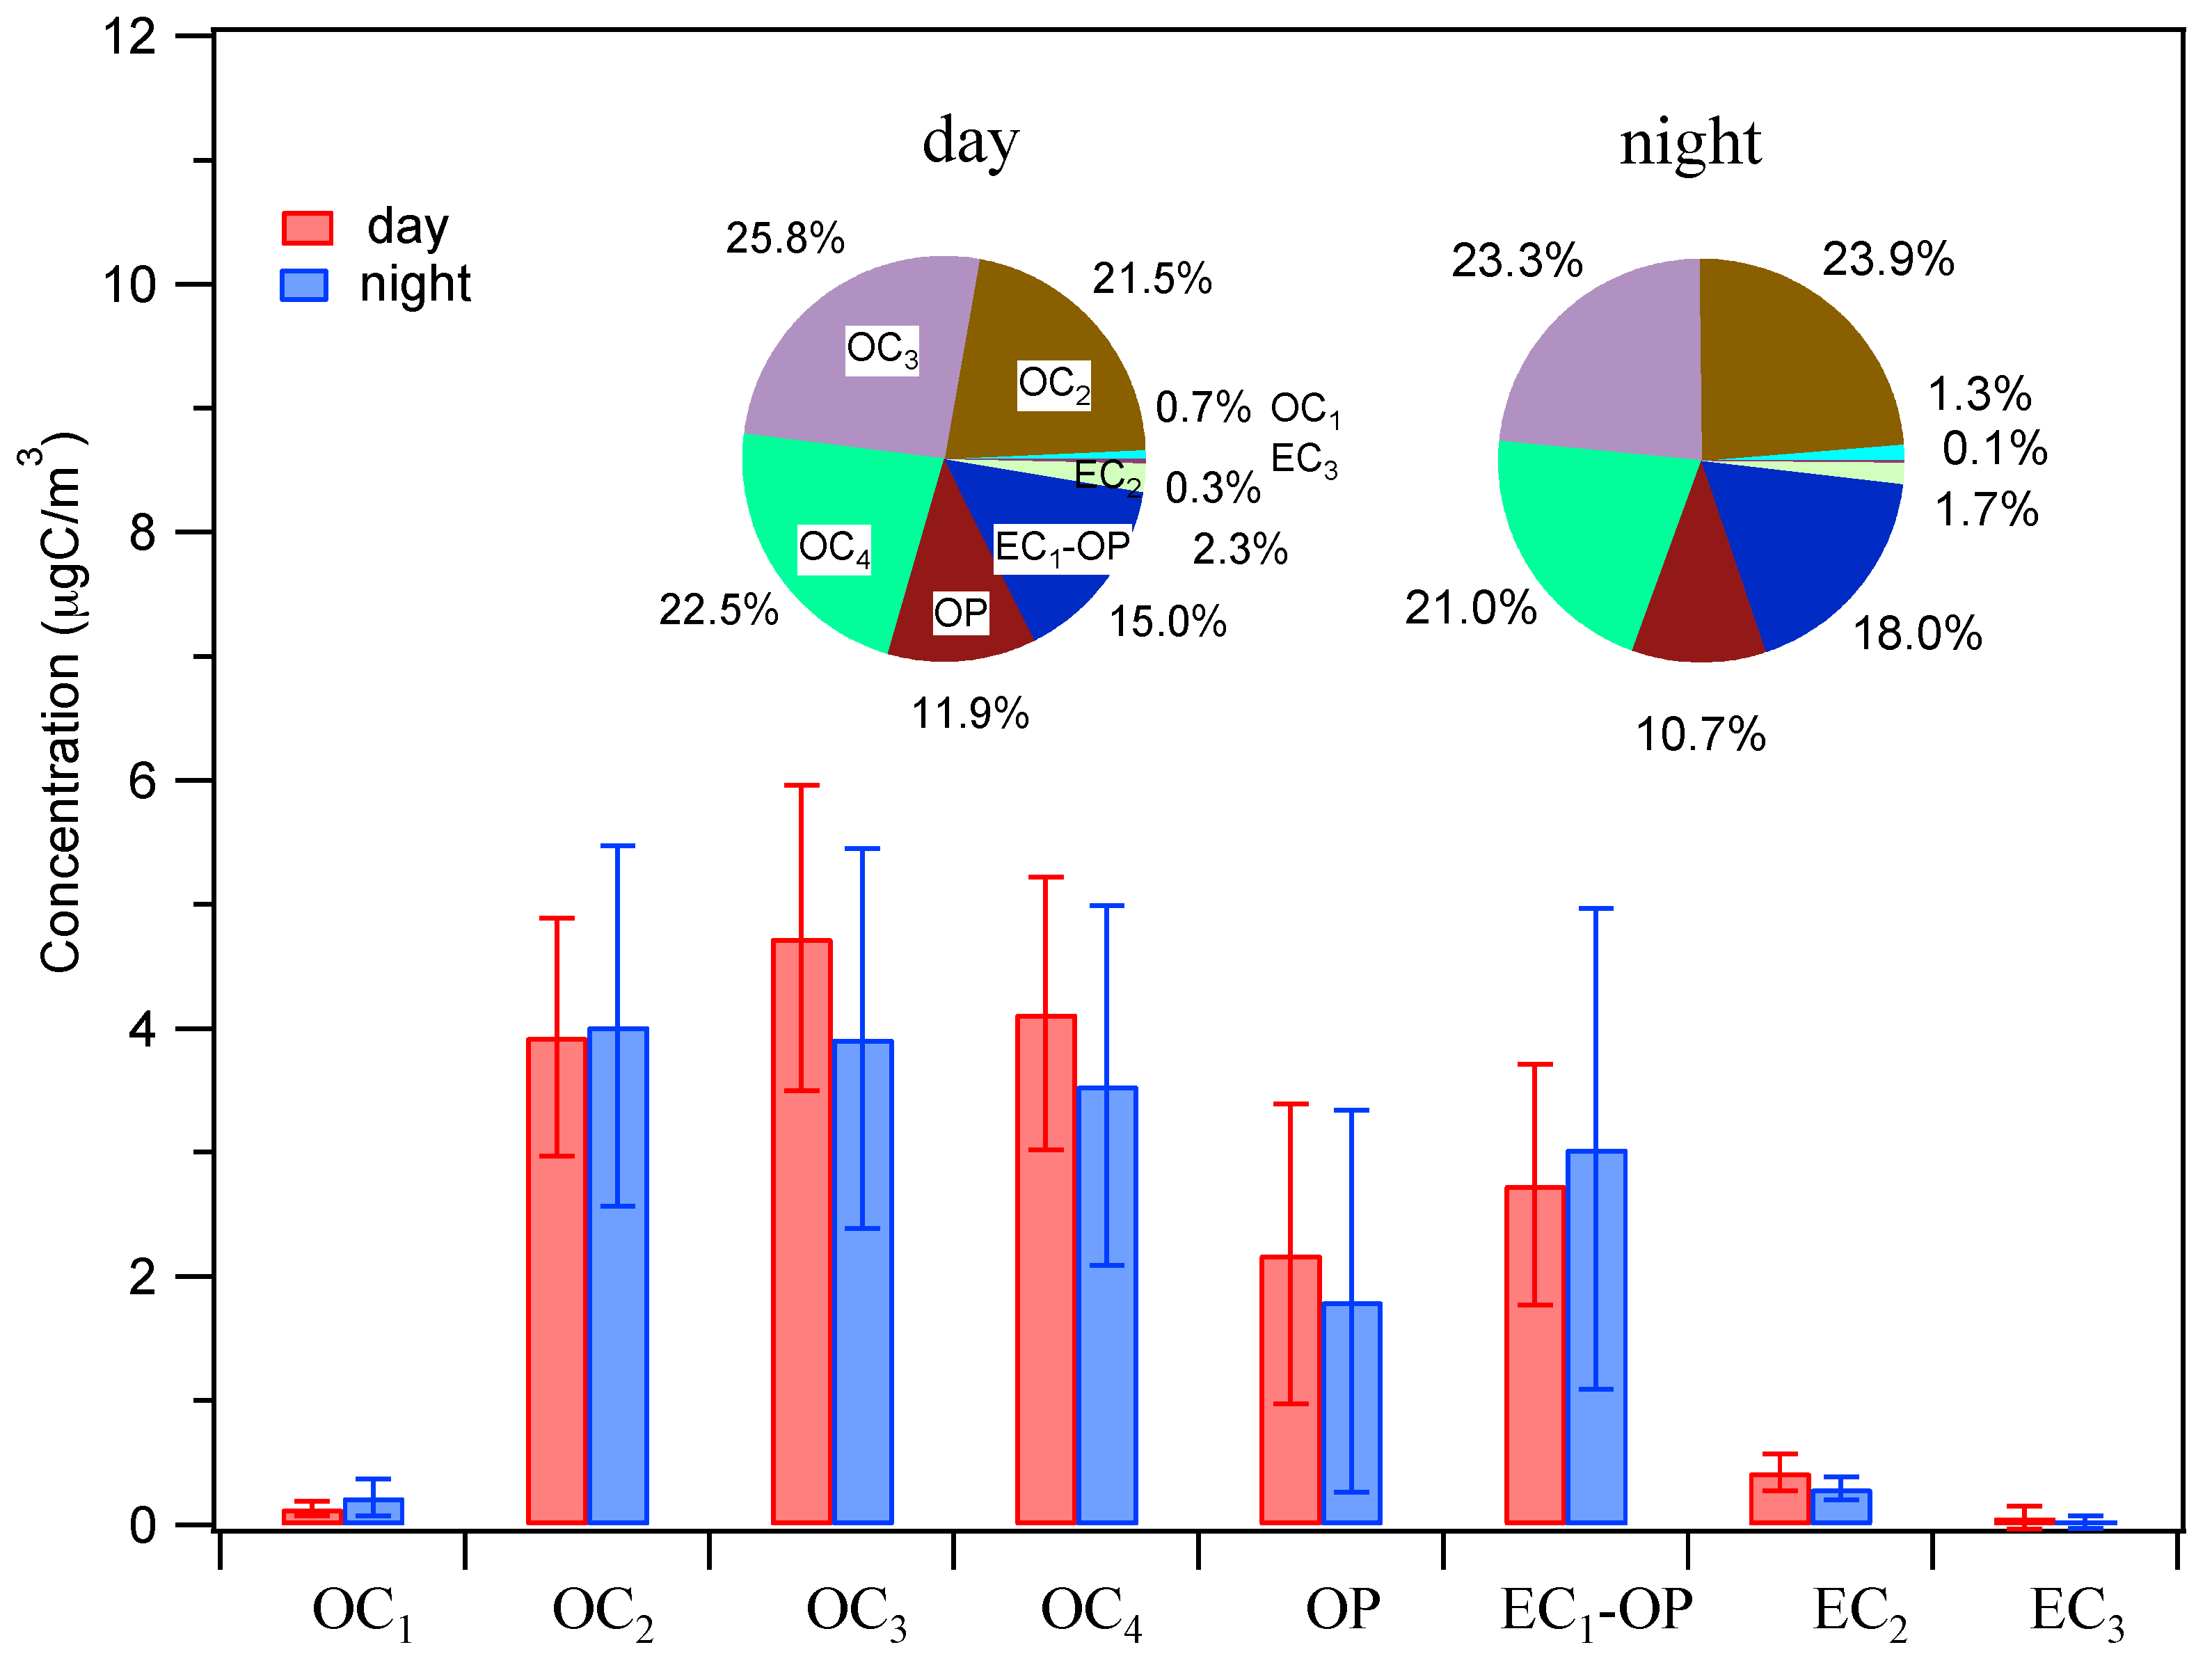
3.2.2. Characteristics of OC and EC

Figure 3 presents concentrations of eight fractions of carbon (i.e., OC1 to OC4, OP and EC1 to EC3) and their average contributions to the total carbon mass (OC + EC), which can reflect the different features of OA [40]. In this study, OC1 concentration only accounted for about 1% of total carbon, which was very low compared with other OC types. Since OC1 and OC2 evaporate at a temperature of less than 280 °C, they are usually treated as volatile and semi-volatile. The fractions of OC1 + OC2 in OC are 22.2% and 25.2% for day and night samples, respectively, indicating low mass percentages of volatile and semi-volatile species in summer OA. On the other hand, OC3 + OC4 accounts for near half of the total carbon mass, indicating a large fraction of organic compounds with large molecular weights and low volatility [41]. OP accounts for ~11%, further supporting that partial low-volatility species exist in OC. Recently, a combination of the OC/EC results with those of high resolution mass spectrometry data has shown to be useful to identify the sources of OA [41], which will be the subject of our future work.
Overall, the average mass contributions of eight carbon fractions, however, are similar in day and night samples. This is likely due to the complex combined effects from mixed contributions from different sources, secondary oxidation processes, and the meteorological conditions (boundary layer height, wind speed, and direction, etc., which can affect the dispersion of aerosols).

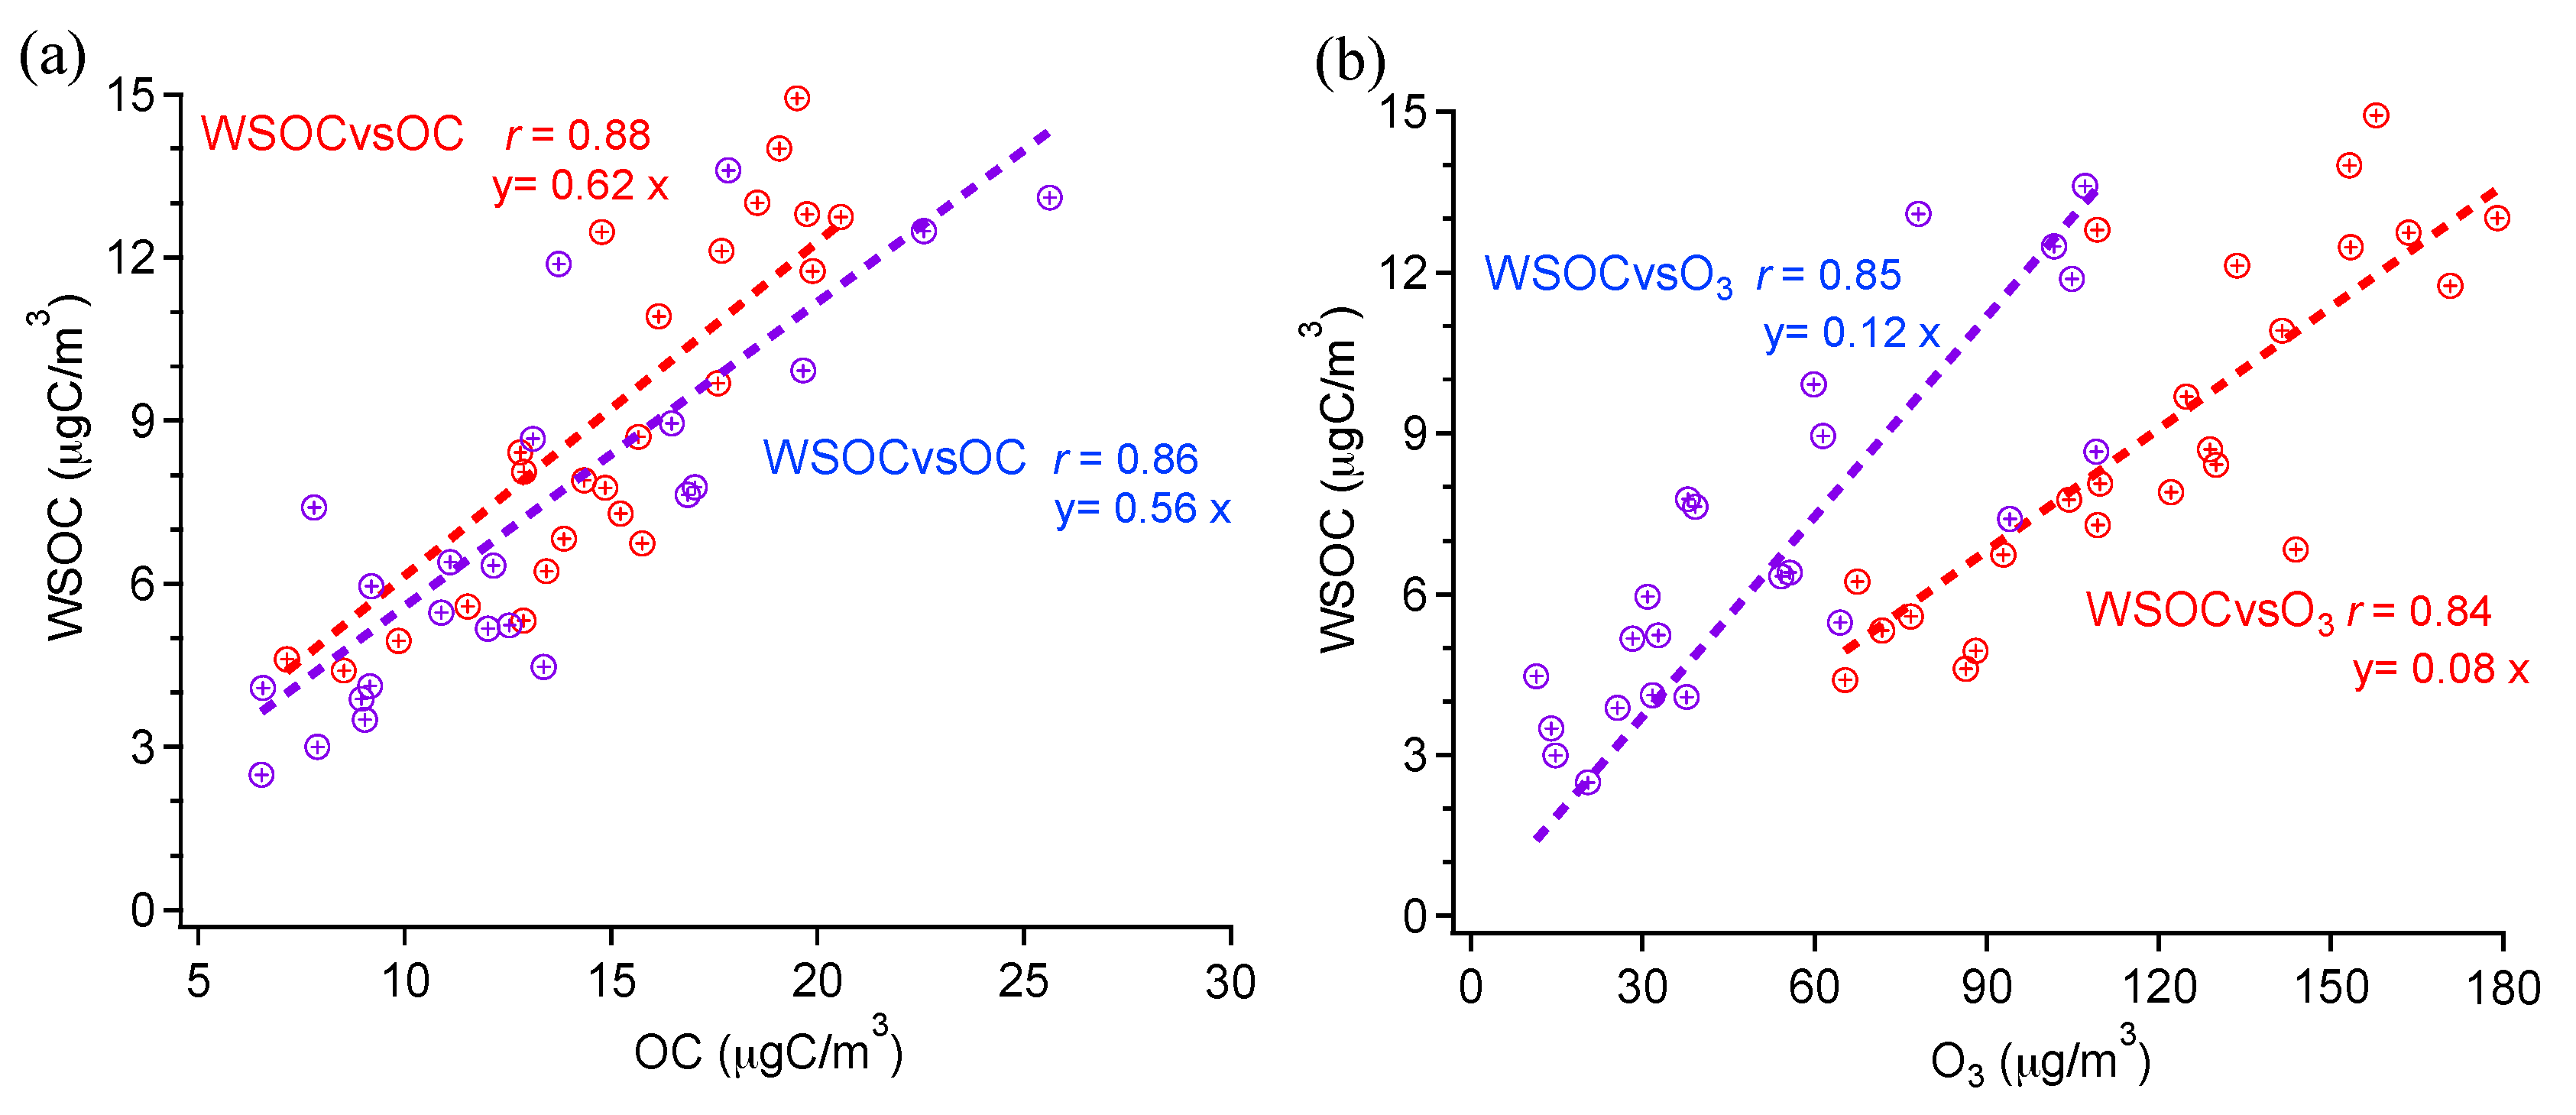
3.2.3. WSOC versus OC and O3

The WSOC concentration and WSOC/OC ratios can be used to infer SOA formation and significance. As shown in Figure 4a, good correlation is found between WSOC and OC whether in day or night. WSOC has good correlations with O3 in both day and night too (Figure 4b). It is well known that in summer, the SOA formation during daytime can be attributed to the photochemical reactions under solar irradiation [42], which can be also inferred from the good correlation of OC with O3 in Figure 2d. The WSOC/OC ratios are only slightly lower than those during daytime. On one hand, this result may indicate that the residual SOA formed during daytime survives in night. But on the other hand, we cannot exclude the SOA formed during night as well. In fact, SOA formation under dark conditions via nitrate radical (NO3) oxidation reactions is also possible and efficient [43,44]. Further investigations should be done in the future.
Indeed, NO3 radical is the most important atmospheric oxidant in night, which can contribute to both nitrate and SOA formations, as follows:
NO2 + O3 → NO3 + O2
NO3 + NO2 → N2O5
N2O5 →NO3 + NO2
N2O5 + H2O → 2HNO3
NO3 + H2O → HNO3 + OH
HNO3 + NH3 → NH4NO3
NO3 + VOCs → SOA
In night, gaseous NO2 can react with O3 to form NO3 radical, which further reacts with NO2 to form N2O5. Since N2O5 and NO3 radical are both very soluble and can react quickly with H2O to form nitric acid (HNO3) (Equations (6) and (7)), it may contribute to the enhanced nitrate concentration we observed in night due to higher RH. NO3 radical (Reaction 9) can also react with VOCs to form SOA [45]. It is very likely that both dark (in night) and photochemical reactions (day) can lead to secondary aerosol formation

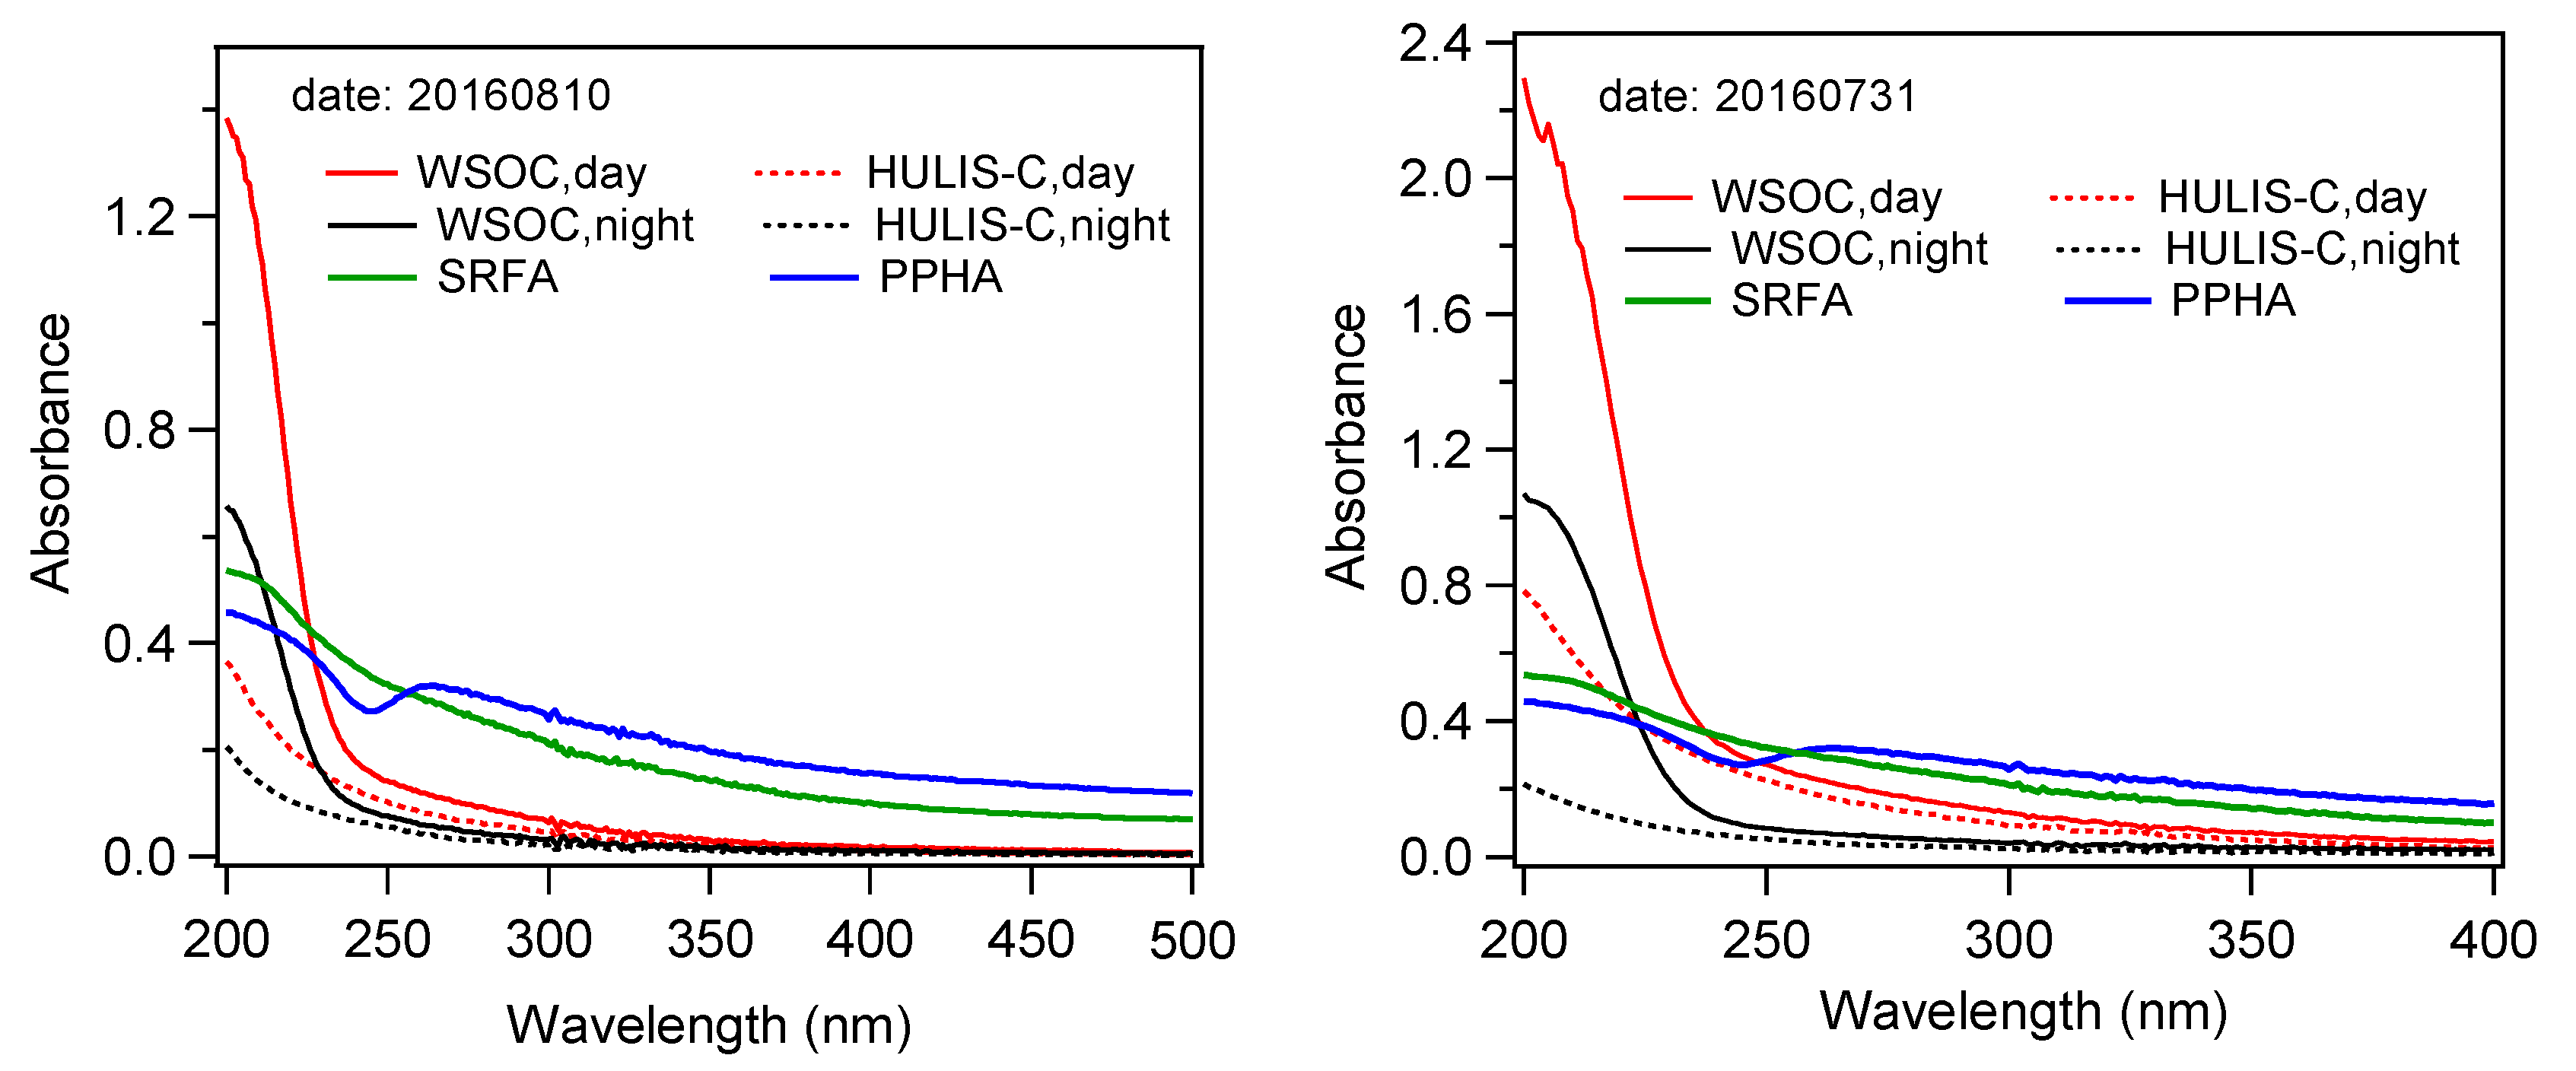
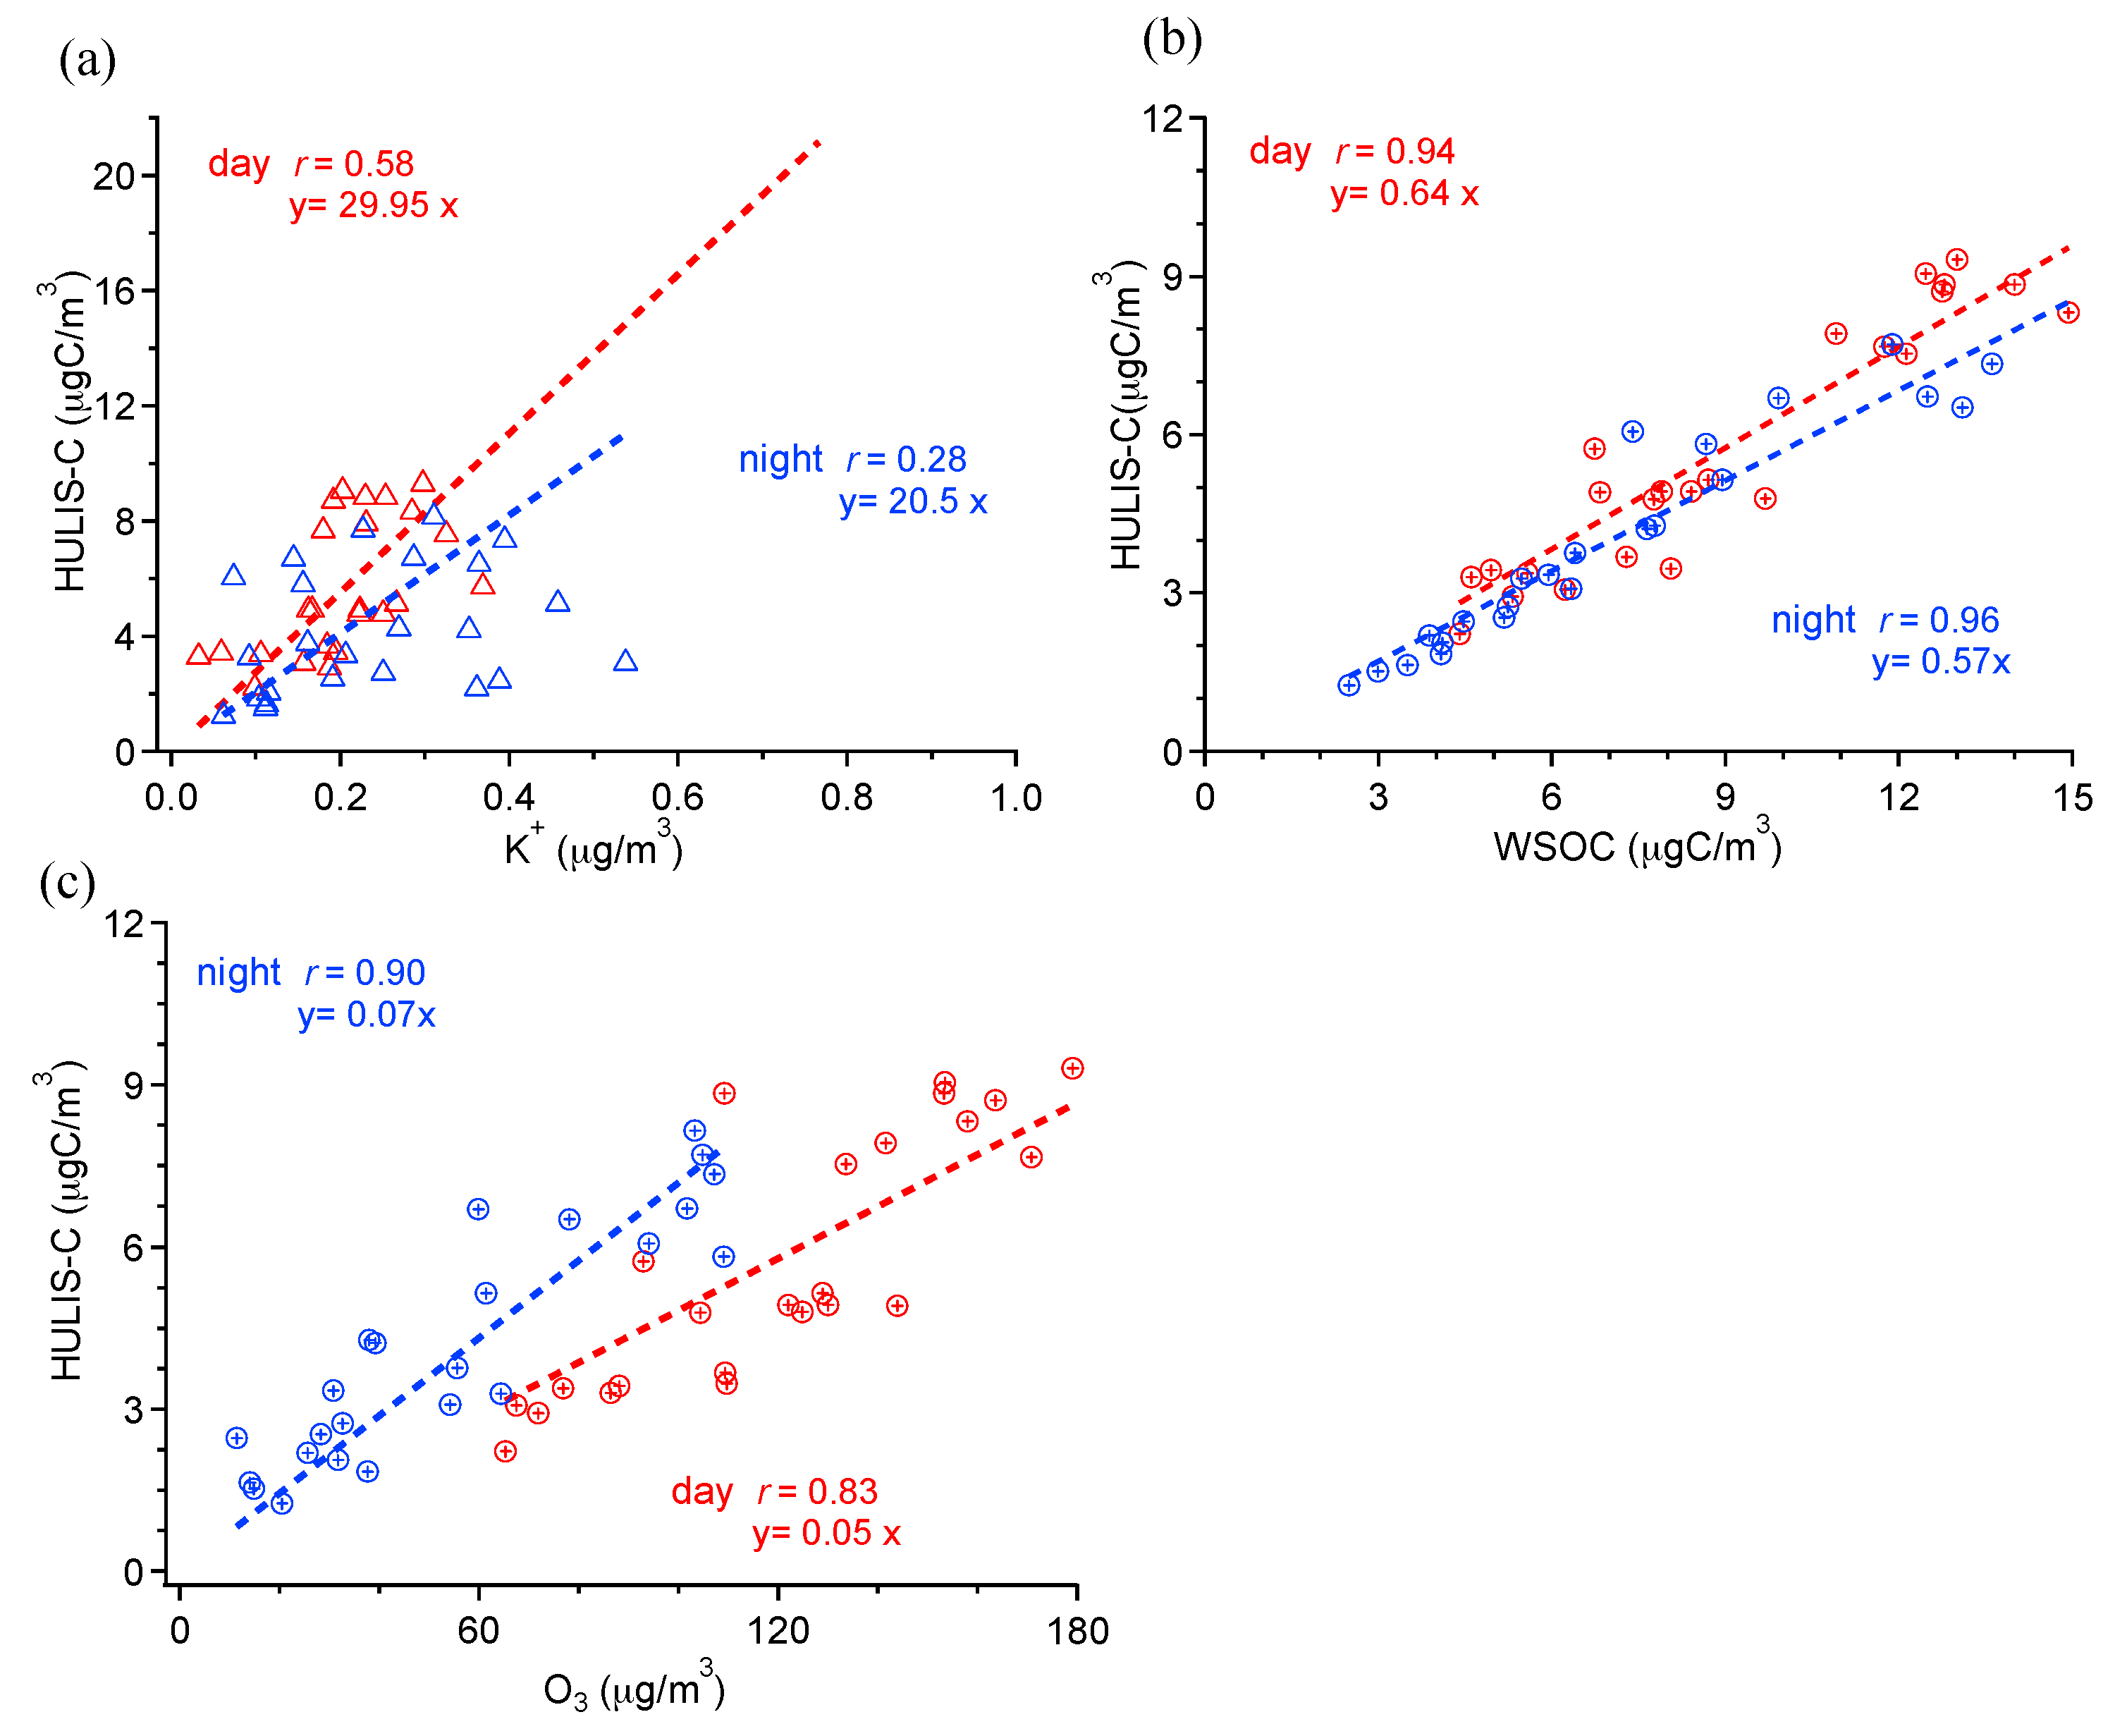
3.3. HULIS-C and Its Relationships with WSOC, K+, and O3

Sources and processes leading to formation of HULIS are diverse, including primary sources (marine emission, vehicle exhaust, biomass burning) and secondary sources (oxidation of soot, aqueous reaction in cloud droplet, and formation of SOA). It has been suggested [46] that a major amount of HULIS compounds can associate with biomass burning emissions. Here, the correlation between HULIS-C and the biomass burning emission marker (K+ ion) is shown in Figure 5a. The correlations between HULIS-C and K+ are not strong in day and night (day: r = 0.58, night: r = 0.28), indicating that biomass burning emission is not a dominant HULIS source. Correlations between HULIS-C and EC, and HULIS-C and PAHs (Table 2) are also poor in both daytime and nighttime samples, indicating that fossil fuel combustion is not an influential source of HULIS in summer either, consistent with results in summer Marseilles [19]. On the other hand, one can find strong positive correlations between HULIS-C and WSOC (day: r = 0.94; night: r = 0.96), and HULIS-C with O3 (day: r = 0.83; night: r = 0.90) (Table 2). It is therefore reasonable to infer that HULIS-C, similar to WSOC, closely links with secondary formation. Also, it is also possible that the HULIS is formed secondarily from oxidation of primary emissions (both biomass burning and fossil fuel combustion emissions can be precursors). Recently, Lin et al. [47,48] reported a linear relationship between HULIS-C and WSOC, and also suggested that the increases are caused by the secondary chemical processes. The dominant role of photochemical production of HULIS-C is also found in Shanghai during summer [49]. Kuang et al. [50] show that the secondary formation processes contribute 49–82% of ambient HULIS. Additionally, linear regression slopes in Figure 5b show that HULIS-C/WSOC ratio (0.64) in daytime was slighter higher that in nighttime (0.57), suggesting that the contribution of photochemical production of HULIS-C in day might be more significant than that during night. The HULIS-C/WSOC ratio in this study is comparable to that observed in Shanghai (0.6) [16] and Hongkong (0.57) [50], but higher than that in Lanzhou (0.46) [51].
Here, we show the UV-Vis absorption spectra of HULIS-C and WSOC by using the samples collected on 31 July and 10 August 2016 in Figure 6. Note these two samples have high and low PM2.5 mass loadings, respectively, and the shapes of their UV-Vis spectra are also representative of the average pattern of all samples. For comparison, the UV-Vis spectra of standard SRFA and PPHA are also presented in Figure 6. Generally, the absorbance of both HULIS-C and WSOC increases with the decreasing wavelength in the range of 200–500 nm, but the WSOC absorbs relatively more light compared to that of HULIS-C at the same wavelength. Compared with the two standard humic substances, the UV-Vis characteristics of both HULIS-C and WSOC are significantly different, with higher absorbance at 365 nm for the latter, indicating they contain different compounds. Such differences are closely relevant with different oxidation reactions of different precursors. For example, our UV-Vis spectra are qualitatively similar to those of pure guaiacol and catechol, but different from those from the guaiacol and catechol-derived SOA [52].
To further investigate the chemical properties of WSOC and HULIS, the E250/E365 ratios are calculated and shown in Figure 7. As suggested by previous studies [34,53], a low E250/E365 ratio indicates the sample contains more aromatic or large molecules. The average E250/E365 values for HULIS-C and WSOC are 7.0 and 5.7 during daytime, and 7.9 and 6.3 during nighttime. Therefore, a slightly smaller E250/E365 ratio in day reveals that the daytime samples include more highly UV absorbing aromatic molecules. The average E250/E365 ratio (either in day and night) of HULIS in our sample is higher than the average value of 5.9 for the HULIS determined in PM2.5 collected in 2010 in Guangzhou [34]. As that study used the same method as us to isolate the HULIS fraction, this difference demonstrates the different chemical characteristics of HULIS in aerosols under different environments [34]. In addition, larger E250/E365 ratio for HULIS fraction than that of WSOC indicates that the HULIS fraction concentrates more aliphatic/less aromatic structures. This finding is opposite to the results from Duarte et al. [53] who found that HULIS had lower E250/E365 ratios than WSOC.

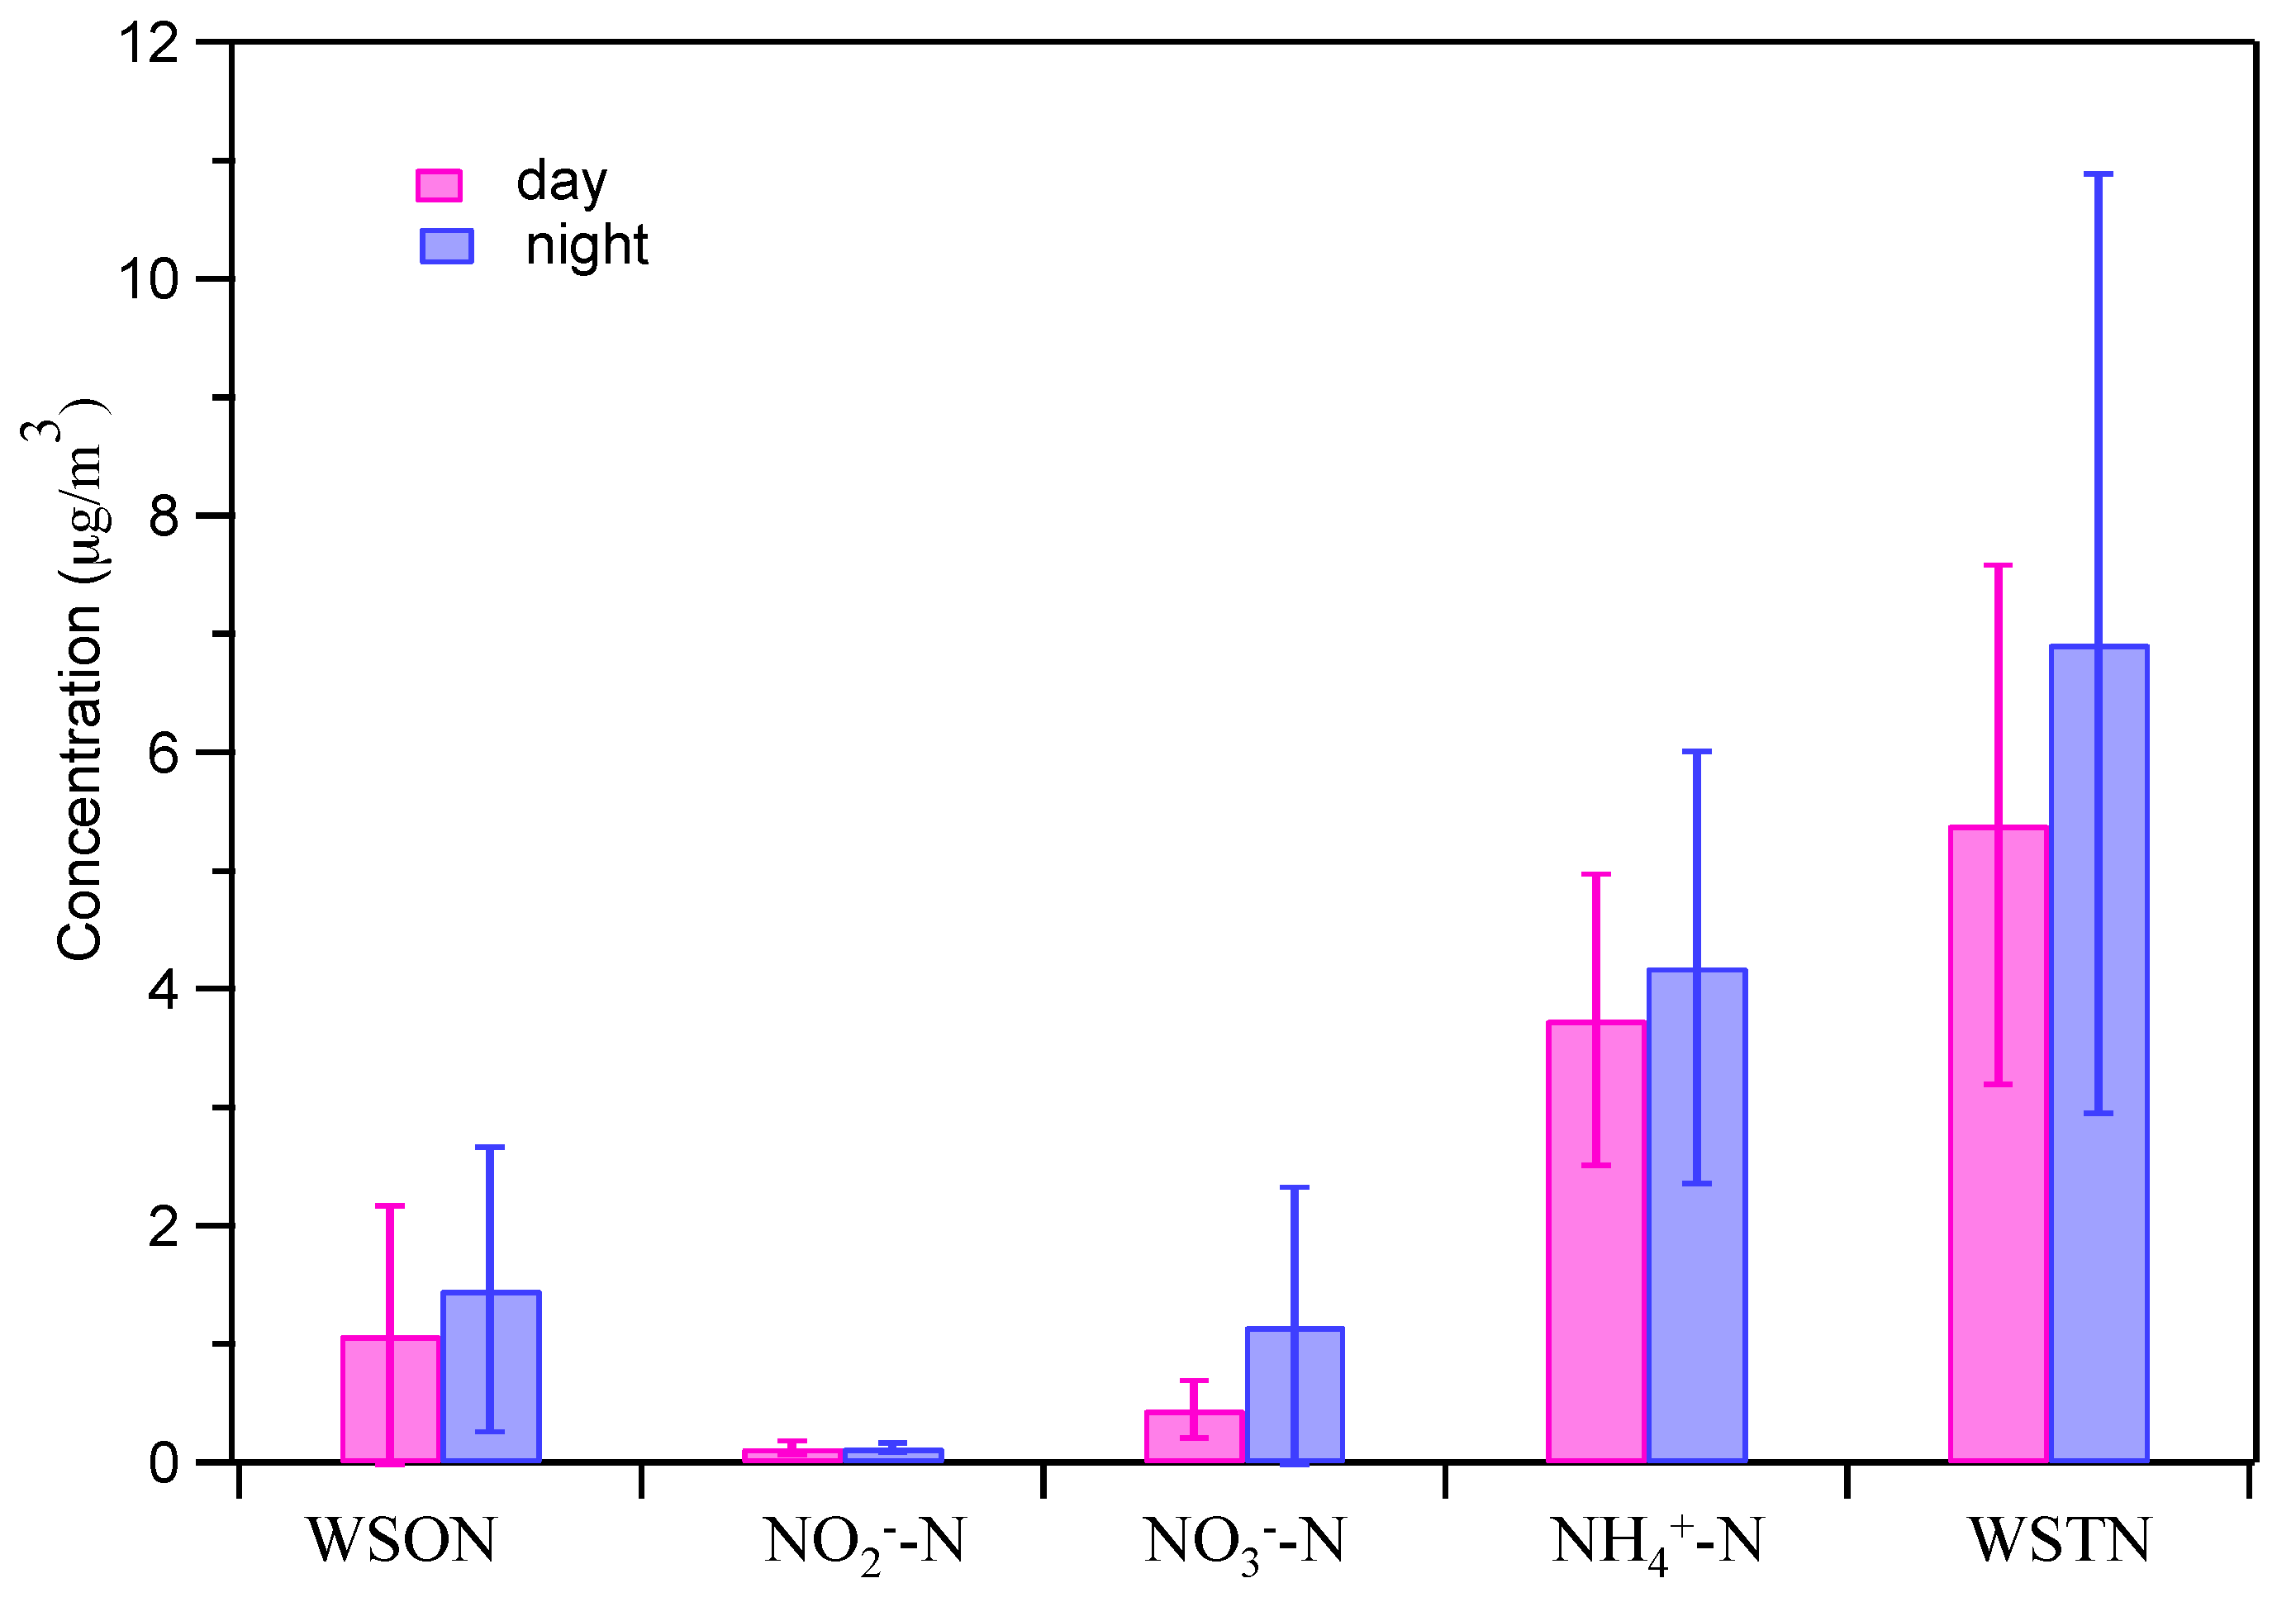
3.4. Determination and Sources of WSON and WSTN

As discussed in earlier studies [23,54], the determination of WSON concentrations by subtracting WSIN from WSTN in some cases yields negative values due to measurement uncertainties and aggregation of errors. During this study, only one negative WSON concentration (31 July) is found and we set it as zero according to the suggestion of Mace et al. [55]. Figure 8 shows the day/night results of N-containing components. Averaged mass concentrations of WSON, NO2-N, NO3-N, NH4+-N, and WSTN are 1.08, 0.12, 0.45, 3.74, 5.39 µg/m3 in daytime samples, and 1.47, 0.12, 1.15, 4.18, 6.92 µg/m3 in nighttime samples, respectively. The mean WSON concentration is higher during nighttime. Our results are similar to those measured over southeastern USA in summer [26]. This is likely due to the unique WSON produced under nighttime dark conditions; for example, previous studies have shown the formation of N-containing oligomers in aqueous droplets [56,57]. The WSTN concentrations are similar to those measured in Beijing spring PM2.5 (0.9–6.7 µg/m3) [58]. Accordingly, WSON on average contributes 16.3% and 17.8% of WSTN mass in day and night (Table 1). The WSON/WSTN ratios in this study are somewhat similar to results at an urban site in Kofu, Japan (16.2%) [27] and in fog water samples collected in Fresno, USA (10–17%) [59]. Differently, the contribution of WSON to WTON was much smaller than results observed by Ho et al. [60] for sampling in summer in downtown background in Xi’an, China, with an average WSON/WTON ratio of 45%. The results demonstrate the large variability of WSON, dependent on source, time, and space.
In order to further probe the source of N-species, we need to investigate its correlations with other species. As shown in Table 2, WSON has good correlation with NH4+ in both day and night, especially in night (r = 0.95); it moderately correlates with SO42− (r = 0.70 in day and r = 0.69 in night), and correlates poorly with NO3 in day (r = −0.06) but more tightly in night (r = 0.76). WSON also positively correlates with WSOC (r = 0.68 in day and r = 0.69 in night). These results all suggest that the WSON has significant contribution from secondary production too. The atmospheric reactions of NOx and VOCs would produce secondary organic nitrogen compounds, such as alkyl nitrates and amino compounds, which would form secondary organonitrate aerosols via gas-to-particle conversions during day and night. Matsumoto et al. [27] also suggest that fine-mode WSON is mainly derived from secondary oxidation of corresponding precursor gases. Research in Xi’an [60] suggests that secondary sources and biomass burning can be the major factors influencing the levels of WSON. While in this study, the positive correlation between WSON and HULIS-C (day: r = 0.66, night: r = 0.61), and weak correlation between WSON and K+ ions (day: r = 0.35, night: r = 0.46) imply that biomass burning is not a major source of WSON.

3.5. PAHs Compounds

The mean total PAH concentrations (ΣPAHs) in PM2.5 are listed in Table 1, and concentrations of individual PAH compounds and their night-to-day mass ratios are also examined and listed in Table 3. Overall, the summer PAHs levels are much lower than those measured during spring and winter in Changzhou [31], probably due to the significantly reduced fossil fuel combustion activities during summer and enhanced partitioning of some PAH species into gas phase owing to warmer temperatures. Table 3 shows that the nighttime ΣPAHs concentrations are higher (3.64 ng/m3 vs. 2.34 ng/m3) than those during daytime. This day-night difference is similar to that found in Xiamen [61] but opposite to that from Sarajevo (day/night = 1.45) [62]. Specifically, high molecular weight PAHs (5–6 rings) exhibit remarkably higher loadings during nighttime (average night/day ratio of 2.20), while the day-night differences are insignificant for low molecular weight PAHs (2–3 rings) (average night/day ratio of 0.99) and medium molecular weight PAHs (4-rings) (average night/day ratio of 1.21). Such behaviors may link with the volatility of different PAHs, as the lighter PAHs (LMW/MMW-PAHs) can exist in both vapor and particulate phases while the heavier PAHs (≥5-rings) are mainly particle-bound [63]. Warmer temperatures during daytime may enhance the evaporation of lighter PAHs but not heavier PAHs. Overall, the amount of total PAHs in PM2.5 is very low during the sampling period compared with those during spring and winter at the same site [31]. Future studies are still needed to elucidate the low PAHs levels in details.
Total PAHs exhibits good correlations with EC and K+, but weak or negative correlations with WSOC, HULIS-C, and O3 (Table 2), suggesting that PAHs are linked to primary sources such as vehicle exhaust and biomass burning.

4. Conclusions

In this study, we conducted a comprehensive day-night comparison regarding various components in the PM2.5 samples collected in summer at an urban site in Changzhou, China. Our results show slightly high levels of PM2.5, WSOC, HULIS-C, SO42, and NH4+ concentrations in the day, while concentrations of PAHs, EC, and WSON are higher in the night. Nitrate concentration is significantly low in the day as it is easy to evaporate at warm temperatures. WSOC contributes, on average, ~60% of the OC mass, and it has particularly good correlations with O3 in day, implying the significant role of secondary photochemical production. Meanwhile the WSOC/OC ratios are only slightly lower in the night, indicating the secondary organic aerosol (SOA) formation likely occurs during nighttime as well.
HULIS-C contributes ~60% of WSOC mass. Very good relationships between HULIS-C and WSOC (day: r = 0.94, night: r = 0.96), HULIS-C and O3 (day: r = 0.83; night: r = 0.90) are found, clearly demonstrating the dominant role of the secondary origin of HULIS-C. On the contrary, correlations between HULIS-C and EC, PAHs, and K+, both in day and night, are weak, indicating that primary sources, e.g., fossil fuel combustion and biomass burning, are not major sources of HULIS in summer. Optical properties (E250/E365 ratios) of HULIS indicate that HULIS contains more aliphatic/less aromatic structures than the WSOC in summer. WSON accounts for approximately 17% (daily average) of the WSTN, and correlation analysis shows that it might be dominated by secondary formation as well. However, different from the behaviors of WSOC, it seems like the nighttime formation processes under dark conditions can contribute remarkably to the WSON. PAHs concentrations are very low in summer, and they are emitted by dominant primary sources (e.g., vehicle emissions, biomass burning) based on good relations with EC and K+ ion and weak correlations with WSOC, HULIS-C, and O3.
Our results, overall, reveal that the secondary formation is a significant contributor to PM2.5 and its major components such as HULIS, WSON, and WSOC. More sample analysis and seasonal variation should be done to look into the new insights of day-night variation. Future investigations should focus on elucidating the details of precursors and products, the reaction mechanism, and the contribution of different sources in both the day and the night, so as to effectively reduce the fine aerosols and/or ozone pollution in Changzhou, China.

Acknowledgments

This work was supported by the Natural Science Foundation of China (Grant Nos. 91544220 and 21577065), the Jiangsu National Science Foundation (BK20150042), the Specially-Appointed Professors Foundation, the Major Research Development Program of Jiangsu Province (BE2016657 and BY2016030-15), and the Postgraduate Research & Practice Innovation Program of Jiangsu Province (SJLX16_0666, SJCX17_0769, SJCX17_0768).

Author Contributions

Zhaolian Ye and Xinlei Ge conceived the idea and wrote the manuscript; Shuaishuai Ma performed graphic processing. Quanfa Zhou provided valuable comments and suggestions for the modification of the manuscript. Qing Li, Yuan Gu, Yalan Su, Yanfang Chen, Hui Chen, and Junfeng Wang contributed to the experimental and data analyses.

Conflicts of Interest

The authors declare no conflict of interest. The funding agencies had no role in the design of the study, in the collection, analyses, or interpretation of data, in the writing of the manuscript, and in the decision to publish the results.

References

  1. Sosa, B.S.; Porta, A.; Colman Lerner, J.E.; Banda Noriega, R.; Massolo, L. Human health risk due to variations in PM10–PM2.5 and associated PAHs levels. Atmos. Environ. 2017, 160, 27–35. [Google Scholar] [CrossRef]
  2. Cao, J.J.; Xu, H.M.; Xu, Q.; Chen, B.H.; Kan, H.D. Fine particulate matter constituents and cardiopulmonary mortality in a heavily polluted chinese city. Environ. Health Perspect. 2012, 120, 373–378. [Google Scholar] [CrossRef] [PubMed]
  3. Zhang, Q.; Jimenez, J.L.; Canagaratna, M.R.; Allan, J.D.; Coe, H.; Ulbrich, I.; Alfarra, M.R.; Takami, A.; Middlebrook, A.M.; Sun, Y.L. Ubiquity and dominance of oxygenated species in organic aerosols in anthropogenically-influenced northern hemisphere midlatitudes. Geophys. Res. Lett. 2007, 34, L13801. [Google Scholar] [CrossRef]
  4. Sun, Y.L.; Zhang, Q.; Zheng, M.; Ding, X.; Edgerton, E.S.; Wang, X. Characterization and source apportionment of water-soluble organic matter in atmospheric fine particles (PM2.5) with high-resolution aerosol mass spectrometry and GC–MS. Environ. Sci. Technol. 2011, 45, 4854–4861. [Google Scholar] [CrossRef] [PubMed]
  5. Wang, J.; Ge, X.; Chen, Y.; Shen, Y.; Zhang, Q.; Sun, Y.; Xu, J.; Ge, S.; Yu, H.; Chen, M. Highly time-resolved urban aerosol characteristics during springtime in Yangtze River Delta, China: Insights from soot particle aerosol mass spectrometry. Atmos. Chem. Phys. 2016, 16, 9109–9127. [Google Scholar] [CrossRef]
  6. Wang, J.; Onasch, T.B.; Ge, X.; Collier, S.; Zhang, Q.; Sun, Y.; Yu, H.; Chen, M.; Prévôt, A.S.H.; Worsnop, D.R. Observation of fullerene soot in eastern China. Environ. Sci. Technol. Lett. 2016, 3, 121–126. [Google Scholar] [CrossRef]
  7. Shen, R.; Schäfer, K.; Schnelle-Kreis, J.; Shao, L.; Norra, S.; Kramar, U.; Michalke, B.; Abbaszade, G.; Streibel, T.; Fricker, M.; et al. Characteristics and sources of PM in seasonal perspective—A case study from one year continuously sampling in Beijing. Atmos. Pollut. Res. 2016, 7, 235–248. [Google Scholar] [CrossRef]
  8. Galindo, N.; Yubero, E. Day-night variability of water-soluble ions in PM10 samples collected at a traffic site in southeastern Spain. Environ. Sci. Pollut. Res. 2017, 24, 805–812. [Google Scholar] [CrossRef] [PubMed]
  9. Zhao, X.; Shi, H.; Yu, H.; Yang, P. Inversion of nighttime PM2.5 mass concentration in Beijing based on the VIIRS day-night band. Atmosphere 2016, 7, 136. [Google Scholar] [CrossRef]
  10. Wang, H.; Shooter, D. Coarse-fine and day-night differences of water-soluble ions in Christchurch and Auckland, New Zealand. Atmos. Environ. 2002, 36, 3519–3529. [Google Scholar] [CrossRef]
  11. Shen, Z.; Cao, J.; Zhang, L.; Liu, L.; Zhang, Q.; Li, J.; Han, Y.; Zhu, C.; Zhao, Z.; Liu, S. Day-night differences and seasonal variations of chemical species in PM10 over Xi’an, Northwest China. Environ. Sci. Pollut. Res. 2014, 21, 3697–3705. [Google Scholar] [CrossRef] [PubMed]
  12. Chan, K.L.; Wang, S.; Liu, C.; Zhou, B.; Wenig, M.O.; Saiz-Lopez, A. On the summertime air quality and related photochemical processes in the megacity Shanghai, China. Sci. Total Environ. 2017, 580, 974–983. [Google Scholar] [CrossRef] [PubMed]
  13. Kristensen, T.B.; Du, L.; Nguyen, Q.T.; Nøjgaard, J.K.; Koch, C.B.; Nielsen, O.F.; Hallar, A.G.; Lowenthal, D.H.; Nekat, B.; Pinxteren, D. Chemical properties of HULIS from three different environments. J. Atmos. Chem. 2015, 72, 65–80. [Google Scholar] [CrossRef]
  14. Zheng, G.; He, K.; Duan, F.; Cheng, Y.; Ma, Y. Measurement of humic-like substances in aerosols: A review. Environ. Pollut. 2013, 181, 301–314. [Google Scholar] [CrossRef] [PubMed]
  15. Vione, D.; Maurino, V.; Minero, C. Photosensitised humic-like substances (HULIS) formation processes of atmospheric significance: A review. Environ. Sci. Pollut. Res. 2014, 21, 11614–11622. [Google Scholar] [CrossRef] [PubMed]
  16. Qiao, T.; Zhao, M.; Xiu, G.; Yu, J. Seasonal variations of water soluble composition (WSOC, Hulis and WSIIs) in PM1 and its implications on haze pollution in urban Shanghai, China. Atmos. Environ. 2015, 123, 306–314. [Google Scholar] [CrossRef]
  17. Graber, R.; Rudich, Y. Atmospheric HULIS: How humic-like are they? A comprehensive and critical review. Atmos. Chem. Phys. 2006, 6, 729–753. [Google Scholar] [CrossRef]
  18. Hawkins, L.N.; Lemire, A.N.; Galloway, M.M.; Corrigan, A.L.; Turley, J.J.; Espelien, B.M.; De Haan, D.O. Maillard chemistry in clouds and aqueous aerosol as a source of atmospheric humic-like substances. Environ. Sci. Technol. 2016, 50, 7443–7452. [Google Scholar] [CrossRef] [PubMed]
  19. Baduel, C.; Voisin, D.; Jaffrezo, J.L. Seasonal variations of concentrations and optical properties of water soluble HULIS collected in urban environments. Atmos. Chem. Phys. 2010, 10, 4085–4095. [Google Scholar] [CrossRef] [Green Version]
  20. Lee, J.Y.; Jung, C.H.; Kim, Y.P. Estimation of optical properties for HULIS aerosols at Anmyeon Island, Korea. Atmosphere 2017, 8, 120. [Google Scholar] [CrossRef]
  21. Baduel, C.; Voisin, D.; Jaffrezo, J.L. Comparison of analytical methods for humic like substances (HULIS) measurements in atmospheric particles. Atmos. Chem. Phys. 2009, 9, 5949–5962. [Google Scholar] [CrossRef] [Green Version]
  22. Fan, X.J.; Song, J.Z.; Peng, P.A. Comparison of isolation and quantification methods to measure humic-like substances (HULIS) in atmospheric particles. Atmos. Environ. 2012, 60, 366–374. [Google Scholar] [CrossRef]
  23. Cape, J.N.; Cornell, S.E.; Jickells, T.D.; Nemitz, E. Organic nitrogen in the atmosphere—Where does it come from? A review of sources and methods. Atmos. Res. 2011, 102, 30–48. [Google Scholar] [CrossRef]
  24. Ge, X.; Wexler, A.S.; Clegg, S.L. Atmospheric amines—Part I. A review. Atmos. Environ. 2011, 45, 524–546. [Google Scholar] [CrossRef]
  25. Ge, X.; Wexler, A.S.; Clegg, S.L. Atmospheric amines—Part II. Thermodynamic properties and gas/particle partitioning. Atmos. Environ. 2011, 45, 561–577. [Google Scholar] [CrossRef]
  26. Rastogi, N.; Zhang, X.L.; Edgerton, E.S.; Ingall, E.; Weber, R.J. Filterable water-soluble organic nitrogen in fine particles over the southeastern USA during summer. Atmos. Environ. 2011, 45, 6040–6047. [Google Scholar] [CrossRef]
  27. Matsumoto, K.; Yamamoto, Y.; Kobayashi, H.; Kaneyasu, N.; Nakano, T. Water-soluble organic nitrogen in the ambient aerosols and its contribution to the dry deposition of fixed nitrogen species in Japan. Atmos. Environ. 2014, 95, 334–343. [Google Scholar] [CrossRef]
  28. Claeys, M.; Vermeylen, R.; Yasmeen, F.; Gómez-González, Y.; Chi, X.; Maenhaut, W.; Mészáros, T.; Salma, I. Chemical characterisation of humic-like substances from urban, rural and tropical biomass burning environments using liquid chromatography with UV/vis photodiode array detection and electrospray ionisation mass spectrometry. Environ. Chem. 2012, 9, 273–284. [Google Scholar] [CrossRef] [Green Version]
  29. Ye, Z.; Liu, J.; Gu, A.; Feng, F.; Liu, Y.; Bi, C.; Xu, J.; Li, L.; Chen, H.; Chen, Y. Chemical characterization of fine particulate matter in Changzhou, China, and source apportionment with offline aerosol mass spectrometry. Atmos. Chem. Phys. 2017, 17, 2573–2592. [Google Scholar] [CrossRef]
  30. Cheng, Y.; He, K.B.; Duan, F.K.; Zheng, M.; Ma, Y.L.; Tan, J.H. Positive sampling artifact of carbonaceous aerosols and its influence on the thermal-optical split of OC/EC. Atmos. Chem. Phys. 2009, 9, 7243–7256. [Google Scholar] [CrossRef]
  31. Ye, Z.; Li, Q.; Liu, J.; Luo, S.; Zhou, Q.; Bi, C.; Ma, S.; Chen, Y.; Chen, H.; Li, L. Investigation of submicron aerosol characteristics in Changzhou, China: Composition, source, and comparison with co-collected PM2.5. Chemosphere 2017, 183, 176–185. [Google Scholar] [CrossRef] [PubMed]
  32. Chow, J.C.; Watson, J.G.; Chenc, L.W.A.; Arnott, W.P.; Moosmüller, H.; Fung, K. Equivalence of elemental carbon by thermal/optical reflectance and transmittance with different temperature protocols. Environ. Sci. Technol. 2004, 38, 4414–4422. [Google Scholar] [CrossRef] [PubMed]
  33. Ge, X.; Li, L.; Chen, Y.; Chen, H.; Wu, D.; Wang, J.; Xie, X.; Ge, S.; Ye, Z.; Xu, J. Aerosol characteristics and sources in Yangzhou, China resolved by offline aerosol mass spectrometry and other techniques. Environ. Pollut. 2017, 225, 74–85. [Google Scholar] [CrossRef] [PubMed]
  34. Fan, X.; Song, J.; Peng, P. Temporal variations of the abundance and optical properties of water soluble Humic-Like Substances (HULIS) in PM2.5 at Guangzhou, China. Atmos. Res. 2016, 172–173, 8–15. [Google Scholar] [CrossRef]
  35. Ram, K.; Sarin, M.M. Day–night variability of EC, OC, WSOC and inorganic ions in urban environment of Indo-Gangetic Plain: Implications to secondary aerosol formation. Atmos. Environ. 2011, 45, 460–468. [Google Scholar] [CrossRef]
  36. Ge, X.; He, Y.; Sun, Y.; Xu, J.; Wang, J.; Shen, Y.; Chen, M. Characteristics and formation mechanisms of fine particulate nitrate in typical urban areas in China. Atmosphere 2017, 8, 62. [Google Scholar] [CrossRef]
  37. Ohta, S.; Okita, T.A. Chemical characterization of atmospheric aerosol in Sapporo. Atmos. Environ. 1990, 24, 815–822. [Google Scholar] [CrossRef]
  38. Song, J.Z.; He, L.L.; Peng, P.A.; Zhao, J.P.; Ma, S.X. Chemical and isotopic composition of humic-like substances (HULIS) in ambient aerosols in Guangzhou, South China. Aerosol Sci. Technol. 2012, 46, 533–546. [Google Scholar] [CrossRef]
  39. Na, K.; Sawant, A.A.; Song, C.; Cocker, D.R., III. Primary and secondary carbonaceous species in the atmosphere of Western Riverside County, California. Atmos. Environ. 2004, 38, 1345–1355. [Google Scholar] [CrossRef]
  40. Li, B.; Zhang, J.; Zhao, Y.; Yuan, S.; Zhao, Q.; Shen, G.; Wu, H. Seasonal variation of urban carbonaceous aerosols in a typical city Nanjing in Yangtze River Delta, China. Atmos. Environ. 2015, 106, 223–231. [Google Scholar] [CrossRef]
  41. Diab, J.; Streibel, T.; Cavalli, F.; Lee, S.C.; Saathoff, H.; Mamakos, A.; Chow, J.C.; Chen, L.W.A.; Watson, J.G.; Sippula, O.; et al. Hyphenation of a EC/OC thermal-optical carbon analyzer to photo-ionization time-of-flight mass spectrometry: An off-line aerosol mass spectrometric approach for characterization of primary and secondary particulate matter. Atmos. Meas. Tech. 2015, 8, 3337–3353. [Google Scholar] [CrossRef]
  42. Xiang, P.; Zhou, X.; Duan, J.; Tan, J.; He, K.; Yuan, C.; Ma, Y.; Zhang, Y. Chemical characteristics of water-soluble organic compounds (WSOC) in PM2.5 in Beijing, China: 2011–2012. Atmos. Res. 2017, 183, 104–112. [Google Scholar] [CrossRef]
  43. Fry, J.L.; Kiendler-Scharr, A.; Rollins, A.W.; Wooldridge, P.J.; Brown, S.S.; Fuchs, H.; Dubé, W.; Mensah, A.; dal Maso, M.; Tillmann, R.; et al. Organic nitrate and secondary organic aerosol yield from NO3 oxidation of β-pinene evaluated using a gas-phase kinetics/aerosol partitioning model. Atmos. Chem. Phys. 2009, 9, 1431–1449. [Google Scholar] [CrossRef]
  44. Monks, P.S. Gas-phase radical chemistry in the troposphere. Chem. Soc. Rev. 2005, 34, 376–395. [Google Scholar] [CrossRef] [PubMed]
  45. Silva, P.J.; Erupe, M.E.; Price, D.; Elias, J.; Malloy, Q.G.J.; Li, Q.; Warren, B.; Cocker, D.R., III. Trimethylamine as precursor to secondary organic aerosol formation via nitrate radical reaction in the atmosphere. Environ. Sci. Technol. 2008, 42, 4689–4696. [Google Scholar] [CrossRef] [PubMed]
  46. Mayol-Bracero, O.L.; Guyon, P.; Graham, B.; Roberts, G.; Andreae, M.O.; Decesari, S.; Facchini, M.C.; Fuzzi, S.; Artaxo, P. Biomass burning aerosols over Amazonia 2. Apportionment of the chemical composition and importance of the polyacidic fraction. J. Geophys. Res. 2002, 107, 8091. [Google Scholar] [CrossRef]
  47. Lin, P.; Engling, G.; Yu, J.Z. Humic-like substances in fresh emissions of rice straw burning and in ambient aerosols in the Pearl River Delta Region, China. Atmos. Chem. Phys. 2010, 10, 6487–6500. [Google Scholar] [CrossRef]
  48. Lin, P.; Huang, X.; He, L.; Yu, J. Abundance and size distribution of HULIS in ambient aerosols at a rural site in South China. J. Aerosol Sci. 2010, 41, 74–87. [Google Scholar] [CrossRef]
  49. Zhao, M.; Qiao, T.; Li, Y.; Tang, X.; Xiu, G.; Yu, J.Z. Temporal variations and source apportionment of Hulis-C in PM2.5 in urban Shanghai. Sci. Total Environ. 2016, 571, 18–26. [Google Scholar] [CrossRef] [PubMed]
  50. Kuang, B.Y.; Lin, P.; Huang, X.H.H.; Yu, J.Z. Sources of humic-like substances in the Pearl River Delta, China: Positive matrix factorization analysis of PM2.5 major components and source markers. Atmos. Chem. Phys. 2015, 15, 1995–2008. [Google Scholar] [CrossRef]
  51. Tan, J.; Xiang, P.; Zhou, X.; Duan, J.; Ma, Y.; He, K.; Cheng, Y.; Yu, J.; Querol, X. Chemical characterization of humic-like substances (HULIS) in PM2.5 in Lanzhou, China. Sci. Total. Environ. 2016, 573, 1481–1490. [Google Scholar] [CrossRef] [PubMed]
  52. Ofner, J.; Krüger, H.U.; Grothe, H.; Schmitt-Kopplin, P.; Whitmore, K.; Zetzsch, C. Physico-chemical characterization of SOA derived from catechol and guaiacol—A model substance for the aromatic fraction of atmospheric HULIS. Atmos. Chem. Phys. 2011, 11, 1–15. [Google Scholar] [CrossRef]
  53. Duarte, R.M.B.O.; Pio, C.A.; Duarte, A.C. Spectroscopic study of the water-soluble organic matter isolated from atmospheric aerosols collected under different atmospheric conditions. Anal. Chim. Acta 2005, 530, 7–14. [Google Scholar] [CrossRef]
  54. Violaki, K.; Mihalopoulos, N. Water-soluble organic nitrogen (WSON) in size-segregated atmospheric particles over the Eastern Mediterranean. Atmos. Environ. 2010, 44, 4339–4345. [Google Scholar] [CrossRef]
  55. Mace, K.A. Organic nitrogen in rain and aerosol in the Eastern Mediterranean atmosphere: An association with atmospheric dust. J. Geophys. Res. Atmos. 2003, 108. [Google Scholar] [CrossRef]
  56. De Haan, D.O.; Hawkins, L.N.; Kononenko, J.A.; Turley, J.J.; Corrigan, A.L.; Tolbert, M.A.; Jimenez, J.L. Formation of nitrogen-containing oligomers by methylglyoxal and amines in simulated evaporating cloud droplets. Environ. Sci. Technol. 2011, 45, 984–991. [Google Scholar] [CrossRef] [PubMed]
  57. Lee, A.K.Y.; Zhao, R.; Li, R.; Liggio, J.; Li, S.-M.; Abbatt, J.P.D. Formation of light absorbing organo-nitrogen species from evaporation of droplets containing glyoxal and ammonium sulfate. Environ. Sci. Technol. 2013, 47, 12819–12826. [Google Scholar] [CrossRef] [PubMed]
  58. Yue, S.; Ren, H.; Fan, S.; Sun, Y.; Wang, Z.; Fu, P. Springtime precipitation effects on the abundance of fluorescent biological aerosol particles and HULIS in Beijing. Sci. Rep. 2016, 6, 29618. [Google Scholar] [CrossRef] [PubMed]
  59. Collett, J.L.; Herckes, P.; Youngster, S.; Lee, T. Processing of atmospheric organic matter by California radiation fogs. Atmos. Res. 2008, 87, 232–241. [Google Scholar] [CrossRef]
  60. Ho, K.F.; Ho, S.S.H.; Huang, R.J.; Liu, S.X.; Cao, J.J.; Zhang, T.; Chuang, H.C.; Chan, C.S.; Hu, D.; Tian, L. Characteristics of water-soluble organic nitrogen in fine particulate matter in the continental area of China. Atmos. Environ. 2015, 106, 252–261. [Google Scholar] [CrossRef]
  61. Wu, S.; Yang, B.; Wang, X.; Hong, H.; Yuan, C. Diurnal variation of nitrated polycyclic aromatic hydrocarbons in PM10 at a roadside site in Xiamen, China. J. Environ. Sci. 2012, 24, 1767–1776. [Google Scholar] [CrossRef]
  62. De Pieri, S.; Arruti, A.; Huremovic, J.; Sulejmanovic, J.; Selovic, A.; Ethordevic, D.; Fernandez-Olmo, I.; Gambaro, A. PAHs in the urban air of Sarajevo: Levels, sources, day/night variation, and human inhalation risk. Environ. Monit. Assess. 2014, 186, 1409–1419. [Google Scholar] [CrossRef] [PubMed]
  63. Ho, K.F.; Ho, S.S.H.; Lee, S.C.; Cheng, Y.; Chow, J.C.; Watson, J.G.; Louie, P.K.K.; Tian, L. Emissions of gas- and particle-phase polycyclic aromatic hydrocarbons (PAHs) in the Shing Mun Tunnel, Hong Kong. Atmos. Environ. 2009, 43, 6343–6351. [Google Scholar] [CrossRef]
Figure 1. (a) Day to night mass ratios of selected chemical species in PM2.5; (b) average chemical compositions of PM2.5 collected during daytime and nighttime, respectively. Error bar represents the standard deviation.
Atmosphere 08 00189 g001
Figure 2. Time series of PM2.5, OC, EC, OC/EC (left y-axis), wind speed (WS), and O3 (right y-axis) during daytime (a) and nighttime (b), respectively; scatter plots of (c) OC vs. EC, and (d) OC vs. O3 (red for daytime and blue for nighttime).
Atmosphere 08 00189 g002
Figure 3. Average mass percentages of eight fractions of carbon to the total carbon mass (OC + EC). OC, EC, and OP stand for organic carbon, elemental carbon, and pyrolyzed carbon, respectively. Error bar represents the standard deviation.
Atmosphere 08 00189 g003
Figure 4. Scatter plots of (a) WSOC vs. OC and (b) WSOC vs. O3 (red for daytime, blue for nighttime).
Atmosphere 08 00189 g004
Figure 5. Scatter plots of (a) HULIS-C vs. K+; (b) HULIS-C vs. WSOC; and (c) HULIS-C vs. O3 (red for daytime, blue for nighttime).
Atmosphere 08 00189 g005
Figure 6. UV-Vis absorption spectra of HULIS-C and WSOC isolated from day and night PM2.5 samples collected on 10 August and 31 July 2017. Two standard humic substances (Suwannee River fulvic acid (SRFA) and Pahokee Peat Humic Acid (PPHA)) were also presented in the figure.
Atmosphere 08 00189 g006
Figure 7. Temporal variation of E250/E365 of HULIS-C (hollow triangles) and WSOC (hollow circles) for daytime (top panel) and nighttime samples (bottom panel).
Atmosphere 08 00189 g007
Figure 8. Mass concentrations of N-containing components in PM2.5 during daytime and nighttime (error bar represents one standard deviation).
Atmosphere 08 00189 g008
Table 1. The average mass concentrations and ranges of PM2.5, organic carbon (OC), elemental carbon (EC), water-soluble organic carbon (WSOC), HULIS-C, water-soluble total nitrogen (WSTN)/water-soluble organic nitrogen (WSON), and total polycyclic aromatic hydrocarbons (ΣPAHs), etc. Data for daytime and nighttime samples are presented separately.
ItemsUnitsDayNight
MeanRangeMeanRange
PM2.5µg/m377.340.9–136.368.933.3–119.3
OCµgC/m315.17.2–20.613.56.5–25.6
ECµgC/m33.21.3–6.73.30.9–8.5
OC/EC 5.21.9–8.04.81.8–8.0
(OC + EC)/PM2.5%23.715.8–31.124.416.3–36.3
WSOCµgC/m39.14.4–14.97.42.5–15.6
HULIS-CµgC/m35.72.2–9.34.21.3–8.2
WSOC/OC%60.341.3–84.454.833.4–94.8
HULIS-C/WSOC%62.643.0–85.058.345.1–81.9
ΣPAHsng/m32.341.47–3.943.641.73–7.76
Sulfateµg/m311.84.70–18.8410.070.80–19.20
Nitrateµg/m32.00.82–5.005.110.22–21.50
Ammoniumµg/m34.81.69–7.475.371.66–9.44
WSONµg/m31.080–4.711.460.01–4.07
WSTNµg/m35.392.01–10.036.921.92–16.39
WSON/WSTN%16.30–46.917.80–31.3
Table 2. Correlation coefficient (r) between components in PM2.5.
ItemsPM2.5OCECΣPAHsWSOCHULIS-CWSONWSTNNH4+NO3SO42−K+O3WS
PM2.510.710.420.430.630.470.320.520.540.390.580.500.48−0.12
OC0.8110.400.280.880.820.400.510.500.210.550.700.74−0.36
EC0.620.5310.560.330.340.020.190.230.450.150.410.27−0.22
ΣPAHs0.400.150.6010.200.110.270.380.340.570.270.530.10−0.11
WSOC0.730.860.67−0.1110.940.680.720.650.040.700.600.84−0.26
HULIS-C0.650.760.36−0.190.9610.660.640.55−0.080.590.580.83−0.27
WSON0.930.730.410.190.690.6110.880.69−0.060.700.350.570.01
WSTN0.920.690.310.190.620.540.9610.940.230.910.440.63−0.37
NH4+0.930.750.400.220.690.600.950.9710.260.960.230.64−0.13
NO30.700.420.020.110.300.260.760.880.7710.090.13−0.17−0.14
SO42−0.710.760.46−0.190.850.760.690.690.750.4610.490.72−0.15
K+0.660.550.450.550.400.280.460.600.630.480.5110.47−0.05
O30.460.550.57−0.320.850.900.450.360.420.080.650.151−0.34
WS−0.66−0.37−0.47−0.38−0.37−0.39−0.62−0.63−0.64−0.52−0.38−0.34−0.251
Data of day samples are displayed in bold.
Table 3. Mean mass concentration of individual PAH during day and night as well as night to day mass ratio.
PAH CompoundsNumber of RingsMean Concentration (ng/m3)Night to Day Mass Ratio
DayNight
NaP2-rings0.3260.3050.94
Acy0.0030.0031.00
Ace0.0120.0131.08
Flu3-rings0.0370.0381.03
Phe0.3180.3231.02
Ant0.0250.0311.24
Flua0.1980.2131.08
Pyr0.1760.1981.13
BaA4-rings0.0790.1171.48
Chr0.1980.2601.31
BbF + BjF0.1710.3472.03
BkF0.0950.1881.98
BaP5-rings0.1750.3522.01
BeP0.1470.2751.87
DBA0.0280.0853.04
InP6-rings0.1720.3982.33
BghiP0.1830.4962.71
LMW-PAHs2-3 rings0.7210.7130.99
MMW-PAHs4-rings0.6510.7881.21
HMW-PAHs5-6 rings0.9712.1412.20
ΣPAHs 2.3433.6421.55

