Characterization and Seasonal Variations of Organic and Elemental Carbon and Levoglucosan in PM10 in Krynica Zdroj, Poland

Polish Academy of Sciences, Institute of Environmental Engineering, M. Skłodowskiej-Curie 34, 41-819 Zabrze, Poland
*
Author to whom correspondence should be addressed.
Atmosphere 2017, 8(10), 190; https://doi.org/10.3390/atmos8100190
Submission received: 17 July 2017
/
Revised: 21 September 2017
/
Accepted: 22 September 2017
/
Published: 25 September 2017
(This article belongs to the Special Issue Carbonaceous Aerosols in Atmosphere)
Abstract
:In this study, the ambient aerosol (PM10) concentrations of elemental carbon (EC), organic carbon (OC), total carbon (TC), and levoglucosan are reported for a Polish health resort following a one-year (March 2016–April 2017) sampling campaign. The seasonal variation of OC, EC, and levoglucosan (LG) concentrations showed their maximum during the heating season for this site, with monthly mean total carbonaceous material/PM10 ratios ranging between about 0.28 and 0.44 depending on the season. Average EC concentration was 1.1 ± 0.6 µg∙m−3 and changed from 0.3 µg∙m−3 up to 2.3 µg∙m−3 during the sampling campaign. The OC concentration at the site ranged from 2.4 µg∙m−3 during the non-heating season up to 22 µg∙m−3 in the heating season, with an average of 7 µg∙m−3. A strong correlation between OC and EC in the heating season suggested that they were produced from similar sources during this time. Mean LG concentration during the sampling campaign was 0.51 µg∙m−3, while in the heating season it was 0.72 µg∙m−3 and in 0.19 µg∙m−3 in the non-heating season. The obtained results indicated a strong influence of local primary source emissions on air quality, especially during the heating period.
1. Introduction
Carbonaceous aerosols can be differentiated as either organic (OC) or elemental carbon (EC). Quantification of the carbonaceous content of the ambient aerosol on the basis of single species is an insurmountable task due to their sheer number, their various chemical and physical properties, and the complex aerosol matrix. Thus, operational definitions of bulk carbonaceous material such as EC and OC have been established. However, these compounds play an important role in the chemistry of the troposphere, and in aerosol form, as a climate forcing agent [1]. The many organic compounds associated with ambient fine aerosols have different physical and chemical properties and their effect on human health and cloud formation remains largely unknown. Organic carbon in the atmosphere includes hydrocarbons, oxygenated or halogenated compounds, and multifunctional compounds, as well as particulate matter [2].
Elemental carbon (EC) in atmospheric particulate matter originates from a broad range of sources in many urban locations [3,4,5]. As health and air quality studies use EC measurements to better understand the impact of diesel engines and other combustion sources, there is a great need to clearly understand the relative source contributions to EC concentration in the atmosphere. EC has often been used as a tracer of primary organic aerosols (POAs) [4]. According to Pio et al. [3], the ratio of OC and EC can be used as a tool to derive OC from primary and secondary sources. The primary OC/EC ratio measured at the monitoring site was influenced by meteorology, daily and seasonal fluctuations in emissions, and local sources. The OC/EC ratio allows for the determination of aerosol origin and their transformations, so the OC/EC value is a key parameter for estimating the secondary organic carbon (SOC) fraction in PM.
If the measured ratio is bigger than this expected value, additional OC was considered as a secondary organic aerosol (SOA). However, the weakness of this approach is that the ratio would vary with meteorology, seasonal fluctuations in emissions, and local sources [6]. The residential energy demands in Polish households are in greater part satisfied by the combustion of solid fuels, mainly hard coal and firewood, which are most commonly used as sources of energy for heating. The average annual consumption of energy derived from biomass combustion in households is 108.1 GJ [7]. Contributions to primary organic aerosols from transport, solid fuel burning, and cooking have been described in detail by Allan et al. [8] and Healy et al. [9].
Levoglucosan (LG) and related degradation products from cellulose can be utilized as specific and general indicator compounds for the presence of emissions from biomass burning in atmospheric fine particulate matter samples [10,11]. LG is considered as a useful molecular tracer of biomass-burning aerosols in the atmosphere. The measurement of levoglucosan and other markers of wood smoke can be used to accurately calculate the contribution of wood smoke to the EC in a given particulate matter sample [12,13]. Hence, ambient aerosol particle concentrations of levoglucosan are commonly used to study the influence of residential wood burning, agricultural waste burning, and wildfire emissions on ambient air quality. Furthermore, levoglucosan has been analyzed in wood burning emission samples and in ambient air, where its presence has been detected due to biomass combustion processes in rural, suburban, and urban air samples in North and South America, Africa, Europe, and East Asia [2,12,13,14,15]. Various papers have indicated that the differences between European countries are very large [16,17,18,19], for example, the maximum daily levels of levoglucosan was at a level 0.2 µg∙m−3 in Barcelona [15], whereas the average wintertime concentration of levoglucosan in the ambient urban background air of Helsinki is typically less than 100 ng∙m−3 [20]. Long-term monitoring data of EC, OC, and levoglucosan are not yet available on a regional scale in Europe, although the importance of such data has been published.
The aims of the work are to (i) examine the seasonal variations of PM10 and levoglucosan, and (ii) investigate the relationship between levoglucosan, elementary, and organic carbon in the local environment of a Polish health resort located in the eastern part of Poland (Krynica Zdroj), near the Slovakia border.
2. Experiments
2.1. Sampling Point
Aerosol samples were collected in the “A” zone of a health resort in Krynica Zdroj by the climatological station IMGW-PIB department in Cracow (φ = 49°24′28″, λ = 20°57′39″, h = 582 m above sea level), near the Slovakian border (Figure 1). The station is located on the hillside of a mountain valley neighboring the residential development of the city and the health resort area. Meteorological parameters are given in Table 1.
The Krynica Zdroj area is agricultural and forest land with many tourist attractions. Due to land development, the station qualifies as representative of the local environment. The sampling campaign was carried out from March 2016 to April 2017. Dust samples were collected with the use of a low flow sampler with separating head PM10 Atmoservice PNS3D15/LVS3d, with a stabilized flow of 2.3 m3∙h−1. Dust sample collection and gravimetric analysis were undertaken as per according to PN-EN 12341:2014 (ambient air). A standard gravimetric measurement method for the determination of the PM10 or PM2.5 mass concentration of suspended particulate matter was applied. Samples were collected at a 24-h cycle on 47 mm Whatman QMA quartz filters. The OC and EC were determined in all samples, while the LG concentration were determined in every fourth dust sample.
2.2. Analytical Methods
Filters from low-volume samplers were analyzed using various techniques to determine the concentrations of organic and elemental carbon, and levoglucosan. A thermal and optical organic and elemental carbon OC/EC analyzer with FID detection—Model 4L Main Oven Assembly (Sunset Laboratory Inc., Tigard, OR, USA) was used to determine the OC and EC in the PM10 samples. Before and after exposure, the filters were conditioned in a weighing room (48 h; relative humidity: 45 ± 5%; air temperature: 20 ± 2 °C) and weighed using a Mettler Toledo microbalance (resolution: 2 μg). For each measurement series (14 days), the analytical background was determined based on the procedure used for OC and EC determination in real samples.
PM10 samples—in the form of 1.5 cm2 sections of the quartz filters—were subjected to a two-step analysis. First, the organic fraction was released from the filter through gradual heating of the sample in a helium stream. Next, the filter section was heated in an oxidizing helium–oxygen mixture to release elemental carbon. The heating regime followed the parameters specified in the selected measurement protocol. The compounds separated from the sample during the subsequent steps were quantitatively converted to CO2 in a magnesium oxide oxidizing oven. The CO2 produced during the analysis, in the presence of hydrogen and the nickel catalyst, was reduced in the methanat to methane, and measured with a flame ionization detector (FID). A correction for OC and EC content was introduced on the basis of the optical transmission measurement of a red laser beam (TOT, thermal optical transmittance). The last step was the inclusion of a fixed volume loop used to inject an external standard at the end of each analysis, thereby maintaining a stable, reproducible analytical method. Using a Sunset Laboratory analyzer, it was possible to perform measurements as per several standard temperature protocols that differ in temperature thresholds, quantity, and duration.
In this study, the analysis was performed using the EUSAAR_2 protocol, which was developed as a proposed standard method for European measurement stations under the EUSAAR (European Supersites for Atmospheric Aerosol Research) project. For each real sample batch/series, the blank samples were analyzed to verify the presence of OC and EC. Based on the results of the 1.5 cm2 pieces of the 25 blank samples, the limit of quantification (LOQ) was calculated as 0.94 μgC∙cm−2 for OC and 0.1 μgC∙cm−2 for EC, respectively. Repeatability was estimated from 25 independent measurements of the same sample under the same measuring conditions (slice of quartz filter with glucose standard solution of concentration 4 μgC∙μL−1). Repeatability determined that the relative standard deviation for OC was 1.6%.
The concentration of levoglucosan was determined by gas chromatography coupled with a mass spectrometry detector (GC/MS) after derivatization. The quartz filters were cut into four parts and one part from each filter was placed in a reaction vial. Two milliliters of pyridine and 50 µL of derivatization agent were added. For silylation, a mixture of N,O-bis(trimethylsilyl) trifluoroacetamide (BSTFA) and trimethylchlorosilane (TMCS) (BSTFA:TMCS, 99:1) was used. The vial was sealed and shaken vigorously for 1 min, and the sample was allowed to react at 40 °C for 30 min. Blank filters were spiked with 1.5 µg of levoglucosan and the recovery was 95%. The extracts were analyzed with a GC-2010 Shimadzu gas chromatograph (Shimadzu, Columbia, MD, USA) coupled with a mass spectrometry detector equipped with a 30 m, 0.25 mm i.d. HP-5MS capillary column. Calibration was performed in four calibration ranges: 0.01–0.2 µg∙mL−1; 0.2–2.0 µg∙mL−1; 2.0–6.0 µg∙mL−1; and 5.0–35.0 µg∙mL−1. The detection limit (LOD) was estimated as the concentration visible in the chromatogram with a peak height at least three times the signal-to noise ratio, which was found to be 0.001 µg∙m−3, and LOQ was expressed as 3 LOD amounts of 0.002 µg∙m−3. Precision—expressed as a relative standard deviation (RSD)—was calculated as 19%.
3. Results and Discussion
PM concentrations reflected the strength of the primary and secondary regional source, the impact of long-range transport on particulate matter, and the dilution of particulate air pollution related to the distance from various sources and meteorology. It should be noted that, in the case of Krynica Zdroj, the administrative authorities have introduced restrictions on the heating of buildings in the resort area, which covers more than 100 ha in the center of Krynica, the suburbs of the city, and the health park, so new buildings in this area cannot be equipped with coal boilers. Measurements at the health resort from March 2016 to April 2017 showed that average PM10 concentration varied from 6 µg∙m−3 in July to 61 µg∙m−3 in December, depending on season (Table 2), and the mean concentration during the measurement campaign was 21.9 µg∙m−3. Figure 2 shows the correlation between PM10 concentration and temperature during the sampling campaign. During the heating season (25 March–21 April 2016 and 26 September 2016–30 March 2017), mean PM10 concentration was 31 µg∙m−3, while in the non-heating season (22 April–25 September 2016) it was half as much at 15.2 µg∙m−3. This is below the level recommended by the World Health Organization (WHO), which is 50 μg∙m−3 [21].
Carbonaceous particles are often divided into two categories: elemental and organic carbon. The total carbon (TC) content of aerosols is defined as the sum of all carbon in the particulate matter e.g., OC and EC. Concentration of TC ranged from 3.5 to 32.1 µg∙m−3 with an average of 8.1 µg∙m−3. Like the PM10 concentrations, there were differences between the heating and non-heating seasons; the average TC concentration during the heating period was 10.2 µg∙m−3, while that for the non-heating period was 4.8 µg∙m−3. The higher TC concentration during the heating period may be attributed to higher emissions from biomass combustion, domestic heating, and OC condensation due to low temperatures (average heating season temperature was 0.6 °C). The differences in the nature of particulate pollution can be better described by the ratio TC/PM, which characterizes the contribution of total organic carbon in dust.
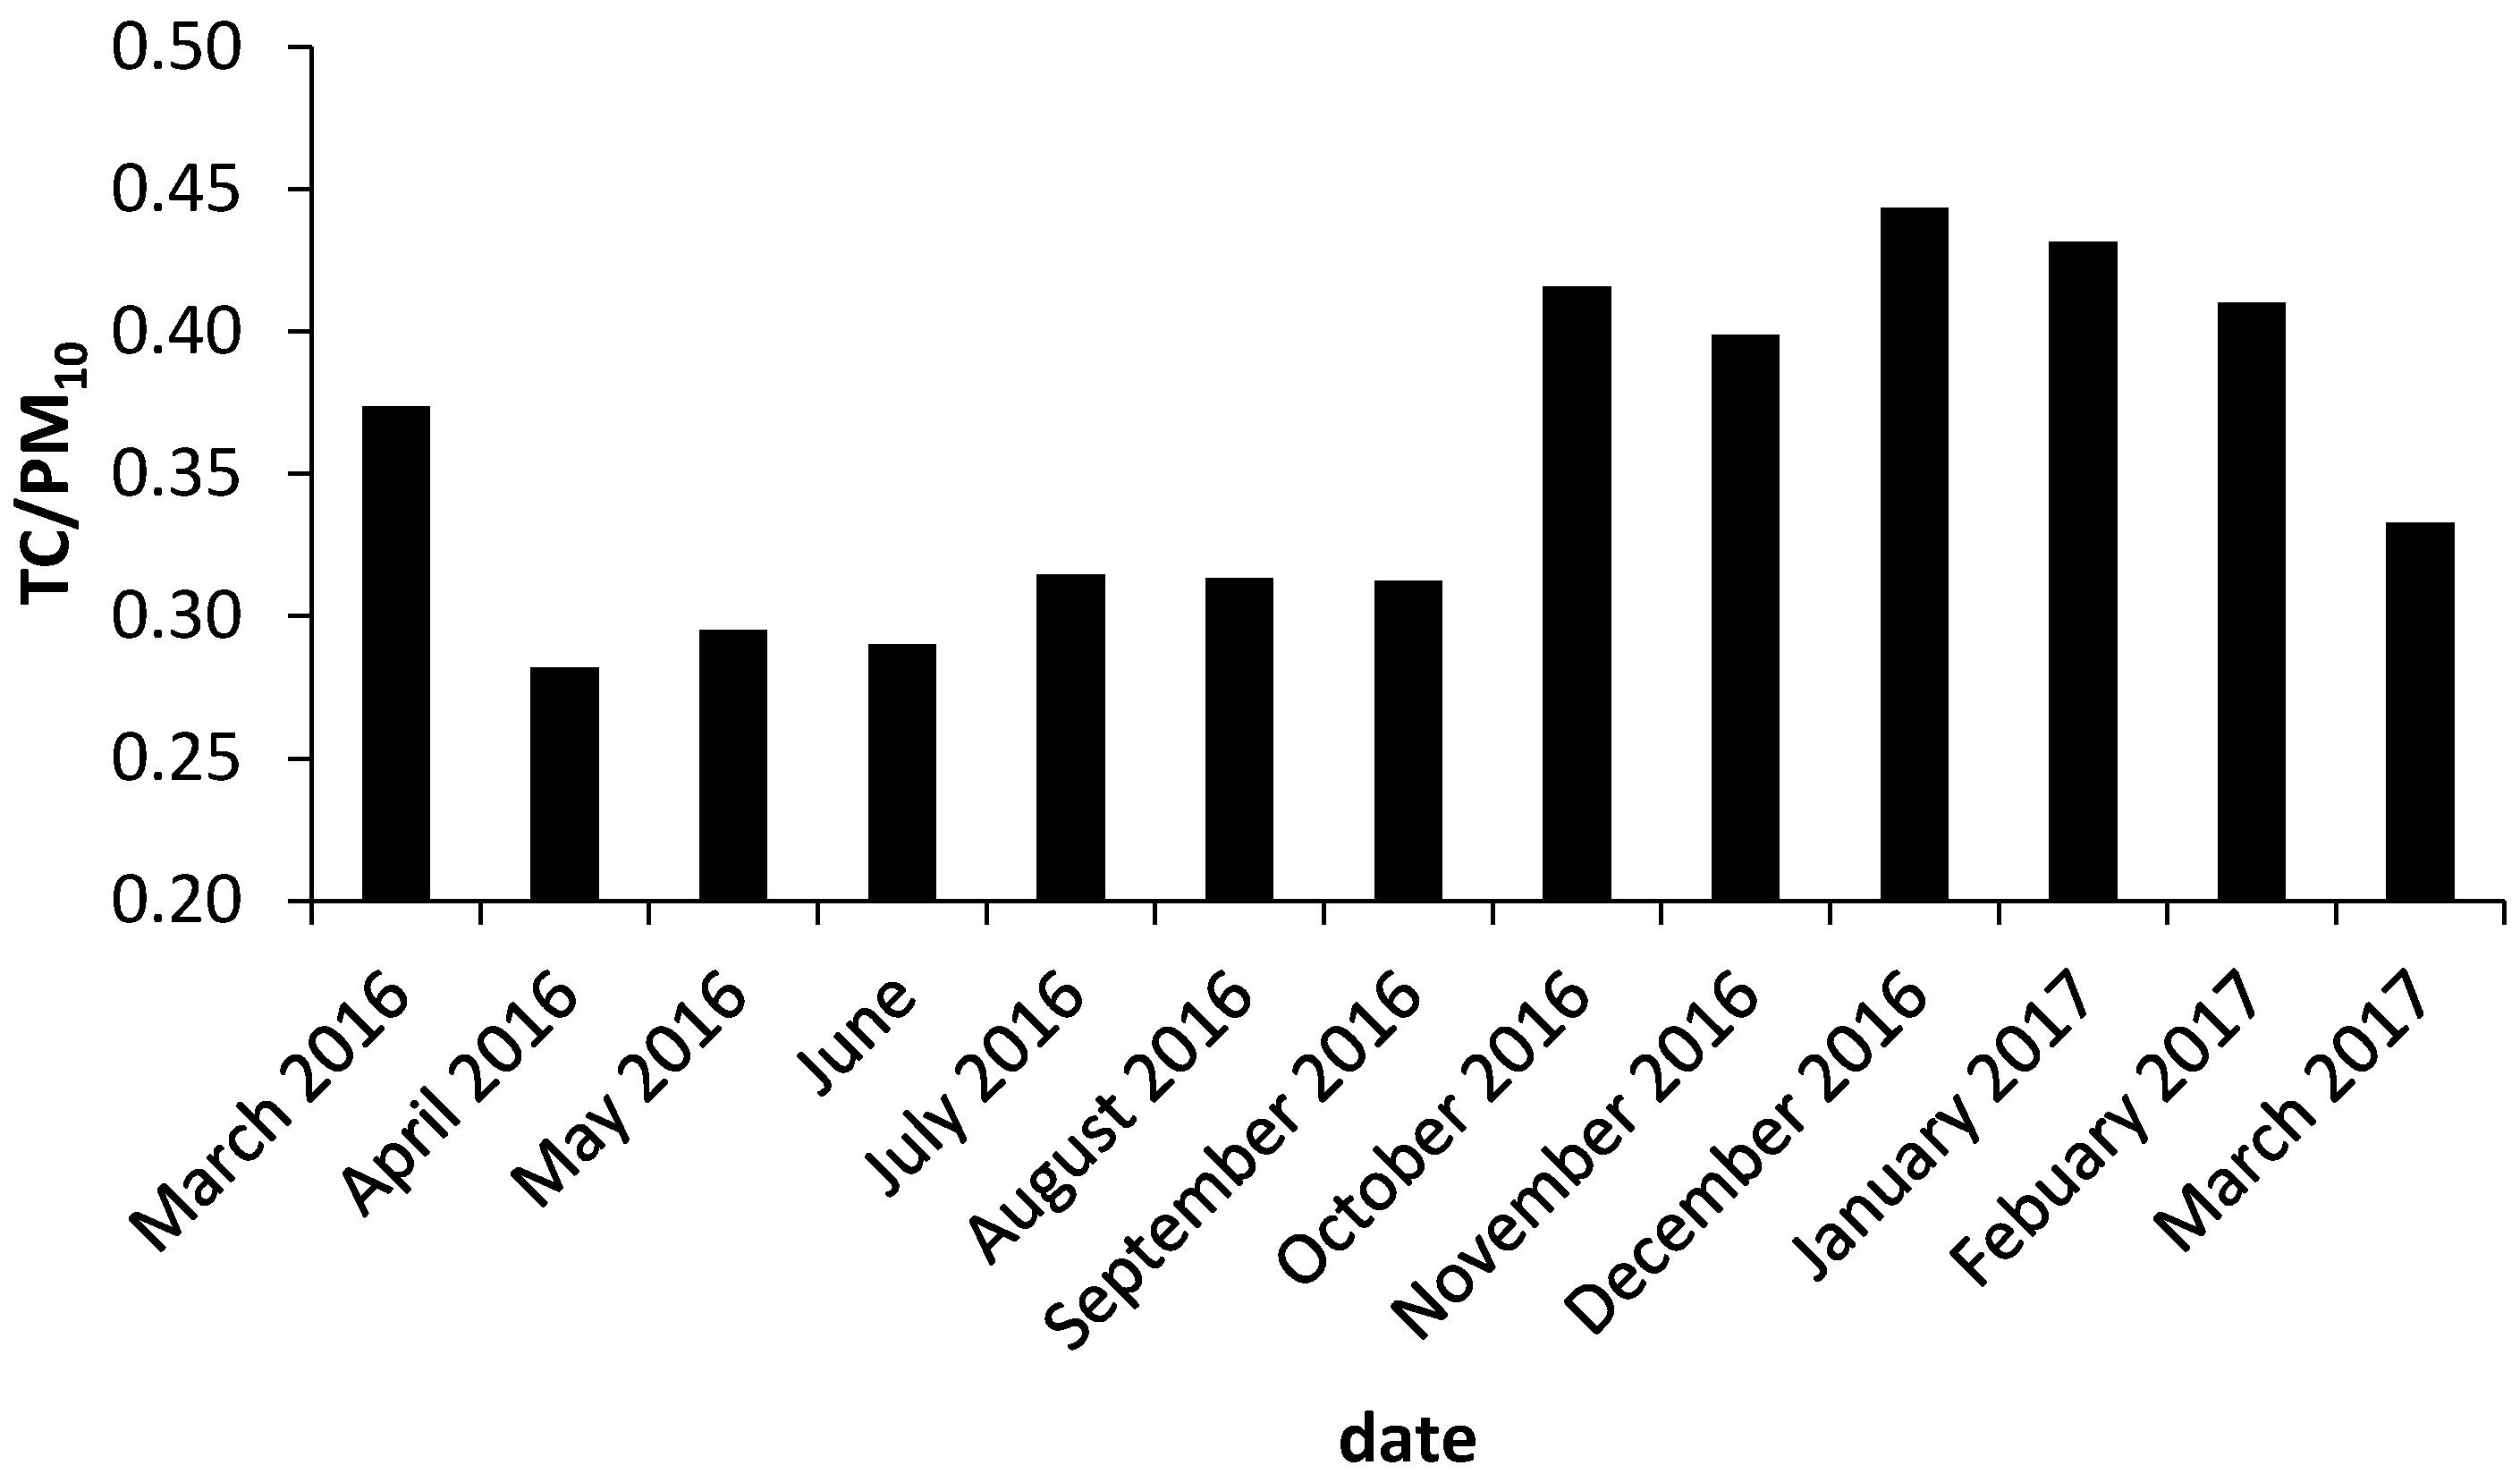
Mean TC/PM10 ratio during the measurement campaign was 0.35 (Table 3), which was similar to the data presented by Cavalli for the site of Ispra, Italy [22]. Monthly mean TC/PM10 ratios ranged between 0.28 and 0.44 (Figure 3). The seasonal cycle of TC/PM10 was characterized by high values from October to January, and lower values between May and August. Such seasonal cycles can be explained by (i) an increase in carbonaceous aerosol emissions due to domestic heating during the cold months; (ii) lower temperatures during the heating season; or (iii) stable atmospheric conditions during the heating season.
The ability to accurately use EC as a tracer for diesel particulate matter in either the environmental or occupational setting is critically dependent on a clear understanding of the relative contributions of other sources to the EC concentrations. Currently, EC is used as a surrogate to monitor occupational exposure to diesel particulate matter [23,24].
Mean EC concentration was 1.1 ± 0.6 µg∙m−3 and increased from 0.3 to 2.3 µg∙m−3 during the sampling campaign. During the heating season, mean EC concentration was 1.3 µg∙m−3, similar to the data for the site of Illmitz, Austria (site category: rural background), which was 1.20 ± 0.52 µg∙m−3 [25] during the same season in 2003. During the remaining time (non-heating season), mean EC concentration was 0.64 µg∙m−3, which were comparable to results from the sites of Braganza, Portugal (site category: rural background; 0.60 ± 0.52 µg∙m−3) and Stara Lesna, Slovakia (site category: rural background; 0.63 ± 0.33 µg∙m−3) in the same season [25]. According to Hoffmann and Warnke [26], EC concentrations in clean areas are typically 1 µg∙m−3, in polluted areas they might exceed 5 µg∙m−3. Obtained results indicated the strong influence of local primary source emissions on air quality in the heating period.
The mean EC concentration ratio of the heating to non-heating season was 2:1. The EC contribution in PM10 was 4.95% on average, while in the heating season it was 5.4% on average, and was 4.3% for the remaining time.
OC represents a large variety of organic compounds of primary and secondary origin, and can be directly emitted into the atmosphere in particulate form (primary), or can result from atmospheric reactions of volatile and semi-volatile organic compounds with reactive trace gases followed by the nucleation and/or condensation of less volatile products [27]. The OC concentration at the site ranged from 2.4 µg∙m−3 in the non-heating season to 22 µg∙m−3 in the heating season, with an average of 7 µg∙m−3. In the heating season, the average concentration of OC was 9.3 µg∙m−3, while in the non-heating period it was 4.2 µg∙m−3. In the case of OC concentration, obtained results were similar to data for the site of Ispra, Italy [22]. The typical mean concentration of OC in the atmosphere was in the range of 1 µg∙m−3 in clean areas to 10 µg∙m−3 in polluted areas; however, peak concentrations might reach up to 50 µg∙m−3 during biomass burning episodes [26]. These obtained results suggest that depending on season, the concentration of OC is characteristic for polluted areas. Mean OC contribution in dust PM10 was 31%, and depending on the measurement season was 32.1% for the heating season and 22.1% for the remaining time.
Correlation between Total Carbon (TC), Elemental Carbon (EC), and Organic Carbon (OC)
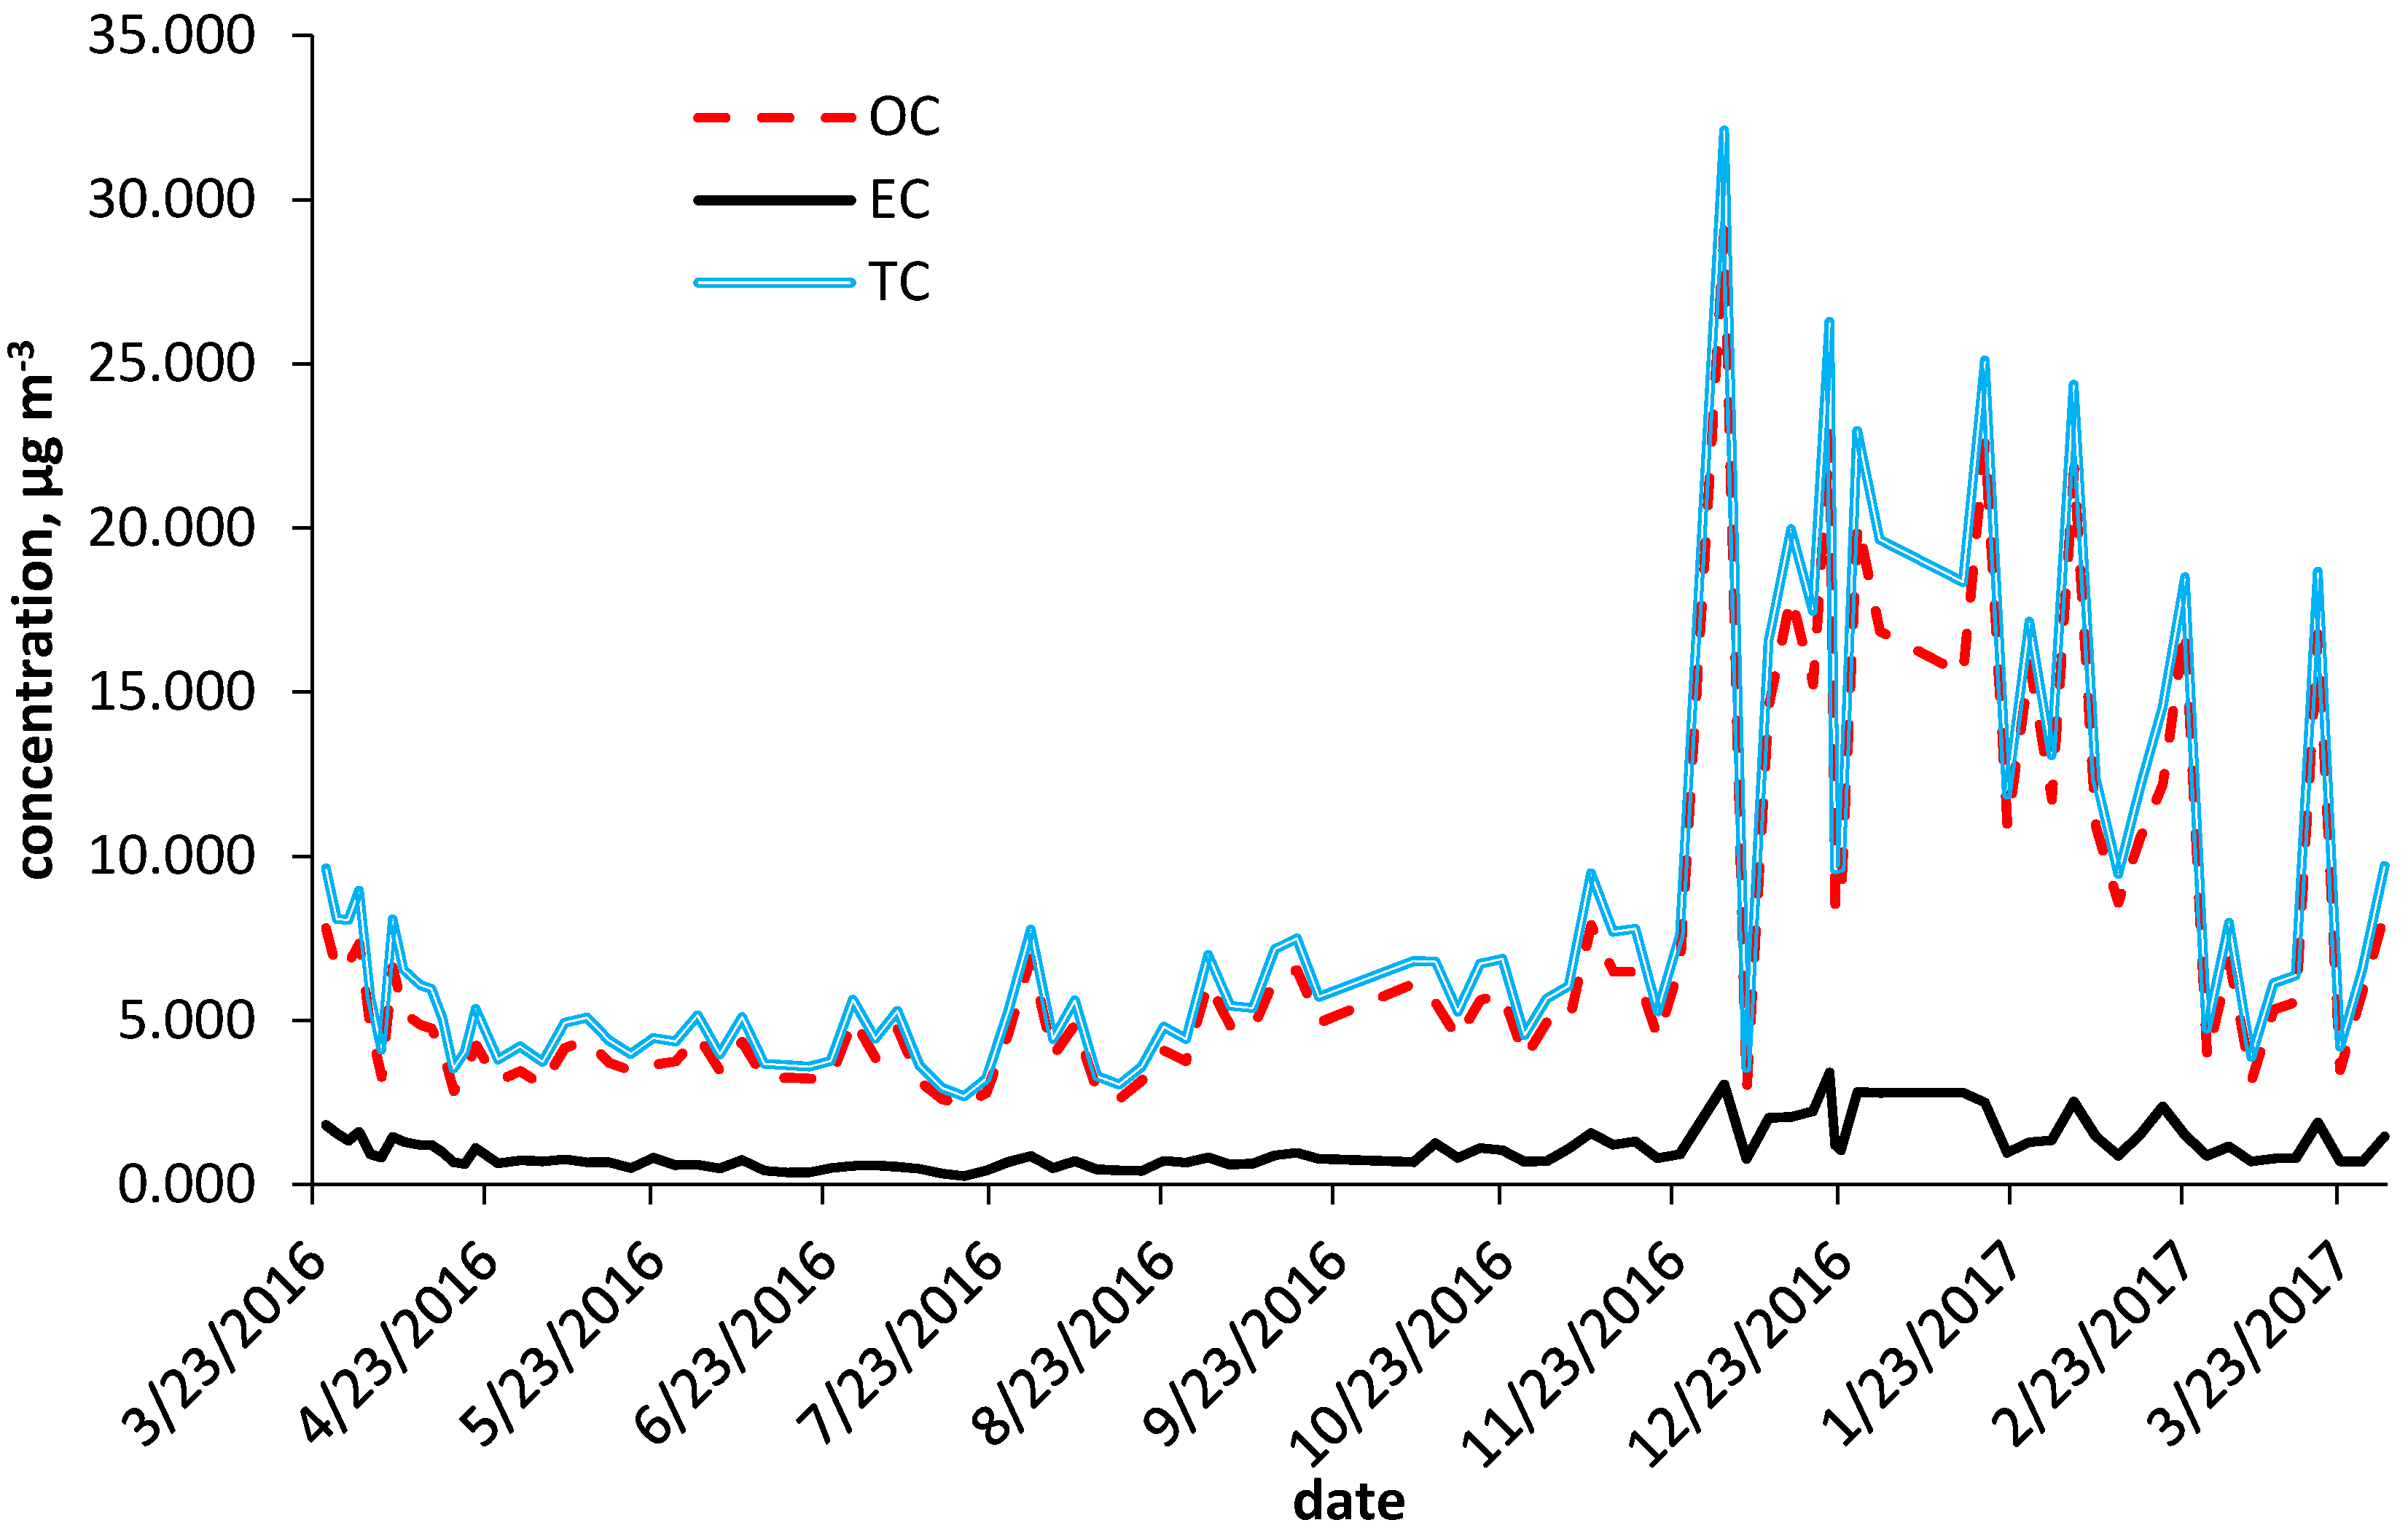
The dominant fraction of carbonaceous aerosol was OC, which includes all organic compounds present in the particle phase. EC constituted a smaller fraction of the carbonaceous aerosol. Figure 4 presents the seasonal variation of EC, OC, and TC from March 2016 to April 2017.
EC contribution in TC ranged between 7.6% and 21%, and the average was 14% during the measurement campaign. In the heating season, the EC share was 14.4% on average and in the non-heating season it was 13.7%. Episodes where the EC share in TC reached >20% occurred in April 2016.
The ratio of organic to total carbon (OC/TC) was suggested to differentiate emission sources of aerosols. Watson et al. [28] reported values of OC/TC for residential wood combustion (0.81), residential coal combustion (0.73), forest fires (0.94), and roadside emissions (0.48–0.67). In our study, the OC/TC ratios for average campaign concentrations at the site ranged from 0.79 to 0.92 (Table 3). The average OC/TC ratios during the heating and non-heating seasons were very similar at 0.87 and 0.86, respectively. These ratios indicated mixed emissions from various sources.
Additionally, the ratio of EC to OC is an indicator of various combustion sources, which makes it useful for source determination. That is, as primary OC and EC are usually emitted from the same source, this means that EC can be used as a tracer for primary combustion-generated OC. It is well known that OC and EC particles exist mainly in aerodynamic particle diameters of 0.1 < d < 1 µm [29,30].
A strong correlation (R2 = 0.8) between OC and EC were observed during the heating season, suggesting that they were produced from similar sources (Figure 5). This correlation suggested that major fractions of OC were emitted by a dominant primary source. On the other hand, in the non-heating season, R2 only achieved a value of 0.6. When there was more than one main primary source, the OC to EC ratio value was not constant and the correlations were weaker [31].
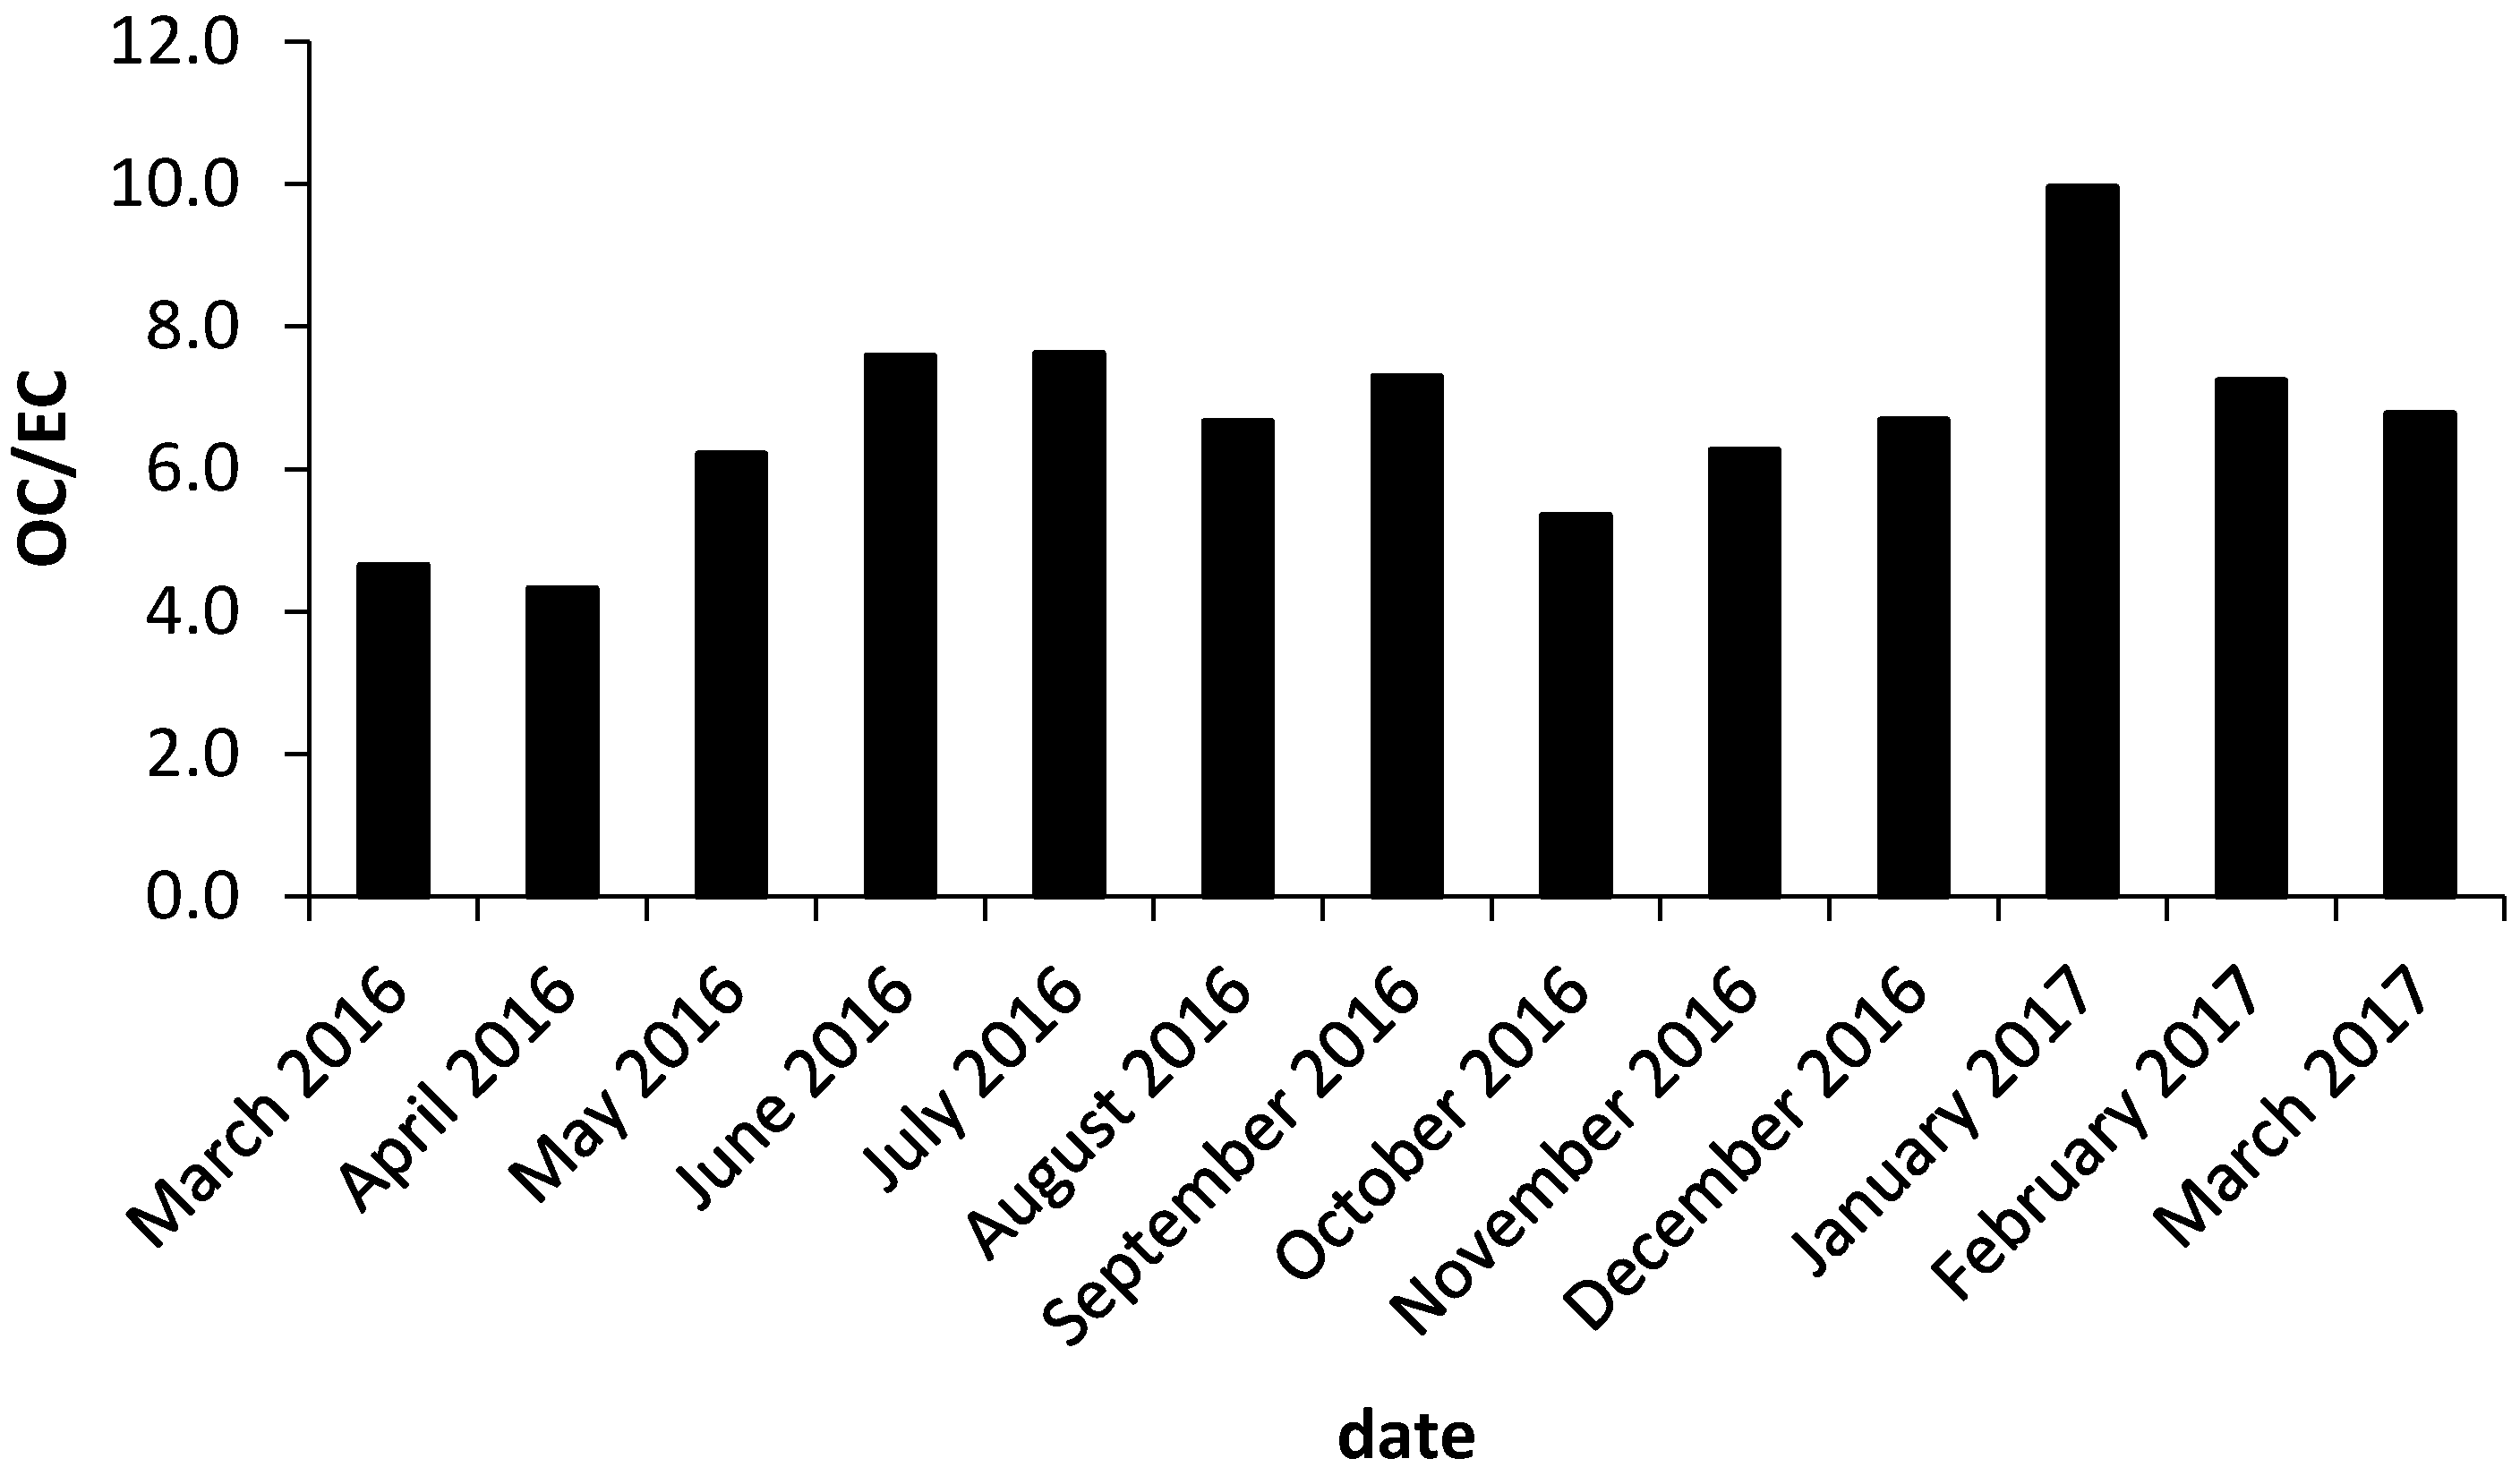
The monthly average OC/EC ratio in the sampling campaign was 6.7 and varied between 4.3 (April 2016) and 10.0 (January 2017). During the heating season, there were episodes when the OC/EC ratio was 12.2 (Figure 6). The high values of OC/EC ratio in the heating season suggested that OC emission may be derived from biogenic sources (biomass combustion) [32,33,34].
Castro et al. [35] estimated secondary organic carbon (SOC) using the minimum ratio of OC/EC. The concentration of SOC—determined by Equation (1)—in the heating season was 3.31 μg∙m−3, while in the non-heating season, it was 1.46 μg∙m−3.
where ( is the minimum value in the set of OC/EC ratios at the measuring point; OC is the OC concentration; and EC is the EC concentration.
These results showed a significant impact on air quality from local sources of emissions, particularly in biomass combustion.
For this study, levoglucosan was determined from the PM10 fraction collected on quartz filters as tracers of biomass-burning emissions. The concentration of LG varied from 0.01 to 1.72 µg∙m−3 depending on season (Figure 7). Furthermore, similar LG concentration levels have been observed in China [14]. Levoglucosan concentrations, with a 24-h average ranging from 46 to 1889 ng∙m−3 and an average concentration of 428 ng∙m−3, were obtained from 5 July 2008 to 27 June 2009. The average levoglucosan concentration in winter changed from 935 to 443 ng∙m−3.
Mean LG concentration during the sampling campaign was 0.51 µg∙m−3, while in the heating and non-heating seasons it was 0.72 µg∙m−3 and 0.19 µg∙m−3, respectively. The highest LG concentration was observed in November (average temperature 1 °C and relative humidity 88%) and it may be explained by the higher consumption of wood for residential heating in the colder months and/or by LG condensation on PM10 [36,37,38]. Similar correlations between summer and winter have also been indicated by the results of studies conducted by Kourtchev et al. [39] during the summer campaign in Cork Harbor, Ireland. Levoglucosan was detected with an average of 9.3 ng∙m−3, while concentration increased during the winter periods of up to 298 ng∙m−3. Observed differences between heating and non-heating seasons may have been the result of higher pollution emissions from biomass burning in the heating season, as well as the effects of atmospheric changes.
It is well-known that levoglucosan has a potential for atmospheric degradation [39,40] and the lifetime of this compound, with respect to its reaction with a typical summer concentration of hydroxyl radicals, has been estimated at 0.7–2.2 days [41]. As winter concentrations of hydroxyl are lower than those in summer, such degradation will be appreciably slower in winter. On the other hand, higher relative humidity and lower temperature can lead to longer lifetimes of levoglucosan. Environmental factors such as relative humidity (RH) and temperature may also play important roles in the atmospheric stability of levoglucosan [42].
The obtained results indicated a good correlation of LG vs. TC, with R2 = 0.7 in the heating season, and a lack of dependence in the non-heating season; R2 = 0.4 (Figure 8).
The mean LG share in the TC during the sampling campaign was 5.5%, while it was 7.1% in the heating season and was about 4% in the non-heating period.
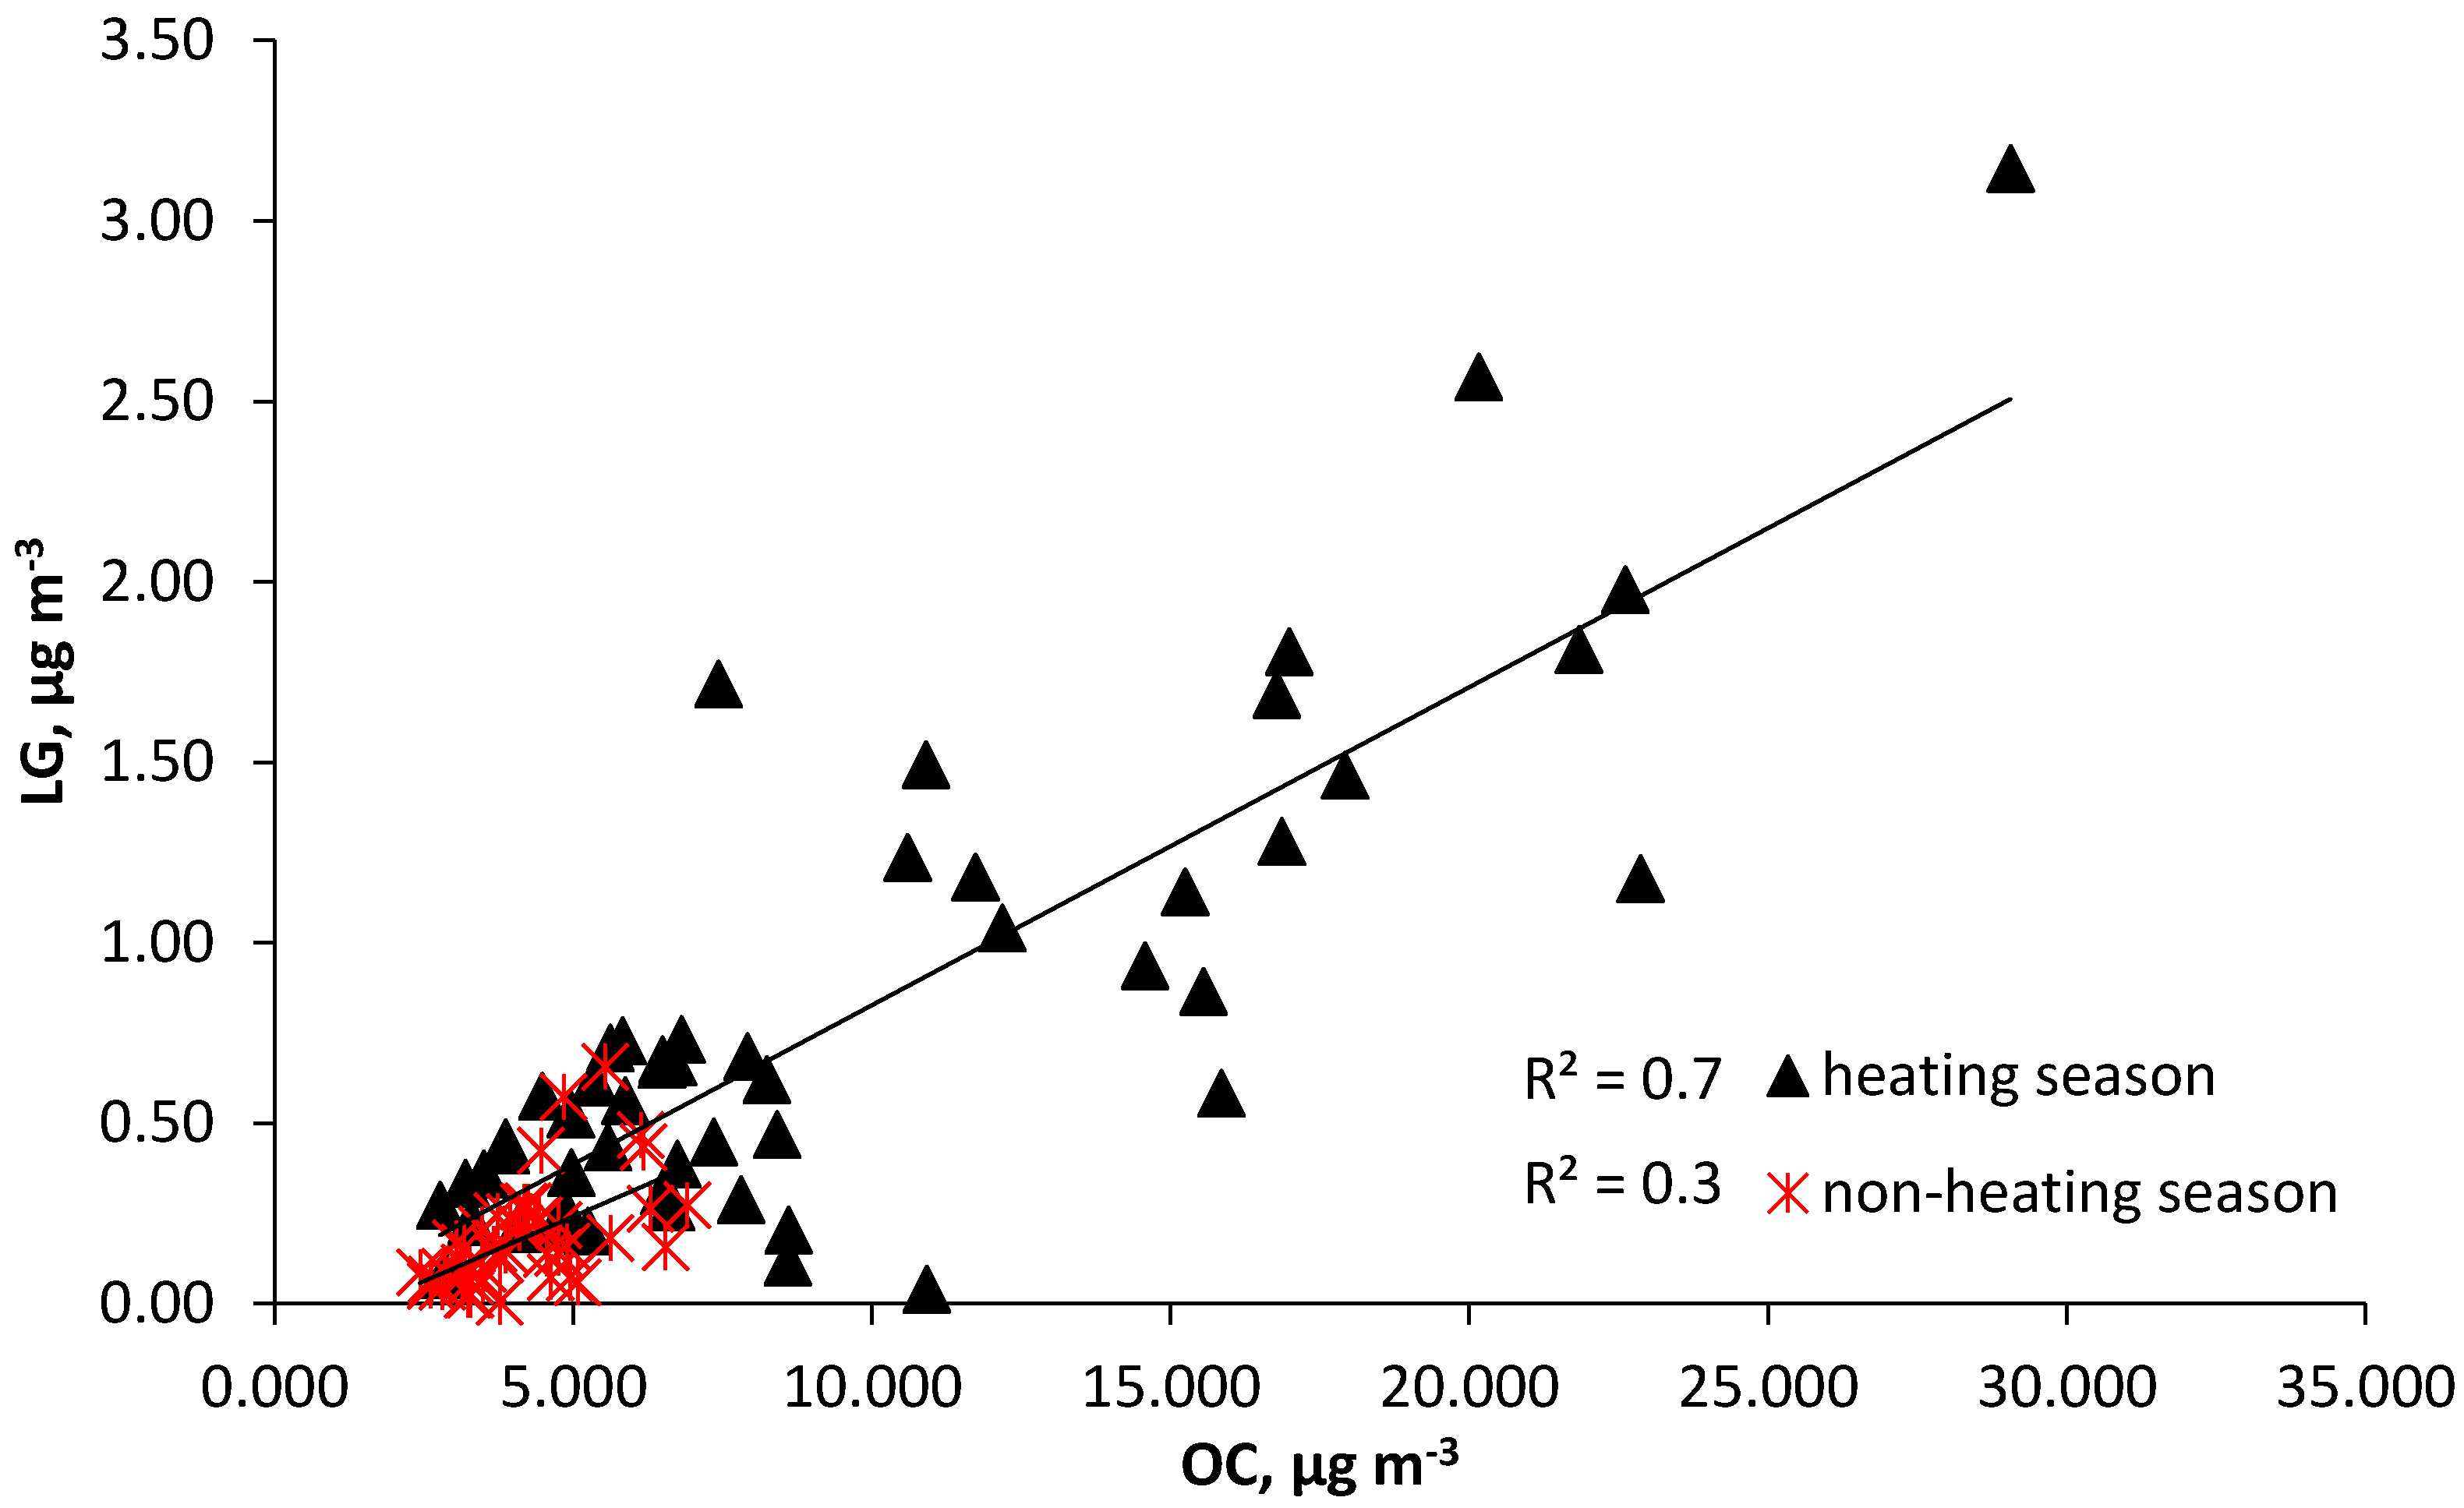
The highest levoglucosan/OC ratio of 6.5% was found in the heating season when compared with non-heating (4.3%), suggesting more biomass was burned in the heating season. Sullivan et al. [43] suggested that the levoglucosan/OC ratio varied with the fuel component, with the highest ratio found in wood and branches, followed by straw, needles, and leaves.
As seen in Figure 9, the correlation between levoglucosan and OC was higher in the heating season (R2 = 0.7), but was weaker in the non-heating season (R2 = 0.3). These correlations suggested that biomass burning in the heating season was an important source of organic carbon.
To identify the relative contributions of biomass burning, fossil fuel combustion, and natural biogenic emission sources of OC and EC, we employed an alternative method based on the indirect approach. Puxbaum et al. [44] based on a review of the literature data available at the time, proposing the application of Equation (2):
Biomass smoke OC = levoglucosan × 7.35.
The fraction of primary OC emitted from biomass burning in the heating season was 5.3 µg∙m−3, while the average value obtained from measurements at the same time was 9.3 ± 5.9 µg∙m−3. During the non-heating season, the primary OC concentration calculated on the LG concentration basis was 1.3 µg∙m−3, while measurement data indicate that OC concentration was 4.2 ± 1.1 µg∙m−3. Therefore, the missing part of OC concentration originated from biogenic sources and from the secondary OC [17].
4. Conclusions
Biomass burning is an important source of aerosol particles affecting local air quality. The biomass-burning tracers levoglucosan, OC, and EC were identified and quantified from aerosol samples collected during a year-long campaign in 2016/2017. The PM10 concentrations in our samples were below the recommended guidelines by WHO in 90% of the samples.
The influence of biomass burning was the highest during the residential heating season. Based on correlation coefficients between the biomass burning tracer and the carbonaceous species, it was suggested that part of the OC and EC in the site were related to biomass burning.
The concentrations of both OC and EC were also higher in the heating season than in the non-heating season, which corresponded particularly with higher biomass burning. Mean LG concentration during the sampling campaign was 0.51 µg∙m−3.
Acknowledgments
Data analysis was supported by the Institute of Environmental Engineering of the Polish Academy of Sciences basic (statutory) research project no. A1/105/2015: Influence of local and synoptic factors on physico-chemical composition of aerosols.
Author Contributions
Krzysztof Klejnowski conceived and designed the experiments and co-wrote the paper; Katarzyna Janoszka performed the experiments; Marianna Czaplicka analyzed the data and co-wrote the paper.
Conflicts of Interest
The authors declare no conflict of interest.
References
- Calvo, A.I.; Alves, C.; Castro, A.; Pont, V.; Vicente, A.M.; Fraile, R. Research on aerosol sources and chemical composition: Past, current and emerging issues. Atmos. Res. 2013, 120, 1–28. [Google Scholar] [CrossRef]
- Mochida, M.; Kawamura, K.; Fu, P.; Takemura, T. Seasonal variation of levoglucosan in aerosols over the western North Pacific and its assessment as a biomass-burning tracer. Atmos. Environ. 2010, 44, 3511–3518. [Google Scholar] [CrossRef]
- Pio, C.; Cerqueira, M.; Harrison, R.M.; Nunes, T.; Mirante, F.; Alves, C.; Oliveira, C.; Sanchez de la Campa, A.; Artíñano, B.; Matos, M. OC/EC ratio observations in Europe: Re-thinking the approach for apportionment between primary and secondary organic carbon. Atmos. Environ. 2011, 45, 6121–6132. [Google Scholar] [CrossRef]
- Liu, J.D.; Allan, D.E.; Young, H.; Coe, D.; Beddows, Z.L.; Fleming, M.J.; Flynn, M.W.; Gallagher, R.M.; Harrison, J.; Lee, A.S.H.; et al. Size distribution, mixing state and source apportionment of black carbon aerosol in London during wintertime. Atmos. Chem. Phys. 2014, 14, 10061–10084. [Google Scholar] [CrossRef] [Green Version]
- Healy, R.M.; Sciare, J.; Poulain, L.; Kamili, K.; Merkel, M.; Müller, T.; Wiedensohler, A.; Eckhardt, S.; Stohl, A.; Sarda-Estève, R.; et al. Sources and mixing state of size-resolved elemental carbon particles in a European megacity: Paris. Atmos. Chem. Phys. 2012, 12, 1681–1700. [Google Scholar] [CrossRef] [Green Version]
- Seinfeld, J.H.; Pandis, S.N. Atmospheric Chemistry and Physics: From Air Pollution to Climate Change; John Wiley & Sons: New York, NY, USA, 2016; p. 1326. [Google Scholar]
- Berent-Kowalska, G.; Dąbrowska-Ładno, J.; Dziedzina, K.; Gontarczuk, W.; Peryt, S.; Roman, W.; Ciszewska, A.; Kossak, E.; Gilecki, R.; Kacprowska, J.; et al. Energy Consumption in Households; Central Statistical Office: Warsaw, Poland, 2015.
- Allan, D.; Williams, P.I.; Morgan, W.T.; Martin, C.L.; Flynn, M.J.; Lee, J.; Nemitz, E.; Phillips, G.J.; Gallagher, M.W.; Coe, H. Contributions from transport, solid fuel burning and cooking to primary organic aerosols in two UK cities. Atmos. Chem. Phys. 2010, 10, 647–668. [Google Scholar] [CrossRef]
- Healy, C.R.M.; Hellebust, S.; Kourtchev, I.; Allanic, A.; O’Connor, I.P.; Bell, J.M.; Healy, D.A.; Sodeau, J.R.; Wenger, J.C. Source apportionment of PM2.5 in Cork Harbour, Ireland using a combination of single particle mass spectrometry and quantitative semi-continuous measurements. Atmos. Chem. Phys. 2010, 10, 9593–9613. [Google Scholar] [CrossRef] [Green Version]
- Schauer, J.J.; Kleeman, M.J.; Cass, G.R.; Simoneit, B.R.T. Measurement of emissions from air pollution sources. 3. C1–C29 organic compounds from fireplace combustion of wood. Environ. Sci. Technol. 2001, 35, 1716–1728. [Google Scholar] [CrossRef] [PubMed]
- Harrison, R.M.; Beddows, D.C.S.; Hu, L.; Yin, J. Comparison of methods for evaluation of wood smoke and estimation of UK ambient concentrations. Atmos. Chem. Phys. 2012, 12, 8271–8283. [Google Scholar] [CrossRef]
- Cahill, T. Size-resolved organic speciation of wintertime aerosols in California’s Central Valley. Environ. Sci. Technol. 2010, 44, 2315–2321. [Google Scholar] [CrossRef] [PubMed]
- Sandradewi, J.; Prévôt, A.S.H.; Szidat, S.; Perron, N.; Alfarra, M.R.; Lanz, V.A.; Weingartner, E.; Baltensperger, U. Using Aerosol Light Absorption Measurements for the Quantitative Determination of Wood Burning and Traffic Emission Contributions to Particulate Matter. Environ. Sci. Technol. 2008, 42, 3316–3323. [Google Scholar] [CrossRef] [PubMed]
- Zhang, T.; Cao, J.J.; Chow, J.C.; Shen, Z.-X.; Ho, K.-F.; Sai, S.; Ho, H. Characterization and seasonal variations of levoglucosan in fine particulate matter in Xi’an, China. J. Air Waste Manag. Assoc. 2014, 64, 1317–1327. [Google Scholar] [CrossRef] [PubMed]
- Reche, C.; Viana, M.; Amato, F.; Alastuey, A.; Moreno, T.; Hillamo, R.; Teinilä, K.; Saarnio, K.; Seco, R.; Peñuelas, J.; et al. Biomass burning contributions to urban aerosols in a coastal Mediterranean City. Sci. Total Environ. 2012, 427–428, 175–190. [Google Scholar] [CrossRef] [PubMed]
- Holnicki, P.; Kałuszko, A.; Nahorski, Z.; Stankiewicz, K.; Trapp, W. Air quality modeling for Warsaw agglomeration. Arch. Environ. Protect. 2017, 43, 48–64. [Google Scholar] [CrossRef]
- Harrison, R.M.; Yin, J. Sources and processes affecting carbonaceous aerosol in central England. Atmos. Environ. 2008, 42, 1413–1423. [Google Scholar] [CrossRef]
- Lanz, V.A.; Prévôt, A.S.H.; Alfarra, M.R.; Weimer, S.; Mohr, C.; DeCarlo, P.F.; Gianini, M.F.D.; Hueglin, C.; Schneider, J.; Favez, O.; et al. Characterization of aerosol chemical composition with aerosol mass spectrometry in Central Europe: An overview. Atmos. Chem. Phys. 2010, 10, 10453–10471. [Google Scholar] [CrossRef]
- Pauraitė, J.; Mordas, G.; Byčenkienė, S.; Ulevicius, V. Spatial and temporal analysis of organic and black carbon mass concentrations in Lithuania. Atmosphere 2015, 6, 1229–1242. [Google Scholar] [CrossRef]
- Saarnio, K.; Aurela, M.; Timonen, H.; Saarikoski, S.; Teinilä, K.; Mäkelä, T.; Sofiev, M.; Koskinen, J.; Aalto, P.P.; Kulmala, M.; et al. Chemical composition of fine particles in fresh smoke plumes from boreal wild-land fires in Europe. Sci. Total Environ. 2010, 405, 2527–2542. [Google Scholar] [CrossRef] [PubMed]
- WHO. Air Quality Guidelines: Global Update 2005: Particulate Matter, Ozone, Nitrogen Dioxide and Sulfur Dioxide; World Health Organization: Copenhagen, Denmark, 2006. [Google Scholar]
- Cavalli, F.; Viana, M.; Yttri, K.E.; Genberg, J.; Putaud, J.-P. Toward a standardized thermal-optical protocol for measuring atmospheric organic and elemental carbon: The EUSAAR Protocol. Atmos. Meas. Tech. 2010, 3, 79–89. [Google Scholar] [CrossRef] [Green Version]
- Koch, D.; Del Genio, A.D. Black carbon semi-direct effects on cloud cover: Review and synthesis. Atmos. Chem. Phys. 2010, 10, 7685–7696. [Google Scholar] [CrossRef] [Green Version]
- Laborde, M.; Crippa, M.; Tritscher, T.; Jurányi, Z.; Decarlo, P.F.; Temime-Roussel, B.; Marchand, N.; Eckhardt, S.; Stohl, A.; Baltensperger, U.; et al. Black carbon physical properties and mixing state in the European megacity Paris. Atmos. Chem. Phys. 2013, 13, 5831–5856. [Google Scholar] [CrossRef] [Green Version]
- Yttri1, K.E.; Aas, W.; Bjerke, A.; Cape, J.N.; Cavalli, F.; Ceburnis, D.; Dye, C.; Emblico, L.M.; Facchini, C.; Forster, C.; et al. Elemental and organic carbon in PM10: A one year measurement campaign within the European Monitoring and Evaluation Programme EMEP. Atmos. Chem. Phys. 2007, 7, 5711–5725. [Google Scholar] [CrossRef]
- Hoffmann, T.; Warnke, J. Organic Aerosols. In Volatile Organic Compounds in the Atmosphere; Koppmann, R., Ed.; Blackwell Publishing Ltd.: Oxford, UK, 2007; pp. 342–387. [Google Scholar]
- Gelencsér, A.; May, B.; Simpson, D.; Sánchez-Ochoa, A.; Kasper-Giebl, A.; Puxbaum, H.; Caseiro, A.; Pio, C.; Legrand, M. Source apportionment of PM2.5 organic aerosol over Europe: Primary/secondary, natural/anthropogenic, fossil/biogenic origin. J. Geophys. Res. 2007, 112. [Google Scholar] [CrossRef]
- Watson, J.G.; Chow, J.C.; Houck, J.E. PM2.5 chemical source profiles for vehicle exhaust, vegetative burning, geological material, and coal burning in northwestern Colorado during 1995. Chemosphere 2001, 43, 1141–1151. [Google Scholar] [CrossRef]
- Kleeman, M.J.; Schauer, J.J.; Cass, G.R. Size and composition distribution of fine particulate matter emitted from motor vehicles. Environ. Sci. Technol. 2000, 34, 1132–1142. [Google Scholar] [CrossRef]
- Funasaka, K.; Miyazaki, T.; Tsuruho, K.; Tamura, K.; Mizuno, T.; Kuroda, K. Relationship between indoor and outdoor carbonaceous particulates in roadside households. Environ. Pollut. 2000, 110, 127–134. [Google Scholar] [CrossRef]
- Szidat, S.; Jenk, T.M.; Synal, H.; Kalberer, M.; Wacker, L.; Hajdas, I.; Kasper-Giebl, A.; Baltensperger, U. Contributions of fossil fuel, biomass burning, and biogenic emissions to carbonaceous aerosols in Zürich as traced by 14C. J. Geophys. Res. 2006, 111. [Google Scholar] [CrossRef]
- Cong, Z.; Kang, S.; Kawamura, K.; Liu, B.; Wan, X.; Wang, Z.; Gao, S.; Fu, P. Carbonaceous aerosols on the south edge of the Tibetan Plateau: Concentrations, seasonality and sources. Atmos. Chem. Phys. 2015, 15, 1573–1584. [Google Scholar] [CrossRef]
- Philip, S.; Martin, R.V.; Pierce, J.R.; Jimenez, J.L.; Zhang, Q.; Canagaratna, M.R.; Spracklen, D.V.; Nowlan, C.R.; Lamsal, L.N.; Cooper, M.J.; et al. Spatially and seasonally resolved estimate of the ratio of organic matter to organic carbon. Atmos. Environ. 2014, 87, 34–40. [Google Scholar] [CrossRef]
- Ni, H.; Han, Y.; Cao, J.; Chen, L.W.A.; Tian, J.; Wang, X.; Chow, J.C.; Watson, J.G.; Wang, Q.; Wang, P.; et al. Emission characteristics of carbonaceous particles and trace gases from open burning of crop residues in China. Atmos. Environ. 2015, 123, 399–406. [Google Scholar] [CrossRef]
- Castro, L.M.; Pio, C.A.; Harrison, R.M.; Smith, D.J.T. Carbonaceous aerosol in urban and rural European atmospheres: Estimation of secondary organic carbon concentrations. Atmos. Environ. 1999, 33, 2771–2781. [Google Scholar] [CrossRef]
- Gianoni, M.; Martellini, T.; Del Bubba, M.; Gambaro, A.; Zangrando, R.; Chiari, M.; Lepri, L.; Cincinelli, A. The use of levoglucosan for tracing biomass burning in PM2.5 samples in Tuscany (Italy). Environ. Pollut. 2012, 167, 7–15. [Google Scholar] [CrossRef] [PubMed]
- Urban, R.C.; Lima-Souza, M.; Caetano-Silva, L.; Queiroz, M.E.C.; Nogueira, R.F.P.; Allen, A.G.; Cardoso, A.A.; Held, G.; Campos, M.L.A.M. Use of levoglucosan, potassium, and water-soluble organic carbon to characterize the origins of biomass-burning aerosols. Atmos. Environ. 2012, 61, 562–569. [Google Scholar] [CrossRef]
- Engling, G.; Lee, J.J.; Sie, H.-J.; Wu, Y.-C.; Yet-Pole, I. Anhydrosugar characteristics in biomass smoke aerosoldcase study of environmental influence on particle-size of rice straw burning aerosol. J. Aerosol. Sci. 2013, 56, 2–14. [Google Scholar] [CrossRef]
- Kourtchev, I.; Hellebust, S.; Bell, J.M.; O’Connor, I.P.; Healy, R.M.; Allanic, A.; Healy, D.; Wenger, J.C.; Sodeau, J.R. The use of polar organic compounds to estimate the contribution of domestic solid fuel combustion and biogenic sources to ambient levels of organic carbon and PM2.5 in Cork Harbour, Ireland. Sci. Total Environ. 2011, 409, 2143–2155. [Google Scholar] [CrossRef] [PubMed]
- Hennigan, C.J.; Sullivan, A.P.; Collett, J.L.; Robinson, A.L. Levoglucosan stability in biomass burning particles exposed to hydroxyl radicals. Geophys. Res. Lett. 2010, 37. [Google Scholar] [CrossRef]
- Hoffmann, D.; Tilgner, A.; Iinuma, Y.; Hermann, H. Atmospheric stability of levoglucosan: A detailed laboratory and modeling study. Environ. Sci. Technol. 2010, 44, 694–699. [Google Scholar] [CrossRef] [PubMed]
- Lai, C.; Liu, Y.; Ma, J.; Ma, Q.; He, H. Degradation kinetics of levoglucosan initiated by hydroxyl radical under different environmental conditions. Atmos. Environ. 2014, 91, 32–39. [Google Scholar] [CrossRef]
- Sullivan, A.P.; Holden, A.S.; Patterson, L.A.; McMeeking, G.R.; Kreidenweis, S.M.; Malm, W.C.; Hao, W.M.; Wold, C.E.; Collett, J.L. A method for smoke marker measurements and its potential application for determining the contribution of biomass burning from wildfires and prescribed fires to ambient PM2.5 organic carbon. J. Geophys. Res. 2008, 113. [Google Scholar] [CrossRef]
- Puxbaum, H.; Caseiro, A.; Sanchez-Ochoa, A.; Kasper-Giebl, A.; Claeys, M.; Gelencser, A.; Legrand, M.; Preunkert, S.; Pio, C. Levoglucosan levels at background sites in Europe for assessing the impact of biomass combustion on the European aerosol background. J. Geophys. Res. 2007, 112. [Google Scholar] [CrossRef]
Figure 1.
Sampling site position.
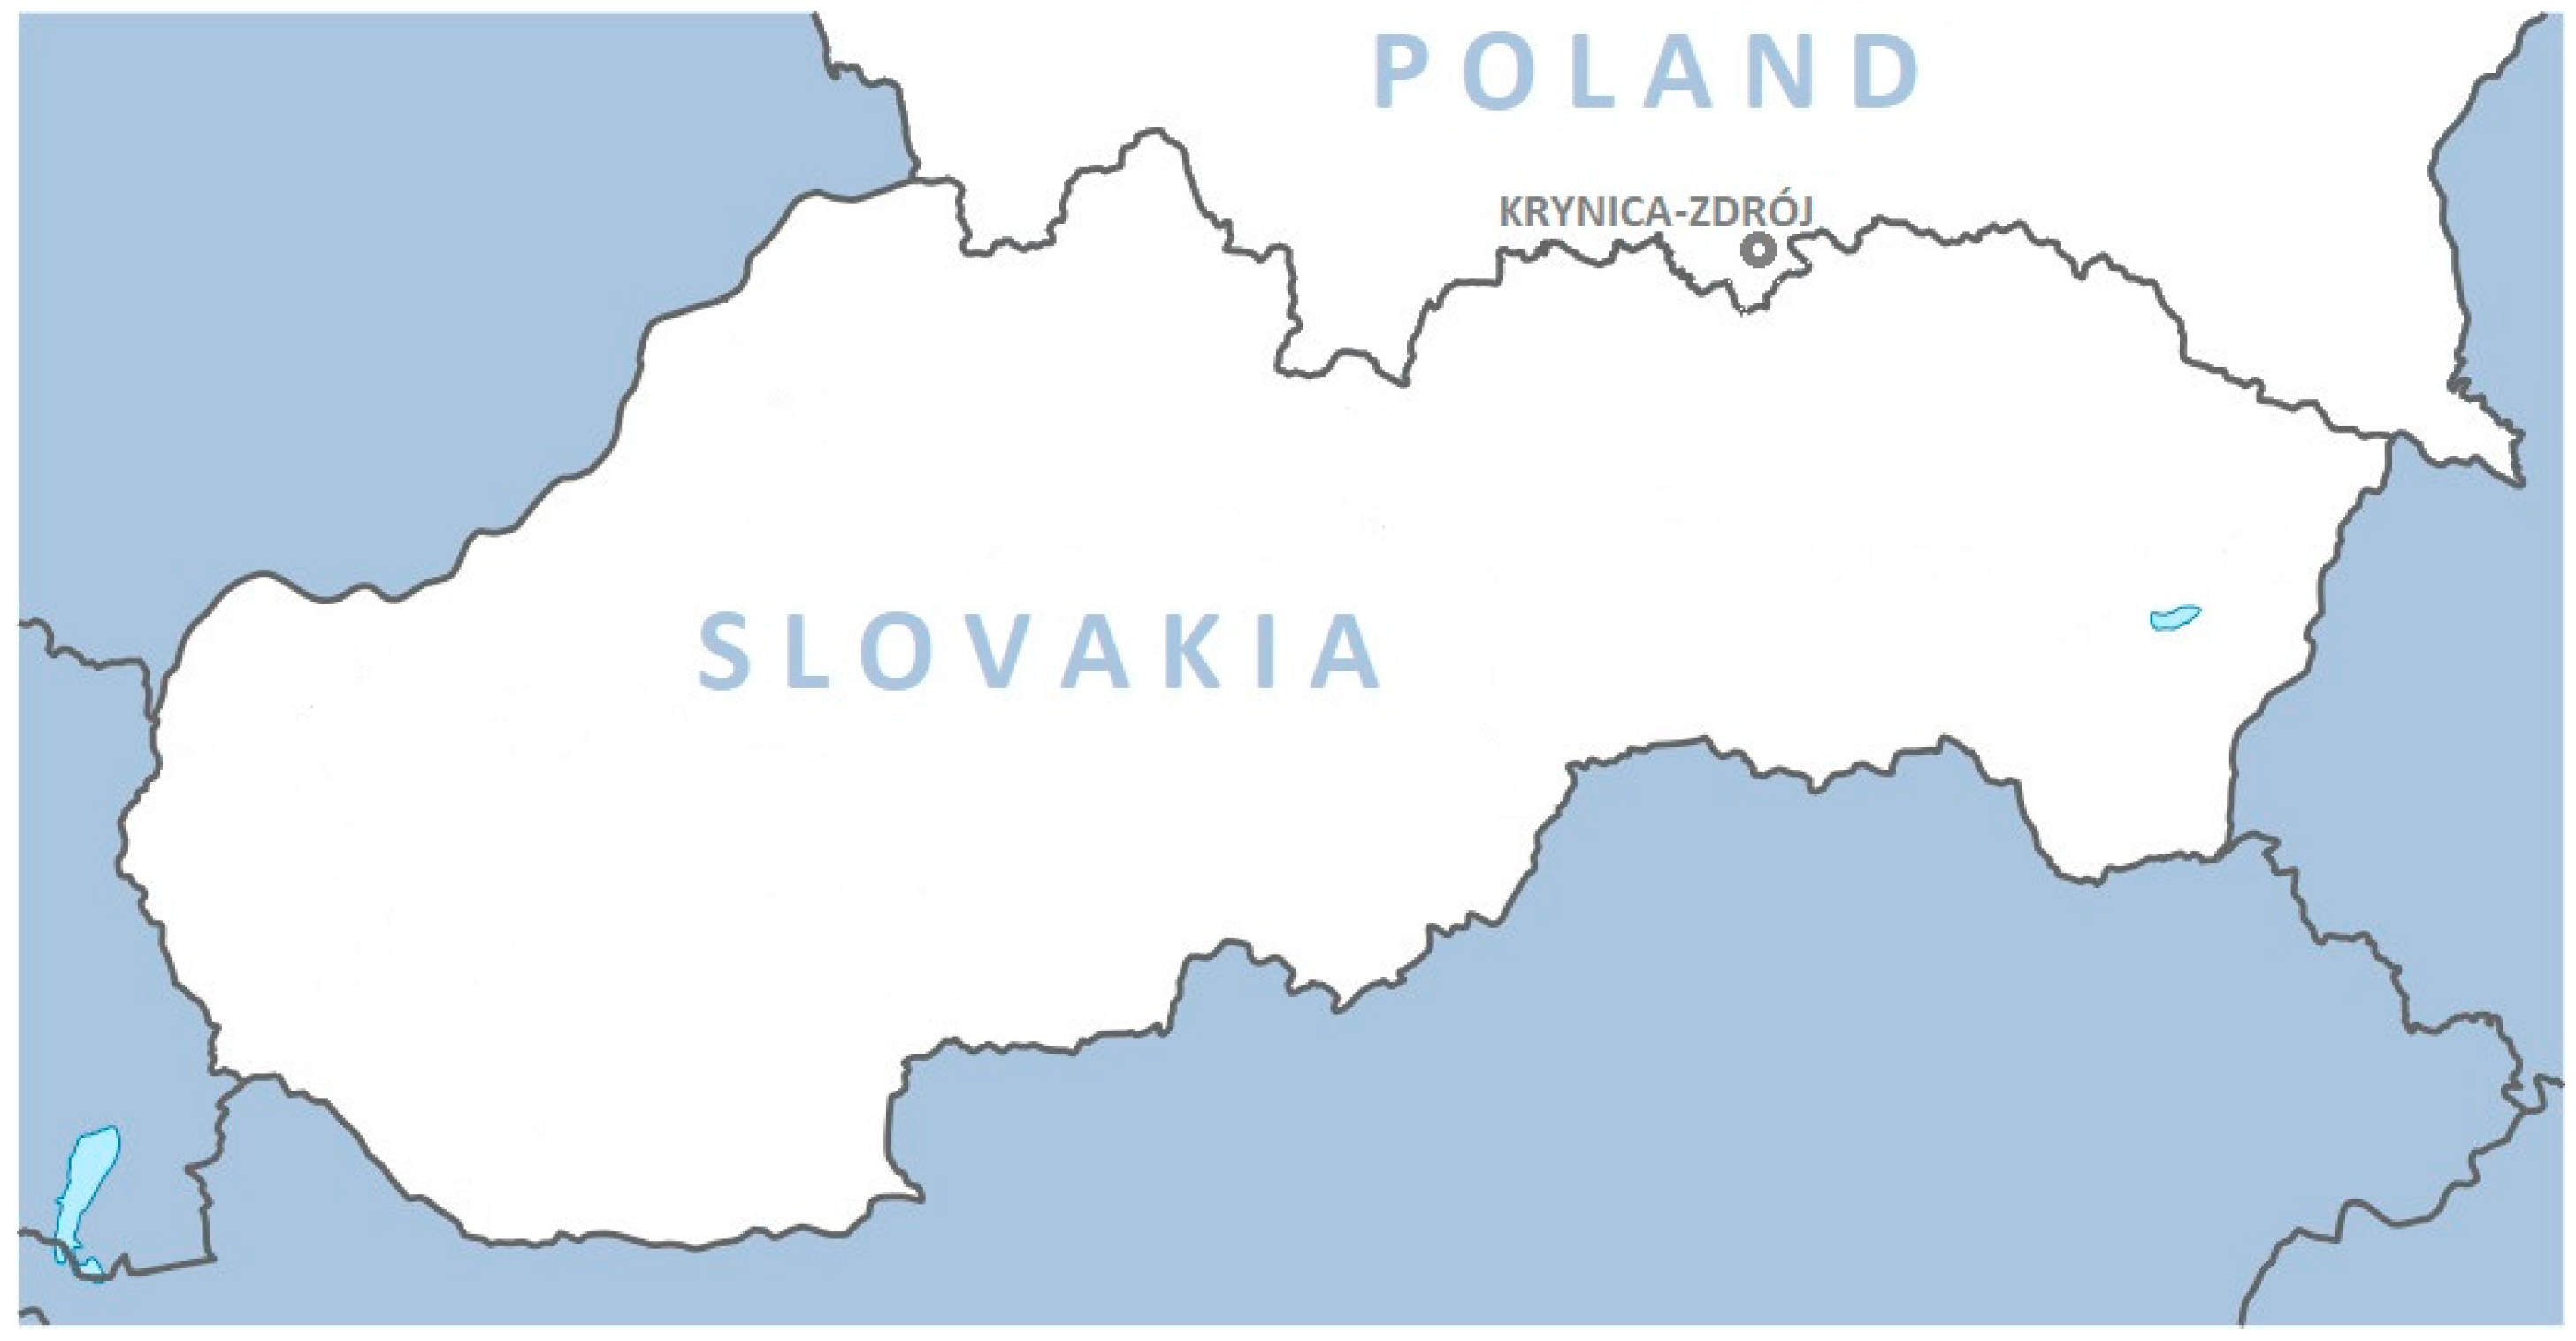
Figure 2.
Seasonal variation of PM10 concentrations and temperature at the site.
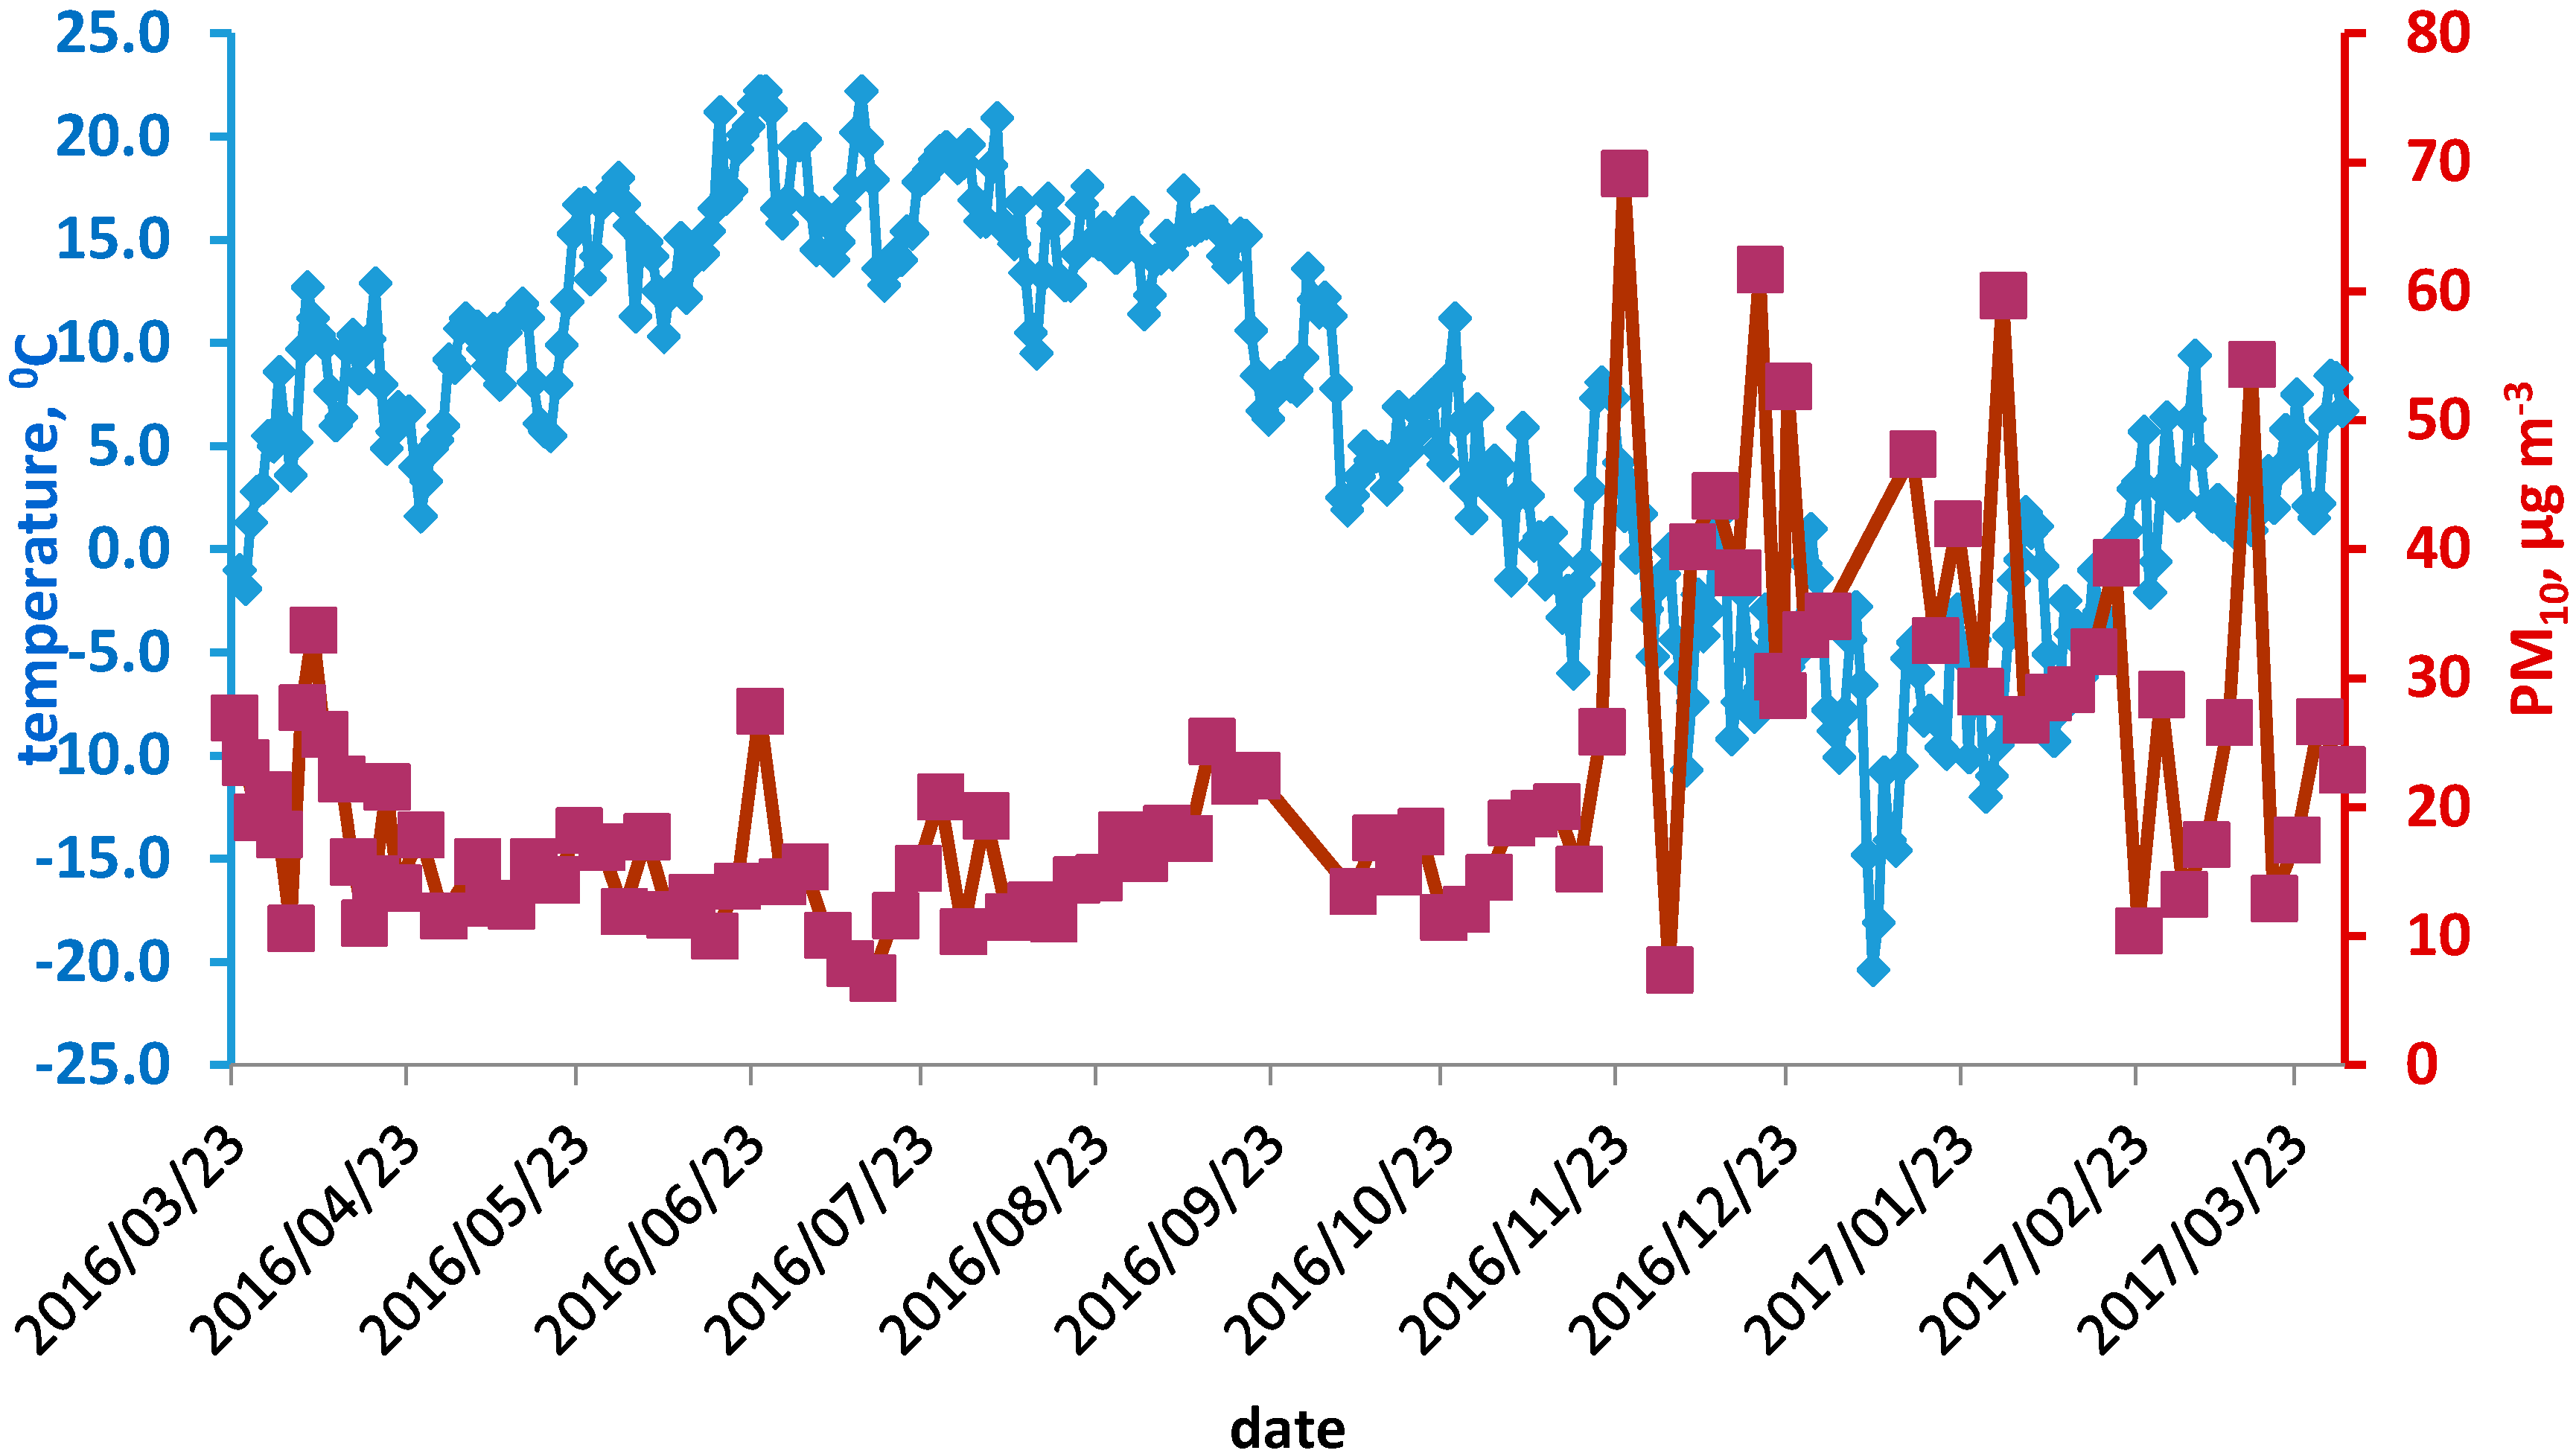
Figure 3.
Monthly mean variation of the TC/PM10 ratio.

Figure 4.
Seasonal variation of EC, OC, and TC from March 2016 to April 2017.

Figure 5.
Relationship EC vs. OC for the heating and non-heating seasons.
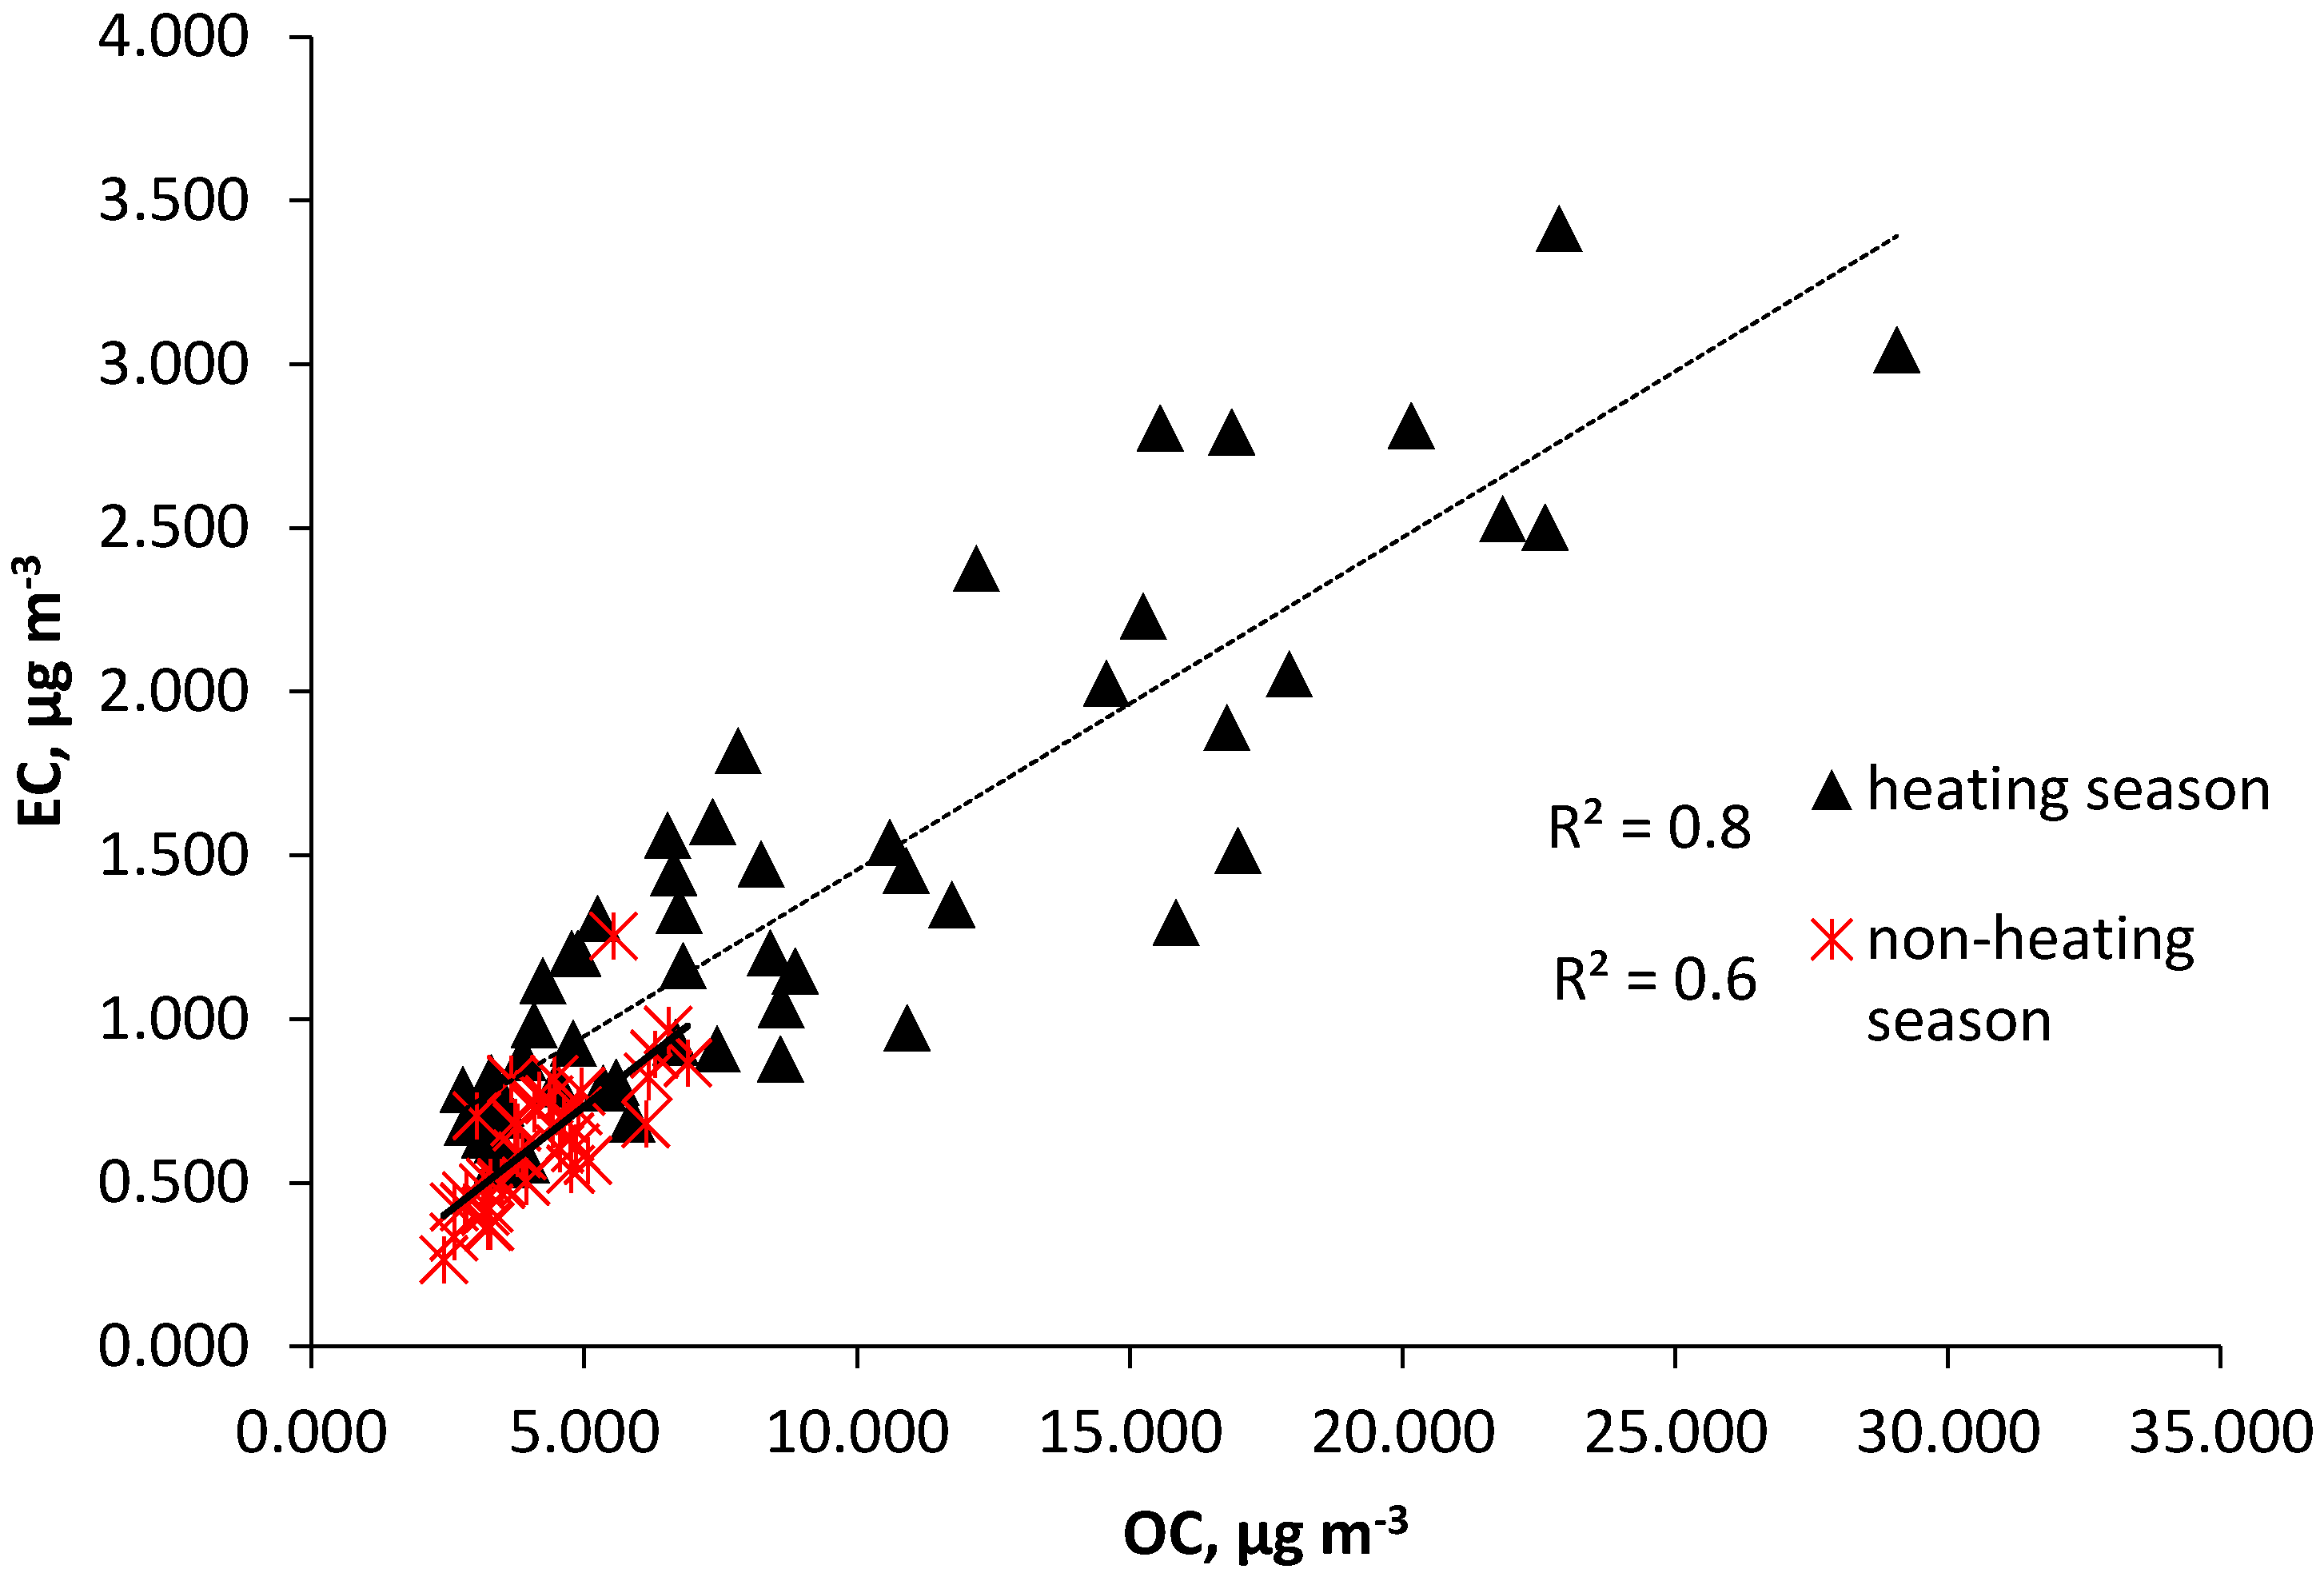
Figure 6.
Monthly mean variation of the OC/EC ratio.

Figure 7.
Seasonal variation of levoglucosan concentration at the site.

Figure 8.
Relationship LG vs. TC for non-heating and heating season.
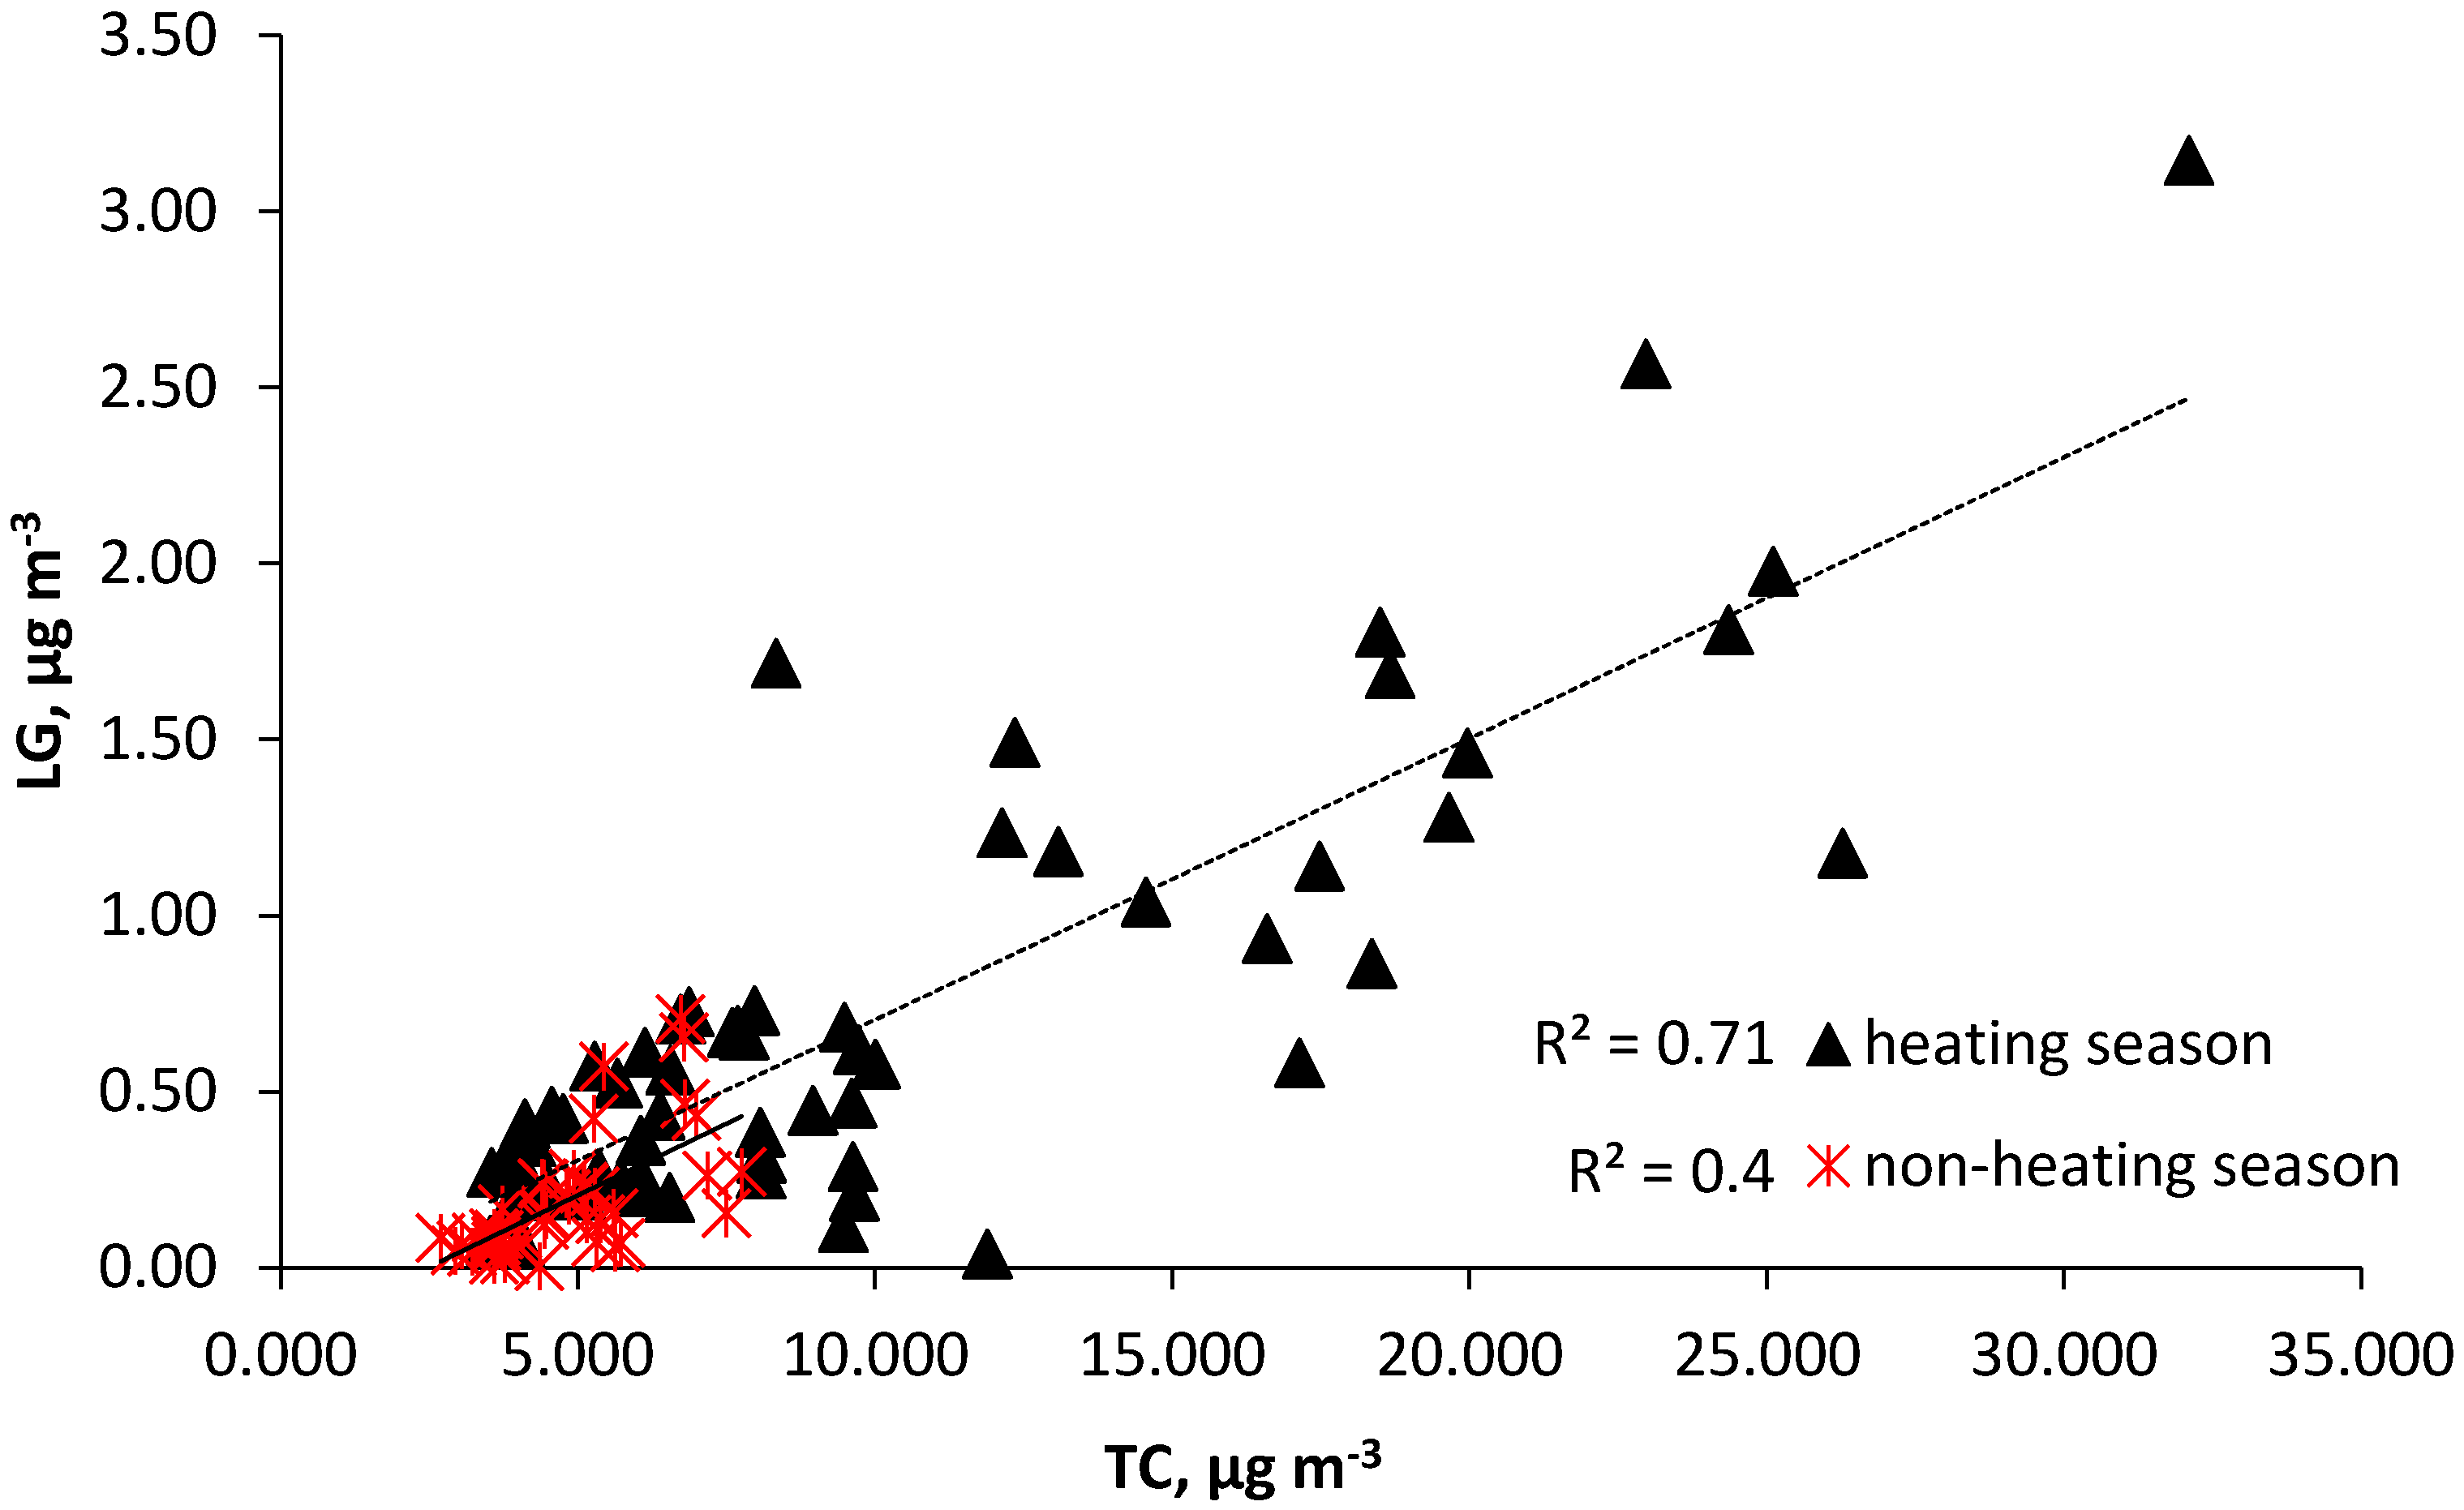
Figure 9.
Relationship LG vs. OC for the heating and non-heating seasons.

Table 1.
Meteorological parameters.
| Parameter | Heating Season 25 March 2016–21 April 2016 and 26 September 2016–30 March 2017 | Non-Heating Season 22 April 2016–25 September 2016 |
|---|---|---|
| Average air temperature, T (°C) | 0.6 ± 6.4 | 14.1 ± 4.2 |
| Average relative humidity (%) | 84.0 ± 5.1 | 77.6 ± 4.7 |
| Average wind speed (m/s) | 1.8 ± 1.2 | 1.6 ± 0.9 |
| Cumulative rainfall (mm) | 447.9 (108 rain days) | 437.4 (77 rain days) |
Table 2.
The average concentration of PM10 (µg∙m−3), EC (µg∙m−3), OC (µg∙m−3), and levoglucosane (µg∙m−3) during the heating and non-heating periods at the site of Krynica Zdroj.
Table 2.
The average concentration of PM10 (µg∙m−3), EC (µg∙m−3), OC (µg∙m−3), and levoglucosane (µg∙m−3) during the heating and non-heating periods at the site of Krynica Zdroj.
| Parameter | Mean (SD) | Max | Min |
|---|---|---|---|
| PM10 | 21.9 (12.3) | 69.2 | 6.7 |
| Heating season | 31.0 (15.2) | 69.2 | 7.4 |
| Non-heating season | 15.3 (4.5) | 25.1 | 6.7 |
| EC | 1.1 (0.66) | 3.42 | 0.26 |
| Heating season | 1.34 (0.69) | 3.42 | 0.63 |
| Non-heating season | 0.64 (0.21) | 1.11 | 0.26 |
| OC | 7.00 (5.28) | 29.10 | 2.61 |
| Heating season | 8.82 (6.18) | 29.10 | 2.77 |
| Non-heating season | 4.21 (1.14) | 6.54 | 2.61 |
| Levoglucosan | 0.51 (0.57) | 1.72 | 0.02 |
| Heating season | 0.78 (0.65) | 1.72 | 0.04 |
| Non-heating season | 0.18 (0.15) | 0.66 | 0.02 |
Table 3.
The annual mean of total carbon to ambient aerosol (TC/PM10), elemental carbon to total carbon (EC/TC), organic carbon to total carbon (OC/TC), organic carbon to elemental carbon (OC/EC), and levoglucosan to organic carbon (LG/OC) ratios for 102 samples.
Table 3.
The annual mean of total carbon to ambient aerosol (TC/PM10), elemental carbon to total carbon (EC/TC), organic carbon to total carbon (OC/TC), organic carbon to elemental carbon (OC/EC), and levoglucosan to organic carbon (LG/OC) ratios for 102 samples.
| Ratio | Mean | Max | Min |
|---|---|---|---|
| TC/PM10 | 0.35 | 0.59 | 0.19 |
| EC/TC | 0.14 | 0.21 | 0.08 |
| OC/TC | 0.86 | 0.92 | 0.79 |
| OC/EC | 6.7 | 12.2 | 4.3 |
| LG/OC | 0.070 | 0.065 | 0.043 |
© 2017 by the authors. Licensee MDPI, Basel, Switzerland. This article is an open access article distributed under the terms and conditions of the Creative Commons Attribution (CC BY) license (http://creativecommons.org/licenses/by/4.0/).
Share and Cite
MDPI and ACS Style
Klejnowski, K.; Janoszka, K.; Czaplicka, M. Characterization and Seasonal Variations of Organic and Elemental Carbon and Levoglucosan in PM10 in Krynica Zdroj, Poland. Atmosphere 2017, 8, 190. https://doi.org/10.3390/atmos8100190
AMA Style
Klejnowski K, Janoszka K, Czaplicka M. Characterization and Seasonal Variations of Organic and Elemental Carbon and Levoglucosan in PM10 in Krynica Zdroj, Poland. Atmosphere. 2017; 8(10):190. https://doi.org/10.3390/atmos8100190
Chicago/Turabian StyleKlejnowski, Krzysztof, Katarzyna Janoszka, and Marianna Czaplicka. 2017. "Characterization and Seasonal Variations of Organic and Elemental Carbon and Levoglucosan in PM10 in Krynica Zdroj, Poland" Atmosphere 8, no. 10: 190. https://doi.org/10.3390/atmos8100190
Note that from the first issue of 2016, this journal uses article numbers instead of page numbers. See further details here.