Moisture Transport Anomalies over the Danube River Basin during Two Drought Events: A Lagrangian Analysis


1
Environmental Physics Laboratory (EPhysLab), Facultade de Ciencias, Universidad de Vigo, 32004 Ourense, Spain
2
Department of Atmospheric Sciences, Institute of Astronomy, Geophysics, and Atmospheric Sciences, University of São Paulo, São Paulo 05508-090, Brazil
*
Author to whom correspondence should be addressed.
Atmosphere 2017, 8(10), 193; https://doi.org/10.3390/atmos8100193
Submission received: 10 August 2017
/
Revised: 27 September 2017
/
Accepted: 28 September 2017
/
Published: 3 October 2017
(This article belongs to the Special Issue Water Vapor in the Atmosphere)
Abstract
:In this paper, we provide a Lagrangian analysis of the anomalies in the moisture transport during two important drought events (1989/1990 and 2003) configured over the Danube River Basin (DRB) region. Firstly, we identified the drought episodes that occurred over the DRB in the period of 1980–2014 through the Standardized Precipitation Evapotranspiration Index (SPEI). SPEI was calculated using monthly Climatic Research Unit (CRU) Time-Series (TS) Version 3.23 precipitation and potential evapotranspiration (PET) datasets with a spatial resolution of 0.5 degrees. The monthly SPEI-1 index was applied to identify the drought episodes and their respective indicators, including duration, severity, and intensity. Two significant drought events were selected: 1989/1990 (presenting dry conditions during October 1989–March 1990) and 2003 (presenting dry conditions during April 2003–September 2003). These events were associated with the two most severe SPEI-1 episodes identified over the DRB during 1980–2014. Then, an analysis of anomalies in the moisture transport was conducted in order to verify possible changes in the moisture supply from the climatological sources for the DRB during these episodes. The moisture transport analysis was performed through a Lagrangian approach, which uses the outputs of the FLEXiblePARTicle dispersion model FLEXPART integrated with one of the reanalysis produced by the European Centre for Medium-Range Weather Forecasts (ECMWF): the ECMWF Re-Analysis (ERA)-Interim dataset. The DRB receives moisture from seven different moisture source regions: the North Atlantic Ocean (NATL), North Africa (NAF), the Mediterranean Sea (MED), the Black Sea (BS), the Caspian Sea (CS), the DRB, and Central and Eastern Europe (Rest of Land (RestL)). The analysis of drought events shows that the precipitation and moisture supply from the selected sources weakened mainly during both drought events. Anomalous subsidence and an increased PET also prevailed over the DRB during these SPEI-1 episodes. RestL and MED registered the most intensive reduction in the moisture supply over the DRB during both periods.
1. Introduction
Water is very important for life on Earth and because of that, there is a huge interest among meteorologists and hydrologists to understand the basic elements of the hydrological cycle [1,2,3]. The main drivers of variability in the water balance are precipitation and evaporation. Climate change is one of the major threats of the 21st century, and according to the Intergovernmental Panel on Climate Change (IPCC) reports (IPCC, 2013), the mean surface temperature will rise globally, which will have consequences for the global hydrological cycle, and it will contribute to water scarcity. Previous studies on precipitation variability have shown decreasing trends in Central and Southeastern Europe and increasing trends in Northern Europe in the last few years [4,5]. Evaporation is projected to increase in Central and Southeastern Europe, and it can have an impact on the soil moisture, water balance, river runoff, and groundwater resources [6].
Rivers constitute an important part of the global hydrological cycle. They have multiple functions, serving as a source of energy and natural resources for transportation, agriculture, and industry, and they have a significant role in the ecological balance [4,7,8]. River flows are highly sensitive, especially to changes in precipitation and evaporation, and information about the potential effects of climate change on river flows is needed for long-term planning and adaptation [9].
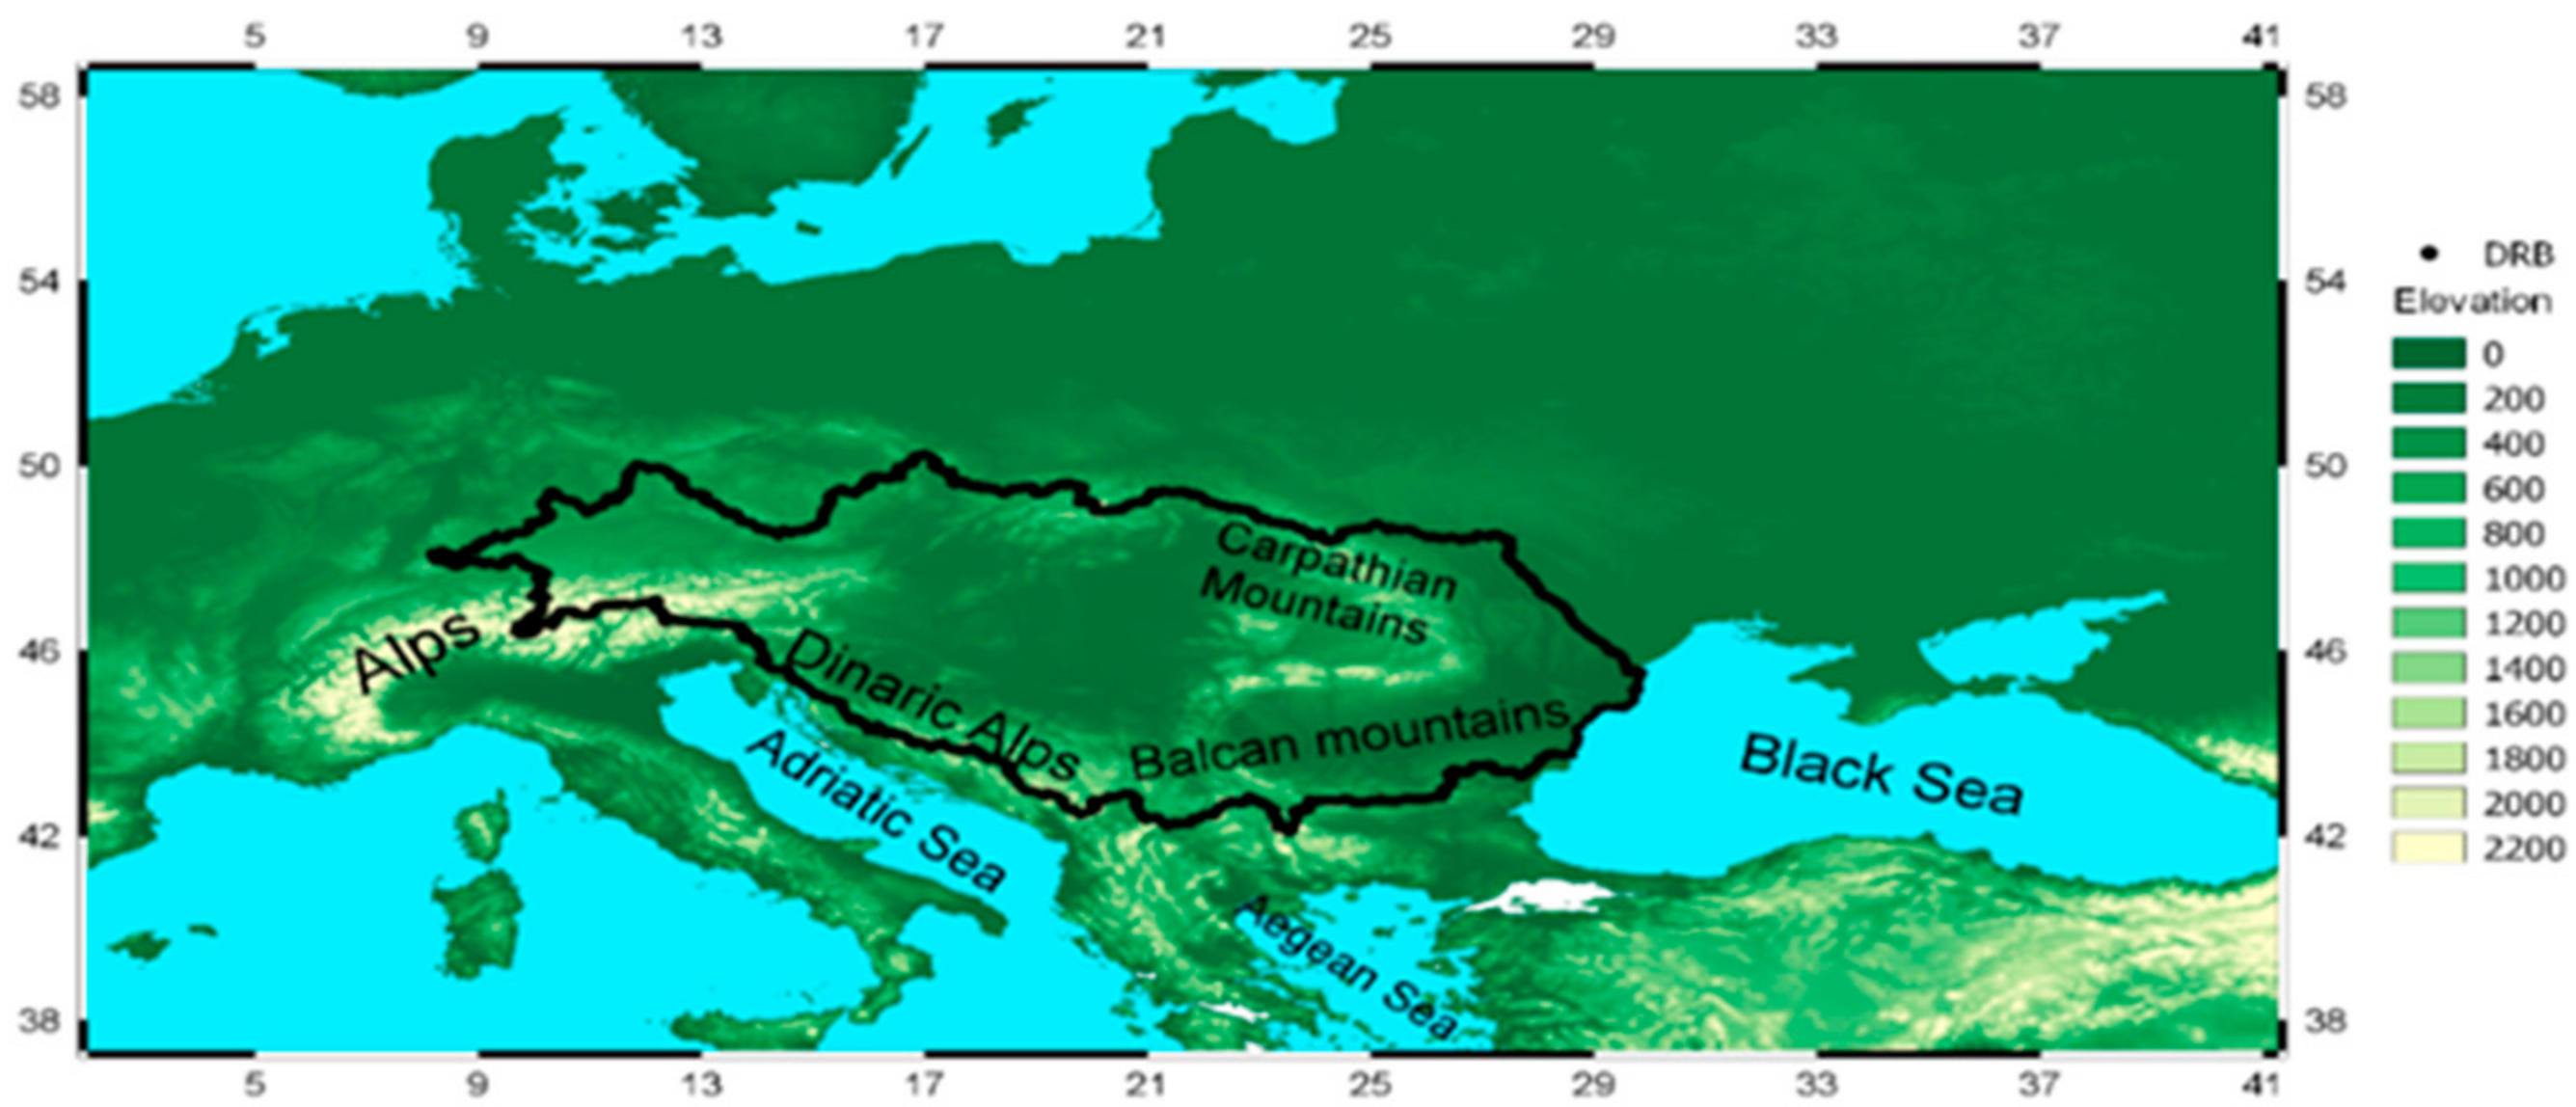
The Danube is one of the most important European waterways, and has a very large drainage area of 817,000 km2 extending from Central to Southeastern Europe (Figure 1). It is one of the most international river basins. From the Schwarzwald Mountains in Germany to the Black Sea in Romania, the Danube river flows through 19 countries (Germany, Austria, Slovakia, Hungary, Croatia, Serbia, Montenegro, Romania, Bulgaria, Moldova, Ukraine, Poland, Czech Republic, Switzerland, Italy, Slovenia, Bosnia-Herzegovina, Albania, and Macedonia) [10]. The Danube has a manifold importance in the ecological balance of the region and a significant socio-economic role in industry activity, agriculture, and domestic fresh water supplies [8,10]. It is characterized by a diverse topography. The region is divided into three characteristic morphological and climatic regions: the southern Dinaric–Balkan mountain chains, the western Alps, and the eastern Carpathian mountain bow (Figure 1). These mountain chains receive the highest annual precipitation of about 2000 mm per year. In contrast, the plains (the Vienna basin, Pannonian basin, and the Romanian and Prut low plains) are extremely dry and receive about 500 mm per year. Evaporation is also very significant for the water balance in the Danube drainage area, especially in the lowlands where the mean annual evaporation is estimated to be between 450 and 650 mm per year, and water and moisture from rivers in the wet mountains can help to balance the evaporation deficits [10].
Many studies have pointed out the effect of precipitation and temperature changes on the Danube flow regime and the possible impacts on water resources and extreme hydrological events, such as floods and droughts, which will be more intensive and more frequent in the Danube River Basin (DRB) [11,12]. During the twentieth century, the climate in Central and Eastern Europe has been characterized by an overall temperature increase, and the beginning of the 21st century is marked by the occurrence of severe and prolonged drought episodes [13]. One of the causes for the occurrence of drought could be the anomalies in the moisture transport, and because of that, understanding the source–sink relationships in the atmospheric water cycle is very important due to the role that they play in extreme meteorological events [14].
Ciric et al. [7] presented the climatology of the major sources of moisture for the DRB during the period of 1980–2014 using a Lagrangian approach and data from the reanalysis produced by the European Centre for Medium-Range Weather Forecasts (ECMWF): the ECMWF Re-Analysis (ERA)-Interim. The DRB receives moisture from seven major moisture source regions: the North Atlantic Ocean (NATL), North Africa (NAF), the Mediterranean Sea (MED), the Black Sea (BS), the Caspian Sea (CS), the DRB, and Central and Eastern Europe (Rest of Land (RestL)) (Figure 2). They also found that the main moisture source during the winter (October–March) for the DRB is the Mediterranean Sea, while during summer (April–September) the principal source of moisture is the DRB itself. The importance of the Mediterranean Sea as a moisture source for the region has been pointed out in previous Lagrangian studies. Using a previous version of the Lagrangian approach applied by Ciric et al. [7] and the ECMWF analysis data, Drumond et al. [15] investigated the seasonal variations in moisture sources for different Mediterranean target regions for 2000–2004, showing that the Mediterranean Sea is the main moisture source for the Balkan Peninsula. Gomez-Hernandez et al. [16] extended Drumond et al. [15] for a 21-year period (using the ERA-40 reanalysis data set) and identified the main moisture sources and sinks over the Mediterranean region, pointing out the role of the Central Mediterranean Sea as the dominant moisture source for the Balkan Peninsula during the winter season. Applying a different Lagrangian approach integrated with data from the ERA-40 reanalysis from 1995 to 2002, Sodemann et al. [17] showed the major importance of the Mediterranean as a moisture source for precipitation events in the Southern Alps.
The main objectives of this study are (1) to rank meteorological drought events over the DRB that occurred in the period of 1980–2014 through the standardized precipitation evapotranspiration index (SPEI) [18] and (2) to analyse anomalies in the moisture supply for the two most severe meteorological drought events over the DRB using a Lagrangian approach [19,20]. In Section 2, the data and methodology are explained; Section 3 presents the results and discussion; Section 4 summarizes the conclusions.
2. Data and Method
2.1. Using SPEI-1(One-Month Standardized Precipitation Evapotranspiration Index) to Identify Meteorological Drought Events over the DRB
Generally, drought may be defined as a natural hazard related to a prolonged lack of precipitation, which can have impacts on different types of systems (economy, ecology, agriculture, forestry, etc.) [21].There is no universally accepted definition of drought. It is possible to define drought in meteorological terms (the magnitude of a precipitation shortfall and the duration of this shortfall event), agricultural terms (referring to a period with low soil moisture, which leads to reduced crop production and plant growth), hydrological terms (low river flows and low water levels in rivers, lakes, and groundwater) and socioeconomic terms (based on the process of the supply and demand of some economic good with elements of meteorological, hydrological, and agricultural drought) [21,22,23,24,25,26]. Meteorological drought can be considered as the primary cause of a drought, while the other types of drought describe secondary effects of a prolonged rainfall deficit on specific compartments (e.g., soil moisture, river flows, reservoirs, and economic sectors) [27]. Drought is a concealed phenomenon, and because of its hidden effects, it is very difficult to determine when it begins and also when it is over. Quantitative evaluation of the likelihood of occurrence and expected severity of drought is of key importance for the understanding, monitoring, and mitigation of the system.
Given the difficulty in predicting the evolution of droughts and to quantify drought in terms of its duration, severity, and intensity due to its essential nature, much effort has been invested to develop a drought indicator appropriate for drought monitoring [18,19,20,21,22,28].
A large number of studies related to the analysis and monitoring of drought has been conducted using either the Palmer drought severity index (PDSI), based on a soil-water balance equation [29], or the standardized precipitation index (SPI), a multi-scaling indicator based on a precipitation probabilistic approach. At present, the SPI is applied by the World Meteorological Organization (WMO) to monitor droughts, and its different timescales correspond to different accumulation periods of anomalous precipitation, which can be associated with different drought types, such as 1 month SPI for meteorological drought, 1–6-month SPI for agricultural drought, and 6–24-month SPI or more for hydrological drought [30].
The recently developed SPEI [20] follows the same conceptual approach of SPI, but it is based on a monthly climatic water balance (precipitation (PRE) minus potential evapotranspiration (PET)). The role of temperature through PET is considered one of the crucial advantages of the SPEI over the most widely used drought indexes. For example, it is known that meteorological drought conditions can be aggravated by high temperatures and low relative humidity [27]. The climatic water balance may be computed at various time scales (i.e., accumulation periods), and the resulting values are fit to a log-logistic probability distribution to transform the original values to standardized units that are comparable in space and time and at different SPEI time scales. The time scale over which the water deficit accumulates becomes extremely important and functionally separates hydrological, agricultural, and other types of drought. Therefore, SPEI multi-scalar characteristics also enable the identification of different drought types and impacts in the context of global warming [18,31,32,33].
In this paper, we analyze changes in the moisture supply into the DRB during the two most severe meteorological drought episodes observed in the period of 1980–2014. We have chosen the SPEI to identify the meteorological drought episodes because it relies on PRE and PET. The SPEI-1 corresponds to the water balance conditions accumulated during one month. This time scale was selected because we are interested in investigating variations in the moisture transport, which is closely related to meteorological drought [34]. The index was calculated using monthly Climatic Research Unit (CRU) Time-Series (TS) Version 3.23 precipitation and the PET dataset available at a spatial resolution of 0.5 degrees [35].
According to McKee et al. [36], a drought episode was defined as a period of one month (or more) starting with a negative SPEI value followed by a value of −1 or less and ending when SPEI returns again to positive values [36,37]. The respective episode indicators, including duration (the number of months between the start (included) and the last month (not included)), severity (the absolute value of the sum of all SPEI values during the episode), and intensity (severity divided by duration), were calculated [37,38]. The peak monthly values of SPEI registered during the episodes identified were then classified into four categories based on the classification of McKee et al. [36] for the SPI (shown in Table 1), because of the similarity in the calculation principles between SPI and SPEI.
2.2. Lagrangian Analysis of the Anomalies in the Moisture Supply during Drought Events
In the present study, we analyze anomalous moisture transport into the DRB during two severe drought events. For this purpose, we applied a Lagrangian approach [19,20] based on the FLEXiblePARTicle dispersion model FLEXPART V9.0 integrated with the ERA-Interim reanalysis data from the ECMWF [39]. This dataset has a 1° spatial resolution on 60 vertical levels from 1000 to 0.1 hPa. We have chosen the ERA-Interim data set because its performance in reproducing the hydrological cycle and the water balance closure is considered better than the other reanalysis products available, such as the ERA-40, the Modern Era Retrospective-Analysis for Research and Applications (MERRA), and the Climate Forecast System Reanalysis (CFSR) [40,41]. In addition, because the FLEXPART model requires high-quality data for wind and humidity, its application in periods prior to the significant improvement seen in the measurements in 1979 following the inclusion of satellite data should, therefore, be avoided.
A detailed comparison of different approaches applied in moisture transport analysis and the main advantages and disadvantages of the methodology applied here were discussed by Gimeno et al. [42]. Briefly mentioning some of them, one advantage is that the Lagrangian approach is suitable for establishing moisture source–sink relationships. Nevertheless, the method is mostly limited by the use of a time derivative of the humidity (unrealistic fluctuations in humidity could be considered as moisture fluxes). Such numerical errors may be minimized given the large number of particles found in each atmospheric column.
In this Lagrangian approach, the changes in specific humidity are diagnosed along trajectories, which enable the identification of the sources and sinks of moisture. The method has been supported by a long list of publications [43,44,45,46,47], and consists of dividing the global atmosphere homogeneously into finite elements of volume (for this study, nearly 2.0 million "particles") with constant mass (m), which are moved using a three-dimensional wind field. The longitude, latitude, and altitude of the particles and specific humidity (q) are registered at 6-hour intervals. The time change in specific humidity (e−p = m dq/dt) over each particle trajectory helps us to identify those particles that obtain moisture through evaporation (e) from the environment or lose it through precipitation (p). The total surface freshwater flux (E−P) associated with the tracked particles is obtained by adding up (e−p) for all of the particles existing in the atmosphere over a given area. (E) and (P) represent the rates of evaporation and precipitation per unit area, respectively. All of the particles were tracked for a period of 10 days, which is the average residence time of water vapor in the atmosphere [48].
The trajectory of the particles can be traced using a backward in time analysis with the aim to determine the moisture sources for the target area (regions where the particles gained humidity, E – P > 0). We can also conduct a forward in time analysis with the aim of identifying the sinks of the moisture transported by particles leaving a given source (sinks are the regions where the particles lost humidity E – P < 0).The reader may read [49] (and the references therein) for examples of analysis.
The climatological moisture sources for the DRB during the period of 1980–2014 were previously identified by Ciric et al. [7] through a backward experiment. In the present work, we make use of forward analyses from those sources to analyze the respective moisture supply for precipitation into the DRB. The water vapor condensed over the DRB (i.e., the moisture supply) can be then converted into surface precipitation depending on favorable dynamical conditions.
The analysis for the anomalous contribution from the moisture sources to the DRB during the drought events was achieved by calculating monthly anomalies of forward analysis for each source averaged over the DRB. In this way, we can compare the relative importance of the anomalous supply for the DRB associated with each selected moisture source. We also calculate the standardized anomaly of precipitation and PET from the CRU and the standardized anomaly of vertical velocity (omega) at 500 hPa from the ERA-Interim reanalysis, all of them averaged over the DRB area. Maps of the vertically integrated moisture flux (VIMF) and its divergence from ERA-Interim were also plotted. The VIMF is useful for illustrating the anomalous moisture flux conditions observed over the DRB region during the drought episodes.
3. Results and Discussion
3.1. Selection of the Meteorological Drought Events over DRB in the Period of 1980–2014
We identified the meteorological drought episodes over the DRB during 1980–2014 through the time scale SPEI-1, as shown in Figure 3. We identified 50 drought episodes.
Following the criteria of the identification of episodes of McKee et al. [36], Table 2 represents the top five most severe drought episodes that occurred over the DRB in the period 1980–2014 on the SPEI-1. The characteristics of the episodes, such as their duration, severity, intensity, and the peak values, are also shown in Table 2.
We selected two drought events to study in this paper, one during 2003 and another one during 1989/1990 based on the characteristics of the episodes. These events were the two most severe SPEI-1 episodes identified over the DRB during 1980–2014: from February to August 2003 (7 months) and from October 1989 to March 1990 (6 months).
The SPEI-1 for the episode 1989/1990 reached a peak of −1.72, belonging to the category severe drought, while the peak registered during the episode of 2003 exceeded −2.0, which is associated with the category extreme. Among all of the drought episodes that occurred in period 1980–2014 on the SPEI-1, the longest and the most severe was the February 2003–August 2003 episode. The episode October 1989–March 1990 on SPEI-1 was the second most severe drought episode.
3.2. Anomalous Patterns Configured during the Drought Events in 1989–1990 and 2003
3.2.1. Drought Event in 1989/1990
The drought event in 1989/1990 has been investigated by previous studies [50,51,52]. This event, which affected Southern Europe and the Mediterranean region, received considerable attention because of the impact that it had on agriculture, losses in crop yield, and water supply [50].
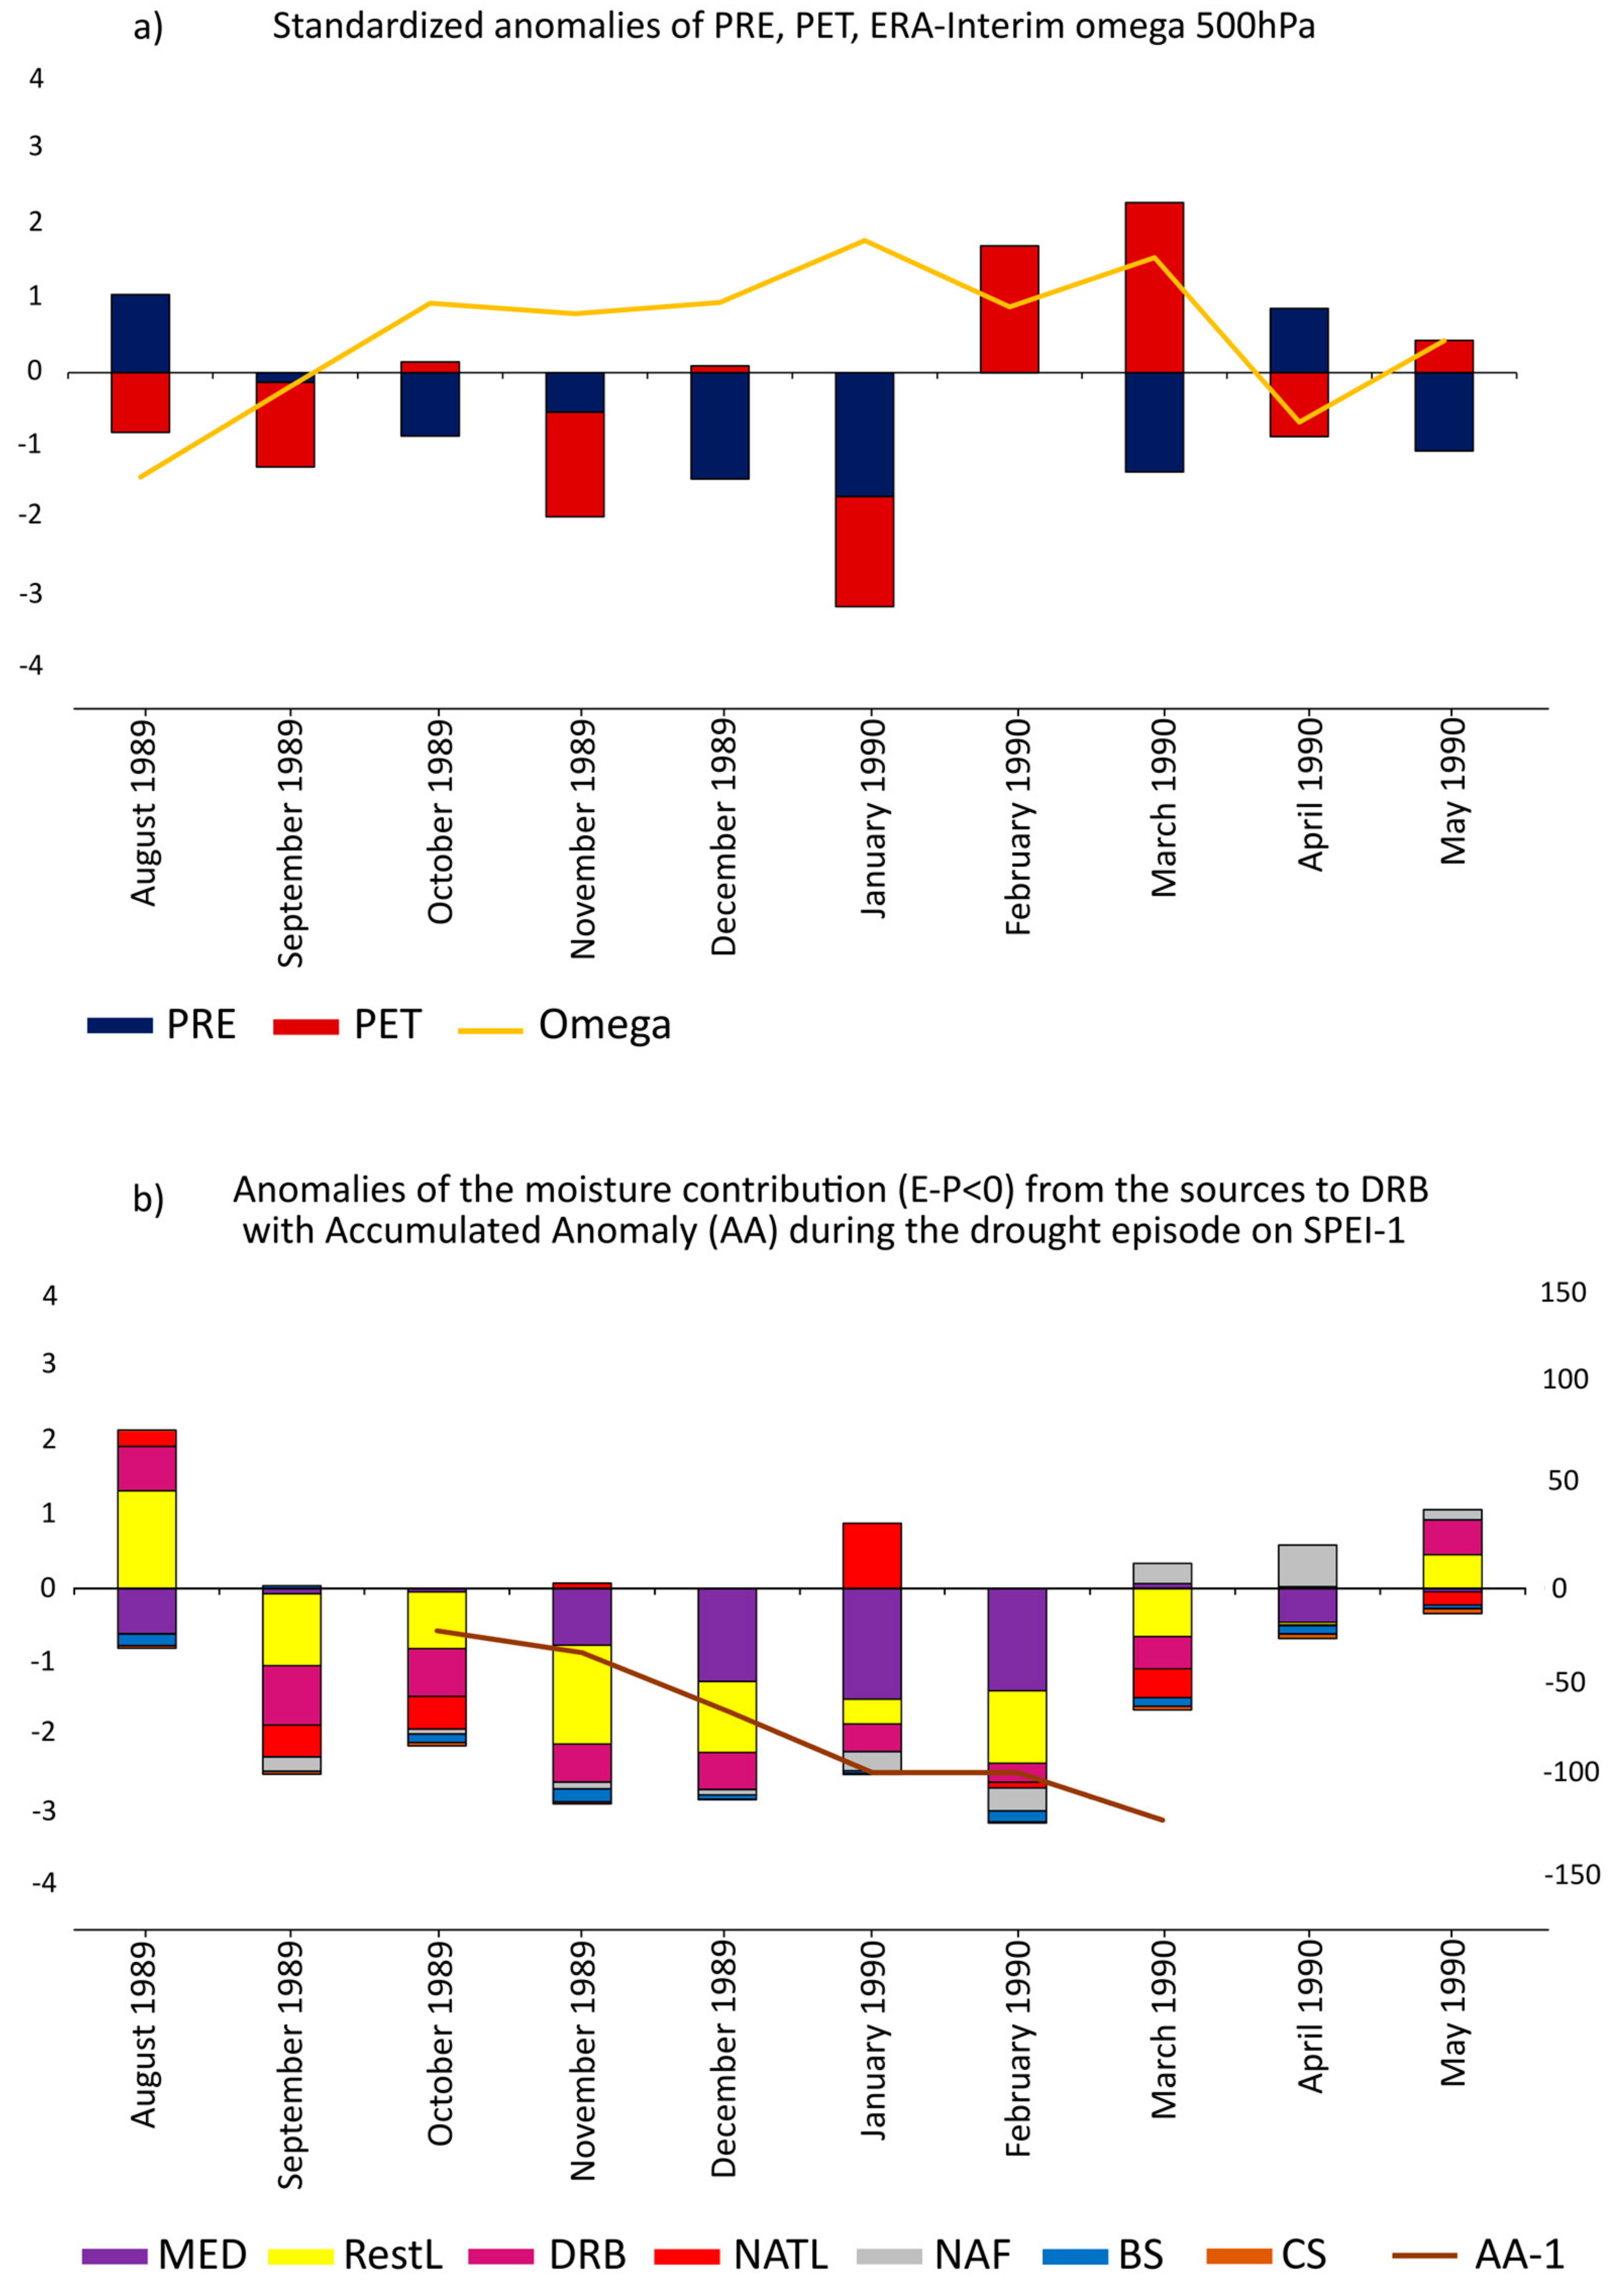
Standardized monthly anomalies of PET, PRE, and omega at 500 hPa are shown in Figure 4a. Monthly anomalies of the moisture supply (E – P < 0) over the DRB by the particles leaving the sources obtained via the forward experiment during the 1989/1990 event are shown in Figure 4b together with the precipitation anomalies accumulated during the SPEI-1 episode (AA-1) defined in Table 2. The bars shown in Figure 4b (left axis) represent the monthly anomalies of the moisture supply by the seven different moisture sources (the North Atlantic Ocean (NATL) (red), North Africa (NAF) (grey), the Mediterranean Sea (MED) (violet), the Black Sea (BS) (blue), the Caspian Sea (CS) (brown), DRB (pink), and Central and Eastern Europe (Rest of Land (RestL) (yellow bars)). For each month, the bars for each source region are superimposed to avoid cluttering. The height of each color bar (computed through the difference between the top and the bottom values of the rectangle read in the left y-axis) represents the magnitude of the anomalous contribution from the respective source. This means that larger color squares are associated with a more intensive anomalous contribution. The superimposition of the anomalous moisture supply allows us to estimate the accumulated anomalies in the moisture contribution from all the studied sources in a given month. For example, in August 1989, the highest positive anomaly was registered for RestL (yellow rectangle, 1.31 mm/day), followed by the DRB (the second largest rectangle, 0.59 mm/day), and that by the NATL was the third contribution (0.22 mm/day), reaching when they were accumulated 2.12 mm/day. On the other hand, the accumulated negative anomalies reached the value of −0.8 mm/day, and the total budget from the seven sources is 1.32 mm/day, indicating, in this particular month, a final positive anomalous support of moisture over the DRB.
From Figure 4, we can see that from September 1989 to February 1990, the moisture supply from all of the selected sources is reduced (except from the North Atlantic in November 1989 and January 1990), which is associated with negative anomalies of PRE and positive ones of omega. From March 1990 to May 1990, there is some increase in the moisture contribution from North Africa (NAF), from other terrestrial sources (RestL), and from the Danube itself. We can notice a small increase in precipitation during April 1990, but it seems that the contribution of these sources is not sufficient to maintain the positive anomaly of precipitation. It seems that the SPEI-1 episode was associated with the increasing of the negative AA-1precipitation anomalies (brown line in Figure 4b). Anomalous subsidence also prevailed during this SPEI-1 episode (positive values of omega anomalies in Figure 4a, yellow line).
The anomalies in the moisture supply by the sources for the DRB accumulated along the SPEI-1 episode are presented in Table 3, summarizing the exclusive effect of each source. In general, Table 3 shows that a reduction in the moisture supply by the studied sources prevailed during the episode, with the exception of the North Atlantic. When comparing the accumulated values from the selected sources, the results indicate that the Rest of Land source (RestL) registered the most intensive negative anomalies accumulated, followed by the Mediterranean (MED) (−4.98, and −4.85 mm/day, respectively).
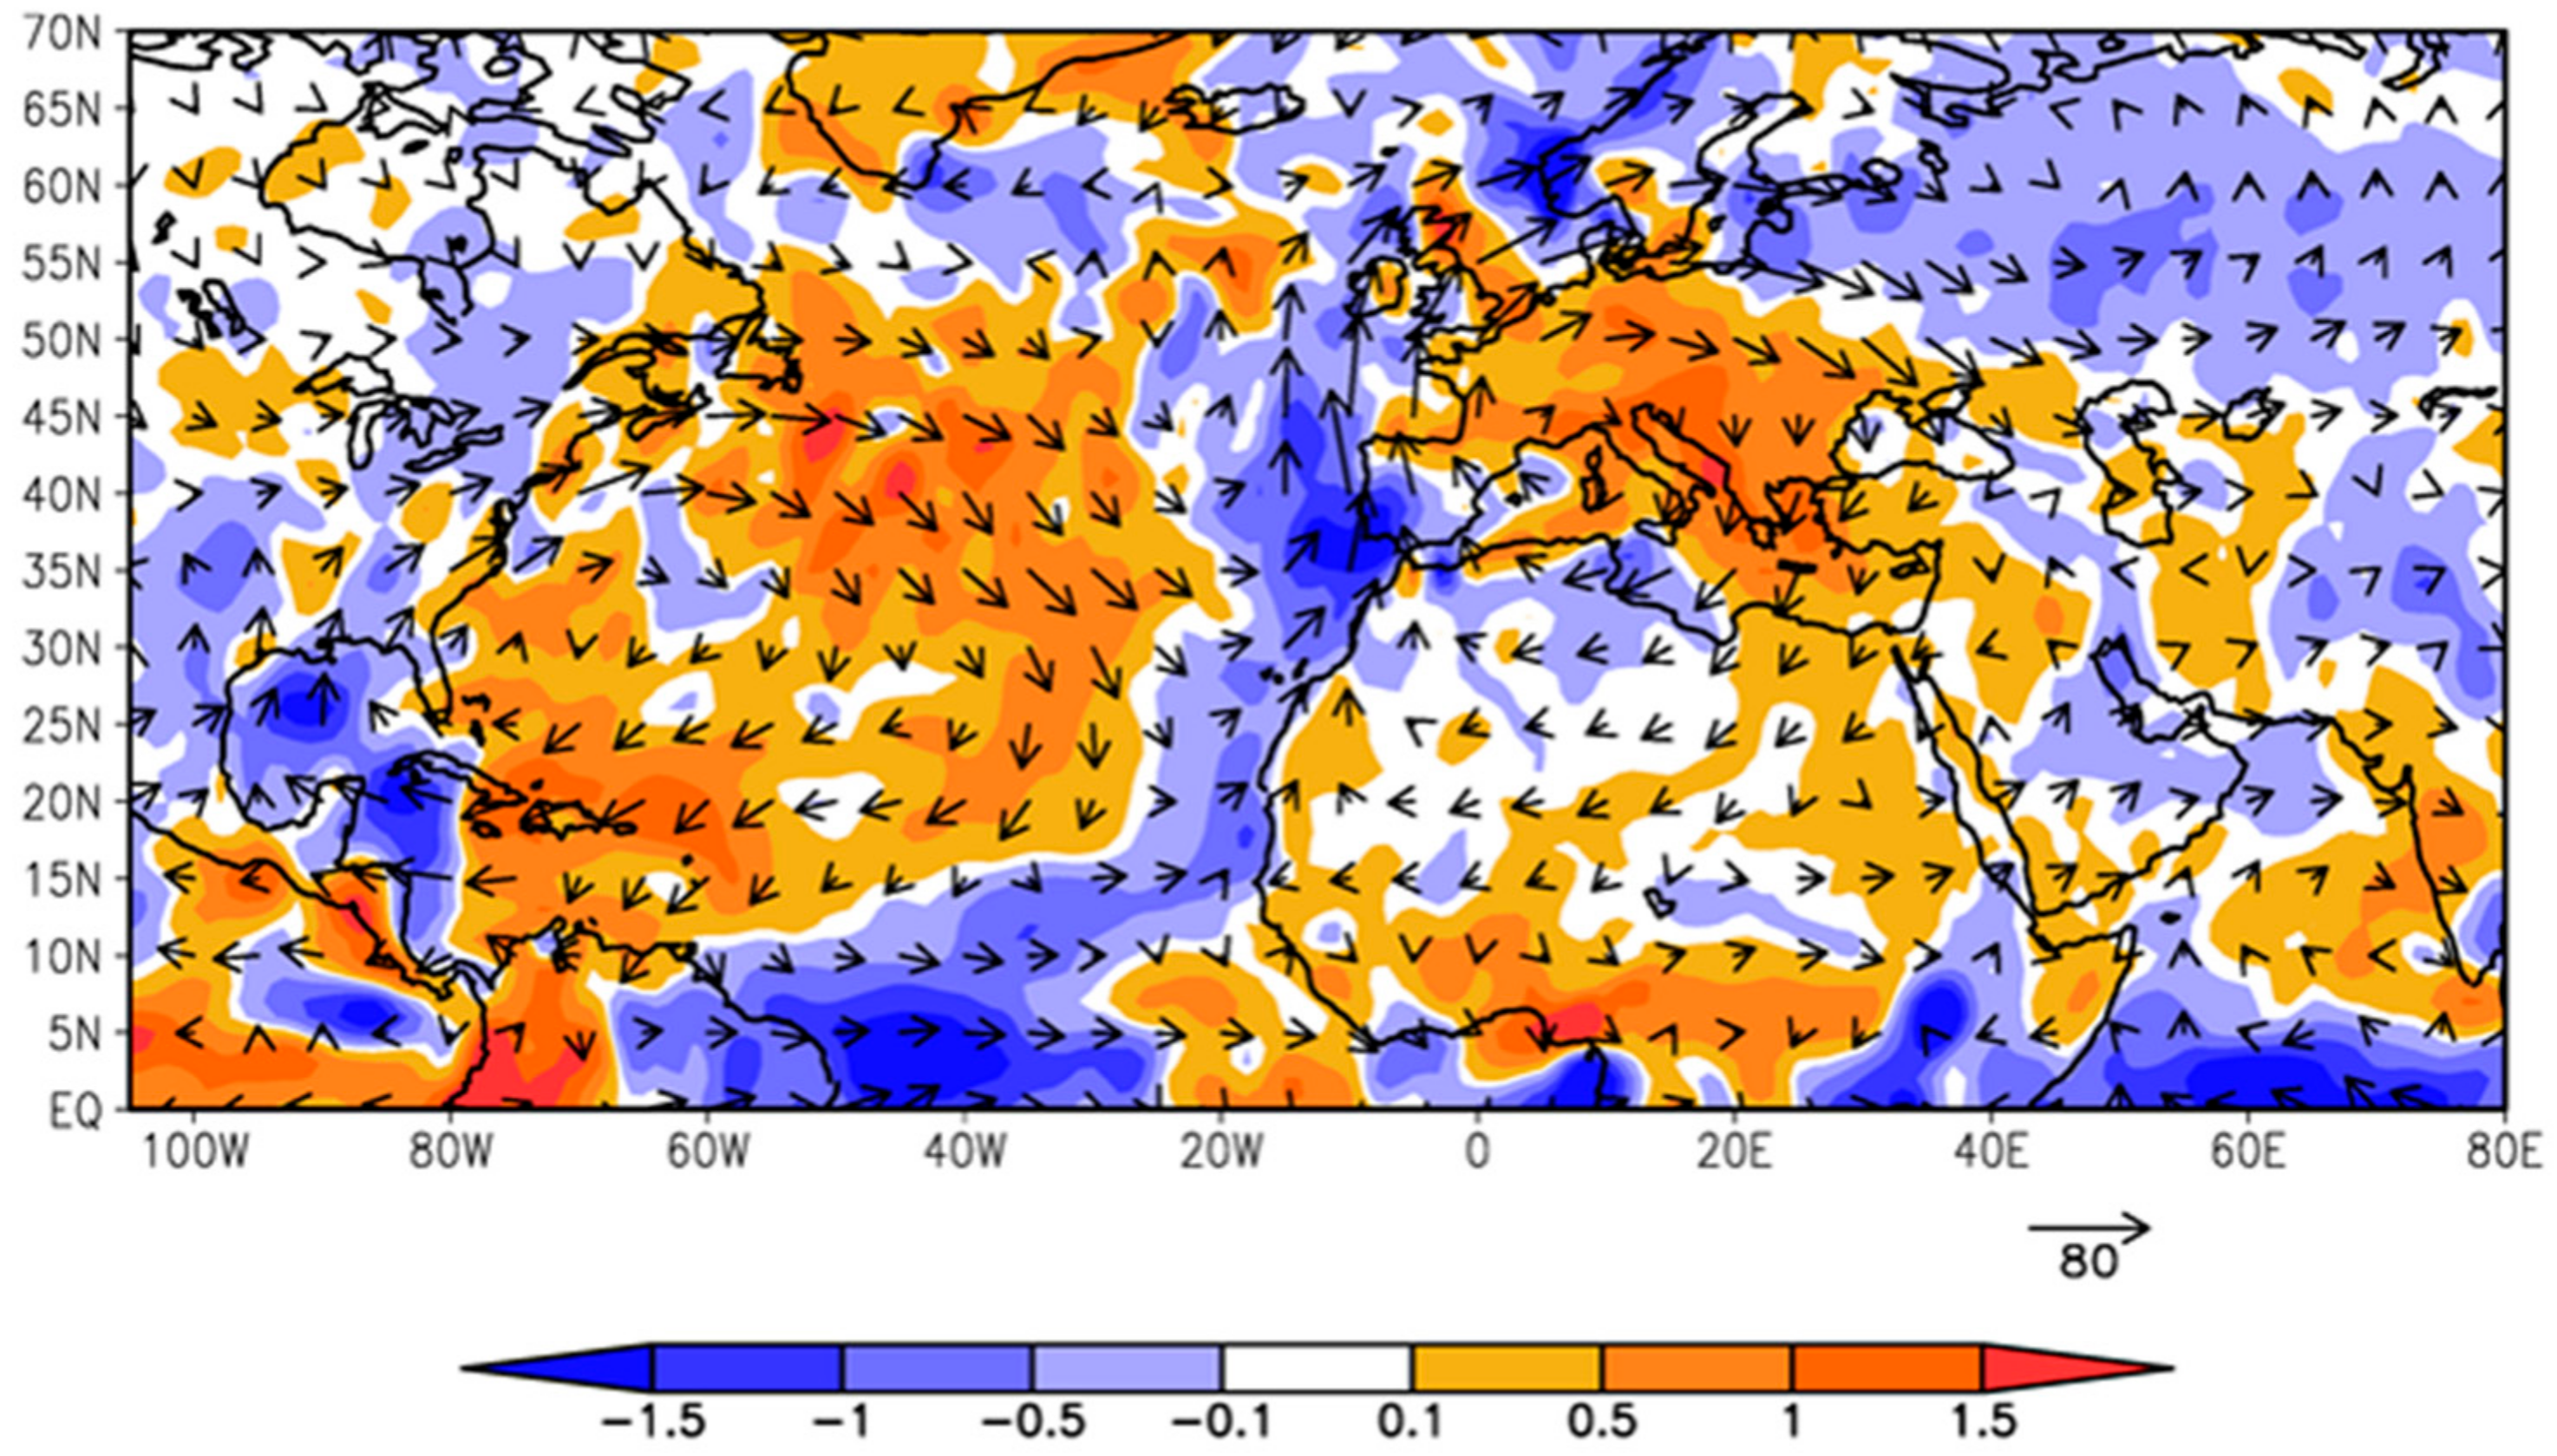
Figure 5 shows the map of the anomalies of the VIMF and its divergence configured over the Mediterranean and North Atlantic regions during the episode. The reader can notice that divergent conditions of VIMF (reddish colors) prevailed over Europe and the Mediterranean, suggesting the inhibition of precipitation over this large spatial domain during the event. Drumond et al. [53] also identified this episode in their analysis of the driest winter conditions verified over the moisture sinks of the MED, which reveals not only that drier conditions have been extended over southeastern Europe during the 1989/1990 winter, but also that the anomalous moisture supply from the MED favored these conditions.
An anomalous anticyclonic circulation localized over central Europe confirms the Lagrangian results concerning the inhibition of the moisture transport from the MED to the DRB, as well as from central/North Europe (including the RestL area). This anticyclonic anomaly may be related to the second prominent mode of climate variability that affects the North Atlantic region and Europe, the East Atlantic (EA) pattern [54]. During its positive phase, this pattern consists in a north–south dipole of 500 hPa geopotential anomalies with enhanced positive anomalies spanning from the western North Atlantic to eastern Europe, and it is also associated with negative anomalies over southern Europe and the eastern Mediterranean [55]. During the drought episode analyzed here, the index of EA remains positive with a mean value of 0.37, but it is higher during the last four months of the period, reaching 1.12. So, this condition favors the drought.
A vector analysis indicates that the moisture transport from the Atlantic Ocean and Mediterranean Sea that converged over the eastern Atlantic are associated with a moisture flux northwards.
3.2.2. Drought Event in 2003
This drought event is the longest and the most severe of all the drought events that occurred over the DRB on the SPEI-1 in the period of 1980–2014. It seems that this event may be associated with the heat waves registered over Europe in the summer of 2003. These heat waves received substantial attention because of the impacts that they had on river flow, central European glaciers, and losses in crop yield, as well as other serious consequences, which have been the focus of many studies [56,57,58,59]. Fink et al. [56] analyzed the synoptic situation and the impacts of the hot, dry 2003 European summer heatwaves. They found that the summer of 2003 was the warmest since 1864, and the impacts of its dryness were intensified by high evaporation rates and the drought conditions during the previous period. They also mentioned that summer heatwaves in 2003 not only affected Central Europe, but also the Mediterranean region, which is in agreement with our results for the DRB.
Similar to Figure 4, Figure 6a shows the standardized anomaly of PET, PRE, and omega at 500 hPa, while Figure 6b shows the anomalies of the moisture supply over the DRB from the sources obtained via the forward experiment for this drought event. It includes the AA-1 precipitation anomalies accumulated during the SPEI-1 episode shown in Table 2.
From Figure 6b, we can see that during the period previous to the event, there were positive anomaly contributions from the Mediterranean Sea until January 2003, while anomalies of PRE are positive and anomalies of omega and PET are negative (Figure 6a).
From February 2003, the onset of the drought event, to August 2003, the contribution from the sources to precipitation predominantly weakened (Figure 6b). The positive anomalies of PET and omega (indicating subsidence), which reached their peak in June 2003, and the most intense negative accumulated anomaly for precipitation in August 2003, on SPEI-1 are associated with the negative anomaly of precipitation during the 2003 summer season that is associated with a reduction in moisture supply from almost all of the sources. The SPEI-1 episode finished in August 2003, and an intensified contribution from the Mediterranean and Black Seas occurred in September 2003 (Figure 6b). In October 2003, when all of the sources show a positive anomaly contribution, the anomaly of PRE registered positive values. Our findings are also in agreement with Ciais et al. [57] and Rebetez et al. [58], which show that precipitation was below normal during the whole of 2003 in Europe with the exception of October 2003. The anomalous subsidence over the DRB persisted in all periods from February 2003 to September 2003.
The anomalies in the moisture supply from the sources over the DRB accumulated during the 2003 episode are shown in Table 4. Table 4 shows a predominance of reduced moisture supply from the studied sources. When we compare the accumulated values from the sources, the results indicate that the RestL and MED registered the most intensive negative anomalies accumulated during the 2003 episode (−5.38, and −4.79 mm/day, respectively).
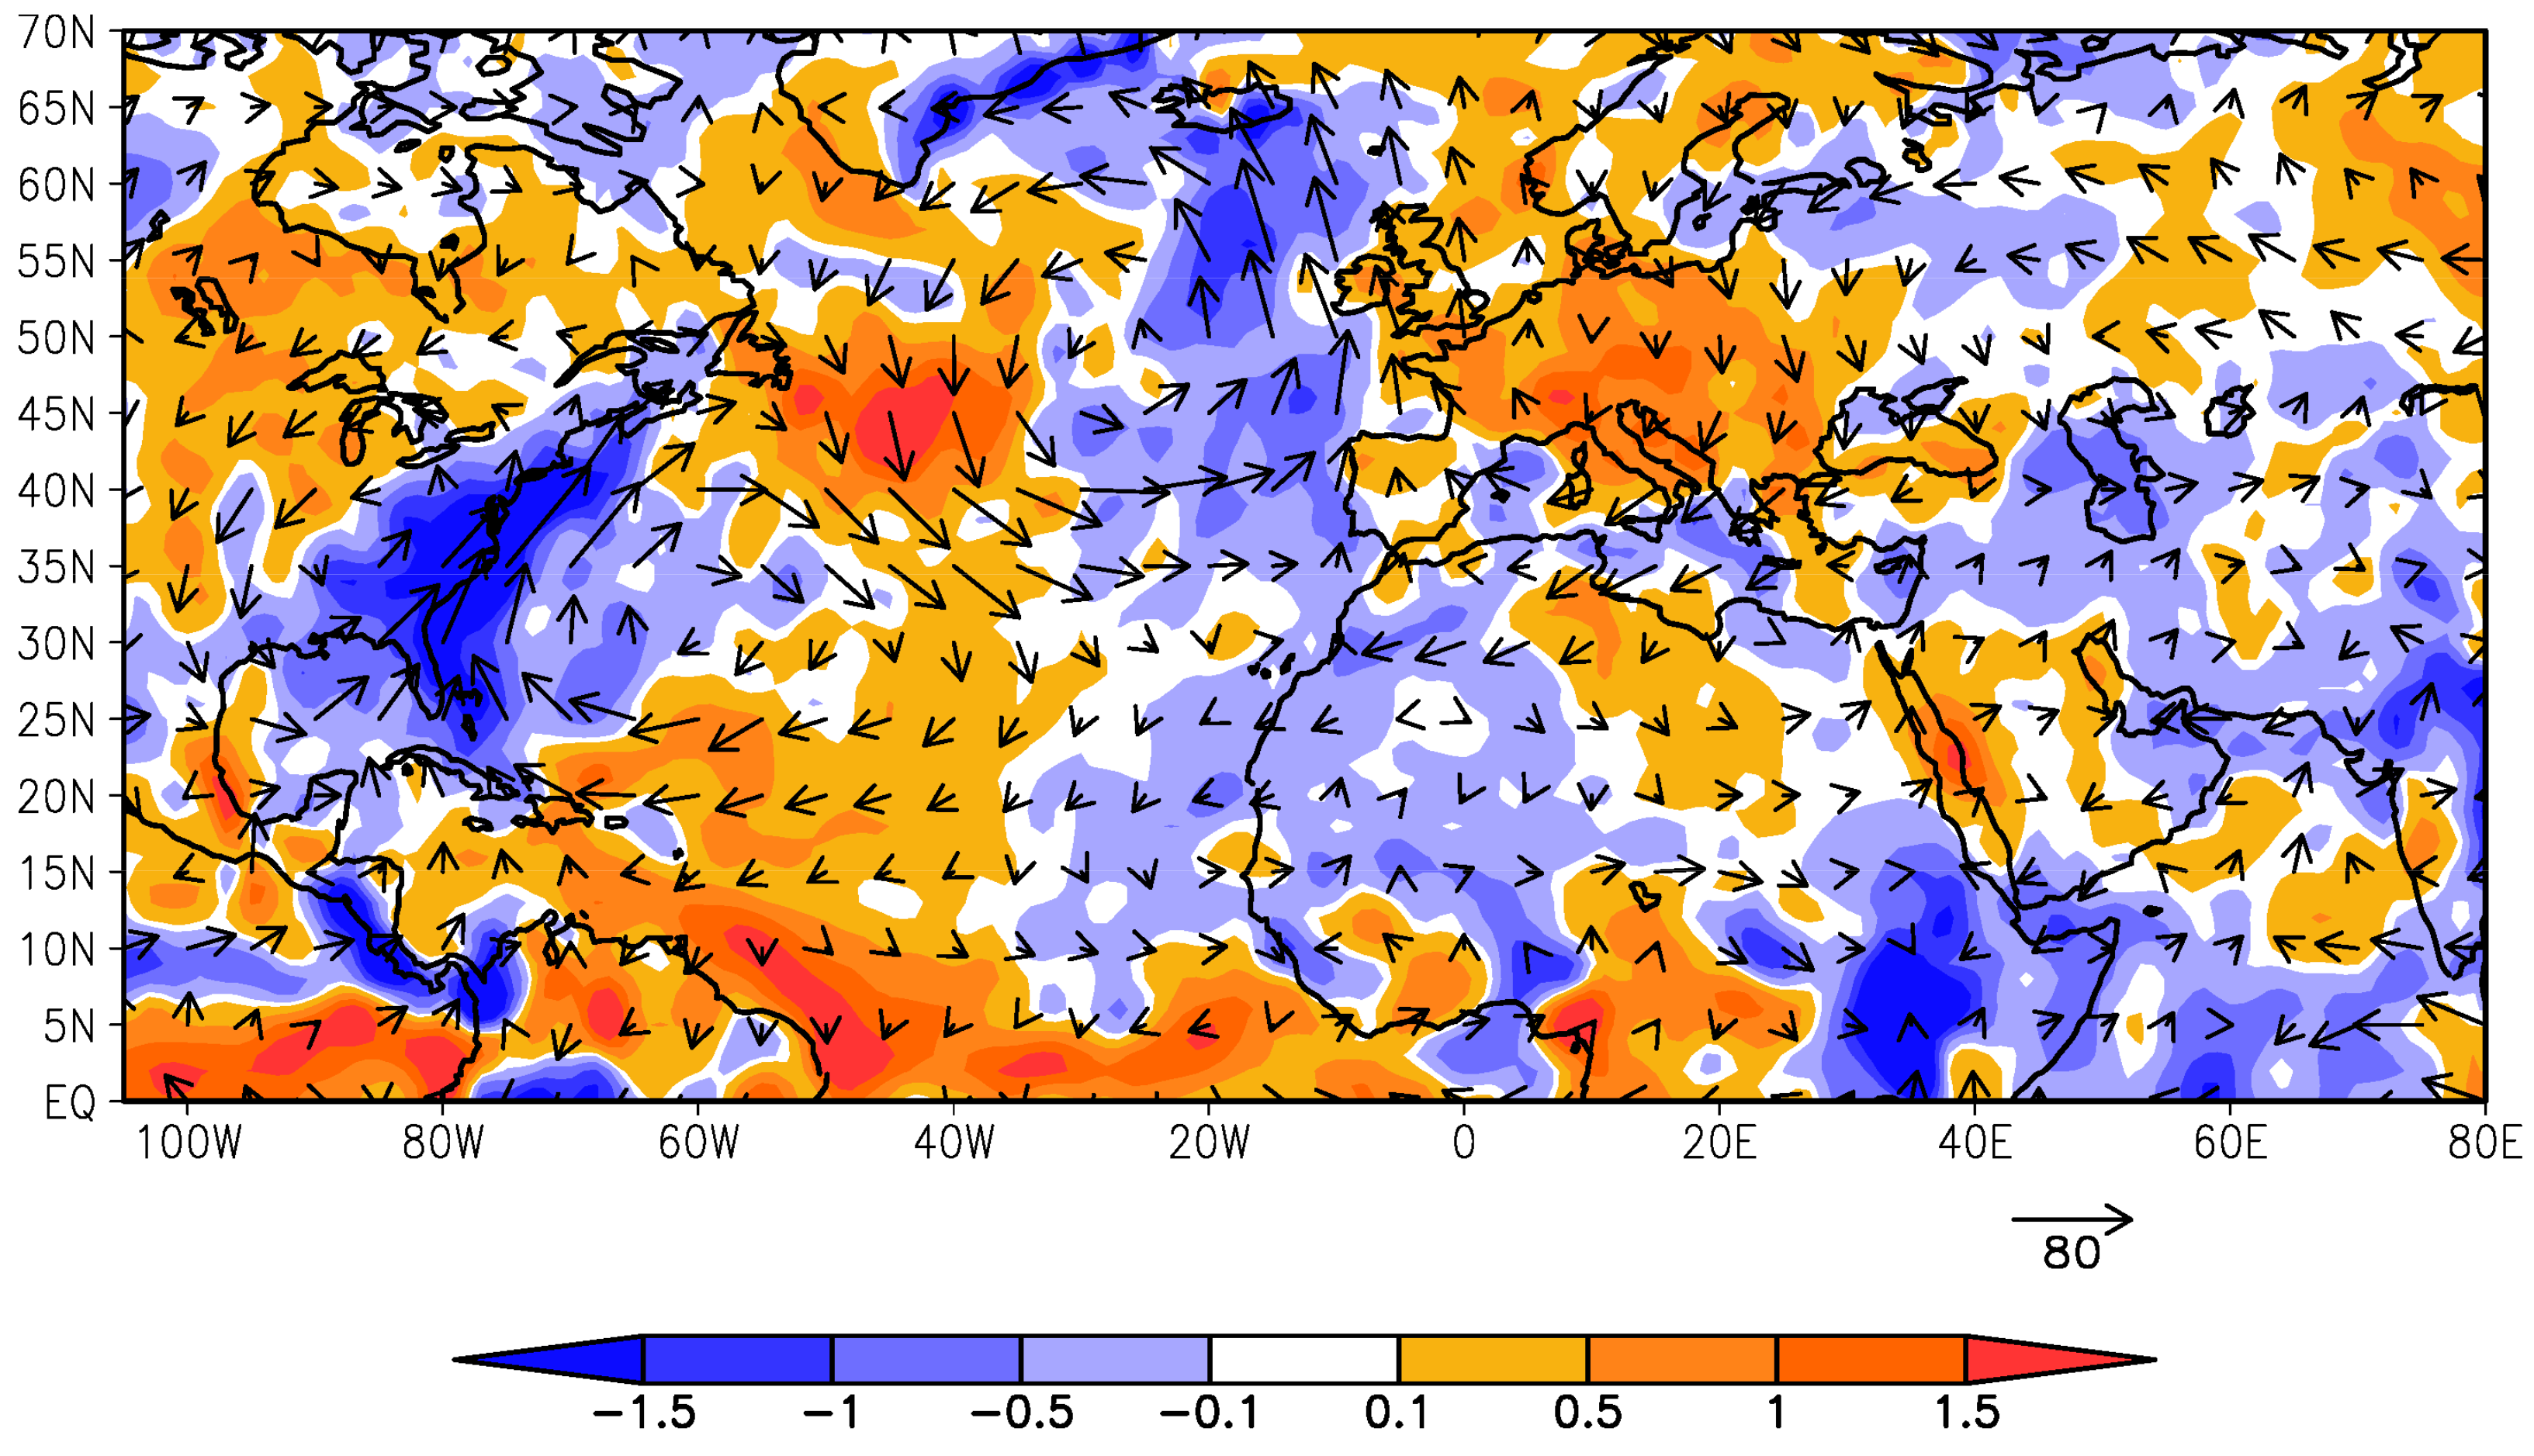
Figure 7 shows the map of the anomalies of the VIMF and its divergence configured over the Mediterranean and North Atlantic regions during the 2003 episode. Quite similar to the 1989/90 event, divergent conditions of VIMF and an anomalous anticyclonic circulation localized over central Europe (the East Atlantic index is also positive during the entire period and during the last four months (0.38 and 0.14, respectively)) inhibited moisture supply from both the MED and RestL to the DRB. This drought episode has also been identified by Drumond et al. [53] between the driest summer conditions verified over the moisture sinks of the MED, which reveals that dry conditions extended over southern and western Europe during 2003. It is also interesting to observe an anomalous VIMF convergence over northwestern Africa, favoring precipitation over the region, which agrees with the study of Wolter et al. [60]. According to these authors, during the European spring season, mature El Niño events tend to create anomalies over the northern Atlantic that are associated with below-normal rainfall over the western Mediterranean and with the intensification and the northward displacement of precipitation over northwestern Africa. These anomalous patterns lead to drier 2003 European conditions.
3.3. Variations in the Moisture Supply from the Moisture Sources for the DRB and Meteorological Drought Conditions over the Basin during 1980–2014
The analyses for the 1989/1990 and 2003 episodes performed in the previous sections revealed that the RestL and MED were the sources presenting the most intensive reduction in the moisture supply over the DRB during both periods, independently of their occurrence in different seasons: 1989/90 during the winter and 2003 in the summer. Although these results cannot be conclusive because they refer to only two episodes and an analysis of all events would be exhaustive, in this section our aim is to provide some climatological perspective of the relationship between the occurrence of meteorological dry conditions over the DRB and the moisture supply from the studied sources.
Table 5 shows the Pearson correlation coefficients between the anomalies in the moisture supply from the sources to the DRB and SPEI-1 time series in an attempt to reveal some joint linear variability. Although all values are positive, it is worth mentioning that the RestL and MED show the highest annual correlation values (exceeding 0.5). It indicates that an enhanced (inhibited) moisture supply from these sources was linearly associated with moist (dry) conditions over the DRB on the SPEI-1 scale. These results support the case studies suggesting the relative importance of the moisture supply particularly from the RestL, MED, and DRB sources, which are the major sources of moisture for the DRB [7].
4. Conclusions
In this paper, we investigated the anomalies in the moisture transport observed during two significant drought events over the Danube River Basin (DRB) (1989–1990 and 2003) through a Lagrangian approach. We calculated the standardized precipitation evapotranspiration index (SPEI) to identify the drought episodes that occurred over the DRB in the period of 1980–2014. SPEI was obtained using the monthly CRU (TS3.23) precipitation and potential evapotranspiration dataset, available at a spatial resolution of 0.5 degree. The monthly values of SPEI were classified into four categories (mild, moderate, severe, and extreme) based on the classification of McKee et al. [36]. The monthly SPEI-1 index was used to identify the drought episodes and to calculate their respective indicators, including duration, severity, and intensity. A Lagrangian approach was then applied using data from ERA-Interim in order to analyze the variation in moisture supply into the DRB during the selected drought events. The main conclusions of the study are summarized as follows.
The two most severe drought episodes that occurred during 1980–2014 on the timescale of SPEI-1 were the episodes October1989–March1990 and February 2003–August 2003.
Anomalous subsidence (positive anomalies of omega at 500 hPa) and reduced precipitation predominated during the episode October 1989–March 1990. The event was associated with reduced moisture supply from almost all of the sources investigated (except the North Atlantic in November 1989 and January 1990).
For 2003, the results show that the reduction in the moisture supply and PRE over the DRB occurred together with the onset of the episode. The SPEI-1 episode lasted up to August 2003, being characterized by anomalous subsidence, increased PET, and reduced PRE over the DRB associated with the predominance of reduced moisture supply from the selected sources. From September 2003, the dismissal of the SPEI-1episode and the weakening of the anomalous subsidence and PET are associated with increasing PRE and moisture supply from the analyzed sources.
Concerning the PET and the SPEI-1 episodes, the 1989/1990 episode was the only one presenting negative anomalies of PET, although these were weaker than the negative anomalies of PRE, which results in PRE − PET <0 and in negative SPEI values.
The analysis for the drought episodes identified on SPEI-1 (October 1989–March 1990 and February 2003–August 2003) shows that the RestL and MED were the sources presenting the most intensive reduction in the moisture supply over the DRB during both periods. Also, the RestL and MED present the highest correlation values between the anomalies in the moisture supply from the sources to the DRB and SPEI-1 time series.
Acknowledgments
Thanks for the funding by the Spanish Government and FEDER through the SETH (CGL2014-60849-JIN) project. M. Stojanovic’s Ph.D. fellowship is supported by European Commission under the Erasmus Mundus project Green-Tech-WB: Smart and Green technologies for innovative and sustainable societies in Western Balkans (551984-EM-1-2014-1-ES-ERA Mundus-EMA2). R. Nieto also acknowledges the support of the CNPq Grant 314734/2014-7 by the Brazilian government. We also thank the IMDROFLOOD project financed by the Water Works 2014 co-funded call of the European Commission. We acknowledge both anonymous referees for their comments that have improved this paper.
Author Contributions
M. Stojanovic, A. Drumond, and L. Gimeno conceived of and designed the experiments. M. Stojanovic performed the experiments and M. Stojanovic, A. Drumond, and L. Gimenoanalyzed the data. M. Stojanovic, A. Drumond, R. Nieto, and L. Gimenowrote the paper.
Conflicts of Interest
The authors declare no conflict of interest. The founding sponsors had no role in the design of the study; in the collection, analyses or interpretation of data; in the writing of the manuscript; nor in the decision to publish the results.
References
- Kuchment, L.S. The Hydrological Cycle and Human Impact on It. 2004. Available online: http://www.biodiversity.ru/programs/ecoservices/library/functions/water/doc/Kuchment.pdf (accessed on 10 May 2017).
- Christensen, J.H.; Christensen, O.B. Severe summertime flooding in Europe. Nature 2003, 421, 805–806. [Google Scholar] [CrossRef] [PubMed]
- Schär, C.; Vidale, P.L.; Lüthi, D.C.; Frei, C.; Häberli, C.; Liniger, M.A.; Appenzeller, C. The role of increasing temperature variability in European summer heatwaves. Nature 2004, 427, 332–336. [Google Scholar] [CrossRef] [PubMed]
- Nikolova, N.; Vassilev, S. Variability of summer-time precipitation in Danube plain, Bulgaria. J. Geogr. Inst. “Jovan Cvijic” SASA 2005, 54, 19–32. [Google Scholar] [CrossRef]
- García-Ruiz, J.M.; López-Moreno, J.I.; Vicente-Serrano, S.M.; Lasanta-Martínez, T.; Beguería, S. Mediterranean water resources in a global change scenario. Earth. Sci. Rev. 2011, 105, 121–139. [Google Scholar] [CrossRef] [Green Version]
- Bates, B.C.; Kundzewicz, Z.W.; Wu, S.; Palutikof, J.P. Technical Paper of the Intergovernmental Panel on Climate Change: Climate Change Water. 2008. Available online: https://www.ipcc.ch/pdf/technical-papers/climate-change-water-en.pdf (accessed on 10 May 2017).
- Ciric, D.; Stojanovic, M.; Drumond, A.; Nieto, R.; Gimeno, L. Tracking the Origin of Moisture over the Danube River Basin Using a Lagrangian Approach. Atmosphere 2016, 7, 162. [Google Scholar] [CrossRef]
- Gibson, J.J.; Aggarwal, P.; Hogan, J.; Herczeg, A. Isotope studies in large river basins: A new global research focus. Eos, Trans. Am. Geophys. Union 2002, 83, 613–617. [Google Scholar] [CrossRef]
- Stagl, C.J.; Hattermann, F.F. Impacts of climate change on the hydrological regime of the Danube River and its tributaries using an ensemble of climate scenarios. Water 2015, 7, 6139–6172. [Google Scholar] [CrossRef]
- Rîmbu, N.; Boroneanţ, C.; Buţă, C.; Dima, M. Decadal variability of the Danube river flow in the lower basin and its relation with the North Atlantic Oscillation. Int. J. Climatol. 2002, 22, 1169–1179. [Google Scholar] [CrossRef]
- Pistocchi, A.; Beck, H.; Bisselink, B.; Gelati, E.; Lavalle, C.; Feher, J. Water Scenarios for the Danube River Basin: Elements for the Assessment of the Danube Agriculture-Energy-Water Nexus. 2015. Available online: https://ec.europa.eu/jrc/en/publication/water-scenarios-danube-river-basin-elements-assessment-danube-agriculture-energy-water-nexus (accessed on 10 May 2017).
- Mishra, A.K.; Singh, V.P. A review of drought concepts. J. Hydrol. 2010, 391, 202–216. [Google Scholar] [CrossRef]
- Popova, Z. Drought vulnerability estimated based on crop-yield models. In Drought Management Centre for South-East Europe -DMCSEE—Summary of Project Results; Slovenian Environmental Agency: Ljubljana, Slovenia, 2012; pp. 39–54. [Google Scholar] [CrossRef]
- Seneviratne, S.I.; Lüthi, D.; Litschi, M.; Schär, C. Land-atmosphere coupling and climate change in Europe. Nature 2006, 443, 205–209. [Google Scholar] [CrossRef] [PubMed]
- Drumond, A.; Nieto, R.; Hernández, E.; Gimeno, L. A Lagrangian analysis of the variation in moisture sources related to drier and wetter conditions in regions around the Mediterranean basin. Nat. Hazards Earth Sys. Sci. 2011, 11, 2307–2320. [Google Scholar] [CrossRef] [Green Version]
- Gómez-Hernández, M.; Drumond, A.; Gimeno, L.; Garcia-Herrera, R. Variability of moisture sources in the Mediterranean region during the period 1980–2000. Water Resour. Res. 2013, 49, 6781–6794. [Google Scholar] [CrossRef] [Green Version]
- Sodemann, H.; Zubler, E. Seasonal and inter-annual variability of the moisture sources for Alpine precipitation during 1995–2002. Int. J. Climatol. 2010, 30, 947–961. [Google Scholar] [CrossRef]
- Vicente-Serrano, S.M.; Begueria, S.; Lopez-Moreno, A.J. A multiscalar drought index sensitive to global warming: The standardized precipitation evapotranspiration index. J. Clim. 2010, 23, 1696–1718. [Google Scholar] [CrossRef]
- Stohl, A.; James, P. A Lagrangian Analysis of the Atmospheric Branch of the Global Water Cycle. Part I: Method Description, Validation, and Demonstration for the August 2002 Flooding in Central Europe. J. Hydrometeorol. 2004, 5, 656–678. [Google Scholar] [CrossRef]
- Stohl, A.; James, P. A Lagrangian analysis of the atmospheric branch of the global water cycle: Part II: Moisture Transports between Earth’s Ocean Basins and River Catchments. J. Hydrometeorol. 2005, 6, 948–961. [Google Scholar] [CrossRef]
- World Meteorological Organization. Drought Monitoring and Early Warning: Concepts, Progress and Future Challenges. 2006. Available online: http://www.wamis.org/agm/pubs/brochures/WMO1006e.pdf (accessed on 11 May 2017).
- Wilhite, D.A.; Glantz, M.H. Understanding the Drought Phenomenon: The Role of Definitions. Water Int. 1985, 10, 111–120. [Google Scholar] [CrossRef]
- Panu, U.S.; Sharma, T.C. Challenges in drought research: Some perspectives and future directions. Hydrol. Sci. J. 2002, 47, S19–S30. [Google Scholar] [CrossRef]
- Urama, K.C.; Ozor, N. Impacts of Climate Change on Water Resources in Africa: The Role of Adaptation. African Technology Policy Studies Network (ATPS), 2010. Available online: http://www.ourplanet.com/climate-adaptation/Urama_Ozorv.pdf (accessed on 11 May 2017).
- Dai, A. Drought under global warming: A review. WIREs Clim. Chang. 2010, 2, 45–65. [Google Scholar] [CrossRef]
- Zlatanovic, N.; Stojkovic, M. Assessment and monitoring of droughts in Southeastern Europe: A Review. Water Res. Man. 2016, 6, 11–18. [Google Scholar]
- Spinoni, J.; Naumann, G.; Vogt, J.; Barbosa, P. Meteorological Droughts in Europe: Events and Impacts: Past Trends and Future Projections. 2016. Available online: http://www.droughtmanagement.info/literature/EC-JRC_Report%20on%20Droughts%20in%20Europe_2016.pdf (accessed on 15 September 2017).
- Rahmat, S.N. Methodology for Development of Drought Severity-Duration-Frequency (SDF) Curves. Ph.D. Thesis, RMIT University, Melbourne, Australia, 28 August 2014. [Google Scholar]
- Palmer, W.C. Meteorological Drought. 1965. Available online: https://www.ncdc.noaa.gov/temp-and-precip/drought/docs/palmer.pdf (accessed on 11 May 2017).
- World Meteorological Organization. Standardized Precipitation Index User Guide. 2012. Available online: http://www.wamis.org/agm/pubs/SPI/WMO_1090_EN.pdf (accessed on 15 September 2017).
- Vicente-Serrano, S.M.; Gouveira, C.; Camarero, J.J.; BeguerÌa, S.; Trigo, R.; LÛpezMoreno, J.I.; Azorin-Molina, C.; Pasho, E.; Lorenzo-Lacruz, J.; Revuelto, J.; et al. Drought Impacts on Vegetation Activity, Growth and Primary Production in Humid and Arid Ecosystems. 2012. Available online: http://digital.csic.es/bitstream/10261/62153/1/BegueriaS_Drought_ComCongSal-AEC_2012.pdf (accessed on 11 May 2017).
- Begueria, S.; Vicente-Serrano, S.M.; Reig, F.; Latorre, B. Standardized precipitation evapotranspiracion index (SPEI) revisted: Parameter fitting, evapotranspiration models, tools, datasets and drought monitoring. Int. J. Climatol. 2013, 34, 3001–3023. [Google Scholar] [CrossRef]
- Potop, V.; Boroneanţ, C.; Možný, M.; Štěpánek, P.; Skalák, P. Observed spatiotemporal characteristics of drought on various time scales over the Czech Republic. Theor. Appl. Climatol. 2014, 115, 563–581. [Google Scholar] [CrossRef]
- Liu, Z.; Lu, G.; He, H.; Wu, Z.; He, J. Anomalous Features of Water Vapor Transport during Severe Summer and Early Fall Droughts in Southwest China. Water 2017, 9, 244. [Google Scholar] [CrossRef]
- Harris, I.; Jones, P.D.; Osborn, T.J.; Lister, D.H. Updated high-resolution grids of monthly climatic observations—The CRU TS3.10 Dataset. Int. J. Climatol. 2014, 34, 623–642. [Google Scholar] [CrossRef] [Green Version]
- McKee, T.B.; Doesken, N.J.; Kleist, J. The relationship of drought frequency and duration to time scales. In Proceedings of the Eighth Conference on Applied Climatology, Anaheim, CA, USA, 17–22 January 1993; pp. 179–184. [Google Scholar]
- Tan, C.; Yang, J.; Li, M. Temporal-Spatial Variation of Drought Indicated by SPI and SPEI in Ningxia Hui Autonomous Region, China. Atmosphere 2015, 6, 1399–1421. [Google Scholar] [CrossRef]
- Spinoni, J.; Naumann, G.; Carrao, H.; Barbosa, P.; Vogt, J. World drought frequency, duration, and severity for 1951–2010. Int. J. Climatol. 2014, 34, 2792–2804. [Google Scholar] [CrossRef]
- Dee, D.P.; Uppala, S.M.; Simmons, A.J.; Berrisford, P.; Poli, P.; Kobayashi, S.; Andrae, U.; Balmaseda, M.A.; Balsamo, G.; Bauer, P.; et al. The ERA-Interim reanalysis: Configuration and performance of the data assimilation system. Q. J. R. Meteorol. Soc. 2001, 137, 553–597. [Google Scholar] [CrossRef]
- Trenberth, K.E.; Fasullo, J.T.; Mackaro, J. Atmospheric moisture transports from ocean to land and global energy flows in reanalyses. J. Clim. 2011, 24, 4907–4924. [Google Scholar] [CrossRef]
- Lorenz, C.; Kunstmann, H. The hydrological cycle in three state-of-the-art reanalyses: Intercomparison and performance analysis. J. Hydrometeorol. 2012, 13, 1397–1420. [Google Scholar] [CrossRef]
- Gimeno, L.; Stohl, A.; Trigo, R.M.; Dominguez, F.; Yoshimura, K.; Yu, L.; Drumond, A.; Duran-Quesada, A.M.; Nieto, R. Oceanic and terrestrial sources of continental precipitation. Rev. Geophys. 2012, 50, 1–41. [Google Scholar] [CrossRef]
- Nieto, R.; Gallego, D.; Trigo, R.M.; Ribera, P.; Gimeno, L. Dynamic identification of moisture sources in the Orinoco basin in equatorial South America. Hydrol. Sci. J. 2008, 53, 602–617. [Google Scholar] [CrossRef]
- Drumond, A.; Nieto, R.; Gimeno, L.; Ambrizzi, T. A Lagrangian identification of major sources of moisture over Central Brazil and La Plata Basin. J. Geophys. Res. Atmos. 2008, 113. [Google Scholar] [CrossRef]
- Huang, Y.; Cui, X. Moisture sources of an extreme precipitation event in Sichuan, China, based on the Lagrangian method. Atmos. Sci. Lett. 2015, 16, 177–183. [Google Scholar] [CrossRef]
- Viste, E.; Sorteberg, A. The effect of moisture transport variability on Ethiopian summer precipitation. Int J. Climatol. 2012, 33, 3106–3123. [Google Scholar] [CrossRef] [Green Version]
- Stohl, A.; Forster, C.; Sodemann, H. Remote sources of water vapor forming precipitation on the Norwegian west coast at 60° N—A tale of hurricanes and an atmospheric river. J. Geophys. Res. Atmos. 2008, 113. [Google Scholar] [CrossRef]
- Numaguti, A. Origin and recycling processes of precipitating water over the Eurasian continent: Experiments using an atmospheric general circulation model. J. Geophys. Res. Atmos. 1999, 104, 1957–1972. [Google Scholar] [CrossRef]
- Vázquez, M.; Nieto, R.; Drumond, A.; Gimeno, L. Extreme Sea Ice Loss over the Arctic: An Analysis Based on Anomalous Moisture Transport. Atmosphere 2017, 8, 32. [Google Scholar] [CrossRef]
- Spinoni, J.; Naumann, G.; Vogt, V.V.; Barbosa, P. The biggest drought events in Europe from 1950–2012. J. Hydrol. 2015, 3, 509–524. [Google Scholar] [CrossRef]
- Tselepidaki, I.; Zarifis, B.; Asimakopoulos, D.N. Low precipitation over Greece during 1989–1990. Theor. Appl. Climatol. 1992, 46, 115–121. [Google Scholar] [CrossRef]
- Tsakiris, G.; Vangelis, H. Establishing a drought index incorporating evapotranspiration. Eur. Water 2005, 9, 3–11. [Google Scholar]
- Drumond, A.; Gimeno, L.; Nieto, R.; Trigo, R.M.; Vicente-Serrano, S.M. Drought episodes in the climatological sinks of the Mediterranean moisture source: The role of moisture transport. Global Planet. Change 2017, 151, 4–14. [Google Scholar] [CrossRef]
- Barnston, A.G.; Livezey, R.E. Classification, seasonality and persistence of low-frequency atmospheric circulation patterns. Mon. Wea. Rev. 1987, 115, 1083–1126. [Google Scholar] [CrossRef]
- Trigo, R.; Xoplaki, E.; Zorita, E.; Luterbacher, J.; Kricak, S.O.; Albert, P.; Jacobeit, J.; Sáenz, J.; Fernández, J.; Glonzález-Rouco, F.; et al. Relations between Variability in the Mediterranean Region and Mid-latitude Variability. Dev. Earth Environ. Sci. 2006, 4, 179–226. [Google Scholar]
- Fink, A.H.; Brücher, T.; Krüger, A.; Leckebusch, G.C.; Pinto, J.G.; Ulbrich, U. The 2003 European summer heatwaves and drought-synoptic diagnosis and impacts. Weather 2004, 59, 209–216. [Google Scholar] [CrossRef] [Green Version]
- Ciais, P.; Reichstein, M.; Viovy, N.; Granier, A.; Ogée, J.; Allard, V.; Aubinet, M.; Buchmann, N.; Bernhofer, C.; Carrara, A.; et al. Europe-wide reduction in primary productivity caused by the heat and drought in 2003. Nature 2005, 437, 529–533. [Google Scholar] [CrossRef] [PubMed]
- Rebetez, M.; Mayer, H.; Dupont, O.; Schindler, D.; Gartner, K.; Kropp, J.P.; Menzel, A. Heat and drought 2003 in Europe: A climate synthesis. Ann. For. Sci. 2006, 63, 569–577. [Google Scholar] [CrossRef]
- Chase, T.N.; Wolter, K.; Pielke, R.A.; Rasool, I. Was the 2003 European heat wave unusual in a global context? Geophys. Res. Lett. 2006, 33. [Google Scholar] [CrossRef]
- Wolter, K.; Baldi, M.; Chase, T.N.; Otterman, J.; Pielke, R.A.; Rasool, I. Possible Causes of the South-Central European Heat Wave of 2003 a Diagnostic Perspective. 2005. Available online: https://meetings.copernicus.org/www.cosis.net/abstracts/EGU05/10447/EGU05-J-10447.pdf (accessed on 17 September 2017).
Figure 1.
The black contour line indicates the Danube river basin (DRB) area. In colors is indicated the elevation of the region (units in meters). Data from the Hydrosheds project (Available online: https://hydrosheds.cr.usgs.gov/dataavail.php).
Figure 1.
The black contour line indicates the Danube river basin (DRB) area. In colors is indicated the elevation of the region (units in meters). Data from the Hydrosheds project (Available online: https://hydrosheds.cr.usgs.gov/dataavail.php).

Figure 2.
Moisture sources (Evaporation minus Precipitation) (E−P) for the Danube River Basin according to the Ciric et al. [7]. The black contour line indicates the sources: NATL (North Atlantic Ocean) red color, MED (Mediterranean Sea) violet color, NAF (North Africa) grey color, DRB (Danube River Basin) pink color, BS (Black Sea) blue color, CS (Caspian Sea) orange color, and Rest of Land RestL (Central and Eastern Europe) yellow color.
Figure 3.
Time series of standardized precipitation evapotranspiration index for 1 month (SPEI-1) averaged over the Danube River Basin (DRB) during 1980–2014. Positive values are in blue and negative in red. The black rectangles show the development of the drought events in 1989/1990 and 2003.
Figure 3.
Time series of standardized precipitation evapotranspiration index for 1 month (SPEI-1) averaged over the Danube River Basin (DRB) during 1980–2014. Positive values are in blue and negative in red. The black rectangles show the development of the drought events in 1989/1990 and 2003.
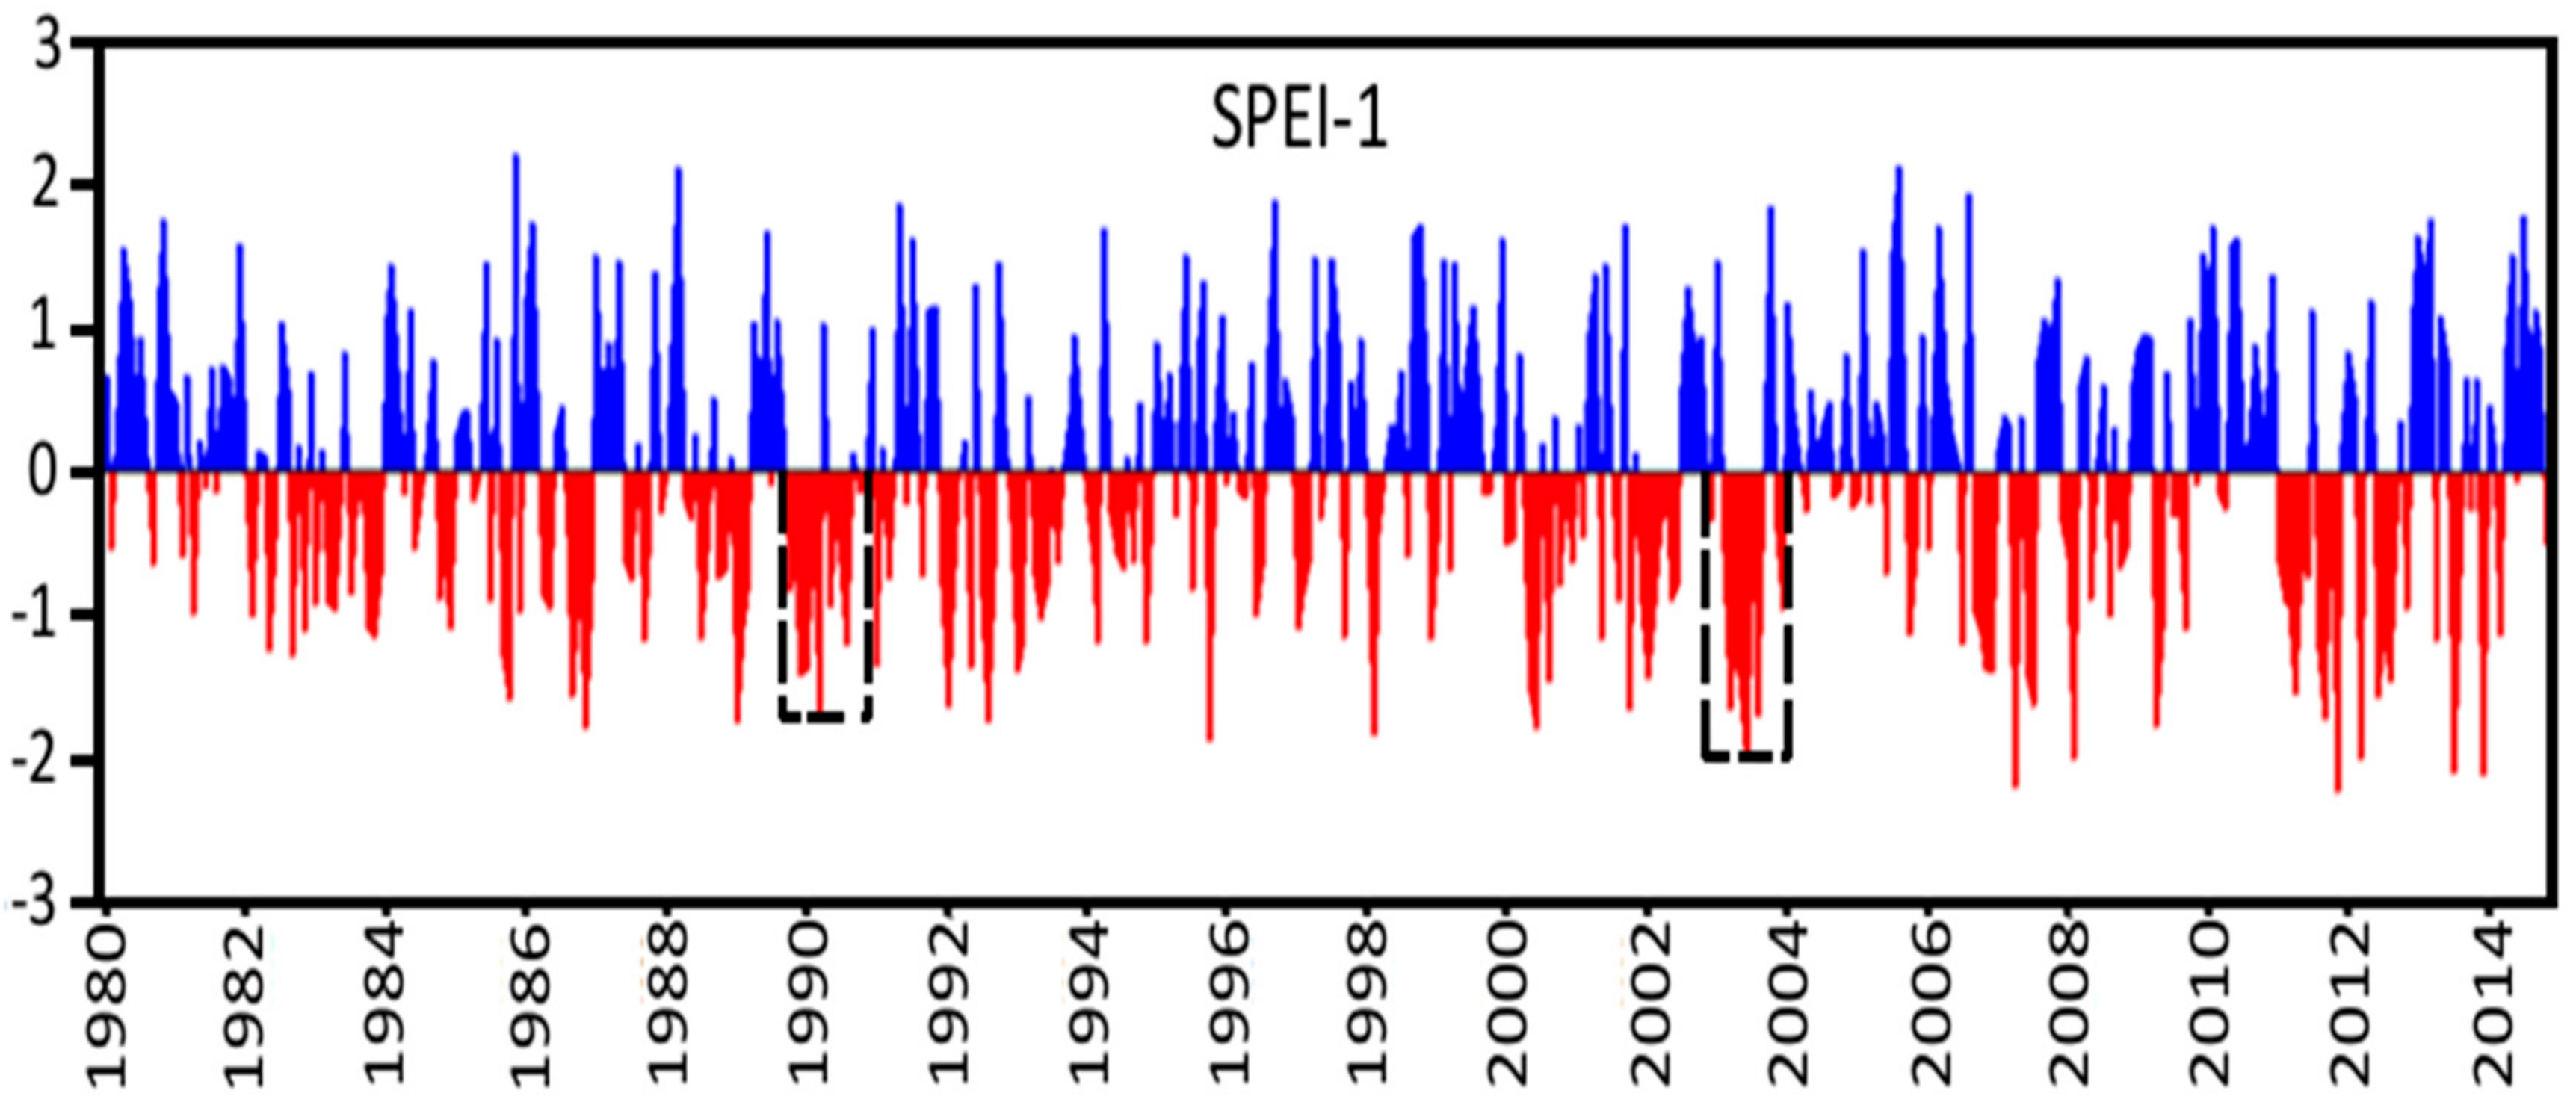
Figure 4.
(a) Standardized anomalies of the precipitation (PRE, blue bars), potential evapotranspiration (PET, red bars) (data from Climatic Research Unit (CRU) Time Series (TS) 3.23), and ECMWF Re-Analysis (ERA)-Interim omega at 500 hPa (omega 500, yellow line), and (b) Anomalies in the moisture supply (E – P < 0) (accumulated bars) by each source over the DRB obtained via the forward FLEXPART experiment (left axis, in mm/day) and the accumulated precipitation anomalies (brown line AA-1) (right axis, in mm/month) for the 1989–1990 event.

Figure 5.
Anomalies of ERA-Interim vertically integrated moisture flux (vector, kg/m/s) and its respective divergence (shaded, mm/day) averaged for the 1989/1990 episode.
Figure 5.
Anomalies of ERA-Interim vertically integrated moisture flux (vector, kg/m/s) and its respective divergence (shaded, mm/day) averaged for the 1989/1990 episode.

Figure 6.
(a) Standardized anomalies of the precipitation (PRE, blue bars), potential evapotranspiration (PET, red bars) (data from Climatic Research Unit (CRU) Time Series (TS) 3.23), and ECMWF Re-Analysis ERA-Interim omega at 500hPa (omega 500, yellow line), and (b) Anomalies in the moisture supply (E – P < 0) (accumulated bars) by each source over the DRB obtained via the forward FLEXPART experiment (left axis, in mm/day) and the accumulated precipitation anomalies(brown line AA-1) (right axis, in mm/month) for the 2003 drought event.
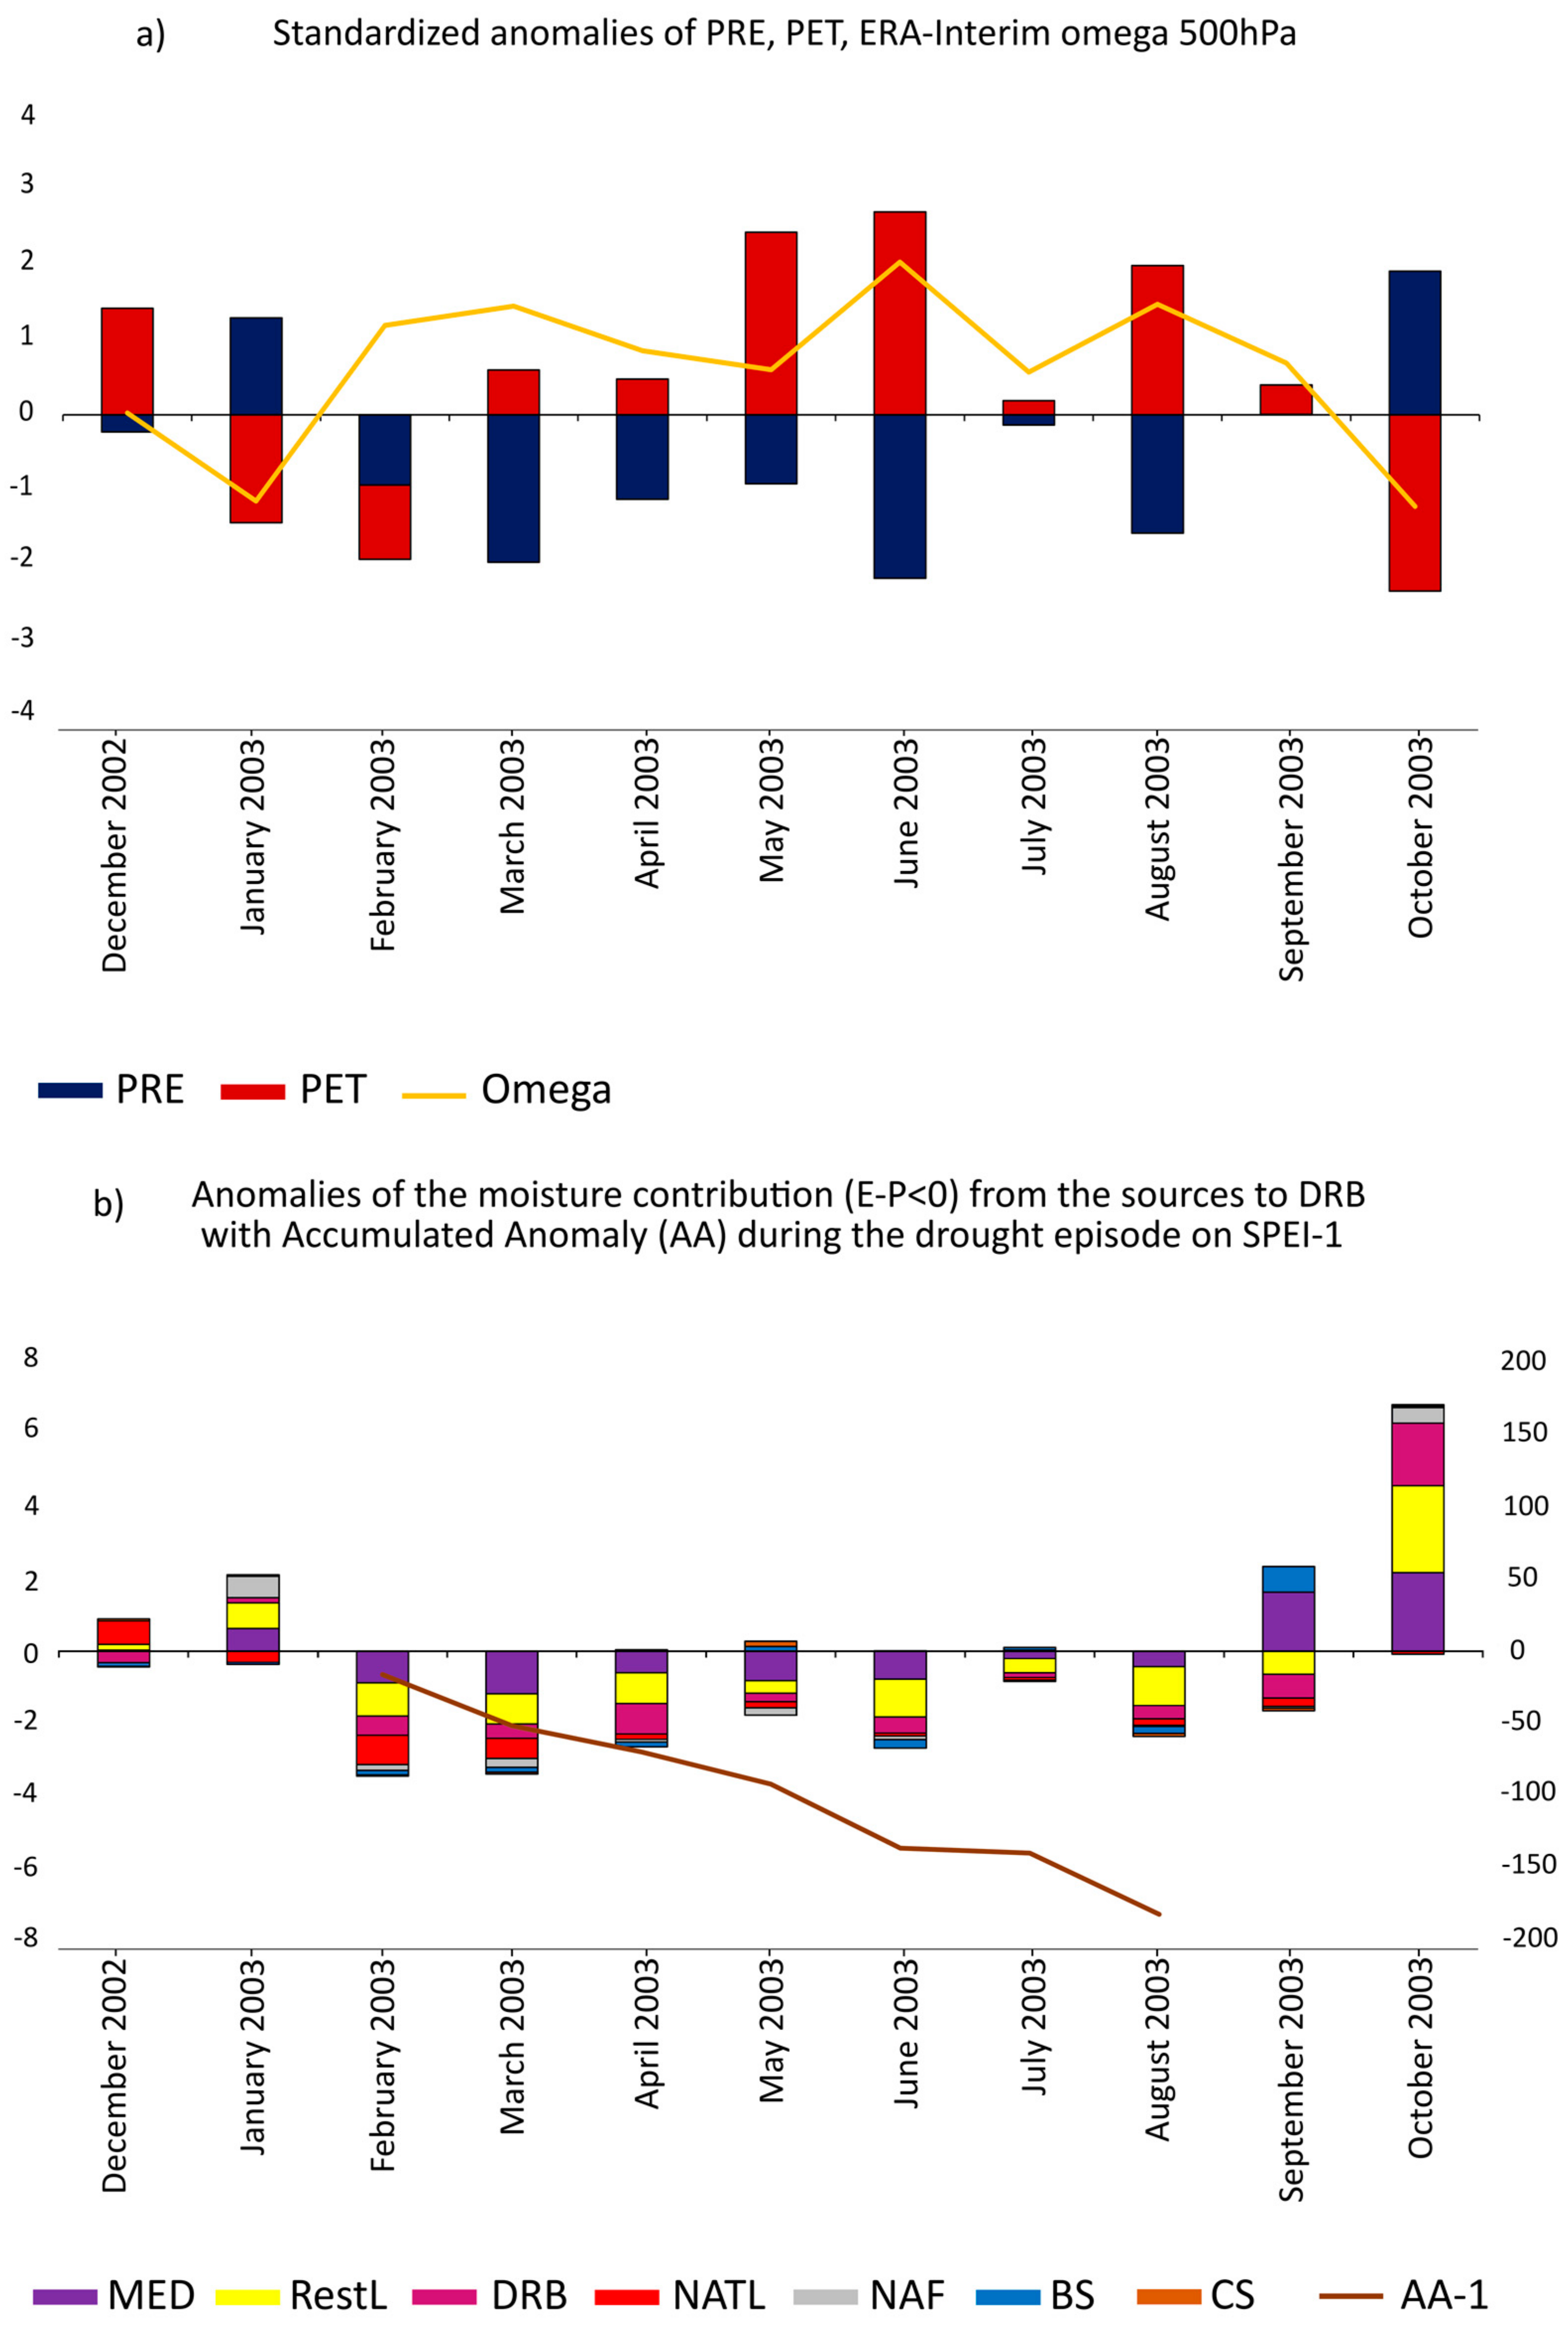
Figure 7.
Anomalies of ERA-Interim vertically integrated moisture flux (vector, kg/m/s) and its respective divergence (shaded, mm/day) averaged for the 2003 episode.
Figure 7.
Anomalies of ERA-Interim vertically integrated moisture flux (vector, kg/m/s) and its respective divergence (shaded, mm/day) averaged for the 2003 episode.

Table 1.
Drought classification based on the monthly standardized precipitation evapotranspiration index (SPEI) values, according to the classification proposed by McKee et al. [36].
Table 1.
Drought classification based on the monthly standardized precipitation evapotranspiration index (SPEI) values, according to the classification proposed by McKee et al. [36].
| SPEI Values | Drought Category |
|---|---|
| 0; −0.99 | Mild |
| −1.00; −1.49 | Moderate |
| −1.50; −1.99 | Severe |
| ≤−2.0 | Extreme |
Table 2.
Top five most severe drought episodes occurring over the DRB on SPEI-1 in the period 1980–2014.
Table 2.
Top five most severe drought episodes occurring over the DRB on SPEI-1 in the period 1980–2014.
| Five Most Severe Drought Episodes Occurring on SPEI-1 | Severity | Duration | Intensity | Peak Month of Each Episode |
|---|---|---|---|---|
| February 2003–August 2003 | 8.80 | 7 | 1.25 | June 2003 −2.09 |
| October 1989–March 1990 | 6.12 | 6 | 1.02 | March 1990 −1.72 |
| December 2001–June 2002 | 5.51 | 7 | 0.78 | January 2002 −1.44 |
| January 2011–June 2011 | 5.39 | 6 | 0.89 | April 2011 −1.55 |
| August 2011–November 2011 | 5.30 | 4 | 1.32 | November 2011 −2.22 |
Table 3.
Anomalies of the moisture supply from the sources over DRB accumulated during the drought episode that occurred on SPEI-1 associated with the event 1989/1990 (in mm/day).
Table 3.
Anomalies of the moisture supply from the sources over DRB accumulated during the drought episode that occurred on SPEI-1 associated with the event 1989/1990 (in mm/day).
| Scale | Drought Episode | MED | RestL | DRB | NATL | NAF | BS | CS |
|---|---|---|---|---|---|---|---|---|
| SPEI-1 | October 1989–March 1990 | −4.85 | −4.98 | −2.71 | 0.04 | −0.52 | −0.65 | −0.15 |
Table 4.
Same as Table 3, but for the 2003 event.
Table 4.
Same as Table 3, but for the 2003 event.
| Scale | Drought Episode | MED | RestL | DRB | NATL | NAF | BS | CS |
|---|---|---|---|---|---|---|---|---|
| SPEI-1 | February 2003–August 2003 | −4.79 | −5.38 | −2.90 | −1.97 | −0.78 | −0.60 | −0.002 |
Table 5.
Pearson correlation coefficients between the anomalies in the moisture supply from the sources to the DRB and SPEI-1 time series. Except for CS, all the values are significant at 99.9% according to the Student’s t-test.
Table 5.
Pearson correlation coefficients between the anomalies in the moisture supply from the sources to the DRB and SPEI-1 time series. Except for CS, all the values are significant at 99.9% according to the Student’s t-test.
| Moisture Sources | Correlation Coefficient |
|---|---|
| RestL | 0.56 |
| MED | 0.53 |
| DRB | 0.46 |
| NAF | 0.41 |
| BS | 0.37 |
| NATL | 0.34 |
| CS | 0.19 |
© 2017 by the authors. Licensee MDPI, Basel, Switzerland. This article is an open access article distributed under the terms and conditions of the Creative Commons Attribution (CC BY) license (http://creativecommons.org/licenses/by/4.0/).
Share and Cite
MDPI and ACS Style
Stojanovic, M.; Drumond, A.; Nieto, R.; Gimeno, L. Moisture Transport Anomalies over the Danube River Basin during Two Drought Events: A Lagrangian Analysis. Atmosphere 2017, 8, 193. https://doi.org/10.3390/atmos8100193
AMA Style
Stojanovic M, Drumond A, Nieto R, Gimeno L. Moisture Transport Anomalies over the Danube River Basin during Two Drought Events: A Lagrangian Analysis. Atmosphere. 2017; 8(10):193. https://doi.org/10.3390/atmos8100193
Chicago/Turabian StyleStojanovic, Milica, Anita Drumond, Raquel Nieto, and Luis Gimeno. 2017. "Moisture Transport Anomalies over the Danube River Basin during Two Drought Events: A Lagrangian Analysis" Atmosphere 8, no. 10: 193. https://doi.org/10.3390/atmos8100193
Note that from the first issue of 2016, this journal uses article numbers instead of page numbers. See further details here.