Data Analysis of the TK-1G Sounding Rocket Installed with a Satellite Navigation System


1
College of Meteorology and Oceanography, National University of Defense Technology, Nanjing 211101, China
2
Collaborative Innovation Center on Forecast and Evaluation of Meteorological Disasters, Nanjing University of Information Science and Technology, Nanjing 210044, China
*
Author to whom correspondence should be addressed.
Atmosphere 2017, 8(10), 199; https://doi.org/10.3390/atmos8100199
Submission received: 13 July 2017
/
Revised: 30 August 2017
/
Accepted: 7 October 2017
/
Published: 11 October 2017
(This article belongs to the Special Issue Atmospheric Measurements with Unmanned Aerial Systems (UAS))
Abstract
:This article gives an in-depth analysis of the experimental data of the TK-1G sounding rocket installed with the satellite navigation system. It turns out that the data acquisition rate of the rocket sonde is high, making the collection of complete trajectory and meteorological data possible. By comparing the rocket sonde measurements with those obtained by virtue of other methods, we find that the rocket sonde can be relatively precise in measuring atmospheric parameters within the scope of 20–60 km above the ground. This establishes the fact that the TK-1G sounding rocket system is effective in detecting near-space atmospheric environment.
1. Introduction
The study of near space atmosphere is one of the frontiers of scientific research. The near space atmosphere is the exact path through which some aircrafts lift off and fly. In particular, the stratosphere and mesosphere region serve as the active area for airplanes, airships, and aerostats; also, the meteorological conditions of this region will exert a great impact on the flight safety of the aircrafts. Therefore, the detection of the near space atmosphere promises accurate and effective data on weather forecasts in the region and is of vital importance to the study of the near space atmosphere and flying safety of the aircrafts. A variety of ways have been tried like sounding balloons, radars, rockets, and occultation techniques in an attempt to study the characteristics of the near space atmosphere [1,2,3,4]. Although meteorological elements below 30 km can be detected by using sounding balloons, it is out of their reach when that height is between 30 km to 100 km, and occultation or radars are incapable of in-situ detection [5,6,7]. In that sense, sounding rockets serve as the main tool for accurate in-situ measurement of the atmosphere of that height.
Since 1945 when the first one was launched, various kinds of sounding rockets have appeared, such as America’s famous SCIFER-2 (Sounding of the Cleft Ion Fountain Energization Region) sounding rocket [8], Japan’s S-310, S-520, and SS-520 series of sounding rockets [9], Europe’s REXUS (Rocket Experiments for University Students) series of sounding rocket, and so on [10]. In order to acquire various sounding data, the sounding rocket tends to carry different sondes, such as TOTAL (stands for total number density), CONE (Combined sensor for Neutrals and Electrons), and the recently used LITOS (Leibniz-Institute Turbulence Observations in the Stratosphere) [11,12,13,14]. Through the processing of the rocket sounding data, numerous studies can be done. For example, with the use of the sounding data, Hall et al. [15] analyzed the plasma’s density; Abe et al. [16] did research on the dynamics and energetics of the lower thermosphere; and Eberhart et al. [17] measured the concentration of the atomic oxygen in the atmosphere. In addition, the rocket sounding data has often been synthesized and compared with the data acquired by other means. Strelnikov et al. [18] compared the radar-measured result of the middle atmospheric turbulence with rocketsonde-measured result separately; Fan et al. [19] compared the sounding rocket data with the experience prediction model and estimated the accuracy of the rocket sounding data.
However, China lags far behind the developed countries like the United States in the use of rockets for near-space detection due to its technological and financial constraints [19,20]. Thus, studies in this field are relatively scarce and defective. In the study of Sheng et al. [3], they analyzed the data garnered by China’s sounding rockets launched in 2004, but the rockets used to employ a traditional method of weather radar positioning to locate sondes. The wind speed obtained in this way thus differs sharply from that of the reference model (average about 6–8 m/s). The differences doubled in the upper stratosphere. As part of our efforts to bridge the gap in this regard, an flight experiment has been carried out on the latest model TK-1G sounding rocket with the satellite navigation system, and the accurate measurement of the meteorological elements has been realized at a height of 20–60 km (the height involved in this article refers to the height from the ground, unless otherwise specified), which is a step forward towards the improvement of the meteorological detection of near space.
2. Overview
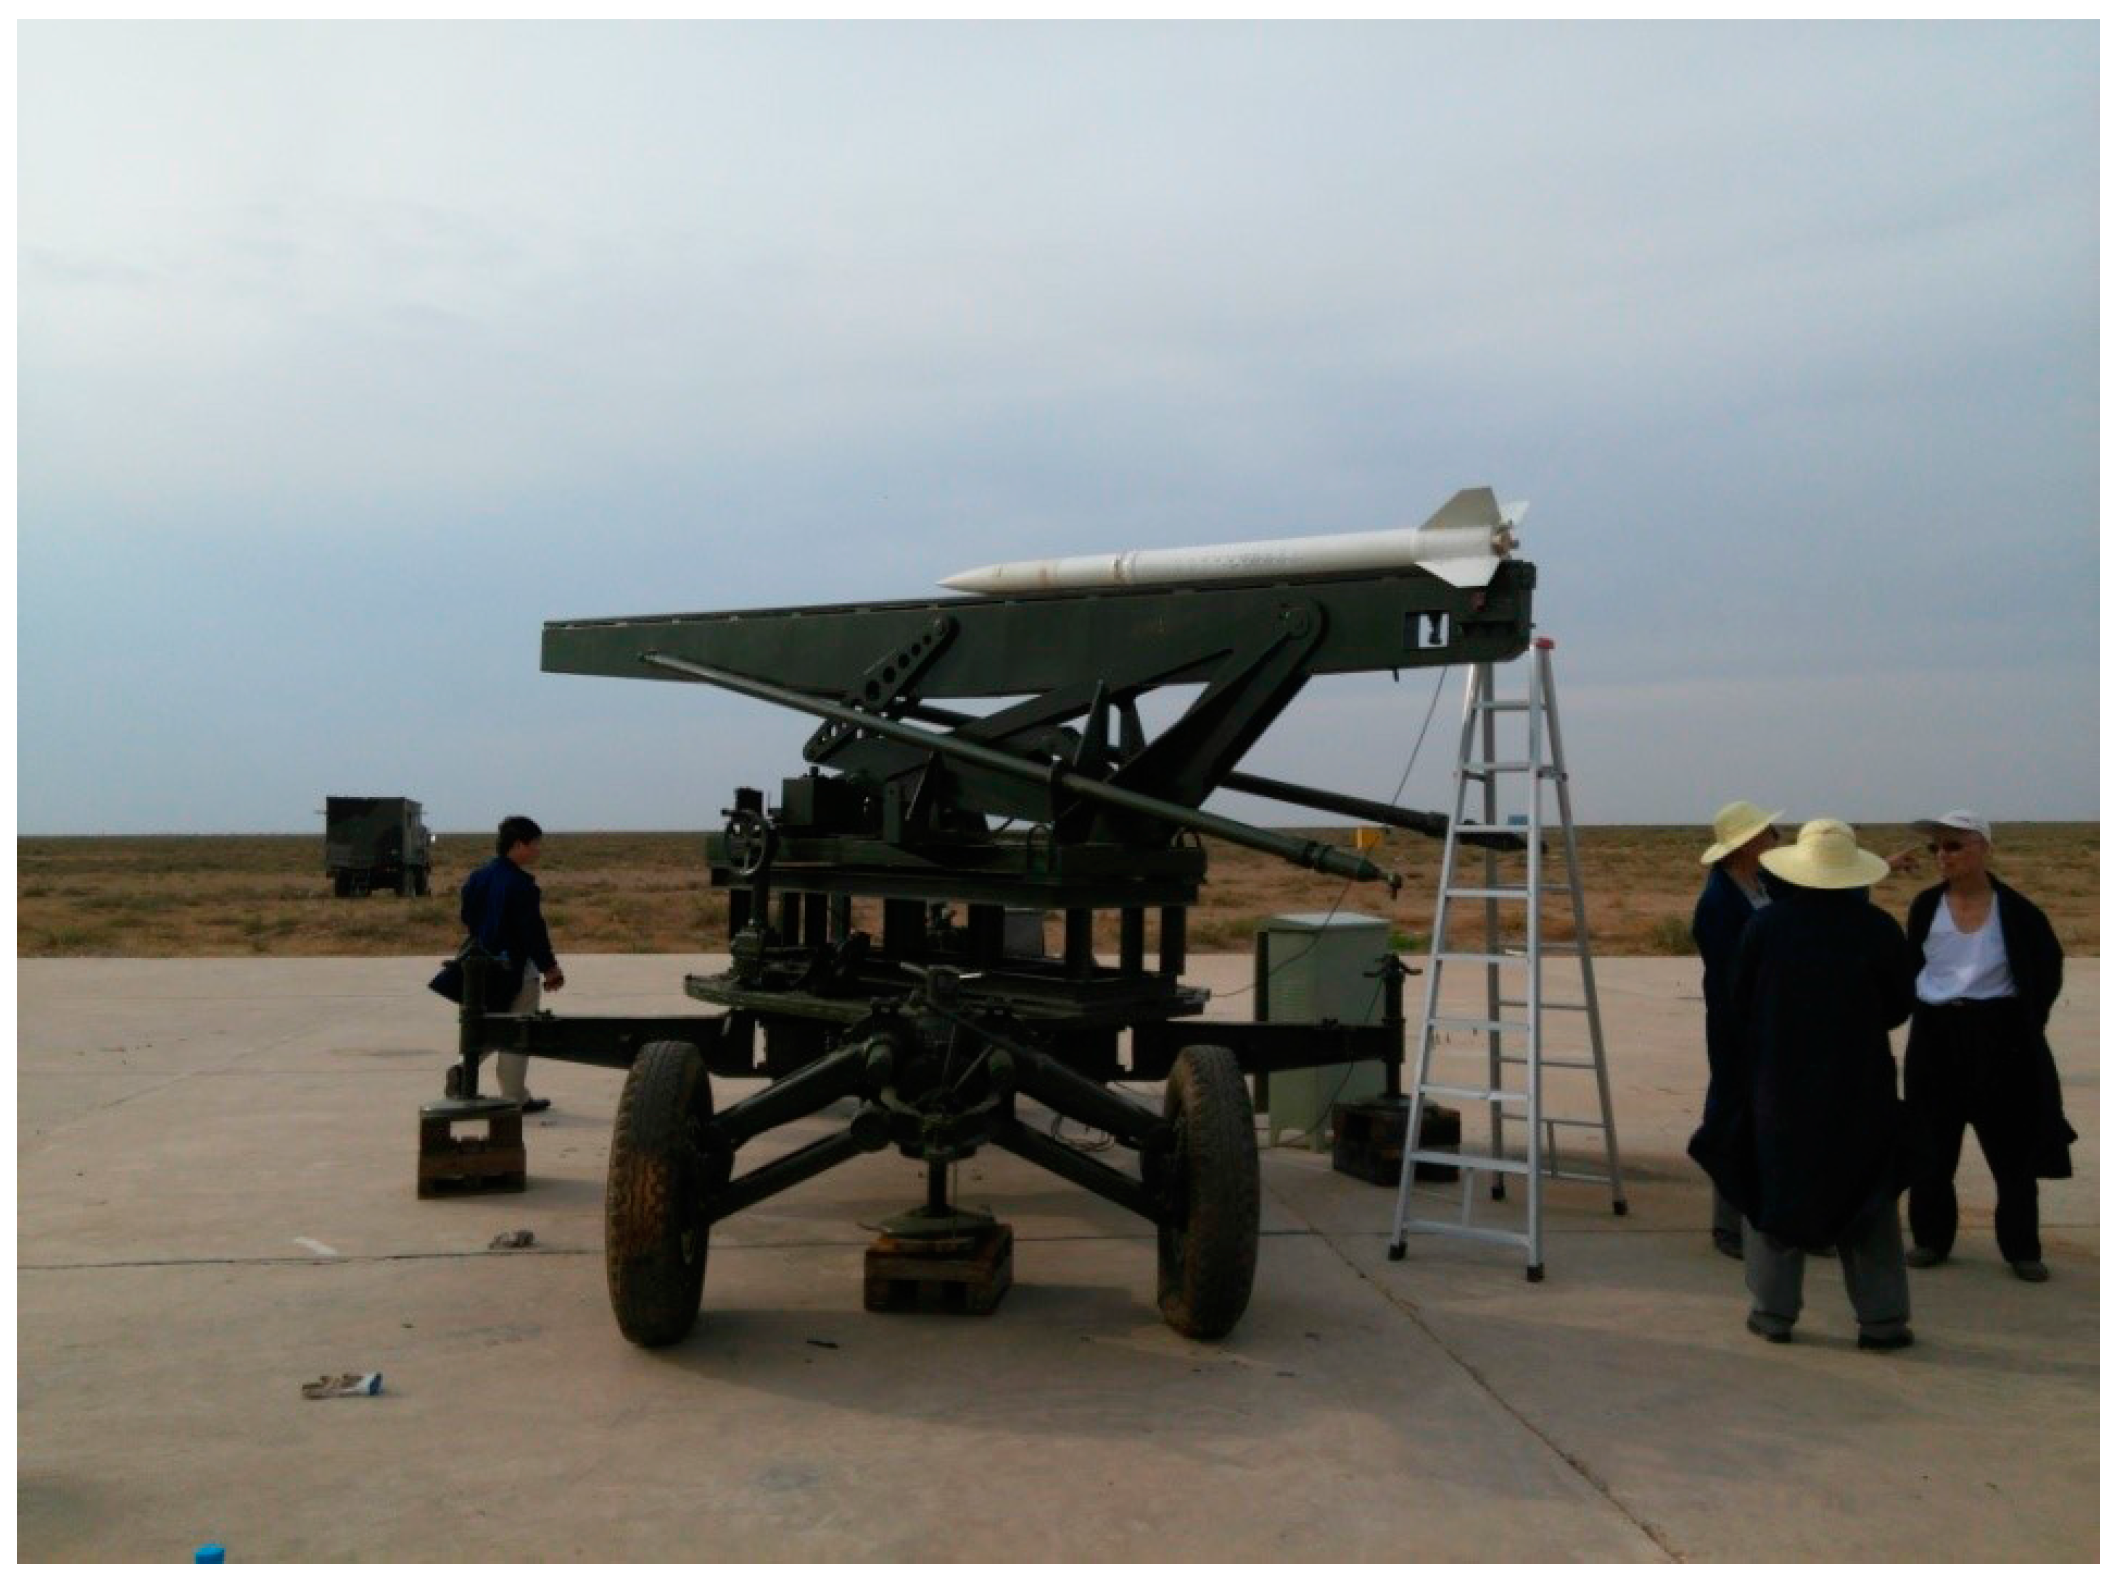
On 3 July 2015, a flight experiment on the rocket sonde installed with new satellite navigation system was conducted in Alxa Left Banner, China. As a director in charge of the data processing, the author had first-hand experience of the experiment and thus gained access to relevant data. Figure 1 shows the state of the rocket before launching.
The meteorological rocket detection system consists of four sub-systems: the meteorological rocket, the rocket sonde, the ground launch system (as well as the ground signal receiving station), and the data processing software with the rocket sonde at its core. After the launch, the rocket will take the rocket sonde near the top of the trajectory, and then the rocket ejection separation system will ignite, separating it from the main body of the rocket. Under air dynamic pressure, the parachute will be inflated to provide lift within a few seconds, carrying the sonde slowly and stably. During the process, atmospheric temperature will be measured by the temperature sensor and atmospheric pressure by the pressure sensor. All such figures will then be transmitted to ground receiving stations via transmitters and processed by data processing systems before the data related to atmospheric temperature, pressure, and density can be finally obtained. In addition, records of the falling trajectory of the parachute collected by means of the COMPASS (stands for Chinese Compass (BeiDou) Navigation Satellite System)/GPS positioning module can offer relevant readings of the wind direction and speed.
The rocket was launched at 6:30 a.m. During its flight, the rocket presented a smooth trajectory and the rocket sonde worked well. The COMPASS/GPS positioning module did not lose lock in condition of large acceleration during take-off or separation stage. The receiving system on the ground was able to gather the whole data during the entire process of rocket exploration. The experiment achieved the intended purpose and the rocket sonde with satellite-navigation system successfully realized 60–20 km positioning.
The coordinates of the launch site are 105°36′27′′ E, 38°45′28′′ N, with a height of 1429.8 m above sea level; the specified launch direction is 299°, and standardized theoretical launching elevation of the trajectory is 81.5°.
Three receiving stations are set up in this experiment. Station 1, equipped with portable ground automatic weather station to monitor real-time surface wind, locates at 150 m to the left of the launch site. Station 2 and 3 are situated approximately 6 km and 12 km, respectively, to the rear side of the launch site.
A balloon (750 g) was released one hour before launching, carrying a GPS sonde to detect the atmospheric condition between the ground and a height of 16 km. The wind data of the ground, 6 km and 11 km was used for correction of the rocket’s flight trajectory. The trajectory angle of elevation was adjusted to 82.3°, and the azimuth angle was adjusted to 296° after the wind correction. The rocket sonde was started to load the ephemeris 17 min before launching.
3. The Data Validity Rate in the Detection
The data validity rate in the detection is defined by the following formula: (the number of valid data packet/the number of receivable data packet) × 100%. It is employed to evaluate the reliability of the data acquisition system.
The data sampling frequency of the rocket sonde is 1 Hz. The rocket sonde reached the trajectory vertex at 6:32:21 a.m. and fell to the height of 20 km at 7:05:02 a.m. The duration of total detection lasted 1961s with 1961 data packets to be collected. After eliminating the error code spot and measurement-missing spot, the mean data validity rate in Station 1 was 89.65% and amounted to 95.7% after the supplement data from Station 2 and 3. The data validity rates at different heights of measurement are displayed in Table 1.
As shown in Table 1, the data validity rate of this test met the required criteria for a successful test (≥85%) in General Technical Requirements for the New Rocket Radiosonde, and the quality of data garnered by the satellite navigation system is better than that garnered by radar system. If more receiving stations were put into use to provide supplementary data, such validity rate should be further improved.
4. Data Processing and Analysis
The data transferred from the rocket sonde mainly include time, latitude and longitude, height, three-dimensional velocity vectors (north direction, east direction and vertical direction), star number, star location, star carrier-to-noise ratio, three-dimensional position dilution of precision (PDOP), atmospheric pressure, and atmospheric temperature.
4.1. Original Data Analysis
As shown in Table 2, the temperature value and the atmospheric pressure value measured by the prelaunch rocket sonde are consistent with those of the balloon sonde and the surface automatic weather station.
The temperature readings from the ground meteorological station and balloon sonde register ambient temperature, while those from the rocket sonde indicate the temperature in the fairing. As such, it is quite reasonable that there exist some differences in the measurements recorded by the rocket sonde and the meteorological station, as well as by the balloon sonde.
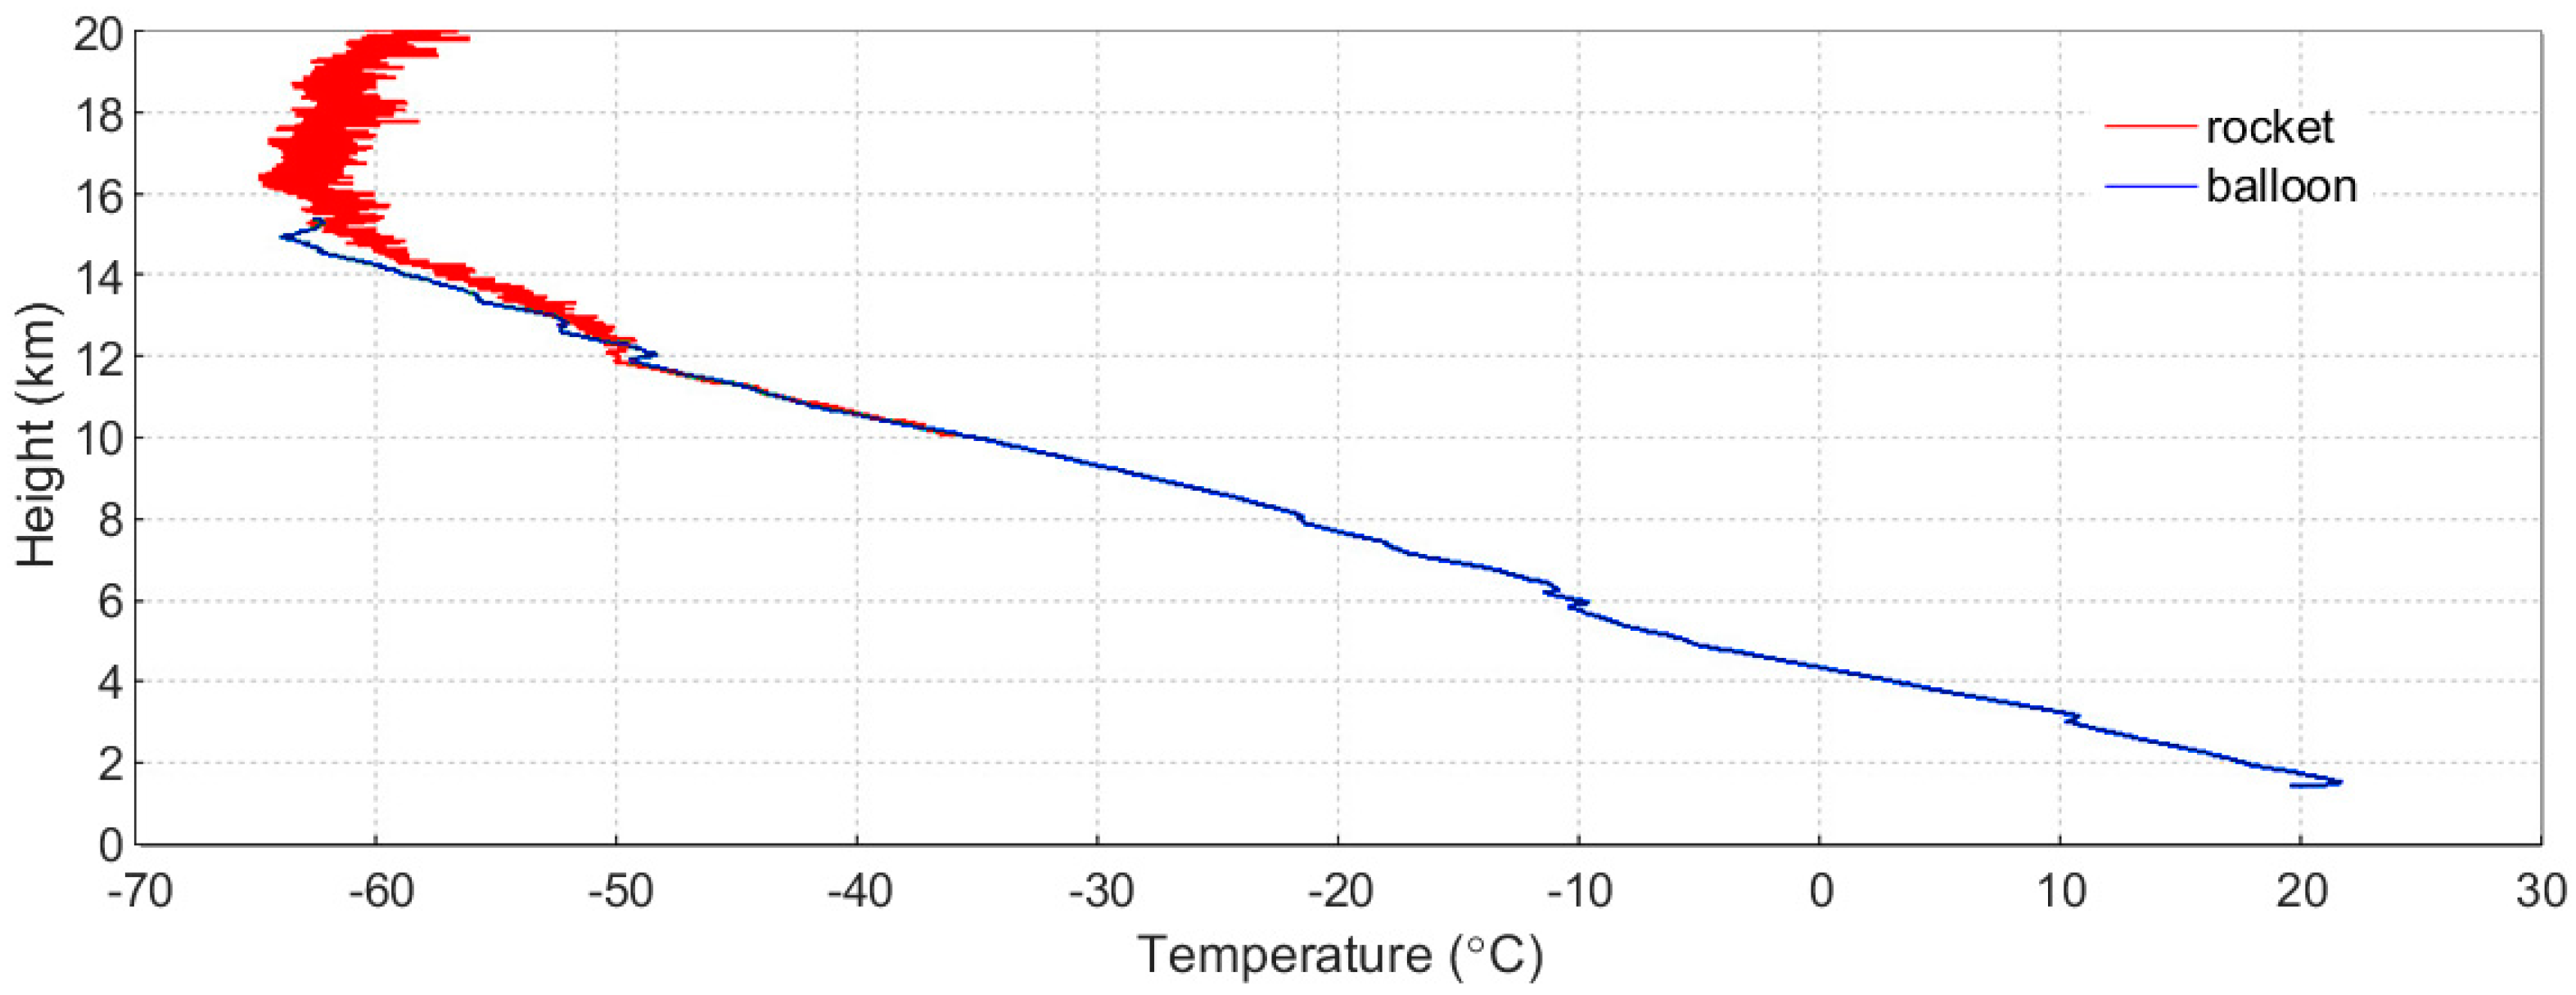
Figure 2 gives the comparison between the temperature measured by rocket sonde and balloon sonde in their coincident height range. From the figure, we can find out roughly similar trend between the two groups of temperature data below 12 km. In the range of 12–15 km above the ground, the temperature measured by rocket sonde is little higher than that gauged by the conventional sounding system. According to the previous studies made by Shi et al. [21], this is mainly because the sounding balloon is released one hour before that of the rocket, and the atmospheric state may change during this period of time, resulting in a difference in the temperature data measured by both.
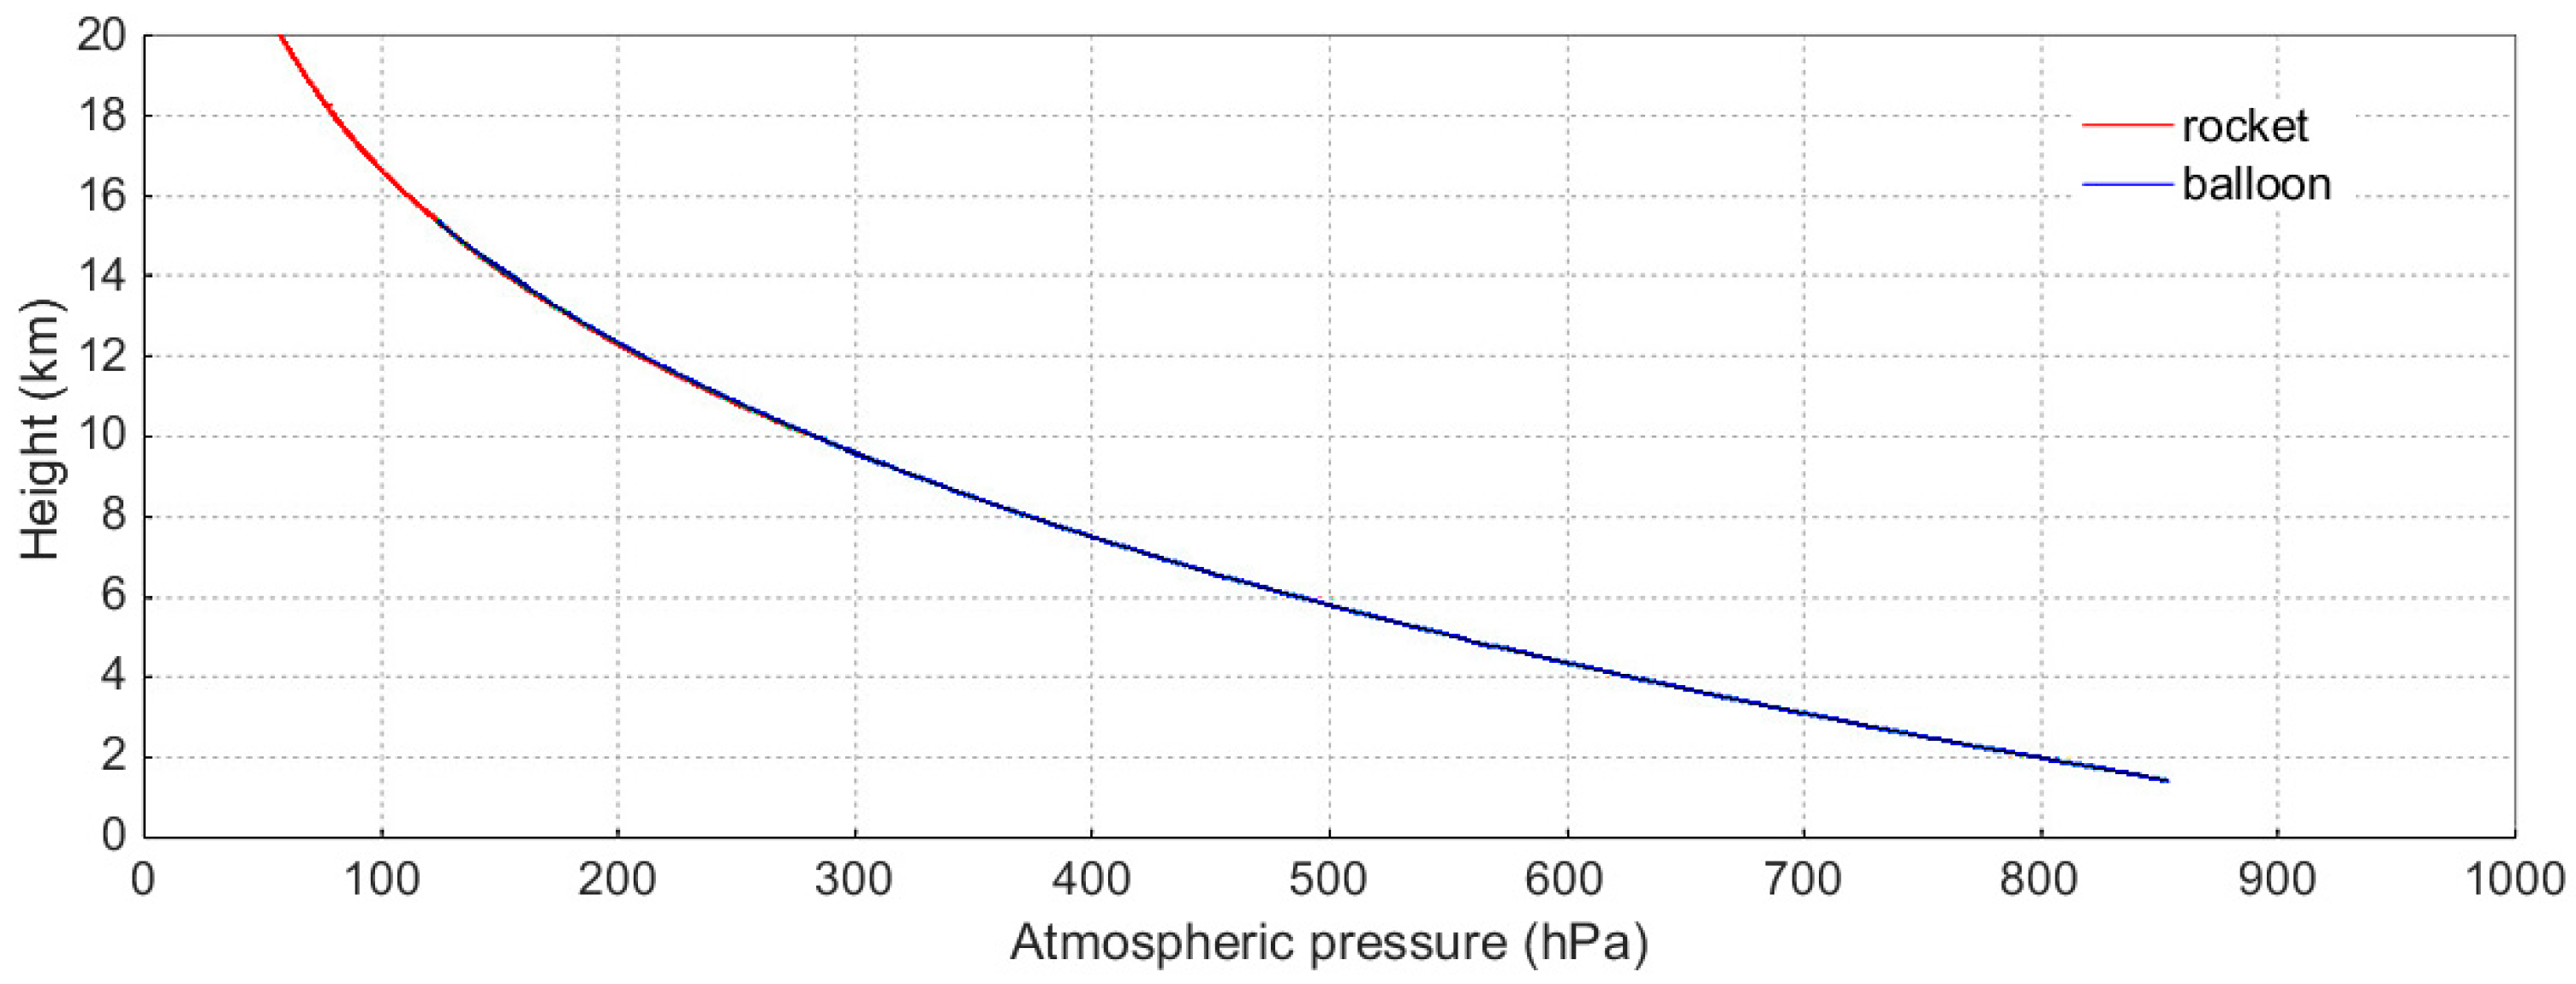
Figure 3 gives the comparison between the atmospheric pressure measured by rocket sonde and by balloon sonde in the coincident stage. It is noted that the two curves basically coincide with one another.
4.2. Result Analysis
4.2.1. Analysis of Body-Parachute System’s Fall Velocity
There is no comparability of the fall velocities in the range of 56.8 km to 59.6 km, due to the fact that the flight trajectory vertex could only reach 59.6 km and the body-parachute system got its balanced fall velocity at the height of 56.8 km during this test. The fall velocities below 56.8 km are smaller than the statistical data of the TK-1 sounding rockets because the weight of the body-parachute system is reduced from 3.4 kg to 3.0 kg. TK-1G dovetails with TY-4B sounding rocket system in the magnitude of fall velocity. The comparison of the fall velocities of different sounding rockets at major heights is listed in Table 3.
4.2.2. Analysis of the Meteorological Data
To further gauge the detection precision of the rocket, this paper draws a comparison between China’s reference atmospheric data, ECMWF-T799 (European Centre for Medium-Range Weather Forecasts) model data and satellite remote sensing data, and rocket sounding data. The rocket sonde data has been smoothed before comparison.
The reference atmosphere used in this paper refers to China’s GJB5601-2006 reference atmosphere. With ranges of 15° N–50° N, 75° E–130° E, it displays the atmospheric parameters up to 80 km above the ground. The horizontal resolution is 5° × 5°. Vertical intervals: 0.5 km, within 10 km above the ground; 1 km, 10 km to 30 km and 2 km, and 30 km to 80 km. Readings of monthly and annual average atmospheric temperature, pressure, humidity, density, and wind field are given through a comprehensive analysis of the distribution features of the atmospheric parameters [22].
The ECMWF-T799 (hereafter referred to as T799) analyses are derived from global four-dimensional assimilation of various atmospheric observations into the ECMWF model. Six-hourly output products have Δh of 0.25° and 91 vertical levels from the surface to 0.01 hPa. The vertical resolution Δz is ~0.4 km in the lower stratosphere and ~1–2 km in the stratosphere, respectively. It can offer meteorological parameters such as temperature, pressure, wind direction, wind speed, and so on [23]. Due to the limitations of spatial resolution, we have used the T799 forecasting data of the grid point (105.50° E, 38.75° N), which is nearest to the launch site and the rocket detection data, to draw a comparison.
TIMED (Thermosphere-Ionosphere-Mesosphere Energetics and Dynamics) satellite, whose orbital period is 97 min, operates at a height of 625 km above the ground with inclination of about 74.1° from the equator. Being one of the four instruments placed onboard the TIMED satellite, SABER (Sounding of the Atmosphere using Broadband Emission Radiometry) serves as a radiometer that measures infrared emissions from 1.27 mm to 15.2 mm from lower stratosphere to lower thermosphere [24]. SABER has the ability to measure temperature, pressure, density, and other parameters by dint of satellite infrared limb sounding technique with ten channels [25].
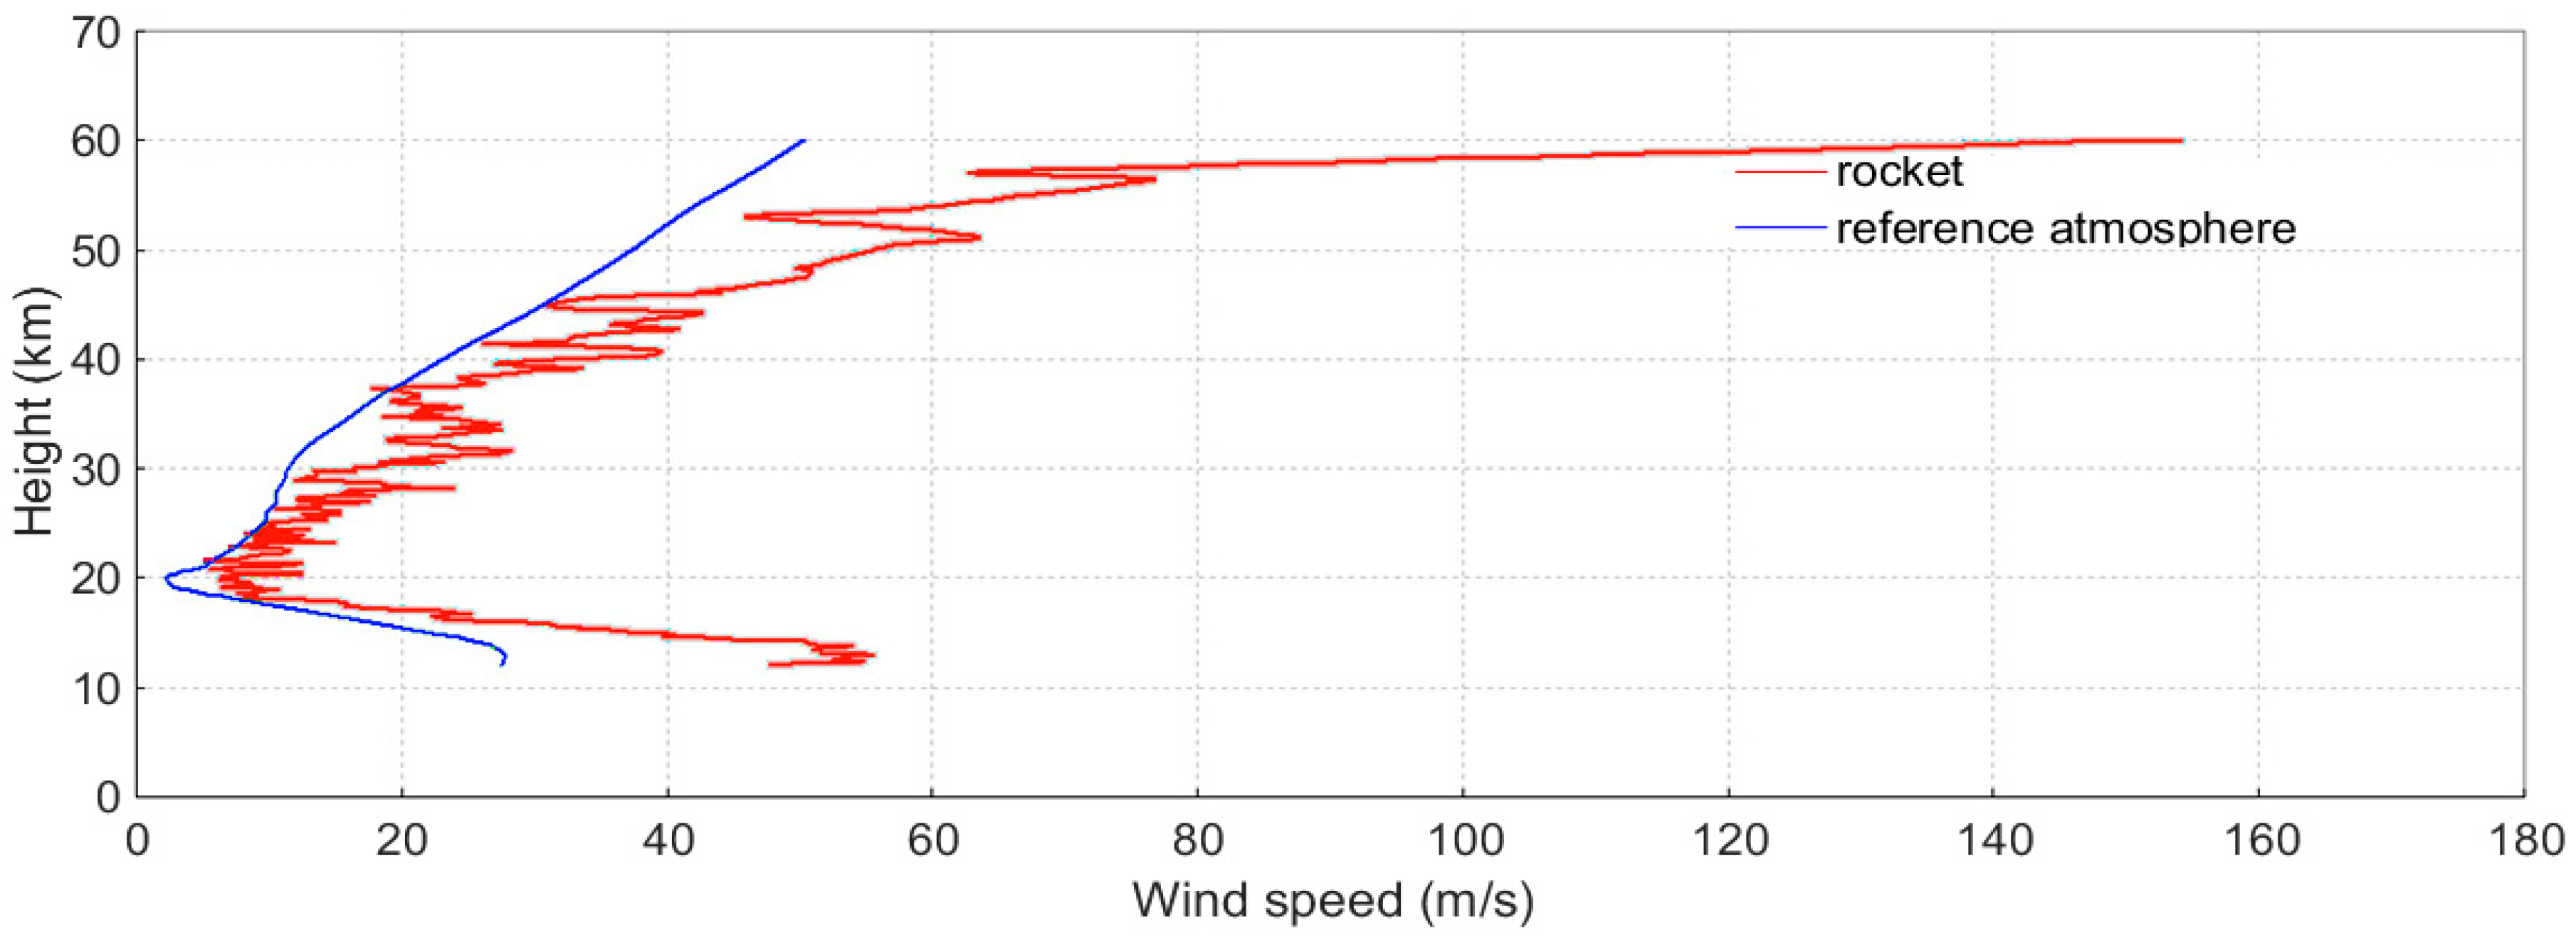
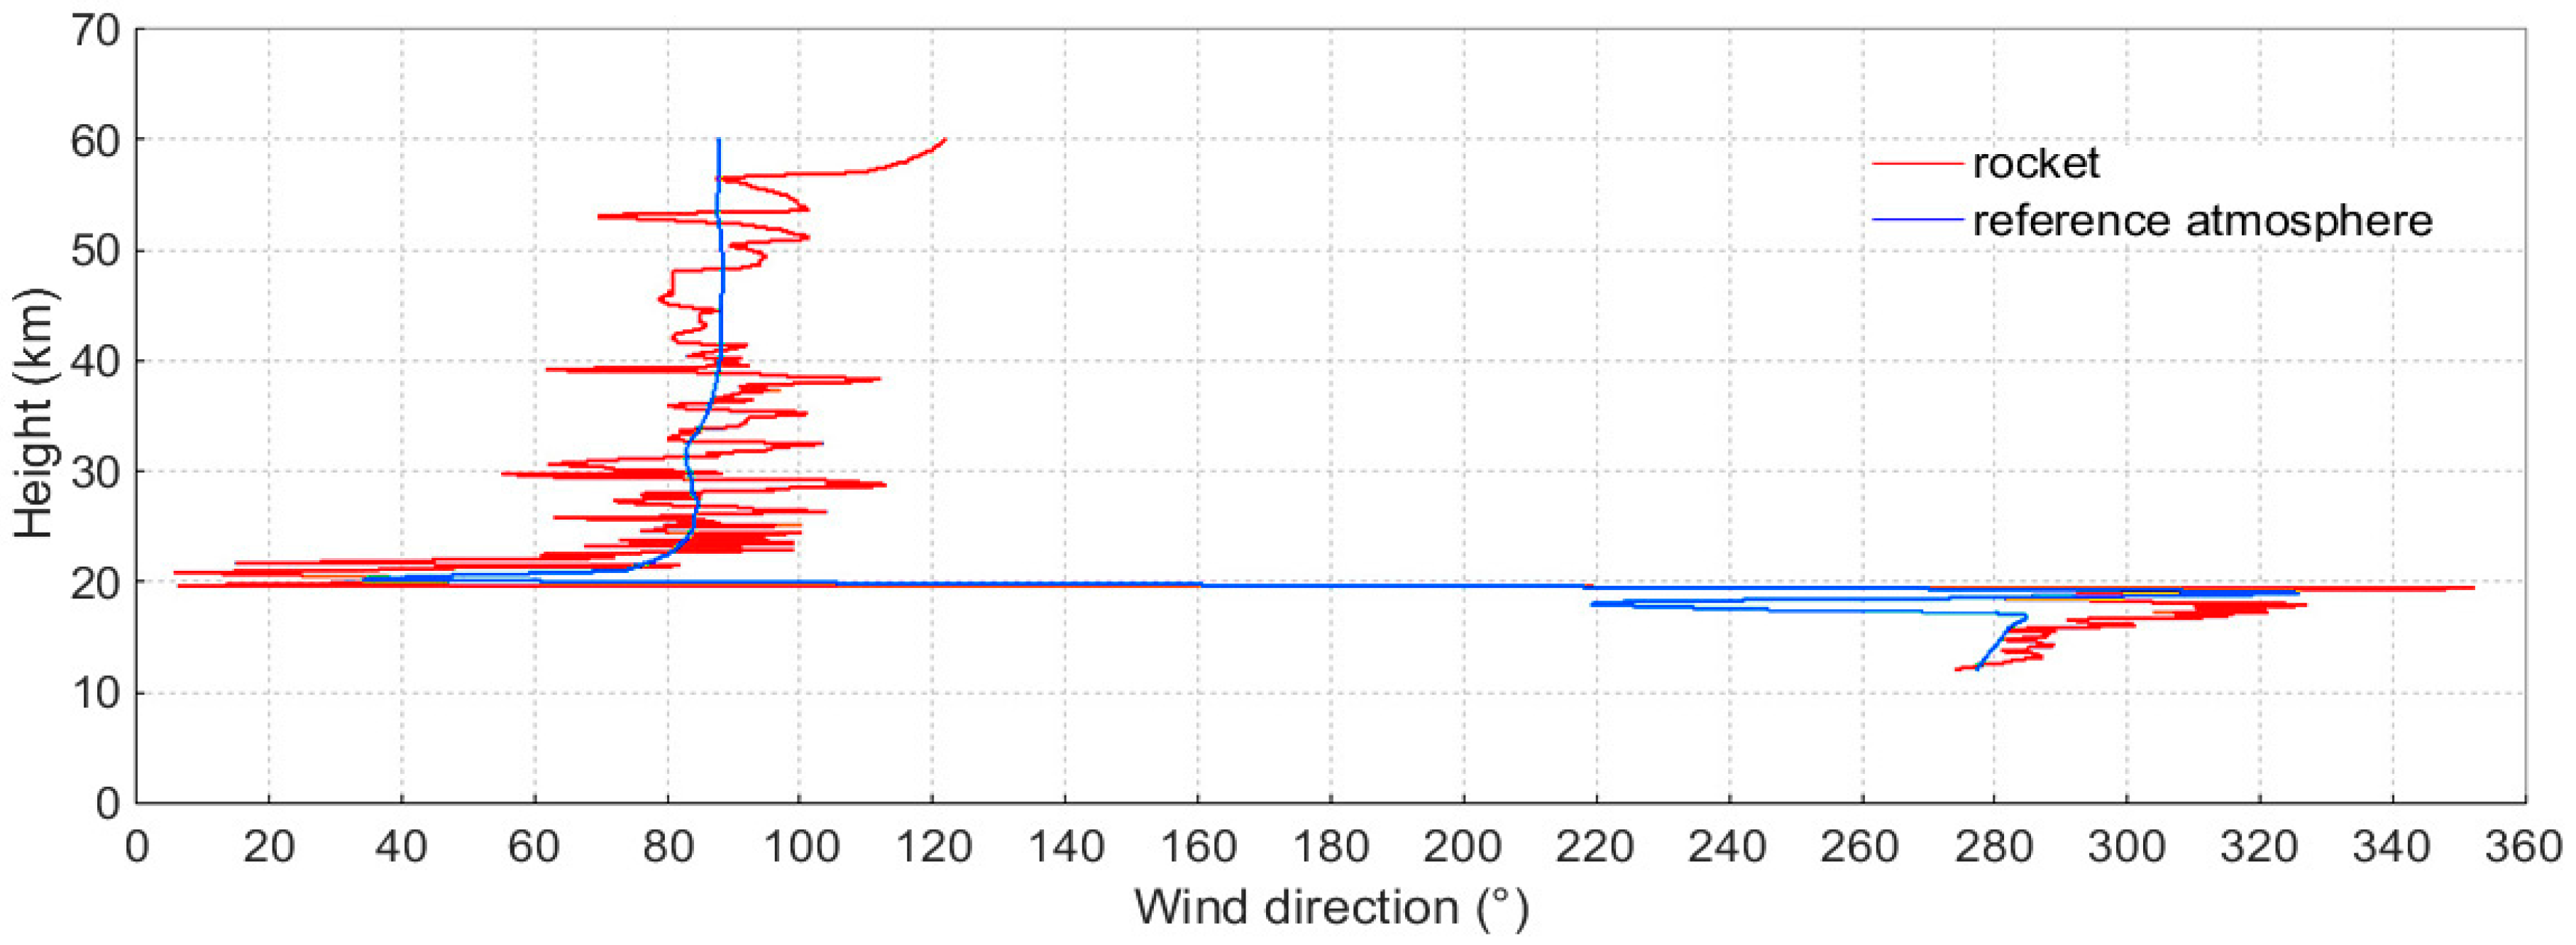
The comparison of the wind speed and direction obtained from the rocket sonde with the reference atmospheric data is shown, respectively, in Figure 4 and Figure 5. As shown in the figures, their tendency is consistent.
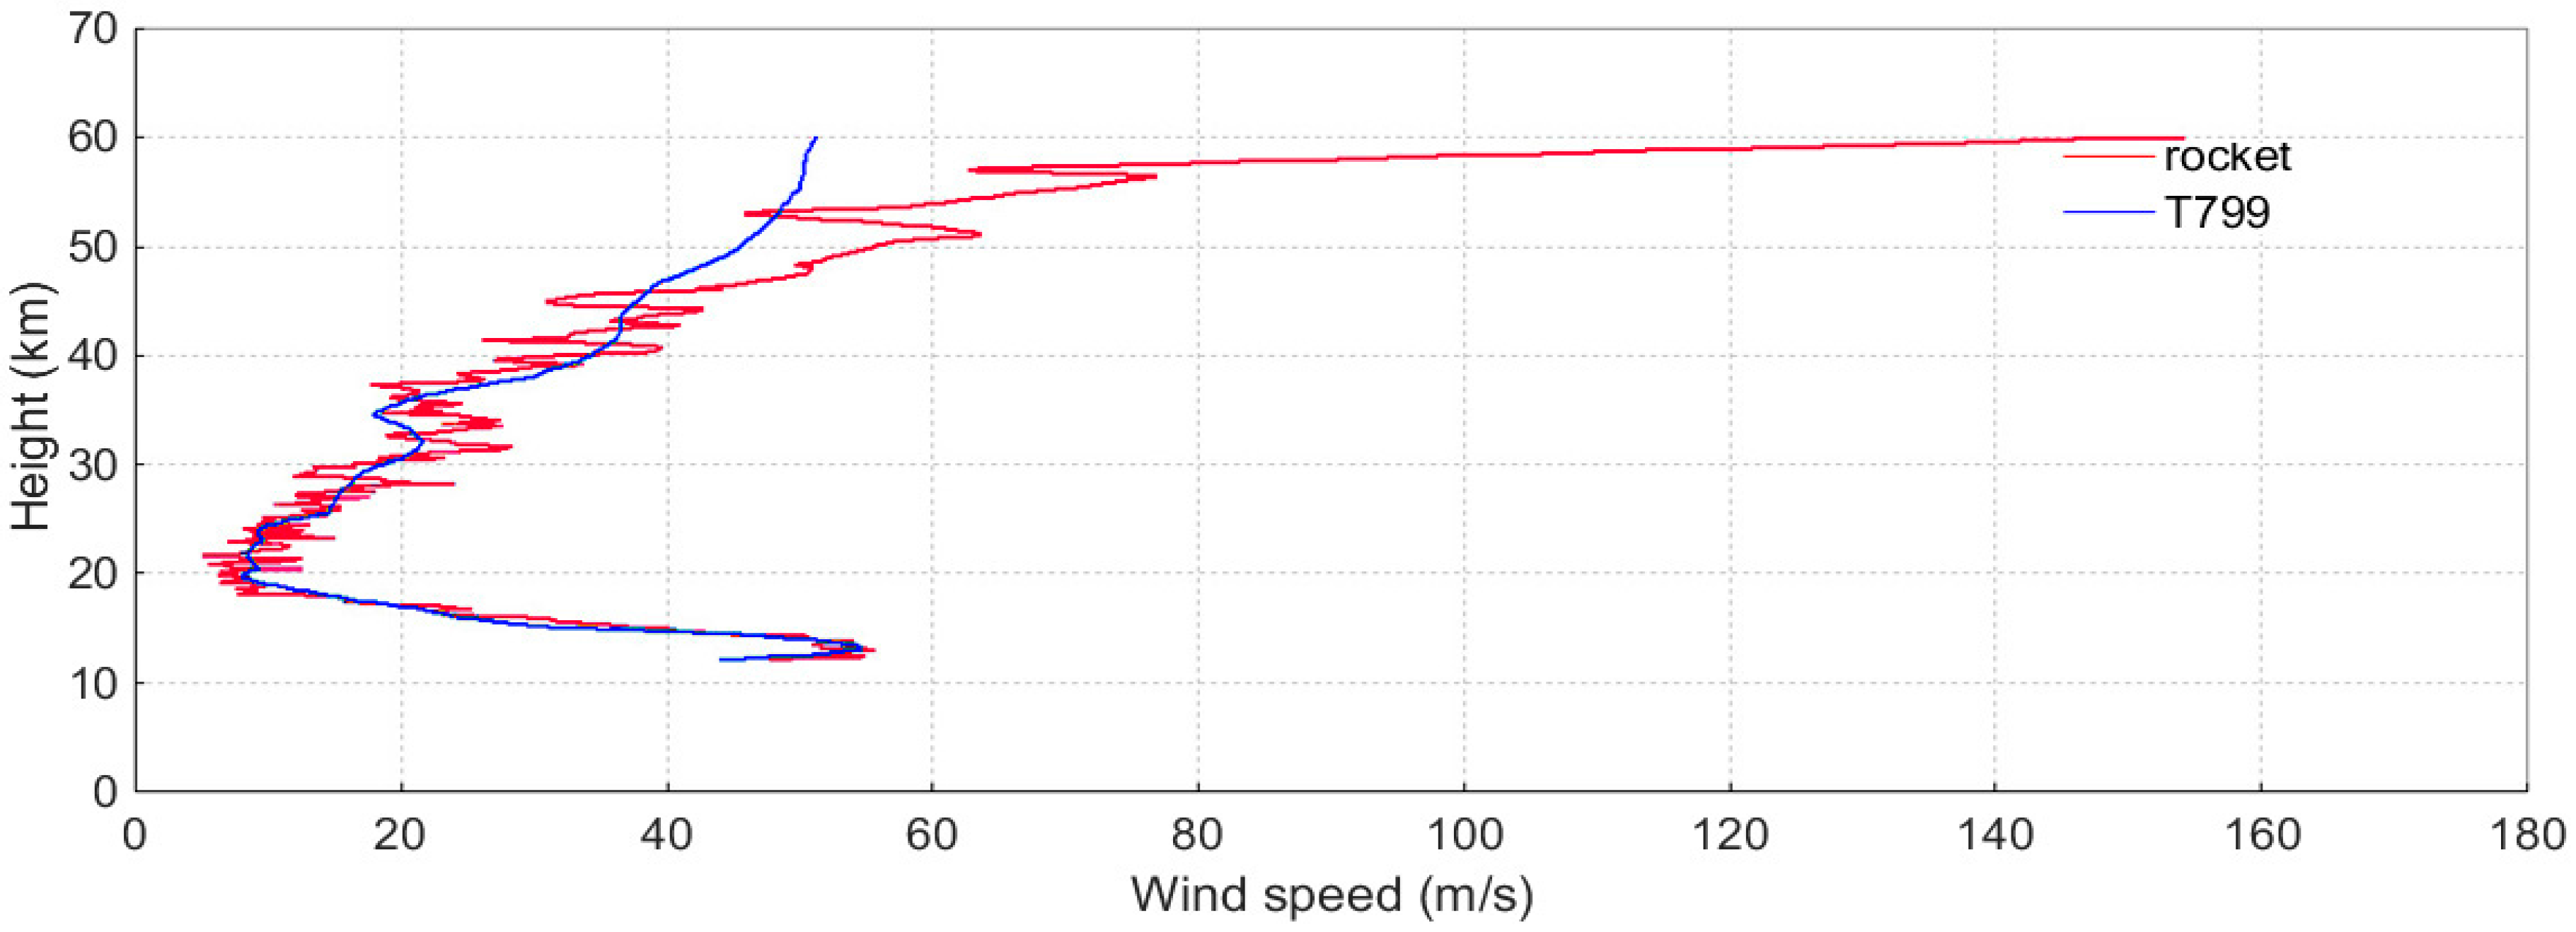
The comparison of the wind speed and direction measured by the rocket sonde and T799 is shown in Figure 6 and Figure 7. It is found that their tendency is coincident.
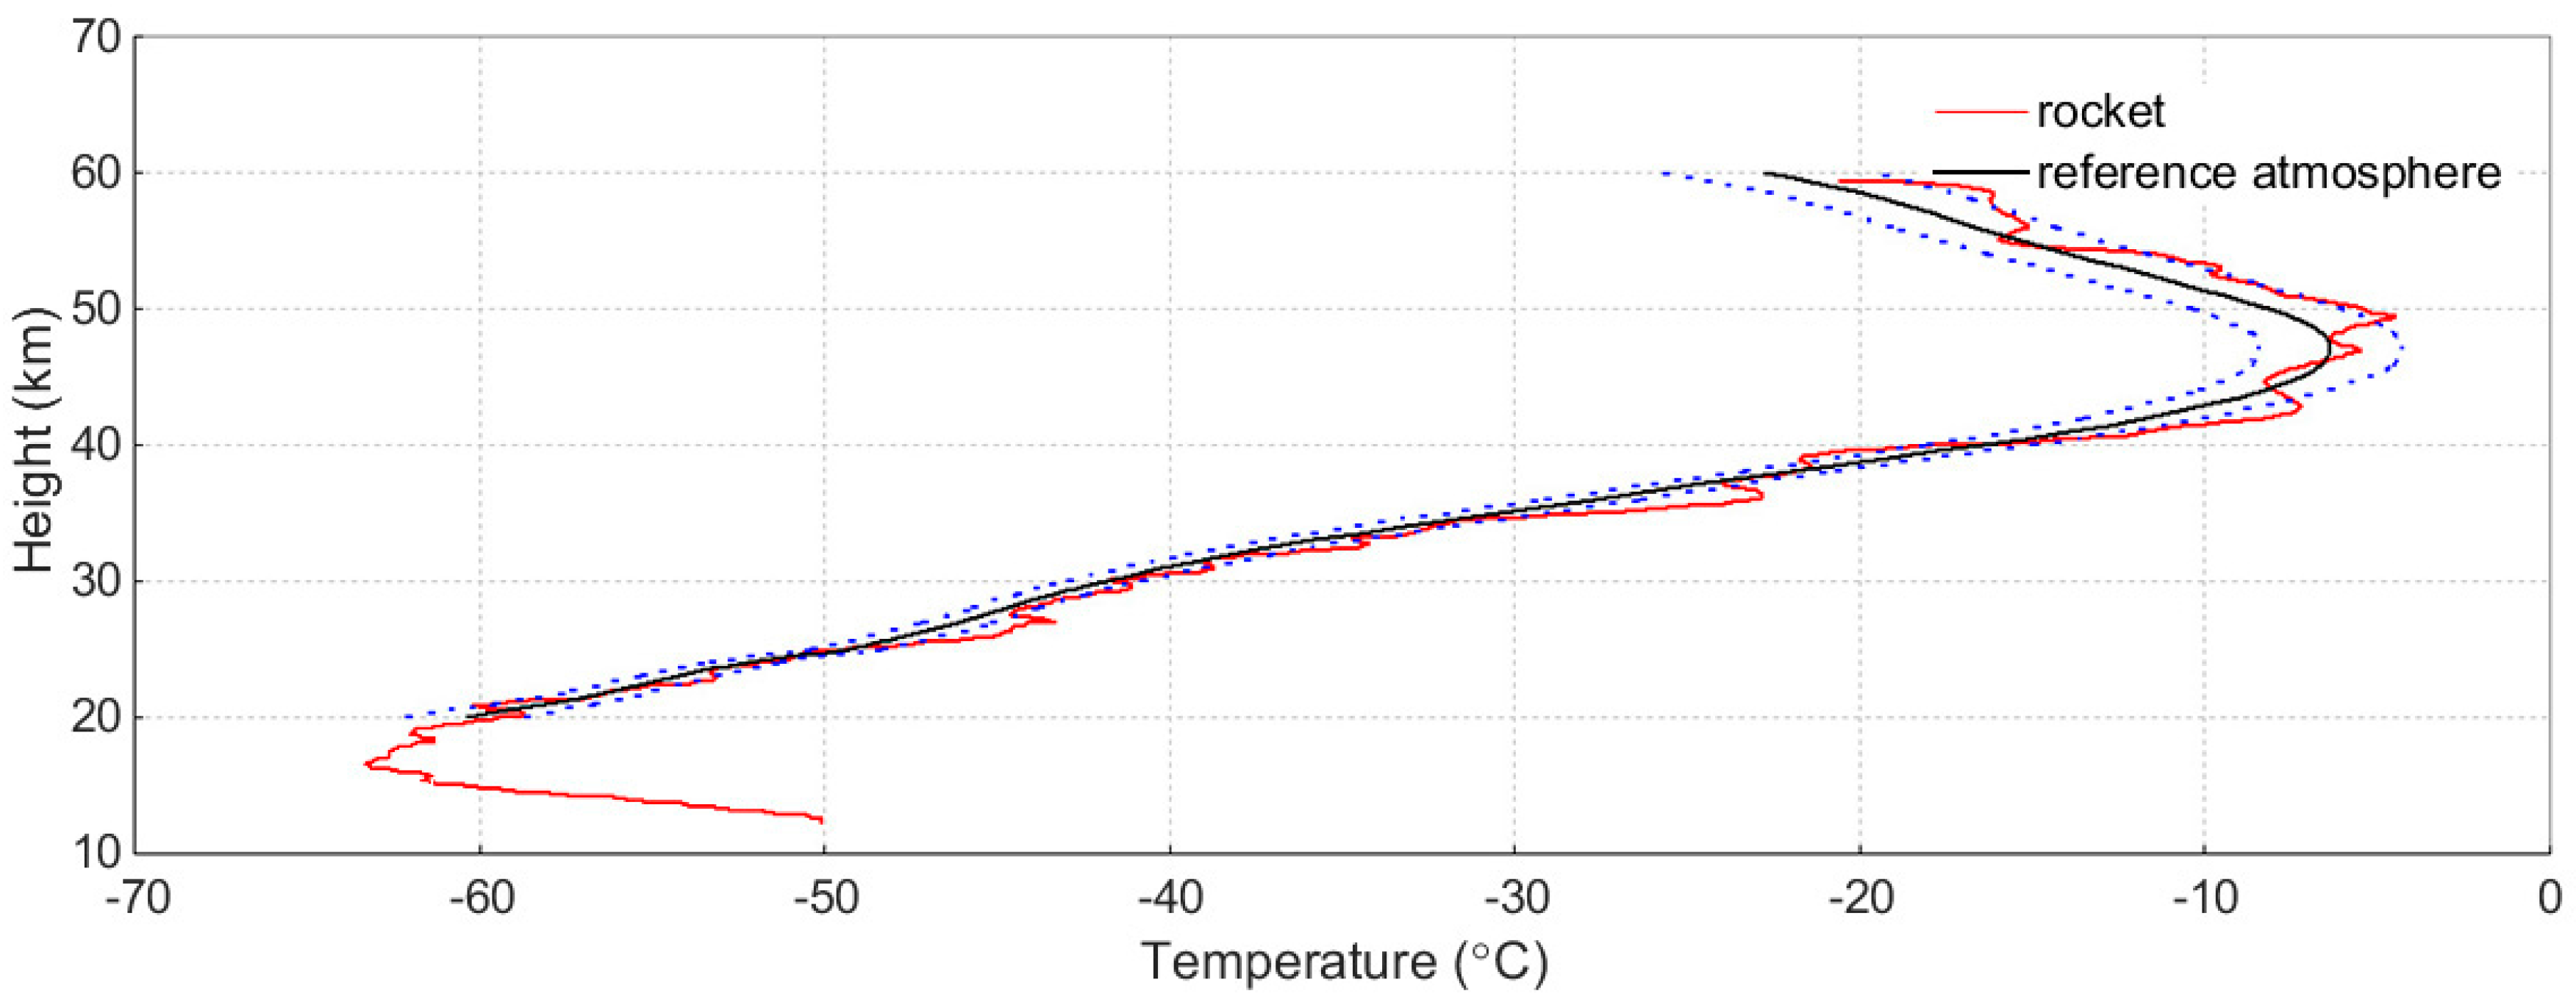
The comparison between the temperature data collected from the rocket sonde and the reference atmospheric data is shown in Figure 8, from which we can see the temperature curve of the rocket sonde shares similar tendency with that of the reference atmosphere. Also, the temperature curve of the rocket sonde mainly locates in the 3σ variance envelope curves of the reference atmosphere.
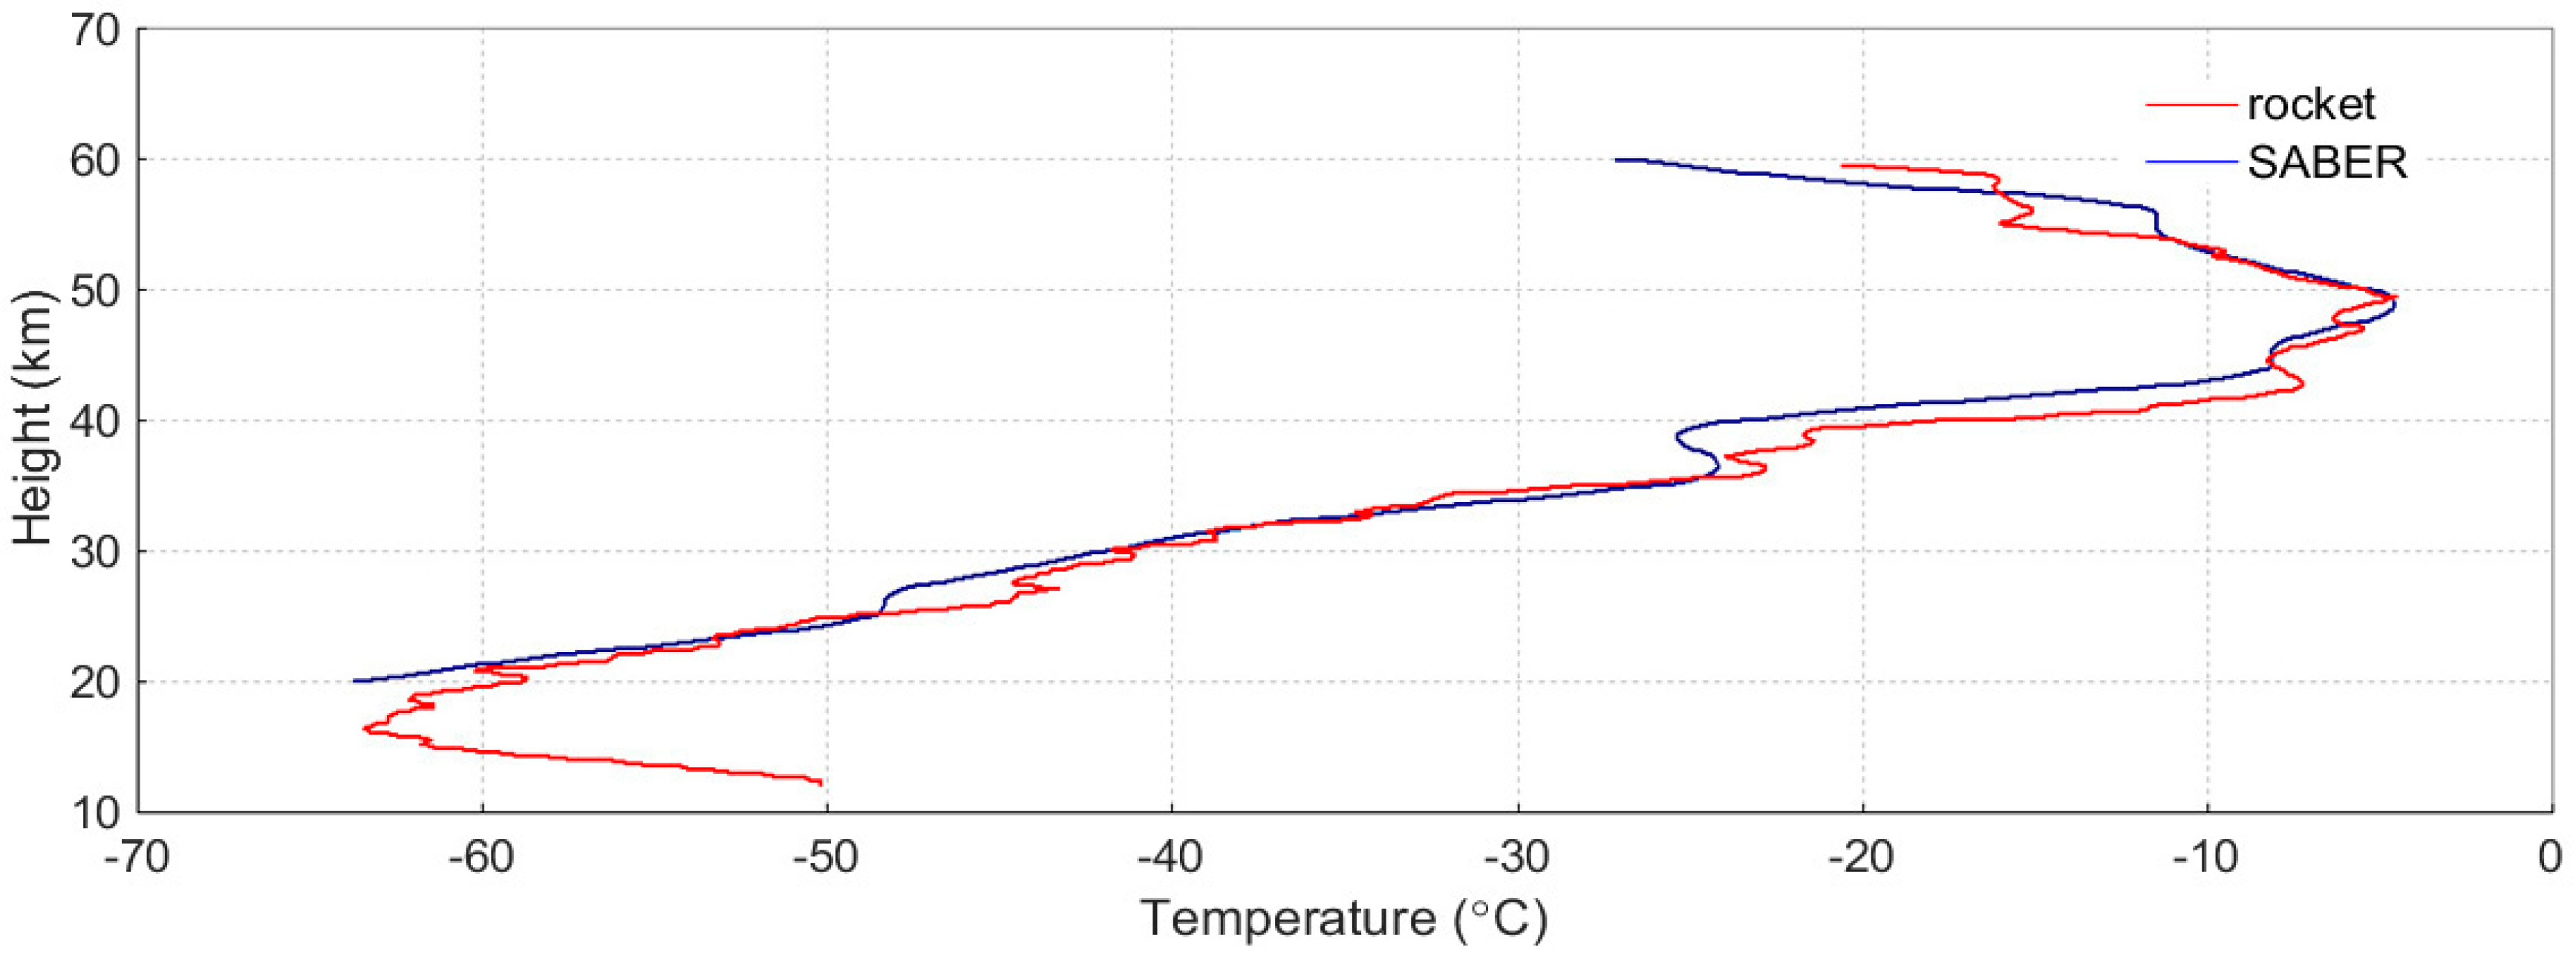
The temperature profiles obtained from the rocket sonde and the SABER are shown in Figure 9. From the figure, we can see consistency between the two curves, which dovetail nicely in terms of their detailed features.
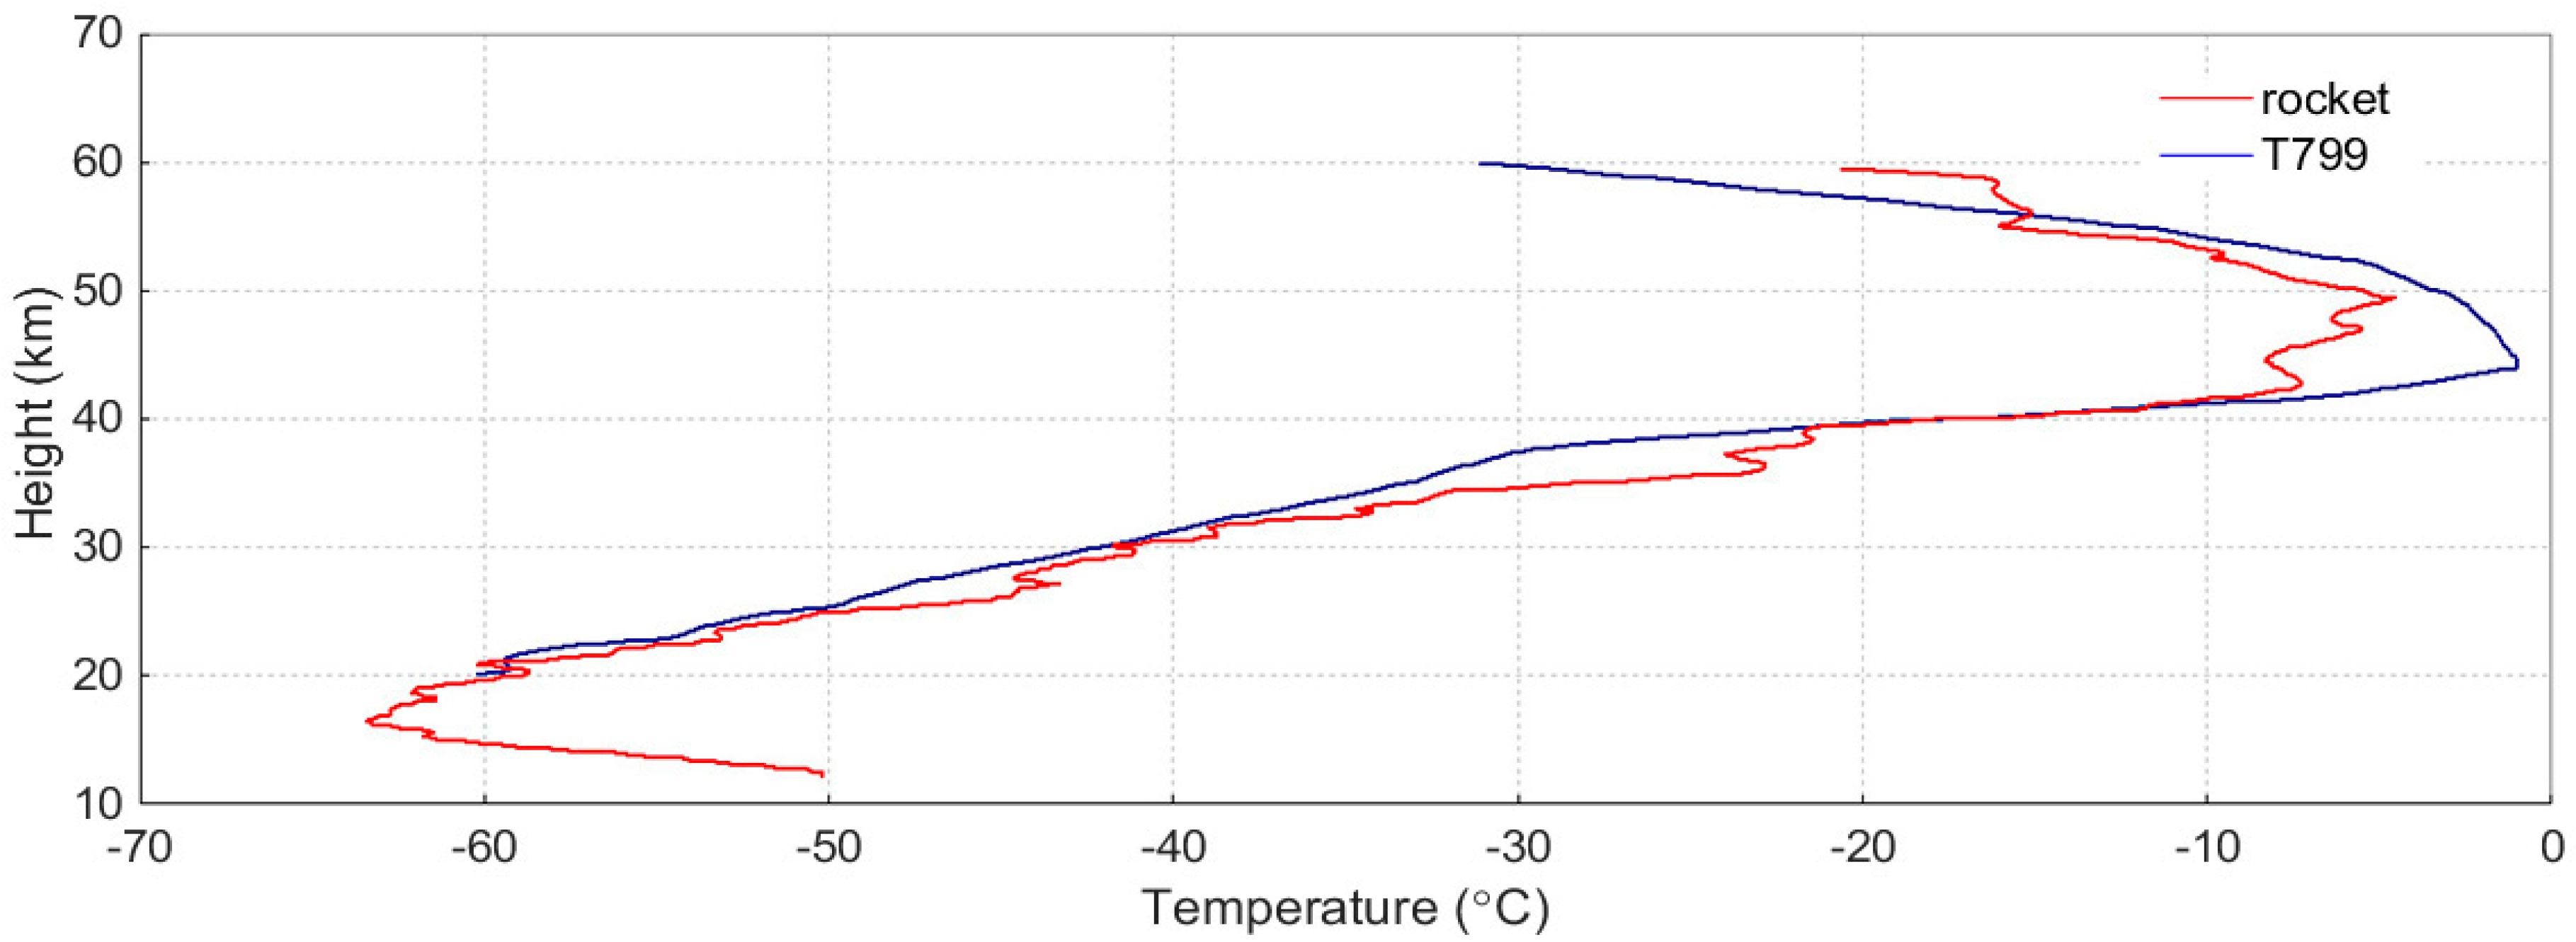
The temperature profiles obtained from the rocket sonde and the T799 is shown in Figure 10. In the figure, the result of rocket sonde shares coincident tendency with the result of T799, but large deviation appears in the height range of 42–50 km.
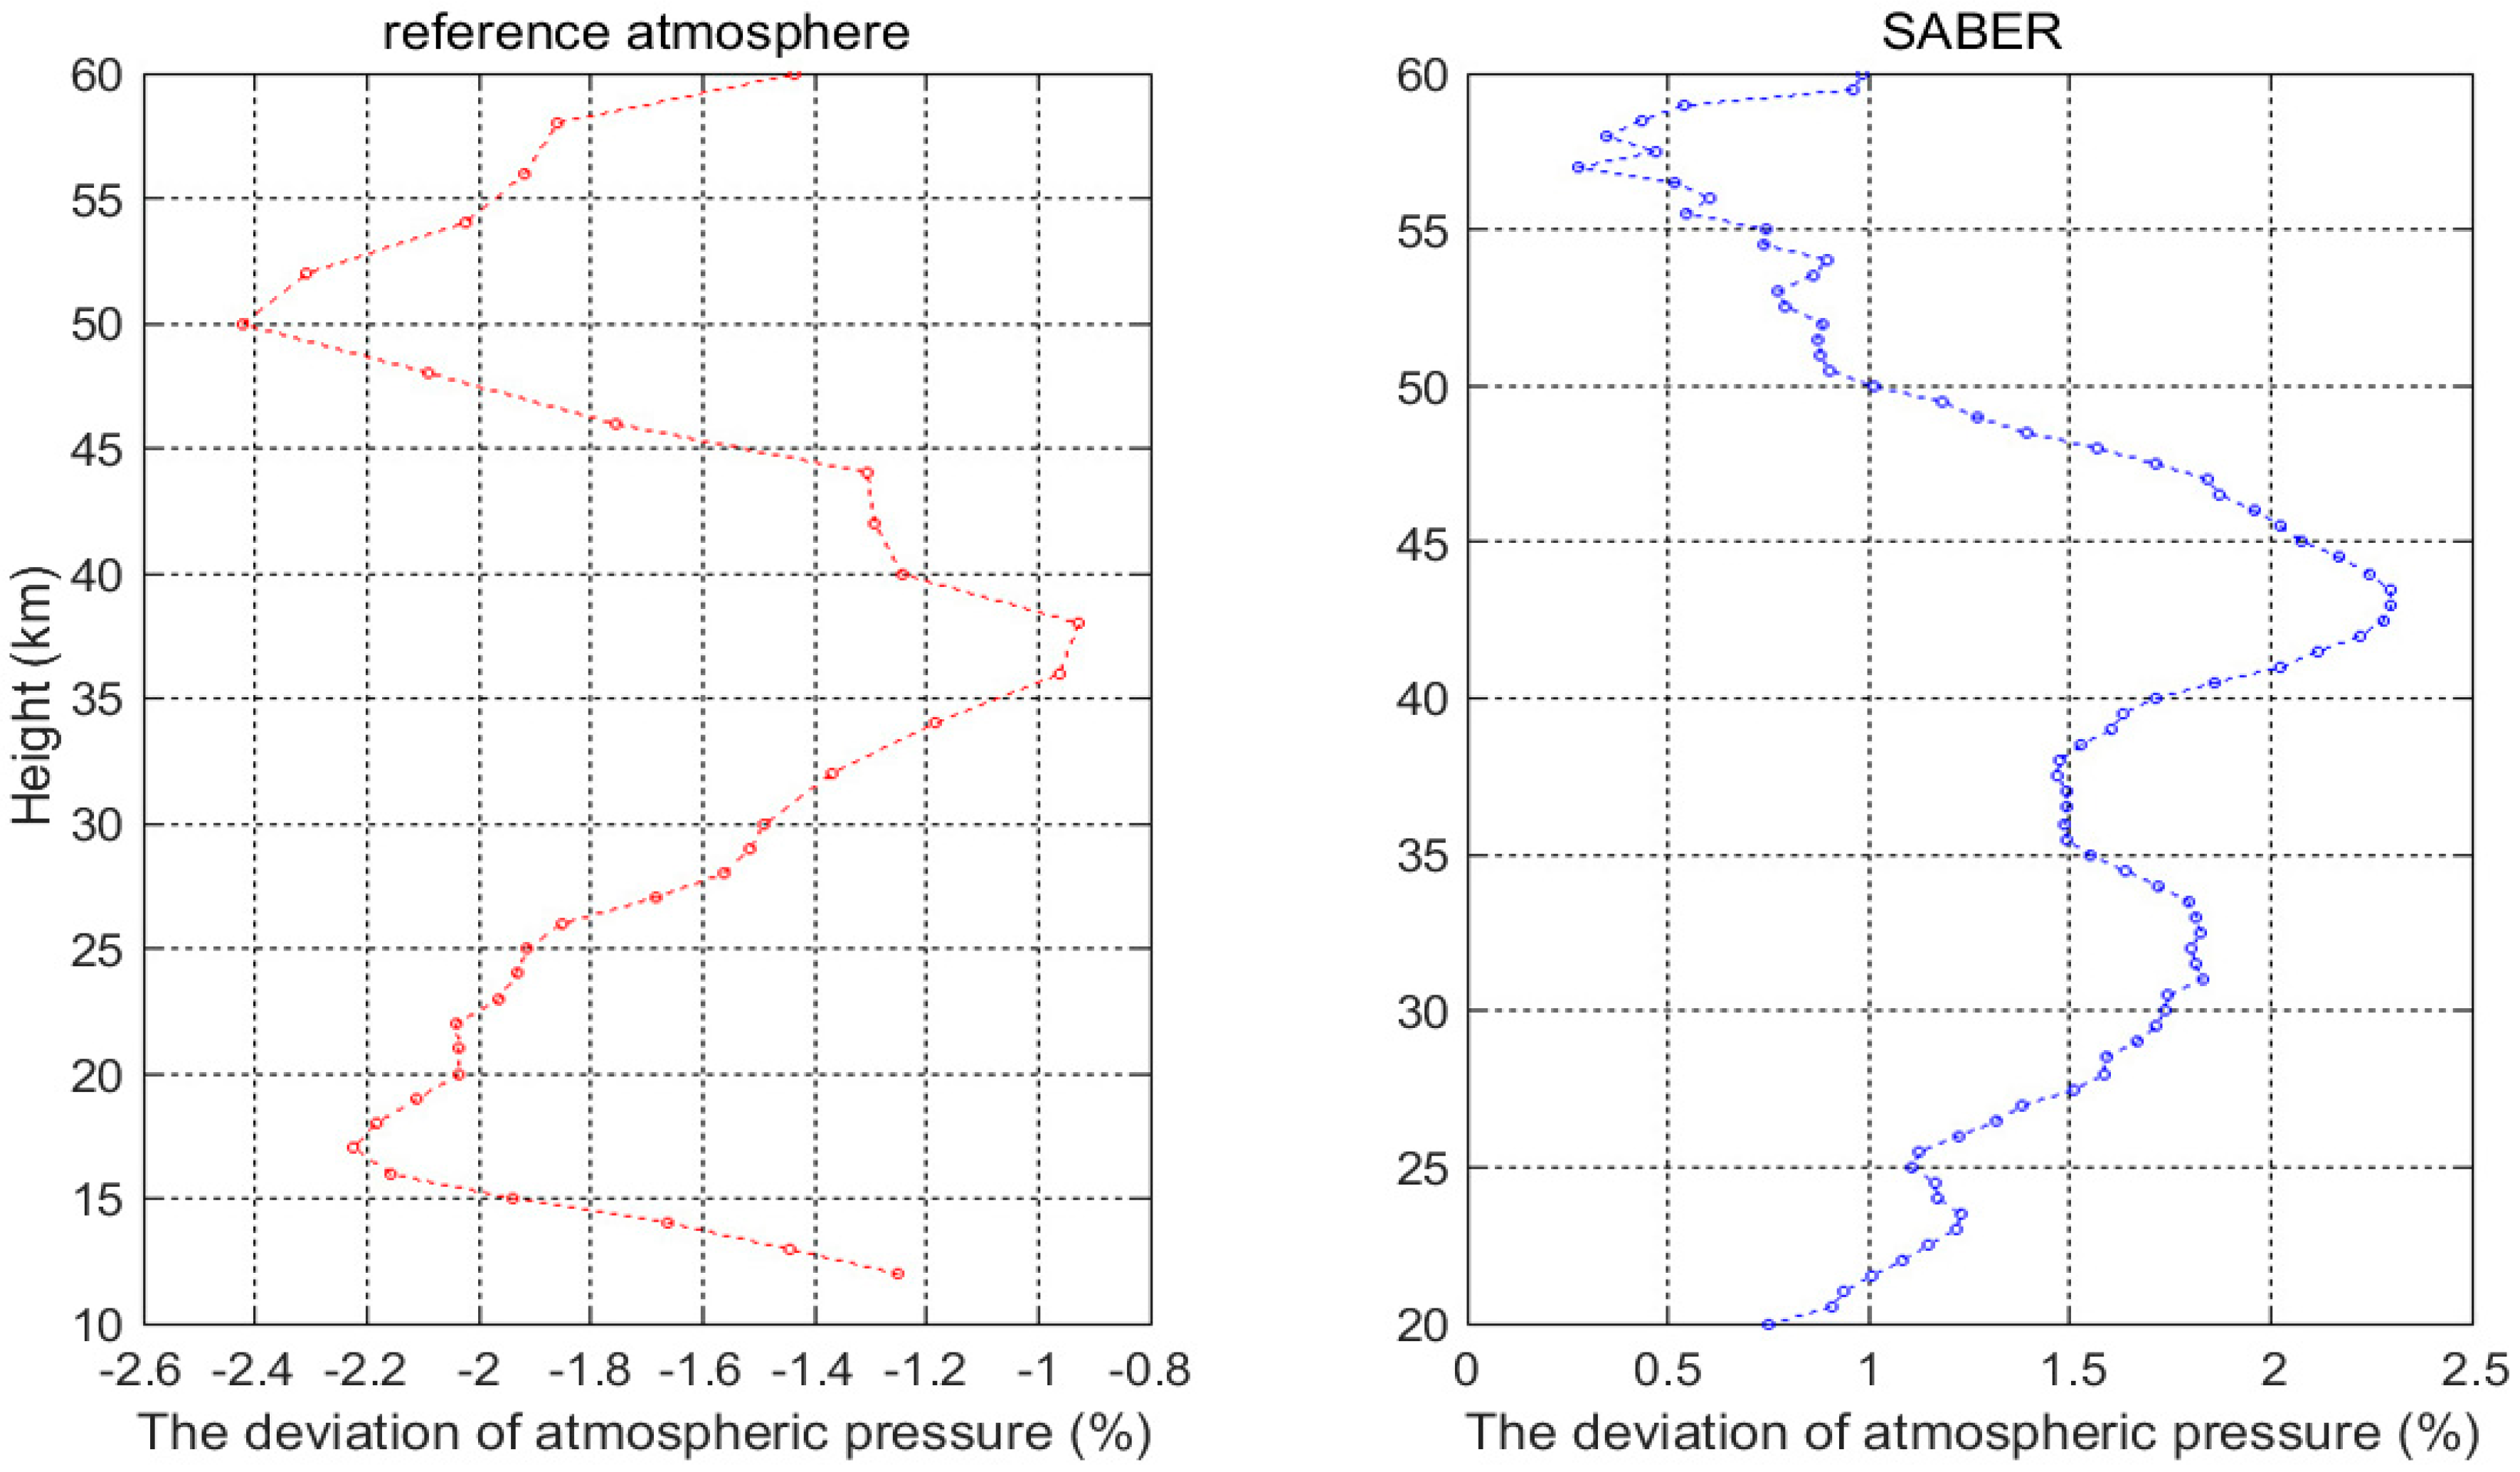
Differences between the atmospheric pressure and density obtained by the rocket sonde and those collected in other ways are displayed in Figure 11 and Figure 12. From Figure 11, it is found that the atmospheric pressure measurements differ a little bit from the reference atmosphere and SABER data, and their relative deviation are both within ±2.4%. (deviation percentage = (rocket probe value − the value of the data used for comparison)/rocket probe value × 100%).
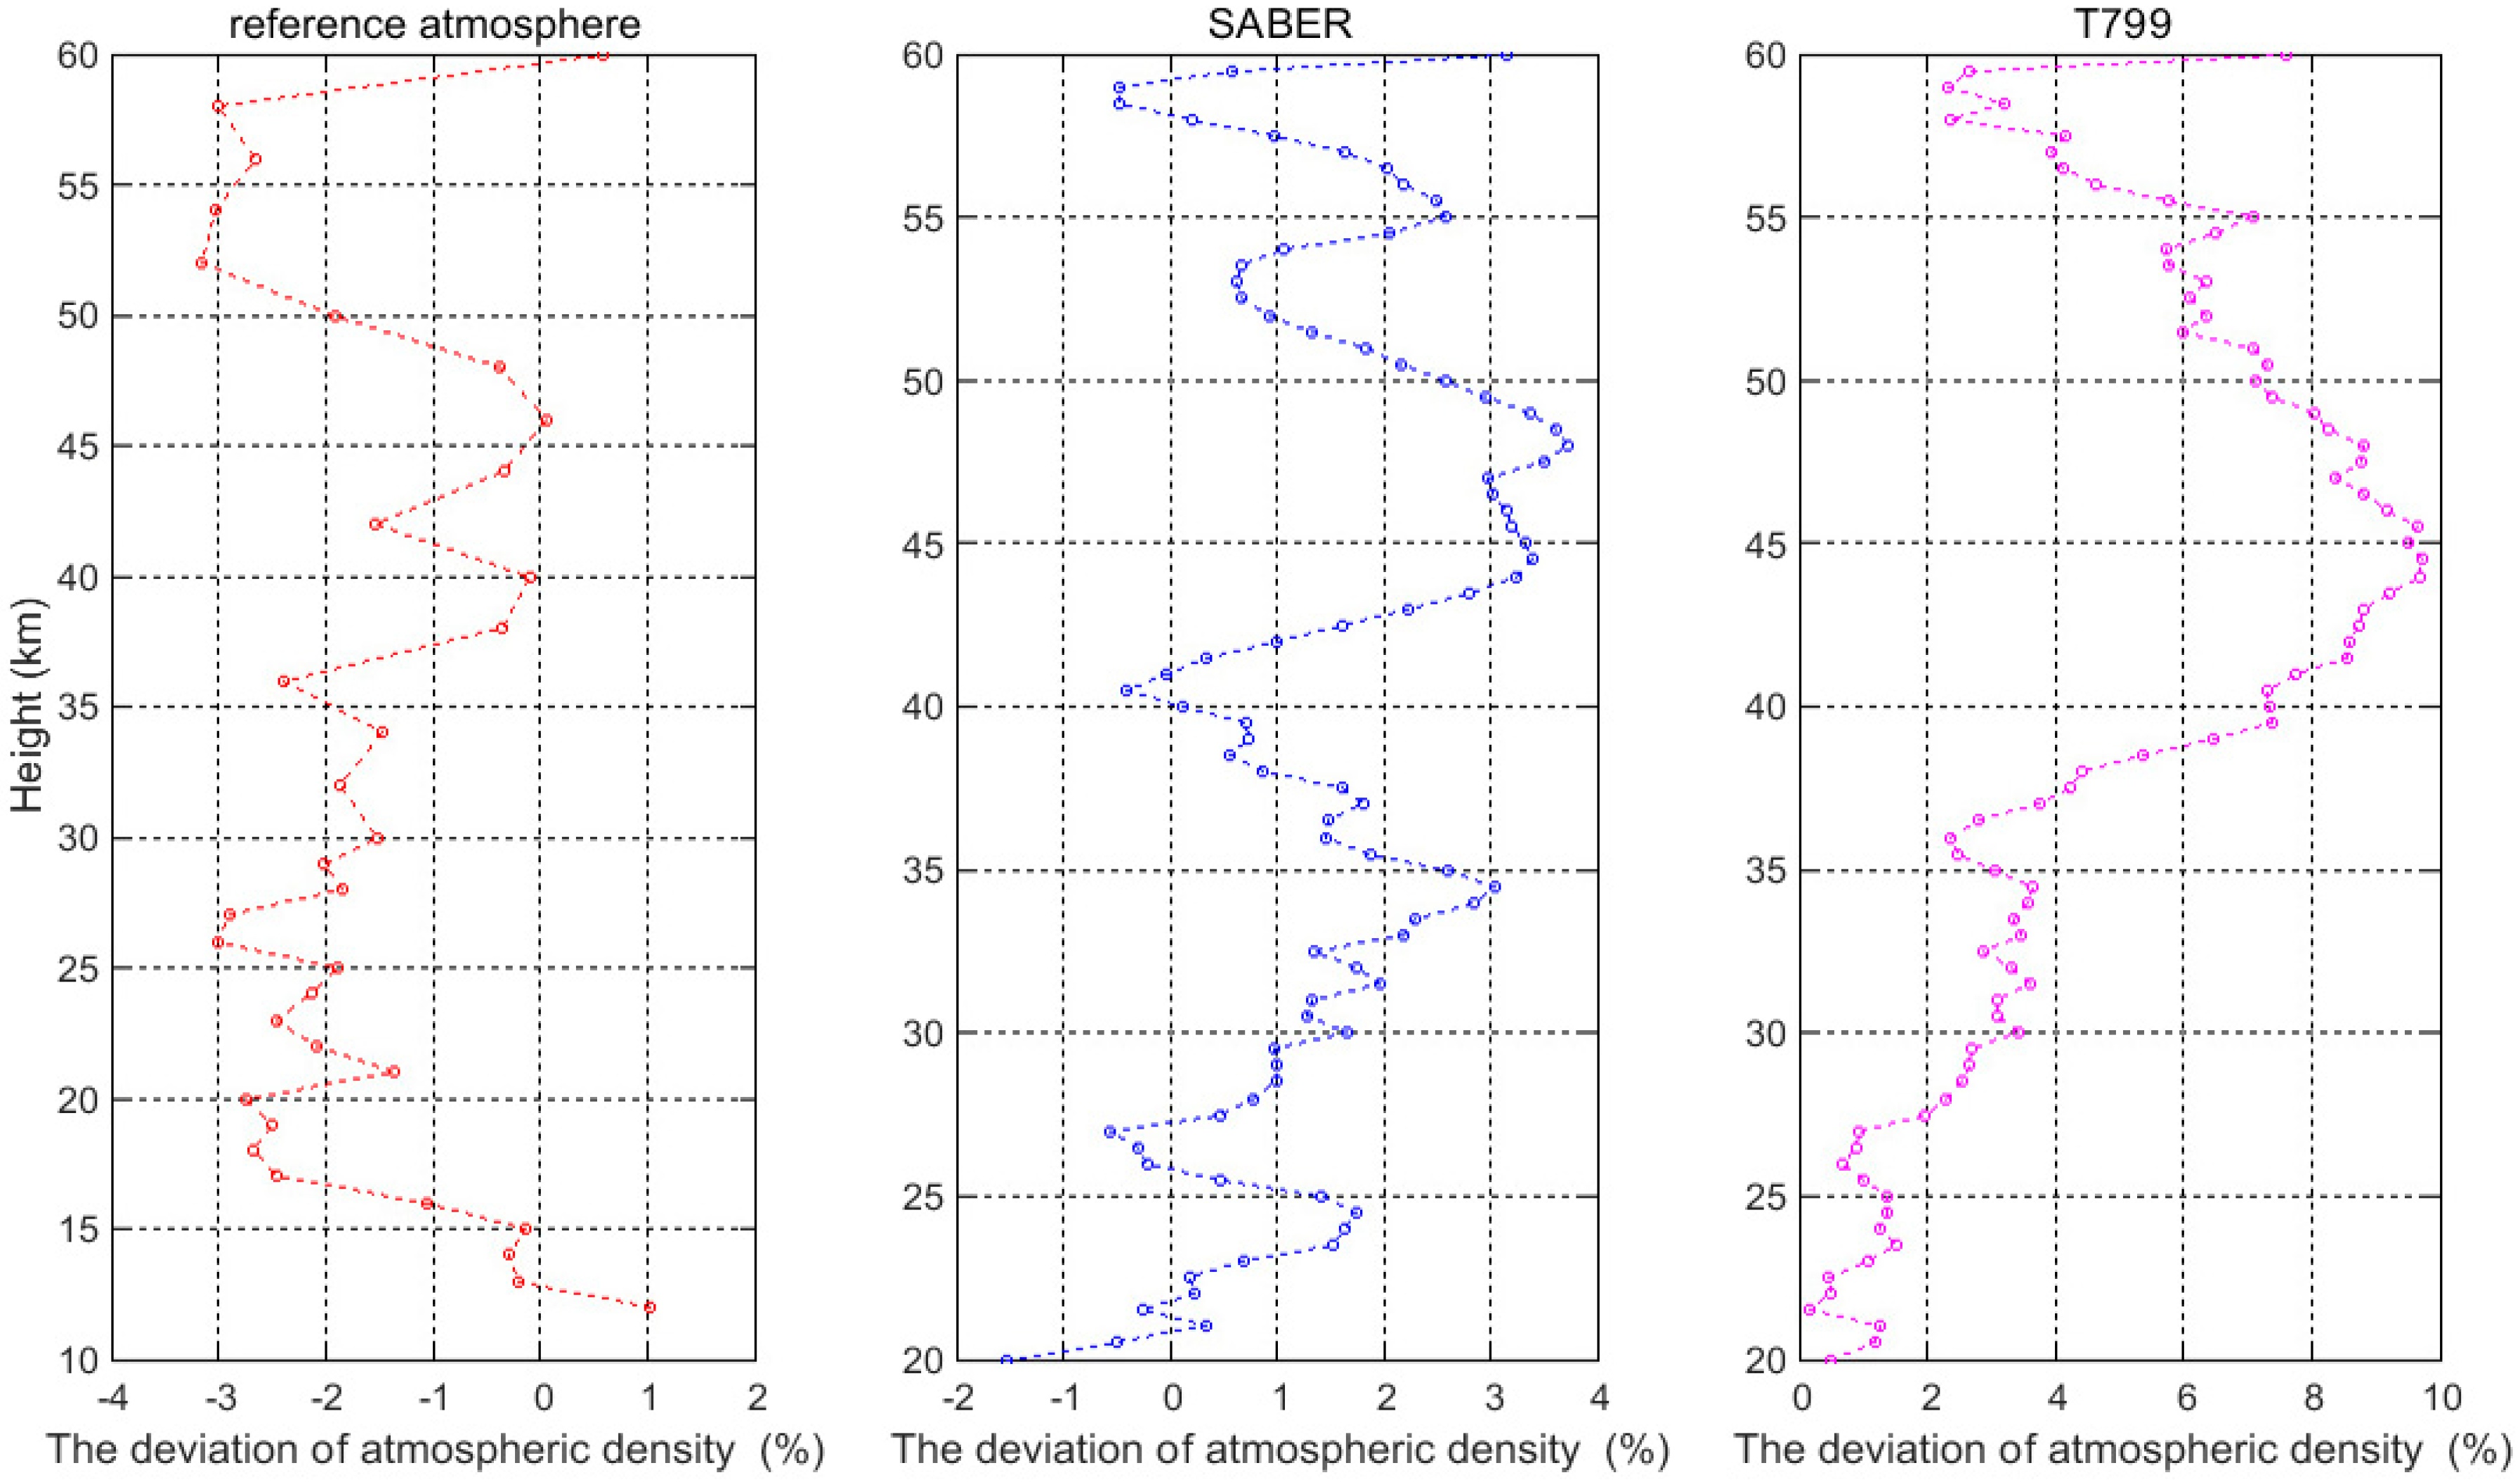
From Figure 12, we can see that the difference between the density measured by the rocket sonde and that of either the reference atmosphere or that gauged by SABER remains small; their relative deviations are both within ±4%. However, large disparities exist between the density measured by the rocket sonde and the density obtained from the T799; their relative deviations are within ±10%.
5. Conclusions
The following conclusions can be drawn from the analysis of the experiment of the TK-1G sounding rocket flight test. Firstly, the rocket sonde installed with the satellite navigation system has a high data acquisition rate (>95%) during the whole process, which can obtain the comparatively complete trajectory data and meteorological data. Secondly, by comparing the measurements gained by the rocket sonde with those collected by several other means, we found they largely bear good agreements, which indicates that the TK-1G sounding rocket system and the data processing methods are viable and reliable. Thus, the flight test proves that the TK-1G sounding rocket system can accurately measure the atmospheric elements in the height range of 20–60 km, which is of significance for making up for the shortcomings of the meteorological detection of near space.
Acknowledgments
The ECMWF data used in this paper were provided by the European Centre for Medium-Range Weather, and the SABER data were provided by the TIMED/SABER team. We acknowledge the contributions to this work from the European Centre for Medium-Range Weather and the TIMED/SABER team. The study was partly supported by the National Natural Science Foundation of China (Grant No. 41375028) and the National Natural Science Foundation of Jiangsu, China (Grant No. BK20151446).
Author Contributions
Zheng Sheng conceived and designed the experiments; Lesong Zhou, Zhiqiang Fan, and Qixiang Liao performed the experiments; Lesong Zhou, Zheng Sheng, Zhiqiang Fan, and Qixiang Liao analyzed the data; Lesong Zhou wrote the paper.
Conflicts of Interest
The authors declare no conflicts of interest.
References
- Hall, C.M. Influence of negative ions on mesospheric turbulence traced by ionization: Implications for radar and in situ experiments. J. Geophys. Res. 1997, 102, 439–443. [Google Scholar] [CrossRef]
- Guo, P.; Kuo, Y.H.; Sokolovskiy, S.V.; Lenschow, D.H. Estimating atmospheric boundary layer depth using cosmic radio occultation data. J. Atmos. 2011, 68, 1703–1713. [Google Scholar] [CrossRef]
- Sheng, Z.; Jiang, Y.; Wan, L.; Fan, Z.Q. A study of atmospheric temperature and wind profiles obtained from rocketsondes in the Chinese midlatitude region. J. Atmos. Ocean. Technol. 2015, 32, 722–735. [Google Scholar] [CrossRef]
- Zhang, Y.; Sheng, Z.; Shi, H.; Zhou, S.; Shi, W.; Du, H.; Fan, Z. Properties of the Long-Term Oscillations in the Middle Atmosphere Based on Observations from TIMED/SABER Instrument and FPI over Kelan. Atmosphere 2017, 8, 7. [Google Scholar] [CrossRef]
- Hu, S.B.; Meng, X.; Yao, X.J.; Yang, X.; Bian, C.J. Study on location and its algorithm using time difference of arrival by sounding rocket. Chin. J. Space Sci. 2008, 28, 326–329. [Google Scholar]
- Fan, Z.Q.; Sheng, Z.; Shi, H.Q.; Yi, X.; Jiang, Y.; Zhu, E.Z. Comparative assessment of cosmic radio occultation data and timed/saber satellite data over China. J. Appl. Meteorol. Climatol. 2014, 54. [Google Scholar] [CrossRef]
- Sheng, Z.; Li, J.W.; Jiang, Y.; Shi, W.L. Characteristics of stratospheric winds over Jiuquan (41.1° N, 100.2° E) using rocketsondes data in 1967–2004. J. Atmos. Ocean. Technol. 2017. [Google Scholar] [CrossRef]
- Sounding Rockets Program Office. NSROC & SRPO Rocket Report of the Third Quarter, 2007. NASA Report. Available online: https://rscience.gsfc.nasa.gov/keydocs/Rocket_Report_3rd_quarter_2007.pdf (accessed on 8 May 2017).
- Hashimoto, K.; Iwai, H.; Ueda, Y.; Kojima, H.; Matsumoto, H. Software wave receiver for the ss-520–2 rocket experiment. IEEE Trans. Geosci. Remote Sens. 2003, 41, 2638–2647. [Google Scholar] [CrossRef]
- Fittock, M.; Stamminger, A.; Maria, R.; Dannenberg, K.; Page, H. Rexus/bexus: Launching student experiments—A step towards a stronger space science community. In Proceedings of the 38th COSPAR Scientific Assembly, Bremen, Germany, 15–18 July 2010; p. 6. [Google Scholar]
- Lübken, F.J. TOTAL: A new instrument to study turbulent parameters in the mesosphere and lower thermosphere. In Proceedings of the ESA SP-270 8th ESA Symposium on European Rocket and Balloon Programs and Related Research, Sunne, Sweden, 17–23 May 1987; pp. 215–218. [Google Scholar]
- Giebeler, J.; Lübken, F.J.; Nägele, M. CONE—A new sensor for in-situ observations of neutral and plasma density fluctuations. In Proceedings of the 11th ESA Symposium on European Rocket and Balloon Programmes and Related Research, Montreux, Switzerland, 24–28 May 1993; pp. 311–318. [Google Scholar]
- Hillert, W.; Lübken, F.-J.; Lehmacher, G. TOTAL: A rocket-borne instrument for high resolution measurements of neutral air turbulence during DYANA. J. Atmos. Terr. Phys. 1994, 56, 1835–1852. [Google Scholar] [CrossRef]
- Theuerkauf, A.; Gerding, M.; Lübken, F.J. LITOS—A new balloon-borne instrument for fine-scale turbulence soundings in the stratosphere. Atmos. Meas. Tech. 2011, 4, 3455–3487. [Google Scholar] [CrossRef]
- Hall, C.M.; Eyken, A.P.V.; Svenes, K.R. Plasma density over Svalbard during the ISBJØRN campaign. Ann. Geophys. 2000, 18, 209–214. [Google Scholar] [CrossRef]
- Abe, T.; Kurihara, J.; Iwagami, N.; Nozawa, S.; Ogawa, Y.; Fujii, R. Dynamics and energetics of the lower thermosphere in aurora (delta)—Japanese sounding rocket campaign. Earth Planet Sp. 2006, 58, 1165–1171. [Google Scholar] [CrossRef]
- Eberhart, M.; Löhle, S.; Steinbeck, A.; Binder, T.; Fasoulas, S. Measurement of atomic oxygen in the middle atmosphere using solid electrolyte sensors and catalytic probes. Atmos. Meas. Tech. 2015, 8, 3701–3714. [Google Scholar] [CrossRef]
- Strelnikov, B.; Szewczyk, A.; Strelnikova, I.; Latteck, R.; Baumgarten, G.; Lübken, F.J.; Rapp, M.; Fasoulas, S.; Löhle, S.; Eberhart, M.; et al. Spatial and temporal variability in MLT turbulence inferred from in situ and ground-based observations during the WADIS-1 sounding rocket campaign. Ann. Geophys. 2017, 35, 547–565. [Google Scholar] [CrossRef]
- Fan, Z.Q.; Sheng, Z.; Wan, L.; Shi, H.; Jiang, Y. Comprehensive Assessment of the Accuracy of the Data from near Space Meteorological Rocket Sounding. Acta Phys. Sin. 2013, 62, 199601. [Google Scholar] [CrossRef]
- Yang, J.; Ye, D.; Huang, J.; Yue, F. Development of TY-3 Microgravity Rocket System. J. Solid Rocket Technol. 2001, 24, 1–3. [Google Scholar]
- Shi, D. Meteorological rocket sonde of meridian project and its detection results. Chin. J. Space Sci. 2011, 31, 492–497. [Google Scholar]
- Li, Q.; Xie, Z.H.; Yan, S.Y.; Ma, R.P.; Ma, J.W.; Fu, X.; Cui, H.G.; Zhang, D.Q. GJB 5601–2006 China Reference Atmosphere (Ground~80 km); General Armaments Department of the People’s Liberation Army: Beijing, China, 2006; pp. 497–499. (In Chinese) [Google Scholar]
- Yamashita, C.; Liu, H.L.; Chu, X. Gravity wave variations during the 2009 stratospheric sudden warming as revealed by ecmwf-t799 and observations. Geophys. Res. Lett. 2010, 37, 333–345. [Google Scholar] [CrossRef]
- Gordley, L.L.; Tansock, J.J.; Esplin, R.W. Overview of the saber experiment and preliminary calibration results. In Proceedings of the SPIE’s International Symposium on Optical Science, Engineering, and Instrumentation, Denver, CO, USA, 20 October 1999; Volume 3756, pp. 277–288. [Google Scholar]
- Guharay, A.; Nath, D.; Pant, P.; Pande, B.; Iii, J.M.R.; Pandey, K. Middle atmospheric thermal structure obtained from rayleigh lidar and timed/saber observations: A comparative study. J. Geophys. Res. Atmos. 2009, 114, 4939–4952. [Google Scholar] [CrossRef]
Figure 1.
Pre-launch preparation.

Figure 2.
The temperature profiles (0–20 km) obtained from the rocket sonde (red) and the balloon sonde (blue).
Figure 2.
The temperature profiles (0–20 km) obtained from the rocket sonde (red) and the balloon sonde (blue).

Figure 3.
The atmospheric pressure profiles (0–20 km) obtained from the rocket sonde (red) and the balloon sonde (blue).
Figure 3.
The atmospheric pressure profiles (0–20 km) obtained from the rocket sonde (red) and the balloon sonde (blue).

Figure 4.
The wind speed profiles (10–60 km) obtained from the rocket sonde (red) and the reference atmosphere (blue).
Figure 4.
The wind speed profiles (10–60 km) obtained from the rocket sonde (red) and the reference atmosphere (blue).

Figure 5.
The wind direction profiles (10–60 km) obtained from the rocket sonde (red) and the reference atmosphere (blue).
Figure 5.
The wind direction profiles (10–60 km) obtained from the rocket sonde (red) and the reference atmosphere (blue).

Figure 6.
The wind speed profiles (10–60 km) obtained from the rocket sonde (red) and the T799 (blue).
Figure 6.
The wind speed profiles (10–60 km) obtained from the rocket sonde (red) and the T799 (blue).

Figure 7.
The wind direction profiles (10–60 km) obtained from the rocket sonde (red) and the T799 (blue).
Figure 7.
The wind direction profiles (10–60 km) obtained from the rocket sonde (red) and the T799 (blue).
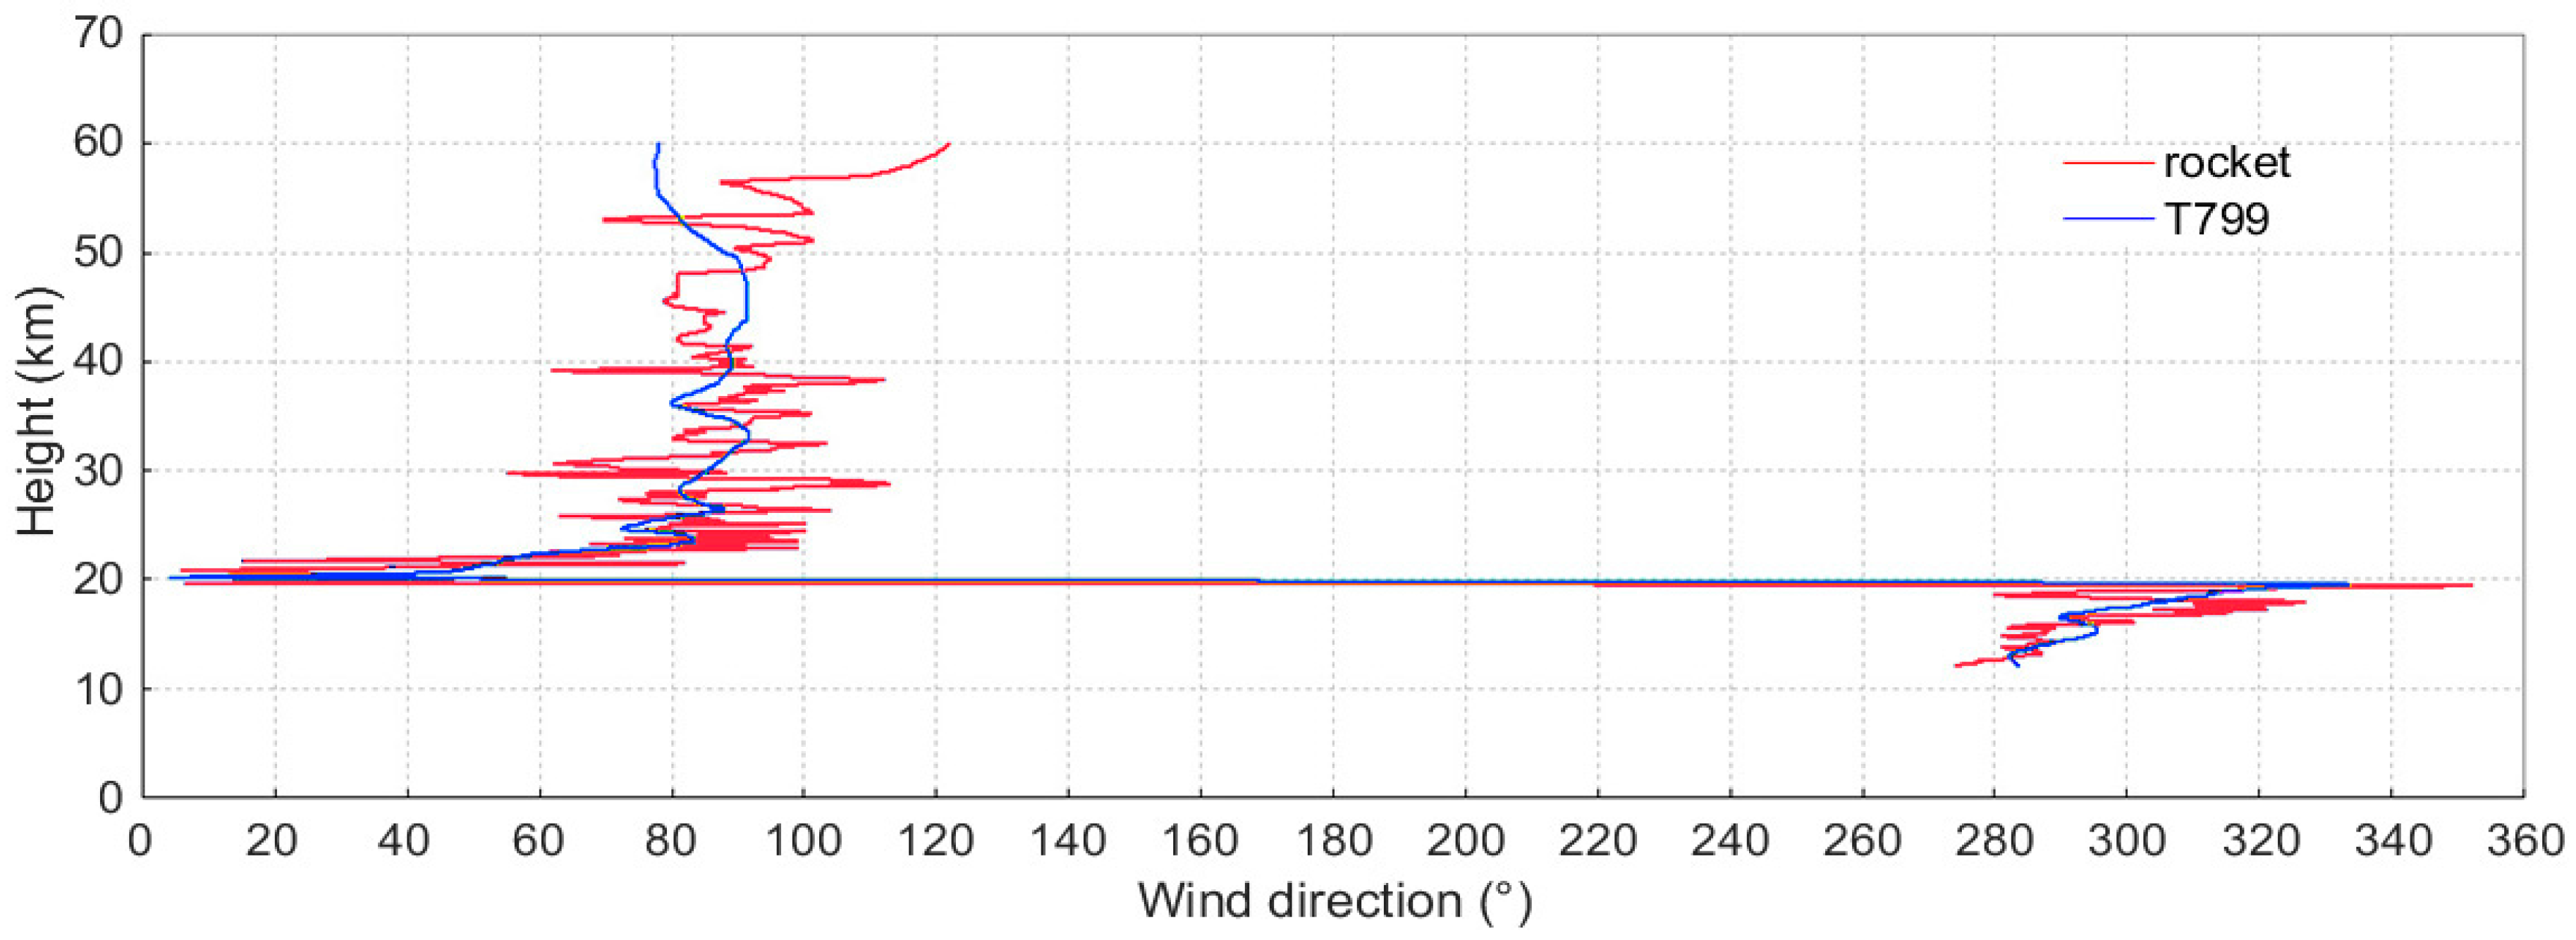
Figure 8.
The temperature profiles (10–60 km) obtained from the rocket sonde (red) and the reference atmosphere (black). The blue dotted line represents the 3σ variance of reference atmosphere.
Figure 8.
The temperature profiles (10–60 km) obtained from the rocket sonde (red) and the reference atmosphere (black). The blue dotted line represents the 3σ variance of reference atmosphere.

Figure 9.
The temperature profiles (10–60 km) obtained from the rocket sonde (red) and the SABER (blue).
Figure 9.
The temperature profiles (10–60 km) obtained from the rocket sonde (red) and the SABER (blue).

Figure 10.
The temperature profiles (10–60 km) obtained from the rocket sonde (red) and the T799 (blue).
Figure 10.
The temperature profiles (10–60 km) obtained from the rocket sonde (red) and the T799 (blue).

Figure 11.
The deviation between the atmospheric pressure that was obtained from the rocket sonde and the reference atmosphere (left, 10–60 km). Also, the deviation between the atmospheric pressure that was obtained from the rocket sonde and the SABER (right, 20–60 km).
Figure 11.
The deviation between the atmospheric pressure that was obtained from the rocket sonde and the reference atmosphere (left, 10–60 km). Also, the deviation between the atmospheric pressure that was obtained from the rocket sonde and the SABER (right, 20–60 km).

Figure 12.
The deviation between the atmospheric density that was obtained from the rocket sonde and the reference atmosphere (left, 10–60 km), the SABER (middle, 20–60 km), and the T799 (right, 20–60 km).
Figure 12.
The deviation between the atmospheric density that was obtained from the rocket sonde and the reference atmosphere (left, 10–60 km), the SABER (middle, 20–60 km), and the T799 (right, 20–60 km).


Table 1.
The list of the date validity rate.
| Height (km) | Receivable Data Packet Number | Actual Valid Data Packet Number from Station 1 | Actual Data Validity Rate of Station 1 | Supplementary Data Packet Number from Station 2 and 3 | The Data Validity Rate of Station 1 after Data Addition |
|---|---|---|---|---|---|
| 60~50 | 103 | 87 | 84.5% | 9 | 93.2% |
| 50~40 | 199 | 176 | 88.4% | 13 | 94.9% |
| 40~30 | 455 | 415 | 91.2% | 31 | 98.0% |
| 30~20 | 1205 | 1139 | 94.5% | 26 | 96.7% |
Table 2.
Prelaunch comparison (atmospheric pressure and temperature).
| Sensor | Surface Weather Station | Balloon Sonde | Rocketsonde |
|---|---|---|---|
| Temperature (°C) | 19.7 | 19.6 | 19.3 |
| Air pressure (hPa) | 854.3 | 854.0 | 854.1 |
Table 3.
Comparison of the fall velocities of different sounding rockets.
| Altitude (km) | 60 | 50 | 40 | 30 | 20 |
|---|---|---|---|---|---|
| TK-1 average fall velocity * | 136.0 | 82.9 | 36.0 | 15.9 | 6.2 |
| TK-1G (20150703) | 34.0 (59.6 km) | 73.8 | 31.5 | 14.3 | 5.6 |
| TY-4B (20140316) | 157.6 | 71.6 | 34.4 | 13.5 | 5.7 |
* Mean value of five qualification tests of TK-1 in November 2004.
© 2017 by the authors. Licensee MDPI, Basel, Switzerland. This article is an open access article distributed under the terms and conditions of the Creative Commons Attribution (CC BY) license (http://creativecommons.org/licenses/by/4.0/).
Share and Cite
MDPI and ACS Style
Zhou, L.; Sheng, Z.; Fan, Z.; Liao, Q. Data Analysis of the TK-1G Sounding Rocket Installed with a Satellite Navigation System. Atmosphere 2017, 8, 199. https://doi.org/10.3390/atmos8100199
AMA Style
Zhou L, Sheng Z, Fan Z, Liao Q. Data Analysis of the TK-1G Sounding Rocket Installed with a Satellite Navigation System. Atmosphere. 2017; 8(10):199. https://doi.org/10.3390/atmos8100199
Chicago/Turabian StyleZhou, Lesong, Zheng Sheng, Zhiqiang Fan, and Qixiang Liao. 2017. "Data Analysis of the TK-1G Sounding Rocket Installed with a Satellite Navigation System" Atmosphere 8, no. 10: 199. https://doi.org/10.3390/atmos8100199
Note that from the first issue of 2016, this journal uses article numbers instead of page numbers. See further details here.