Impact of Cold Waves and Heat Waves on the Energy Production Sector
by

Juan A. Añel
1,*,†, 
Manuel Fernández-González
1,†,
Xavier Labandeira
2,3,†,
Xiral López-Otero
4,† and
Laura De la Torre
1,† 1
EPhysLab, Universidade de Vigo, 32004 Vigo, Spain
2
REDE, Universidade de Vigo, 32004 Vigo, Spain
3
FSR-Climate, European University Institute, I-50133 Florence, Italy
4
Universidad Nacional de Educación a Distancia (UNED), 28040 Madrid, Spain
*
Author to whom correspondence should be addressed.
†
These authors contributed equally to this work.
Atmosphere 2017, 8(11), 209; https://doi.org/10.3390/atmos8110209
Submission received: 5 July 2017
/
Revised: 9 October 2017
/
Accepted: 20 October 2017
/
Published: 27 October 2017
(This article belongs to the Special Issue Temperature Extremes and Heat/Cold Waves)
Abstract
:Cold and heat waves represent a significant problem for the electricity generation sector. The disruptions cold and heat waves can cause in power production are beyond their consumption impacts through, for instance, higher peak demand. Unexpected stops at thermal or nuclear power plants by excessively high-temperature water constitute clear examples of this. In this invited paper, we use past case studies to analyze the impact of these kinds of events on power production. Subsequently we discuss how events of this nature may evolve over the future in view of their association to climate change. Although the review is not exhaustive, we do expose some ideas that may be relevant for decision making in this area.
1. Introduction
Extreme weather represents a very significant problem for all activities that rely on average and predictable weather patterns. This problem is transversal throughout natural systems and life. Extreme weather events are related to the extreme values of environmental variables. One of these variables is temperature and, when such extreme values persist across several days, a cold or heat wave takes place for low and high values of temperature, respectively. However, a proper definition of such events is missing. Given the increasing societal concern about these episodes over the last years, the World Meteorological Organization (WMO) established a task team in 2010 to provide a proper definition. The most recent published report [1] proposes the following definition for a heat wave:
and, in a similar way, it defines a cold wave as:"A marked unusual hot weather (Max, Min and daily average) over a region persisting at least two consecutive days during the hot period of the year based on local climatological conditions, with thermal conditions recorded above given thresholds"
"A marked and unusual cold weather characterized by a sharp and significant drop of air temperatures near the surface (Max, Min and daily average) over a large area and persisting below certain thresholds for at least two consecutive days during the cold season."
The proposed definition recognizes the regional features of what may be considered an extreme event. That is, while a value of temperature may be considered extreme for a given region, it may be completely normal for another.
The relevance of this matter is reinforced by the fact that climate change also affects extreme weather. Indeed the impact of climate change has regularly been attributed to such events over the last years (see, for example, the reports by the American Meteorological Society since 2011 [2]). Also the last report by the Intergovernmental Panel on Climate Change (IPCC) states that anthropogenic climate change is likely to have more than doubled the probability of heat wave ocurrence in some regions of the planet [3]. Climate simulations project that by the end of the current century these heat waves will be “more intense, more frequent and last longer”.
One of the activities seriously endangered by extreme weather (and heat and cold waves in particular) is energy production and consumption. A report in 2014 by ClimateCentral points out that blackouts due to extreme weather have multiplied by ten in the US between the 1980s and 2012 and many of them have resulted from cold and heat waves [4]. The energy sector is involved in this problem in two different ways: as well as being affected, it has also been a major cause of it since the early 20th century as a significant greenhouse gas (GHG) emitter due to power generation through fossil fuels. Yet it is also greatly affected by extreme weather, which introduces a level of unpredictability for power generation and consumption that affects operations, price volatility and at the end may as well have impacts on energy security. For example, a heat wave can make it impossible to generate electricity in a nuclear plant yet at the same time it may increase energy demand because of air conditioning.
The literature presents many examples of how extreme weather can put the power grid and the electricity generation system under stress and finally lead to blackouts. Moreover the side effects of increasing energy consumption during heat and cold waves are known to include increased levels of tropospheric ozone in urban environments. This is associated to health problems and to a positive feedback of the urban heat island effect and thus extra energy consumption [5,6].
In particular, extreme weather phenomena affect energy production and its facilities. They cause supply cuts of different magnitudes and affect other infrastructures depending on the energy supply [7]. An evident example is the Northeast blackout of 1965 [8] linked to a huge power demand and cold weather in a very relevant US region. Looking again at some figures for the US, we observe that the estimated average annual cost of power outages caused by severe weather events (including hot and cold waves, as well as hurricanes, floods, etc.) ranged between US$18 and 33 billion between 2003 and 2012 [9].
Recent efforts acknowledge the relevance of this issue [10,11]. Some examples are the European Climate Energy Mixes (ECEM), Weather Intelligence for Renewable Energies (WIRE), or Clim4Energy in the framework of the Copernicus Climate Change Services programme (Available online: http://climate.copernicus.eu). All of them intend to provide better information and tools for decision makers working in the interface between weather, climate and energy. However it is worth noting that the last IPCC report on the impact of climate change on renewable energy resources (now six years old) makes no specific statements concerning cold waves or heat waves [12].
Therefore, this paper focuses on how heat and cold waves can introduce a significant stress on the electricity generation sector and on how climate change has affected them and is likely to impact them over the next decades (with a discussion of the role of intra and interannual weather forecast). The article is also interested in identifying the factors that may increase the resilence of the electricity generation sector through adaptation. With that purpose it examines and discusses heat and cold waves separately by reviewing some case studies. The reason for such a separate analysis is the diversity of effects associated to extreme events: heat waves affect the generation, transmission and distribution of electricity and may lead to blackouts or reductions in the electricity supply [13]. However, cold waves are more likely to affect the energy network and provoke electricity supply cuts [14]. Table 1 lists some well known power outage events resulting from weather conditions associated with heat and cold waves. The list is non-exhaustive but shows some regional and temporal coverage. More than 300 well known power outage cases happening in the last seventy years were examined to pick up the ones here included.
2. Heat Waves
During heat waves high temperatures affect the generation capacity of fossil fuel and nuclear powered plants, as well to renewable technologies, due to increased air and water temperature. When the air temperature becomes very high, fuel efficiency is affected due to a lower oxygen concentration in the air and thus shows a 0.1% reduction in gas and fuel powered plants for each increase of 1 °C in the temperature. In the case of nuclear powered plants, an increase of 1 °C reduces the energy supply by about 0.5% via its effect on thermal efficiency. For its part every 5 °C increase in water temperature represents a 1% loss of efficiency [37]. During droughts and heat waves, the loss of electricity production may therefore exceed 2% per degree Celsius given that refrigeration systems of power plants are limited by physical laws, regulations and access to cold water [38]. It has been reported that near to 40% of the nuclear power plants in Europe have already experienced refrigerating problems because of high temperatures [39]. The same phenomenon has been studies in model simulations and it has been found that for central Europe power production can decrease near to 12% representing losses for a single power plant around 80 million €, without accounting for potential decreases in streamflows [40].
In this context, factors such as temperature limits for discharging water could represent a loss of between 12% and 16% of the generation capacity of central and eastern US power plants by the middle of this century [41]. In addition, heatwaves could lead to deficits of electricity supply up to 19% in California by the same time [42]. Recent studies on water stress have recently pointed out that by 2030 some thermoelectric plants in Mediterranean regions could face up to 100% of loss of generation capacity because of high water temperatures [43] and up to 27% of such facilities in the contiguous U.S. will be heavily impacted [44]. In addition, operating costs may increase during heat waves given the need of more staff (requiring an increase of between 50% and 100%) and a bigger stock (an increase of between 10% and 20%) [37] and cascading failures leading to blackouts will become more likely [45].
Conversely, transmission and distribution systems lose efficiency at high temperatures because they limit the power of the transformers and lines and expand the resistance of electric transmission in networks, thereby increasing energy losses. The capacity of transformers decreases by 1% for each °C; in copper lines the temperature of the resistance increases by 0.4% for each °C. Hence, total network losses increase 1% for every 3 °C [13]. Moreover, heat waves increase cooling demands, thereby boosting electricity consumption to its highest value and testing the ability of the system to meet this demand. In this sense, demand could increase by as much as 21% on particularly hot days by the end of the century [41].
We next provide some examples, based on the existing literature, of the impact of heat waves on the energy sector:
- during the 2003 heat wave in France, rivers reached record temperatures and caused a slowdown in the cooling process of nuclear plants. This reduced power generation capacity by 4000 MW and nuclear power generation by 5.3 TWh, even though the actual electricity supply was unrestricted (yet EDF, the most important electricity producer in France, had to halve its exports to Switzerland, Britain, Italy, Belgium and Spain during peak periods) [13]. For the same heat wave in Spain the cumulative electricity demand in August peaked nearly to 13% above the values for the previous year [46];
- during the California 2006 heat wave [21], transformers warmed to the extent of breaking the fuses and burning the insulation; this resulted in short circuits that led to significant failure in almost 900 electricity transformers in the Los Angeles area, causing electricity outages that affected over 80,000 people throughout several days. In the north of California more than 1000 transformers were impacted, bringing about electricity shortages that affected around 1.3 million clients [13,22]. Also in 2013, a report by the US Department of Energy [22] already listed up to twelve crises affecting different energy production infrastructures in the US since 2006 due to extremely high temperatures, including nuclear plant shutdowns due to heat waves;
- in 2007 the State of Victoria (Australia) suffered a power outage resulting from a heat wave that also caused fires. As a consequence of the fires, two key electricity transportation lines were affected and thus provoked a cascading failure that left the national electricity system divided in three isolated areas. More than eight hours were necessary for a full restoration of the grid. and, as a result, about 690,000 electricity consumers suffered power outages. This included about 70,000 businesses, which were at a standstill for over a week in some cases. Unsupplied electricity amounted to 7100 MWh, with a direct cost of AU$235 million. This together with indirect impacts (interruptions in transport, communications, health, etc.) entailed an economic cost of about AU$500 million. For large firms, direct costs ranged between AU$0.05 and 30 million per affected site [23];
- in March 2008 the nearby South Australian region also suffered heat waves leading to record electricity demands on three separate occasions. The impact of high temperatures on the capacity of the electricity distribution network, together with the unexpected excess burden brought about by the increased use of air conditioning, caused problems to maintain the electricity supply on the transmission grid; it reduced the instantaneous reserve margin up to 7%, and it ultimately led to rocketing electricity market prices. Thus, the price exceeded AU$5000/MWh 26 times, and it exceeded AU$7000/MWh six times with an average price of AU$353/MWh in March. The cumulative total price increased by over AU$150,000 and forced the electricity market operator to set a price cap. The heat wave was claimed to have allowed electricity companies to obtain extra revenues of nearly AU$200 million [47]. The heat wave suffered by Southeast Australia in the summer of 2009 caused financial losses estimated at AU$800 million, mainly resulting from power outages, interruptions in transport service and response costs [48]. The electricity sector was the most vulnerable to heat, which particularly affected the transmission and distribution systems, on the verge of collapsing given that they were operating at close to full capacity. Interruptions occurring in major transportation lines, as well as failures in the instrumentation transformers and in local voltage transformers, caused blackouts that left hundreds of thousands of homes and businesses without electricity on 30 January and accounted for AU$100 million in damages [49].
3. Cold Waves
The effects of cold waves on the energy sector include breakdowns in power plants and reduce oil and gas production [50]. They could also cause failures in airlines and towers, since ice and snow may accumulate in the insulation under freezing conditions, bridge them and cause a flashover [51]. Again, we next provide a quantification of impacts based on the evidence from existing case studies.
During the cold wave suffered in Canada and the United States in 1998 [18,19], over 4 million people were left without electricity and heating. The cold wave also destroyed 120,000 km of power lines and communications. This included 130 major transport towers valued at US$100,000 each and 30,000 posts costing US$3000 each. Under these circumstances, the total economic cost (not just for the electricity sector) amounted to C$1.5 billion in Canada and US$1 billion in the United States [50]. Similarly, the cold spell suffered by Texas, Arizona and New Mexico in the US during February 2011 [28] led to several blackouts and natural gas shutdowns that affected more than 4.4 million of electricity customers. Despite holding adequate reserve levels, electricity generators were unable to service demand due to the large capacity generation losses caused by starting failures (due to presence of ice in different facilities, including generation equipment, water sources, sensing lines and valves), and to restrictions in the supply of natural gas to power plants [29].
However, cold waves can also cause significant energy demand increases. The cold wave affecting the United States in the winter of 1976–1977 represented a US$3800 million increase in costs associated with energy consumption that included higher electricity, heating and coal costs [52]. A cold wave in France in January 2010 also resulted in a peak in demand for natural gas; every °C reduction in winter temperatures represented an increase of about 100 GWh in daily natural gas consumption [53].
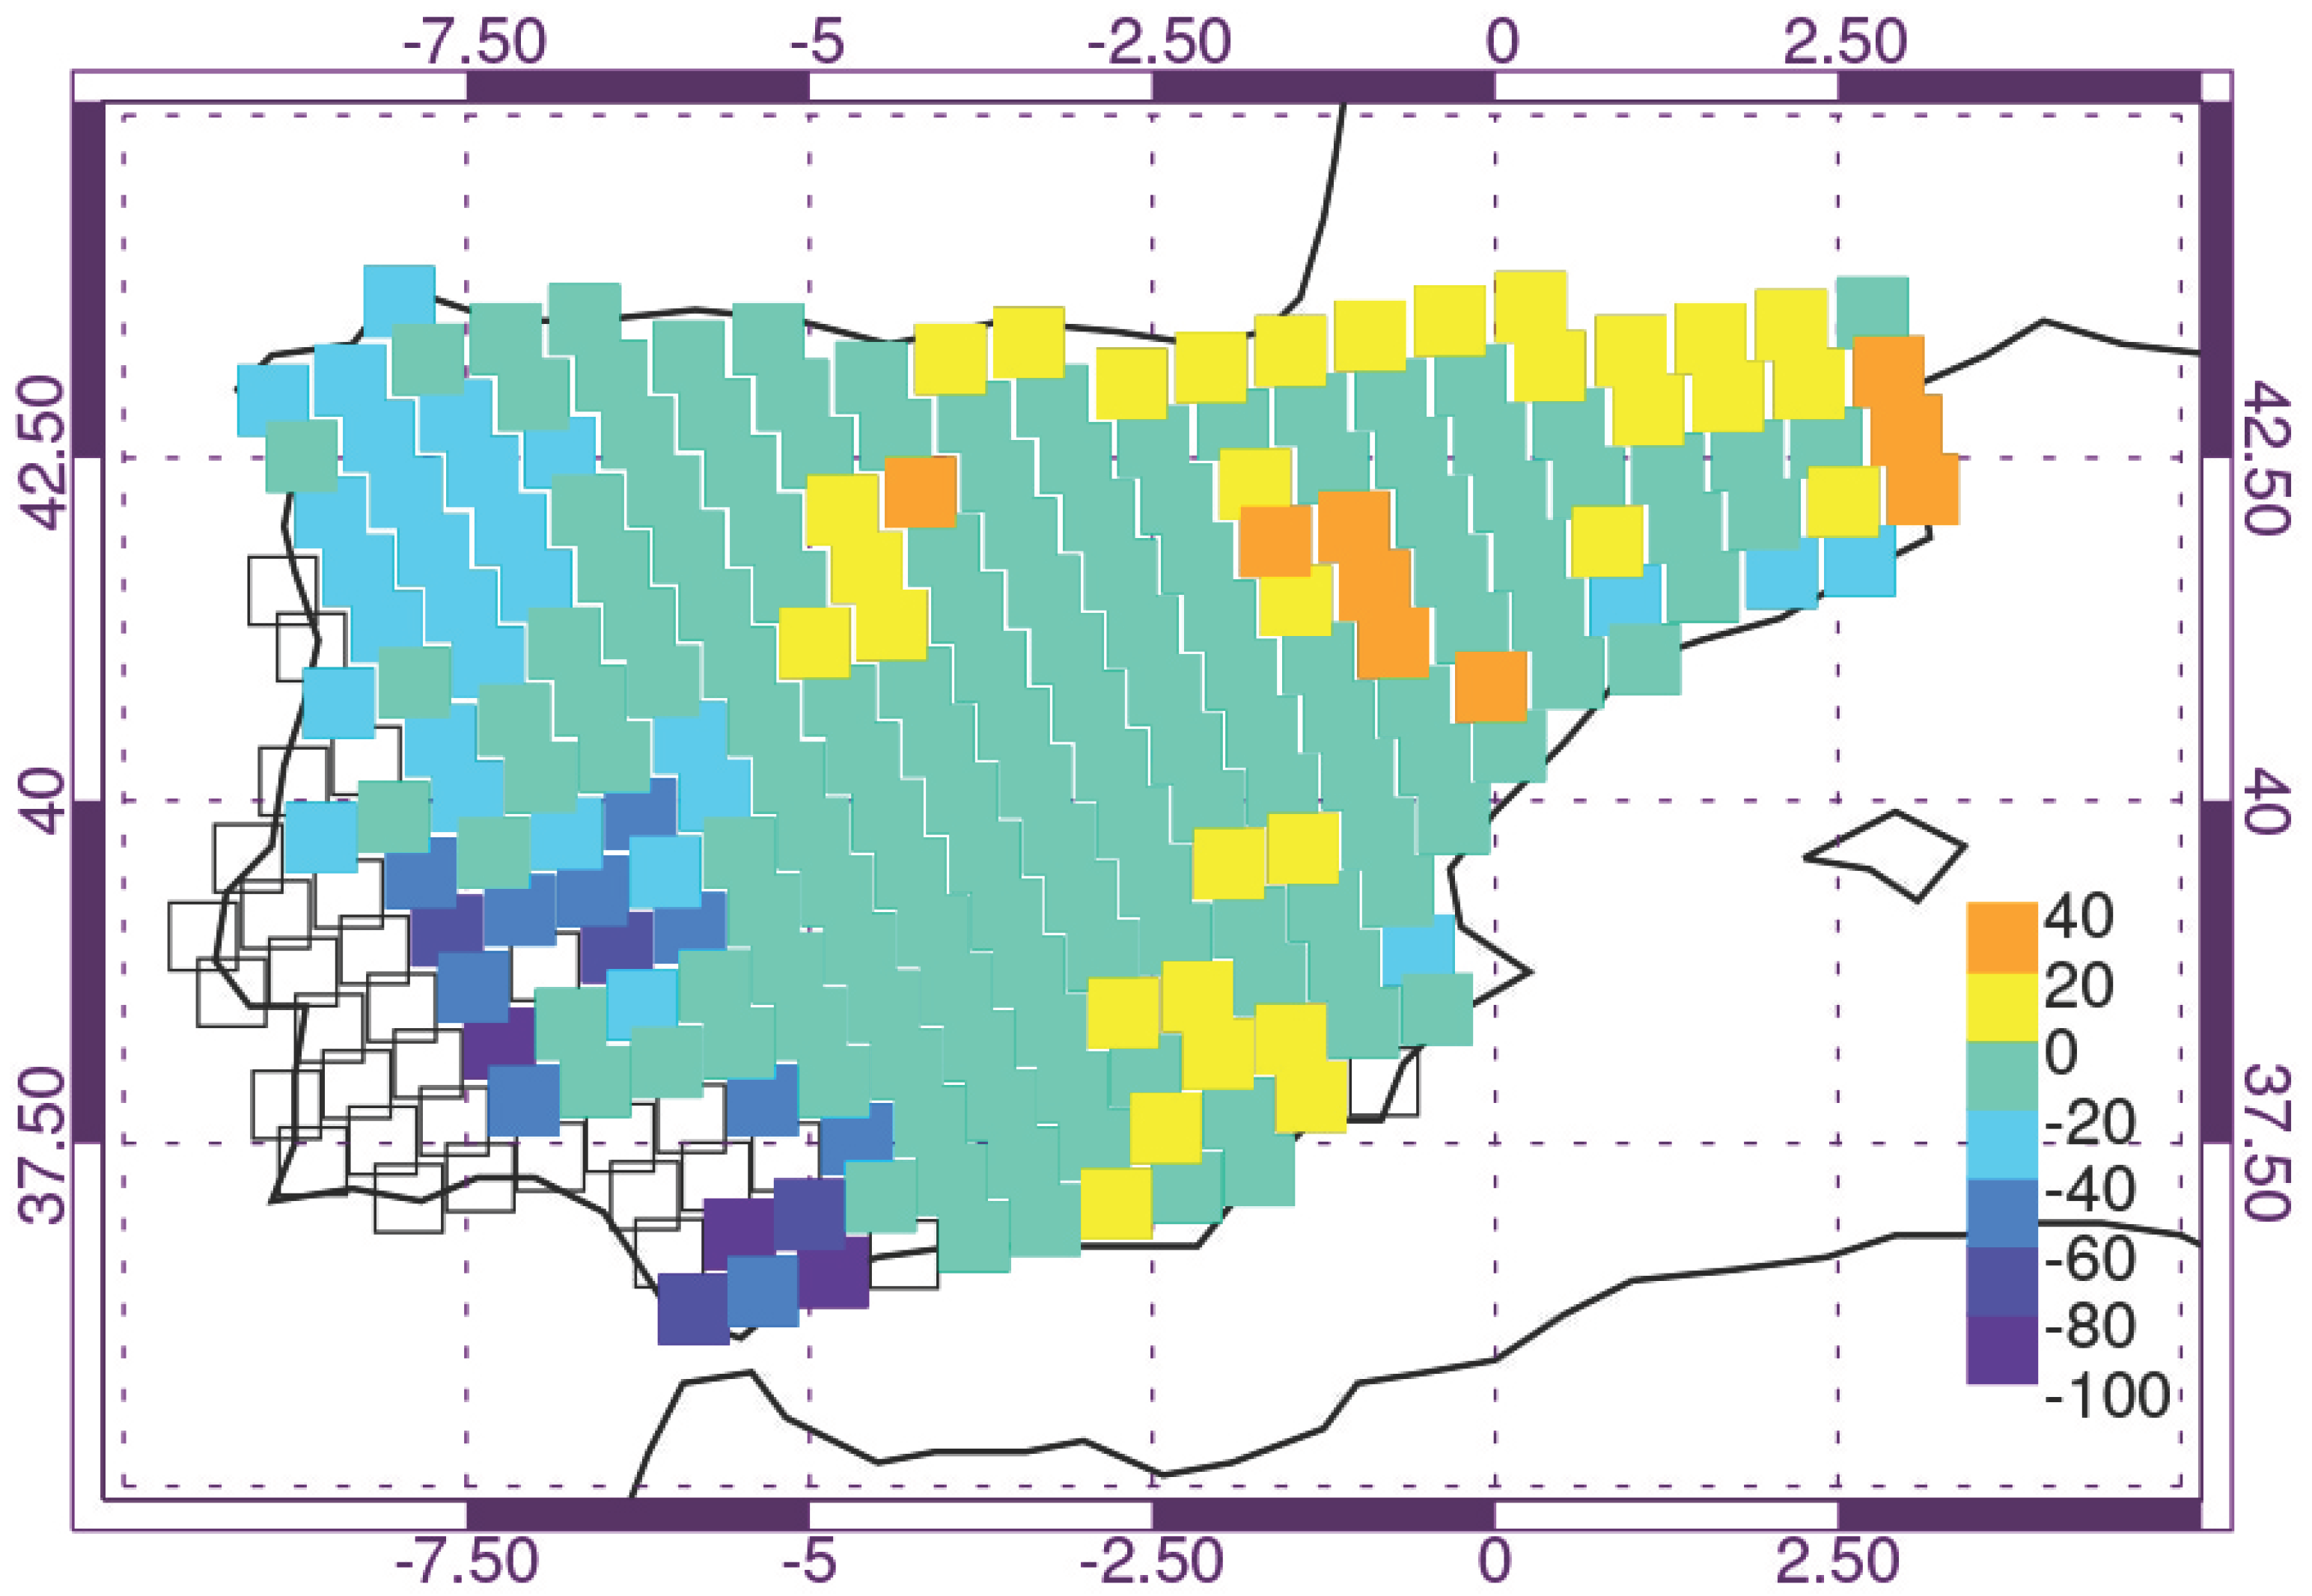
As an example we expose here a case study, a cold wave that affected the Iberian Peninsula as recently as January 2017 [54] (three days rolling mean minimum temperature of 1.83 °C). Because of it Spain faced a rush in the prices of electricity because of the combination of the meteorological conditions and other market constraints such as the need to supply electricity to France because of several stops for nuclear plants mainteinance and an increasing price of fossil fuels. Electricity prices peaked on 25 January 2017 with a mean price of 112.8 €/MWh, the highest ever recorded in Spain (Available online: https://www.esios.ree.es/es/mercados-y-precios). Also another cold spell was observed the previous week with a three days rolling mean minimum temperature of 0.5 °C but with an electricity price slightly lower (104.3 €/MWh). We focus our study on the one that pushed the electricy price to the highest values. The three days rolling mean temperature for Spain was 4.9 °C (data obtained from the web page of the national grid operator previously cited). We wanted to know how much climate change has affected the frequency of ocurrence of such events over the last few years. For it we used data from climate simulations computed for the Weatherathome.net project [55] for the European region. We analyzed an ensemble of 500 members/year for the periods 1985–1989 and 2006–2010. This totalizes 5000 full years simulated. The configuration of the model includes a regional grid of 0.5° (latitude × longitude) for a regional model (HadRM3P) nested into a global model (HadAM3). Initial conditions and details about the model can be consulted in previous works and references therein [56]. The only difference between the simulation of both five-year periods is the impact of climate change. Results for changes in the frequency of such cold waves are shown in Figure 1.
We can see a range where for some regions this kind of cold waves disappear () and others where their ocurrence increases up to because of climate change. For most of Spain these episodes decrease up to in only 25 years. These results agree with others recently obtained [57]. At a first glance this could seem a good thing, but a closer analysis makes the picture much worse. The cells in the map where the frequency of the events has increased correspond to the location of nearly of the fossil fuel thermoelectric plants and of the nuclear ones in Spain. Therefore their operation could be threatened.
Another problem associated with extremely cold temperatures representing a substantial threat for the energy sector is freezing rain. This is liquid, supercooled precipitation that freezes when coming into contact with solid objects, forming a coating of ice [58]. Freezing rain represents a threat for the power transmission lines as it could lead them to fail. Several examples are listed in the literature and they include blackouts affecting up to 80% of the population in some countries, and more than 200 km of power lines and major cities such as Moscow [59]. Again, climate change may have an impact on this meteorological phenomenon: it has been found that for eastern Canada the intra-annual distribution of freezing rain events will change as they will be more frequent from December-February and less frequent in other months by the end of this century [60]. However, climate change will likely lead to a reduction in the number of such events in the eastern coast of North America [61].
4. The Role of Seasonal Forecast
First of all it must be clear the existence of huge differences in the use of weather/climate information for long-term planning and for daily operational response for power production. In this section we focus on the role of seasonal forecast without going into these differences in deep.
It is clear that when discussing the relationship between weather and energy production, one cannot overlook the role of seasonal forecast. This is because energy production and demand patterns are very different for each season. Also energy prices are sometimes decided on a seasonal basis. Therefore, having climate information on a seasonal level is usually considered of the outmost importance by the power sector, investment funds, reinsurance companies, etc. However, as recently as 2010, it was necessary to answer the question on why to do seasonal forecast for the energy sector if it was not useful because of limited skill [62]. But seasonal and subseasonal weather forecasts have progressed considerably during the last decade, making it now possible to provide probabilistic assessments of energy production and consumption [63,64,65]. A good example of how this topic has evolved is the launching in March 2017 by IBM of a software suite specific to provide seasonal forecast information for the energy sector [66].
The skill and potential of seasonal forecasting for the energy sector depends mostly on how relaiable the forecast is for a region. In Europe, for example, where the North Atlantic oscillation (a very well studied climatological pattern [67]) fingerprints Winter weather, the last results of seasonal forecasts considering it show promising and useful outcomes for the energy sector [68], even allowing for results up to one year in advance [69]. The French company EDF is reported to have been using a combination of probabilistic and deterministic numerical weather prediction for monthly forecast of temperatures affecting their operations with an acceptable skill [70]. Recent work for China shows some promising results using the HadGEM-GloSea5 model, mostly for wind in winter and summer temperatures [71].
Moreover, seasonal forecast combined with weather typing can be a powerful tool for evaluating the recurrence of episodes that may put the energy balance under stress. This may also prove useful to plan how to work around potential problems [72]. It must be stressed that this involves using meteorological and climate models with a well resolved stratosphere (at least for winter) [73], which is something uncommon as of yet. An example of its application is the possibility of getting seasonal forecasts for water temperature (that depend on flow and air temperature) in the Rhine River linked with the North Atlantic Oscillation (NAO) [74]. Such forecasts have also proved to detect potentially cold winters, such as the winter of 2005–2006 in the United Kingdom, which had a huge impact on energy prices [75]. Moreover, although summer seasonal predictability is known to be more difficult, improved models have been developed during the last years that are now able to forecast heat waves like the one affecting France and Italy in July 2015 [76], which led to several blackouts.
Other climatic phenomena related to seasonal forecast with potential for significant improvements on predictions for the energy sector are the variations of the stratospheric polar vortex and stratospheric sudden warmings. Yet this again implies the use of models with a well-resolved stratosphere such as HadGEM-GloSea5 or WACCM [73,77,78]. The proven existence of a link between atmospheric blocking and heat waves and cold waves with impacts on the energy sector may be forecasted using seasonal and subseasonal scales [79,80,81,82].
5. Discussion and Recommendations for Future Works
Herein we have briefly reviewed how heat, cold waves and generally extreme temperatures represent a risk for the energy sector. We also discussed some clues on how climatic variability relates to seasonal predictability. From the preceding it is possible to extract some conclusions that support a number of recommendations:
- return periods of extreme temperatures (and other extreme weather events) change with climate change. Such variations may lead to lack of accuracy concerning future physical efficiency and economic viability during the planning of new power production infrastructures. Therefore, the decision process for setting up these facilities should include a complete assessment of potential changes in such return periods.
- Single extreme weather events are less likely to pose a risk for the power production sector and energy security than are compound extreme events. Compound events are defined as “(i) two or more extreme events occurring simultaneously or successively, (ii) combinations of extreme events with underlying conditions that amplify the impact of the events, or (iii) combinations of events that are not themselves extreme but lead to an extreme event or impact when combined” [1]. That is, a cold spell itself could represent a problem but, if enough water is stored in reservoirs, hydropower production can address the problem. However a cold wave combined with a prolonged drought period, or more physically-extreme low accumulated precipitation over a long period of time can represent a clear threat for energy security. This is especially relevant if we take into account that water scarcity and other alterations of the hydrological cycle are well-known consequences of climate change. We therefore suggest that an increasing effort should be set forth both from the point of view of climate sciences and economics to address the issues concerning the probable incidence of compounded extreme weather events and their impact on the energy market.
- As it has been exposed along this work, one of the typical scenarios for power outages resulting from heat and cold waves also involves a huge increase in electricity demmand because for air conditioning or heating. Therefore the ability to manage peak electricity demmand is an obvious candidate for adaptation and resilence measurements. A report for a region as California, that has already suffered a blackout in the past decade because of such conditions, suggest that reduction of demmand through energy efficiency programs as a main measurement [83].
- Diversification of supply sources can be an effective idea to decrease exposition to power outages. This includes the possibility of using off-grid small generation facilities for backup (e.g., solar photovoltaic).
- Where they do not exist yet, vulnerability assessments and resilience plans for the energy sector should be developed both at the government and company levels. An example of this is a recent report by the U.S. Department of Energy [84]. In this sense, the report identifies a compound event of a drought and a heat wave that affected a power station in Braidwood (US) in 2012.
- In general it is acknowledge that the power sector should increase investement on R&D to improve adaptation and resilence to climate change and extreme weather. Companies of different sectors already have performed evaluations in collaboration with academia on how these phenomena could affect their operations in the future. It is strongly suggested that every stakeholder in the energy sector do it.
- The existence of potentially huge benefits from improvements in seasonal forecasts and their application in the energy sector, make it likely for bigger investments in this field to generate sizeable returns. This should include better studies of El Niño-La Niña seasons. In some way, most of the regions of the planet have overlooked this link to date despite their well-known global-regional teleconnections and the fact that they introduce interannual variability that can heavily affect energy production and demand.
- Making a pre-emptive investment to construct or renovate plant cooling towers could avoid the loss of power generation associated to heat waves. However, the cost of renewing existing cooling towers in a plant to allow for 2–3 °C cooler water would be approximately 2.5 €/kW, while the cost for building the towers would amount to 80 €/kW. For its part, avoiding increased losses in the transport network would require an investment of 40 €/kW. In this context, the actual annual regional costs for adapting to climate change in 2080 would, in function of the European region, range between 166 and 527 million euros due to increased air temperature, and between 67 and 308 million euros due to a greater recurrence of heat waves [37].
- For new thermoelectric plants (for old ones it would be too expensive or not feasible) introducing pumps with higher capacity can help to decrease wastewater temperature [40].
- In the near future decision making systems for energy production should incorporate potential effects of extreme events on a daily basis. This must be done by automatically including meteorological information from observations and models and decision algorithms. Some tests using such methodologies have already been performed successfully [85]. Integrating Big Data in the decision process may also improve the management of potential crisis from heat and cold waves [86].
About the case study presented for the extreme cold wave of 2017 in the Iberian Peninsula, it rises a different issue related to the impacts of extreme events on the energy sector beyond blackouts, the possibility of exacerbating energy poverty problems [87]. Not discussed here, increasing episodes of high electricity prices because of climate change are a major threat that deserve attention by political authorities and market operators.
The climate simulations presented show how different can be the impacts of climate change for heat and cold waves across a not so big geographical region. This is specially relevant as the whole region can be managed by the same grid operator. It is also clear that large ensembles of climate simulations are needed in order to be able of computing significant return times of extreme events. Other conclusion is that at least for the case here presented (and probably for many other with sudden orographic changes and poower generation facilities near to the coast) the horizontal grid resolution of the model is of great importance, because of the abrupt changes in frequency of ocurrence of extreme events and the relevance of the affected regions.
In sum, as is the case of most agents and sectors, energy production must also adapt to attain higher levels of resilience given the threat of climate change and extreme weather, and there seems to be great room for improvement. For example, a study by the World Bank in 2011 failed to find adequate adaptation measures in major energy sector programs or projects despite having experienced real problems during the 2003 and 2006 heat waves in Europe and the US [88]. This comes to show that more and larger efforts are clearly required.
Acknowledgments
Juan A. Añel is supported by a Ramón y Cajal grant by the Government of Spain (RYC-2013-14560). The EPhysLab is partially supported by the European Regional Development Fund (ERDF). We thank the Weatherathome.net/ClimatePrediction.net team for providing the climate simulations data.
Author Contributions
J.A.A., X.L. and L.T. conceived and designed the study. M.F.G., L.T. and X.L.O. reviewed literature and performed experiments. All the authors collaborated in the writing of the paper.
Conflicts of Interest
Juan A. Añel and Xavier Labandeira are co-directors of the Gas Natural Fenosa Chair in the Universidade de Vigo. Gas Natural Fenosa has not had a role in the design of the study, collection, analyses, or interpretation of data; in the writing of the manuscript, and in the decision to publish the results.
References
- World Meteorological Organization (WMO). Guidelines on the Definition and Monitoring of Extreme Weather and Climate Events; TT-DEWCE. 4/14/2016 Technical Report; World Meteorological Organization: Geneva, Switzerland, 2016. [Google Scholar]
- Peterson, T.C.; Stott, P.A.; Herring, S. Explaining extreme events of 2011 from a climate perspective. Bull. Am. Meteorol. Soc. 2012, 93, 1041–1067. [Google Scholar] [CrossRef]
- Intergovernmental Panel on Climate Change (IPCC). Climate Change 2013: The Physical Science Basis. In Contribution of Working Group I to the Fifth Assessment Report of the Intergovernmental Panel on Climate Change; Cambridge University Press: Cambridge, UK; New York, NY, USA, 2013; p. 1535. [Google Scholar]
- Kenward, A.; Raja, U. Blackout: Extreme Weather, Climate Change and Power Outages; Technical Report; Climate Central: Princeton, NJ, USA, 2014. [Google Scholar]
- Coughlin, K.; Goldman, C. Physical Impacts of Climate Change on the Western US Electricity System: A Scoping Study; Technical Report; Lawrence Berkeley National Laboratory: Berkeley, CA, USA, 2008.
- Añel, J. Atmospheric ozone: Historical background and state-of-the-art. Contemp. Phys. 2016, 57, 417–420. [Google Scholar] [CrossRef]
- Dell, J.; Tierney, S.; Franco, G.; Newell, R.; Richels, R.; Weyant, J.; Wilbanks, T. Energy supply and use. In Climate Change Impacts in the United States: The Third National Climate Assessment; Melillo, J., Richmond, T., Yohe, G., Eds.; U.S. Government Printing Office: Washington, DC, USA, 2014. [Google Scholar]
- Nye, D.E. When the Lights Went Out: A History of Blackouts in America; The MIT Press: Cambridge, MA, USA, 2010; p. 292. [Google Scholar]
- Executive Office of the President. Economic Benefits of Increasing Electric Grid Resilience to Weather Outages; Technical Report; The White House: Washington, DC, USA, 2013.
- Troccoli, A.; Dubus, L.; Haupt, S.E. (Eds.) Weather Matters for Energy; Springer: New York, NY, USA, 2014; p. 528. [Google Scholar]
- Añel, J. On the importance of weather and climate change for our present and future energy needs. Contemp. Phys. 2015, 56, 206–208. [Google Scholar] [CrossRef]
- Edenhofer, O.; Pichs-Madruga, R.; Sokona, Y.; Seyboth, K.; Matschoss, P.; Kadner, S.; Zwickel, T.; Eickemeier, P.; Hansen, G.; Schlömer, S.; et al. IPCC Special Report on Renewable Energy Sources and Climate Change Mitigation; Cambridge University Press: Cambridge, UK; New York, NY, USA, 2011; p. 1088. [Google Scholar]
- Aivalioti, S. Electricity Sector Adaptation to Heat Waves; Technical Report; Sabin Center for Climate Change Law Columbia Law School: New York, NY, USA, 2015. [Google Scholar]
- Jahn, M. Economics of extreme weather events: Terminology and regional impact models. Weather Clim. Extremes 2015, 10, 29–39. [Google Scholar] [CrossRef]
- MARSH Risk Management Research. Historical Loss Experiences in the Global Power Industry; Technical Report; MARSH: London, UK, 2014. [Google Scholar]
- U.S.-Canada Power System Outage Task Force. Interim Report: Causes of the August 14th Blackout in the United States and Canada; Technical Report; Canadian Embassy: Washington, DC, USA, 2003.
- National Climatic Data Center (NCDC). November 1996 Spokane, Washington, Local Climatological Data; Technical Report; National Climatic Data Center: Asheville, NC, USA, 1996.
- Chang, S.E.; McDaniels, T.L.; Mikawoz, J.; Peterson, K. Infrastructure failure interdependencies in extreme events: Power outage consequences in the 1998 Ice Storm. Nat. Hazards 2007, 41, 337–358. [Google Scholar] [CrossRef]
- Henson, W.; Stewart, R.; Kochtubajda, B.; Thériault, J. The 1998 Ice Storm: Local flow fields and linkages to precipitation. Atmos. Res. 2011, 101, 852–862. [Google Scholar] [CrossRef]
- Waple, A.M.; Lawrimore, J.H. State of the Climate in 2002. Bull. Am. Meteorol. Soc. 2003, 84, 800. [Google Scholar] [CrossRef]
- Gershunov, A.; Cayan, D.R.; Iacobellis, S.F. The Great 2006 Heat Wave over California and Nevada: Signal of an Increasing Trend. J. Clim. 2009, 22, 6181–6203. [Google Scholar] [CrossRef]
- U.S. Department of Energy. U.S. Energy Sector Vulnerabilities to Climate Change and Extreme Weather; Technical Report; U.S. Department of Energy: Washington, DC, USA, 2013.
- Victoria State Government. January Supply Interruptions—Executive Summary; Technical Report; Victoria State Government: Victoria, Australia, 2007.
- Bureau of Meteorology. Special Climate Statement 48—One of Southeast Australia’s Most Significant Heatwaves; Technical Report; Australia Goverment Bureau of Meteorology: Melbourne, Australia, 2014.
- Tomaszewski, M.; Ruszczak, B. Analysis of frequency of occurrence of weather conditions favouring wet snow adhesion and accretion on overhead power lines in Poland. Cold Reg. Sci. Technol. 2013, 85, 102–108. [Google Scholar] [CrossRef]
- Skarbek, L.; Zak, A.; Ambroziak, D. Damage Detection Strategies in Structural Health Monitoring of Overhead Power Transmission System. In Proceedings of the EWSHM-7th European Workshop on Structural Health Monitoring, Nantes, France, 8–11, July 2014; pp. 663–670. [Google Scholar]
- McEvoy, D.; Ahmed, I.; Mullet, J. The impact of the 2009 heat wave on Melbourne’s critical infrastructure. Local Environ. 2012, 17, 783–796. [Google Scholar] [CrossRef]
- Hardiman, M. Intense Cold Wave of February 2011; Technical Report; National Weather Service: El Paso, TX, USA; Santa Teresa, NM, USA, 2011.
- Federal Energy Regulatory Commission; North American Electric Reliability Corporation. Report on Outages and Curtailments during the Southwest Cold Weather Event of 1–5 February 2011; Causes and Recommendations; Technical Report; Federal Energy Regulatory Commission: Washington, DC, USA, 2011.
- Blowfield, M.; Johnson, L. Turnaround Challenge: Business & the City of the Future; Oxford University Press: Oxford, UK, 2013; p. 264. [Google Scholar]
- Basrur, R.; Chang, Y.; Koh, S.L.C. Nuclear Energy in Asia: The end of the renaissance? In Routledge Handbook of Environment and Society in Asia; Harris, P.G., Lang, G., Eds.; Routledge: London, UK; New York, NY, USA, 2014; pp. 423–437. [Google Scholar]
- National Climatic Data Center (NCDC). National Climate Report—October 2011 (Accessed 8 October 2017); Technical Report; National Climatic Data Center: Asheville, NC, USA, 2011.
- Federal Energy Regulatory Commission; The North American Electric Reliability Corporation. Report on Transmission Facility Outages during the Northeast Snowstorm of 29–30 October 2011; Technical Report; Office of Enforcement Federal Energy Regulatory Commission: Washington, DC, USA, 2012.
- Central Electricity Regulatory Commission (CERC). Report on the Grid Disturbance on 30th July 2012 and Grid Disturbance on 31st July 2012; Technical Report; Central Electricity Regulatory Commission: New Delhi, India, 2012.
- North American Electric Reliability Corporation. Polar Vortex Review; Technical Report; North American Electric Reliability Corporation: Atlanta, GA, USA, 2014. [Google Scholar]
- Wolter, K.; Hoerling, M.; Eischeid, J.K.; van Oldenborgh, G.J.; Quan, X.W.; Walsh, J.E.; Chase, T.N.; Dole, R.M. How unusual was the cold winter of 2013/14 in the upper midwest? [in “Explaining Extremes of 2014 from a Climate Perspective”]. Bull. Am. Meteorol. Soc. 2015, 96, S10–S15. [Google Scholar] [CrossRef]
- Rademaekers, K.; van der Laan, J.; Boeve, S.; Lise, W.; van Hienen, J.; Metz, B.; Haigh, P.; de Groot, K.; Dijkstra, S.; Jansen, J.; et al. Investment Needs for Future Adaptation Measures in EU Nuclear Power Plants and Other Electricity Generation Technologies due to Effects of Climate Change; Technical Report; European Commission: Brussels, Belgium, 2011. [Google Scholar]
- Linnerud, K.; Mideksa, T.; Eskeland, G. The impact of climate change on nuclear power supply. Energy J. 2011, 32, 149–168. [Google Scholar] [CrossRef]
- Rübbelke, D.; Vögele, S. Impacts of climate change on European critical infrastructures: The case of the power sector. Environ. Sci. Policy 2011, 14, 53–63. [Google Scholar] [CrossRef]
- Förster, H.; Lilliestam, J. Modeling thermoelectric power generation in view of climate change. Reg. Environ. Chang. 2010, 10, 327–338. [Google Scholar] [CrossRef]
- Davis, M.; Clemmer, S. Power Failure. In How Climate Change Puts Our Electricity at Risk and What We Can Do; Union of Concerned Scientists: Cambridge, MA, USA, 2014. [Google Scholar]
- Miller, N.; Hayhoe, K.; Jin, J.; Auffhammer, M. Climate, Extreme Heat, and Electricity Demand in California. J. Appl. Meteorol. Clim. 2008, 47, 1834–1844. [Google Scholar] [CrossRef]
- Behrens, P.; van Vliet, M.T.H.; Nanninga, T.; Walsh, B.; Rodrigues, J.F.D. Climate change and the vulnerability of electricity generation to water stress in the European Union. Nat. Energy 2017, 2, 17114. [Google Scholar] [CrossRef]
- Ganguli, P.; Kumar, D.; Ganguly, A.R. US Power Production at Risk from Water Stress in a Changing Climate. Sci. Rep. 2017, 7. [Google Scholar] [CrossRef] [PubMed]
- Beard, L.; Cardell, J.; Dobson, I.; Galvan, F.; Hawkins, D.; Jewell, W.; Kezunovic, M.; Overbye, T.; Sen, P.; Tylavsky, D. Key technical challenges for the electric power industry and climate change. IEEE Trans. Energy Convers. 2010, 25, 465–473. [Google Scholar] [CrossRef]
- López-Zafra, J.; Sánchez de Tembleque, L.; Meneu-Ferrer, V.; Ardines Tomás, E.; Gimeno Nogués, R.; de Cabo, R.M.; Pardo Tornero, A.; de Paz Cobo, S.; Valor Micó, E. Impactos Sobre el Sector Energético; Technical Report; Ministerio de Medio Ambiente: Madrid, Spain, 2005.
- WattClarity. Effects of the Heatwave of March 2008 on the South Australian Region; Technical Report; Global-Roam: Queensland, Australia, 2008. [Google Scholar]
- Commonwealth Scientific and Industrial Research Organisation (CSIRO). Climate Change: Adapt Now for the Future; Issues Magazine: Penticton, Canada, 2011. [Google Scholar]
- Queensland University of Technology. Impacts and Adaptation Response of Infrastructure and Communities to Heatwaves: The Southern Australian Experience of 2009; Report for the National Climate Change Adaptation Research Facility, Gold Coast, Australia; Technical Report; National Climate Change Adaptation Research Facility: Southport, Australia, 2010. [Google Scholar]
- Jendritzky, G. Impacts of extreme and persistent temperatures—Cold waves and heat waves. In Proceedings of the WMO/UNESCO Sub-Forum on Science and Technology in Support of Natural Disaster Reduction, Geneva, Switzerland, 6–8 July 1999; pp. 43–53. [Google Scholar]
- Panteli, M.; Mancarella, P. Influence of extreme weather and climate change on the resilience of power systems: Impacts and possible mitigation strategies. Electr. Power Syst. Res. 2015, 127, 259–270. [Google Scholar] [CrossRef]
- Adams, C. Impacts of Temperature Extremes. In Proceedings of the Workshop on the Social and Economic Impacts of Weather, Boulder, CO, USA, 2–4 April 1997. [Google Scholar]
- Déandreis, C.; Pincet, P.; Braconnot, P.; Planton, S. Impact of Climate Change on Demand for Gas; Development of Climate Criteria for Vulnerability to Cold Waves; Technical Report; GDF-Suez: La Défense, France, 2012. [Google Scholar]
- Agencia Estatal de Meteorología (AEMET). Informe Mensual Climatológico; Enero de 2017; Technical Report; Agencia Estatal de Meteorología: Madrid, Spain, 2017. [Google Scholar]
- Massey, N.; Jones, R.; Otto, F.E.L.; Aina, T.; Wilson, S.; Murphy, J.M.; Hassel, D.; Yamazaki, Y.H.; Allen, M.R. weather@home—Development and validation of a very large ensemble modelling system for probabilistic event attribution. Q. J. R. Meteorol. Soc. 2014, 141, 1528–1545. [Google Scholar] [CrossRef]
- Añel, J.A.; López-Moreno, J.I.; Otto, F.E.L.; Vicente-Serrano, S.; Schaller, N.; Massey, N.; Buisán, S.T.; Allen, M. The extreme snow accumulation in the western Spanish Pyrenees during Winter and Spring 2013. Bull. Am. Meteorol. Soc. 2014, 95, S73–S76. [Google Scholar]
- Cardoso Pereira, S.; Marta-Almeida, M.; Carvalho, A.C.; Rocha, A. Heat wave and cold spell changes in Iberia for a future climate scenario. Int. J. Clim. 2017. [Google Scholar] [CrossRef]
- World Meteorological Organization (WMO). Manual on Codes: Part A—Alphanumeric Codes: International Codes; Technical Report; World Meteorological Organization: Geneva, Switzerland, 2011. [Google Scholar]
- Kämäräinen, M.; Hyvärinen, O.; Jylhä, K.; Vajda, A.; Neiglick, S.; Nuottokari, J.; Gregow, H. A method to estimate freezing rain climatology from ERA-Interim reanalysis over Europe. Nat. Hazards Earth Syst. Sci. 2017, 17, 243–259. [Google Scholar] [CrossRef]
- Cheng, C.; Guilong, L.; Auld, H. Possible Impacts of Climate Change on Freezing Rain Using Downscaled Future Climate Scenarios: Updated for Eastern Canada. Atmos.-Ocean 2011, 49, 8–21. [Google Scholar] [CrossRef]
- Lambert, S.; Hansen, B. Simulated Changes in the Freezing Rain Climatology of North America under Global Warming Using a Coupled Climate Model. Atmos.-Ocean 2011, 49, 289–295. [Google Scholar] [CrossRef]
- Lemaître, O. Meteorology, Climate and Energy. In Management of Weather and Climate Risk in the Energy Industry; Troccoli, A., Ed.; Springer: Dordretch, The Netherlands, 2010; pp. 51–66. [Google Scholar]
- Love, G.; Plummer, N.; Muirhead, I.; Grant, I.; Rakich, C. Meteorology and the Energy Sector. In Weather Matters for Energy; Troccoli, A., Dubus, L., Haupt, S.E., Eds.; Springer: New York, NY, USA, 2014; pp. 221–235. [Google Scholar]
- Dutton, J.A.; James, R.P.; Ross, J.D. A probabilistic view of weather, climate and the energy industry. In Weather Matters for Energy; Troccoli, A., Dubus, L., Haupt, S.E., Eds.; Springer: New York, NY, USA, 2014; pp. 353–378. [Google Scholar]
- De Felice, M.; Alessandri, A.; Catalano, F. Seasonal climate forecasts for medium-term electricity demand forecasting. Appl. Energy 2015, 137, 435–444. [Google Scholar] [CrossRef]
- International Business Machines (IBM). Weather Company Seasonal Forecasts for Energy and Utilities (Product ID: 5737-C54); International Business Machines: New York, NY, USA, 2017. [Google Scholar]
- Trigo, R.; Osborn, T.J.; Corte-Real, J. The North Atlantic Oscillation influence on Europe: Climate impacts and associated physical mechanisms. Clim. Res. 2002, 20, 9–17. [Google Scholar] [CrossRef]
- Clark, R.T.; Bett, P.E.; Thornton, H.; Scaife, A. Skilful seasonal predictions for the European energy industry. Environ. Res. Lett. 2017, 12, 024002. [Google Scholar] [CrossRef]
- Dunstone, N.; Smith, D.; Scaife, A.; Hermanson, L.; Eade, R.; Robinson, N.; Andrews, M.; Knight, J. Skilful predictions of the winter North Atlantic Oscillation one year ahead. Nat. Geosci. 2016, 9, 809–814. [Google Scholar] [CrossRef]
- Dubus, L. Monthly and Seasonal Forecast in the French Power Sector; ECMWF: Reading, UK, 2012; p. 12. [Google Scholar]
- Bett, P.E.; Thornton, H.; Lockwood, J.F.; Scaife, A.A.; Golding, N.; Hewitt, C.; Zhu, R.; Zhang, P.; Li, C. Skill and reliability of seasonal forecasts for the Chinese energy sector. J. Clim. 2017. [Google Scholar] [CrossRef]
- Thornton, H.; Scaife, A.; Hoskins, B.; Brayshaw, D. The relationship between wind power, electricity demand and winter weather patterns in Great Britain. Environ. Res. Lett. 2017, 12, 064017. [Google Scholar] [CrossRef]
- Añel, J. The stratosphere: History and future a century after its discovery. Contemp. Phys. 2016, 57, 230–233. [Google Scholar] [CrossRef]
- Rutten, M.; van de Giesen, N.; Baptist, M.; Icke, J.; Uijttewaal, W. Seasonal forecast of cooling water problems in the River Rhine. Hydrol. Process. 2008, 22, 1037–1045. [Google Scholar] [CrossRef]
- Troccoli, A. Seasonal climate forecasting. Meteorol. Appl. 2010, 17, 251–268. [Google Scholar] [CrossRef]
- Ardilouze, C.; Batté, L.; Déqué, M. Subseasonal-to-seasonal (S2S) forecasts with CNRM-CM: A case study on the July 2015 West-European heat wave. Adv. Sci. Res. 2017, 14, 115–121. [Google Scholar] [CrossRef]
- De la Torre, L.; Garcia, R.; Barriopedro, D.; Chandran, A. Climatology and characteristics of stratospheric sudden warmings in the Whole Atmosphere Community Climate Model. J. Geophys. Res. 2012, 117, D04110. [Google Scholar] [CrossRef]
- Scaife, A.; Karpechko, A.; Baldwin, M.; Brookshaw, A.; Butler, A.; Eade, R.; Gordon, M.; MacLachLan, C.; Martin, N.; Dunstone, N.; et al. Seasonal winter forecasts and the stratosphere. Atmos. Sci. Lett. 2016, 17, 51–56. [Google Scholar] [CrossRef] [Green Version]
- Buehler, T.; Raible, C.; Stocker, T. The relationship of winter season North Atlantic blocking frequencies to extreme cold or dry spells in the ERA-40. Tellus A 2010, 63, 212–222. [Google Scholar]
- Dole, R.; Hoerling, M.; Perlwitz, J.; Eischeid, J.; Pegion, P.; Zhang, T.; Quan, X.W.; Xu, T.; Murray, D. Was there a basis for anticipating the 2010 Russian heat wave? Geophys. Res. Lett. 2011, 38, L06702. [Google Scholar] [CrossRef]
- Pfahl, S.; Wernli, H. Quantifying the relevance of atmospheric blocking for co-located temperature extremes in the Northern Hemisphere on (sub-)daily time scales. Geophys. Res. Lett. 2012, 39, L12807. [Google Scholar] [CrossRef]
- Porebska, M.; Zdunek, M. Analysis of extreme temperature events in Central Europe related to high pressure blocking situations in 2001–2011. Meteorol. Z. 2013, 22, 533–540. [Google Scholar] [CrossRef]
- Vine, E. Adaptation of California’s Electricity Sector to Climate Change. Clim. Chang. 2012, 111, 75–99. [Google Scholar] [CrossRef]
- U.S. Department of Energy. Climate Change and the Electricity Sector: Guide for Climate Change Resilience Planning; Technical Report; U.S. Department of Energy: Washington, DC, USA, 2016.
- Bouilloud, L.; Legrand, R.; Vionnet, V.; Lac, C. Forecasting of Winter Phenomena Impacting the Energy Sector; Previsions Meteo France: Paris, France, 2017. [Google Scholar]
- Park, D.; Kim, J.; Kim, J.; Chung, H.; Lee, J. Future Disaster Scenario Using Big Data: A Case Study of Extreme Cold Wave. Int. J. Des. Nat. Ecodyn. 2016, 11, 362–369. [Google Scholar] [CrossRef]
- Labandeira, X.; Linares, P. Pobreza Energética en España: Análisis Económico y Propuestas de Actuación; Technical Report; Economics for Energy: Vigo, Spain, 2014. [Google Scholar]
- Ebinger, J.; Vergara, W. Climate Impacts on Energy Systems: Key Issues for Energy Sector Adaptation; Technical Report; The World Bank Group: Washington, DC, USA, 2011. [Google Scholar]
Figure 1.
Percentage of change (coloured cells) in the frequency of ocurrence of cold waves with a three days rolling mean temperature ≤ °C for the period 2006–2010 compared to 1985–1989. Empty cells show grid boxes without enough events to compute a reliable frequency value.
Figure 1.
Percentage of change (coloured cells) in the frequency of ocurrence of cold waves with a three days rolling mean temperature ≤ °C for the period 2006–2010 compared to 1985–1989. Empty cells show grid boxes without enough events to compute a reliable frequency value.

Table 1.
Examples of historical power outages (blackouts, brownouts, etc.) caused by a heat or cold wave. Ice storms are included as they are usually associated to cold waves.
Table 1.
Examples of historical power outages (blackouts, brownouts, etc.) caused by a heat or cold wave. Ice storms are included as they are usually associated to cold waves.
| Heat Wave | Cold Wave/Ice Storm |
|---|---|
| 1947 (February), (UK) [8] | |
| 1959 (Summer), Manhattan, NY (US) [8] | |
| 1961 (Summer), Manhattan, NY (US) [8] | |
| 9 November 1965, Northeastern US [8] | |
| 23 September 1970, Northeastern US [8] | |
| 1977 (Summer), NY (US) [8] | |
| 1988, Seattle (US) [8] | |
| 1989, Houston, Tampa, Jacksonville (US) [8] | |
| 25 December 1992, Newark, NJ (US) [15] | |
| 10 August 1996, West Coast (US) [16] | |
| 19 November 1996, Spokane, WA (US) [17] | |
| January 1998, Eastern Canada & Northeastern US [18,19] | |
| 19 July 1999, West Coast (US) [16] | |
| 4–5 December 2002, NC (US) [20] | |
| July 2006, CA (US) [13,21,22] | |
| 16 January 2007, Victoria (Australia) [23,24] | |
| 8 April 2008, Szczecin (Poland) [25,26] | |
| 27–31 January 2009, Victoria (Australia) [13,27] | |
| 14–16 March 2010, NJ (US) [15] | |
| 6 September 2010, (Yemen) [15] | |
| 2 February 2011, Southwestern US [28,29,30] | |
| 15 September 2011, (South Korea) [31] | |
| 29–30 October 2011, Northeastern US [32,33] | |
| 30–31 July 2012, (India) [34] | |
| January 2014, Mid West, South Central and East Coast (US) [35,36] |
© 2017 by the authors. Licensee MDPI, Basel, Switzerland. This article is an open access article distributed under the terms and conditions of the Creative Commons Attribution (CC BY) license (http://creativecommons.org/licenses/by/4.0/).
Share and Cite
MDPI and ACS Style
Añel, J.A.; Fernández-González, M.; Labandeira, X.; López-Otero, X.; De la Torre, L. Impact of Cold Waves and Heat Waves on the Energy Production Sector. Atmosphere 2017, 8, 209. https://doi.org/10.3390/atmos8110209
AMA Style
Añel JA, Fernández-González M, Labandeira X, López-Otero X, De la Torre L. Impact of Cold Waves and Heat Waves on the Energy Production Sector. Atmosphere. 2017; 8(11):209. https://doi.org/10.3390/atmos8110209
Chicago/Turabian StyleAñel, Juan A., Manuel Fernández-González, Xavier Labandeira, Xiral López-Otero, and Laura De la Torre. 2017. "Impact of Cold Waves and Heat Waves on the Energy Production Sector" Atmosphere 8, no. 11: 209. https://doi.org/10.3390/atmos8110209
Note that from the first issue of 2016, this journal uses article numbers instead of page numbers. See further details here.