The Spatial and Temporal Variation of Temperature in the Qinghai-Xizang (Tibetan) Plateau during 1971–2015


1
State Key Laboratory of Cryospheric Science, Northwest Institute of Eco-Environment and Resources, Chinese Academy of Sciences, Lanzhou 730000, China
2
University of Chinese Academy of Sciences, Beijing 100049, China
*
Author to whom correspondence should be addressed.
Atmosphere 2017, 8(11), 214; https://doi.org/10.3390/atmos8110214
Submission received: 24 September 2017
/
Revised: 31 October 2017
/
Accepted: 2 November 2017
/
Published: 9 November 2017
(This article belongs to the Special Issue Temperature Extremes and Heat/Cold Waves)
Abstract
:The Tibetan Plateau (TP), which is well known as “The Third Pole”, is of great importance to climate change in East Asia, and even the whole world. In this paper, we selected the monthly temperature (including the monthly mean and the maximum and minimum temperature) during 1971–2015 from 88 meteorological stations on the TP. The data were tested and corrected by using Penalized Maximal F Test (PMFT) based on RHtest. Afterwards, based on the Mann-Kendall test, we analyzed the seasonal and time-interval characteristics on each station in detail. The results show that the TP has experienced significant warming during 1971–2015. When comparing the selected elements, the warming rate of minimum temperature (Tmin) is the largest, the mean temperature (Tmean) comes second, and the maximum temperature (Tmax) is the smallest. The warming trends in four seasons are significant, and the highest warming rate occurs in winter. The warming trend on the TP has a prominent spatial difference, with a large warming rate on the eastern parts and a small one on the central regions. In different seasons, the warming trends on the TP have different characteristics in the time interval. Since 1998, the warming rate in spring increased markedly, spring has displaced winter as the season with the highest warming rate recently.
1. Introduction
In the context of global warming, temperature has gradually become one of the meteorological parameters of great concern. The fifth assessment report of IPCC (AR5) shows that the global surface temperature has risen 0.85 °C during 1880–2012. The surface temperature has been rising significantly for nearly one century, especially for nearly fifty years [1]. Many coastal regions will be submerged because of the sea level rise that is caused by global warming [2]. The global warming also brings meteorological disasters, such as drought, floods, glacial recession, and extreme high temperature events, which could cause harm to the humans [3,4].
The trend of surface temperature in China is consistent with the global state, and it has significant spatial difference. In the past 50 years, the surface temperature has warmed by 1.40 °C in China, which is nearly twice than that on the global scale (0.72 °C) [5]. The trend of extreme temperature is similar to mean temperature, and the warming rate of minimum temperature is higher than that of maximum temperature [6]. Many studies indicate that the variations of extreme temperature are unbalanced and extreme temperature indices have an obvious trend turning in the 1990s [7,8]. Li et al. [9] have analyzed the extreme temperature indices in China during nearly 50 years by using homogenized temperature data. The results show that the warming rate of mean annual maximum and minimum temperature decreased from 1998 to 2012, with a rate of over 0.4 °C decade−1 during the period 1961–1997, and the greatest decrease occurred in winter.
The high-elevation regions are widely considered as the sensitive area of global climate change. It is also one of most-concerned regions on climate change research. Beniston and Rebetez [10] noticed that the warming rate in high-elevation regions is larger than that in low-elevation regions in researching the minimum temperature in Switzerland. The results of climate model over the Alpine region and the Rocky Mountains also revealed the same conclusions [11,12]. Yan and Liu [13] have analyzed the warming rates at elevations over 2000 m, 3000 m, and 4000 m, respectively over the Tibetan Plateau (TP) from 1961 to 2012, and the results indicate that the warming is more pronounced on the stations with higher elevations. Pepin et al. [14] have listed some hypotheses and mechanisms for Elevation-dependent warming (EDW). However, because of the limitations of observational conditions, many relevant problems cannot be fully addressed.
The Tibetan Plateau (TP), at an average altitude of more than 4000 m, is the highest and largest plateau on the planet. The elevation of the principal part of TP is mainly over 4500 m. Therefore, the TP is also called the “Third Pole”, and is sensitive to climate change. The thermal and dynamic processes over the TP also have great influence on the global climate change [15,16,17]. Many researches on the temperature variations over the TP have been done so far. Although these data are varied in different studies, roughly consistent results have been obtained. Firstly, the temperature variations over the TP have temporal variation characteristics. Cai et al. [18] have presented that there are two turning points (1963, 1987) in the course of warming over the TP, and the warming is increasingly obvious since the 1970s. It is also verified by other related researches. The warming rate is 0.16 °C decade−1 from 1955 to 1996 over the TP [19], and it increases to 0.254 °C decade−1 during 1971–2000 [20]. During 1979–2012, the warming rate reaches to 0.42 °C decade−1, which is almost twice than that in last period [21]. Secondly, the temperature variations show spatial heterogeneity over the TP [22]. The warming rate in the TP is increasing from the southeast to northwest [23]. Finally, the temperature variations over the TP are of significant differences in different seasons. The largest warming rate occurs in winter and the smallest one occurs in spring, which is similar to the global climate change [24]. Furthermore, the unbalanced tendency of extreme temperature variations is also similar to the global climate change. Research indicates that the warming rate of the daily minimum temperature (0.41 °C decade−1) is 2.3 times that of the daily maximum temperature (0.18 °C decade−1) [25].
It is well known that the meteorological data from ground stations is the foundation of the research on climate change. Along with the fast development of climate change study, many scientists have raised the requirements of high-quality meteorological data series. The factors, such as station relocation and changes in instructions and observation methods, have affected the long-term climate trends. For these reasons, the processes of the climate data homogeneity test and correction have become an important basic work. There are many kinds of homogenization methods at present [26,27,28,29]. Although their results are varied, the homogeneity of corrected data series has already increased.
In this paper, we have chosen the temperature data from 88 stations over the TP, corrected by means of the PMFT (Penalized Maximal F Test) method and analyzed for trend detection by means of the Mann-Kendall test, aiming at gaining some spatial and temporal variation characteristics of temperature over the TP.
2. Data and Methods
2.1. Data
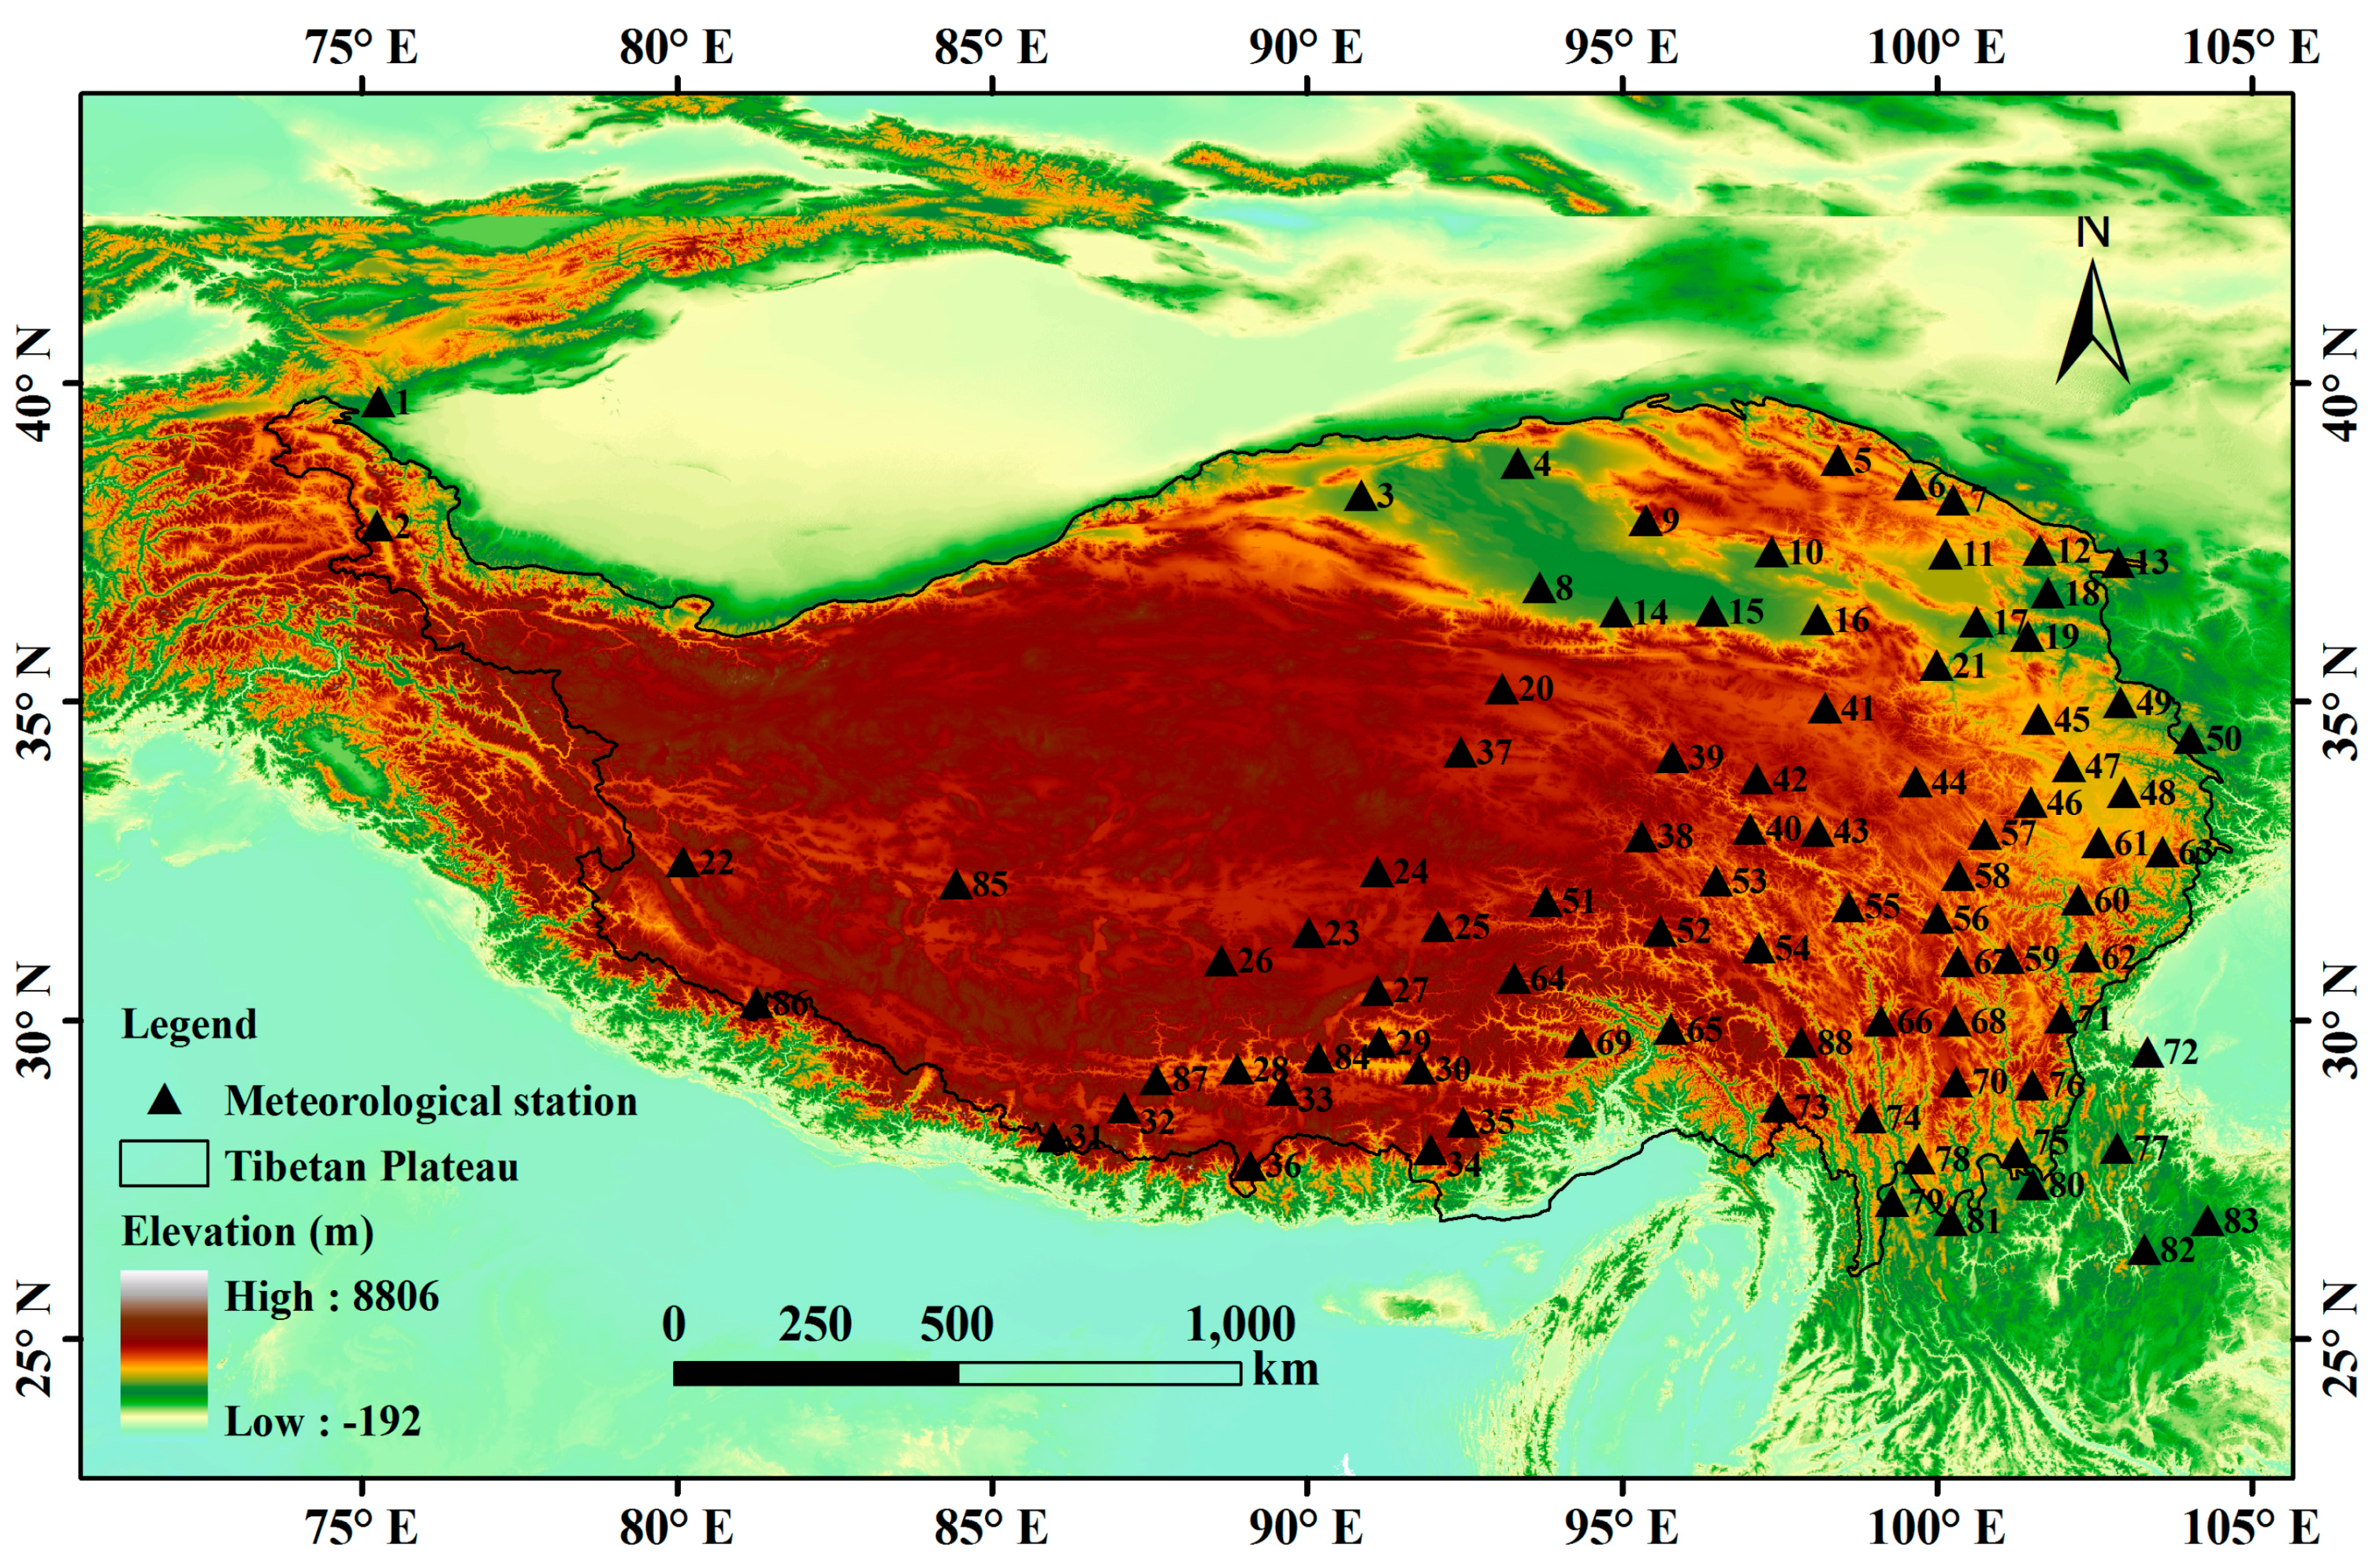
For a long time, there is no consistent conclusion about the exact range and boundary of the TP in the field of natural science. Zhang et al. [30] define the range as 26°00′12′′ N~39°46′50′′ N, 73°18′52′′ E~104°46′59′′ E, according to long-term field observation and various kinds of data. It covers an area of 2572.4 × 103 km2. Basing on this partition method and combining with the information from the China Meteorological Data Service Center (CMDC), there are 160 stations located on the TP. Among these stations, 45 of them with the altitude under 2000 m, 16 of them with the starting time of data in the 1990s, and 11 of them with the end time of data in the 1980s. These stations should be neglected when considering the research purpose and time continuity. We have selected the rest of the 88 stations as the research objects (Figure 1). Most of them with the start time of data around 1960, and only five stations whose data start between 1970 and 1980 (see Table A1).
In order to retain some important data and get more accurate research results, we select the temperature data over the last 45 years from 1971 to 2015 to make analysis. The mentioned five stations whose data start between 1970 and 1980 are located on the central and western regions of the TP. In these regions, stations are rare and the observational data is valuable. So, we analyze the data from these stations separately and dismiss them when calculating the overall trend over the TP. The selected temperature data include monthly mean temperature data, monthly mean maximum temperature data, and monthly mean minimum temperature data. All of the data are downloaded from CMDC (http://data.cma.cn). Appendix A has listed detailed information of selected 88 stations. The distribution of these stations is uneven, mainly in the eastern and central regions and sparse in the western regions. During the study period, only Xiaozaohuo station has a few missing records from April to December in 1974. We have processed the monthly mean data into annual and seasonal one in order to discuss the characteristics of temperature variation. Four seasons are divided as follows: Spring (March–May), Summer (June–August), Autumn (September–November), and Winter (December–next February).
2.2. Methods
The temperature data from stations may be influenced by non-climate factors, causing data series inhomogeneity. We use the software package RHtestsV4 (Science and Technology Branch, Environment Canada, Toronto, On, Canada) to test the homogenization of data and correct the inhomogeneous data [31,32,33]. The methods of RHtests are based on binomial regression testing methods and are improved by Wang et al. [34] from Environment Canada. It has provided two testing methods: the penalized maximal T test (PMT) [27] and the penalized maximal F test (PMFT) [28]. They are both based on multiple-phase linear regression algorithm. The PMT test needs a homogenous time series as reference series, while for the PMFT test the reference is not necessary. It has mentioned that the observational network in the TP is sparse and that the reference series are unavailable. For this reason, the PMFT method is more suitable [35]. Wan et al. [36] have tested and corrected the monthly precipitation data in the TP via PMFT, the results are convincing. Here, we still use the PMFT algorithm and mean-adjusted base series to test and correct the original monthly temperature data.
In the PMFT algorithm, for a time series with β as linear trend, the null hypothesis is defined as follows:
Define the alternative hypothesis:
In which εt is a Gaussian variable with zero-mean to test whether has discontinuity when t = k. If , Hα will be true and the time point k will have discontinuity.
There are 34 stations having inhomogeneous points in monthly mean temperature (Tmean), 39% of the total; for monthly mean maximum (Tmax) and minimum temperature (Tmin), the numbers are 48% and 41%, 55% and 47% of the total, respectively. The Tmin has the highest number of changepoints, followed by Tmax and Tmean, while changepoints mainly occur in the 1970s and 1990s (Figure 2). It implies that the relocation of meteorological stations mainly happened during these two periods, and that the Tmin is more sensitive to relocation than Tmax and Tmean. Cao et al. [37] has tested and corrected the surface air temperature (SAT) dataset from 14 stations, the results also show that the Tmin series have more changepoints. One possible reason is that the Tmin datasets have a smaller variance than Tmax, so non-natural biases become more significant.
To examine the reliability of the test and correction methods, we take the mean temperature data series as an example. Three stations have been selected whose absolute values of difference between temperature linear trends before and after the corrections are larger than 0.5 °C decade−1 (Henan, Muli, and Mangya station). Figure 3 shows the different trends between data series before and after corrections. The quality of data series from three stations all significantly improved after correction. Afterwards, we have checked metadata from other research [38,39]. It is proved that relocation of these stations did occur in the years when inhomogeneous points exist (Table 1). It demonstrates that testing and correcting the data series from stations on the TP are necessary, and that the PMFT method is effective to some extent.
Here we use the non-parametric Mann-Kendall statistical test [40,41] to analyze the monotonic trends of temperature. The content is as follows:
in which
where n is the data record length, xk and xi are the sequential data values. sgn(θ) is equal to +1, 0 and −1 if, or . t denotes the extent of any given period. When, the null hypothesis is rejected at the specific α significant level.
In Mann-Kendall test, the Kendall slope is used to estimate the monotonic trend:
In which , and β denotes the monotonic trend of the data set. The positive value of β indicates an upward trend of temperature, and the negative value of β indicates a downward trend of temperature conversely.
3. Results
3.1. The Spatial and Temporal Variation of Temperature
3.1.1. The Mean Temperature
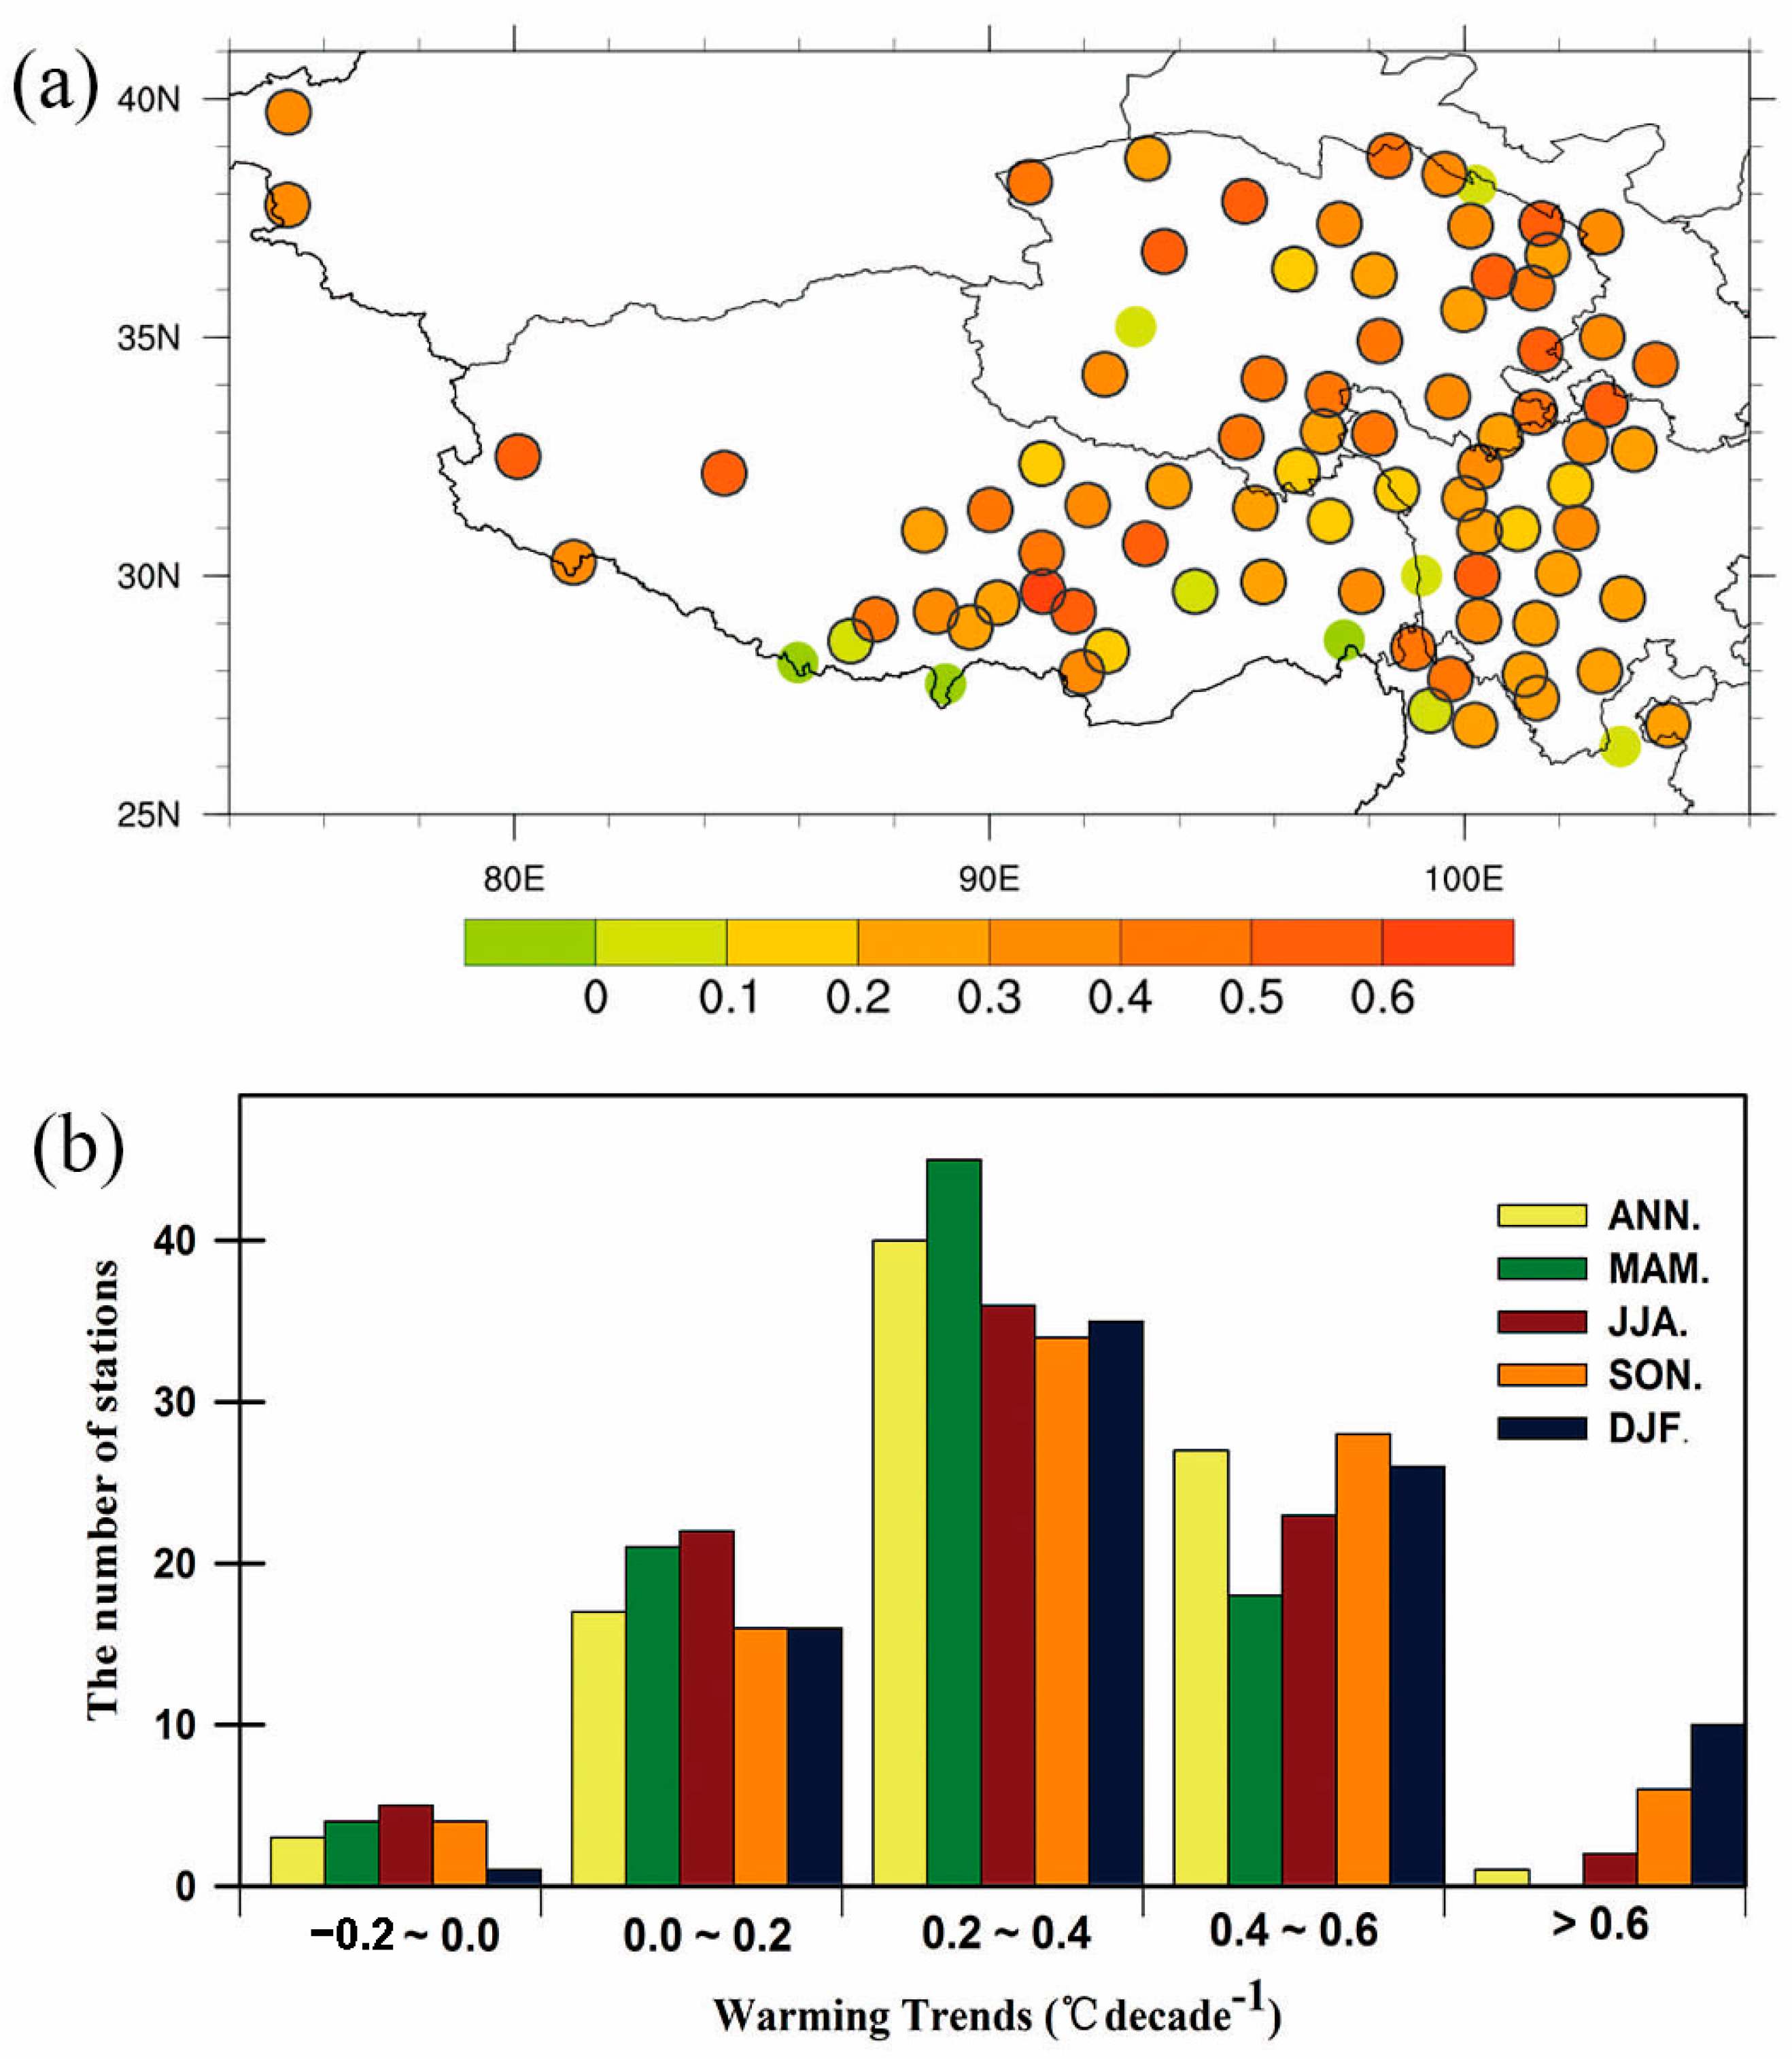
The mean warming rate of the Tmean on an annual scale is 0.30 °C decade−1 during 1971–2015 over the TP. The greatest warming occurs in winter, with a rate of 0.36 °C decade−1, followed by 0.34 °C decade−1 in autumn, 0.29 °C decade−1 in summer and 0.27 °C decade−1 in spring. Analysis of annual variation at each station shows that Tmean ranges from −0.06 °C decade−1 (Nelaer station) to 0.67 °C decade−1 (Lhasa station). 85 stations have warming trends, but only three stations have cooling trends.
Figure 4a shows the variation of Tmean in every selected station. As a whole, stations with significant warming trends are mainly distributed in three regions: eastern TP around the Yellow River Basin, southern TP in NianqingTanggula Mountain regions, and southeastern TP in Hengduan Mountain regions. Five stations in the western TP also show significant warming trends, hereinto, the warming rates of Wuqia station and Tashikuergan station, which are located in southwest edge of Talimu Basin both reach over 0.3 °C decade−1. Gaize, Shiquanhe, and Pulan stations located in southwest of the North Tibet, and Gaize and Shiquanhe have the warming rates of over 0.5 °C decade−1. The warming rate of Tmean is smaller in the central TP and most of stations with a decreasing trend are located in the south edge of the TP.
The variations of Tmean also have great seasonal difference. With the exception of winter, stations with a decreasing trend occurred in other three seasons. The annual variations of Tmean in different stations are mainly concentrated in the 0.20–0.40 °C decade−1, and are different with seasons (Figure 4b). In spring, their distributions are more concentrated than the other three seasons. There are 45 stations with a warming rate of 0.20–0.40 °C decade−1in spring (44 of them are significant at the 0.01 level), accounting for 51% of the total number. In summer, autumn, and winter, the station numbers separately reduce to 36, 34, and 35, accounting for 41%, 39%, and 40%, respectively (all of them are significant at the 0.01 level, except for six of them in winter). Furthermore, less than five stations with the Tmean decreasing trend appear in spring, summer and autumn, but only one station (Pali station) in winter presents a decreasing trend. There are 10 stations with the warming trends over 0.60 °C decade−1 occuring in winter (the largest warming rate is at the Jiali station, reaching up to 0.73 °C decade−1), six stations with warming behavior in autumn, and 2 stations in summer (significant at the 0.01 level). There is no station whose spring warming rate is larger than 0.60 °C decade−1 on the TP.
3.1.2. The Maximum Temperature
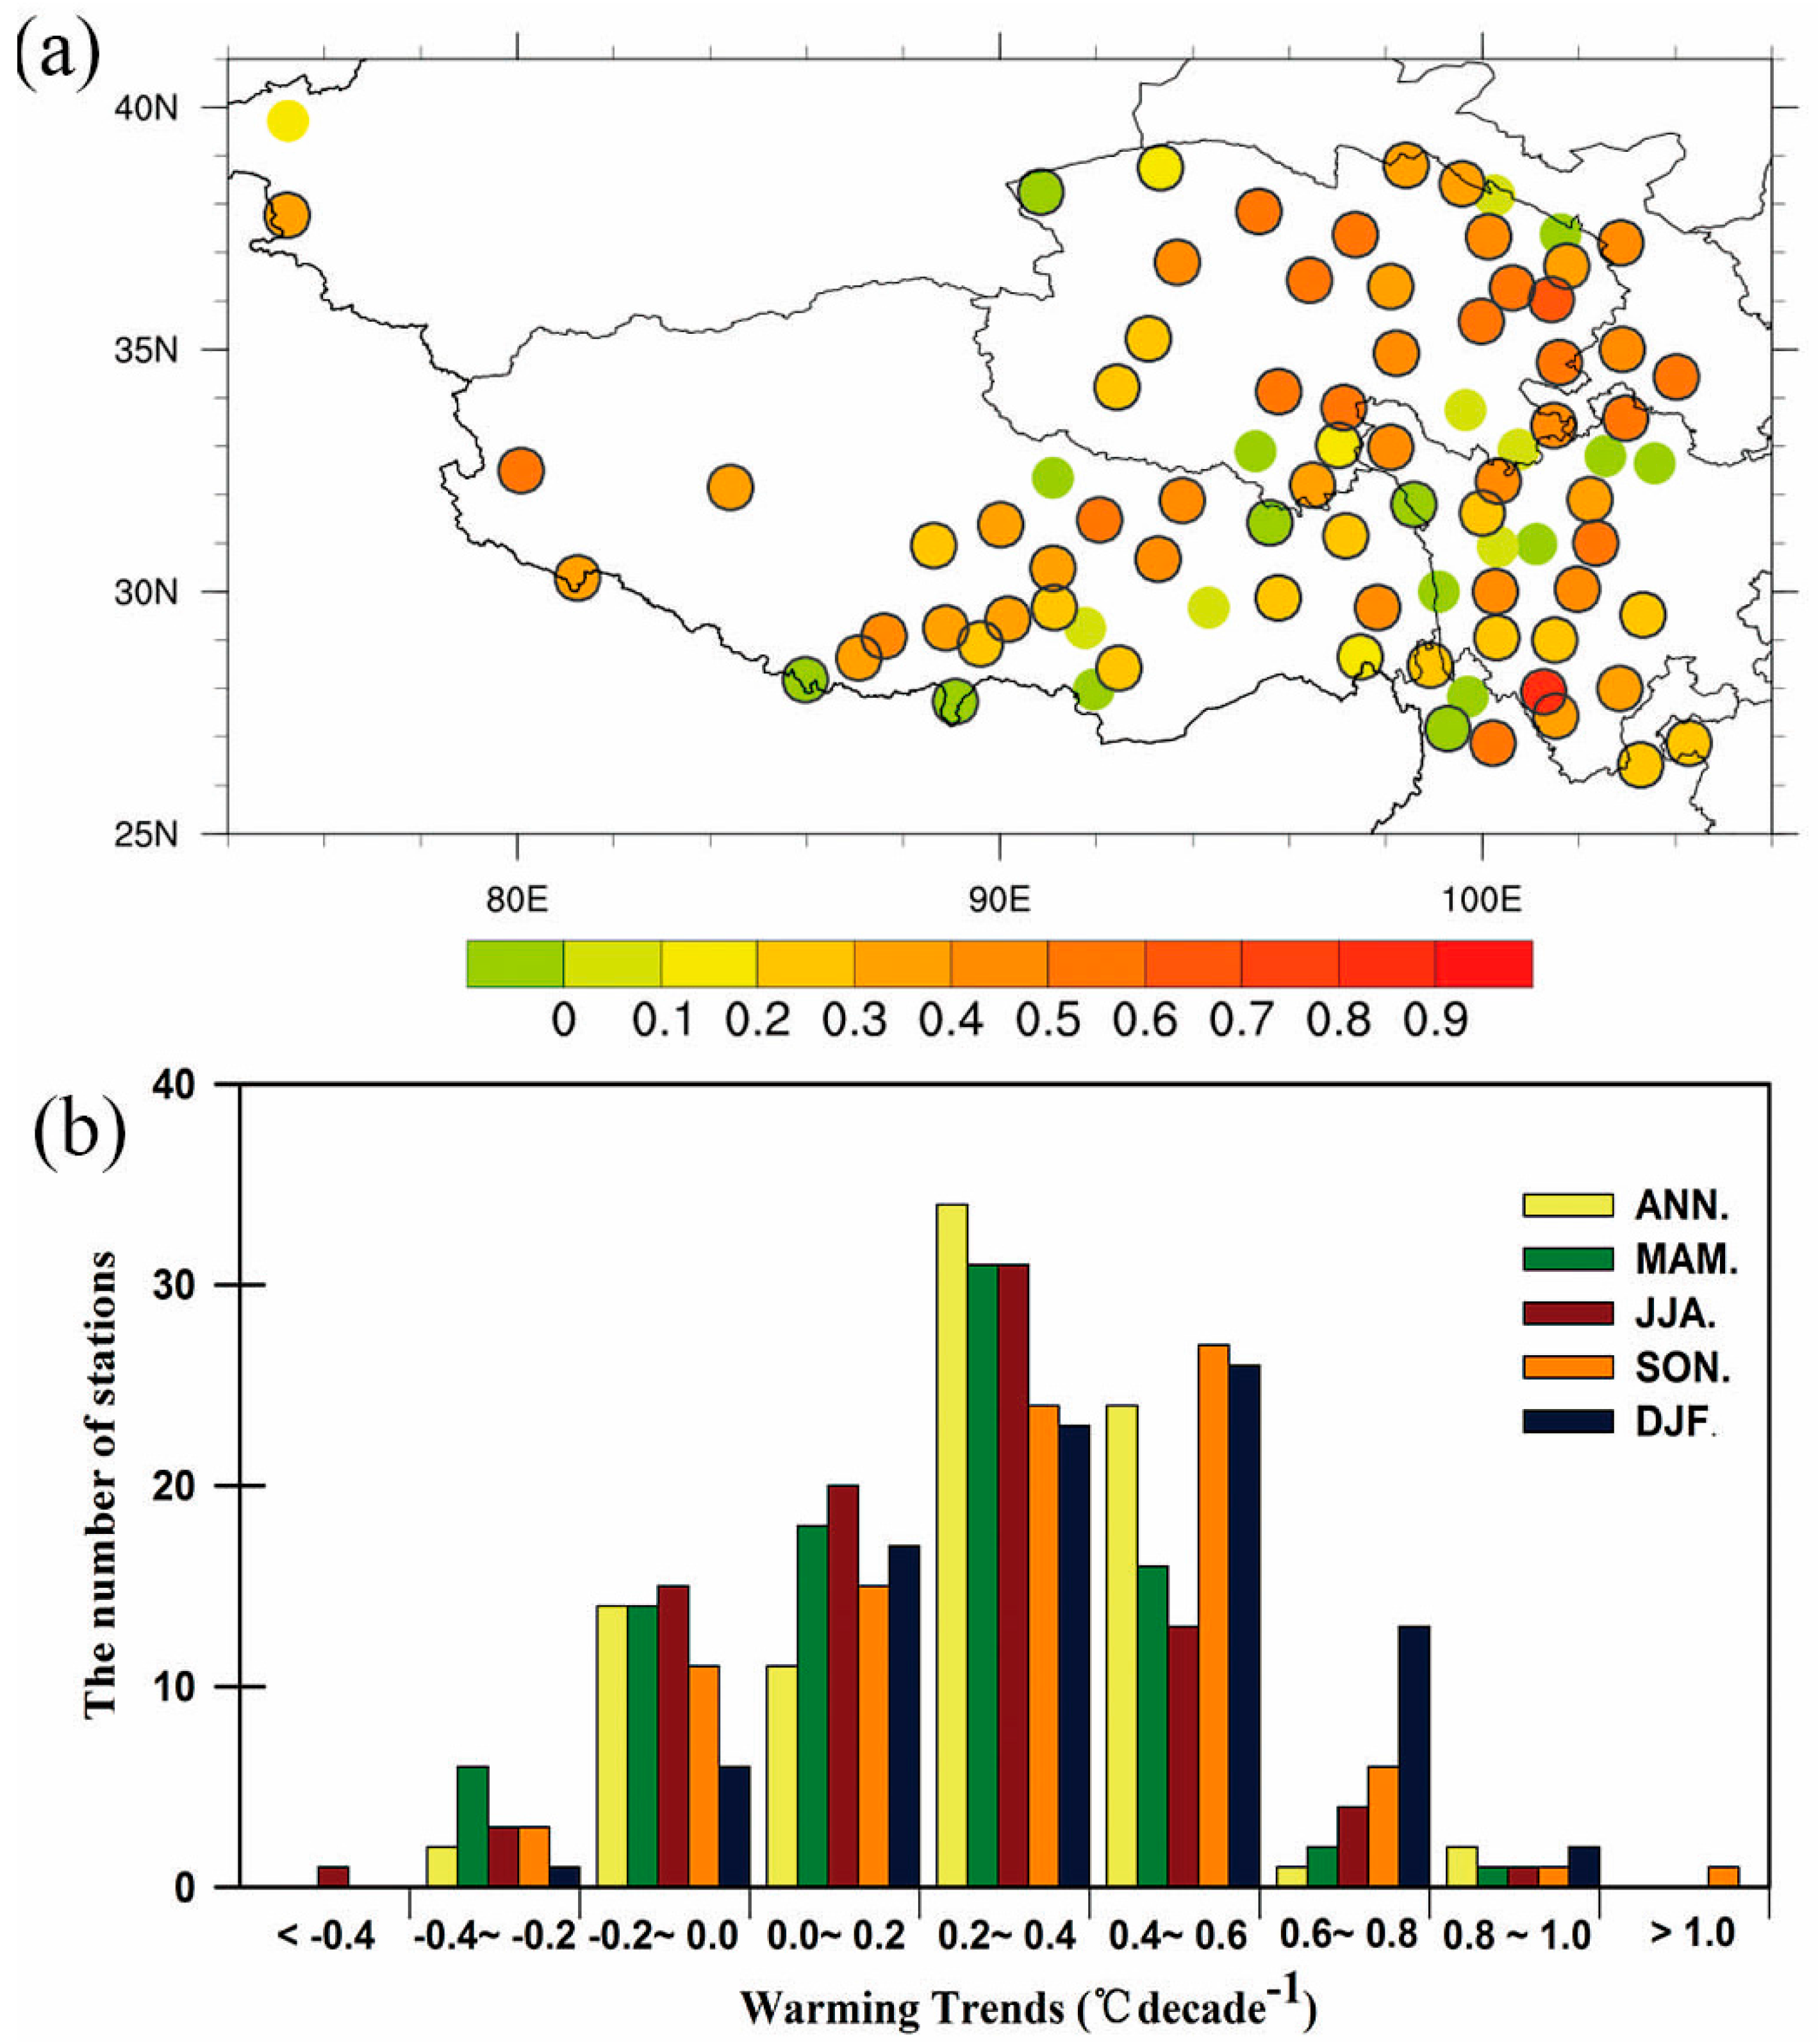
The mean warming rate of the Tmax on annual scale is 0.27 °C decade−1 over the TP during 1971–2015 (lower than Tmean of about 0.03 °C decade−1). The largest seasonal warming rate of Tmax also happens in winter (0.33 °C decade−1), followed by 0.32, 0.21, and 0.19 °C decade−1 in autumn, summer, and spring, respectively. The annual variations of Tmax range from −0.25 °C decade−1 (Pali station) to 0.89 °C decade−1 (Geermu station) based on the result of each station. Among the selected stations, a few of stations (16) show cooling trends in Tmax and most of stations (72) show warming trends.
When compared with Tmean and Tmin, the warming trend of Tmax is less obvious as a whole. Distinct warming trends in Tmax yet still occur in the Yellow River Basin, eastern TP, in the Nianqing Tanggula Mountain regions, southern TP, and in the Hengduan Mountain regions, southeastern TP (Figure 5a). All of the mentioned western stations show warming trend exceeding 0.30 °C decade−1 except for the Wuqia station, and the warming rate of Shiquanhe station is larger than 0.50 °C decade−1. Stations over the central TP show smaller warming trends. Most of the stations with cooling trends are located in the mid-eastern and southern edge of the TP.
Additionally, Figure 5b displays the seasonal and annual variations of the Tmax warming trends. It is shown that stations that have great variations also have apparent seasonal differences. The Tmax warming trends during spring and summer are both concentrated in the range of 0.20–0.40 °C decade−1, and the number of stations for both is 31 (35% of the total, 24 and 29 of them are significant at the 0.01 level, respectively). However, the warming trends during autumn and winter are concentrated in the range of 0.40–0.60 °C decade−1, the number of stations is 27 (31% of the total, all of them are significant at the 0.01 level) and 26 (30% of the total, all of them are significant at the 0.01 level) stations, respectively. The stations with cooling trends appear in every season, but the number of stations is slightly different: the highest number is 20 in spring, and the least is seven in winter (four and none of them are significant at the 0.01 level, respectively). The seasonal trends of Tmax varied greatly in different stations. For each season, the most significant cooling trend is below −0.40 °C decade−1, while the most warming trend is over 1.0 °C decade−1.
3.1.3. The Minimum Temperature
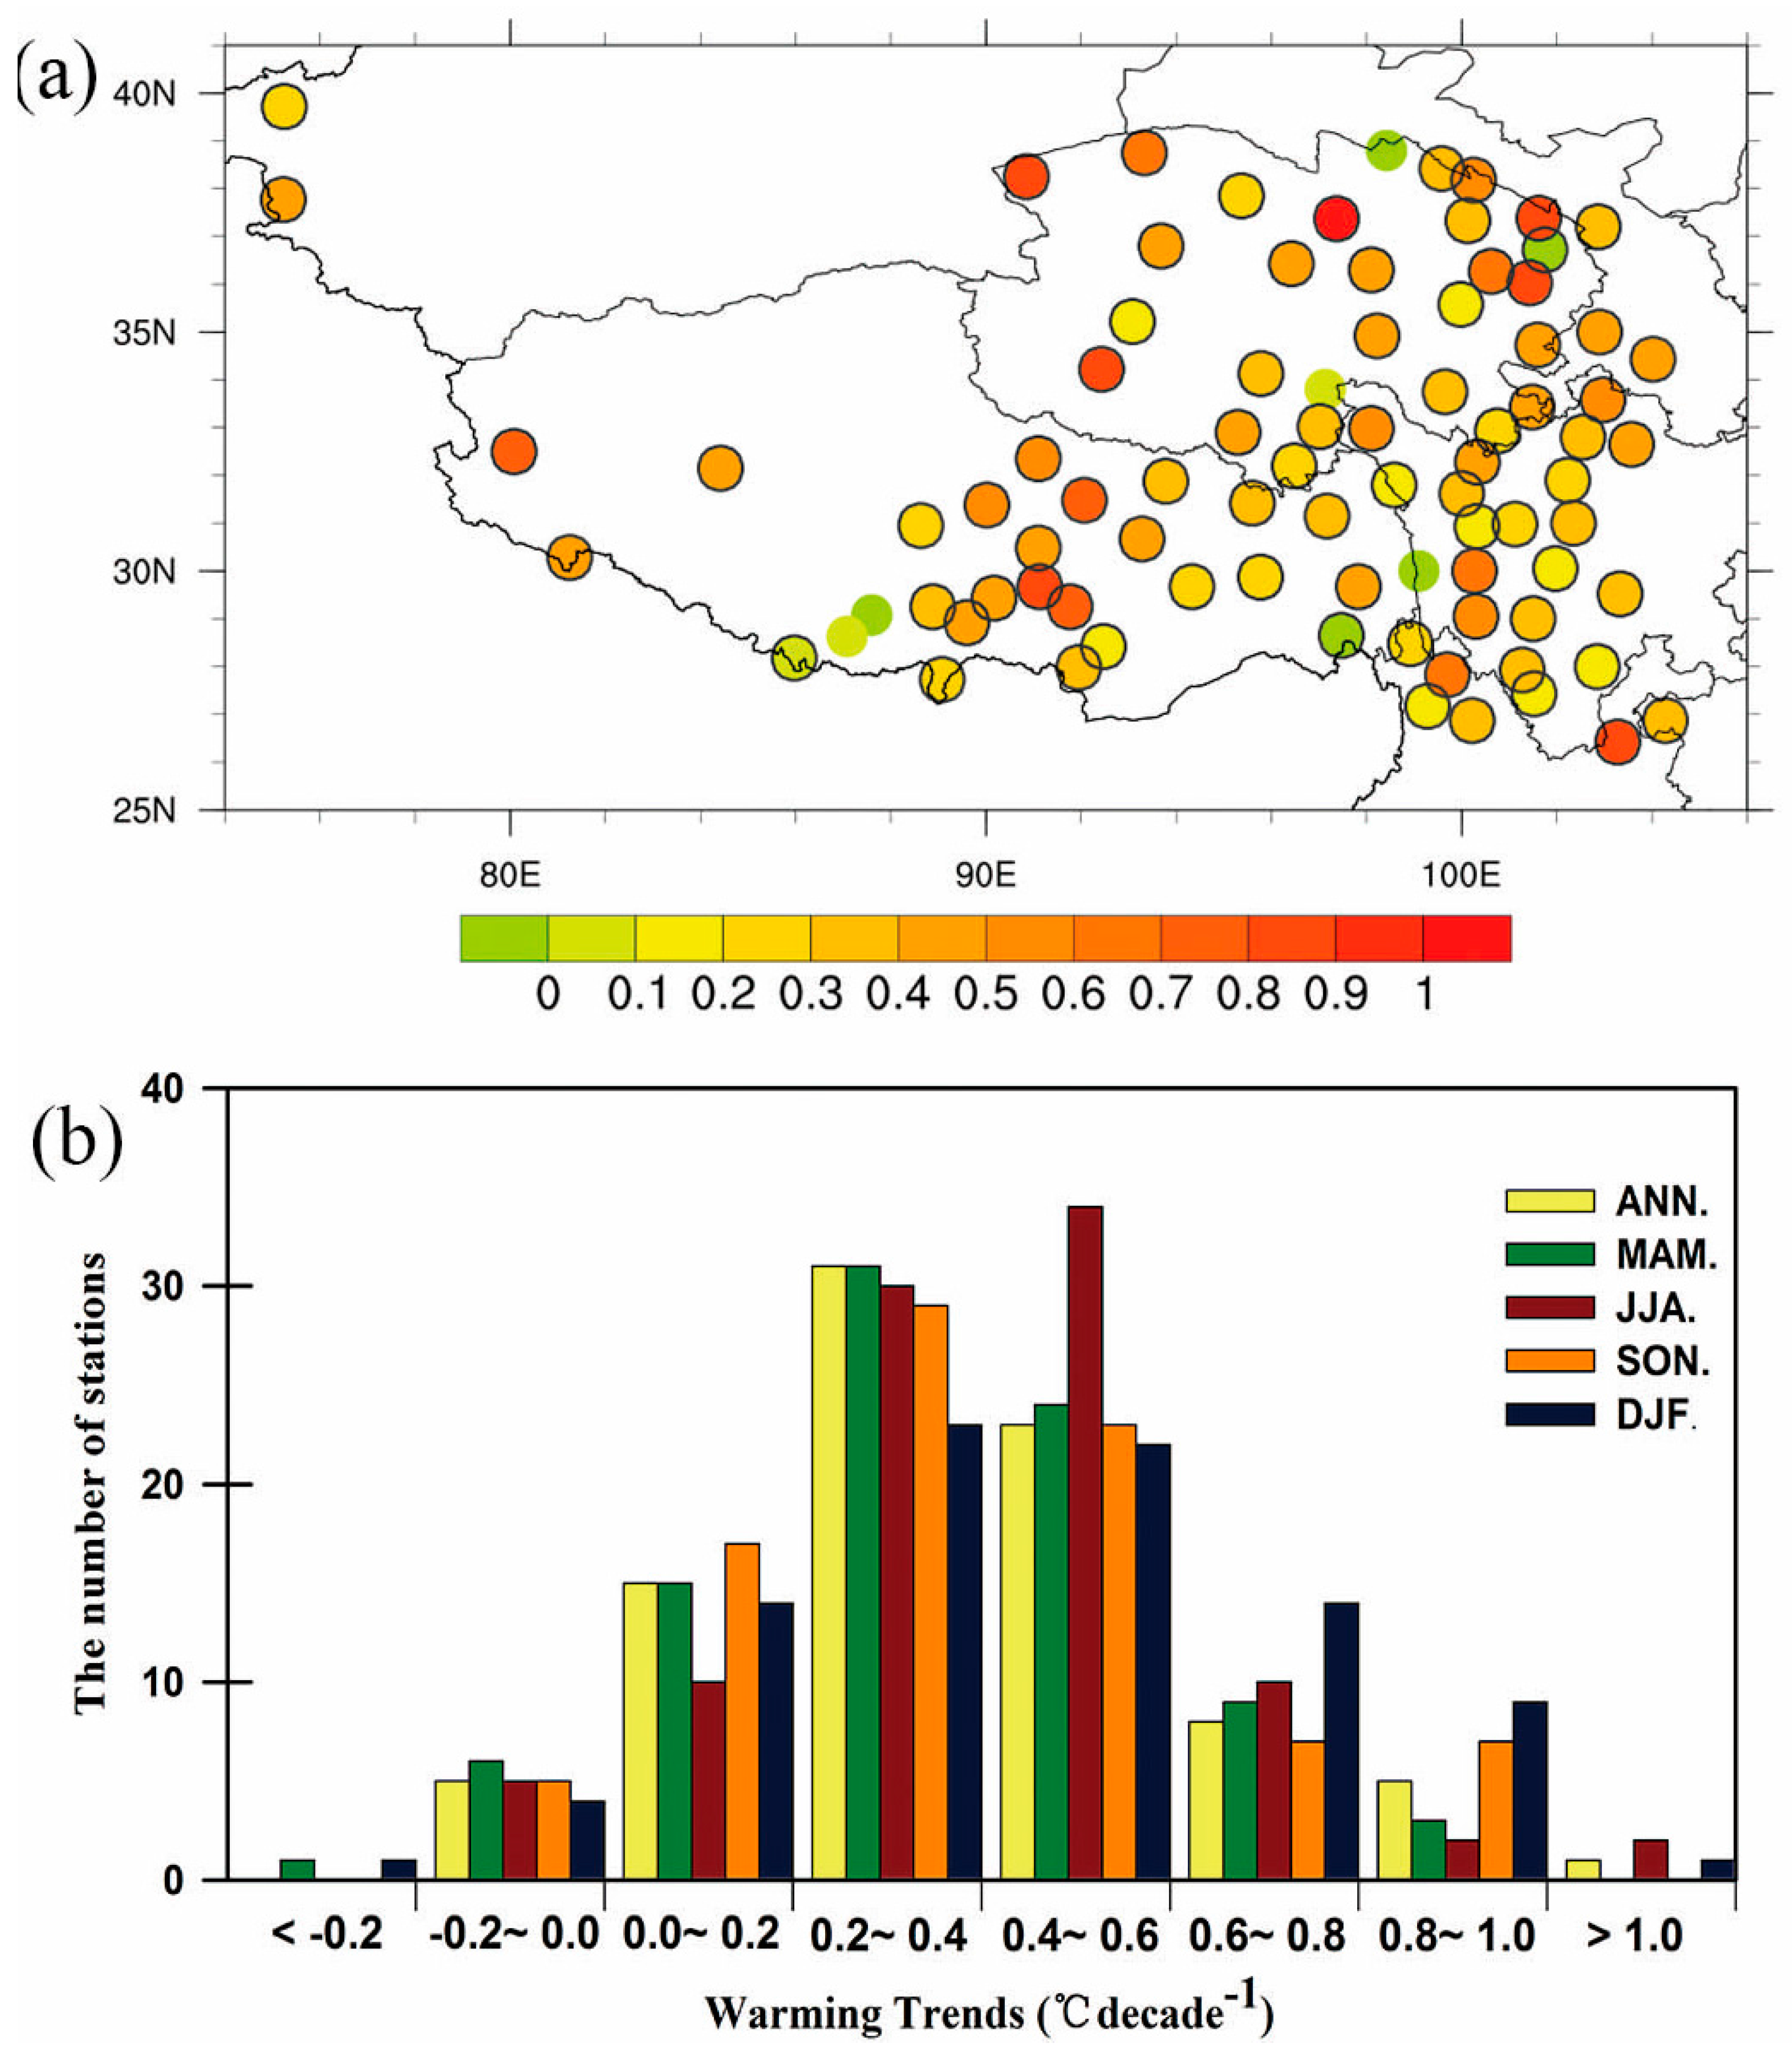
When compared with the Tmean and Tmax, the mean warming rate of annual Tmin is the largest during 1971–2015 over the TP (0.39 °C decade−1). The maximal Tmin warming rates occurs in winter, at a rate of 0.43 °C decade−1, followed by 0.42 °C decade−1 in summer, 0.40 °C decade−1 in autumn and 0.36 °C decade−1 in spring. The warming rate in summer exceeds that in autumn. The annual variations of Tmin varied from −0.16 °C decade−1 (Xining station) to 1.04 °C decade−1 (Delingha station). Five of them have cooling trends and 83 of them have warming trends.
It can be seen that the warming trend in Tmin is greater than that in Tmean, and Tmax as a whole (Figure 6a). The distribution of stations with warming trends in the aforementioned three regions is more dispersed, and the warming rates are quite high. Among the five stations in the western TP, warming trends at two stations in the Talimu Basin are below the annual mean trend, and at the other three stations in the southwest of the North Tibet are over 0.40 °C decade−1. The warming rate at Shiquanhe station is up to 0.73 °C decade−1. Only four stations have cooling trends and mainly occurred in the northern and southern edges of the TP.
Similar to Tmax, the seasonal variations of Tmin are significantly different in selected stations. However, it should be noticed that the warming rate in summer has exceeded that in autumn. Figure 6b shows the seasonal and annual variations of Tmin warming trend. The Tmin warming trends in spring, autumn, and winter are all concentrated in the range of 0.20–0.40 °C decade−1, and the numbers of station are 31 (35% of the total, all of them are significant at the 0.01 level), 29 (33% of the total, 28 of them are significant at the 0.01 level) and 23 (26% of the total, 21of them are significant at the 0.01 level), respectively. There are 10 stations whose warming rates exceeds 0.80 °C decade−1 in winter, while in spring the numbers are three (significant at the 0.01 level). In summer, the Tmin warming rates (34 stations, 39% of the total and all of them are significant at the 0.01 level) range from 0.40 to 0.60 °C decade−1, and the warming trends at three stations exceed 0.80 °C decade−1. Stations showing seasonal cooling trends occur in every season, but the numbers are varied: the highest number is seven in spring, followed by five in summer, autumn, and winter (2, 1, 2, and 2 of them are significant at the 0.01 level, respectively).
3.2. The Temporal Variation Characteristics of Warming Trends
Under the background of global warming, more significant warming trend starts from 1998 over the TP [24,42]. When considering the consistency of lengths of the time series, we chose two periods: 1980–1997 and 1998–2015 and analyzed their differences in the warming trends. The results are listed in Table 2. The warming rates of Tmean, Tmax and Tmin during 1998–2015 are all larger than that during 1980–1997 (exceeding 0.16, 0.21, and 0.04 °C decade−1 respectively). From comparisons among the four seasons, the spring warming rate has increased since 1998 (0.03, 0.08 and 0.04 °C decade−1, respectively), but decreased in other seasons. The most significant warming rates occur in summer (Tmean and Tmax) and autumn (Tmin) during 1980–1997, while occur in spring during 1998–2015.
Meanwhile, we have calculated the warming rates during 1971–1997. Similarly, the results show that the spring warming rates have increased since 1998 (exceeding 0.16, 0.20, and 0.13 °C decade−1, respectively). However, the winter warming rates have had a rapid decrease since then. The winter trends of Tmean, Tmax, and Tmin are 0.21, 0.10, and 0.34 °C decade−1, respectively, during 1971–1997, while changed into −0.05, −0.22, and 0.13 °C decade−1 during 1998–2015. In the whole research period (1971–2015), the warming rates in autumn and winter exceeded the annual warming rates, and the warming trend in winter is the most significant. However, since 1998, the warming rates in spring and summer have dramatically increased. Spring has replaced winter and has become the most significant warming season.
4. Discussion and Conclusions
In this paper, based on the data, which have beencorrected by PMFT method and the Mann-Kendall test, we focus on the temperature variations of each station on the TP, and analyze the spatial and temporal variations of Tmean, Tmax, and Tmin. The main conclusions are the following:
The monthly temperature data (including the monthly mean and the maximum and minimum temperature) in stations in the TP have poor homogeneity. It is of great importance that whether temperature data series are homogeneous or not in climate change research. The regional climate change in the TP is complicated, and the process of climate data homogeneity test and correction should receive more attention in future.
The temperatures have significantly increased during 1971–2015, and the warming rates of Tmean, Tmax, and Tmin on annual scale are 0.30, 0.27, and 0.39 °C decade−1, respectively. The tendencies of extreme temperature variations are unbalanced and the warming rate of Tmin is much greater than that of Tmax. The four seasons all show warming trends in Tmean, Tmax, and Tmin. The largest warming rate occurs in winter while the smallest occurs in spring.
The climate warming over the TP has an obvious spatial difference. Stations with significant warming trends are mainly located in three regions: around the Yellow River Basin in the eastern TP, the NianqingTangkula Mountain regions in the southern TP, and the Hengduan Mountain regions in the southeastern TP. The five selected western stations (Wulan, Tashikuergan, Gaize, Pulan, and Shiquanhe) all show significant warming trends, although their amplitudes are different. Shiquanhe station shows the highest warming rate. The distribution of stations with cooling trends is dispersive, mainly in the southern edge of the TP.
The annual and seasonal warming trends both have temporal variation characteristics. The warming rates of Tmean, Tmax, and Tmin during 1998–2015 are all larger than that during 1980–1997. The warming rates in spring have increased, while they decreased in other three seasons since 1998. In general, spring has replaced winter and becomes into the most significant warming season during nearly 20 years.
Previous studies have fully discussed the temperature variations based on station data series [19,22,25]. However, the homogenization methods often did not receive adequate attentions. Because of the limitation of natural environment, the ground observation network has not been established in the TP [43]. For existing stations, relocation and changes of instructions are of high frequency. We can receive few records of these. For these reasons, the homogeneity test and correction methods for long-term climate dataset are of great importance.
At present, the reasons of climate change in the TP have been fully discussed. The recent rapid warming trend is likely to be associated with an increased carbon dioxide content, variation of cloud, ozone depletion ratios, feedback from ice and snow, aerosol, land cover change, and urbanization [14,22,44,45]. However, there is no clear understanding of the physical mechanism of climate change in the TP, and these scientific issues are our study focus in the future. Mechanism researches require detailed meteorological data and information. The problem of observation is still the main issues that need to be preferentially solved.
Acknowledgments
This study is supported by the National Natural Science Foundation of China (41571066, 41601077, 41771068), the Chinese Academy of Sciences (CAS) “Light of West China” Program, and the International Innovative Group Project of CAS (Y42AC71001). Sincere thanks are given to all the reviewers for their valuable comments.
Author Contributions
Meixue Yang conceived and designed this study. Zhaochen Liu has processed and analyzed the data. Zhaochen Liu, Guoning Wan and Xuejia Wang have wrote this paper. All authors have read and approved the final vision of the manuscript.
Conflicts of Interest
The authors declare no conflict of interest.
Appendix A

Table A1.
Detailed information of the selected stations.
| Station Number | ID | Station Name | Latitude (N) | Longitude (E) | Elevation (m) | First Year |
|---|---|---|---|---|---|---|
| 1 | 51705 | Wuqia | 39°43′ | 75°15′ | 2175.7 | 1955 |
| 2 | 51804 | Tashikuergan | 37°46′ | 75°14′ | 3090.1 | 1957 |
| 3 | 51886 | Mangya | 38°15′ | 90°51′ | 2944.8 | 1958 |
| 4 | 52602 | Lenghu | 38°45′ | 93°20′ | 2770 | 1956 |
| 5 | 52633 | Tuole | 38°48′ | 98°25′ | 3367 | 1956 |
| 6 | 52645 | Yeniugou | 38°25′ | 99°35′ | 3320 | 1959 |
| 7 | 52657 | Qilian | 38°11′ | 100°15′ | 2787.4 | 1956 |
| 8 | 52707 | Xiaozaohuo | 36°48′ | 93°41′ | 2767 | 1960 |
| 9 | 52713 | Dachaidan | 37°51′ | 95°22′ | 3173.2 | 1956 |
| 10 | 52737 | Delingha | 37°22′ | 97°22′ | 2981.5 | 1955 |
| 11 | 52754 | Gangcha | 37°20′ | 100°08′ | 3301.5 | 1957 |
| 12 | 52765 | Menyuan | 37°23′ | 101°37′ | 2850 | 1956 |
| 13 | 52787 | Wushaoling | 37°12′ | 102°52′ | 3045.1 | 1951 |
| 14 | 52818 | Geermu | 36°25′ | 94°54′ | 2807.6 | 1955 |
| 15 | 52825 | Nuomuhong | 36°26′ | 96°25′ | 2790.4 | 1956 |
| 16 | 52836 | Dulan | 36°18′ | 98°06′ | 3191.1 | 1954 |
| 17 | 52856 | Qiabuqia | 36°16′ | 100°37′ | 2835 | 1953 |
| 18 | 52866 | Xining | 36°43′ | 101°45′ | 2295.2 | 1954 |
| 19 | 52868 | Guizhou | 36°02′ | 101°26′ | 2237.1 | 1956 |
| 20 | 52908 | Wudaoliang | 35°13′ | 93°05′ | 4612.2 | 1956 |
| 21 | 52943 | Xinghai | 35°35′ | 99°59′ | 3323.2 | 1960 |
| 22 | 55228 | Shiquanhe | 32°30′ | 80°05′ | 4278.6 | 1961 |
| 23 | 55279 | Bange | 31°23′ | 90°01′ | 4700 | 1956 |
| 24 | 55294 | Anduo | 32°21′ | 91°06′ | 4800 | 1965 |
| 25 | 55299 | Naqu | 31°29′ | 92°04′ | 4507 | 1954 |
| 26 | 55472 | Shenzha | 30°57′ | 88°38′ | 4672 | 1960 |
| 27 | 55493 | Dangxiong | 30°29′ | 91°06′ | 4200 | 1962 |
| 28 | 55578 | Rikaze | 29°15′ | 88°53′ | 3836 | 1955 |
| 29 | 55591 | Lhasa | 29°40′ | 91°08′ | 3648.9 | 1955 |
| 30 | 55598 | Zedang | 29°15′ | 91°46′ | 3551.7 | 1956 |
| 31 | 55655 | Nielaer | 28°11′ | 85°58′ | 3810 | 1966 |
| 32 | 55664 | Dingri | 28°38′ | 87°05′ | 4300 | 1959 |
| 33 | 55680 | Jiangzi | 28°55′ | 89°36′ | 4040 | 1956 |
| 34 | 55690 | Cuona | 27°59′ | 91°57′ | 4280.3 | 1967 |
| 35 | 55696 | Longzi | 28°25′ | 92°28′ | 3860 | 1959 |
| 36 | 55773 | Pali | 27°44′ | 89°05′ | 4300 | 1956 |
| 37 | 56004 | Tuotuohe | 34°13′ | 92°26′ | 4533.1 | 1956 |
| 38 | 56018 | Zaduo | 32°54′ | 95°18′ | 4066.4 | 1956 |
| 39 | 56021 | Qumalai | 34°8′ | 95°47′ | 4175 | 1956 |
| 40 | 56029 | Yushu | 33°1′ | 97°01′ | 3681.2 | 1951 |
| 41 | 56033 | Maduo | 34°55′ | 98°13′ | 4272.3 | 1953 |
| 42 | 56034 | Qingshuihe | 33°48′ | 97°08′ | 4415.4 | 1956 |
| 43 | 56038 | Shiqu | 32°59′ | 98°06′ | 4200 | 1960 |
| 44 | 56046 | Dari | 33°45′ | 99°39′ | 3967.5 | 1956 |
| 45 | 56065 | Henan | 34°44′ | 101°36′ | 3500 | 1959 |
| 46 | 56067 | Jiuzhi | 33°26′ | 101°29′ | 3628.5 | 1958 |
| 47 | 56074 | Maqu | 34°0′ | 102°05′ | 3471.4 | 1967 |
| 48 | 56079 | Ruoergai | 33°35′ | 102°58′ | 3439.6 | 1957 |
| 49 | 56080 | Hezuo | 35°00′ | 102°54′ | 2910 | 1957 |
| 50 | 56093 | Minxian | 34°26′ | 104°01′ | 2315 | 1951 |
| 51 | 56106 | Suoxian | 31°53′ | 93°47′ | 4022.8 | 1956 |
| 52 | 56116 | Dingqing | 31°25′ | 95°36′ | 3873.1 | 1954 |
| 53 | 56125 | Nangqian | 32°12′ | 96°29′ | 3643.7 | 1956 |
| 54 | 56137 | Changdu | 31°09′ | 97°10′ | 3306 | 1954 |
| 55 | 56144 | Dege | 31°48′ | 98°35′ | 3184 | 1956 |
| 56 | 56146 | Ganzi | 31°37′ | 100°00′ | 3393.5 | 1951 |
| 57 | 56151 | Banma | 32°56′ | 100°45′ | 3530 | 1960 |
| 58 | 56152 | Seda | 32°17′ | 100°20′ | 3893.9 | 1961 |
| 59 | 56167 | Daofu | 30°59′ | 101°07′ | 2957.2 | 1957 |
| 60 | 56172 | Maerkang | 31°54′ | 102°14′ | 2664.4 | 1953 |
| 61 | 56173 | Hongyuan | 32°48′ | 102°33′ | 3491.6 | 1960 |
| 62 | 56178 | Xiaojin | 31°00′ | 102°21′ | 2369.2 | 1951 |
| 63 | 56182 | Songpan | 32°39′ | 103°34′ | 2850.7 | 1951 |
| 64 | 56202 | Jiali | 30°40′ | 93°17′ | 4488.8 | 1954 |
| 65 | 56227 | Bomi | 29°52′ | 95°46′ | 2736 | 1955 |
| 66 | 56247 | Batang | 30°00′ | 99°06′ | 2589.2 | 1952 |
| 67 | 56251 | Xinlong | 30°56′ | 100°19′ | 3000 | 1959 |
| 68 | 56257 | Litang | 30°00′ | 100°16′ | 3948.9 | 1952 |
| 69 | 56312 | Linzhi | 29°40′ | 94°20′ | 2991.8 | 1954 |
| 70 | 56357 | Daocheng | 29°03′ | 100°18′ | 3727.7 | 1957 |
| 71 | 56374 | Kangding | 30°03′ | 101°58′ | 2615.7 | 1951 |
| 72 | 56385 | Emeishan | 29°31′ | 103°20′ | 3047.4 | 1951 |
| 73 | 56434 | Chayu | 28°39′ | 97°28′ | 2327.6 | 1969 |
| 74 | 56444 | Deqin | 28°29′ | 98°55′ | 3319 | 1953 |
| 75 | 56459 | Muli | 27°56′ | 101°16′ | 2426.5 | 1959 |
| 76 | 56462 | Jiulong | 29°00′ | 101°30′ | 2987.3 | 1952 |
| 77 | 56479 | Zhaojue | 28°00′ | 102°51′ | 2132.4 | 1956 |
| 78 | 56543 | Zhongdian | 27°50′ | 99°42′ | 3276.7 | 1958 |
| 79 | 56548 | Weixi | 27°10′ | 99°17′ | 2326.1 | 1954 |
| 80 | 56565 | Yanyuan | 27°26′ | 101°31′ | 2545 | 1956 |
| 81 | 56651 | Lijiang | 26°52′ | 100°13′ | 2392.4 | 1951 |
| 82 | 56684 | Huize | 26°25′ | 103°17′ | 2110.5 | 1952 |
| 83 | 56691 | Weining | 26°52′ | 104°17′ | 2237.5 | 1951 |
| 84 | 55585 | Nimu * | 29°26′ | 90°10′ | 3809.4 | 1973 |
| 85 | 55248 | Gaize * | 32°09′ | 84°25′ | 4414.9 | 1973 |
| 86 | 55437 | Pulan * | 30°17′ | 81°15′ | 4900 | 1973 |
| 87 | 55569 | Lazi * | 29°05′ | 87°36′ | 4000 | 1977 |
| 88 | 56331 | Zuogong * | 29°40′ | 97°50′ | 3780 | 1978 |
Noted: * means the start year of data after 1971.
References
- Intergovernmental Panel on Climate Change (IPCC). Climate Change 2013: The Physical Science Basis: Summary for Policymakers; Cambridge University Press: Cambridge, UK, 2013; pp. 1–30. [Google Scholar]
- Gregory, J.M.; Oerlemans, J. Simulated future sea-level rise due to glacier melt based on regionally and seasonally resolved temperature changes. Nature 1998, 391, 474–476. [Google Scholar] [CrossRef]
- Yao, T.; Wang, Y.; Liu, S.; Pu, J.; Shen, Y.; Lu, A. Recent glacial retreat in High Asia in China and its impact on water resource in Northwest China. Sci. China Earth Sci. 2004, 47, 1065–1075. [Google Scholar] [CrossRef]
- Roudier, P.; Andersson, J.C.M.; Donnelly, C.; Feyen, L.; Greuell, W.; Ludwig, F. Projections of future floods and hydrological droughts in Europe under a +2 °C global warming. Clim. Chang. 2016, 135, 341–355. [Google Scholar] [CrossRef] [Green Version]
- Ren, G.; Ding, Y.; Tang, G. An overview of Mainland China temperature change research. J. Meteorol. Res. 2017, 31, 3–16. [Google Scholar] [CrossRef]
- Xiao, B.; Ma, Y.; Zhao, T.; Yan, S. Long-term t rends in extreme Temperature over China Mainland based on homogenized dataset. Meteorol. Mon. 2016, 42, 339–346. [Google Scholar]
- Zhou, Y.; Ren, G. Variation characteristics of extreme temperature indices in mainland China during 1956–2008. Clim. Environ. Res. 2010, 15, 405–417. [Google Scholar]
- Wang, D.; You, Q.; Jiang, Z.; Wu, W.; Jiao, Y. Analysis of extreme temperature changes in China based on the homogeneity-adjusted data. Plateau Meteorol. 2016, 35, 1352–1363. [Google Scholar]
- Li, Q.; Yang, S.; Xu, W.; Wang, X.L.; Jones, P.; Parker, D.; Zhou, L.; Feng, Y.; Gao, Y. China experiencing the recent warming hiatus. Geophys. Res. Lett. 2015, 42, 889–898. [Google Scholar] [CrossRef]
- Beniston, M.; Rebetez, M. Regional behavior of minimum temperatures in Switzerland for the period 1979–1993. Theor. Appl. Climatol. 1996, 53, 231–243. [Google Scholar] [CrossRef]
- Giorgi, F.; Hurrell, J.W.; Marinucci, M.R.; Beniston, M. Elevation dependency of the surface climate change signal: A model study. J. Clim. 2010, 10, 288–296. [Google Scholar] [CrossRef]
- Fyfe, J.C.; Flato, G.M. Enhanced climate change and its detection over the Rocky Mountains. J. Clim. 2011, 12, 230–243. [Google Scholar] [CrossRef]
- Yan, L.; Liu, X. Has climatic warming over the Tibetan Plateau paused or continued in recent years. J. Earth Ocean Atmos. Sci. 2014, 1, 13–28. [Google Scholar]
- Mountain Research Initiative EDW Working Group; Pepin, N.; Bradley, R.S.; Diaz, H.F.; Baraer, M.; Caceres, E.B.; Forsythe, N.; Fowler, H.; Greenwood, G.; Hashmi, M.Z.; et al. Elevation-dependent warming in mountain regions of the world. Nat. Clim. Chang. 2015, 5, 424–430. [Google Scholar] [Green Version]
- Jiang, D.; Ding, Z.; Drange, H.; Gao, Y. Sensitivity of East Asian climate to the progressive uplift and expansion of the Tibetan plateau under the Mid-Pliocene boundary conditions. Adv. Atmos. Sci. 2008, 25, 709–722. [Google Scholar] [CrossRef]
- Wu, G.; Liu, Y.; He, B.; Bao, Q.; Duan, A.; Jin, F.F. Thermal controls on the Asian summer monsoon. Sci. Rep. 2011, 2, 404. [Google Scholar] [CrossRef] [PubMed]
- Yao, T.; Thompson, L.; Yang, W.; Yu, W.; Gao, Y.; Guo, X.; Yang, X.; Duan, K.; Zhao, H.; Xu, B.; et al. Different glacier status with atmospheric circulations in Tibetan Plateau and surroundings. Nat. Clim. Chang. 2012, 2, 663–667. [Google Scholar] [CrossRef]
- Cai, Y.; Li, D.; Tang, M.; Bai, C. Decadal temperature changes over Qinghai-Xizang Plateau in recent 50 years. Plateau Meteorol. 2003, 22, 464–470. [Google Scholar]
- Liu, X.; Chen, B. Climatic warming in the Tibetan Plateau during recent decades. Int. J. Climatol. 2000, 20, 1729–1742. [Google Scholar] [CrossRef]
- Li, L.; Zhu, X.; Qin, N.; Wang, Z.; Wang, Q.; Zhou, L. Study on temperature variations and its anomaly patterns over Qinghai-Xizang Plateau. Plateau Meteorol. 2003, 22, 524–530. [Google Scholar]
- Wang, X.; Pang, G.; Yang, M.; Zhao, G. Evaluation of climate on the Tibetan Plateau using ERA-interim reanalysis and gridded observations during the period 1979–2012. Quat. Int. 2017, 444, 76–86. [Google Scholar] [CrossRef]
- Guo, D.; Wang, H. The significant climate warming in the Northern Tibetan Plateau and its possible causes. Int. J. Climatol. 2012, 32, 1775–1781. [Google Scholar] [CrossRef]
- Xu, Y.; Knudby, A.; Ho, H.C.; Shen, Y.; Liu, Y.H. Warming over the Tibetan Plateau in the last 55 years based on area-weighted average temperature. Reg. Environ. Chang. 2017, 1–9. [Google Scholar] [CrossRef]
- Zheng, R.; Li, D.; Jiang, Y. New Characteristics of temperature change over Qinghai-Xizang Plateau on the background of global warming. Plateau Meteorol. 2015, 34, 1531–1539. [Google Scholar]
- Liu, X.; Yin, Z.Y.; Shao, X.; Qin, N. Temporal trends and variability of daily maximum and minimum, extreme temperature events, and growing season length over the Eastern and Central Tibetan Plateau during 1961–2003. J. Geophys. Res. Atmos. 2006, 111, 4617–4632. [Google Scholar] [CrossRef]
- Szentimrey, T. The Manual of Multiple Analysis of Series for Homogenization (MASH), Hungarian Meteorological Service, Budapest, Hungary. 2008. Available online: http://www.met.hu/pages/seminars/seeera/index.html (accessed on 5 November 2017).
- Wang, X.L. Accounting for autocorrelation in detecting mean-shifts in climate data series using the penalized maximal tor F test. J. Appl. Meteorol. Climatol. 2008, 47, 2423–2444. [Google Scholar] [CrossRef]
- Wang, X.L. Penalized maximal F-test for detecting undocumented mean-shifts without trend change. J. Atmos. Ocean. Technol. 2008, 25, 368–384. [Google Scholar] [CrossRef]
- Menne, M.J.; Williams, J.R.; Claude, N. Homogenization of temperature series via pairwise comparisons. J. Clim. 2009, 22, 1700–1717. [Google Scholar] [CrossRef]
- Zhang, Y.; Li, B.; Zheng, D. A discussion on the boundary and area of the Tibetan Plateau in China. Geogr. Res. 2002, 21, 1–8. [Google Scholar]
- Zhang, X.; Aguilar, E.; Sensoy, S.; Melkonyan, H.; Tagiyeva, U.; Ahmed, N.; Kutaladze, N.; Rahimzadeh, F.; Taghipour, A.; Hantosh, T.H.; et al. Trends in Middle East climate extreme indices from 1950 to 2003. J. Geophys. Res. Atmos. 2005, 110, 3159–3172. [Google Scholar] [CrossRef]
- You, Q.; Kang, S.; Aguilar, E.; Yan, Y. Changes in daily climate extremes in the Eastern and Central Tibetan Plateau during 1961–2005. J. Geophys. Res. Atmos. 2008, 113, 1639–1647. [Google Scholar] [CrossRef]
- Cao, L.; Ju, X.; Liu, X. Penalized maximal f test for the homogeneity study of the annual mean wind speed over China. Meteorol. Mon. 2010, 36, 52–56. [Google Scholar]
- Wang, X.L. Comments on “Detection of undocumented changepoints: A revision of the two-phase regression model”. J. Clim. 2003, 16, 3383–3385. [Google Scholar] [CrossRef]
- Cao, L.; Yan, Z.W. Progress in research on homogenization of climate data. Adv. Clim. Chang. Res. 2012, 3, 59–67. [Google Scholar]
- Wan, G.; Yang, M.; Liu, Z.; Wang, X.; Liang, X. The precipitation variations in the Qinghai-Xizang (Tibetan) Plateau during 1961–2015. Atmosphere 2017, 8, 80. [Google Scholar] [CrossRef]
- Cao, L.; Yan, Z.; Zhao, P.; Zhu, Y.; Yu, Y.; Tang, G.L.; Jones, P. Climatic warming in China during 1901–2015 based on an extended dataset of instrumental temperature records. Environ. Res. Lett. 2017, 12, 064005. [Google Scholar] [CrossRef]
- You, Y.; Xu, H.; Wan, Y.; Wang, X. Detecting and analysis on average temperature data homogeneity of Sichuan. Plateau Mt. Meteorol. Res. 2009, 29, 45–48. [Google Scholar]
- Zhu, X.; Li, L.; Li, Q.; Wang, Z.; Wang, Q.; Shi, X. Homogeneity of historical climate data based on relocation data in Qinghai Province. J. Qinghai Meteorol. 2010, 2, 6–9. [Google Scholar]
- Mann, H.B. Non-parametric Tests against Trend. Econometrica 1945, 13, 245–259. [Google Scholar] [CrossRef]
- Kendall, M.G. Rank-Correlation Measures; Charles Griffin: London, UK, 1975; p. 202. [Google Scholar]
- Duan, A.; Xiao, Z. Does the climate warming hiatus exist over the Tibetan Plateau? Sci. Rep. 2015, 5, 13711. [Google Scholar] [CrossRef] [PubMed]
- Wang, X.; Pang, G.; Yang, M. Precipitation over the Tibetan Plateau during recent decades: A review based on observations and simulations. Int. J. Climatol. 2017. [Google Scholar] [CrossRef]
- Cui, X.; Graf, H.F. Recent land cover changes on the Tibetan Plateau: A review. Clim. Chang. 2009, 94, 47–61. [Google Scholar] [CrossRef]
- Wang, X.; Yang, M.; Liang, X.; Pang, G.; Wan, G.; Chen, X.; Luo, X. The dramatic climate warming in the Qaidam Basin, Northeastern Tibetan Plateau, during 1961–2010. Int. J. Climatol. 2014, 34, 1524–1537. [Google Scholar] [CrossRef]
Figure 1.
The locations of selected stations.

Figure 2.
The number of changepoints in the monthly minimum temperature (Tmin), the monthly maximum temperature (Tmax) and the monthly mean temperature (Tmean) dataseries during different periods.
Figure 2.
The number of changepoints in the monthly minimum temperature (Tmin), the monthly maximum temperature (Tmax) and the monthly mean temperature (Tmean) dataseries during different periods.
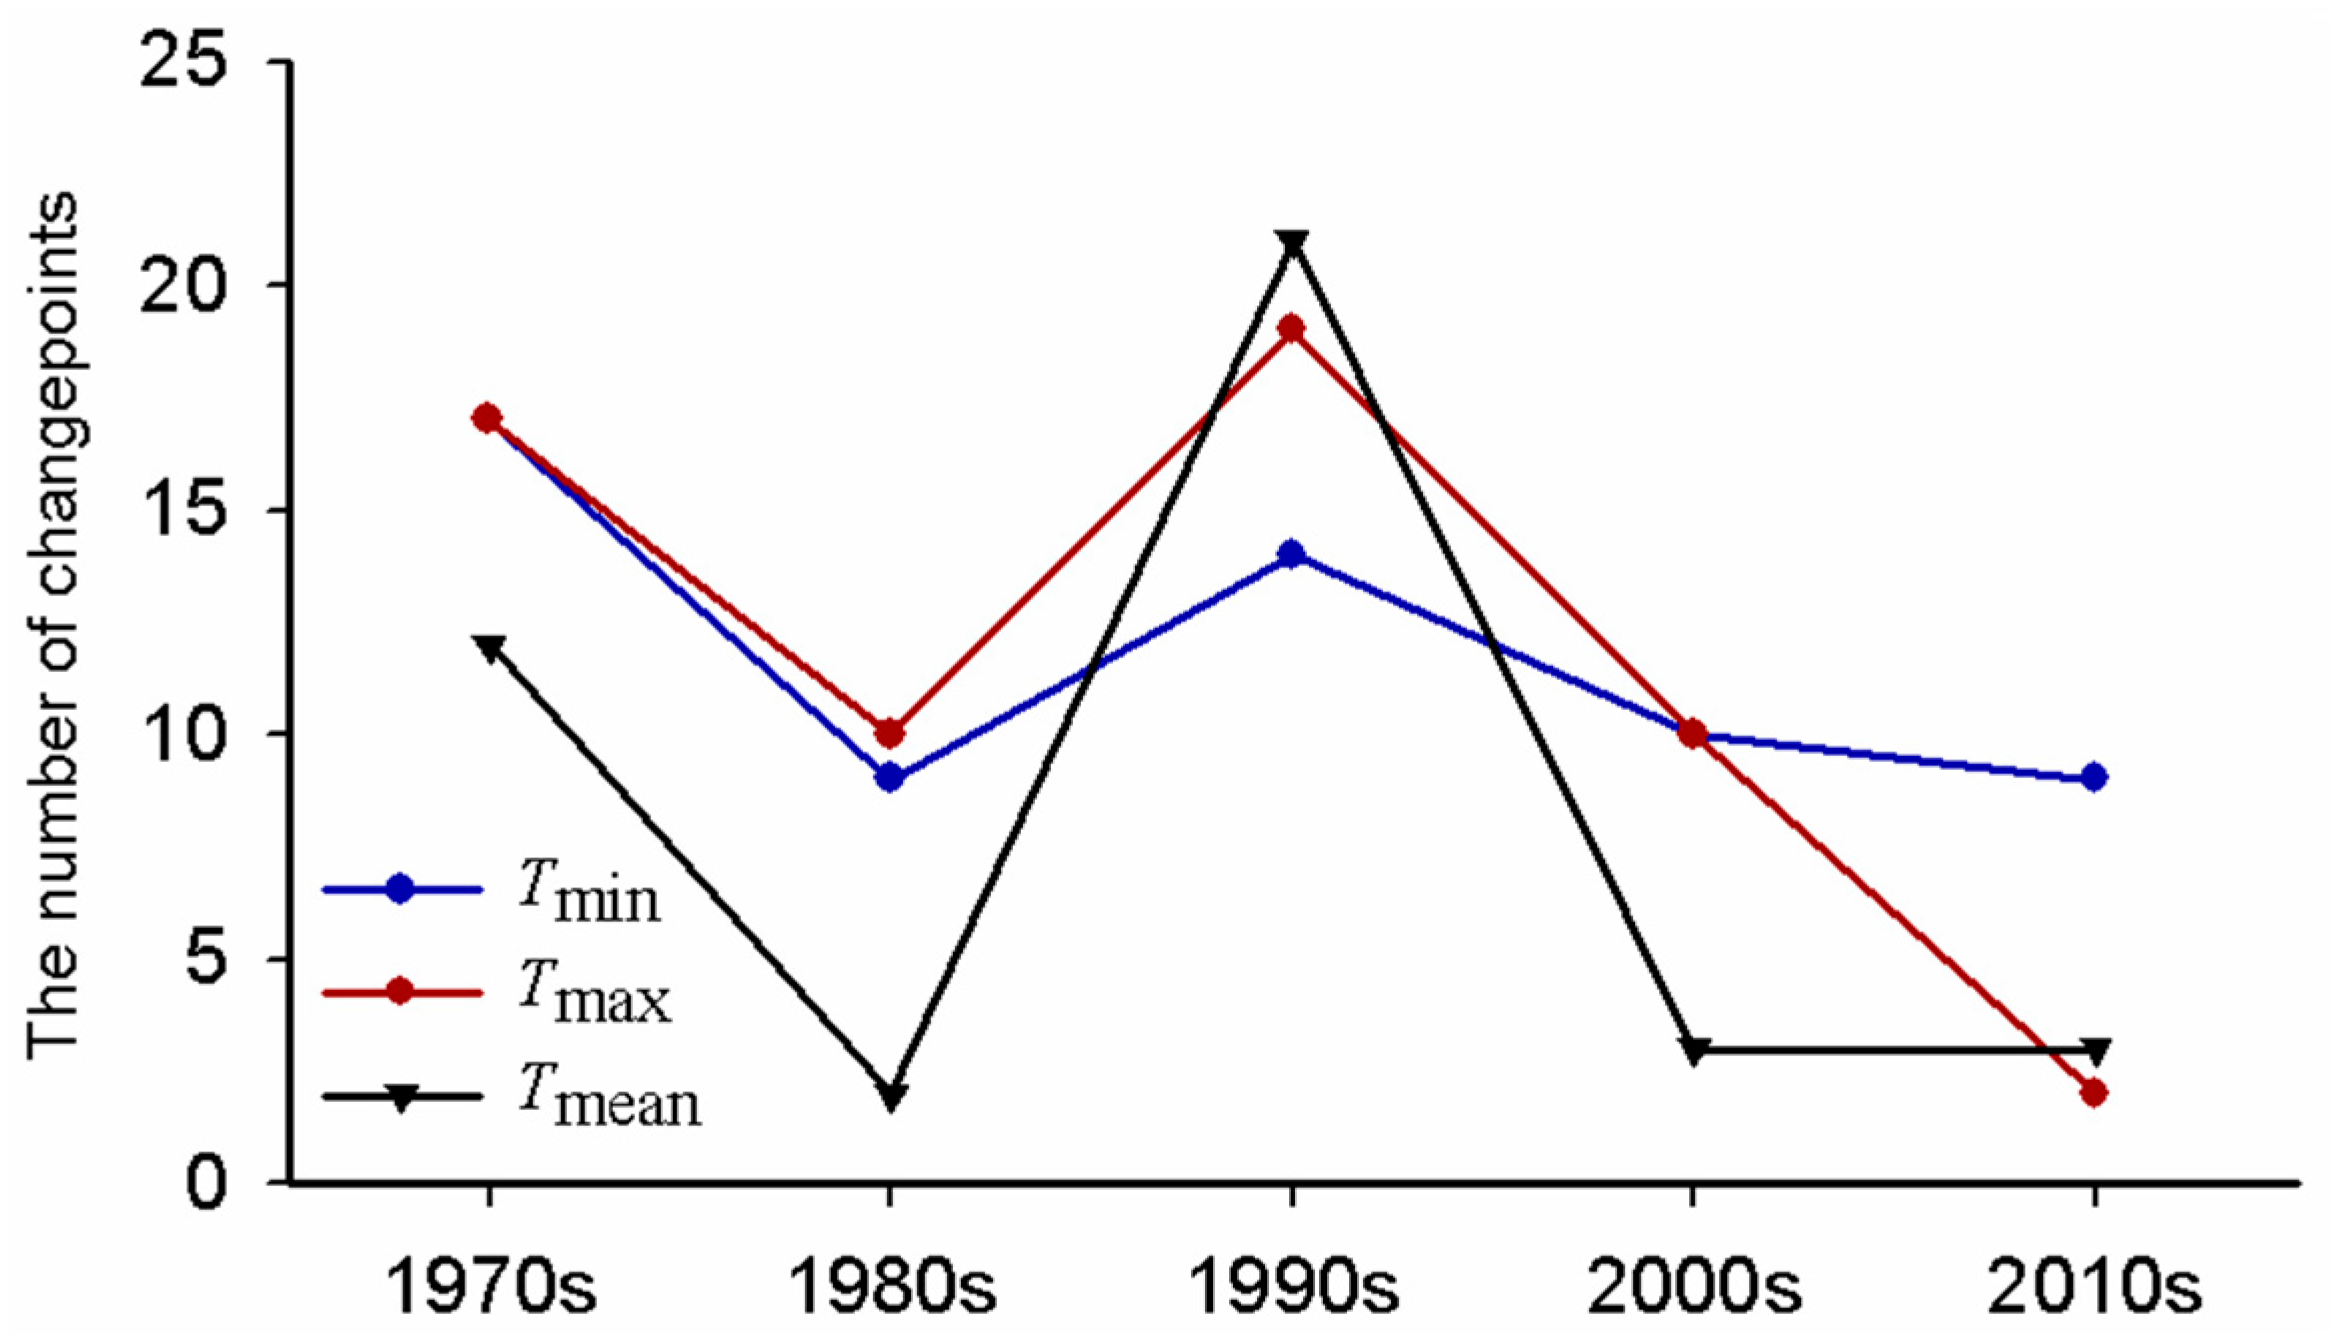
Figure 3.
Comparisons between the raw and corrected data series at three stations. The absolute values of their difference in annual mean temperature trend are larger than 0.5 °C decade−1: (a) Henan station; (b) Muli station; and, (c) Mangya station. Red and blue solid lines indicate the raw and corrected data series, respectively.
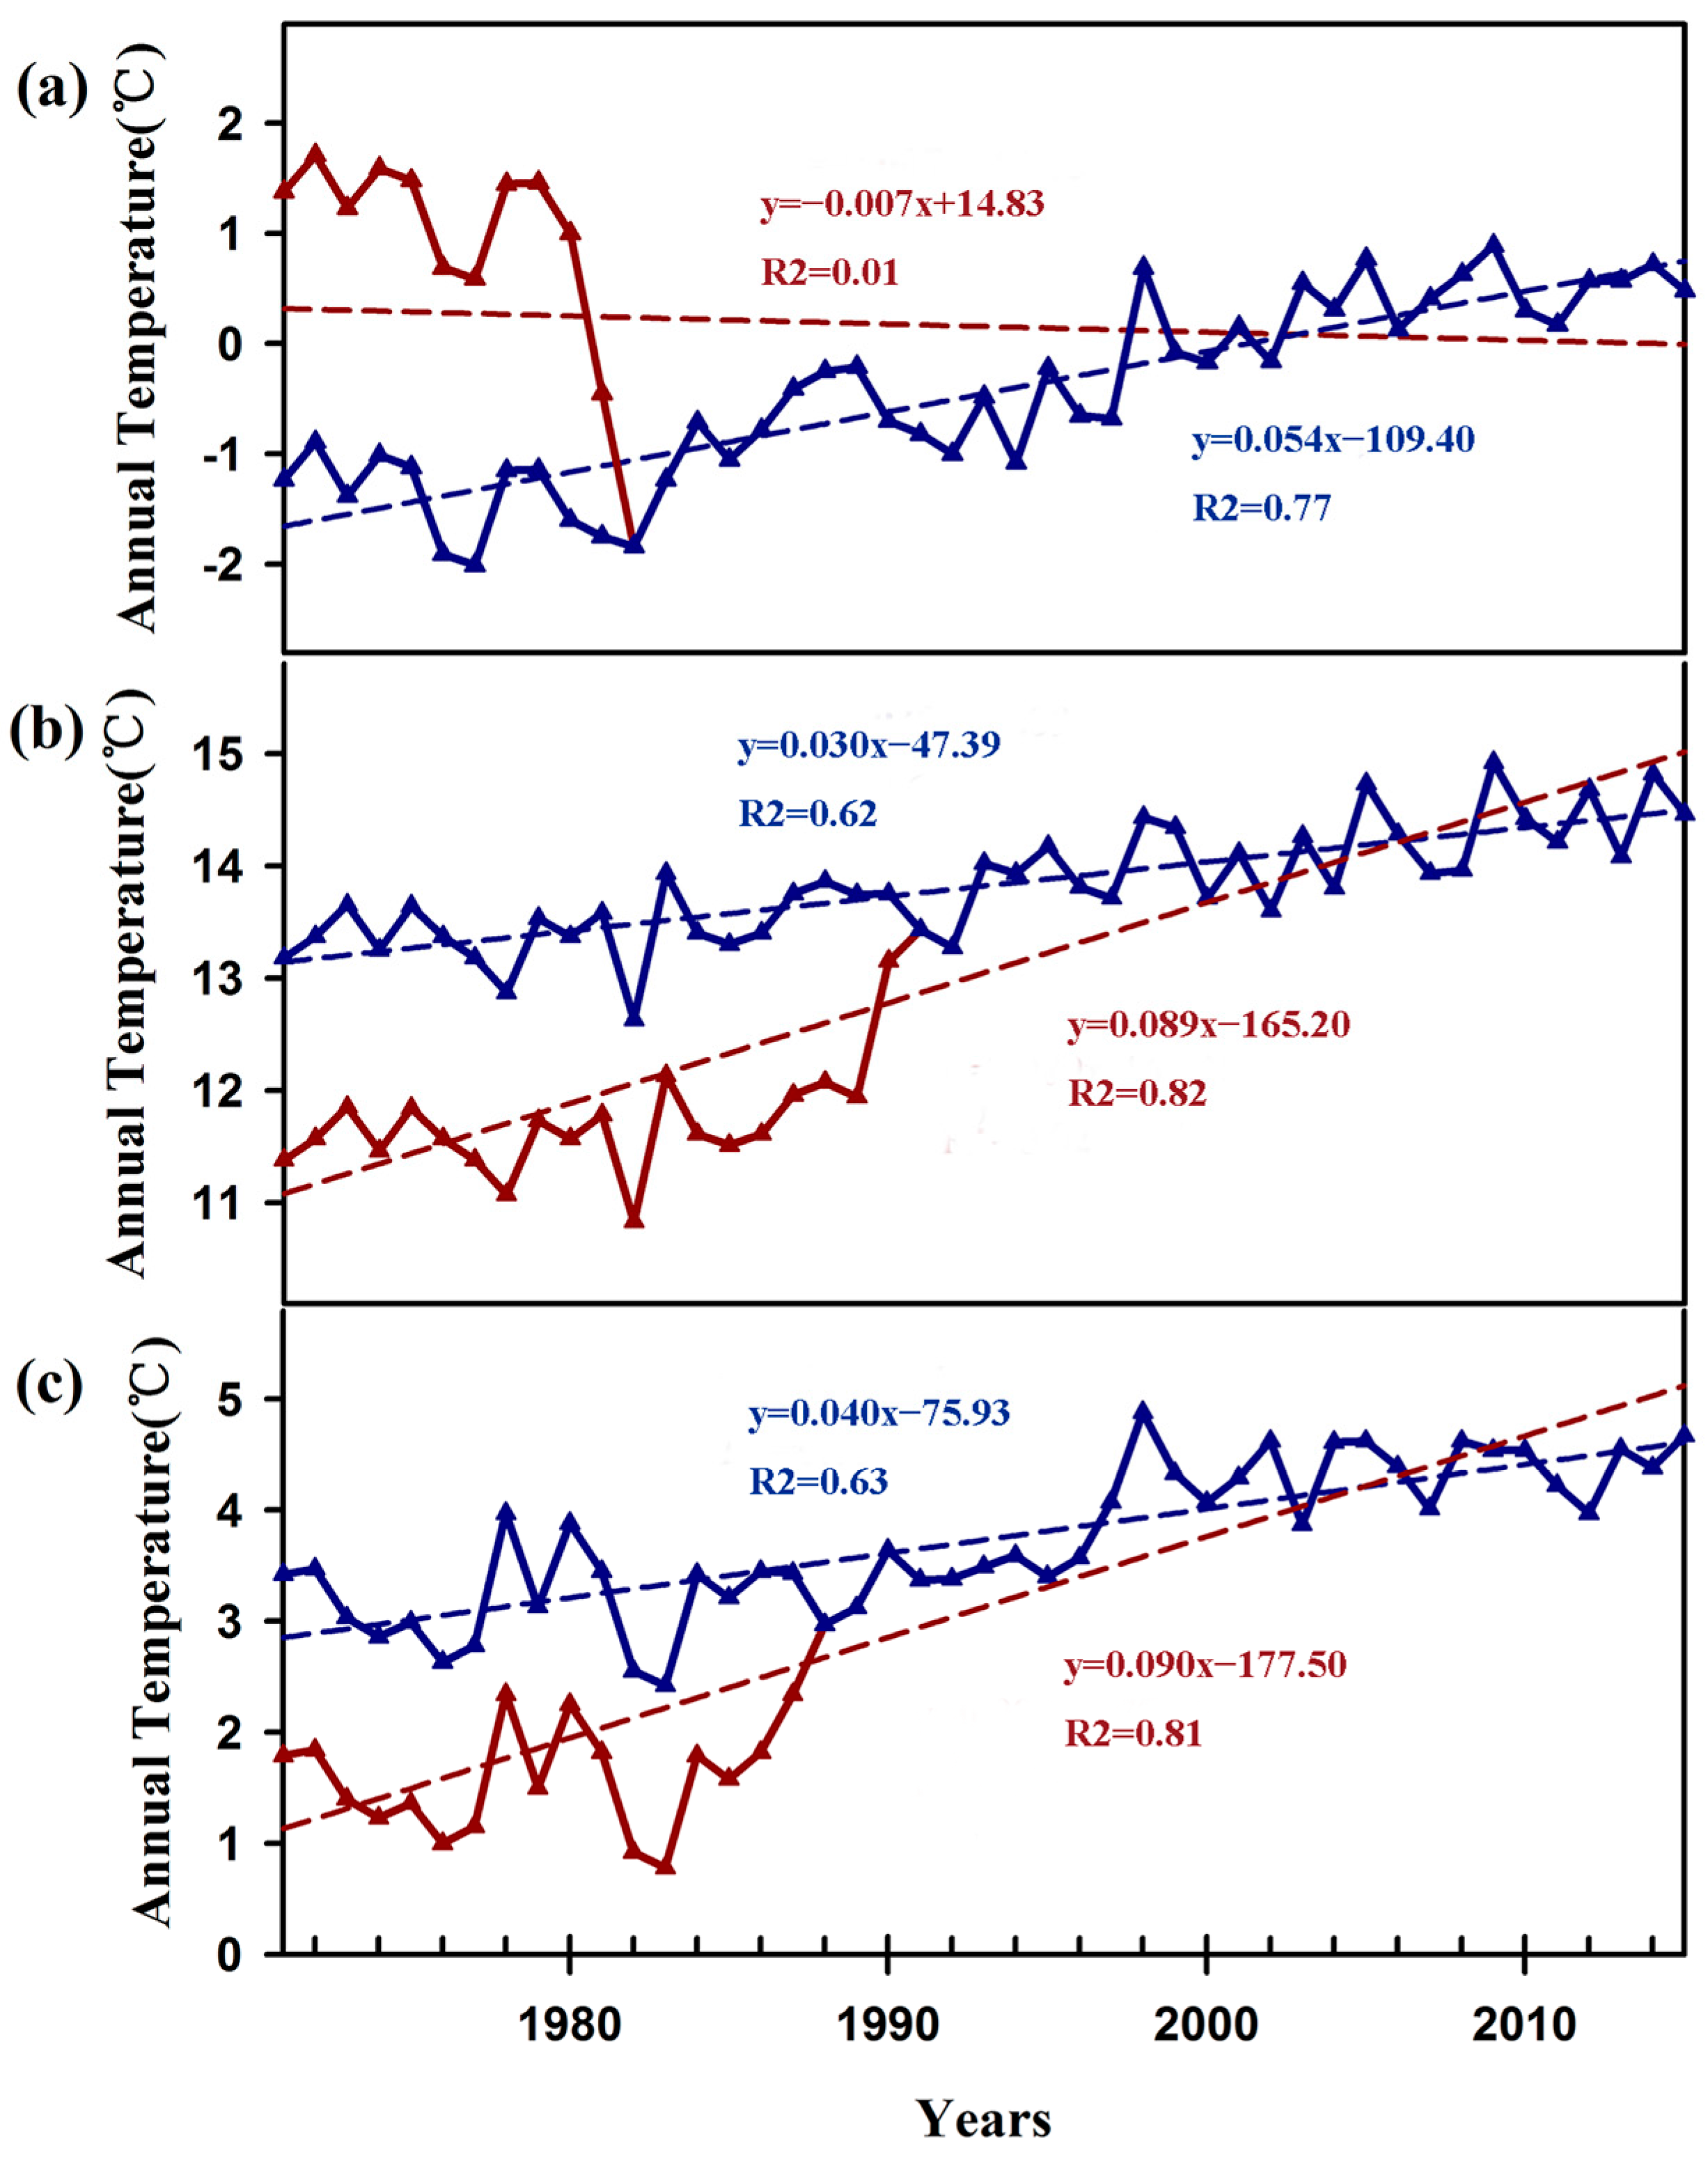
Figure 4.
Spatial distribution and seasonal difference in mean temperature during 1971–2015. (a) Spatial distribution of annual temperature variations in 88 stations (points with blue circles indicate that they are significant at the 0.01 level); (b) The number of stations with different variation trends in annual and seasonal scales.

Figure 5.
Similar to Figure 3, but for the maximum temperature. (a) Spatial distribution of annual temperature variations in 88 stations (points with blue circles indicate that they are significant at the 0.01 level); (b) The number of stations with different variation trends in annual and seasonal scales.

Figure 6.
Similar to Figure 3, but for the minimum temperature. (a) Spatial distribution of annual temperature variations in 88 stations (points with blue circles indicate that they are significant at the 0.01 level); (b) The number of stations with different variation trends in annual and seasonal scales.

Table 1.
The relocation data and comparison between annual mean temperature variations before and after corrections in selected stations.
Table 1.
The relocation data and comparison between annual mean temperature variations before and after corrections in selected stations.
| ID | Station Name | (°C decade−1) | Relocation Year | Changepoint Year |
|---|---|---|---|---|
| 56065 | Henan | 0.621 | 1981 | 1981 |
| 56459 | Muli | 0.588 | 1990 | 1990 |
| 51886 | Mangya | 0.507 | 1987 | 1987 |
Noted: indicates the linear trends of corrected data series; indicates the linear trends of raw data series.
Table 2.
The warming trends (°C decade−1) of the mean temperature (Tmean), the maximum temperature (Tmax) and the minimum temperature (Tmin) on annual and seasonal scale in different periods.
Table 2.
The warming trends (°C decade−1) of the mean temperature (Tmean), the maximum temperature (Tmax) and the minimum temperature (Tmin) on annual and seasonal scale in different periods.
| Temperature | Periods | Spring | Summer | Autumn | Winter | Annual |
|---|---|---|---|---|---|---|
| Tmean | 1971–1997 | 0.10 | 0.26 * | 0.28 | 0.21 | 0.16 * |
| 1980–1997 | 0.23 | 0.29 | 0.28 | 0.02 | 0.14 | |
| 1998–2015 | 0.26 | 0.21 | 0.13 | −0.05 | 0.30 * | |
| 1971–2015 | 0.27 * | 0.29 * | 0.34 * | 0.36 * | 0.30 * | |
| Tmax | 1971–1997 | −0.05 | 0.21 | 0.27 | 0.10 | 0.06 |
| 1980–1997 | 0.07 | 0.31 | 0.09 | −0.13 | 0.00 | |
| 1998–2015 | 0.15 | 0.28 | 0.08 | −0.22 | 0.21 | |
| 1971–2015 | 0.19 * | 0.21 * | 0.32 * | 0.33 * | 0.27 * | |
| Tmin | 1971–1997 | 0.32 * | 0.29 * | 0.29 | 0.34 * | 0.28 * |
| 1980–1997 | 0.41 * | 0.17 | 0.31 | 0.17 | 0.25 * | |
| 1998–2015 | 0.45 * | 0.25 | 0.22 | 0.13 | 0.29 * | |
| 1971–2015 | 0.36 * | 0.42 * | 0.40 * | 0.43 * | 0.39 * |
Noted: * indicates that the trends are significant at the 0.05 level.
© 2017 by the authors. Licensee MDPI, Basel, Switzerland. This article is an open access article distributed under the terms and conditions of the Creative Commons Attribution (CC BY) license (http://creativecommons.org/licenses/by/4.0/).
Share and Cite
MDPI and ACS Style
Liu, Z.; Yang, M.; Wan, G.; Wang, X. The Spatial and Temporal Variation of Temperature in the Qinghai-Xizang (Tibetan) Plateau during 1971–2015. Atmosphere 2017, 8, 214. https://doi.org/10.3390/atmos8110214
AMA Style
Liu Z, Yang M, Wan G, Wang X. The Spatial and Temporal Variation of Temperature in the Qinghai-Xizang (Tibetan) Plateau during 1971–2015. Atmosphere. 2017; 8(11):214. https://doi.org/10.3390/atmos8110214
Chicago/Turabian StyleLiu, Zhaochen, Meixue Yang, Guoning Wan, and Xuejia Wang. 2017. "The Spatial and Temporal Variation of Temperature in the Qinghai-Xizang (Tibetan) Plateau during 1971–2015" Atmosphere 8, no. 11: 214. https://doi.org/10.3390/atmos8110214
Note that from the first issue of 2016, this journal uses article numbers instead of page numbers. See further details here.