Onshore Wind Speed Modulates Microbial Aerosols along an Urban Waterfront
by
 , and
, and
M. Elias Dueker
1,2,* ,
,
Gregory D. O’Mullan
3,
Joaquín Martínez Martínez
4,
Andrew R. Juhl
5 and
Kathleen C. Weathers
2 1
Biology Program & Environmental and Urban Studies Program, Bard College, Campus Road, PO Box 5000, Annandale-on-Hudson, NY 12504, USA
2
Cary Institute of Ecosystem Studies, Box AB, Millbrook, NY 12545-0129, USA
3
School of Earth and Environmental Sciences, City University of New York Queens College, 65-30 Kissena Blvd., Flushing, NY 11367, USA
4
Bigelow Laboratory for Ocean Sciences, 60 Bigelow Drive, P.O. Box 380, East Boothbay, ME 04544, USA
5
Lamont Doherty Earth Observatory, Columbia University, 61 Route 9W, Palisades, NY 10964, USA
*
Author to whom correspondence should be addressed.
Atmosphere 2017, 8(11), 215; https://doi.org/10.3390/atmos8110215
Submission received: 28 August 2017
/
Revised: 17 October 2017
/
Accepted: 6 November 2017
/
Published: 9 November 2017
(This article belongs to the Special Issue Biological Particles in Atmosphere)
Abstract
:Wind blowing over aquatic and terrestrial surfaces produces aerosols, which include microbial aerosols. We studied the effect of onshore wind speeds on aerosol concentrations as well as total and culturable microbial aerosols (bacterial and viral) at an urban waterfront (New York, NY, USA). We used two distinct methods to characterize microbial aerosol responses to wind speed: A culture-based exposure-plate method measuring viable bacterial deposition near-shore (CFU accumulation rate); and a culture-independent aerosol sampler-based method measuring total bacterial and viral aerosols (cells m−3 air). While ambient coarse (>2 µm) and fine (0.3–2 µm) aerosol particle number concentrations (regulated indicators of air quality) decreased with increasing onshore wind speeds, total and depositing culturable bacterial aerosols and total viral aerosols increased. Taxonomic identification of the 16S rDNA of bacterial aerosol isolates suggested both terrestrial and aquatic sources. Wind appears to increase microbial aerosol number concentrations in the near-shore environment by onshore transport at low wind speeds (<4 m s−1), and increased local production and transport of new microbial aerosols from adjacent water surfaces at higher wind speeds (>4 m s−1). This study demonstrates a wind-modulated microbial connection between water and air in the coastal urban environment, with implications for public health management and urban microbial ecology.
1. Introduction
In coastal areas, bioaerosols are produced from water surfaces and transported by onshore winds to the near-shore environment. The role of wind speed in modulating bioaerosol production and transport has not been fully examined, particularly in coastal urban settings where dense human populations are in close proximity to waterways suffering from microbial pollution due to sewage discharges. Whereas higher winds are known to dilute fine aerosols (and other air pollutants) in urban spaces, and therefore are correlated with improved air quality [1], they are also likely to increase local production and transport of aerosols from adjacent urban aquatic environments [2]. If water quality is poor due to sewage contamination, locally-produced aerosols may contain pollution-related microbes, thereby degrading air quality and affecting human health [3,4,5,6]. Previous studies have confirmed the transfer of viable bacterial cells from polluted surface waters to air in the urban waterfront, including bacteria from genera containing known human pathogens [4,7]. The public health implications for the movement of potentially pathogenic bacteria from aquatic sources to urban air remain largely unexplored, despite the stated need to assess and model sources, production, and transport of aerosolized pathogens in the outdoor environment [8,9].
The movement of microbes and microbial products from water to air through aerosol production has been demonstrated in a wide range of aquatic environments, including a superfund-designated waterway [4], urban coastal areas [10,11,12], coastal surf and public beaches [7,13], open ocean [14,15], riverine and estuarine environments [16,17,18], and temperate lakes [19,20]. In urban settings, where surface waters are often sewage-contaminated, the delivery of surface water to air via aerosolization may represent a movement of sewage-associated bacteria [5,21,22,23,24,25,26], endotoxins [27,28], and viruses [29,30,31], into urban airspace. Despite the local connections between water quality and air quality suggested in these studies, urban bioaerosol studies have been primarily conducted in cities without extensive waterfronts [32,33,34,35,36,37] and have also focused on bacterial aerosols. Studies of viral aerosols have been conducted in sea spray aerosols [18,38,39,40] inland forest and industrial outdoor environments [30,31], but not in coastal urban environments. Nevertheless, these studies have confirmed the production of bacterial and viral aerosols from water surfaces, which is pertinent to public health management of water and air quality.
Aerosols are produced from water surfaces through the bursting of bubbles that release microscopic droplets into the air [41]. Bubbles are introduced to the water column through wind-wave interactions, wave-shore interactions, recreational water use, or any other activity that disrupts water surfaces. The delivery of viable bacterial and viral particles from water to air and land requires onshore winds. In addition, physical wind-wave interactions at wind speeds above 4 m s−1 are associated with the onset of whitecapping [42], and, therefore, the production of new aerosol particles from the water’s surface [43,44]. Some of these new particles contain microbes [39]. In coastal environments, aerosol particle number concentrations and inland transport distances increase with increasing onshore wind speeds [45], resulting in marine particles traveling further before settling out [46,47]. Previous research has demonstrated that bacterial aerosols are predominantly detected in the coarse aerosol fraction [10,48], and often are attached to larger particles [39]. These findings combined suggest that wind-facilitated production of coarse aerosols at wind speeds above 4 m s−1 will result in the increased onshore transfer of large marine particles containing aquatic microbes to the coastal atmosphere.
We measured urban waterfront bacterial and viral aerosols under the influence of a range of onshore wind speeds in New York, NY, USA. We hypothesized that the production of new microbial aerosols (bacterial and viral) from water surfaces would result in increased transfer of culturable and total microbial aerosols to the near-shore environment when winds exceeded 4 m s−1. Specifically, we expected that elevated onshore wind speeds would (1) increase the concentrations of total and culturable microbial (viral and bacterial) aerosols in the near-shore environment, and (2) result in greater taxonomic similarity between water and air bacterial communities in the near-shore environment.
2. Experiments
2.1. Sampling Sites and Meteorological Context
Sampling for this study was conducted at two New York, NY, USA coastal sites: Louis Valentino Pier (LVP) on the NY Harbor in Brooklyn, NY, USA (40.67838° N, 74.01966° W), and Flushing Bay (FB), Queens (40.761179° N, 73.846655° W) during onshore wind conditions (Figure S1). Both of these sites are highly-trafficked public parks with waterfront access. The first field campaign was conducted at LVP from 6 April to 8 June 2011, and the second field campaign was conducted at LVP and FB from 23 April to 18 June 2014 (Table S1). One-minute wind speed, wind direction, relative humidity, and temperature were collected using a Vantage Pro2 Plus Weather Station (Davis Instruments, Hayward, CA, USA). At both locations, the weather station was deployed at 1.8 m above ground level (this translated to 2–5 m above water-level, depending on tidal height). Wind speed was used to evaluate environmental controls on the transport and production of aerosol particles. Wind direction was used to assess local origin of sampled aerosols (onshore or offshore). At both LVP and FB, fetch over harbor waters, approximated using imagery from Google Earth (www.google.com/earth), ranged from 3–8+ km depending on wind direction. Relative humidity (RH) and temperature were measured as parameters known to affect aerosol particle size and thought to influence the viability of aerosolized bacteria [49,50,51].
During the first field campaign, aerosol particle concentrations were measured using a stationary Met One 9012 Ambient Aerosol Particulate Profiler (Met One Instruments, Grants Pass, OR, USA). The profiler was placed at the same height as the weather station (2.0 m from the pier decking). One-minute measurements of aerosol particle number concentrations were continuously logged in particle cut-off bins of 0.3, 0.7, 1, 2, 3, 5, 7 and 10 µm diameter (Dp), with a particle size cut-off of approximately Dp = 30 μm. This range of particle sizes covers both the fine (Dp = 0.3–2 µm) and coarse (Dp = 2–30 µm) aerosol particle modes [1]. Due to the high variability of RH at LVP during the first field campaign, and the strong dependence of aerosol particle size on RH [1], coarse and fine aerosol particle size concentrations were normalized to 80% RH according to Fitzgerald et al. [52] to allow for analyses pooled across sampling events. To assess wind speed influence on coarse aerosol number concentrations and the presence of culturable bacterial aerosols, results were binned by wind speed.
2.2. Depositing Culturable Bacterial Aerosols and Sub-Surface Water Bacteria (First Field Campaign)
The presence of depositing culturable bacterial aerosols was measured by simultaneously exposing both R2A (BD Difco, Fisher Scientific, Hampton, NH, USA) and LB (LB Miller, BD Difco, Fisher Scientific) agar media plates (each in triplicate) to ambient aerosols from a wind-rotated platform 2.0 m above the pier decking. Replicate plates were horizontally aligned, perpendicular to wind direction, and exposure times varied from 15–50 min (depending on aerosol loading and wind conditions). Each exposure event consisted of exposing a total of six media plates, and each sampling day consisted of 4–6 exposure events. Sampling during the first field campaign (at LVP) occurred on nine separate days at LVP, from early morning to mid-afternoon in each case, resulting in 42 bacterial aerosol exposure events (a total of 252 plates exposed).
It is important to note that this method does not measure total depositing bacterial aerosols, since not all bacterial aerosols are settling and not all bacterial aerosols are capable of growth on the media provided. This first field campaign was instead focused on making consistent relative measurements of depositing culturable bacterial aerosols (e.g., [46,53]) in relation to onshore wind speed. In contrast to culture-independent methods, this approach allows for confidence that the bacteria that were counted and molecularly characterized were viable, intact cells at the time of sampling. Prior publications provide strong support for the use of culture-based methods to assess environmental controls on viable bacterial aerosols [4,45,46]. Measurements were conducted using two different media types to assess and reduce bias in media selection: R2A, a relatively low-nutrient media typically used for heterotrophic bacterial plate counts; and LB, a high-nutrient media known to discourage fungal overgrowth [53]. In previous studies, both LB and R2A media have been used to grow diverse microbial assemblages from aerosols and water from freshwater and brackish environments [46,53,54].
After exposure, plates were incubated for five days in the dark at 25 °C and then colony forming units (CFU) were counted. During protocol optimization, five days was optimal in terms of balancing CFU detection with overgrowth and plate desiccation. A “CFU accumulation rate” (CFU m−2 s−1) was calculated using the surface area of the exposed petri dishes (0.0079 m2) and the duration of exposure. To assess culturable sub-surface water bacteria at the site, near-shore surface water (<1 m depth) was collected near the aerosol sampling site during each exposure. Surface water subsamples were plated, incubated and enumerated under the same conditions described for aerosol exposures. For both media types, control plates (unexposed) were regularly incubated under the same conditions to ensure that poured media was sterile. All statistical analyses were performed using R statistical software (R Development Project 2008).
2.3. Total Microbial Aerosols (Second Field Campaign)
Because culture-based methods are only able to measure bacterial cells capable of growth on the specific media used, and our method sampled only depositing bacterial aerosols, we conducted a second field campaign using culture independent methods. Samples were taken over the course of 10 days during the second field campaign (2 days at LVP, 8 days at FB). Samples were gathered using a Coriolis cyclonic air sampler (Bertin, Inc., Montigny-le-Bretonneux, France). In brief, a measured volume of air was directed by the sampler into a 15 mL solution of sterile, endotoxin-free water with 0.001% final concentration of surfactant TritonX (Dow Chemical) to reduce surface tension of collection liquid. Immediately after sampling, 6 ml of the solution were fixed for approximately 30 min at 4 °C with electron microscopy-grade glutaraldehyde (0.5% final concentration, Sigma-Aldrich, St. Louis, MO, USA) for enumeration of bacteria and viruses by flow cytometry. The fixed samples were then flash-frozen in liquid-N2 and stored at −80 °C until further analysis.
Total bacteria and viruses were measured using a BD FACScan flow cytometer (Beckton Dickinson, Franklin Lakes, NJ, USA), equipped with an air-cooled laser providing 50 mW at 488 nm with standard filter set-up, as previously described [55,56]. Briefly, samples were stained with the fluorescent nucleic acid dye SYBR® Green I (Invitrogen Co., Carlsbad, CA, USA) and viruses and bacteria were discriminated based on their side scatter and acquired green fluorescence (DNA) signals.
2.4. Bacterial Taxonomic Identification (First Field Campaign)
Bacterial colonies grown on R2A media agar plates from aerosols and sub-surface water samples collected at the LVP site were identified through sequencing of the 16S ribosomal gene. Specifically, after CFU enumeration, media plates were stored at 4 °C until colonies were individually picked and suspended in 50 μL of HyClone sterile water (ThermoScientific, Logan, UT, USA) in 96-well microplates and then boiled for 5 min to lyse the cells. This lysed-cell suspension was immediately frozen at −20 °C until PCR was performed. 16S rRNA genes were amplified from lysed-cell suspensions using TopTaq DNA Polymerase (Qiagen, Valencia, CA, USA) and universal bacterial primers 8F (5’-AGRGTTTGATCCTGGCTCAG-3’) and 1492R (5’-CGGCTACCTTGTTACGACTT-3’) [57] with 35 polymerase chain reaction (PCR) cycles of 45 s of denaturation at 94 °C, 45 s of annealing at 55 °C, and 1 min elongation at 72 °C.
Single-read sequencing using the 8F primer was performed on amplified PCR products by SeqWright Laboratories (Houston, TX, USA). Sequences were quality-checked and edited using Geneious software [58]. Edited sequences yielding less than 200 base pairs of high quality sequence were removed from further analyses. Remaining sequences (GenBank accession #’s MG270584–MG271746) were aligned using the Ribosomal Database Project (RDP) [59] and taxonomically classified using RDP’s naive Bayesian rRNA classifier at an 80% confidence level [60].
3. Results
In the first field campaign, sampling conditions covered a range of temperatures (8.5–24.5 °C), daily onshore wind speeds (0.9–7.7 m s−1) and RH (29.4–85%) (Supplemental Table S1). Onshore SW winds measured in this study were <4 m s−1 (low wind), while NW winds were >4 m s−1 (high wind); W winds were either low or high winds on different sampling dates (Supplemental Table S1). During the second field campaign, temperatures ranged from 9.1–27.8 °C, onshore wind speeds ranged from 1.5–10.8 m s−1, and RH ranged from 32.7–86.0% (Supplemental Table S1). In this second campaign, the LVP site had the lowest temperatures (9.1 °C) and the highest wind speeds (10.8 m s−1).
In the first field campaign, regardless of wind direction, the geometric mean of humidity-corrected aerosol number concentrations (binned by wind speed) decreased with wind speed (Figure 1). Relationships of aerosol number concentrations to wind speed were non-linear, and similar to those found using non-humidity-corrected concentrations. The declines of both fine (0.3–2 µm) and coarse aerosols were more marked for speeds up to 4 m s−1 (Figure 1). Although both fine and coarse particle counts declined with elevated wind speed, fine particle counts declined to a greater extent, indicating a shift in the particle size spectrum towards higher relative abundance of coarse particles with higher wind speeds.
The CFU accumulation rate (measured during the first field campaign) remained relatively low with wind speeds <4 m s−1, with a geometric mean of 0.86 ± 0.11 CFU m−2 s−1 for R2A media and 0.32 ± 0.05 CFU m−2 s−1 for LB media. At wind speeds above 4 m s−1, both LB and R2A CFU accumulation rates increased significantly above low wind speed values (p < 0.01) with a geometric mean of 1.95 ± 0.20 CFU m−2 s−1 for R2A and 0.70 ± 0.09 CFU m−2 s−1 for LB. Regression analysis of CFU accumulation rate for both types of media revealed linear relationships with increasing wind speed (Figure 2) (R2A media: R2 = 0.39, p < 0.01; LB media: R2 = 0.28, p < 0.01).
In the second field campaign, mean viral aerosol loading was 5.3 ± 1.2 × 10⁴ m−3 and mean bacterial aerosol loading was 1.6 ± 0.4 × 10⁴ m−3, yielding a virus to bacteria ratio (VBR) of 3.5 ± 0.7. Abundances of both bacterial and viral aerosols increased linearly with onshore wind speed (bacteria: R2 = 0.49, p < 0.05; viruses: R2 = 0.54, p < 0.01) (Figure 3). At wind speeds below 4 m s−1, the VBR was 1.1 ± 0.3, and at wind speeds above 4 m s−1 the VBR was significantly higher at 4.57 ± 0.8 (p < 0.01).
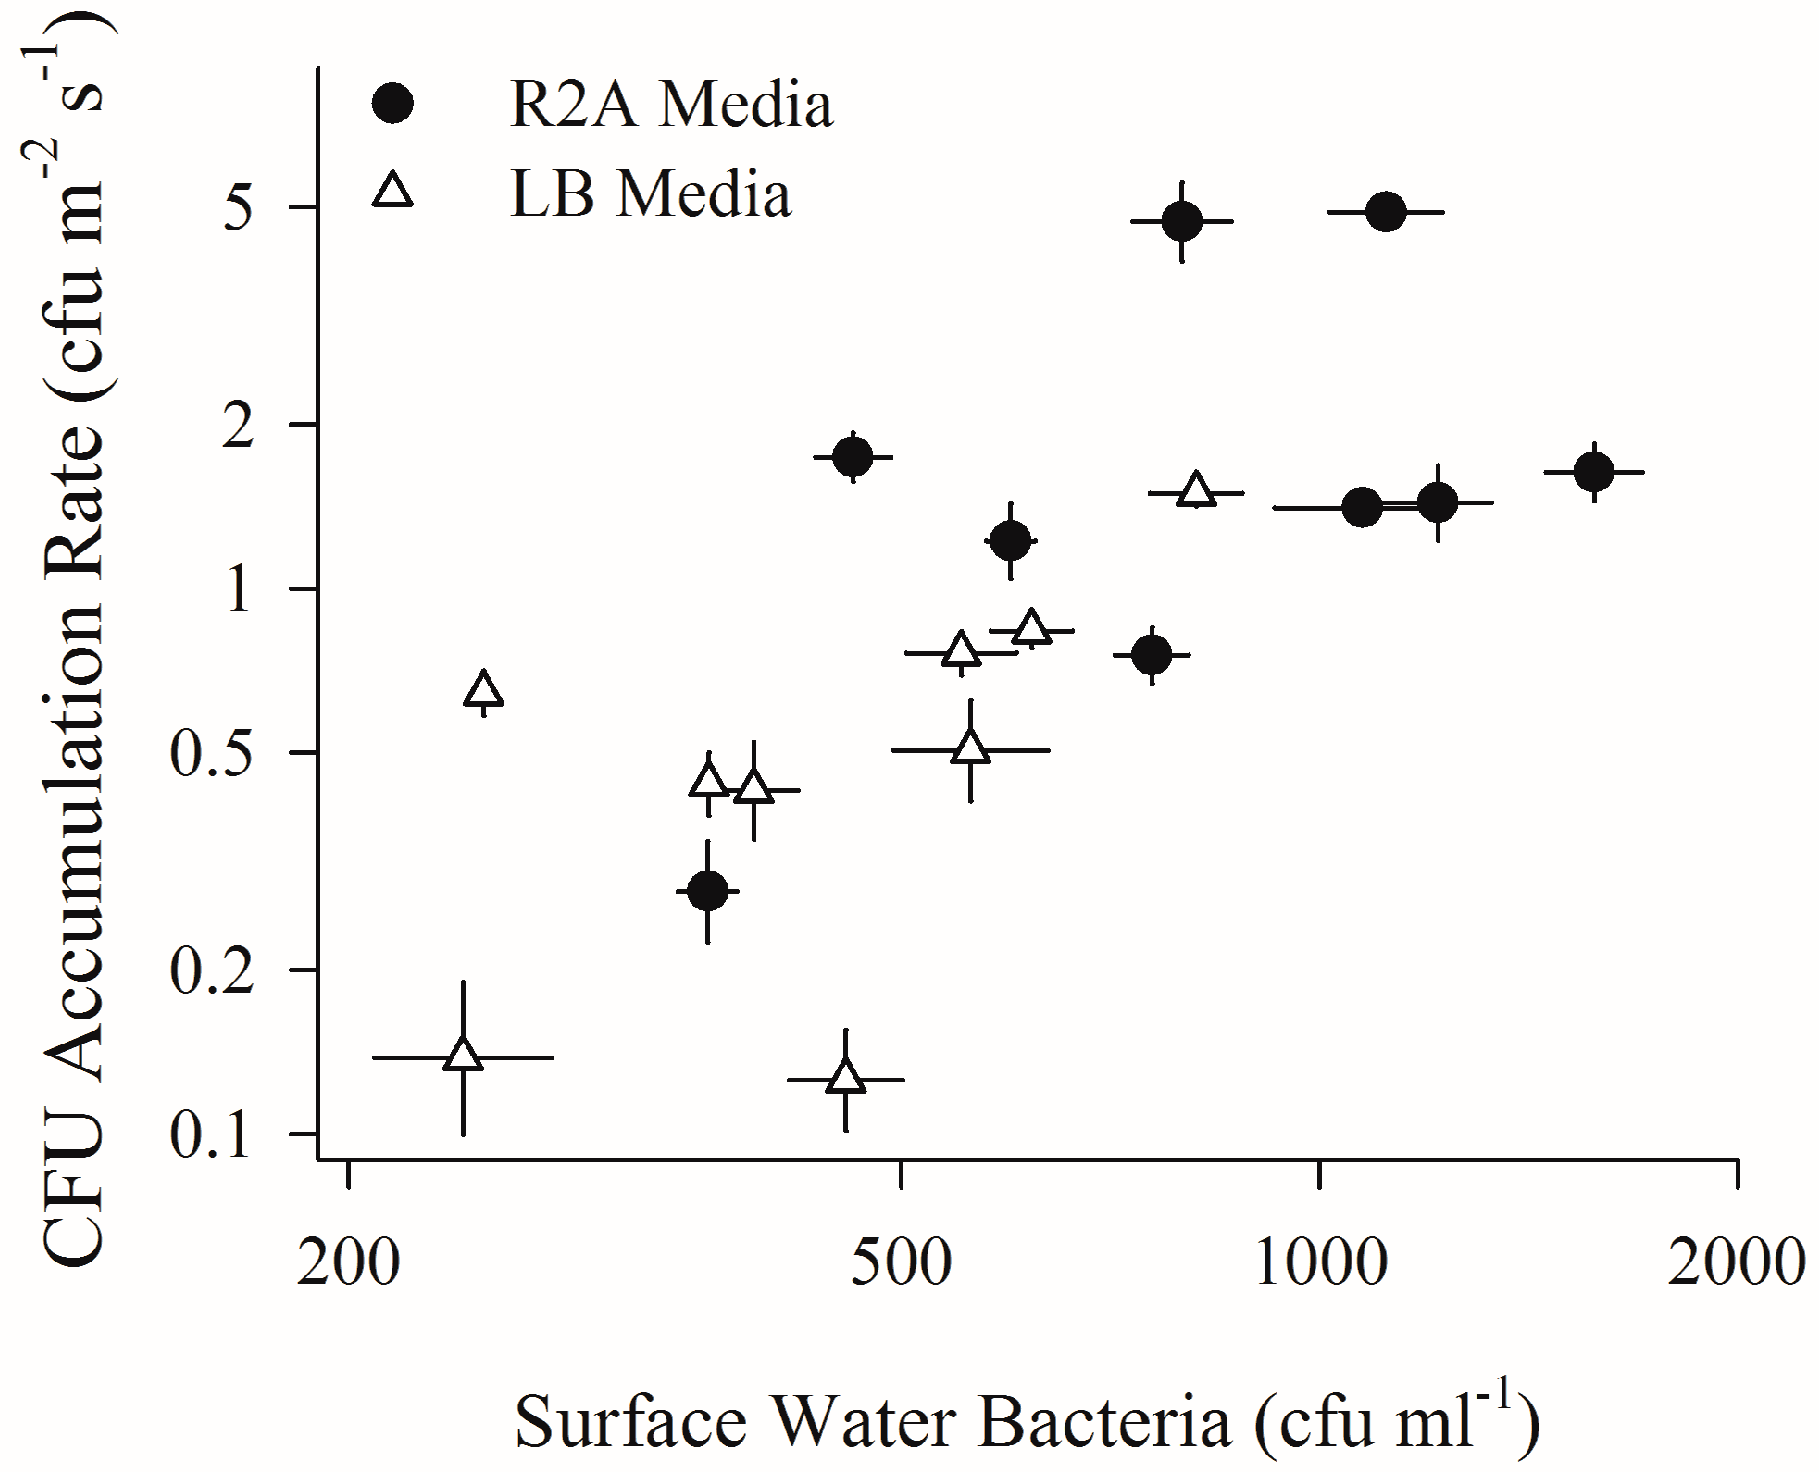
Sub-surface water spreads on R2A media yielded bacterial concentrations almost twice as high as concentrations from LB media (R2A mean: 891 CFU mL−1, LB mean: 476 CFU mL−1) (significant difference, p < 0.05). Daily CFU accumulation rates and surface water bacterial concentrations were log-linearly related, regardless of media type (R2 = 0.47, p < 0.01) (Figure 4). Near-shore culturable bacterial aerosol deposition was sensitive to hourly shifts in onshore wind speed and coarse aerosol number concentrations, as detailed on two consecutive sampling days in Supplemental Figure S2.
Sequencing of bacterial isolates on R2A plates from aerosols (615 isolates) and surface waters (548 isolates) revealed a diverse bacterial assemblage, representing bacteria from Firmicutes, Proteobacteria, Actinobacteria, Bacteroidetes, and Deinococcus-Thermus (Figure 5). 131 bacterial genera were represented, 39 of which were shared between surface water and aerosol sequence libraries, representing greater than 75% of both libraries (Table 1). At least 25 of these shared genera are known to contain potential human pathogens. There were more bacterial genera shared between water surfaces and aerosols under wind conditions above 4 m s−1 (37 shared genera) than under low-wind conditions (33 shared genera).
4. Discussion
4.1. Increased Wind Speeds Increase Total and Culturable Microbial Aerosols at the Waterfront
The relationships between coarse and fine aerosol number concentrations and wind speed in this study strongly suggest a dual role for wind in modulating aerosol concentrations at the urban waterfront: transport of existing aerosol particles and production of new aerosols. At wind speeds below 4 m s−1, onshore wind transport resulted in the inland movement of fine and coarse aerosol particles that had built up over time in the absence of winds to disperse them. These particles were then replaced at the pier by lower aerosol concentration air masses from over the harbor (Figure 1 and Figure S2). As in previous aerosol studies, we observed a shift in the trend of the relationship between onshore wind speed and aerosol number concentrations at LVP when wind speeds exceeded 4 m s−1 (Figure 1).
The role of wind in both production of new aerosols from surface waters and the transport of those aerosols to the waterfront was also evident in bacterial CFU accumulation rate patterns at the waterfront, with higher wind speeds resulting in significantly higher CFU accumulation rates. In contrast to total aerosol particle concentrations, CFU accumulation rate was low and steady for both R2A and LB media at wind speeds below 4 m s−1. Above 4 m s−1, however, CFU accumulation rates increased with increasing wind speeds for both media types (Figure 2), despite decreasing aerosol particle number concentrations, indicating either an increase in the proportion of settling particles containing bacteria or an increase in the proportion of viable bacteria (or both). However, increases in culturable bacterial aerosols with higher wind speed occurred despite significant concurrent declines in relative humidity, which is thought to negatively influence the viability of microbial aerosols [61]. The inverse relationship between CFU accumulation rate and relative humidity therefore suggests that changes in bacterial aerosol concentration were more important than bacterial viability in the wind speed/bacterial aerosol relationship.
The taxonomically diverse bacterial aerosol library sampled at this site included the same dominant phyla as previously-published, culture-based and culture-independent bacterial aerosol libraries from urban and coastal sites (e.g., [32,46,62]). Over 74% of the bacterial aerosols in this study’s library belonged to genera that were also detected in surface waters (Table 1). Mean total microbial aerosol concentrations at our study sites (5.3 × 10⁴ m−3 viruses, 1.6 × 10⁴ m−3 bacteria) were generally one or two orders of magnitude lower than those reported by Whon et al. [30] (1.0 × 10⁶–4.0 × 10⁷ m−3 viruses, 8.6 × 10⁵–1.1 × 10⁷ m−3 bacteria) and Prussin et al. [31] (5 × 10⁵–1.9 × 10⁶ m−3 viruses, 4.0 × 10⁵–1.3 × 10⁶ m−3 bacteria). This discrepancy in microbial aerosol concentrations may be due to differences in sampling and enumeration techniques, but was more likely related to the environmental setting, as terrestrial urban outdoor environments, which dominate earlier research [30,31], are expected to have higher microbial aerosol loading than marine environments [63]. In that context, it is worth noting that the VBR from our study was similar to ranges reported by Whon et al. [30] and Prussin et al. [31]. The observed increase in aerosol VBR with increased wind speed has not previously been reported, and contributes additional support for increased aquatic influence on microbial aerosols at wind speeds above 4 m s−1. In general, VBR for water-bodies (marine and fresh) can range from 3–10, with higher ratios reported in nutrient-polluted waters [64].
While correlations between total and culturable urban bacterial aerosol concentrations have been previously reported by Ravva et al. [11], our study provides the first evidence that total and culturable bacterial aerosols and total viral aerosols respond similarly to onshore wind influence in the urban coastal environment. These results, particularly the additional agreement across media types and culture-based and culture-independent measurement methods, serve as strong evidence that onshore winds above 4 m s−1 increase production and transport of microbial aerosols from the local aquatic environment.
4.2. Increased Wind Speeds Strengthen Water-Air Microbial Connection
Sources for wind-produced microbial aerosols in the urban environment could be dominated by either terrestrial or aquatic environments. The long fetches over NY Harbor and Flushing Bay waters, the positive relationship between CFU accumulation rates and surface water bacterial concentrations (Figure 4), and the similar response of both CFU accumulation rates and total microbial aerosols to wind speeds above 4 m s−1 strongly support the hypothesis that surface waters are a significant source of viable bacterial aerosols at this waterfront. This results in a close connection between water quality and air quality in the near-shore urban environment.
As found by Lighthart et al. [65] and discussed by Montero et al. [10], once a microbial aerosol is produced, a vertical downwind size fractionation should occur as larger particles settle out more quickly than smaller particles. Given the 3+ km fetch over Flushing Bay and NY Harbor waters, this should result in a decrease in urban terrestrial and background aerosol contributions in waterfront samples, and an increased representation of local aquatic bacteria.
If the local aquatic environment is microbially contaminated (e.g., through sewage discharges), aerosol production and transport by elevated onshore winds can be expected to influence the quality of air along the shoreline, with potential public health implications. Although this study did not determine the pathogenicity of cultured isolates, many of the culturable bacteria present in both air and water at this site were members of genera known to contain human pathogens, suggesting that pathogenic species could likely survive aerosolization from surface waters (Table 1). Also, the dominance of gram-negative bacteria such as Sphingomonas, Pseudomonas, Massilia, Acinetobacter and Aeromonas in both water and air suggest that aerosolized endotoxins, which are known to trigger asthmatic symptoms, may also originate from surface waters [66,67]. The viral particles detected in this study may also pose a public health threat, given their higher concentrations relative to bacteria and known ability to travel long distances, intact and infection-ready, in marine systems [29].
The water-air microbial connection along the urban waterfront may be an issue worthy of consideration even at lower wind speeds. Indeed, the LB CFU accumulation rate under low wind conditions (0.32 CFU m−2 s−1) at this site was five times higher than previously-published CFU accumulation rates at a non-urban coastal site (0.06 CFU m−2 s−1) [45] using the same methodology. This suggests that, regardless of wind speed, other aerosol-producing activities (boat traffic, recreational use of waters, wave-shore interactions) in urban environments result in a steady emission of surface water bacteria and viruses to urban waterfronts.
5. Conclusions
This study established a relationship between onshore wind speed and total and culturable microbial aerosols at an urban waterfront. Wind production of aerosols from water surfaces at wind speeds above 4 m s−1 resulted in increased water-air transfer of culturable and total aquatic bacterial and viral particles. Therefore, wind appears to have a dual role in the modulation of microbial aerosols at the urban waterfront: transport at all wind speeds, and local production and transport of new microbial aerosols from adjacent water surfaces at high wind speeds. The role of wind in strengthening microbial air and water connections at the urban waterfront needs to be considered in terms of air quality in urban areas. In contrast to commonly reported patterns of change in air quality with increasing wind, while winds do serve to dilute some forms of air pollution, this study shows that wind may simultaneously increase locally-aerosolized bacterial and viral pollution, of particular concern when surface waters contain sewage contamination. This wind-facilitated microbial connection between water and air quality merits further study given the frequent incidence of degraded water quality in densely-populated urban centers.
Supplementary Materials
The following are available online at www.mdpi.com/2073-4433/8/11/215/s1. Table S1: Meteorological conditions during Field Campaigns 1 and 2. Figure S1: Hourly relationship between meteorological parameters and bacterial aerosols; Figure S2: Hourly interaction of wind speed with coarse aerosols and CFU accumulation rate.
Acknowledgments
For research support in the field and the lab, we thank Angel Montero, Roman Reichert, Lizzy Winig, Ilana Berger, Brian Brigham, Gwenden Dueker, Amanda Lindsey, John Lipscomb, Maria Uriarte, and Suzanne Young. Funding was provided by the Eppley Foundation, the Hudson River Foundation, and the Brinson Foundation.
Author Contributions
For research articles with several authors, a short paragraph specifying their individual contributions must be provided. The following statements should be used “A.R.J., G.D.O., M.E.D., K.C.W. conceived and designed the experiments; M.E.D., G.D.O., J.M.M. performed the experiments; M.E.D., J.M.M., G.D.O., K.C.W. analyzed the data; A.R.J., M.E.D., G.D.O., J.M.M. contributed reagents/materials/analysis tools; M.E.D. wrote the paper.” Authorship must be limited to those who have contributed substantially to the work reported.
Conflicts of Interest
The authors declare no conflict of interest.
References
- Seinfeld, J.H.; Pandis, S.N. Atmospheric Chemistry and Physics: From Air Pollution to Climate Change, 2nd ed.; Wiley: Hoboken, NJ, USA, 2006. [Google Scholar]
- Keene, W.C.; Maring, H.; Maben, J.R.; Kieber, D.J.; Pszenny, A.A.P.; Dahl, E.E.; Izaguirre, M.A.; Davis, A.J.; Long, M.S.; Zhou, X.L.; et al. Chemical and physical characteristics of nascent aerosols produced by bursting bubbles at a model air-sea interface. J. Geophys. Res. Atmos. 2007, 112. [Google Scholar] [CrossRef]
- Dueker, M.E.; O’Mullan, G.D. Aeration remediation of a polluted waterway increases near-surface coarse and culturable microbial aerosols. Sci. Total Environ. 2014, 184–189. [Google Scholar] [CrossRef] [PubMed]
- Dueker, M.E.; O’Mullan, G.D.; Juhl, A.R.; Weathers, K.C.; Uriarte, M. Local environmental pollution strongly influences culturable bacterial aerosols at an urban aquatic superfund site. Environ. Sci. Technol. 2012, 46, 10926–10932. [Google Scholar] [CrossRef] [PubMed]
- O’Mullan, G.D.; Dueker, M.E.; Juhl, A.R. Challenges to managing microbial fecal pollution in coastal environments: Extra-enteric ecology and microbial exchange among water, sediment, and air. Curr. Pollut. Rep. 2017, 3, 1–16. [Google Scholar] [CrossRef]
- Pope, C.A. Epidemiology of fine particulate air pollution and human health: Biologic mechanisms and who’s at risk? Environ. Health Persp. 2000, 108, 713–723. [Google Scholar] [CrossRef]
- Marks, R.; Kruczalak, K.; Jankowska, K.; Michalska, M. Bacteria and fungi in air over the gulf of gdansk and baltic sea. J. Aerosol Sci. 2001, 32, 237–250. [Google Scholar] [CrossRef]
- Lai, K.M.; Emberlin, J.; Colbeck, I. Outdoor environments and human pathogens in air. Environ. Health 2009, 8. [Google Scholar] [CrossRef] [PubMed]
- Woo, A.C.; Brar, M.S.; Chan, Y.; Lau, M.C.Y.; Leung, F.C.C.; Scott, J.A.; Vrijmoed, L.L.P.; Zawar-Reza, P.; Pointing, S.B. Temporal variation in airborne microbial populations and microbially derived allergens in a tropical urban landscape. Atmos. Environ. 2013, 74, 291–300. [Google Scholar] [CrossRef]
- Montero, A.; Dueker, M.E.; O’Mullan, G.D. Culturable bioaerosols along an urban waterfront are primarily associated with coarse particles. PeerJ 2016, 4, e2827. [Google Scholar] [CrossRef] [PubMed]
- Ravva, S.V.; Hernlem, B.J.; Sarreal, C.Z.; Mandrell, R.E. Bacterial communities in urban aerosols collected with wetted-wall cyclonic samplers and seasonal fluctuations of live and culturable airborne bacteria. J. Environ. Monit. 2012, 14, 473–481. [Google Scholar] [CrossRef] [PubMed]
- Polymenakou, P.N.; Mandalakis, M.; Stephanou, E.G.; Tselepides, A. Particle size distribution of airborne microorganisms and pathogens during an intense african dust event in the eastern mediterranean. Environ. Health Persp. 2008, 116, 292–296. [Google Scholar] [CrossRef] [PubMed]
- Corbett, S.; Rubin, G.; Curry, G.; Kleinbaum, D. The health effects of swimming at sydney beaches. Am. J. Public Health 1993, 83, 1701–1706. [Google Scholar] [CrossRef] [PubMed]
- Li, M.; Yu, X.; Kang, H.; Xie, Z.; Zhang, P. Concentrations and size distributions of bacteria-containing particles over oceans from China to the arctic ocean. Atmosphere 2007, 8, 82. [Google Scholar] [CrossRef]
- Cho, B.C.; Hwang, C.Y. Prokaryotic abundance and 16s rRNA gene sequences detected in marine aerosols on the east sea (korea). FEMS Microbiol. Ecol. 2011, 76, 327–341. [Google Scholar] [CrossRef] [PubMed]
- Motta, O.; Capunzo, M.; De Caro, F.; Brunetti, L.; Santoro, E.; Farina, A.; Proto, A. New approach for evaluating the public health risk of living near a polluted river. J. Prev. Med. Hyg. 2008, 49, 79–88. [Google Scholar] [PubMed]
- Pickup, R.W.; Rhodes, G.; Arnott, S.; Sidi-Boumedine, K.; Bull, T.J.; Weightman, A.; Hurley, M.; Hermon-Taylor, J. Mycobacterium avium subsp paratuberculosis in the catchment area and water of the river taff in South Wales, United Kingdom, and its potential relationship to clustering of crohn′s disease cases in the city of Cardiff. Appl. Environ. Microb. 2005, 71, 2130–2139. [Google Scholar] [CrossRef] [PubMed]
- Aller, J.Y.; Kuznetsova, M.R.; Jahns, C.J.; Kemp, P.F. The sea surface microlayer as a source of viral and bacterial enrichment in marine aerosols. J. Aerosol Sci. 2005, 36, 801–812. [Google Scholar] [CrossRef]
- Caller, T.A.; Doolin, J.W.; Haney, J.F.; Murby, A.J.; West, K.G.; Farrar, H.E.; Ball, A.; Harris, B.T.; Stommel, E.W. A cluster of amyotrophic lateral sclerosis in new hampshire: A possible role for toxic cyanobacteria blooms. Amyotroph. Lateral Scler. 2009, 10. [Google Scholar] [CrossRef] [PubMed]
- Bradley, W.G.; Borenstein, A.R.; Nelson, L.M.; Codd, G.A.; Rosen, B.H.; Stommel, E.W.; Cox, P.A. Is exposure to cyanobacteria an environmental risk factor for amyotrophic lateral sclerosis and other neurodegenerative diseases? Amyotroph. Lateral Scler. Frontotemporal Degener. 2013, 14, 325–333. [Google Scholar] [CrossRef] [PubMed]
- Young, S.; Juhl, A.R.; O’Mullan, G.D. Antibiotic resistant bacteria in the hudson river estuary linked to wet weather sewage contamination. J. Water Health 2013, 11, 297–310. [Google Scholar] [CrossRef] [PubMed]
- Brandi, G.; Sisti, M.; Amagliani, G. Evaluation of the environmental impact of microbial aerosols generated by wastewater treatment plants utilizing different aeration systems. J. Appl. Microbiol. 2000, 88, 845–852. [Google Scholar] [CrossRef] [PubMed]
- Carducci, A.; Tozzi, E.; Rubulotta, E.; Casini, B.; Cantiani, L.; Rovini, E.; Muscillo, M.; Pacini, R. Assessing airborne biological hazard from urban wastewater treatment. Water Res. 2000, 34, 1173–1178. [Google Scholar] [CrossRef]
- Haas, D.; Unteregger, M.; Habib, J.; Galler, H.; Marth, E.; Reinthaler, F.F. Exposure to bioaerosol from sewage systems. Water Air Soil Pollut. 2010, 207, 49–56. [Google Scholar] [CrossRef]
- Heinonen-Tanski, H.; Reponen, T.; Koivunen, J. Airborne enteric coliphages and bacteria in sewage treatment plants. Water Res. 2009, 43, 2558–2566. [Google Scholar] [CrossRef] [PubMed]
- Stewart, J.R.; Gast, R.J.; Fujioka, R.S.; Solo-Gabriele, H.M.; Meschke, J.S.; Amaral-Zettler, L.A.; del Castillo, E.; Polz, M.F.; Collier, T.K.; Strom, M.S.; et al. The coastal environment and human health: Microbial indicators, pathogens, sentinels and reservoirs. Environ. Health 2008, 7, 14. [Google Scholar] [CrossRef] [PubMed] [Green Version]
- Nilsson, S.; Merritt, A.S.; Bellander, T. Endotoxins in urban air in Stockholm, Sweden. Atmos. Environ. 2011, 45, 266–270. [Google Scholar] [CrossRef]
- Gangamma, S.; Patil, R.S.; Mukherji, S. Characterization and proinflammatory response of airborne biological particles from wastewater treatment plants. Environ. Sci. Technol. 2011, 45, 3282–3287. [Google Scholar] [CrossRef] [PubMed]
- Sharoni, S.; Trainic, M.; Schatz, D.; Lehahn, Y.; Flores, M.J.; Bidle, K.D.; Ben-Dor, S.; Rudich, Y.; Koren, I.; Vardi, A. Infection of phytoplankton by aerosolized marine viruses. Proc. Natl. Acad. Sci. USA 2015, 112, 6643–6647. [Google Scholar] [CrossRef] [PubMed]
- Whon, T.W.; Kim, M.S.; Roh, S.W.; Shin, N.R.; Lee, H.W.; Bae, J.W. Metagenomic characterization of airborne viral DNA diversity in the near-surface atmosphere. J. Virol. 2012, 86, 8221–8231. [Google Scholar] [CrossRef] [PubMed]
- Prussin, A.J.; Garcia, E.B.; Marr, L.C. Total concentrations of virus and bacteria in indoor and outdoor air. Environ. Sci. Technol. Lett. 2015, 2, 84–88. [Google Scholar] [CrossRef] [PubMed]
- Brodie, E.L.; DeSantis, T.Z.; Parker, J.P.M.; Zubietta, I.X.; Piceno, Y.M.; Andersen, G.L. Urban aerosols harbor diverse and dynamic bacterial populations. Proc. Natl. Acad. Sci. USA 2007, 104, 299–304. [Google Scholar] [CrossRef] [PubMed]
- Bowers, R.M.; Sullivan, A.P.; Costello, E.K.; Collett, J.L.; Knight, R.; Fierer, N. Sources of bacteria in outdoor air across cities in the midwestern united states. Appl. Environ. Microb. 2011, 77, 6350–6356. [Google Scholar] [CrossRef] [PubMed]
- Bowers, R.M.; Clements, N.; Emerson, J.B.; Wiedinmyer, C.; Hannigan, M.P.; Fierer, N. Seasonal variability in bacterial and fungal diversity of the near-surface atmosphere. Environ. Sci. Technol. 2013, 47, 12097–12106. [Google Scholar] [CrossRef] [PubMed]
- Despres, V.R.; Nowoisky, J.F.; Klose, M.; Conrad, R.; Andreae, M.O.; Poschl, U. Characterization of primary biogenic aerosol particles in urban, rural, and high-alpine air by DNA sequence and restriction fragment analysis of ribosomal rna genes. Biogeosciences 2007, 4, 1127–1141. [Google Scholar] [CrossRef]
- Fang, Z.G.; Ouyang, Z.Y.; Zheng, H.; Wang, X.K.; Hu, L.F. Culturable airborne bacteria in outdoor environments in beijing, china. Microb. Ecol. 2007, 54, 487–496. [Google Scholar] [CrossRef] [PubMed]
- Cao, C.; Jiang, W.; Wang, B.; Fang, J.; Lang, J.; Tian, G.; Jiang, J.; Zhu, T. Inhalable microorganisms in Beijing’s PM2.5 and PM10 pollutants during a severe smog event. Environ. Sci. Technol. 2014, 48, 1499–1507. [Google Scholar] [PubMed]
- Lee, C.; Sultana, C.M.; Collins, D.B.; Santander, M.V.; Axson, J.L.; Malfatti, F.; Cornwell, G.C.; Grandquist, J.R.; Deane, G.B.; Stokes, M.D.; et al. Advancing model systems for fundamental laboratory studies of sea spray aerosol using the microbial loop. J. Phys. Chem. A 2015, 119, 8860–8870. [Google Scholar] [CrossRef] [PubMed]
- Patterson, J.P.; Collins, D.B.; Michaud, J.M.; Axson, J.L.; Sultana, C.M.; Moser, T.; Dommer, A.C.; Conner, J.; Grassian, V.H.; Stokes, M.D.; et al. Sea spray aerosol structure and composition using cryogenic transmission electron microscopy. ACS Cent. Sci. 2016, 2, 40–47. [Google Scholar] [CrossRef] [PubMed]
- Blanchard, D.C. The ejection of drops from the sea and their enrichment with bacteria and other materials: A review. Estuaries 1989, 12, 127–137. [Google Scholar] [CrossRef]
- Blanchard, D.C.; Syzdek, L. Bubbles and water-to air transfer of bacteria. Bull. Am. Meteorol. Soc. 1971, 52, 1136–1141. [Google Scholar]
- Monahan, E.C.; Fairall, C.W.; Davidson, K.L.; Boyle, P.J. Observed interrelations between 10 m winds, ocean whitecaps and marine aerosols. Q. J. R. Meteorol. Soc. 1983, 109, 379–392. [Google Scholar] [CrossRef]
- Hultin, K.A.H.; Krejci, R.; Pinhassi, J.; Gomez-Consarnau, L.; Martensson, E.M.; Hagstrom, A.; Nilsson, E.D. Aerosol and bacterial emissions from baltic seawater. Atmos. Res. 2011, 99, 1–14. [Google Scholar] [CrossRef]
- Vignati, E.; de Leeuw, G.; Schulz, M.; Plate, E. Characterization of aerosols at a coastal site near vindeby (Denmark). J. Geophys. Res. Oceans 1999, 104, 3277–3287. [Google Scholar] [CrossRef]
- Dueker, M.E.; Weathers, K.C.; O’Mullan, G.D.; Juhl, A.R.; Uriarte, M. Environmental controls on coastal coarse aerosols: Implications for microbial content and deposition in the near-shore environment. Environ. Sci. Technol. 2011, 45, 3386–3392. [Google Scholar] [CrossRef] [PubMed]
- Dueker, M.E.; O’Mullan, G.D.; Weathers, K.C.; Juhl, A.R.; Uriarte, M. Coupling of fog and marine microbial content in the near-shore coastal environment. Biogeosciences 2012, 9, 803–813. [Google Scholar] [CrossRef] [Green Version]
- De Leeuw, G.; Neele, F.P.; Hill, M.; Smith, M.H.; Vignati, E. Production of sea spray aerosol in the surf zone. J. Geophys. Res. Atmos. 2000, 105, 29397–29409. [Google Scholar] [CrossRef]
- Jayarathne, T.; Sultana, C.M.; Lee, C.; Malfatti, F.; Cox, J.L.; Pendergraft, M.A.; Moore, K.A.; Azam, F.; Tivanski, A.V.; Cappa, C.D.; et al. Enrichment of saccharides and divalent cations in sea spray aerosol during two phytoplankton blooms. Environ. Sci. Technol. 2016, 50, 11511–11520. [Google Scholar] [CrossRef] [PubMed]
- Hatch, M.T.; Dimmick, R.L. Physiological responses of airborne bacteria to shifts in relative humidity. Bacteriol. Rev. 1966, 30, 597–602. [Google Scholar] [PubMed]
- Burrows, S.M.; Elbert, W.; Lawrence, M.G.; Poschl, U. Bacteria in the global atmosphere—Part 1: Review and synthesis of literature data for different ecosystems. Atmos. Chem. Phys. 2009, 9, 9263–9280. [Google Scholar] [CrossRef]
- Lighthart, B.; Shaffer, B.T. Increased airborne bacterial survival as a function of particle content and size. Aerosol Sci. Technol. 1997, 27, 439–446. [Google Scholar] [CrossRef]
- Fitzgerald, J.W. Approximation formulas for equilibrium size of an aerosol particle as a function of its dry size and composition and ambient relative humidity. J. Appl. Meteorol. 1975, 14, 1044–1049. [Google Scholar] [CrossRef]
- Shaffer, B.T.; Lighthart, B. Survey of culturable airborne bacteria at four diverse locations in oregon: Urban, rural, forest, and coastal. Microb. Ecol. 1997, 34, 167–177. [Google Scholar] [CrossRef] [PubMed]
- Lighthart, B.; Shaffer, B.T. Viable bacterial aerosol particle size distributions in the midsummer atmosphere at an isolated location in the high desert chaparral. Aerobiologia 1995, 11, 19–25. [Google Scholar] [CrossRef]
- Marie, D.; Brussaard, C.P.D.; Thyrhaug, R.; Bratbak, G.; Vaulot, D. Enumeration of marine viruses in culture and natural samples by flow cytometry. Appl. Environ. Microbiol. 1999, 65, 45–52. [Google Scholar] [PubMed]
- Brussaard, C.P.D. Optimization of procedures for counting viruses by flow cytometry. Appl. Environ. Microbiol. 2004, 70, 1506–1513. [Google Scholar] [CrossRef] [PubMed]
- Teske, A.; Hinrichs, K.U.; Edgcomb, V.; Gomez, A.D.; Kysela, D.; Sylva, S.P.; Sogin, M.L.; Jannasch, H.W. Microbial diversity of hydrothermal sediments in the guaymas basin: Evidence for anaerobic methanotrophic communities. Appl. Environ. Microb. 2002, 68, 1994–2007. [Google Scholar] [CrossRef]
- Drummond, A.; Ashton, B.; Buxton, S.; Cheung, M.; Cooper, A.; Heled, J.; Kearse, M.; Moir, R.; Stones-Havas, S.; Sturrock, S.; et al. Geneious, version 5.1; Available online: http://www.geneious.com (accessed on 8 November 2017).
- Cole, J.R.; Wang, Q.; Cardenas, E.; Fish, J.; Chai, B.; Farris, R.J.; Kulam-Syed-Mohideen, A.S.; McGarrell, D.M.; Marsh, T.; Garrity, G.M.; et al. The ribosomal database project: Improved alignments and new tools for rRNA analysis. Nucleic Acids Res. 2009, 37, 141–145. [Google Scholar] [CrossRef] [PubMed]
- Wang, Q.; Garrity, G.M.; Tiedje, J.M.; Cole, J.R. Naive bayesian classifier for rapid assignment of rRNA sequences into the new bacterial taxonomy. Appl. Environ. Microb. 2007, 73, 5261–5267. [Google Scholar] [CrossRef] [PubMed]
- Griffiths, W.D.; Decosemo, G.A.L. The assessment of bioaerosols—A Critical Review. J. Aerosol Sci. 1994, 25, 1425–1458. [Google Scholar] [CrossRef]
- Fahlgren, C.; Hagstrom, A.; Nilsson, D.; Zweifel, U.L. Annual Variations in the Diversity, Viability, and Origin of Airborne Bacteria. Appl. Environ. Microb. 2010, 76, 3015–3025. [Google Scholar] [CrossRef] [PubMed]
- Jones, A.M.; Harrison, R.M. The effects of meteorological factors on atmospheric bioaerosol concentrations—A review. Sci. Total Environ. 2004, 326, 151–180. [Google Scholar] [CrossRef] [PubMed]
- Wommack, K.E.; Colwell, R.R. Virioplankton: Viruses in Aquatic Ecosystems. Microbiol. Mol. Biol. Rev. 2000, 64, 69–114. [Google Scholar] [CrossRef] [PubMed]
- Lighthart, B.; Shaffer, B.T.; Marthi, B.; Ganio, L. Trajectory of Aerosol Droplets from a Sprayed Bacterial Suspension. Appl. Environ. Microb. 1991, 57, 1006–1012. [Google Scholar]
- Holgate, S.T. Innate and adaptive immune responses in asthma. Nat. Med. 2012, 18, 673–683. [Google Scholar] [CrossRef] [PubMed]
- Meyer, E.H.; Goya, S.; Akbari, O.; Berry, G.J.; Savage, P.B.; Kronenberg, M.; Nakayama, T.; DeKruyff, R.H.; Umetsu, D.T. Glycolipid activation of invariant T cell receptor(+) NK T cells is sufficient to induce airway hyperreactivity independent of conventional CD4(+) T cells. Proc. Natl. Acad. Sci. USA 2006, 103, 2782–2787. [Google Scholar] [CrossRef] [PubMed]
Figure 1.
The effect of onshore wind speed on fine (0.3–2 µm) and coarse aerosol number concentrations. Geometric mean of humidity-corrected, wind speed-binned fine (A) and coarse (B) aerosol number concentrations (m−3) plotted against wind speed (m s−1) at Louis Valentino Pier, Brooklyn, NY, USA. Vertical bars indicate standard error (if not visible, the standard error is smaller than the plot point character). Because the standard error is calculated from a geometric mean, error bars may be uneven. For reference, a dashed line highlights 4 m s−1 wind speed.
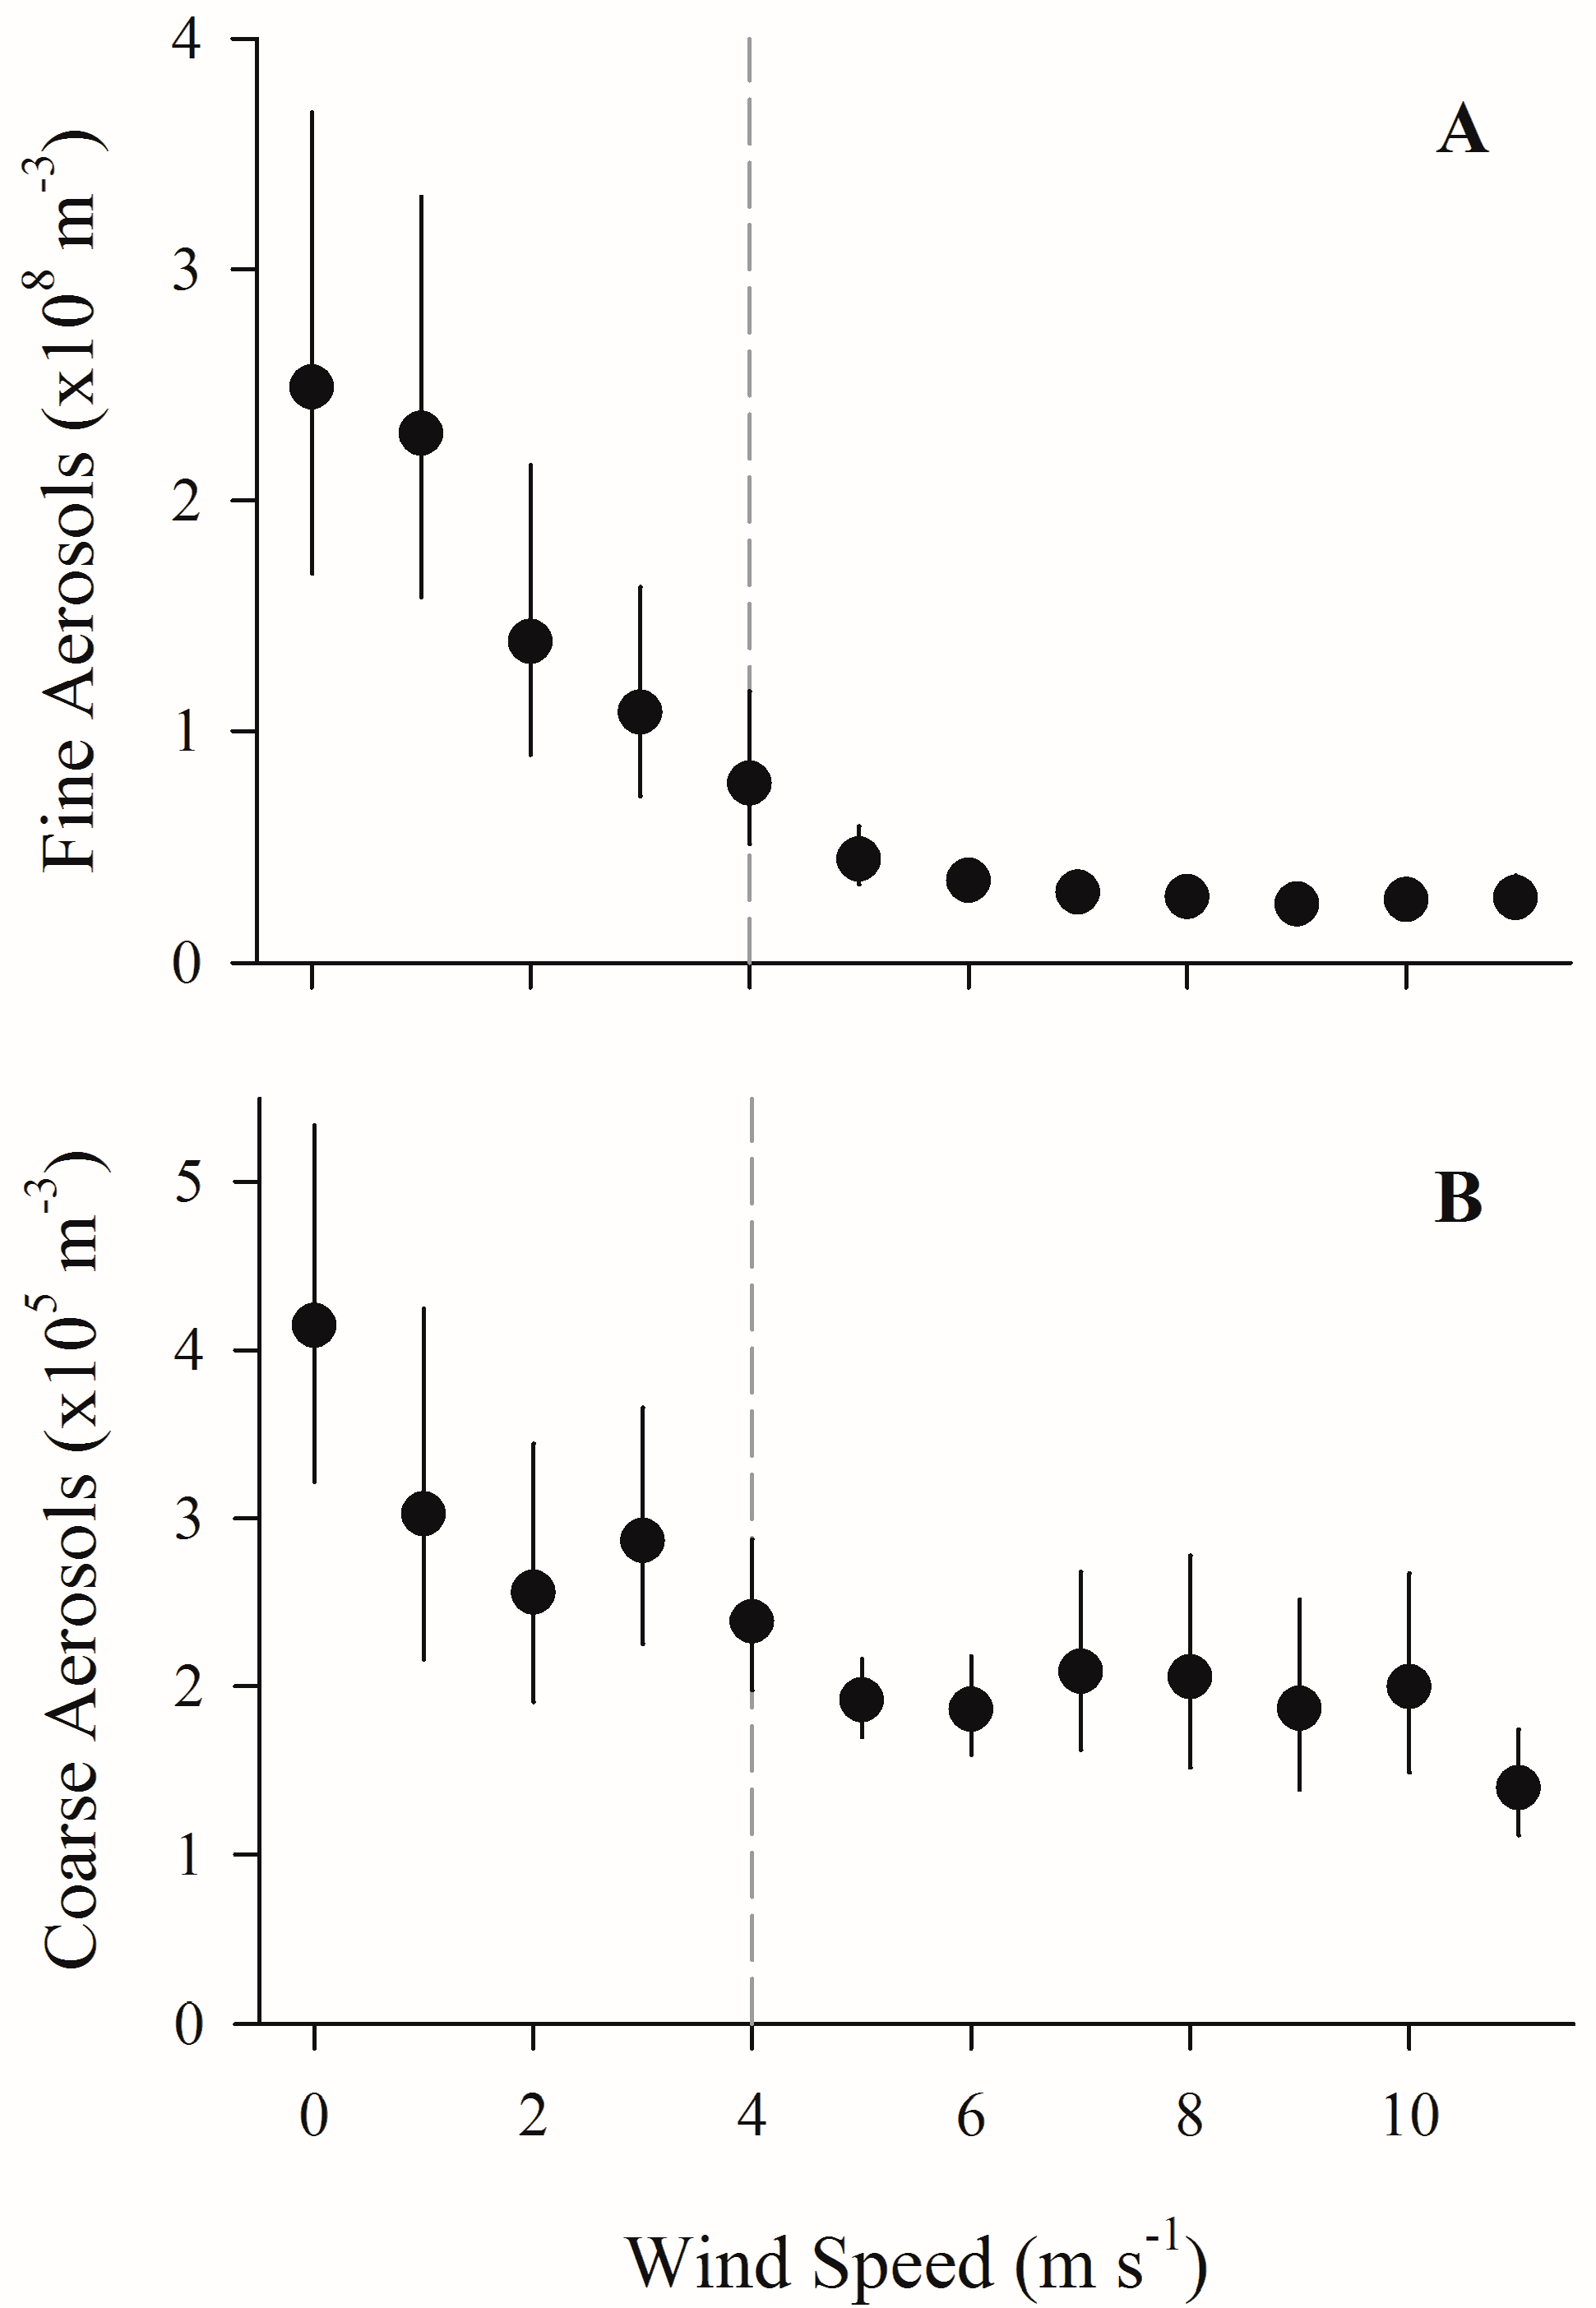
Figure 2.
The effect of onshore wind speed on the CFU (colony forming units) accumulation rate of bacterial aerosols. Geometric mean of CFU accumulation rate (CFU m−2 s−1) for each exposure event binned by wind speed and then plotted against wind speed (m s−1) for (A) R2A and (B) LB media. Vertical bars indicate standard error (if not visible, the standard error is smaller than the plot point character). Because the standard error is calculated from a geometric mean, error bars may be uneven. For reference, a dashed line highlights 4 m s−1 wind speed.
Figure 3.
Relationship between total microbial aerosols and wind speed. Total viral (A) and bacterial (B) aerosols per m3 air, plotted against onshore wind speed (m s−1). For reference, a dashed line highlights 4 m s−1 wind speed.
Figure 3.
Relationship between total microbial aerosols and wind speed. Total viral (A) and bacterial (B) aerosols per m3 air, plotted against onshore wind speed (m s−1). For reference, a dashed line highlights 4 m s−1 wind speed.

Figure 4.
Relationship between bacterial concentrations in sub-surface waters and aerosols. CFU accumulation rate (CFU m−2 s−1) vs. culturable surface water bacteria concentrations (CFU mL−1). Please note that both axes are on a log scale. Horizontal and vertical bars indicate standard error of replicate plates (if not visible, the standard error is smaller than the plot point character).

Figure 5.
Phylum-level comparison of aerosol and water surface bacterial isolates. Taxonomic analysis based on Sanger sequencing of the 16S rRNA of 1163 bacterial isolates from water and air. These isolates were sampled during the first field campaign using R2A media.
Figure 5.
Phylum-level comparison of aerosol and water surface bacterial isolates. Taxonomic analysis based on Sanger sequencing of the 16S rRNA of 1163 bacterial isolates from water and air. These isolates were sampled during the first field campaign using R2A media.

Table 1.
Bacterial genera shared between aerosol and surface water olate libraries collected in first field campaign. # Seq = number of sequences in genera; % Lib = percentage of library (Aerosol/Surface Water) these sequences represent.
Table 1.
Bacterial genera shared between aerosol and surface water olate libraries collected in first field campaign. # Seq = number of sequences in genera; % Lib = percentage of library (Aerosol/Surface Water) these sequences represent.
| Aerosols (n = 615) | Sub-Surface Water (n = 548) | |||
|---|---|---|---|---|
| # Seq | % Lib | # Seq | % Lib | |
| Acinetobacter * | 6 | 1.0% | 57 | 10.4% |
| Aeromonas * | 1 | 0.2% | 14 | 2.6% |
| Agrococcus | 14 | 2.3% | 1 | 0.2% |
| Arthrobacter * | 40 | 6.5% | 5 | 0.9% |
| Bacillus * | 110 | 17.9% | 33 | 6.0% |
| Bosea * | 2 | 0.3% | 1 | 0.2% |
| Brevundimonas * | 11 | 1.8% | 15 | 2.7% |
| Chryseobacterium * | 7 | 1.1% | 6 | 1.1% |
| Curtobacterium | 6 | 1.0% | 1 | 0.2% |
| Flavobacterium * | 2 | 0.3% | 70 | 12.8% |
| Janthinobacterium | 2 | 0.3% | 3 | 0.5% |
| Kocuria * | 18 | 2.9% | 1 | 0.2% |
| Lysinibacillus * | 2 | 0.3% | 3 | 0.5% |
| Massilia * | 13 | 2.1% | 1 | 0.2% |
| Methylobacterium * | 8 | 1.3% | 4 | 0.7% |
| Microbacterium * | 36 | 5.9% | 13 | 2.4% |
| Nocardioides | 3 | 0.5% | 1 | 0.2% |
| Novosphingobium * | 2 | 0.3% | 16 | 2.9% |
| Ochrobactrum * | 2 | 0.3% | 1 | 0.2% |
| Oxalicibacterium | 2 | 0.3% | 1 | 0.2% |
| Paenibacillus * | 5 | 0.8% | 5 | 0.9% |
| Paracoccus * | 5 | 0.8% | 3 | 0.5% |
| Pedobacter | 4 | 0.7% | 4 | 0.7% |
| Plantibacter | 1 | 0.2% | 1 | 0.2% |
| Pseudomonas * | 18 | 2.9% | 47 | 8.6% |
| Pseudoxanthomonas | 4 | 0.7% | 1 | 0.2% |
| Psychrobacter * | 5 | 0.8% | 1 | 0.2% |
| Ralstonia | 1 | 0.2% | 35 | 6.4% |
| Rhodococcus * | 19 | 3.1% | 5 | 0.9% |
| Roseomonas * | 4 | 0.7% | 2 | 0.4% |
| Sanguibacter | 3 | 0.5% | 1 | 0.2% |
| Sphingobium * | 2 | 0.3% | 4 | 0.7% |
| Sphingomonas * | 43 | 7.0% | 55 | 10.0% |
| Sphingopyxis * | 2 | 0.3% | 13 | 2.4% |
| Streptomyces * | 6 | 1.0% | 1 | 0.2% |
| Unclassified Comamonadaceae | 4 | 0.7% | 1 | 0.2% |
| Unclassified Microbacteriaceae | 15 | 2.4% | 1 | 0.2% |
| Unclassified Oxalobacteraceae | 10 | 1.6% | 1 | 0.2% |
| Variovorax | 20 | 3.3% | 2 | 0.4% |
| Total Shared | 74.5% | 78.5% | ||
* = genus known to include human pathogens.
© 2017 by the authors. Licensee MDPI, Basel, Switzerland. This article is an open access article distributed under the terms and conditions of the Creative Commons Attribution (CC BY) license (http://creativecommons.org/licenses/by/4.0/).
Share and Cite
MDPI and ACS Style
Dueker, M.E.; O’Mullan, G.D.; Martínez, J.M.; Juhl, A.R.; Weathers, K.C. Onshore Wind Speed Modulates Microbial Aerosols along an Urban Waterfront. Atmosphere 2017, 8, 215. https://doi.org/10.3390/atmos8110215
AMA Style
Dueker ME, O’Mullan GD, Martínez JM, Juhl AR, Weathers KC. Onshore Wind Speed Modulates Microbial Aerosols along an Urban Waterfront. Atmosphere. 2017; 8(11):215. https://doi.org/10.3390/atmos8110215
Chicago/Turabian StyleDueker, M. Elias, Gregory D. O’Mullan, Joaquín Martínez Martínez, Andrew R. Juhl, and Kathleen C. Weathers. 2017. "Onshore Wind Speed Modulates Microbial Aerosols along an Urban Waterfront" Atmosphere 8, no. 11: 215. https://doi.org/10.3390/atmos8110215
Note that from the first issue of 2016, this journal uses article numbers instead of page numbers. See further details here.