Article

Evolution of Multispectral Aerosol Absorption Properties in a Biogenically-Influenced Urban Environment during the CARES Campaign

1
Physics Department, University of Nevada, Reno, Nevada System of Higher Education, Reno, NV 89557, USA
2
Laboratory for Aerosol Science, Spectroscopy, and Optics, Desert Research Institute, Nevada System of Higher Education, Reno, NV 89512, USA
3
Atmospheric Sciences & Global Change Division, Pacific Northwest National Laboratory, Richland, WA 99352, USA
4
Earth System Observations, Los Alamos National Laboratory, Los Alamos, NM 87545, USA
5
Department of Environmental Toxicology, University of California, Davis, CA 95616, USA
6
Atmospheric Science Program, Michigan Technological University, Houghton, MI 49931, USA
7
Droplet Measurements Technologies, Boulder, CO 80301, USA
*
Author to whom correspondence should be addressed.
Now at San Jacinto College, Houston, TX 77089, USA.
Now at RAI Innovations Company, Winston-Salem, NC 27105, USA.
§
Now at AECOM, Houston, TX 77094, USA.
Now at Laboratory for Advanced Analytical Technologies, Empa (Swiss Federal Laboratories for Materials Science and Technology), Dübendorf 8600, Switzerland.
Now at Environmental Molecular Sciences Laboratory, Pacific Northwest National Laboratory, Richland, WA 99354, USA.
**
Now at Center for Atmospheric Particle Studies, Carnegie Mellon University, Pittsburgh, PA 15213, USA.
Atmosphere 2017, 8(11), 217; https://doi.org/10.3390/atmos8110217
Submission received: 16 October 2017 / Revised: 6 November 2017 / Accepted: 8 November 2017 / Published: 13 November 2017
(This article belongs to the Special Issue Carbonaceous Aerosols in Atmosphere)

Abstract

:
We present the evolution of multispectral optical properties through urban aerosols that have aged and interacted with biogenic emissions, resulting in stronger short wavelength absorption and the formation of moderately brown secondary organic aerosols. Ground-based aerosol measurements were made in June 2010 within the Sacramento urban area (site T0) and at a 40-km downwind location (site T1) in the forested Sierra Nevada foothills area. Data on black carbon (BC) and non-refractory aerosol mass and composition were collected at both sites. In addition, photoacoustic (PA) instruments with integrating nephelometers were used to measure spectral absorption and scattering coefficients for wavelengths ranging from 355 to 870 nm. The daytime absorption Ångström exponent (AAE) indicated a modest wavelength-dependent enhancement of absorption at both sites throughout the study. From 22 to 28 June 2010, secondary organic aerosol mass increased significantly at both sites, which was due to increased biogenic emissions coupled with intense photochemical activity and air mass recirculation in the area. During this period, the median BC mass-normalized absorption cross-section (MAC) values for 405 nm and 532 nm at T1 increased by ~23% and ~35%, respectively, compared with the relatively less aged urban emissions at the T0 site. In contrast, the average MAC values for the 870 nm wavelength were similar for both sites. These results suggest the formation of moderately brown secondary organic aerosols in biogenically-influenced urban air.

1. Introduction

Atmospheric aerosols impact the Earth’s radiation budget by scattering and absorbing solar radiation, which is referred to as the aerosol direct effect [1,2]. This can lead to heating or cooling, depending on the ratio of aerosol scattering and extinction coefficients (single scattering albedo, or SSA), the particle scattering asymmetry parameter, and the albedo of the underlying surface [3,4,5,6]. In addition to these direct effects, aerosols can also have indirect effects on the radiation balance by changing the properties of clouds, thus influencing their optical properties and lifetime [7,8]. Inorganic salts such as sulfates are an important aerosol species that strongly scatter and backscatter solar radiation, usually cooling the climate [1,9]. Black carbon (BC) aerosol [10] is the dominant absorber over the solar spectrum [11], and is associated with a warming effect [9,12,13]. Furthermore, a number of studies [14,15,16,17,18,19,20,21] have identified a fraction of organic aerosols (OA) as major absorbers at shorter wavelengths, which are often referred to as “brown carbon” (BrC). OA constitutes a large fraction of the atmospheric aerosol mass; typical measurements range from ~20% to 90% of the submicron-diameter aerosol mass [22]. These aerosols scatter light efficiently because their size is comparable to the wavelength of the visible solar radiation, and typical values of the real part of their refractive index are fairly high. Additionally, they can be transported over long distances; hence, their climatic impact is not limited to their source or formation region. However, the role of OA on the Earth’s radiation budget is still poorly understood [23].
The Department of Energy’s (DOE) Carbonaceous Aerosols and Radiative Effects Study (CARES) field campaign was carried out during June 2010 in the Sacramento (CA, USA) area to better understand the evolution of aerosol properties resulting from the various physical and chemical interactions between anthropogenic and biogenic emissions. A wide range of ground-based and airborne instruments was deployed to monitor comprehensive aerosol properties, meteorological variables, and gaseous species. Two ground sites, one within the Sacramento urban area (T0) and another in Cool, CA, ~40 km downwind in the forested Sierra Nevada foothills area (T1), were set up to study the evolution of the aerosols as they aged during transport. Zaveri et al. [24] presented detailed descriptions of the overall research objectives of the CARES campaign, the various sampling platforms and instrumentation, and an overview of several key observations. Fast et al. [25] described the meteorological conditions during CARES.
Previously published aerosol observations during CARES are summarized in the following paragraph. Shilling et al. [26] analyzed aircraft measurements obtained during CARES, and found that the production of secondary organic aerosol (SOA) was dramatically enhanced when anthropogenic emissions from the Sacramento urban area mixed with isoprene-rich air from the Sierra Nevada foothills. A similar conclusion was reached by Setyan et al. [27] and Setyan et al. [28], based on measurements made at the T1 site. Cappa et al. [29] reported that BC absorption enhancement due to coating with non-refractory material during photochemical ageing at T0 was only ~6% at 532 nm, and attributed the slightly higher absorption enhancement at 405 nm to the influence of BrC on absorption in this wavelength region. Kassianov et al. [30] demonstrated an unexpectedly large contribution of coarse mode aerosols to aerosol radiative forcing, with coarse mode aerosols sometimes contributing between 50 and 85% of the total aerosol volume observed at T0 and T1 during CARES.
Previous laboratory and field studies employing direct measurements and inference from the use of Mie theory have reported absorption enhancement. As the day progresses, the fractal-like BC particles begin to increase in mass and transform into a more compact structure upon coating by organics, sulfate, ammonium, nitrate, and water [31]. Such coatings on BC particles can lead to absorption enhancement of up to ~1.6 [31,32,33], while the AAE can be as high as ~1.6 due to non-absorbing coating [18,34]. Laboratory studies have also shown that organic dioctyl sebacate coatings enhanced BC absorption [35].
In this paper, we focus on a comparative analysis of aerosol absorption, scattering, and single scattering albedo over wavelengths ranging from 355 nm to 870 nm at T0 and T1. The objective of this study was to characterize the evolution of these multispectral optical properties as urban aerosols and precursor gases mixed and interacted with biogenic emissions as they were routinely transported to the forested Sierra Nevada foothills area. We begin with a brief description of the measurement sites and instruments, followed by a discussion of the error analysis of aerosol measurements. The BC mass concentration measurements from a single particle soot photometer (SP2) were analyzed together with the aerosol light absorption measurements to obtain BC mass normalized light absorption cross-sections (MAC).

2. Experiments and Discussions
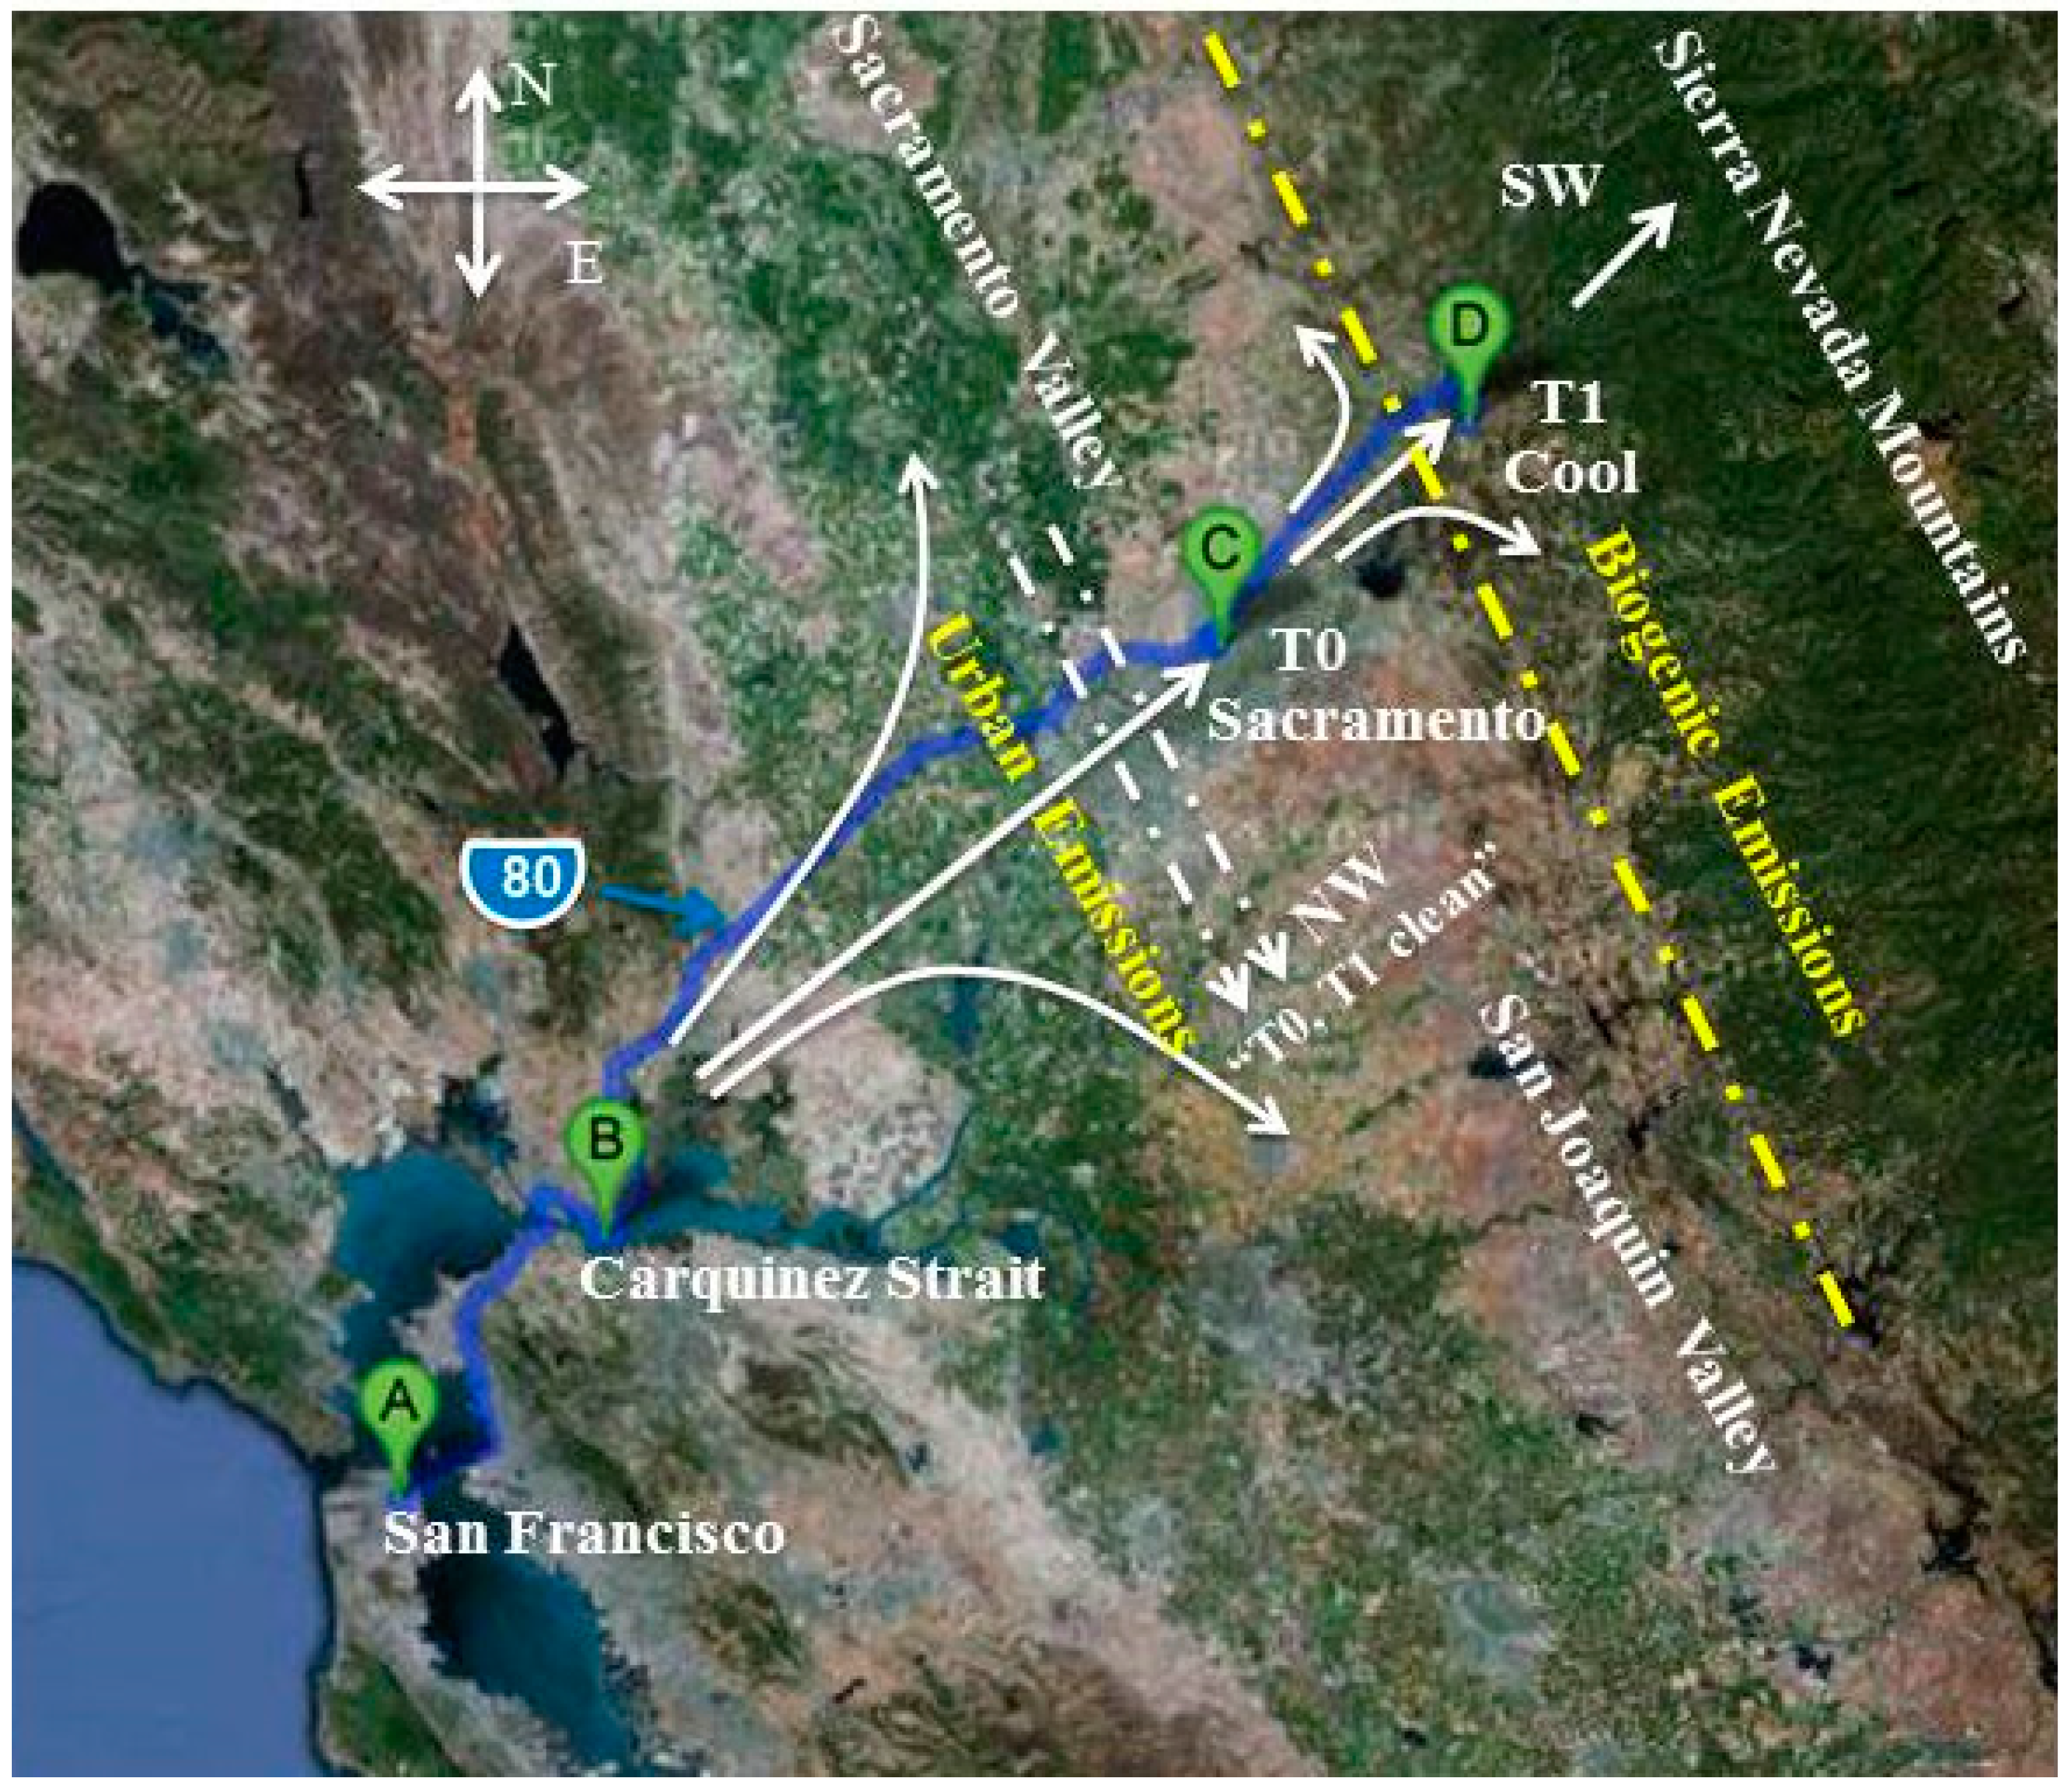
2.1. Ground Sites

The CARES campaign took place in the Sacramento valley from 2 to 28 June 2010. Figure 1 shows the location of the ground sampling sites overlaid with the dominant summer daytime wind patterns. Two ground sites were strategically chosen to study the evolution and transport of urban emissions and their interaction with biogenic emissions in the forested area. The urban site, T0 (altitude ~30 m above sea level (ASL)), was located on the American River College campus, ~14 km northeast of the downtown Sacramento area. The downwind rural site, T1 (altitude ~450 m ASL), was located ~40 km northeast of the T0 site on the Northside School campus in Cool, CA. In addition to local urban and agricultural sources, emissions from the Bay Area and the petrochemical refineries located in the Carquinez Strait are major sources of air pollution in Sacramento and the Central Valley. During strong southwesterly flow events, coarse-mode sea salt aerosols from the Pacific Ocean can also be advected to the Sacramento area via the Carquinez Strait [24].
All measurements are reported at ambient temperature and pressure, and in Pacific Daylight Time (PDT), the local time in California during summer.

2.2. Measurements of Aerosol Optical Properties

During the CARES campaign, a number of photoacoustic (PA) instruments equipped with integrating reciprocal nephelometers were deployed at the T0 and T1 sites to study the magnitude and spectral dependence of aerosol light absorption (βabs) and scattering (βsca) coefficients. To accomplish this, two groups from the University of Nevada, Reno (UNR) and from the Los Alamos National Laboratory (LANL) deployed several PA instruments operating at multiple wavelengths. At T0, wavelengths used included 375, 405, 532, and 870 nm, while at T1, they were 355, 405, 532, and 870 nm.
The PA technique provides real time, in situ measurements of ambient aerosol light absorption [36,37]. In this method, aerosol samples are illuminated in an acoustic resonator by a power-modulated laser. The absorbed energy heats the particles, and the heat is quickly released to the surrounding air, producing a periodic variation in air pressure (i.e., a sound wave). The pressure of the sound wave is measured with a calibrated microphone located in the resonator, thereby producing a first-principle measurement of the βabs. These PA instruments simultaneously measure βsca using a reciprocal nephelometer [38,39].
All PA instruments were calibrated before the CARES campaign using kerosene-flame soot and table salt particles. The absorption and scattering calibration procedure shown and discussed in and around Figure 1 of Gyawali et al. [40] was performed for all of the PA instruments.
Since PA instruments are designed for the concurrent measurement of βabs and βsca, we can obtain the extinction coefficient (βext = βabs + βsca), as well as other optical parameters such as the single scattering albedo (SSA) and the absorption Ångström exponent (AAE), through using multiple wavelength measurements. The SSA is the ratio of the βsca and βext, and can be expressed as
S S A = β s c a ( λ ) β a b s ( λ ) + β s c a ( λ )
The spectral dependence of SSA is related to those of βabs and βsca [41]. At T0, SSA was studied at λ = 405, 532, and 870 nm, and at T1, it was investigated at λ = 355, 532, and 870 nm. The SSA and AAE calculations were reported for the most abundant PA measurements at each site. The AAE expressed by
A A E = l n ( β a b s ( λ 1 ) β a b s ( λ 2 ) ) l n ( λ 1 λ 2 )
characterizes the spectral dependence of aerosol light absorption assuming a simple power-law dependence between the wavelengths λ1 and λ2 [42]. The AAE at T0 was derived from the PA measurements of βabs at 405 and 870 nm, while at T1, it was derived from similar measurements at 355 and 870 nm. These wavelengths were chosen to emphasize light absorption by organic aerosol coatings and intrinsic absorption [18].

2.3. Collocated Measurements Used in This Study

BC mass concentrations were measured at T0 and T1 with a single particle soot photometer (SP2) [43] calibrated with Acheson Aquadag [44]. While the SP2 was calibrated with Aquadag, recent studies have shown that diesel soot and wood smoke BC are better represented by fullerene soot [45,46]. Therefore, the SP2-measured BC mass was increased by 43% as a first-order approximation toward a fullerene soot-equivalent value, based on the results of Moteki and Kondo [46].
Within a particle mobility diameter range from 8 to 858 nm, particle size distributions were measured at T1 in 70 logarithmically-spaced size bins by a scanning mobility particle sizer (SMPS) system consisting of a differential mobility analyzer (DMA) and a condensation particle counter (CPC, model 3772; TSI Inc., Shoreview, MN, USA) [27]. Similar measurements were conducted at T0 for particle mobility diameters from 12 to 736 nm in 115 size bins. Measurements of the size-resolved chemical composition of non-refractory species in particles of an aerodynamic diameter less than 1 µm (NR-PM1) were simultaneously acquired with a high-resolution aerosol mass spectrometer (HR-AMS) [27]. The HR-AMS provides mass concentrations of inorganic and organic aerosols.
Aerosol samples for electron microscopy analysis were collected on 13-mm diameter nuclepore polycarbonate membranes with 100-um pore size (Whatman Inc., Chicago, IL, USA) using a custom made sequential sampler, as described in China et al. [47]. The samples were sputter coated with a thin layer of platinum, and were imaged using a Hitachi S-4700 field emission scanning electron microscope (FE-SEM) [24,47].

2.4. Error Analysis

We have used basic uncertainty propagation theory to compute the error bars for derived aerosol optical properties, f (βabs, βsca, BCmass), such as SSA, AAE, and MAC. Assuming that βabs, βsca, and BCmass are uncorrelated, the error δf in f follows from the method of propagation of errors [48] as
δ f ( β a b s , β s c a , B C m a s s ) = ( f β a b s ) 2 ( Δ β a b s ) 2 + ( f β s c a ) 2 ( Δ β s c a ) 2 + ( f B C m a s s ) 2 ( Δ B C m a s s ) 2
The three partial derivatives appearing on the right hand side of this expression can be evaluated using Equations (1) and (2), and the well-known expression defining the MAC as MAC = βabs/BCmass. In this study, both instrument calibration uncertainties and statistical variations are considered to estimate the error bars for calculated aerosol optical properties. The terms Δβabs, Δβsca, and ΔBCmass correspond to the root square sum of the squares of the uncertainties due to instrument calibrations and the statistical errors. The calibration uncertainties associated with PA absorption coefficient measurements and reciprocal nephelometer (RN) scattering coefficient measurements are 5% and 15%, respectively. Gyawali et al. [40], Lewis [49], Lewis et al. [21], and Arnott et al. [50] have discussed these uncertainties. The uncertainties in BC mass concentrations are about 22% [44]. Additionally, the following equations were used to conservatively estimate the electronic uncertainties associated with measurement precisions of the PA absorption measurements (Δβabs)precision and SP2 black carbon measurements (ΔBCmass)precision as
( Δ β a b s ) p r e c i s i o n = [ 8   M m 1 30 m W P L 1 s τ ]
and
( Δ B C m a s s ) p r e c i s i o n = [ 0.5 n g m 3 1 τ ]
In Equations (4) and (5), PL and τ are the laser power and the measurement time, respectively [36]. The uncertainty associated with the electronic precision of SP2 measurements of BC were not considered in the error analysis below due to their negligible contribution to the total MAC error, as the large laser irradiance used by SP2 provides much more precise measurements than those obtained with the PA. The maximum value of τ is 600 s, as the measurement begins to drift after this time. Our PA instruments all use the same type of microphone, acoustical resonator, and detection electronics. The MAC error associated with PA measurement precisions is estimated by using the following equation
Δ M A C p r e c i s i o n 2 = 1 N i = 1 N [ ( M A C ) i ( Δ β a b s ) p r e c i s i o n ( β a b s ) i ] 2
The statistical errors in regression-derived MAC were obtained from the slope error. Table 1 summarizes the mean, median, and regression values of MAC for 22–28 June 2010 at T0 and T1 including the standard deviation (SD), instrument calibration, and precision error. The total error in the regression MAC values is obtained by using the error propagation technique to combine the slope errors (SE) and calibration uncertainties of the PA and SP2 instruments.

3. Results and Discussion

A study of the meteorological parameters characterizing the transport of aerosols during the CARES campaign was published by Fast et al. [25]. In brief, near-surface thermally-driven upslope flows, including synoptic southwesterly (SW) winds, were favorable for transport of the urban plume from Sacramento, CA to the T1 site near Cool, CA. These patterns were occasionally interrupted by a northwesterly (NW) flow, which carried the urban plume southeast to the San Joaquin Valley (Figure 1), thereby reducing the interaction of the urban plume with biogenic emissions at T1 and providing recirculation to T0.

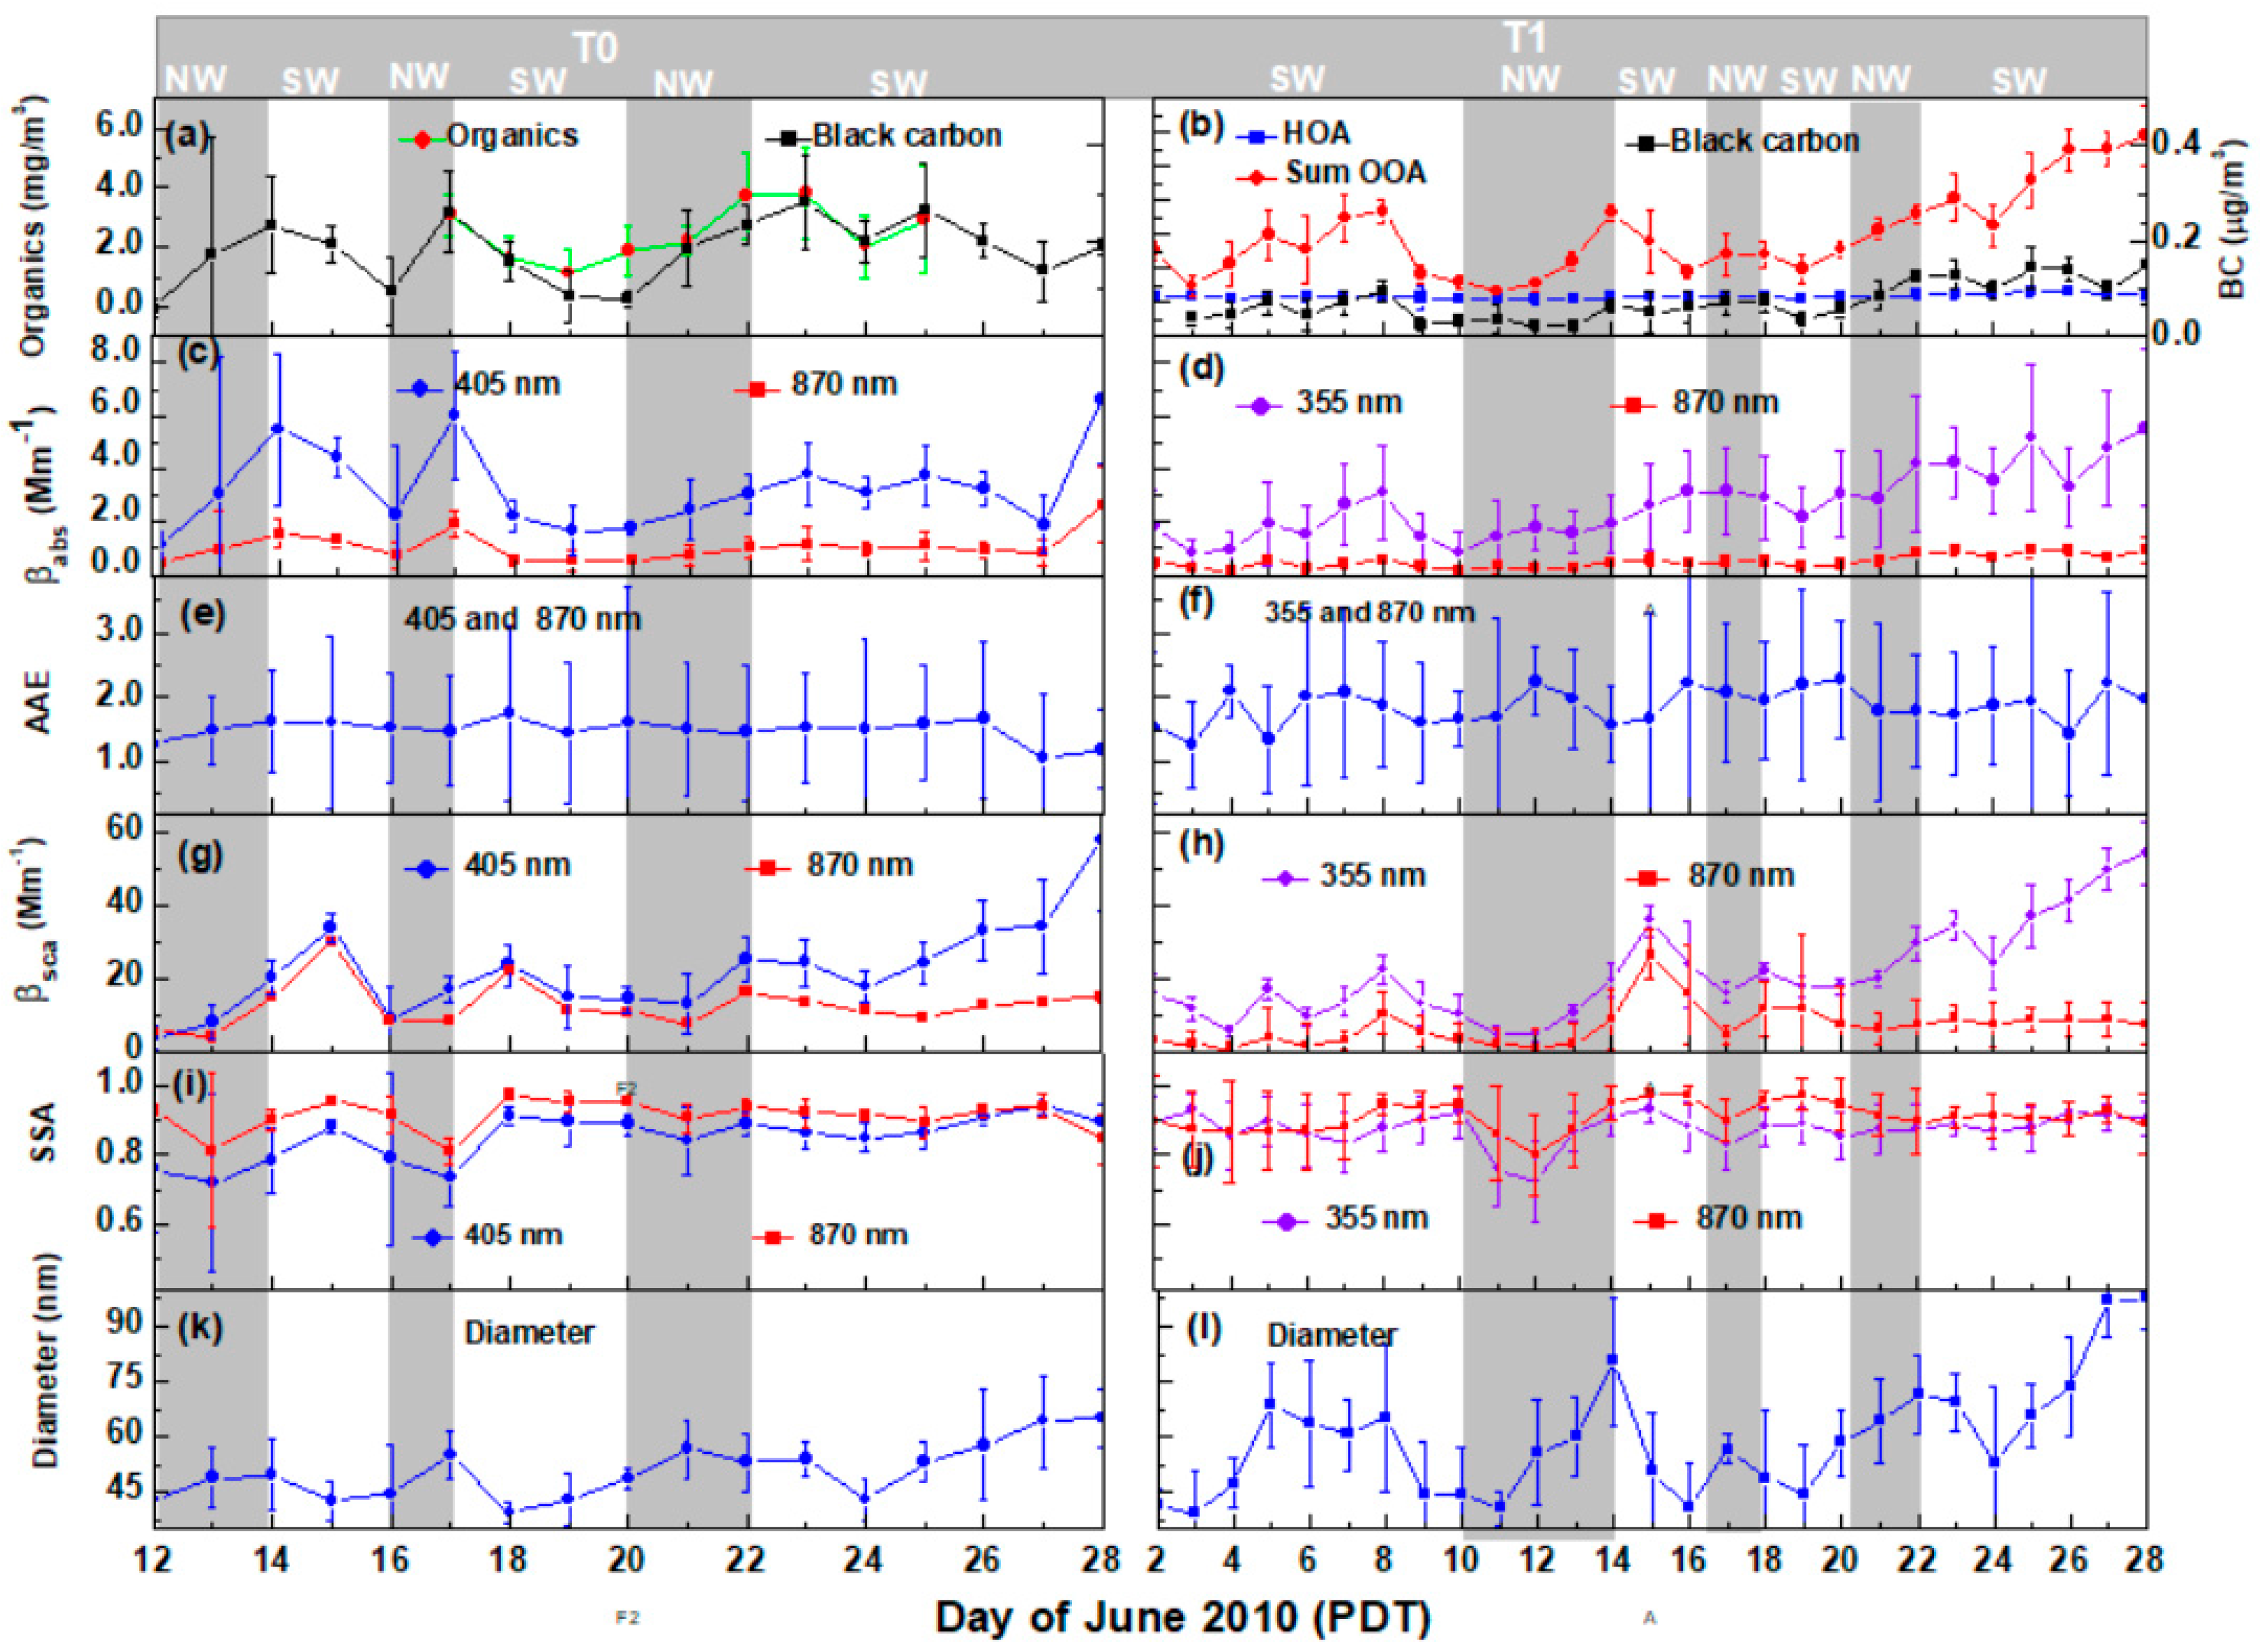
3.1. Daily Average of Aerosol Chemical, Physical, and Optical Properties

The left panels of Figure 2 show the daily daytime (06:00 to 18:00 PDT) average of PM1 organic mass concentration, the PA measurements of βabs and βsca, AAE, SSA, and the particle mobility diameter (particle mean number-weighted diameter) measured by the SMPS at T0 from 12 to 28 June 2010. Likewise, the right panels of Figure 2 present similar measurements for the T1 site, from 2 to 28 June 2010. The vertical bars in PM1 organic mass concentration, βabs, βsca, and PM1 mean diameter represent one standard deviation of the averaged measurements during daylight hours. The uncertainties of SSA and AAE were determined by the error propagation technique, which is described in Section 2.4. PM1 organic mass concentration measurements at T0 were available only from 17 to 25 June 2010. The gray bar at the top of Figure 2 indicates periods during which the synoptic wind was either southwesterly (SW) or northwesterly (NW). Semi-transparent gray shading for the NW flow periods is also shown over all the plots.
Site T0: The daily daytime BC mass concentrations varied between 0.05 ± 0.02 (average ± 1σ) and 0.25 ± 0.09 µg m–3, with an overall average of 0.14 ± 0.05 µg m–3 (Figure 2a). The daily daytime average βabs plotted for 405 and 870 nm (Figure 2c) exhibited similar variations with BC mass concentrations and PM1 organic mass concentrations (Figure 2a). The peaks of βabs ~ 5.5 ± 2.8 and 1.6 ± 0.6, and 6.0 ± 2.4 and 1.9 ± 0.5 Mm–1 at 405 and 870 nm, respectively were observed on 14 and 17 June 2010, and found to be associated with the corresponding peak values of BC mass concentrations.
Scattering at 405 nm (Figure 2g) correlated especially well with the mean diameter of PM1 from after 22 June 2010 to the end of the campaign, when PM1 particle growth contributed to enhanced scattering at 405 nm relative to 870 nm. The daily daytime maximum PM1 mean mobility diameter (Figure 2k) was 68.5 ± 11.5 nm with βsca of 57 ± 20 Mm−1 for 28 June, while the daily daytime βsca at 870 nm remained constant at ~11 Mm−1. The SSA (Figure 2i) was lower for both 405 and 870 nm during NW flows, due to the increased influence of fresh traffic emissions. The daily daytime SSA varied between 0.72 ± 0.31 (average ± uncertainty) and 0.95 ± 0.03 at 405 nm, and 0.81 ± 0.04 and 0.97 ± 0.01 at 870 nm. The difference between the SSA at 405 and 870 nm decreased continuously as the campaign progressed due to the enhanced formation of SOA and recirculation of aged aerosols. The SSA exhibited a value of ~0.90 for both 405 and 870 nm after 25 June. The daily daytime average AAE (Figure 2e) at 405 and 870 nm remained fairly constant, as it varied only between 1.1 ± 1.6 (±uncertainty) and 1.7 ± 1.0 with an average value of ~1.6 ± 0.3, indicating enhanced absorption at shorter wavelengths at T0, even in background air.
Figure 3 (left image) shows a field emission scanning electron microscope (FE-SEM) image of particles collected at the T0 site on a nuclepore membrane. The image shows a broad size distribution of BC aggregates as large as 4.5 µm in the longest dimension (Figure 3i). Freshly emitted BC particles can be mixed with partly coated BC particles (Figure 3ii), or coated by other material (Figure 3iii) (darker region), such as unburned fuel, lubricating oil, or organic matter [47,51].
Site T1: The daily daytime average BC mass concentration varied from 0.02 ± 0.01 to 0.14 ± 0.08 µg m−3 (Figure 2b), with an overall average of 0.06 ± 0.02 µg m−3. The lower BC mass concentrations were primarily observed during the NW flows. As mentioned previously, the NW flows disrupted the transport of the urban plume from Sacramento to the T1 site. Between 8 and 11 June 2010, the average mass concentration of PM1 organics decreased from 3.80 ± 0.40 (±1σ) to 0.80 ± 0.13 µg m−3, while the mean mobility diameter of these particles decreased from 65 ± 20 to 39 ± 12 nm. In Figure 2b, the time series of total PM1 organic mass concentration has been shown in more detail, with hydrocarbon-like organic aerosol (HOA) and the sum of oxygenated organic aerosol (OOA) mass concentrations plotted individually; these data show that most of the organic aerosol mass fraction observed corresponds to SOA. While this does not give any indication on the ageing of particles, we also note that according to Setyan et al. [27,28], (1) the toluene/benzene mass ratio was between 1.5 and 2.0, suggesting moderate ageing; (2) the O/C ratios of organic aerosol were between 0.35 and 0.45, which also suggest moderate ageing; and (3) the change in organic aerosol (OA) mass concentration relative to that of CO (ΔOA/ΔCO) was the highest when air masses were dominated by anthropogenic emissions in the presence of a high concentration of biogenic volatile organic compounds, indicating enhanced SOA formation in mixed anthropogenic–biogenic plumes. Additional information relevant to aerosol ageing includes the meteorological modeling described by Fast et al. [25] and the temperature time series given by Zaveri et al. [24].
The βabs at 355 nm ranged from 0.8 ± 0.7 to 5.5 ± 3.0 Mm−1 (Figure 2d) with an overall average of 2.6 ± 1.4 Mm−1. Similarly, βabs at 870 nm ranged from 0.2 ± 0.1 to 0.9 ± 5.5 Mm−1. According to Setyan et al. [27], organics dominated the average chemical composition with 80% of PM1 mass, followed by sulfate (9.9%), ammonium (4.5%), nitrate (3.6%), and BC (1.6%). In addition to BC, organic species emitted directly from combustion processes or formed via the oxidation of volatile organic compound (VOC) emissions are the major light absorbing carbonaceous aerosols in the atmosphere [52].
The daily daytime average AAE (Figure 2f) varied from 1.3 ± 0.6 to 2.3 ± 0.8, and remained ~1.8 after 22 June, suggesting enhanced absorption at the shorter wavelengths, which is likely due to coating by mildly absorbing organic species on BC. Higher temperatures result in higher emission rates for biogenic VOCs (e.g., isoprene, monoterpenes) [53]. Enhanced SOA formation was observed when the urban plume interacted with biogenic emissions during the campaign [27]. The steadily increasing organic mass from 22 to 28 June at T1 (Figure 2b) produced a strong impact on aerosol light scattering at 355 nm (Figure 2h) with ~84% increase in βsca, while βabs at 355 nm increased by ~35%. For comparison, during the same period, βsca and βabs at 870 nm increased by ~5% and ~11%, respectively. These results suggest that the SOA formed from the oxidation of mixed biogenic and anthropogenic emissions in the forested region (near T1) developed a modest apparent or intrinsic absorption at 355 nm, which is much less than the strong intrinsic SOA ultraviolet (UV) absorption observed for biomass burning aerosols [18]. Furthermore, at the T1 site, OOA comprised 90% of the total mass of organics, while HOA comprised only 10% [27]. The OOA fraction corresponds to SOA, and the HOA fraction corresponds to traffic-related primary emissions. From this PM1 classification, it is apparent that the enhanced scattering of 355 nm radiation at T1 was dominated by the OOA components of the SOA.
Emissions of VOC precursors for the observed SOA have been discussed by Zaveri et al. [24]; maps of anthropogenic VOC and biogenic isoprene emission rates along with locations of T0 and T1 sites are shown in Figure 2 [24]. In addition, Shilling et al. [26] analyzed airborne mass spectrometer measurements made during mornings and afternoons, and observed that isoprene concentrations of up to 12.9 ppbv dominated the biogenic VOC concentrations, with monoterpene concentrations generally below the detection limit of ~300 pptv. Setyan et al. [27] noted that at T1, monoterpene concentrations have a very strong diurnal pattern; they are close to the detection limit during the day, and increase up to 1 ppb during the night, which is still five times lower than the isoprene concentration. A possible explanation for this result is that the main sources of monoterpenes are quite far from T1, and given that monoterpenes are very reactive with OH radicals, they may be already almost completely oxidized before reaching T1. Another possible explanation is that the main sources of monoterpenes are located northeast of T1. In this case, monoterpenes would be observed at T1 only during the night, when we have the recirculation of air from the foothills of the Sierra Nevada back to T1.
Days with NW flows exhibited lower SSA (Figure 2j) in comparison with days with SW flows both at 355 and 870 nm, with values 0.72 ± 0.13 (±uncertainty) and 0.80 ± 0.20, respectively. As observed at the T0 site, the SSA at both wavelengths became increasingly similar after 22 June, with values ~0.90. This was consistent with the concurrently observed increasing mass of PM1 organics and the diameter of the particles. The aerosol size increases during atmospheric processing as a result of the coagulation and condensation of both organic and inorganic species, which affect aerosol optical properties [54]. After 22 June, the growing mean diameter of PM1 (Figure 2l) resulted in enhanced βsca at 355 nm at T1, and also at 405 nm at T0, though the effect was more pronounced at T1. The maximum PM1 mean diameter at T1 reached ~98 ± 8 nm, while βsca at 355 nm peaked at 54.0 ± 8.8 Mm−1 on 28 June. The βsca at 870 nm was slightly higher after 22 June, but remained nearly constant at ~10 Mm−1.
Figure 3 (right image) shows a FE-SEM image of particles collected at the T1 site, and displays: (a) fractal-like BC aggregates with open (Figure 3i) and compact structures (Figure 3ii), which are consistent with the presence of fresh and aged particles; (b) partially-encapsulated BC with a spherical particle (Figure 3iii), which are representative of the complex mixing state of BC particles; (c) spherical and near-spherical particles (Figure 3iv), which are consistent with the presence of organic aerosols. For comparison, Chakrabarty et al. [55] reported the morphology of incense smoke aerosols composed of mostly BrC to be non-coalescing and weakly-bound aggregates.

3.2. Aerosol Light Absorption Efficiency

Aerosol light absorption efficiency is obtained from the ratio of aerosol light absorption coefficients measured with the PA instruments and BC mass concentrations measured with the SP2, and is referred to as mass-normalized absorption cross-section (MAC). MAC is of great importance in understanding the role of BC in climate forcing. Estimations of MAC and the associated uncertainties are presented in this section.

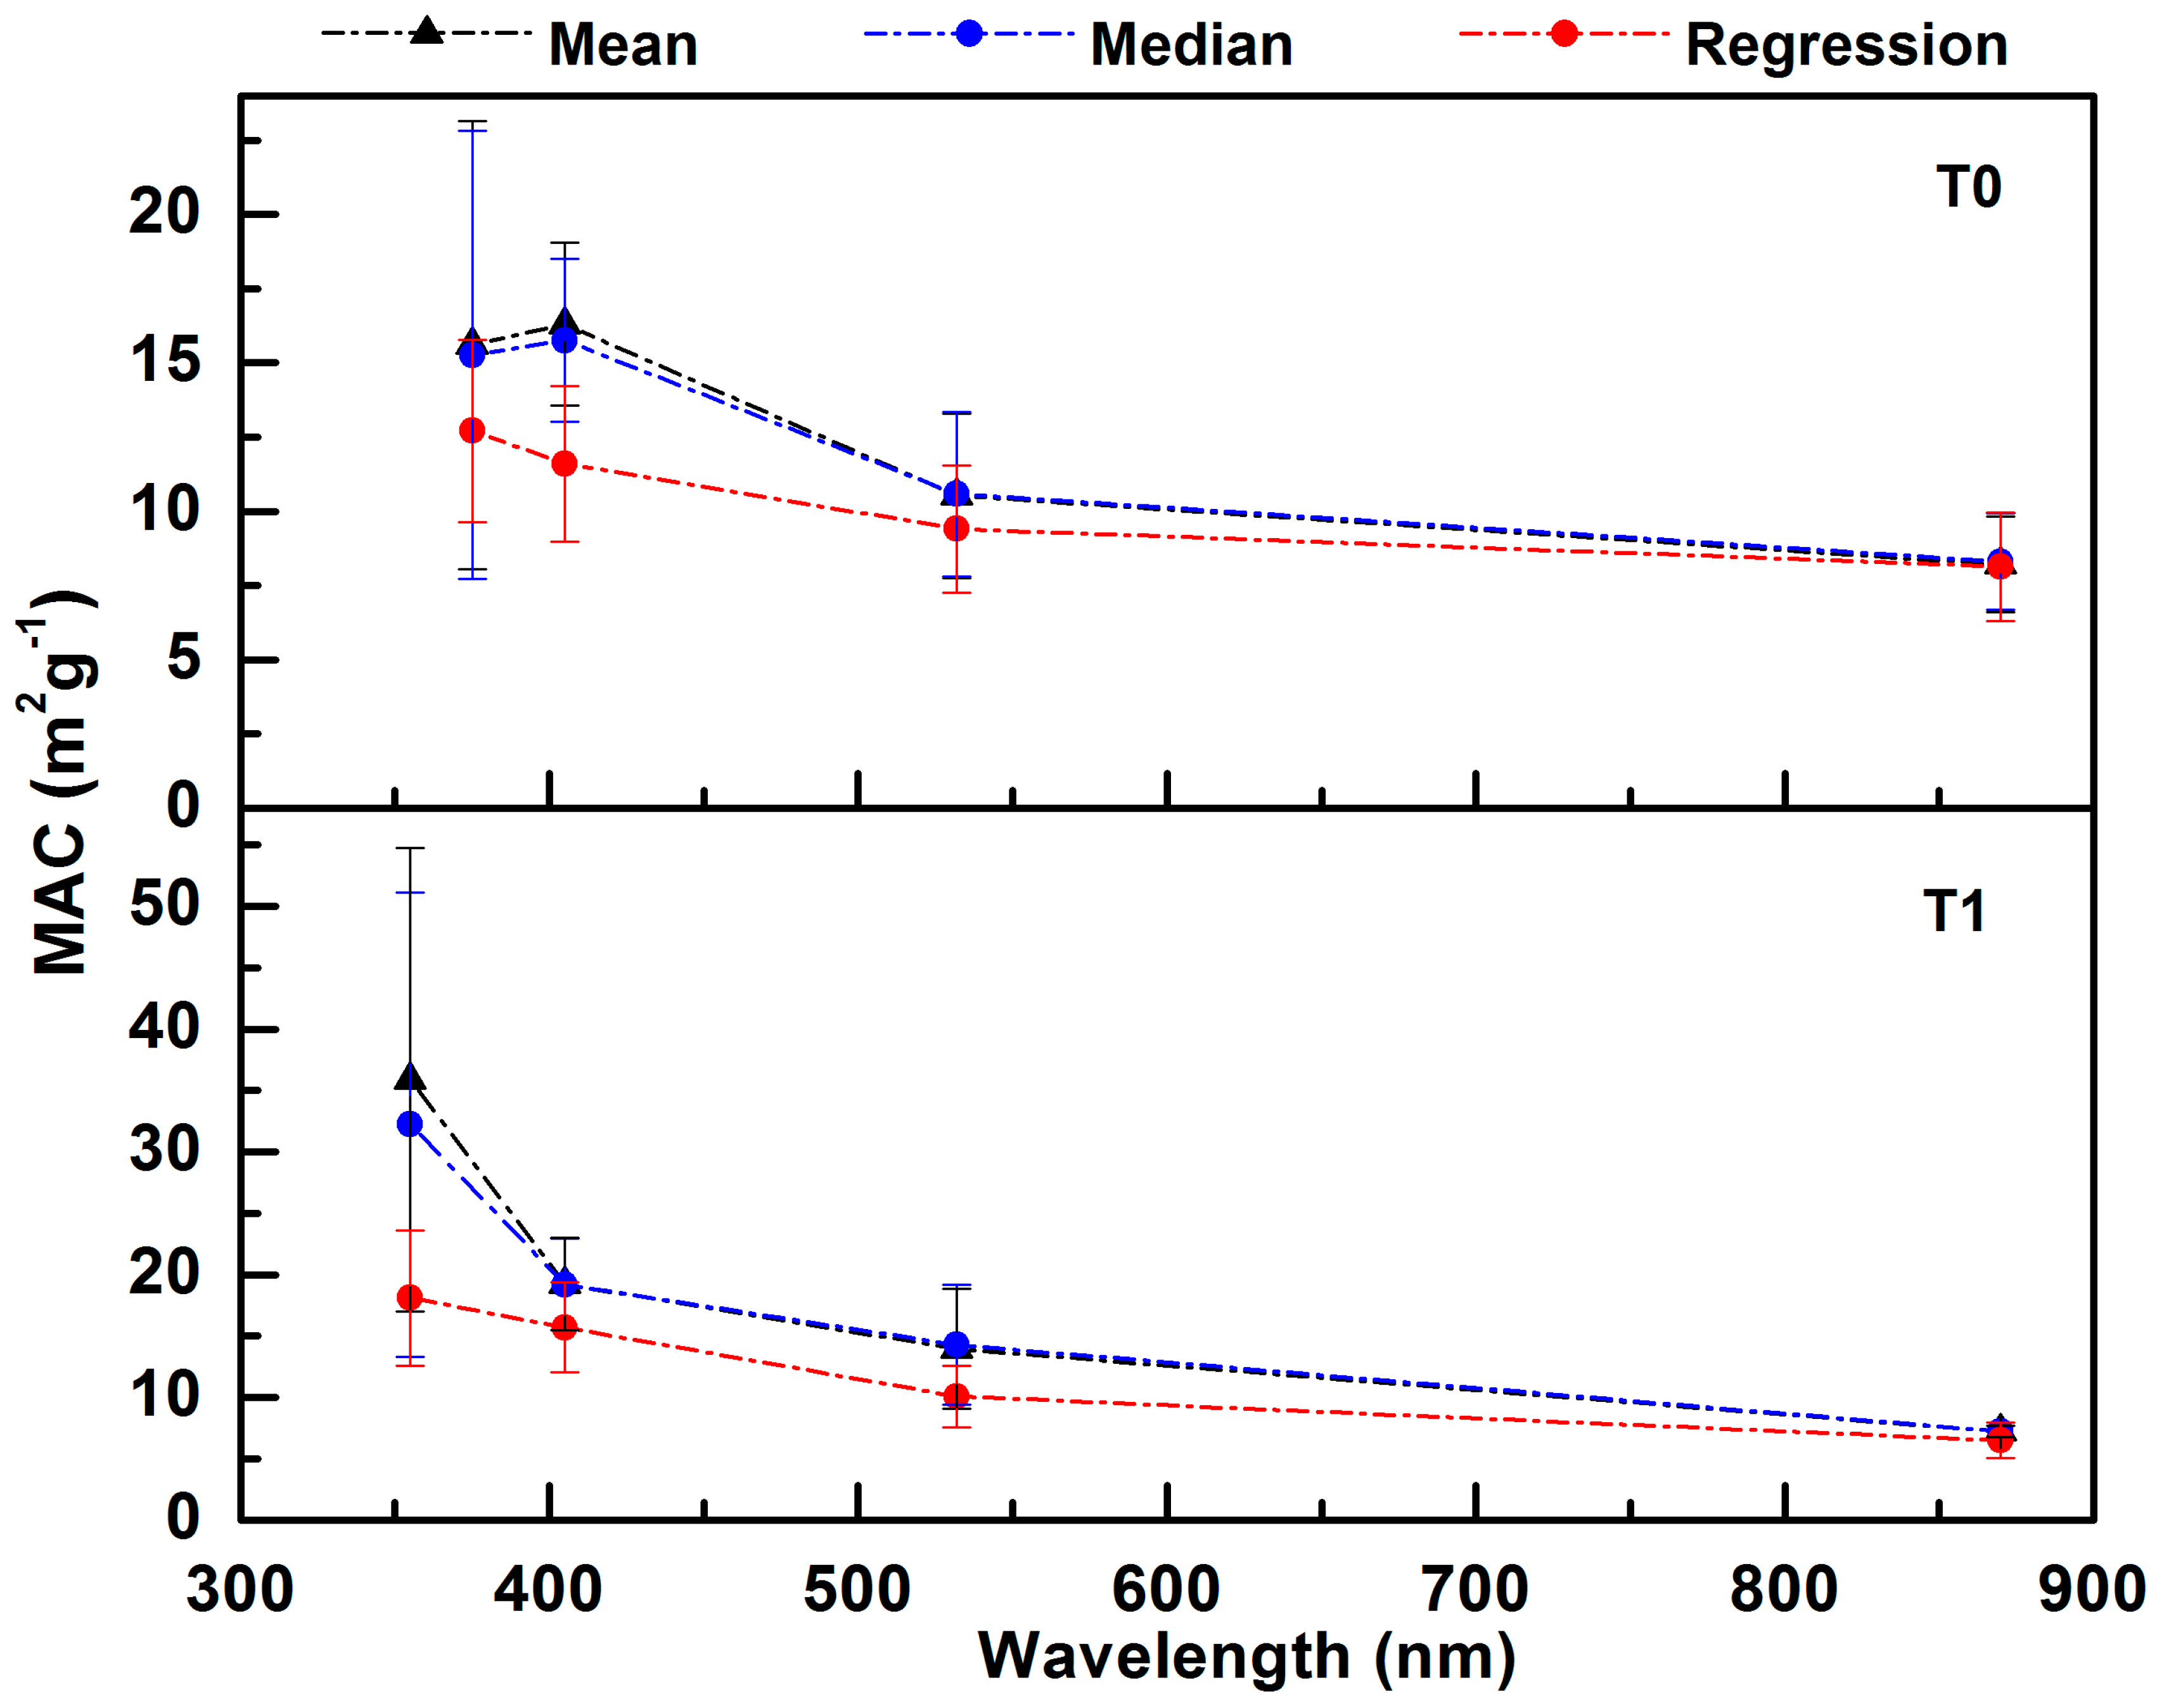
3.2.1. MAC from Linear Regression, Mean, and Median Analyses

Results are presented for the period from 22 to 28 June, as this was the longest time period during which all SP2 and PA instruments were operating continuously at both sites. As mentioned previously, these days were favorable for the transport of the urban plume from Sacramento to the T1 site and its vicinity. Additionally, a steady buildup of aged pollutants was noted.
Regression analyses were carried out for PA measurements of absorption coefficients and BC mass concentrations from the SP2. The slope of the linear regression yields an estimate of BC MAC (m2 g−1). Better correlation between the absorption coefficients and BC mass concentration is generally expected for the longer wavelengths (e.g., 532 and 870 nm) than for the shorter wavelengths (e.g., 355, 375, and 405 nm), as light absorption by the latter is potentially influenced by the presence of BrC. Perfect correlation is not necessarily expected for any wavelength due to the increase in MAC associated with particle coatings and BrC, and the decrease in MAC associated with the shielding effect on light absorption of the aerosol interior for larger aerosol particles. Measurement precision also affects the correlation.
Error bars for MAC were calculated from the propagation of the standard error of the slope, instrument precision, and calibration uncertainty for both PA and SP2 instruments. MAC values for T0 and T1, from near UV to near IR wavelengths, are shown in Figure 4. Mean and median MAC values are also presented in the same Figure. These mean and median MAC values were derived by dividing continuous measurements of absorption coefficients by continuous measurements of BC mass concentrations. Mean and median values are quite similar for all wavelengths except 355 nm, suggesting that MAC measurements are symmetrically distributed around the mean values for these wavelengths, as discussed further in the following section. The linear regression model assumes that the MAC is the same for all points, and is only a coarse statistical measure of the relationship between BC and light absorption; this is especially true for wavelengths where BrC absorbs strongly as well. We prefer to use the median MAC values, as in Doran et al. [56,57], when reporting a single value for MAC at a specific wavelength. MAC values obtained from the slope of the regression analysis are substantially lower for the shorter wavelengths compared with the mean and median values, because offsets (due to lack of correlation BC and BrC) will positively affect the mean and median values.
Table 1 summarizes the linear regression, mean, and median MAC values with the corresponding slope errors, standard deviations, and instrumental errors. This table represents our current state of knowledge for MAC estimations for places such as Sacramento in early summer, where signal levels are modest and measurement uncertainty is similar to the range of MAC values caused by various physical and chemical processes. One use of this table by modelers could be to assume that the MAC values are normally distributed (see next section) about the mean values with a width (due to chemical and physical processes) that is equal to the square root of the standard deviation squared (last column), minus the precision error squared (column 6). In doing so, note that the width of the MAC distribution functions are generally larger (except for 870 nm) at T1 compared with T0, perhaps suggesting that BrC contributes more to light absorption at T1. Note that the slope error from linear regression is proximally close in values to the precision error calculated from the use of Equation (6). The large standard deviation at 355 nm really stands out compared with other values, perhaps indicating that both dust and brown carbon light absorption contribute to the width of the MAC probability distribution, substantially more so than at 375 nm.
The median MAC values for T1 ranged from 32.2 ± 18.9 (±standard deviation) at 355 nm to 7.2 ± 0.5 m2 g−1 at 870 nm, while for T0, the values ranged from 15.3 ± 7.6 m2 g−1 at 375 nm to 8.2 ± 1.6 m2 g−1 at 870 nm. Even though the vertical bars (standard deviation) in the average MAC values at T0 and T1 for similar wavelengths were touching or overlapping, the median MAC values at T0 were lower than those at T1. For example, the median MAC values at T1 were about 23% and 35% higher than those at T0 for 405, and 532 nm, respectively. Brown carbon could account for ~10–30% of total absorption at mid-visible to UV wavelengths [58]. Our MAC values at 870 nm for T0 and T1 are larger than Bond and Bergstrom’s [11] suggested value of 7.5 ± 1.2 m2 g−1 for freshly emitted BC at 550 nm (or 4.7 m2 g−1 at 870 nm, assuming a λ−1 dependence). Using a PA and an organic carbon/elemental carbon OC/EC analyzer instrument, Doran [56,57] found similar MAC values of 5.6 and 5.5 m2 g−1 at 870 nm for partially coated BC at sites T1 (north of Mexico City) and T2 (~35 km farther to the northeast) downwind of Mexico City. It is possible that the differences in the determination of BC from the SP2 and EC from the Sunset Labs OC/EC analyzer causes large MAC value differences between Sacramento and Mexico City, as the PA 870 nm instrument was the same in both studies.
The rather small difference in absorption at 870 nm at T1 and T0 suggests that the additional coating on the aged BC particles at T1 may not have produced an appreciable absorption enhancement. However, the observed increases in absorption at 532 nm, 405 nm, and UV wavelengths at T1 may be mainly due to the influence of brown SOA and perhaps mineral dust [59,60]. While these results are generally consistent with the findings of Cappa et al. [29], a more detailed analysis of the absorption data with the core–shell Mie theory, constrained with the observed BC coating thickness (from SP2 measurements) and morphological information (based on SEM images), is needed to estimate the relative contributions of the absorption enhancement and brown SOA to the total multispectral absorption observations at both T0 and T1. Such a study is planned, and results will be published elsewhere.

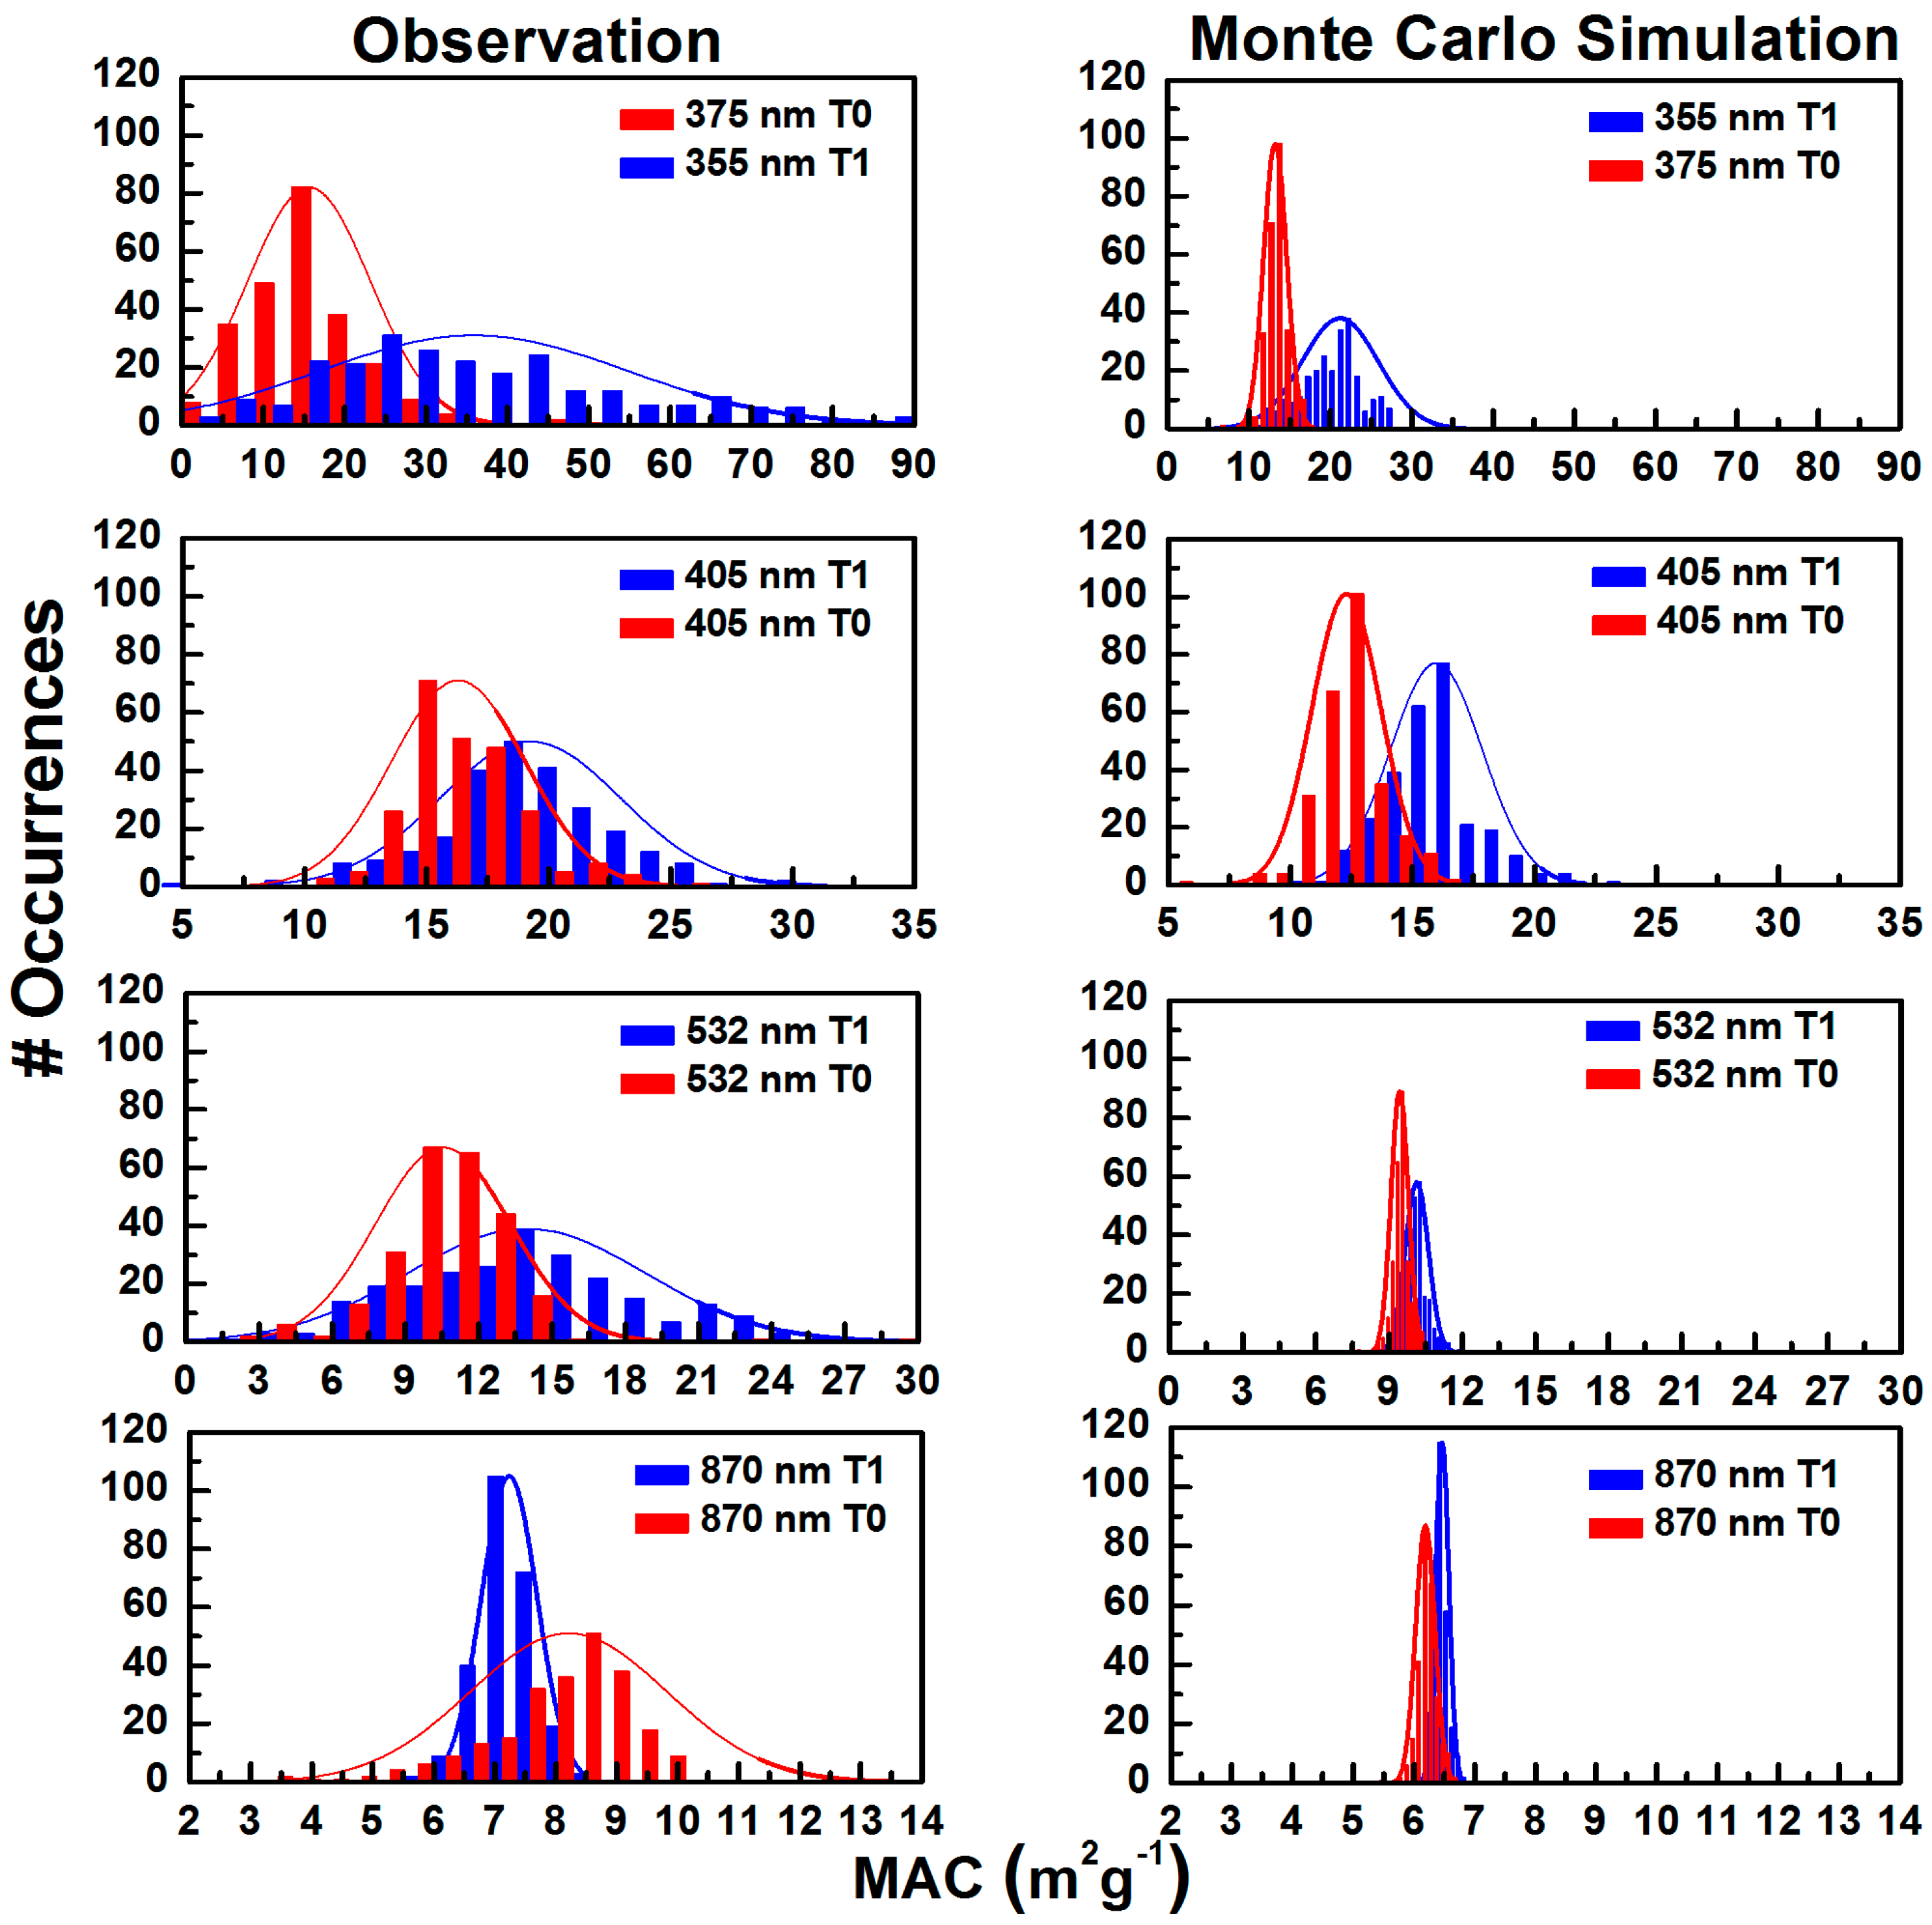
3.2.2. MAC Frequency Distribution and Monte Carlo Simulation

Figure 5 presents histograms of the frequency distribution of observed (left panel) and modeled Monte Carlo simulation (right panel) of MAC assuming only precision error. The purpose of this section is to display the measured histograms, and to show what they would look like if instrument precision error was the only broadening mechanism.
The Monte Carlo method was used to simulate the MAC values obtained from the regression analysis presented in Section 3.2.1. The simulation depicts the spread of the MAC values with instruments that suffer from error due to measurement precision alone. The algorithm for simulating the experiment is as follows: first, randomly choose 〈BC〉 values in the range from BCmin to BCmax, then calculate the corresponding 〈βabs〉 value from 〈βabs〉 = slope〈BC〉, where the slope is the MAC value from the regression analysis. Second, choose a trial measurement of βabs by picking a random number from the range β a b s t r i a l = [ 4   Δ β a b s + β a b s ,   4   Δ β a b s + β a b s ] . The probability distribution in 〈βabs〉 is normalized, and the peak value of the probability distribution Pmax is calculated by using the equation P m a x = ( 2 π   Δ β a b s ) 1 . A random number is chosen; if this random number is ≤Pmax, then accept β a b s t r i a l as βabs. This process is repeated for finding the same number of pairs of acceptable values of βabs and BC, as reported in the measured values in the histograms.
The modeled MAC distributions are very narrow in comparison to the corresponding observed distributions. This was expected, since the modeled MAC values only consider uncertainty in measurement precision. Additionally, the shortwave lengths (355 and 375 nm) show a very broad histogram for observed MAC, while for longer wavelengths, the histograms are narrower, and the data move to lower MAC values, as do the frequency peaks. Furthermore, for similar wavelengths, the MAC distribution shifted to the higher values for T1 than for T0, implying a prevalence of BrC at T1.

4. Conclusions

As part of the CARES field campaign carried out in June 2010 in Sacramento Valley, California, the evolution of multispectral aerosol optical properties was characterized for the Sacramento urban area (site T0) and a 40-km downwind location (site T1) in the forested Sierra Nevada foothills area, as the urban aerosols aged and interacted with biogenic emissions. The weather conditions at the beginning of the campaign were spring-like (high wind speeds and mild temperatures), in which aerosol optical properties were mostly driven by primary emissions, and later transitioned to summer-like conditions (low wind speeds and higher temperatures), during which optical properties were increasingly influenced by secondary aerosol formation. Enhanced production of SOA was observed during the southwesterly flow events, during which the average SSA remained high (>0.90) at both sites. In contrast, the SSA values were appreciably lower during the occasional northwesterly flow events (as seen in Figure 3) when both sites were impacted by fresh local emissions of BC.
During the last week of the campaign, under sustained southwesterly flow, the SOA mass increased significantly at both sites, which was due to increased biogenic emissions coupled with intense photochemical activity and air mass recirculation in the area. This resulted in a strong impact on 355 nm light scattering due to larger submicron particles. The month-long daytime average AAE was ~1.6 for the wavelength pair 405 and 870 nm at T0, while it was ~1.8 for the wavelength pair 355 and 870 nm at T1, indicating a modest wavelength-dependence of absorption at both sites throughout the study. During the last week of the campaign (i.e., the period when SOA mass increased significantly), the BC mass-normalized absorption cross-section (MAC) for 405 nm at T1 increased by ~23% compared with that of the relatively less aged urban emissions at the T0 site. In contrast, the MAC values for the 870 nm wavelength were nearly identical at T0 and T1. These results suggest the formation of moderately brown SOA in biogenically-influenced urban air, as opposed to absorption enhancement caused by non-absorbing SOA coating. These results are generally consistent with the conclusions of Cappa et al. [29]. However, a detailed model analysis of the absorption data, constrained with the observed BC coating thickness and morphological information, is needed to estimate the relative contributions of brown SOA and the absorption enhancement caused by non-absorbing SOA coating to the total multispectral absorption observations at both sites.

Acknowledgments

This research is based upon work supported by NASA EPSCoR under Cooperative Agreement No. NNX10AR89A and by NASA ROSES under Grant No. NNX15AI48G. Funding for data collection was provided by the Atmospheric Radiation Measurement (ARM) Program sponsored by the US Department of Energy (DOE), Office of Biological and Environmental Research (OBER). This work was also supported by the US Department of Energy’s Atmospheric System Research (ASR) Program under Contract DE-AC06-76RLO 1830 at PNNL and LANLF265 to Los Alamos National Laboratory. Supports for AS and QZ was provided by the Office of Science (BER), US Department of Energy, Atmospheric System Research Program, Grant No. DE-FG02-11ER65293.

Author Contributions

Madhu Gyawali is the prime author of this paper and was also involved with instrument calibration, measurements, and data analysis. W. Patrick Arnott assisted with data interpretation, instrument calibration, and measurements. Rahul A. Zaveri was responsible for overall project design and implementation, and assisted with data interpretation. Chen Song provided aerosol size measurements and interpretation. Bradley Flowers assisted with instrument calibration and measurements of aerosol optics. Manvendra K. Dubey participated in overall project design and data interpretation. Ari Setyan and Qi Zhang were responsible for aerosol chemical composition measurements and interpretation. Swarup China, Claudio Mazzoleni, and Kyle Gorkowski were involved with electron microscopy of sampled aerosols. Ramachandran Subramanian was responsible for calibration of the SP2 instrument and interpretation its data. Hans Moosmüller assisted with data interpretation and manuscript preparation. All authors were given the opportunity to write sections of the manuscript concerning their measurements and interpretations, and to comment on the overall manuscript.

Conflicts of Interest

The authors declare no conflict of interest.

References

  1. Charlson, R.J.; Schwartz, S.E.; Hales, J.M.; Cess, R.D.; Coakley, J.A.; Hansen, J.E.; Hofmann, D.J. Climate Forcing by Anthropogenic Aerosols. Science 1992, 255, 423–430. [Google Scholar] [CrossRef] [PubMed]
  2. Schwartz, S.E. The Whitehouse Effect—Shortwave Radiative Forcing of Climate by Anthropogenic Aerosols: An Overview. J. Aerosol Sci. 1996, 27, 359–382. [Google Scholar] [CrossRef]
  3. Chýlek, P.; Wong, J. Effect of Absorbing Aerosol on Global Radiation Budget. Geophys. Res. Lett. 1995, 22, 929–931. [Google Scholar] [CrossRef]
  4. Hassan, T.; Moosmüller, H.; Chung, C.E. Coefficients of an Analytical Aerosol Forcing Equation Determined with a Monte-Carlo Radiation Model. J. Quant. Spectrosc. Radiat. Transf. 2015, 164, 129–136. [Google Scholar] [CrossRef]
  5. Moosmüller, H.; Ogren, J.A. Parameterization of the Aerosol Upscatter Fraction as Function of the Backscatter Fraction and Their Relationships to the Asymmetry Parameter for Radiative Transfer Calculations. Atmosphere 2017, 8. [Google Scholar] [CrossRef]
  6. Moosmüller, H.; Sorensen, C.M. Small and Large Particle Limits of Single Scattering Albedo for Homogeneous, Spherical Particles. J. Quant. Spectrosc. Radiat. Transf. 2018, 204, 250–255. [Google Scholar] [CrossRef]
  7. Coakley, J.A.; Bernstein, R.L.; Durkee, P.A. Effect of Ship-Stack Effluents on Cloud Reflectivity. Science 1987, 237, 1020–1022. [Google Scholar] [CrossRef] [PubMed]
  8. Twomey, S. The Influence of Pollution on the Shortwave Albedo of Clouds. J. Atmos. Sci. 1977, 34, 1149–1152. [Google Scholar] [CrossRef]
  9. Haywood, J.M.; Ramaswamy, V. Global Sensitivity Studies of the Direct Radiative Forcing due to Anthropogenic Sulfate and Black Carbon Aerosol. J. Geophys. Res. 1998, 103, 6043–6058. [Google Scholar] [CrossRef]
  10. Lack, D.A.; Moosmüller, H.; McMeeking, G.R.; Chakrabarty, R.K.; Baumgardner, D. Characterizing Elemental, Equivalent Black, and Refractory Black Carbon Aerosol Particles: A Review of Techniques, Their Limitations and Uncertainties. Anal. Bioanal. Chem. 2014, 406, 99–122. [Google Scholar] [CrossRef] [PubMed]
  11. Bond, T.; Bergstrom, R. Light Absorption by Carbonaceous Particles: An Investigative Review. Aerosol Sci. Tech. 2006, 40, 27–67. [Google Scholar] [CrossRef]
  12. Ramanathan, V.; Chung, C.; Kim, D.; Bettge, T.; Buja, L.; Kiehl, J.T.; Washington, W.M.; Fu, Q.; Sikka, D.R.; Wild, M. Atmospheric Brown Clouds: Impacts on South Asian Climate and Hydrological Cycle. Proc. Natl. Acad. Sci. USA 2005, 102, 5326–5333. [Google Scholar] [CrossRef] [PubMed]
  13. Bond, T.C.; Doherty, S.J.; Fahey, D.W.; Forster, P.M.; Berntsen, T.; DeAngelo, B.J.; Flanner, M.G.; Ghan, S.; Kärcher, B.; Koch, D.; et al. Bounding the Role of Black Carbon in the Climate System: A Scientific Assessment. J. Geophys. Res. 2013, 118, 5380–5552. [Google Scholar] [CrossRef] [Green Version]
  14. Andreae, M.O.; Gelencsér, A. Black Carbon or Brown Carbon? The Nature of Light-Absorbing Carbonaceous Aerosols. Atmos. Chem. Phys. 2006, 6, 3131–3148. [Google Scholar]
  15. Barnard, J.C.; Volkamer, R.; Kassianov, E.I. Estimation of the Mass Absorption Cross Section of the Organic Carbon Component of Aerosols in the Mexico City Metropolitan Area. Atmos. Chem. Phys. 2008, 8, 6665–6679. [Google Scholar] [CrossRef]
  16. Chakrabarty, R.K.; Moosmüller, H.; Chen, L.-W.A.; Lewis, K.; Arnott, W.P.; Mazzoleni, C.; Dubey, M.K.; Wold, C.E.; Hao, W.M.; Kreidenweis, S.M. Brown Carbon in Tar Balls from Smoldering Biomass Combustion. Atmos. Chem. Phys. 2010, 10, 6363–6370. [Google Scholar] [CrossRef]
  17. Flowers, B.A.; Dubey, M.K.; Mazzoleni, C.; Stone, E.A.; Schauer, J.J.; Kim, S.-W.; Yoon, S.C. Optical-Chemical-Microphysical Relationships and Closure Studies for Mixed Carbonaceous Aerosols Observed at Jeju Island; 3-Laser Photoacoustic Spectrometer, Particle Sizing, and Filter Analysis. Atmos. Chem. Phys. 2010, 10, 10387–10398. [Google Scholar] [CrossRef]
  18. Gyawali, M.; Arnott, W.P.; Lewis, K.; Moosmüller, H. In Situ Aerosol Optics in Reno, NV, USA during and after the Summer 2008 California Wildfires and the Influence of Absorbing and Non-Absorbing Organic Coatings on Spectral Light Absorption. Atmos. Chem. Phys. 2009, 9, 8007–8015. [Google Scholar] [CrossRef]
  19. Kirchstetter, T.W.; Novakov, T.; Hobbs, P.V. Evidence that the Spectral Dependence of Light Absorption by Aerosols is Affected by Organic Carbon. J. Geophys. Res. 2004, 109. [Google Scholar] [CrossRef]
  20. Lack, D.A.; Langridge, J.M.; Bahreini, R.; Cappa, C.D.; Middlebrook, A.M.; Schwarz, J.P. Brown Carbon and Internal Mixing in Biomass Burning Particles. Proc. Natl. Acad. Sci. USA 2012, 109, 14802–14807. [Google Scholar] [CrossRef] [PubMed]
  21. Lewis, K.; Arnott, W.P.; Moosmüller, H.; Wold, C.E. Strong Spectral Variation of Biomass Smoke Light Absorption and Single Scattering Albedo Observed with a Novel Dual-Wavelength Photoacoustic Instrument. J. Geophys. Res. 2008, 113. [Google Scholar] [CrossRef]
  22. Zhang, Q.; Jimenez, J.L.; Canagaratna, M.R.; Allan, J.D.; Coe, H.; Ulbrich, I.; Alfarra, M.R.; Takami, A.; Middlebrook, A.M.; Sun, Y.L.; et al. Ubiquity and Dominance of Oxygenated Species in Organic Aerosols in Anthropogenically-Influenced Northern Hemisphere Midlatitudes. Geophys. Res. Lett. 2007, 34. [Google Scholar] [CrossRef]
  23. IPCC. Climate Change 2013: The Physical Science Basis. Contribution of Working Group I to the Fifth Assessment Report of the Intergovernmental Panel on Climate Change; Stocker, T.F., Qin, D., Plattner, G.-K., Tignor, M., Allen, S.K., Boschung, J., Nauels, A., Xia, Y., Bex, V., Midgley, P.M., Eds.; Cambridge University Press: Cambridge, UK; New York, NY, USA, 2013. [Google Scholar]
  24. Zaveri, R.A.; Shaw, W.J.; Cziczo, D.J.; Schmid, B.; Ferrare, R.A.; Alexander, M.L.; Alexandrov, M.; Alvarez, R.J.; Arnott, W.P.; Atkinson, D.B.; et al. Overview of the 2010 Carbonaceous Aerosols and Radiative Effects Study (CARES). Atmos. Chem. Phys. 2012, 12, 7647–7687. [Google Scholar] [CrossRef] [Green Version]
  25. Fast, J.D.; Gustafson, W.I., Jr.; Berg, L.K.; Shaw, W.J.; Pekour, M.; Shrivastava, M.; Barnard, J.C.; Ferrare, R.A.; Hostetler, C.A.; Hair, J.A.; et al. Transport and Mixing Patterns over Central California during the Carbonaceous Aerosol and Radiative Effects Study (CARES). Atmos. Chem. Phys. 2012, 12, 1759–1783. [Google Scholar] [CrossRef]
  26. Shilling, J.E.; Zaveri, R.A.; Fast, J.D.; Kleinman, L.; Alexander, M.L.; Canagaratna, M.R.; Fortner, E.; Hubbe, J.M.; Jayne, J.T.; Sedlacek, A.; et al. Enhanced SOA Formation from Mixed Anthropogenic and Biogenic Emissions during the CARES Campaign. Atmos. Chem. Phys. 2013, 13, 2091–2113. [Google Scholar] [CrossRef]
  27. Setyan, A.; Zhang, Q.; Merkel, M.; Knighton, W.B.; Sun, Y.; Song, C.; Shilling, J.E.; Onasch, T.B.; Herndon, S.C.; Worsnop, D.R.; et al. Characterization of Submicron Particles Influenced by Mixed Biogenic and Anthropogenic Emissions Using High-Resolution Aerosol Mass Spectrometry: Results from CARES. Atmos. Chem. Phys. 2012, 12, 8131–8156. [Google Scholar] [CrossRef] [Green Version]
  28. Setyan, A.; Song, C.; Merkel, M.; Knighton, W.B.; Onasch, T.B.; Canagaratna, M.R.; Worsnop, D.R.; Wiedensohler, A.; Shilling, J.E.; Zhang, Q. Chemistry of New Particle Growth in Mixed Urban and Biogenic Emissions—Insights from CARES. Atmos. Chem. Phys. 2014, 14, 6477–6494. [Google Scholar] [CrossRef]
  29. Cappa, C.D.; Onasch, T.B.; Massoli, P.; Worsnop, D.R.; Bates, T.S.; Cross, E.S.; Davidovits, P.; Hakala, J.; Hayden, K.L.; Jobson, B.T.; et al. Radiative Absorption Enhancements Due to the Mixing State of Atmospheric Black Carbon. Science 2012, 337, 1078–1081. [Google Scholar] [CrossRef] [PubMed]
  30. Kassianov, E.; Pekour, M.; Barnard, J. Aerosols in Central California: Unexpectedly Large Contribution of Coarse Mode to Aerosol Radiative Forcing. Geophys. Res. Lett. 2012, 39. [Google Scholar] [CrossRef]
  31. Moffet, R.C.; Prather, K.A. In-Situ Measurements of the Mixing State and Optical Properties of Soot with Implications for Radiative Forcing Estimates. Proc. Natl. Acad. Sci. USA 2009, 106, 11872–11877. [Google Scholar] [CrossRef] [PubMed]
  32. China, S.; Scarnato, B.; Owen, R.C.; Zhang, B.; Ampadu, M.T.; Kumar, S.; Dzepina, K.; Dziobak, M.P.; Fialho, P.; Perlinger, J.A.; et al. Morphology and Mixing State of Aged Soot Particles at a Remote Marine Free Troposphere Site: Implications for Optical Properties. Geophys. Res. Lett. 2015, 42, 1243–1250. [Google Scholar] [CrossRef]
  33. Liu, S.; Aiken, A.C.; Gorkowski, K.; Dubey, M.K.; Cappa, C.D.; Williams, L.R.; Herndon, S.C.; Massoli, P.; Fortner, E.C.; Chhabra, P.S.; et al. Enhanced Light Absorption by Mixed Source Black and Brown Carbon Particles in UK Winter. Nat. Commun. 2015, 6. [Google Scholar] [CrossRef] [PubMed] [Green Version]
  34. Lack, D.A.; Cappa, C.D. Impact of Brown and Clear Carbon on Light Absorption Enhancement, Single Scatter Albedo and Absorption Wavelength Dependence of Black Carbon. Atmos. Chem. Phys. 2010, 10, 4207–4220. [Google Scholar] [CrossRef] [Green Version]
  35. Cross, E.S.; Onasch, T.B.; Ahern, A.; Wrobel, W.; Slowik, J.G.; Olfert, J.; Lack, D.A.; Massoli, P.; Cappa, C.D.; Schwarz, J.P.; et al. Soot Particle Studies—Instrument Inter-Comparison—Project Overview. Aerosol Sci. Technol. 2010, 44, 592–611. [Google Scholar] [CrossRef]
  36. Arnott, W.P.; Moosmüller, H.; Rogers, C.F.; Jin, T.; Bruch, R. Photoacoustic Spectrometer for Measuring Light Absorption by Aerosol: Instrument Description. Atmos. Environ. 1999, 33, 2845–2852. [Google Scholar] [CrossRef]
  37. Moosmüller, H.; Chakrabarty, R.K.; Arnott, W.P. Aerosol Light Absorption and its Measurement: A Review. J. Quant. Spectrosc. Radiat. Transf. 2009, 110, 844–878. [Google Scholar] [CrossRef]
  38. Abu-Rahmah, A.; Arnott, W.P.; Moosmüller, H. Integrating Nephelometer with a Low Truncation Angle and an Extended Calibration Scheme. Meas. Sci. Technol. 2006, 17, 1723–1732. [Google Scholar] [CrossRef]
  39. Moosmüller, H.; Arnott, W.P. Angular Truncation Errors in Integrating Nephelometry. Rev. Sci. Instrum. 2003, 74, 3492–3501. [Google Scholar] [CrossRef]
  40. Gyawali, M.; Arnott, W.P.; Zaveri, R.A.; Song, C.; Moosmüller, H.; Liu, L.; Mishchenko, M.I.; Chen, L.-W.A.; Green, M.C.; Watson, J.G.; et al. Photoacoustic Optical Properties at UV, VIS, and Near IR Wavelengths for Laboratory Generated and Winter Time Ambient Urban Aerosols. Atmos. Chem. Phys. 2012, 12, 2587–2601. [Google Scholar] [CrossRef] [Green Version]
  41. Moosmüller, H.; Chakrabarty, R.K. Technical Note: Simple Analytical Relationships between Ångström Coefficients of Aerosol Extinction, Scattering, Absorption, and Single Scattering Albedo. Atmos. Chem. Phys. 2011, 11, 10677–10680. [Google Scholar] [CrossRef]
  42. Moosmüller, H.; Chakrabarty, R.K.; Ehlers, K.M.; Arnott, W.P. Absorption Ångström Coefficient, Brown Carbon, and Aerosols: Basic Concepts, Bulk Matter, and Spherical Particles. Atmos. Chem. Phys. 2011, 11, 1217–1225. [Google Scholar] [CrossRef]
  43. Schwarz, J.P.; Gao, R.S.; Fahey, D.W.; Thomson, D.S.; Watts, L.A.; Wilson, J.C.; Reeves, J.M.; Darbeheshti, M.; Baumgardner, D.G.; Kok, G.L.; et al. Single-Particle Measurements of Midlatitude Black Carbon and Light-Scattering Aerosols from the Boundary Layer to the Lower Stratosphere. J. Geophys. Res. 2006, 111. [Google Scholar] [CrossRef]
  44. Subramanian, R.; Kok, G.L.; Baumgardner, D.; Clarke, A.; Shinozuka, Y.; Campos, T.L.; Heizer, C.G.; Stephens, B.B.; De Foy, B.; Voss, P.B.; et al. Black Carbon over Mexico: The Effect of Atmospheric Transport on Mixing State, Mass Absorption Cross-Section, and BC/CO Ratios. Atmos. Chem. Phys. 2010, 10, 219–237. [Google Scholar] [CrossRef]
  45. Laborde, M.; Mertes, P.; Zieger, P.; Dommen, J.; Baltensperger, U.; Gysel, M. Sensitivity of the Single Particle Soot Photometer to Different Black Carbon Types. Atmos. Meas. Tech. 2012, 5, 1031–1043. [Google Scholar] [CrossRef]
  46. Moteki, N.; Kondo, Y. Dependence of Laser-Induced Incandescence on Physical Properties of Black Carbon Aerosols: Measurements and Theoretical Interpretation. Aerosol Sci. Technol. 2010, 44, 663–675. [Google Scholar] [CrossRef]
  47. China, S.; Salvadori, N.; Mazzoleni, C. Effect of Traffic and Driving Characteristics on Morphology of Atmospheric Soot Particles at Freeway On-Ramps. Environ. Sci. Technol. 2014, 48, 3128–3135. [Google Scholar] [CrossRef] [PubMed]
  48. Bevington, P.R. Data Reduction and Error Analysis for the Physical Sciences; McGraw-Hill: New York, NY, USA, 1969. [Google Scholar]
  49. Lewis, K.A. Development of a Dual-Wavelength Photoacoustic Instrument for Measurement of Light Absorption and Scattering by Aerosol and Gases in Atmospheric Science Program. Doctoral Thesis, University of Nevada, Reno, NV, USA, May 2007. [Google Scholar]
  50. Arnott, W.P.; Moosmüller, H.; Walker, J.W. Nitrogen Dioxide and Kerosene-Flame Soot Calibration of Photoacoustic Instruments for Measurement of Light Absorption by Aerosols. Rev. Sci. Instrum. 2000, 71, 4545–4552. [Google Scholar] [CrossRef]
  51. China, S.; Mazzoleni, C.; Gorkowski, K.; Aiken, A.C.; Dubey, M.K. Morphology and Mixing State of Individual Freshly Emitted Wildfire Carbonaceous Particles. Nat. Commun. 2013, 4. [Google Scholar] [CrossRef] [PubMed]
  52. Andreae, M.O.; Crutzen, P.J. Atmospheric Aerosols: Biogeochemical Sources and Role in Atmospheric Chemistry. Science 1997, 276, 1052–1058. [Google Scholar] [CrossRef]
  53. Worton, D.R.; Goldstein, A.H.; Farmer, D.K.; Docherty, K.S.; Jimenez, J.L.; Gilman, J.B.; Kuster, W.C.; De Gouw, J.; Williams, B.J.; Kreisberg, N.M.; et al. Origins and Composition of Fine Atmospheric Carbonaceous Aerosol in the Sierra Nevada Mountains, California. Atmos. Chem. Phys. 2011, 11, 10219–10241. [Google Scholar] [CrossRef]
  54. Reid, J.S.; Hobbs, P.V. Physical and Optical Properties of Young Smoke from Individual Biomass Fires in Brazil. J. Geophys. Res. 1998, 103, 32013–32030. [Google Scholar] [CrossRef]
  55. Chakrabarty, R.K.; Arnold, I.J.; Francisco, D.M.; Hatchett, B.; Hosseinpour, F.; Loria, M.; Pokharel, A.; Woody, B.M. Black and Brown Carbon Fractal Aggregates from Combustion of Two Fuels Widely Used in Asian Rituals. J. Quant. Spectrosc. Radiat. Transf. 2013, 122, 25–30. [Google Scholar] [CrossRef]
  56. Doran, C. Corrigendum to “The T1-T2 Study: Evolution of Aerosol Properties Downwind of Mexico City” published in Atmos. Chem. Phys., 7, 1585–1598, 2007. Atmos. Chem. Phys. 2007, 7, 2197–2198. [Google Scholar]
  57. Doran, J.C.; Barnard, J.C.; Arnott, W.P.; Cary, R.; Coulter, R.; Fast, J.D.; Kassianov, E.I.; Kleinman, L.; Laulainen, N.S.; Martin, T.; et al. The T1-T2 Study: Evolution of Aerosol Properties Downwind of Mexico City. Atmos. Chem. Phys. 2007, 7, 1585–1598. [Google Scholar] [CrossRef]
  58. Yang, M.; Howell, S.G.; Zhuang, J.; Huebert, B.J. Attribution of Aerosol Light Absorption to Black Carbon, Brown Carbon, and Dust in China—Interpretations of Atmospheric Measurements during EAST-AIRE. Atmos. Chem. Phys. 2009, 9, 2035–2050. [Google Scholar] [CrossRef]
  59. Engelbrecht, J.P.; Moosmüller, H.; Pincock, S.; Jayanty, P.K.M.; Lersch, T.; Casuccio, G.S. Technical Note: Mineralogical, Chemical, Morphological, and Optical Interrelationships of Mineral Dust Re-Suspensions. Atmos. Chem. Phys. 2016, 16, 10809–10830. [Google Scholar] [CrossRef]
  60. Moosmüller, H.; Engelbrecht, J.P.; Skiba, M.; Frey, G.; Chakrabarty, R.K.; Arnott, W.P. Single Scattering Albedo of Fine Mineral Dust Aerosols Controlled by Iron Concentration. J. Geophys. Res. 2012, 117. [Google Scholar] [CrossRef]
Figure 1. Location of the ground sites, T0 and T1, along with a depiction of the dominant summer daytime wind patterns.
Atmosphere 08 00217 g001
Figure 2. Daily daytime averages at T0, left panels, (12–28 June 2010) and T1, right panels, (from 2 to 28 June 2010) of: (a,b) PM1 organic mass concentration and BC mass concentration; (c,d) aerosol absorption coefficients (βabs); (e,f) absorption Ångström exponent (AAE); (g,h) aerosol scattering coefficient (βsca); (i,j) single scattering albedo (SSA); and (k,l) PM1 particle mean mobility diameter. Vertical bars (Figure 2ad,g,h,k,l) represent one standard deviation (1σ) around the mean calculated for each vertical level. The error bars in AAE and SSA (Figure 2e,f,i,j) correspond to the total uncertainty, the square root of the sum of squares of the 1σ around the mean, and the propagated error from the systematic errors (5% and 15% relative uncertainties in photoacoustic (PA) βabs measurements and reciprocal nephelometer (RN) βsca measurements, respectively). Each data point is averaged from 06:00 to 18:00 Pacific Daylight Time (PDT). The gray bar at the top indicates periods during which the synoptic wind was either southwesterly (SW) or northwesterly (NW). Semi-transparent gray shading for the NW flow periods is also shown over all the plots.
Atmosphere 08 00217 g002
Figure 3. Field emission scanning electron microscope (FE-SEM) images of particles collected at T0 (left image) and T1 (right image) sites on nuclepore membranes, illustrating a broad distribution of fractal-like BC aggregates. FE-SEM image at T0, (i) elongated fractal-like BC aggregate; (ii) fresh BC mixed with coated BC; and (iii) darker region around the BC suggesting BC coated with other material (possibly organic matter). FE-SEM image at T1, (i) open fractal-like BC aggregate; (ii) compact BC aggregate; (iii) partially-encapsulated BC with a spherical particle (top); and (iv) spherical particle. The dark circles are the holes in the collection substrate.
Atmosphere 08 00217 g003
Figure 4. Regression, mean, and median BC mass normalized absorption cross-section (MAC) versus wavelength for 22–28 June 2010 at T0 and T1. The error bars were calculated as discussed in Section 2.4. The median and mean MAC values were derived by comparing with the continuous SP2 and PA measurements of BC mass concentration and aerosol light absorption coefficient, respectively.
Atmosphere 08 00217 g004
Figure 5. Histograms of observed (left panel) and modeled (Monte Carlo, right panel) BC mass normalized absorption cross-section (MAC) overlaid with the normal distributions for 22–28 June 2010 at T0 and T1. The Monte Carlo simulation considers only the measurement uncertainties of PA and SP2. The modeled analysis represents the MAC distribution of each wavelength obtained from the regression.
Atmosphere 08 00217 g005
Table 1. Regression, mean, and median values of black carbon (BC) mass-normalized absorption cross-section (MAC) for 22–28 June 2010 at T0 and T1. Also included in the table are the standard deviation (SD) for the mean and median MAC values, and the slope error (SE) of MAC values from regression analysis. The total error in the regression MAC values is obtained by using the error propagation technique to the SE and calibration uncertainties of the photoacoustic (PA) and single particle soot photometer (SP2) instruments.
Regression MAC (m2 g−1)Mean and Median MAC (m2 g−1)
λ (nm)SlopeSlope ErrorPA Calibration ErrorSP2 Calibration ErrorPrecision ErrorMeanMedianStandard Deviation
T0 Site
37512.711.120.763.361.1715.6115.267.55
40511.610.260.793.471.4216.3015.762.74
5329.420.320.532.330.3510.5310.582.77
8708.130.170.421.830.148.218.301.62
T1 Site
35518.103.951.617.093.7935.8832.2418.90
40515.710.970.964.221.9519.2519.193.73
53210.121.030.723.150.4913.9714.304.88
8706.510.110.361.590.107.247.230.46

