Regional Impact Assessment of Monsoon Variability on Wind Power Availability and Optimization in Asia


School of Energy and Environment, City University of Hong Kong, Tat Chee Avenue, Kowloon, Hong Kong, China
*
Author to whom correspondence should be addressed.
Atmosphere 2017, 8(11), 219; https://doi.org/10.3390/atmos8110219
Submission received: 31 August 2017
/
Revised: 2 November 2017
/
Accepted: 7 November 2017
/
Published: 13 November 2017
(This article belongs to the Special Issue Energy Meteorology)
Abstract
:Recent developments have emphasized the global impacts of climate change and have renewed commitments in renewable energy and energy meteorology. Wind energy depends largely on prevailing meteorological conditions on both local and large scales, thus, wind power optimization should aid its assessment and development. This study uses ERA-Interim daily data from 1979 to 2014 to investigate the impact of the East Asian Monsoon on wind power in Asia. Wind power increase in the Bay of Bengal region as wind vectors strengthened from winter (DJF, December-January-February) to summer (JJA, June-July-August), while the predominant direction shifted to southwesterly. The influence of the South China Sea on South East Asia resulted in increased wind power that peaked in winter. Probability distribution functions for four sub-regions revealed higher probabilities of relatively lower wind speeds in JJA, except for the South East region, where most probable wind speeds were reached in winter. The capacity factor also varied by region and by season. Power generation was lowest in JJA for all the regions except the South West. The South East region also had the highest power generated over the domain. This variation of wind power impacts the amount of energy that must be supplied by non-wind sources, termed Demand Net Wind (DNW). Knowledge of DNW fluctuations thus becomes an important consideration for optimization of power plants, grid networking and reliability, and energy markets.
1. Introduction
The energy world is presently facing challenges and is consequently evolving new ways to meet these challenges. Although the forms of these challenges vary [1,2,3,4], one point of convergence is the need to keep global warming below 2 °C. Moreover, according to the Intergovernmental Panel on Climate Change Working Group 2 [5], recent decades have witnessed changes in climate that have affected natural and human systems across continents. One strategic area of response to these aforementioned challenges is renewable energy development.
Harnessing energy from renewable sources is highly dependent on the prevailing atmospheric conditions [2], especially because renewable sources are driven by the natural cycles of meteorology such as solar radiation, wind speed and direction, and wave and tidal energy. The internal variability of the earth, especially changes in atmospheric and ocean circulation patterns, would also affect renewable energy availability [3]. Renewables actually provide a low-carbon energy strategy that has been adopted globally. Wind energy has become perhaps the largest contributor to renewable energy and the global electricity supply [1], with China leading the way. From 2010, China’s growth in wind power has continued to increase, with installed capacity at 169 GW while that of the entire Asia continent was 204 GW as of the end of 2016 [6]. In addition, proposals are being made for the development of wind farms on the local and mesoscales, while research on the nature, availability, and variability of wind is also underway by environmentalists, meteorologists, and earth scientists. More recent discourse has also taken various forms, from micro-grids to regional renewable power systems. The regional system allows a connection between renewable power systems that can be shared by provinces, regions, or even nations. Of course, the dependence of renewables on climate means that the affected nations in the case of the international system must first understand the timescale variability of their respective renewable sources.
Conventionally, near-surface winds are known to vary, ranging from short, speedy gusts of a few seconds to minutes in duration to prolonged circulations that form a pattern, which itself also varies. Research into wind speed variability with respect to wind energy development has progressed from infancy [7] to short-span durations [8,9], long-term trends, wind speed prediction, and wind power production [10,11,12,13]. Although abundant works exist on wind energy development and potential, especially for its sustainable characteristics, more recent works are beginning to focus on the variable nature of wind itself [12,13]. The energy industry is a forerunner in the development of wind power and usually takes the mean wind power potential for a specific number of years as a key indicator [10], which is justifiable. However, the power output from wind turbines is also subject to the associated variability of wind vectors, which has often been described as intermittency by energy experts.
Circulation patterns usually provide insight into wind variability [7]. The seasonal reversal of wind direction near the surface of the earth is referred to as the monsoon [14]. The East Asia region (in which China lies) covers about 12 million km2 and is bounded by Russia and Mongolia to the north and South East Asia on the east. The massive region itself, the Pacific Ocean to the east, as well as the topographic details of the Tibetan Plateau, all form essential circulation-influencing elements. The land–sea thermal contrast created by these elements is the major driver for the climate in the region, termed the East Asian Monsoon, which is basically a reversal of wind flow from a southwesterly pattern to a northeasterly pattern. This reversal causes the warm and wet summer monsoon to alternate with the cold and dry winter monsoon, giving rise to two meteorological seasons, namely summer and winter. Various attempts have been made to fit these seasons to a particular time frame using various parameters such as the switch of zonal winds [15], an increase in convective activities [16], changes in precipitation patterns [17], the summation of the sea level pressure (SLP) gradient between land and sea, also called the Guo Index [18], and other conventional methods. A consensus reached, however, is that there are transitional periods for these seasons on both sides that have now been described as spring and autumn. The advance and retreat of the leading monsoon fronts in both winter and summer produce an interphase that is neither summer nor winter, thereby dividing the annual timescale into the seasons of winter, spring, summer, and autumn, which are interchangeably called astronomical seasons in certain fields.
In optimizing wind energy output, it is imperative to know whether seasonal variations exist in wind vector properties and if there is a notable pattern in such variation. Such knowledge would be valuable for the design, operation, and optimization of hybrid power systems, thereby impacting on a more efficient and reliable power supply system. By adopting a regional approach for Asia, this study advances knowledge gained from previous contributions in wind assessment studies, especially in terms of seasonal wind power availability and variability, as well regional grid interconnectivity and networking from an increased-penetration approach. Seasonal designations are winter, comprising December-January-February (DJF); spring, comprising March-April-May (MAM); summer, comprising June-July-August (JJA); and autumn, comprising September-October-November (SON). The seasonal variation in wind speed and wind power plus its impact on energy generation over the study area are fully investigated.
2. Data and Methodology
The ERA-Interim reanalysis data provided by the European Centre for Medium-Range Weather Forecasts (ECMWF) is a high-resolution database of atmospheric, climate, ocean, and hydrological dataset with global coverage from 1979 onwards [19]. For this study, the parameters listed below for the years 1979–2014 at a spatial scale of 0.5° by 0.5° on 6-hourly time-steps were utilized over the domain of 10°–60° N latitude and 70°–120° E longitude. In order to simultaneously examine regional levels and their possible impact on an interconnected system, four regions, namely North West, North East, South West, and South East/Coastal, were also studied. The topographical details of the study area as well as the locations of the regional domains selected are illustrated in Figure 1. A detailed meteorological regional division is not used, since the aim is to show in a rather unsophisticated manner the possible variations of available wind power essential for wind power optimization on regional scales. The Qinghai–Tibet plateau (>3500 m above sea level) is blacked out in the figures contained in subsequent sections.
The high spatial resolution of the dataset makes it highly suitable for wind energy studies. The ERA-Interim dataset also has the added advantage of a high vertical resolution comprising 37 levels.
- -
- Meridional wind component at 10 m and 1000 hPa to 100 hPa
- -
- Zonal wind component at 10 m and 1000 hPa to 100 hPa
- -
- Air temperature at 2 m and 1000 hPa to 100 hPa
- -
- Geopotential height at 1000 hPa to 100 hPa
- -
- Surface pressure
Wind vector data were mathematically interpolated to a height of 90 m above the surface before analysis; this corresponds to the average wind turbine base-to-hub height (50 m–120 m) used in most wind power potential assessment studies. The piecewise linear interpolation method was used following the three-step procedure highlighted in Equations (1)–(4) using parameter values from 10 m through to 100 hPa.
For a known variable (the defined parameter) s defined as
with a divided difference (gradient) Δk expressed as
and interpolant Ix defined as
from which the required value (90 m) is estimated from
Conventionally, wind power output estimation from a typical wind turbine is dependent on the wind power curve of the particular turbine. However, the concept of a simple generalized power curve (usually referred to as a wind speed power curve) has been adopted by many researchers studying wind energy, such as Pryor and Barthelmie [20], Ruiz-Arias et al. [21], and Cannon et al. [22]. The nonlinear transformation of wind speed to wind power is achieved using an index defined as the capacity factor, Cf.
The capacity factor actually expresses a ratio of the actual turbine performance to the tagged capacity of the turbine as indicated by the manufacturer over a particular period of time. The capacity factor is the selected index because it makes no assumptions as to the dimensions and efficiency of the turbine, while taking into full consideration the particular wind speed. As seen in the conceptualized wind speed power curves shown in Figure 2 based on turbine operation manuals, there are certain conditions that must be taken into account when transforming wind speed to the capacity factor:
- Cut-in speed: Usually about 3.5 m/s, the cut-in speed is the wind speed at which the turbine is unable to generate any power, as the blades are unable to move. At this speed, the capacity factor is zero.
- Rated speed: Rated speed is the speed range at which the wind turbine is expected to perform optimally, and it is given a capacity factor equivalent to 1. Most turbines have rated speeds from 15 m/s to 25 m/s.
- Cut-out speed: Pegged above 25–30 m/s (5 MW or more above the turbine rating), this is the speed at which the turbine is unable to produce any energy, as the wind speed is too high for the safe and efficient operation of the turbine. The capacity factor above the cut-out speed is equal to zero.
The mathematical expression for obtaining the capacity factor is shown in Equation (5) below with all terms clearly defined;
where A is the circular area swept by the blades, η is the efficiency of the turbine, ρ is the air density, and u is the observed wind speed. A turbine with a rotor diameter of 90 m and an estimated efficiency of 30% was adopted in this study.
3. Results and Discussion
3.1. Seasonal Monsoon Variation
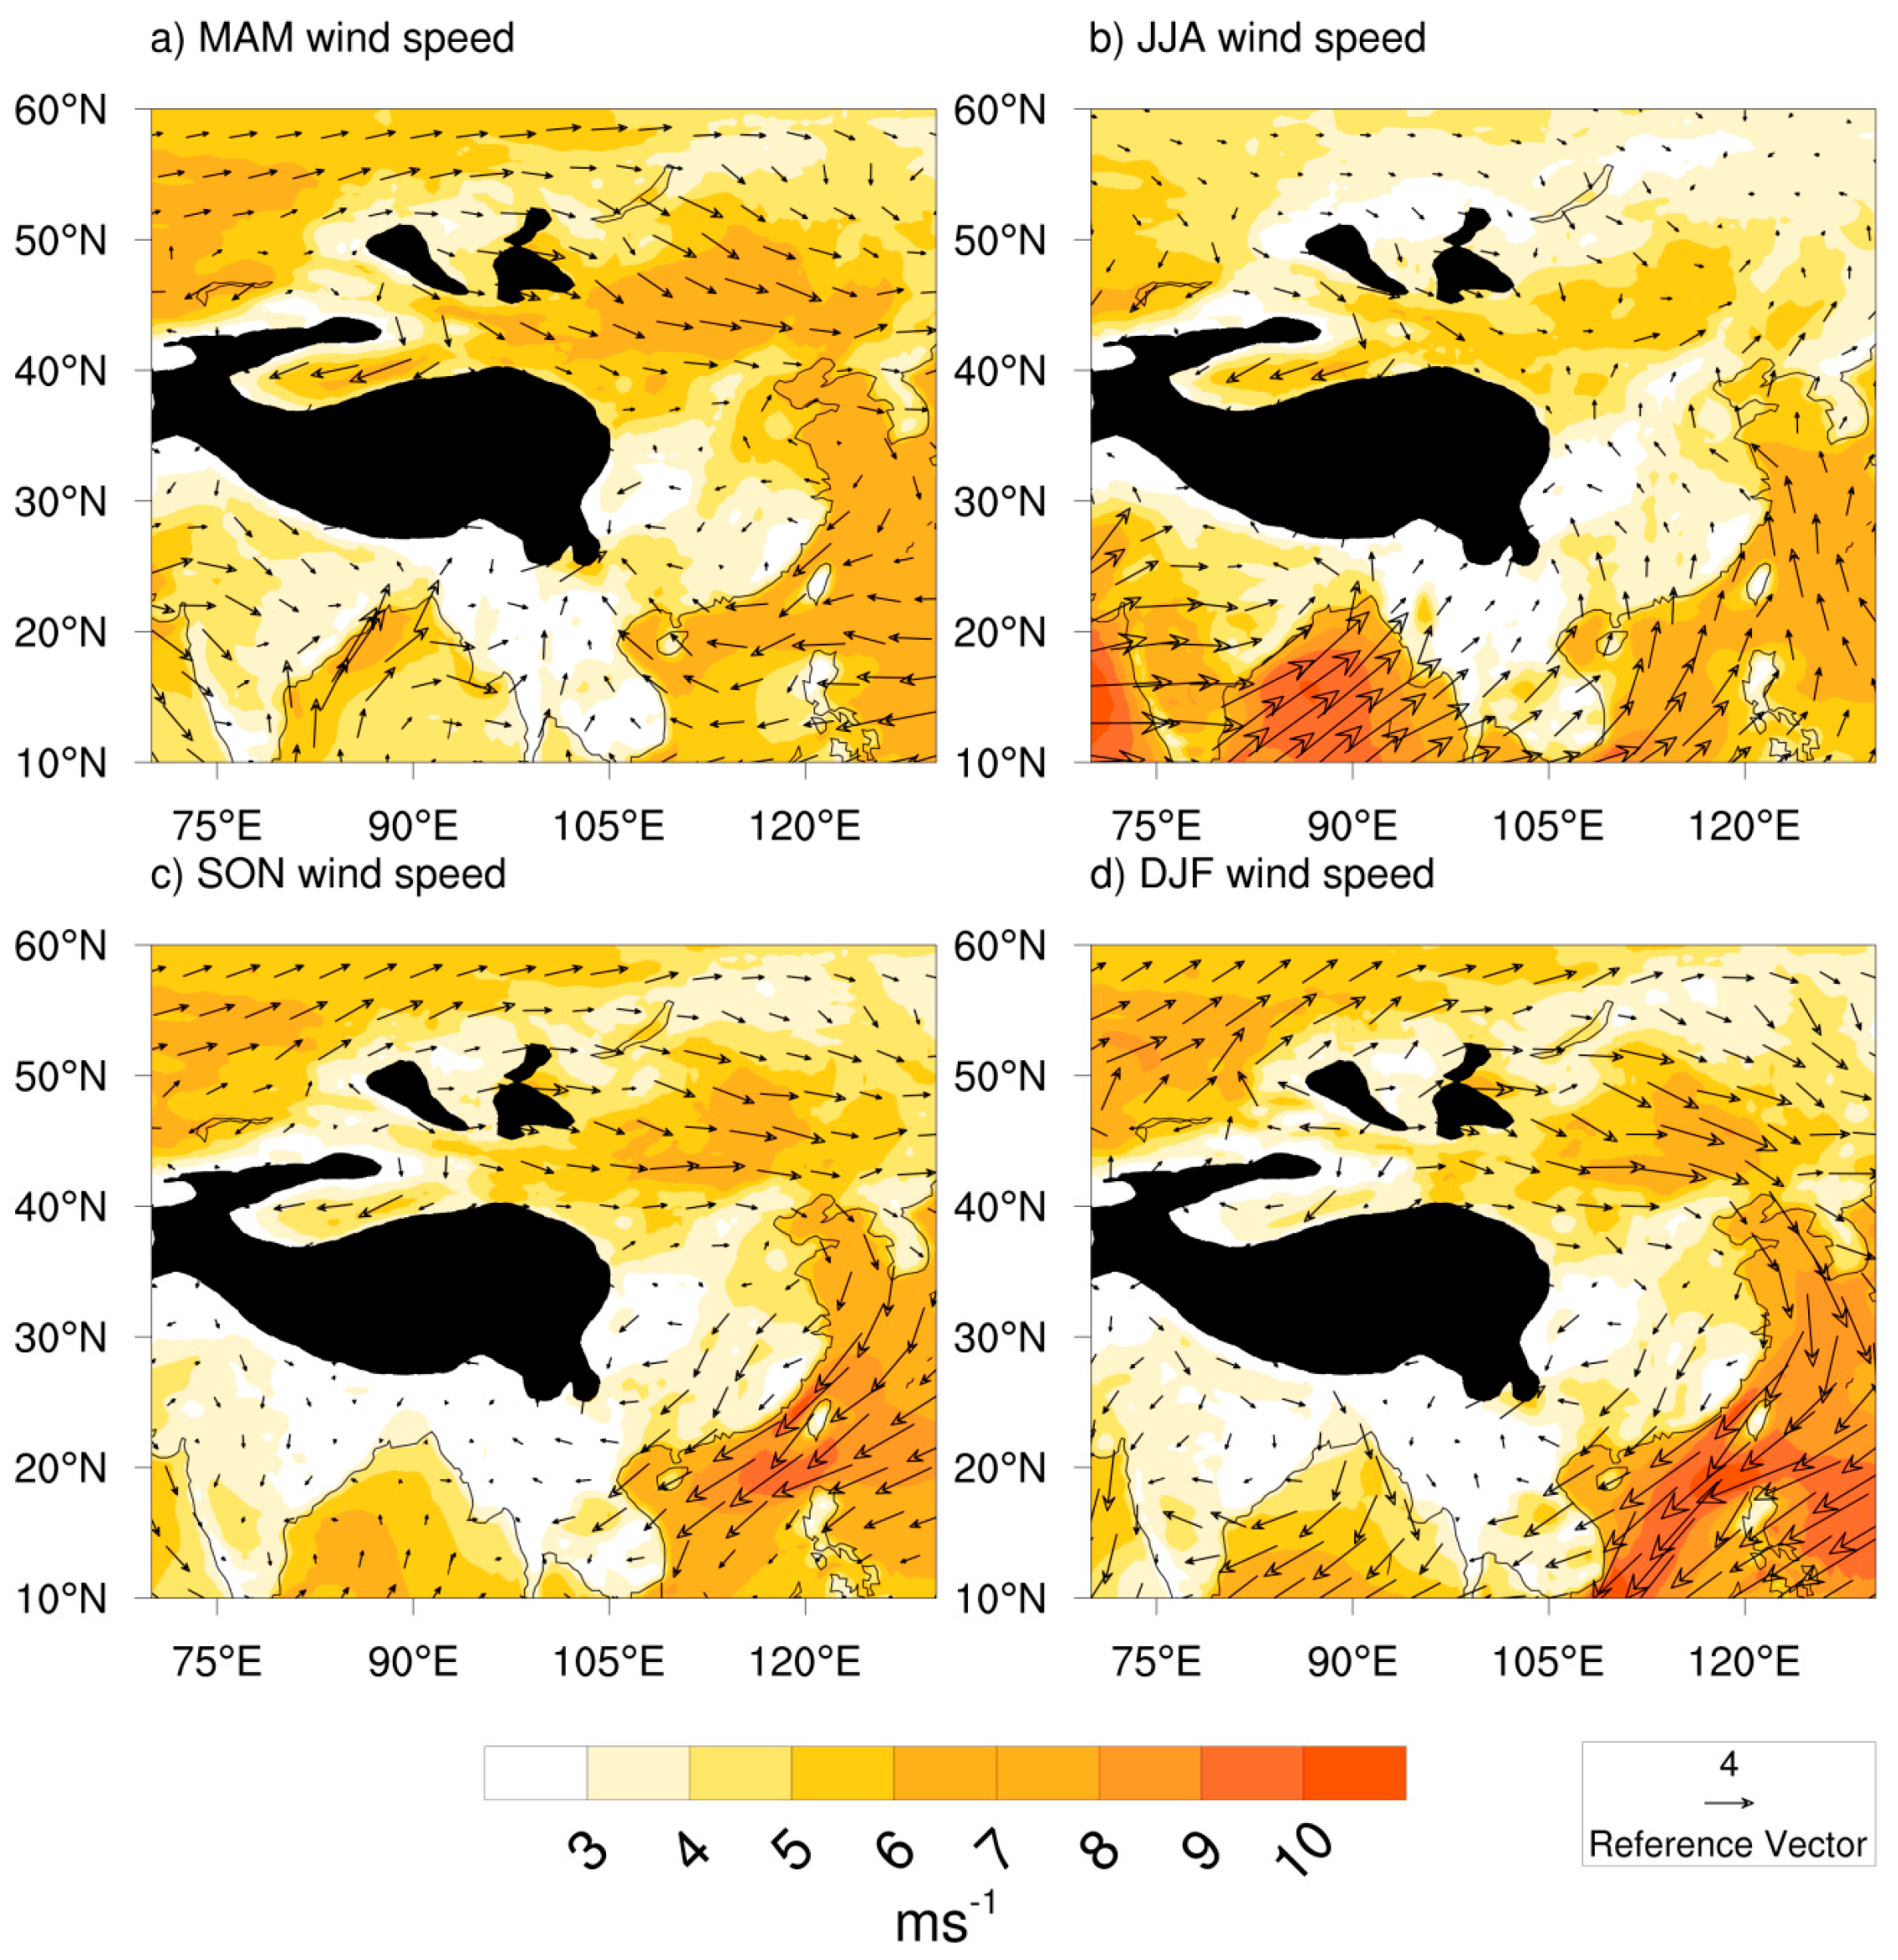
Figure 3 shows the wind climatology and vectors during the four seasons. The climatology and wind vectors over China (latitude 10°–60° N and longitude 70°–130° E) from 1979 to 2014 for the spring season (MAM) are shown in Figure 3a. Consistent with land–sea thermal contrast patterns, strong southwesterly winds around central to southern China may be directly traced to air currents originating from the Bay of Bengal (BoB) and the Arabian Sea. A countercurrent exists in eastern China, however, attributed to the influence of the neighbouring South China Sea (SCS), which also has its own attendant influence on the circulation pattern where easterly and northeasterly winds are observed. Northern China, in contrast, exhibits a strengthening westerly wind, which perhaps confirms the fact that the East Asian Monsoon comprises tropical and subtropical systems and is hence more independent of the Indian Monsoon. The southwesterly winds coincide with the arrival of the East Asian Summer Monsoon, which has been the subject of numerous studies over the last decade. A previous study by Zhou and Chan [23] surmised that the onset of the South China Sea Summer Monsoon (SCSSM) can be early e.g., on 14 April 1980 and late e.g., on 9 June 1987 over a study period of 1979–2000. The conventionally accepted fourth pentad in May (14–20 May) had the highest occurrence as an onset date. Zhang et al. [24] noted that changes in monsoonal convection and rainfall were consistent with changes in wind and circulation patterns where the monsoon onset was set at the first pentad in May, also confirming the direct relationship between monsoon commencement in May and changes in wind vector dynamics. Fong and Wang [25] observed features of abrupt change in 40-year mean pentad precipitation maps around the pentad of 16–20 May, which was thought to signal the onset of the summer monsoon. Ding [26] acknowledged a connection between the convection system over the Indian Ocean, the southern BoB, the SCS, and the subtropical West Pacific, thereby confirming the changes in circulation features during the transition from winter to summer (spring) in the BoB, Southeast Asia, and East Asia.
This strengthening over the southern and southeastern regions of the study area is more pronounced in summer (JJA), as seen in Figure 3b. The magnitude of the southwesterly wind originating from the BoB and its environs can be clearly noted, while the former easterly and northeasterly currents from the southern East China Sea witnessed in spring gradually reverse to southwesterly. Perhaps the sparseness of vectors in northern China may be attributed to the distinct nature of the summer monsoon over China. Ding [26,27] described the summer monsoon over China as comprising seasonal stepwise northward jumps, and this could thus be responsible for the vector sparseness up north. This agrees with the findings of Ding and Sun [28], who compared latitude–time cross-sections of wind vectors at 850 hPa and 200 hPa on a pentad–pentad basis from 1979 to 1999, and observed a dominance of southwesterlies from the equator to about 15° N and some midlatitude westerlies around 35° N to 50° N, whose intensity weakened significantly along with the northward advancement of the summer monsoon. Ding [26] suggests that the second northward jump from the Yangtze River basin to northern China occurs in the first 10 days of July, while the leading zone of the summer monsoon advances to its northernmost location in northeastern China around the 41st pentad (20–24 July) and its retreat starts at about the 44th pentad (5–9 August), effectively limiting the summer monsoon in northern and northeastern China to about a month, which may be responsible for the trend observed in wind vectors over northern China during JJA.
In autumn, wind speed shows a greater magnitude in the SCS domain and its coastal surroundings, as seen in Figure 3c, comprising dominant northeasterly and easterly winds. Some studies explained the quick withdrawal of the leading zone of the summer monsoon southward to the northern part of the SCS in early September, where it becomes stationary and thus marks the end of the summer monsoon in East Asia [26,28]. The predominant wind in northern China is now westerly and southwesterly, in line with the global circulation pattern of prevailing westerlies between the latitudes of ±30° and 60° caused by the alternating high-pressure and low-pressure belts above and below this region. This also suggests an alternating interaction between the Indian Ocean (BoB and Arabian Sea) and the SCS, which corroborates the findings of Ding [28], with autumn as a transition season with northerly and northeasterly winds interposed with westerly and southwesterly winds.
Winter witnesses a strengthening of the wind vectors observed in the transition period of autumn, as displayed in Figure 3d. The prevalent northeasterly wind strengthens over the coastal and inland regions of the SCS under the influence of the sea. This constitutes a total reversal of what occurred in summer, where the dominance of southwesterly winds was obtained in the lower latitudes of China. The northern region, however, still exhibits westerly winds, which weaken and strengthen along the region. Cressman [29] reported a strong eastward acceleration of jet stream wind direction for January (1968–1977), at 200 hPa, in a similar study carried out in the same region of northern China, while Chang and Lau [30] described the intensification of the winter monsoon in southern China as eventually becoming a prevailing northerly or northeasterly wind at low levels, defining this as cold surge and providing insight on how it can be measured. The influence of the midlatitude prevailing westerlies is more pronounced here than in autumn. Another area thought to contribute to the microclimate of this region is the Tibetan Plateau. The Tibetan Plateau produces an elevated heat source during summer [31,32], which considerably alters the wind circulation pattern in central China, as well as affects the East Asian Summer Monsoon. Zhao and Chen [33], using NCEP wind reanalysis data, evaluated the heat field over the Qinghai–Tibet Plateau and posited a high probability that the heat regime over that region affects the formation and variation of the Asian monsoon and interaction with the ocean. Yeh et al. [34], as cited by Chen et al. [32], stressed that a heat sink in winter and a heat source in summer are obtained in the atmosphere above the plateau, while Ding [28] also confirmed that the atmosphere above the same region acts as a heat sink during late fall and winter.
In terms of magnitude, average wind speed peaked in summer around the BoB with a value of about 9 to 10 m/s while being quite light up north at <5 m/s average wind speed. Around the coastal region and the SCS, wind speed was relatively higher at >6 m/s, possibly influenced by sea breezes and the SCS temperature gradient. Through the transition into winter, wind speed gradually rises to a peak of about 11 m/s for the coastal areas. Comparatively, peak wind speeds are observed around the BoB during summer and the SCS during winter and autumn.
3.2. Wind Power Distribution and Its Variability
The mean seasonal wind power in kW was estimated for the entire study area and ranged from 50 kW to about 200 kW, with similar trends to what was obtained in the wind climatology, as seen in Figure 4. Since wind speed contributes the most to wind power, it follows that total wind power output should vary directly with the wind speed observed over the study area. Wind power is at its peak throughout the study area in DJF, with the eastern parts of China around the coast of the East China Sea with values in excess of 160 kW. Wind energy is lowest in JJA, indicating lower mean wind speed in the study area, as compared to winter. A strengthening pattern is observed from JJA (Figure 4b) through SON (Figure 4c) to DJF (Figure 4d), before peaking in MAM (Figure 4a). This suggests that despite slightly stronger wind vectors and wind speed climatology observed in DJF during the wind vector assessment, temporal variability may affect the amount of wind energy that can be harnessed per unit time.
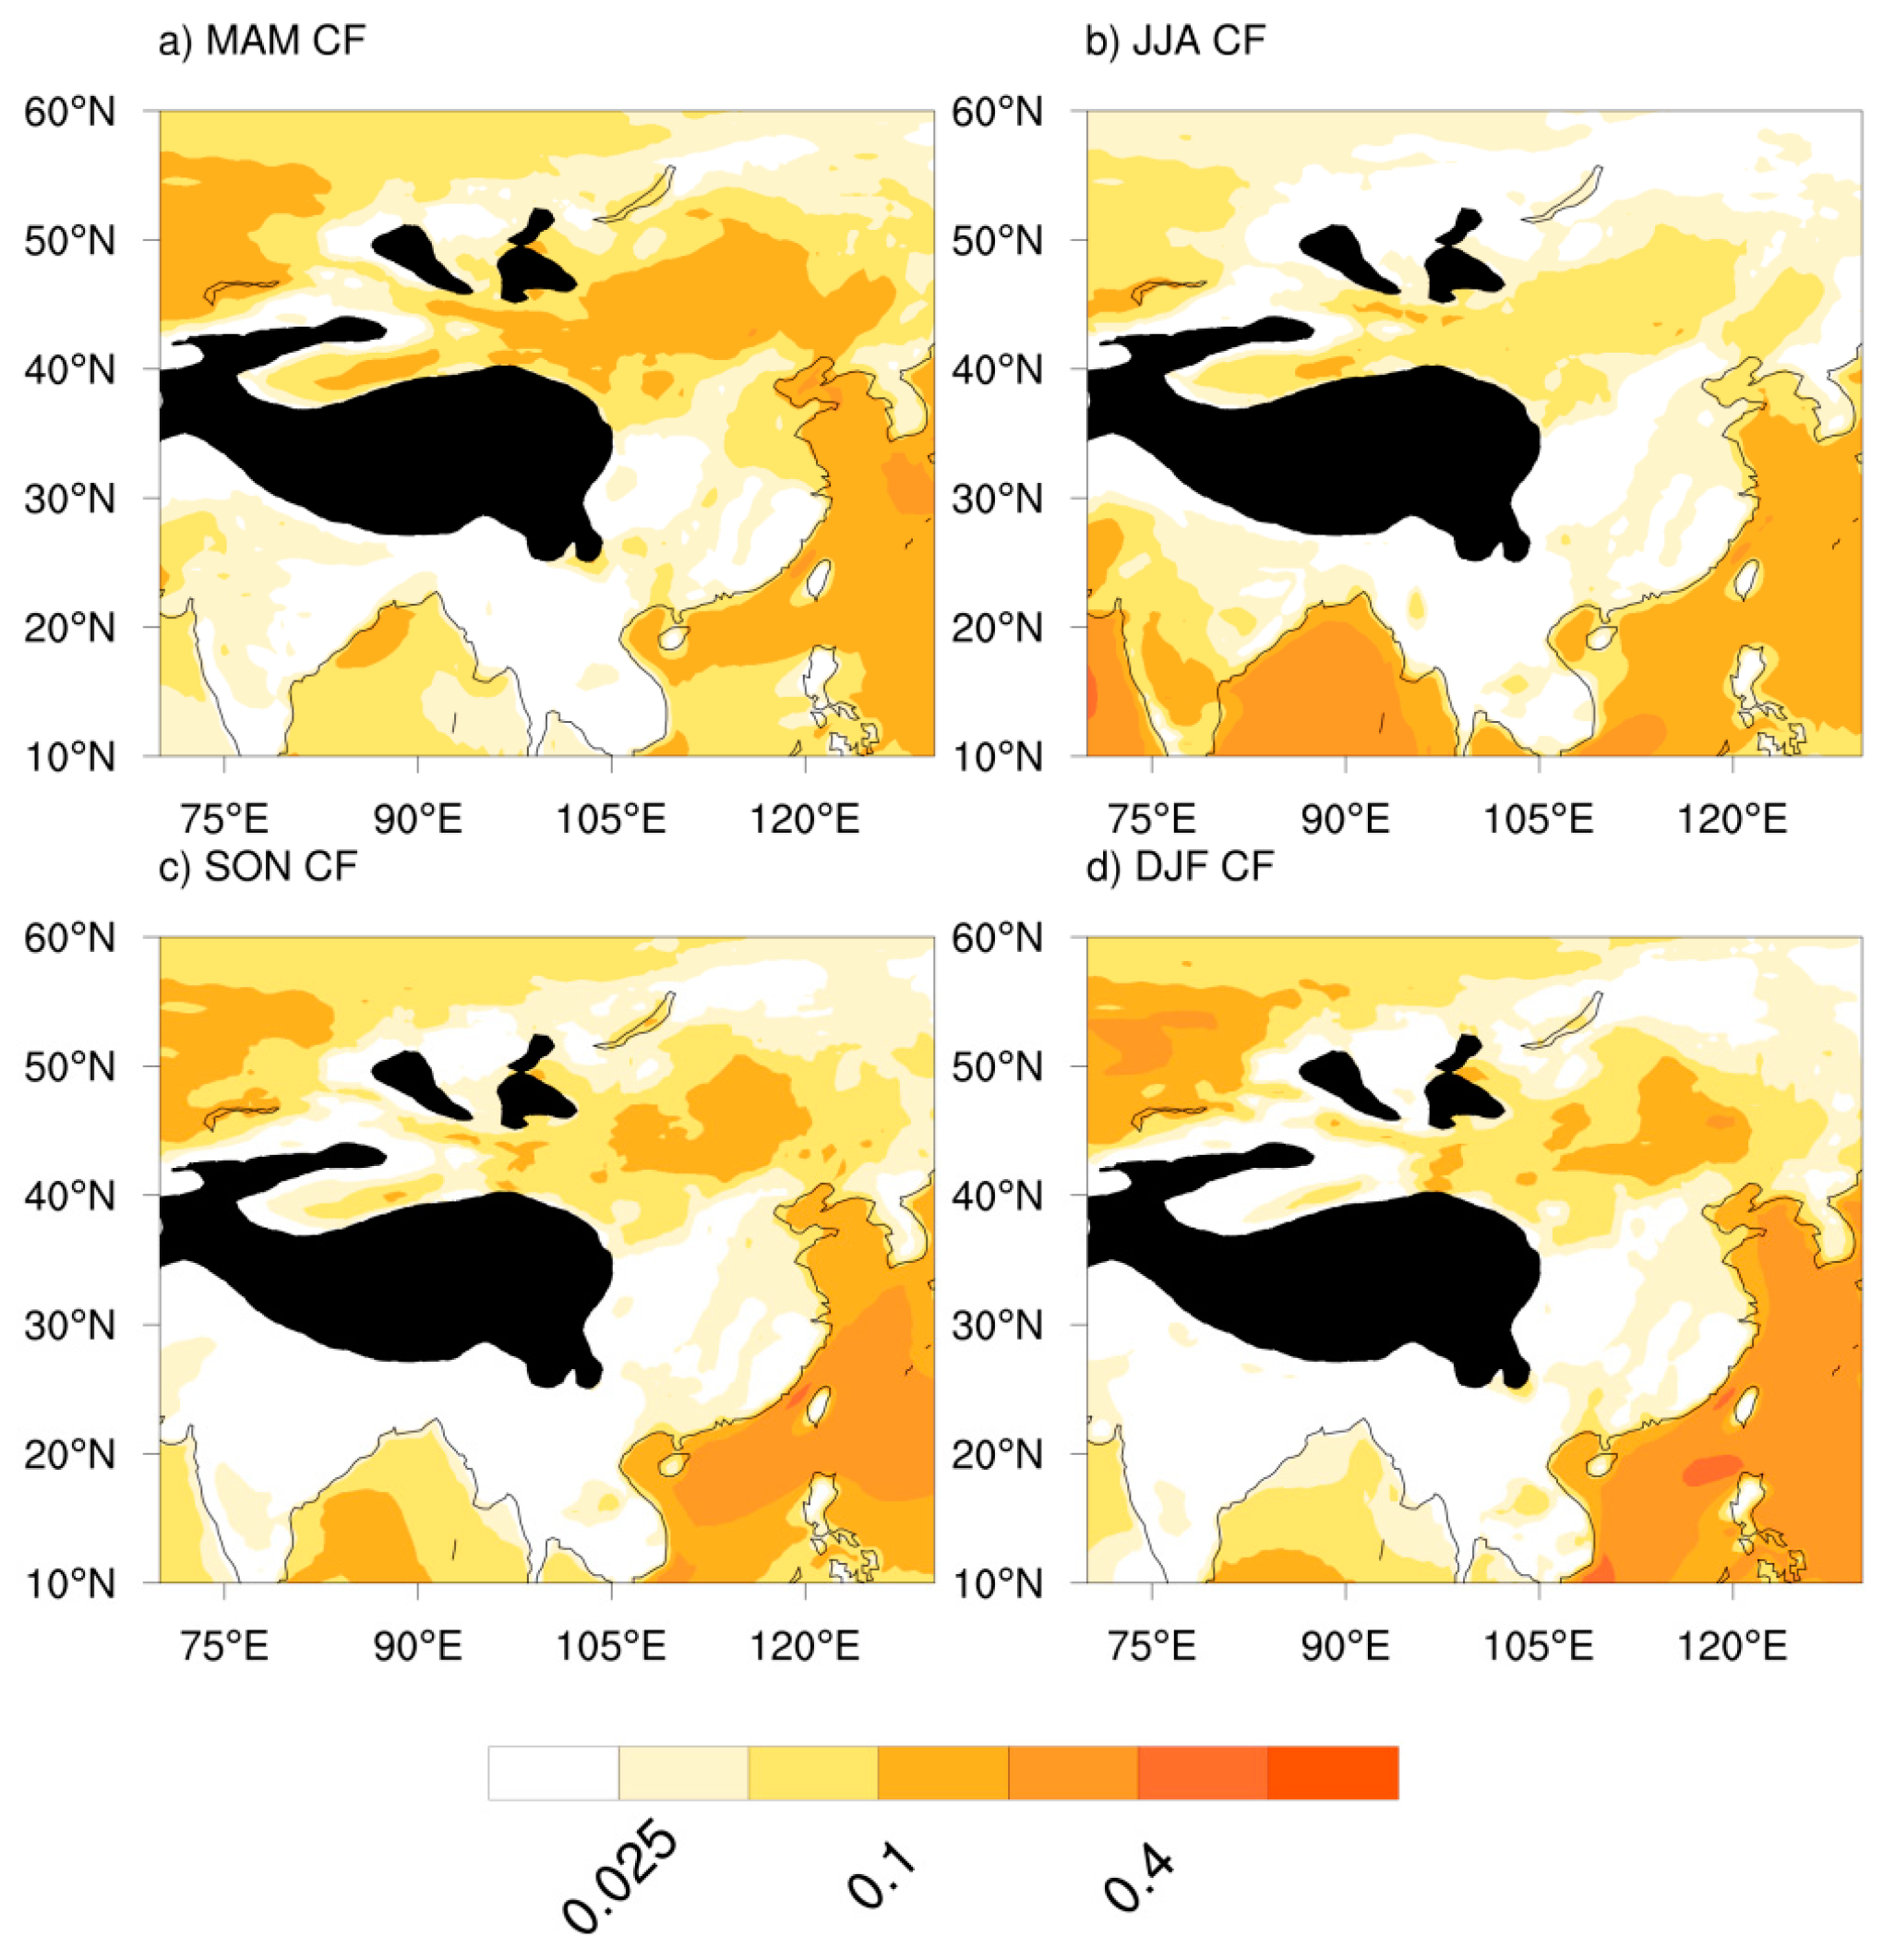
To fully explore this distribution, seasonal mean wind speed was transformed to a capacity factor, as shown in Figure 5. As highlighted earlier, the capacity factor gives an indication of the extent of utilization of a wind turbine, especially since a lot of power can be generated at the rated speed, but variable wind speeds pose a challenge. Regions of higher capacity factor indicate areas of higher utilization and also point out possible areas of larger investment in wind power development. Capacity factor ranges between 0 and 1 for corresponding wind speeds between the cut-in speed and the rated speed. Usually, these values depend on the particular turbine specifications and power rating. Capacity factors in the range of 0.2–0.5 are not uncommon in various wind power studies, due to the highly varied nature of wind vectors on various timescales. While it is most common to experience low wind speeds for a protracted period, higher wind speeds generally last for shorter periods and may come in gusts at particular locations over varied intervals [2,35,36].
The capacity factor ranges for this study region agree with the results obtained in surveyed studies. On the seasonal timescale, the capacity factor in MAM (see Figure 5a) averages about 0.2 and is more uniformly distributed over the study area. JJA in Figure 5b has a more diffuse pattern, stronger offshore from the southwest around the BoB (about 0.35) and in the East China Sea and its environs (about 0.2); however, inland values are much lower, almost exhibiting values less than 0.1. From Figure 5c, in SON, the capacity factor decreases considerably, especially in the southwest, corresponding to the major switch of wind vectors, with the eastern and southeastern region increasing to almost 0.3, while increasing in the north. The maximum capacity factor is recorded offshore around the East China Sea in DJF (Figure 5d) nearing 0.4, and it is also strong in North East Asia, although the values drop as we go inland, and this effect is quite pronounced relative to MAM, which has better inland values.
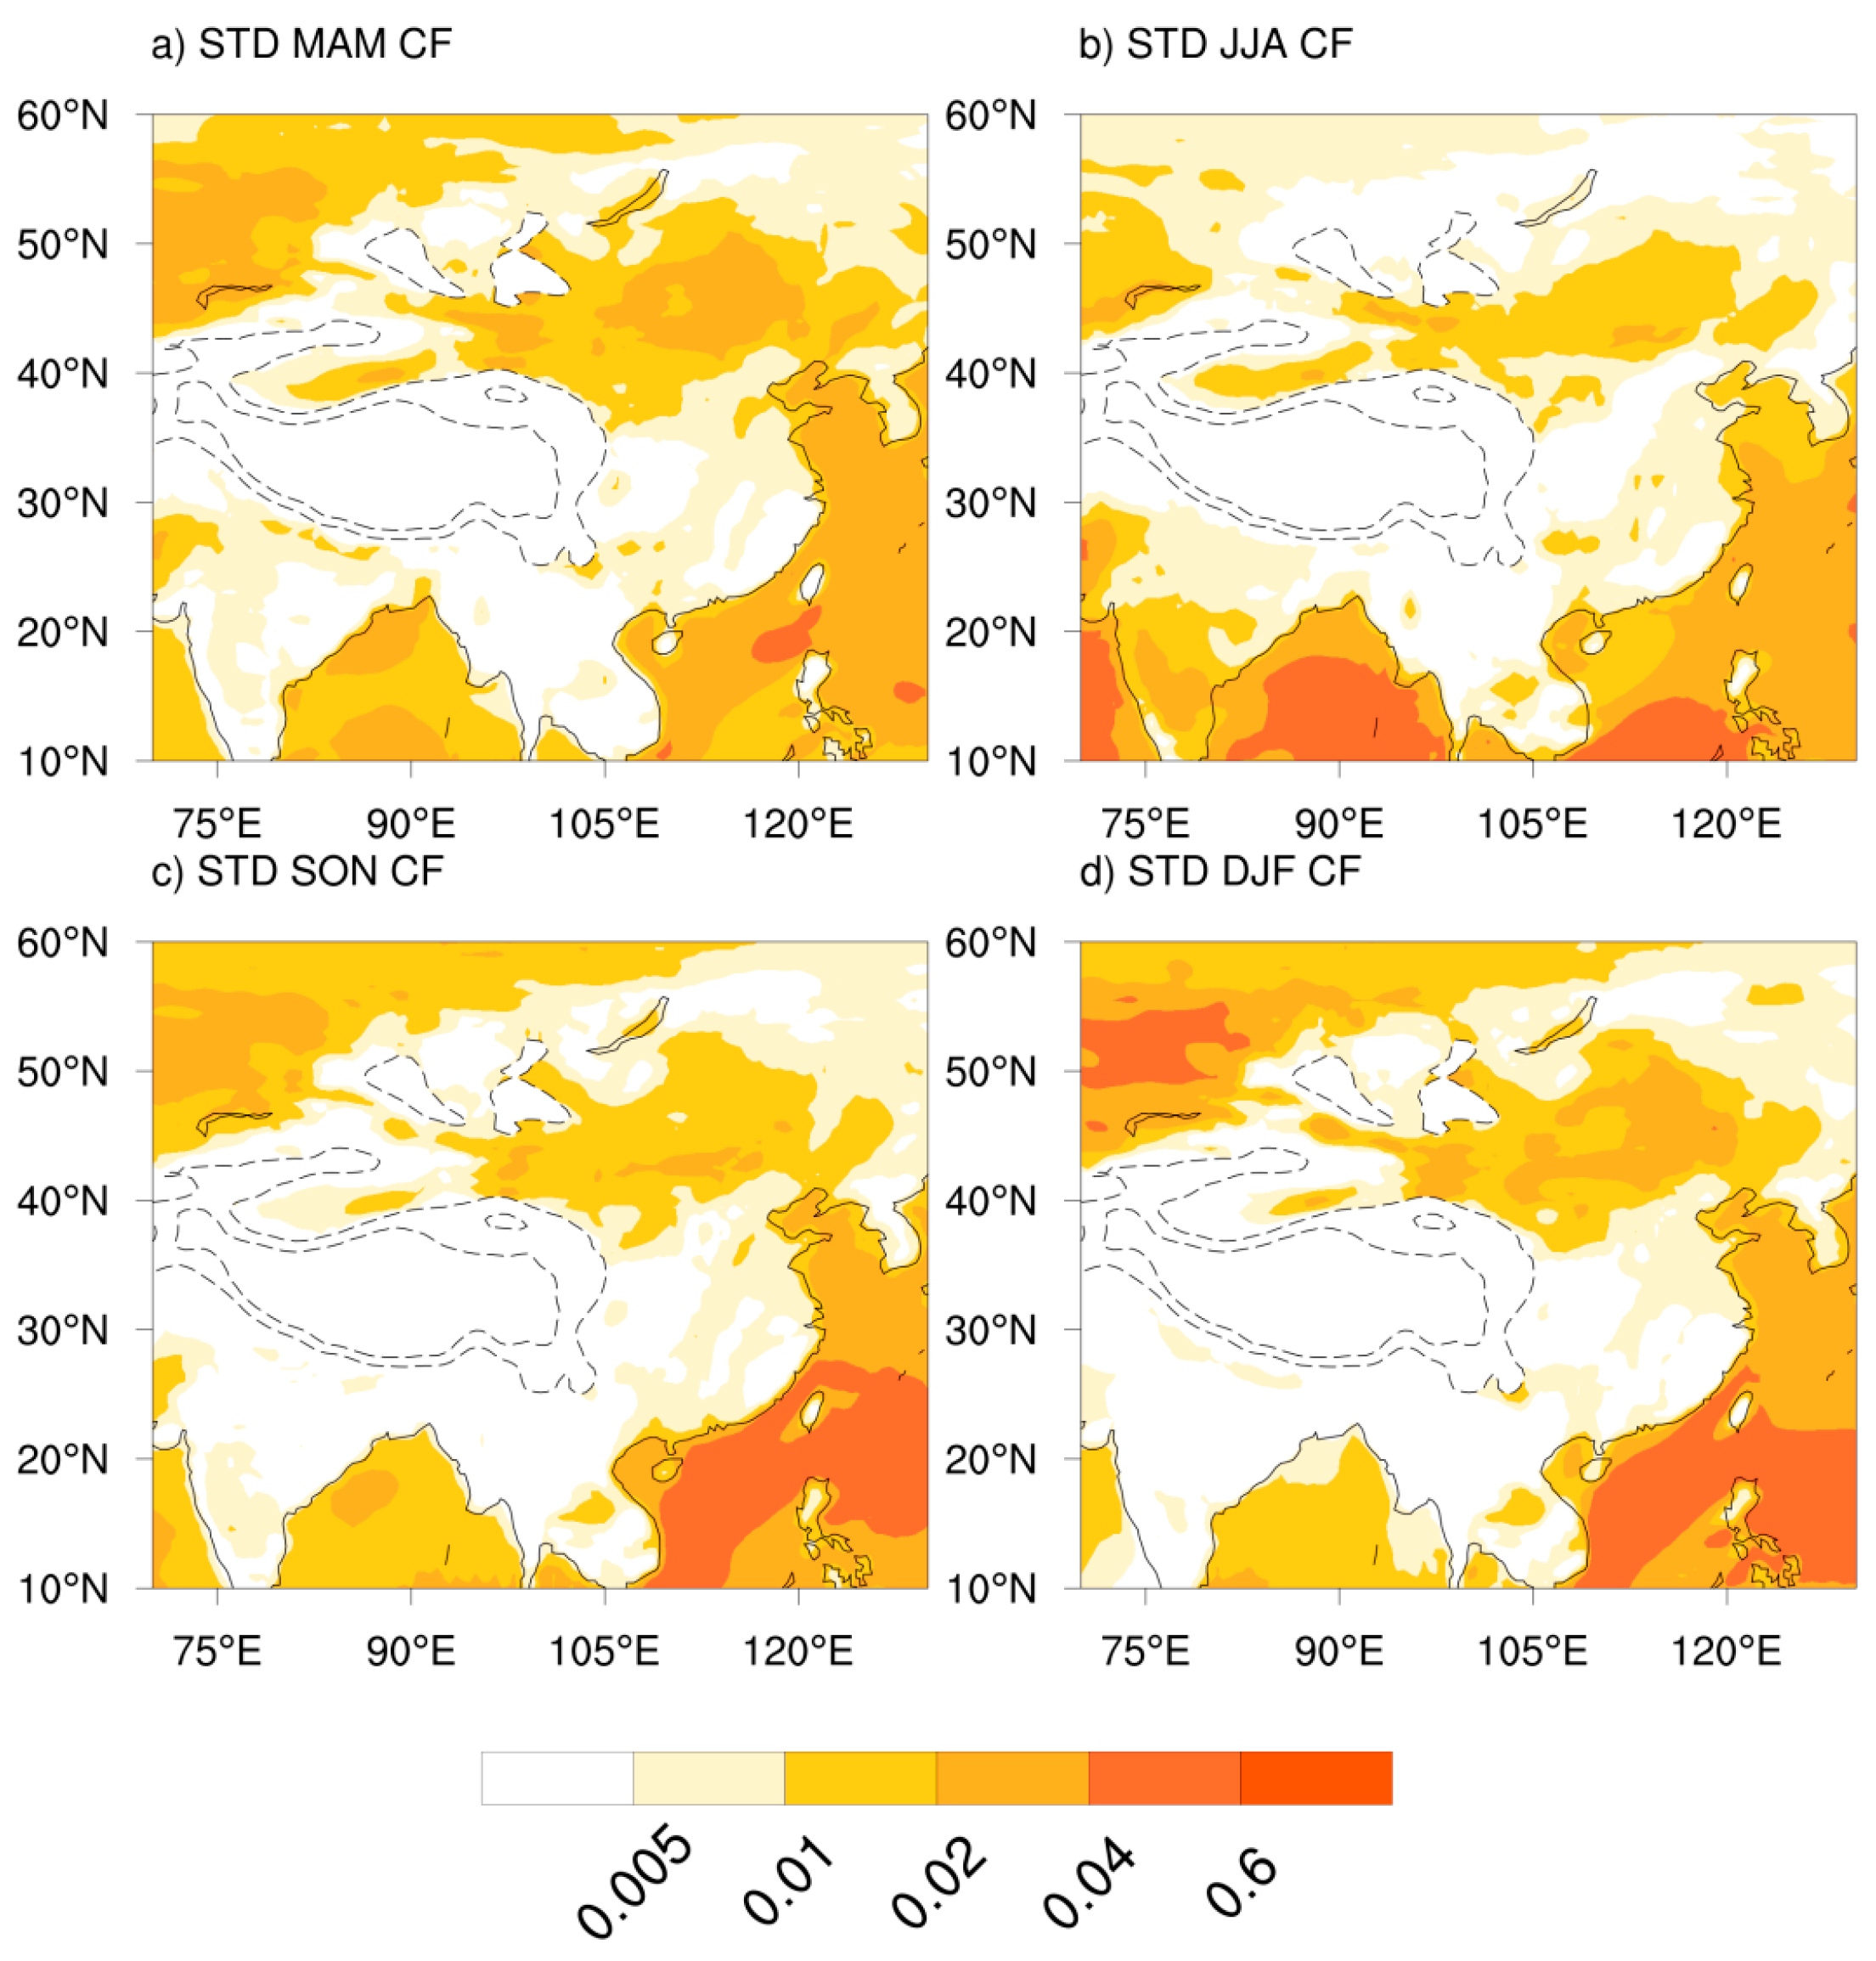
The capacity factor shown in Figure 6 varied considerably more during the summer season than the winter season, especially in the BoB region. This may directly imply less variation of wind speed in winter than in summer for this environ. The case is reversed, however, for the SCS and its environ, where a higher standard deviation is observed during winter. This reversal may be explained by the strengthening of wind vectors during the monsoon and transition seasons. All in all, the nature of the variability of wind speed and how it affects the wind power is expressed here, although further insight can be gained by exploring the wind speed distribution frequency plots using individual domains.
3.3. Wind Speed Distribution and Its Variability
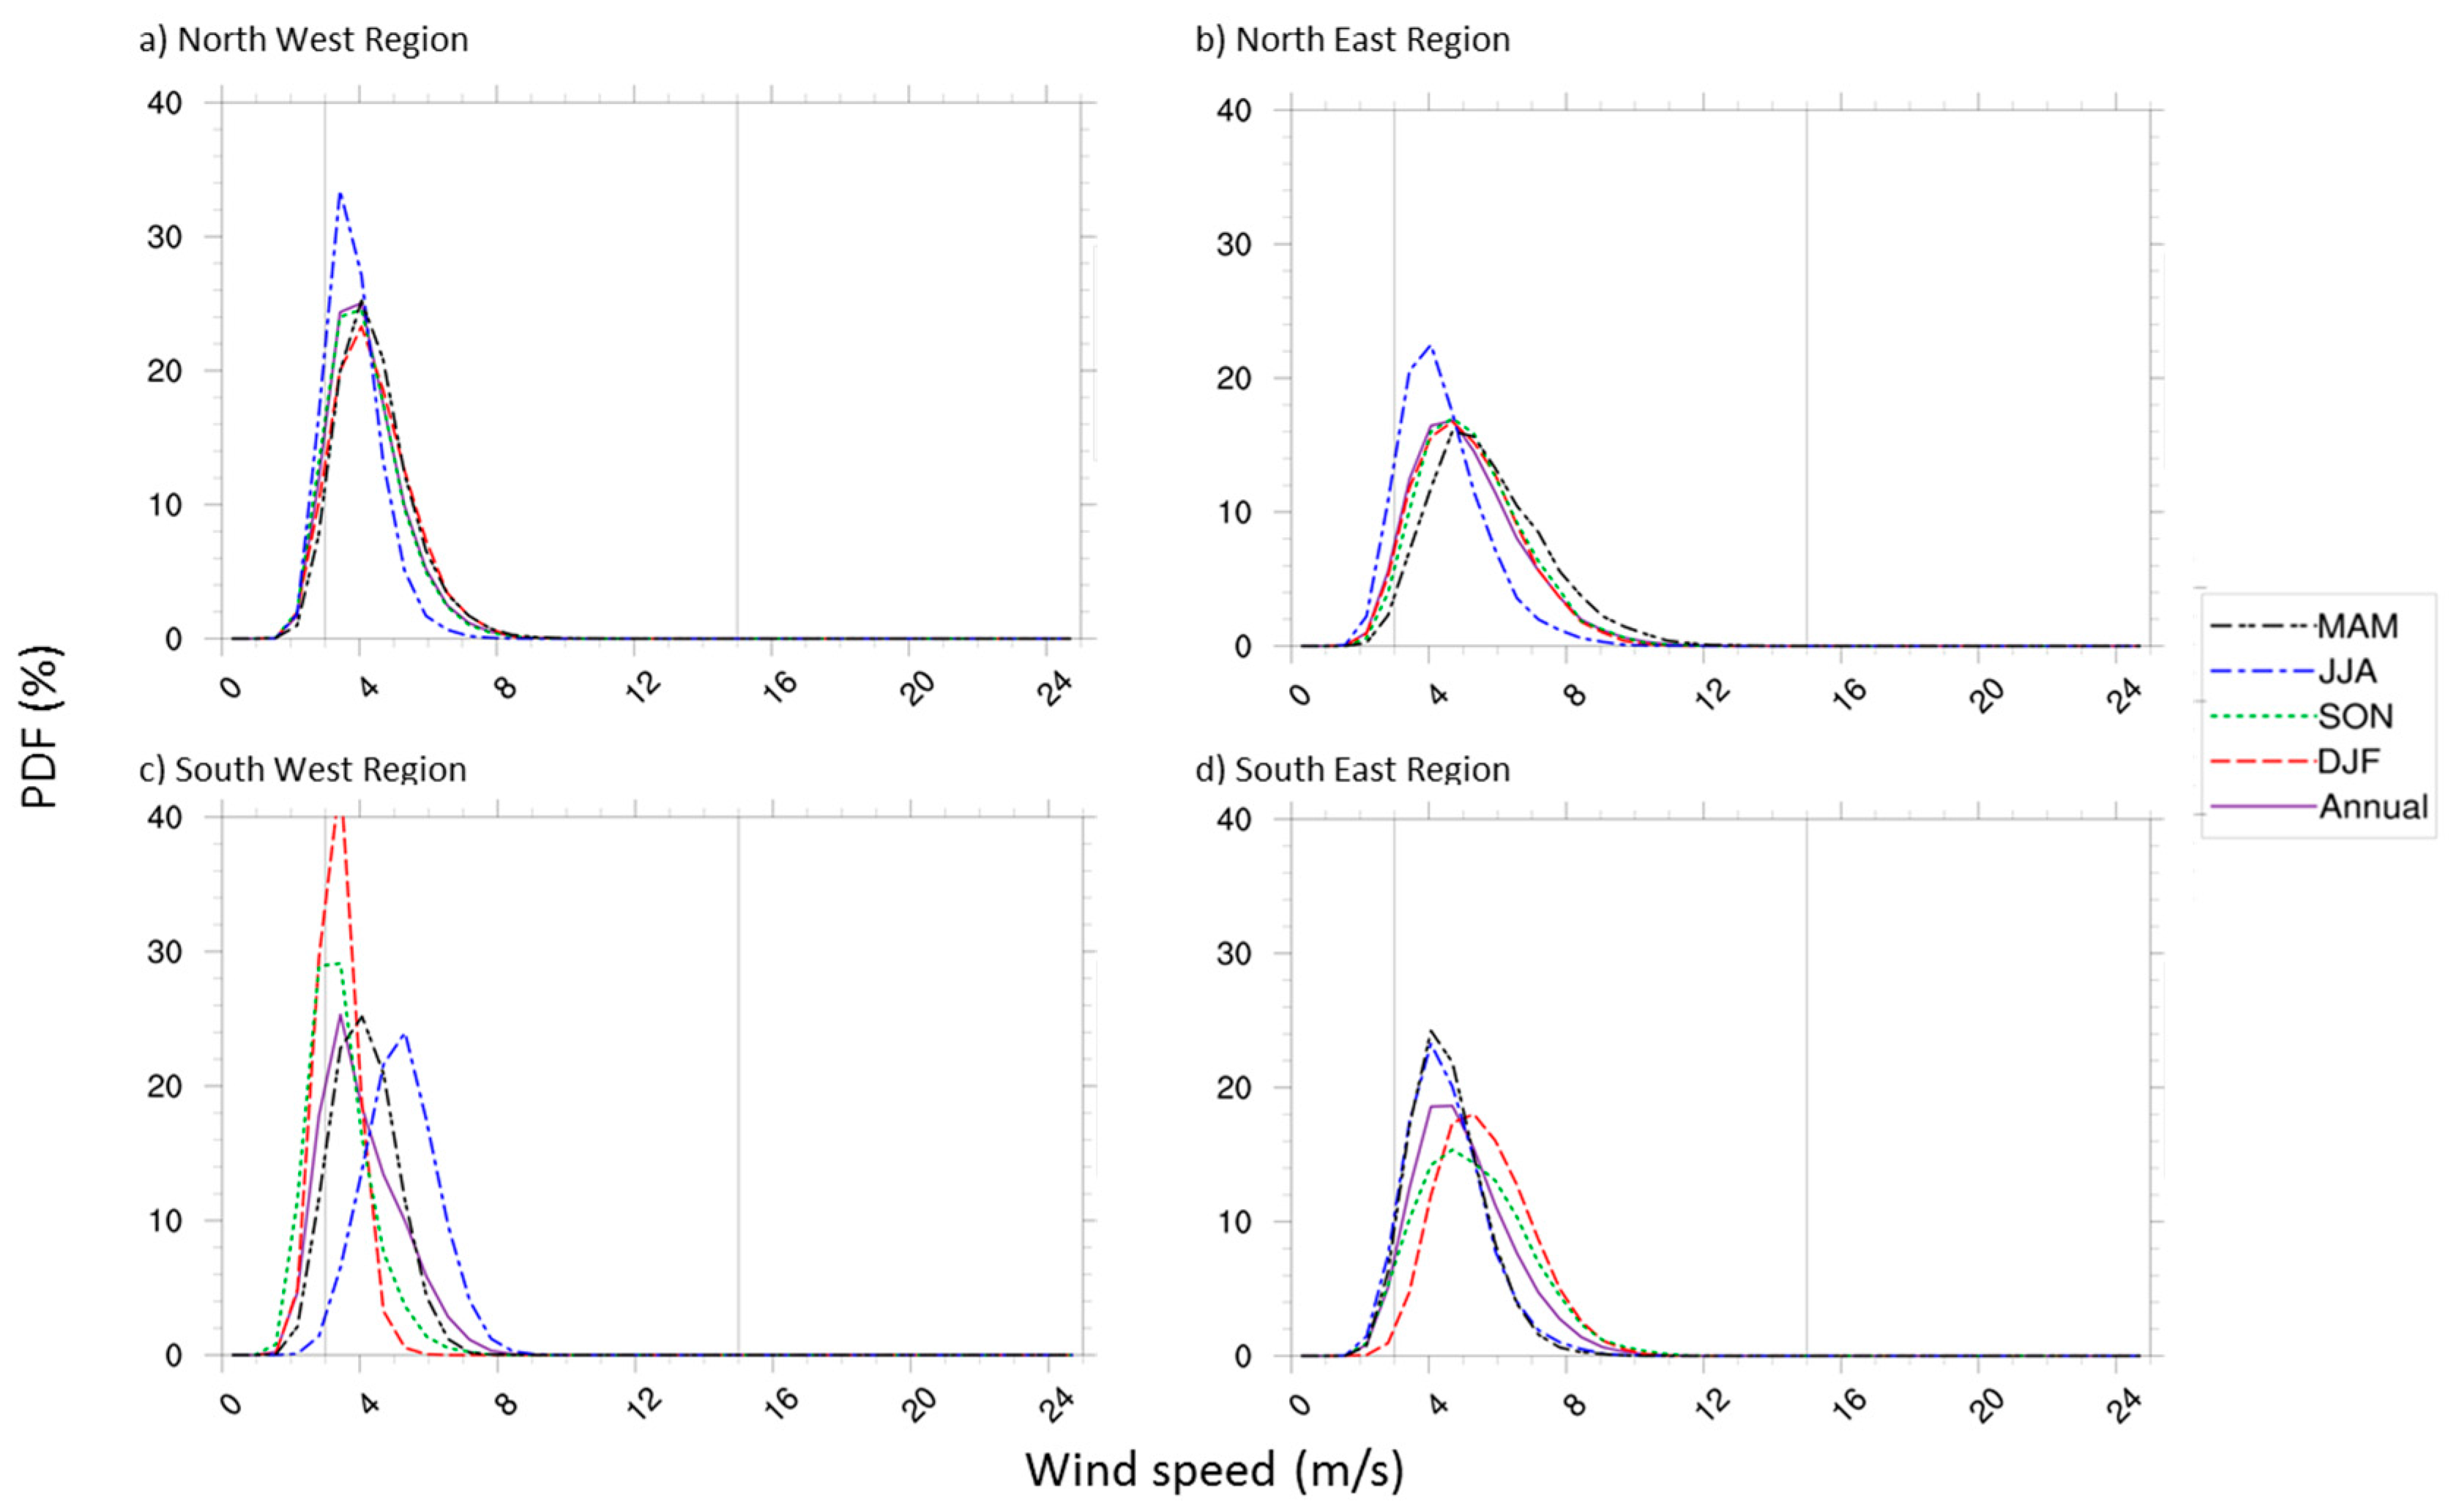
Wind speed distribution over the study area was also examined seasonally and annually by using the probability density function (PDF). Higher average wind speeds are observed in the North East and South East (coastal) regions. The most probable wind speed was obtained in JJA for all regions except the South West, where DJF had the most occurring wind speed. The North West and South West regions had slightly higher probabilities to experience wind speed greater than 4 m/s than both the North East and South East regions, although the latter had more occurrences of higher wind speeds for all seasons, as seen in Figure 7a,c. The steeper curves for DJF in the South West region mean that the most probable wind speed in the region is considerably low and hence may not generate as much power compared to the North East, which has a gentler slope and thus more chances of higher wind speeds. The South East region as seen in Figure 7d, however, has the least deviation between seasonal averages, suggesting that wind power in this region would be the maximum. Based on these plots, DJF (SON) wind speed of about 3 m/s had a probability of 40% (35%) in the South West region while for JJA, the value increased to about 5.5 m/s with a 30% probability.
The trend was reversed in the North West with slightly lower probabilities. The South East region, on the other hand, has a maximum probability of about 25% and 24% in JJA and MAM, equivalent to 4 m/s and 4.4 m/s, respectively. The relatively higher wind speeds over the South East can be linked to the inclusion of the South China Sea and modulation of sea breezes into the surrounding landmass. The curve for DJF is slightly skewed to the right, implying higher wind speeds in this season relative to others. It is therefore probable from the above that, depending on the region considered, MAM wind power might sometimes exceed that of DJF, or vice-versa. Faced with this possibility, seasonal contribution to annual wind power over the 35-year period is thus subsequently examined and discussed.
3.4. Annual Variation of Seasonal Wind Power
The wind power annual variation for each region is shown in Figure 8. Power peaked in the winter of 1996 at about 86 kW, while it was lowest in 2011 over the North West region for DJF, according to Figure 8a. Variability appeared to be higher in DJF but lowest in JJA, with a range of about 40 kW and 12 kW, respectively. For the time period considered, JJA wind power was never greater than DJF wind power for this region, while MAM and SON were considerably closer in the early years before a further deviation around 2004 onward. Wind power is slightly greater in the North East with a peak value of 120 kW during MAM, as illustrated in Figure 8b. Unlike in the previously discussed season, wind power during MAM was highest for the entire period considered, while JJA was again the lowest in terms of contribution. A high range of about 50 kW also suggests that relatively higher wind speeds and thus more variability in MAM than in DJF, in line with the conclusions obtained from the PDFs. These higher wind speeds translated to more wind power. The contributions of the SON and DJF seasons were also relatively close to each other for the study duration, as seen in Figure 8c. An interesting observation is that for these two regions, DJF and SON dipped in year 2011. The trend is reversed in the South West, as JJA had peak wind power of about 110 kW in 1994 and remained the highest contributor to annual wind power throughout the study duration. SON was the lowest contributor, behind DJF and MAM, while also showing the least variability for the duration considered. The contributions of DJF and MAM are close in this case as well, creating a similar pattern to the previous regions seasonal contribution structure. As inferred from the probability density plots, wind power was highest in the South East (coastal) region with DJF clearly being the highest contributor, as shown in Figure 8d. Wind power peaked at about 240 kW in 1995 and was lowest in 1997 at about 130 kW. The pattern for this region differed considerably from the others, as MAM and DJF were the lowest contributors of about the same values intermittently. The variability in contribution also appeared relatively lower until around 2004. SON contribution was higher, averaging about 90 kW per year, which is about the peak value recorded in the North West region.
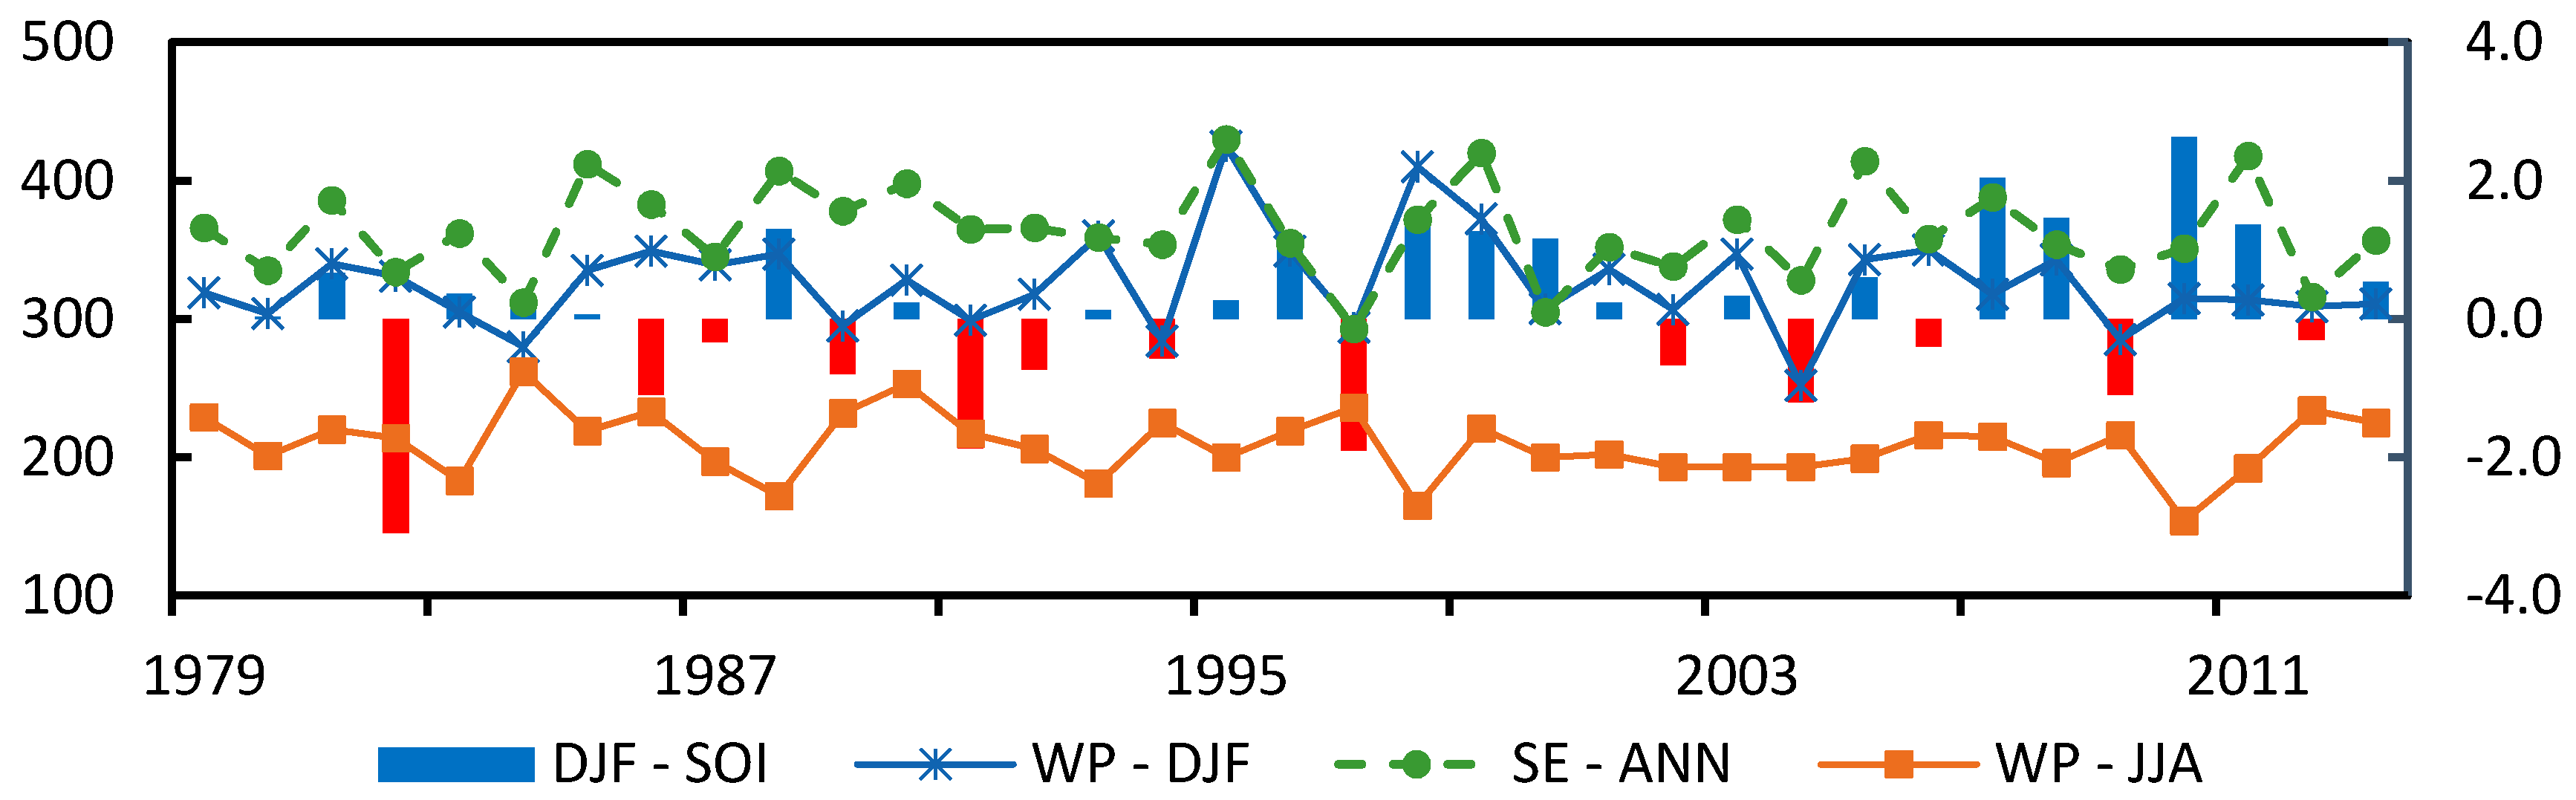
Preliminary studies show a relatively low correlation with the Southern Oscillation Index (SOI), thus, a detailed study of this annual variability and its relationship to major teleconnection indices is motivation for future studies. Notwithstanding, there is a significant positive correlation between DJF SOI and MAM wind power in the North West region and DJF wind power in the SE region, while it is negative for DJF SOI and JJA wind power. In the case of JJA SOI, the correlation is positive and significant for the South East region SON wind power and North West region MAM wind power. For the whole domain, the correlation is significant and positive between DJF SOI and DJF wind power, but negative for JJA wind power, with the reverse case occurring for the JJA SOI. Annual wind power and both JJA SOI and DJF SOI are positively correlated in the South East region only. The results for DJF SOI are shown in Figure 9.
In terms of trend, an anti-correlation is observed between the South East and South West for winter and summer seasons, respectively. Power production is highest in the South West during summer but lowest during winter in the South East. This anti-correlation would impact on wind power supply, but it provides good opportunities to combine power resources. In terms of magnitude, wind power could be reduced by 50% or more from region to region depending on the season considered, and this has huge implications for energy-mix discussions and renewables optimization. Influenced more considerably by prevailing direction of the East Asian Monsoon, wind power on average reduced by up to 25% in SON, 30% in MAM, and 37% in JJA, using DJF values as base reference.
3.5. Impact on Wind Energy Optimization
Effectively, seasonal variations in the capacity factor imply that the amount of energy harnessed from the wind would likewise vary seasonally. A wider variance in values would thus affect the design and development of hybrid power generation systems if energy demand is to be met. This suggests that much care must go into designing these plants, since the conventional variation of wind vectors cannot be perfectly estimated or replicated. Consequently, it is expected that demand net wind (DNW, which is the energy demand that must be supplied by non-wind sources to maintain the demand–supply equilibrium) would vary seasonally over the entire study domain with lower values expected in winter and higher values expected in summer because of seasonal variation in the wind vectors. Thus, designing and operating a plant which can accommodate fluctuations in DNW is essential for optimizing the potential offered by wind.
On a regional scale, wind power has the greatest potential in the South East region. The relatively stronger wind vector and characteristics obtained in this region arise as a direct influence of the South China Sea. For interconnection on large-scale wind farms, a link between the South East and the South West may likely produce a more stable pattern of DNW, as the shortfall of JJA power in South East would be augmented by the peak of JJA power in the South West, and vice-versa. The findings from the regional assessments also show that higher values of DNW can be expected during summer for all regions except the South West, whose maximum power output is observed in summer.
These results agree with the conclusions of Yeh et al. [34], that the cooling effect of the Asiatic continent produces higher wind speeds in winter, while its heating effect results in relatively lower wind speeds during summer. This relationship would help in the design and operation of hybrid energy plants and electricity grids by energy sector players, while also guiding policy-makers in decision-making towards optimizing wind energy output. More importantly, in the near future, a “demand–supply” trade-off could also be implemented where energy demand for both cooling during summer and heating during winter could be supplied via wind sources.
4. Conclusions
This study examined the variability of the East Asian Monsoon on wind vectors and its characteristics over Asia. It adopted a large-scale and regional approach by using ERA-Interim reanalysis data to investigate the impact on wind power availability and optimization on seasonal time-frames. The indices evaluated included wind climatology, prevailing direction, wind power and capacity factor.
The results show that on average, wind power is highest in winter and lowest in summer for all regions considered, except the South West, where wind power is at maximum during summer. This variation in power is driven by the respective frequencies of occurrence of different wind speed bins for the seasons considered. An important factor recognized as being responsible for the differences in wind speed is the monsoon as the reversal of wind direction, and consequent northward jumps during summer imply a strengthening pattern commencing from the South West region of the study area. This also affects the capacity factor directly, with higher values recorded in winter and lower values in summer. Detailed probability distribution function shows slightly lesser wind speeds occurring more frequently during summer than in winter in most cases, thus confirming that the average DNW (demand net wind) for summer would be lower than that of winter.
Increasing attention that is being paid to the development of interconnected regional wind power systems and grids means that collective optimization of the benefits of renewable energy may be very effective for costs distribution, power optimization, and grid stability.
Finally, a paradigm shift from wind resources assessment to wind power optimizations is required for the wind power industry to prosper in the energy mix. Despite timescale weather variability and intermittent wind power production, detailed analysis and understanding such as the one conducted in this study provide a framework upon which renewable energy optimization must commence.
Acknowledgments
The first author is a recipient of a research studentship provided by the City University of Hong Kong.
Author Contributions
The study idea, plan and design were conceived by W.Z. and A.T.A. Calculations, analysis and visualizations were carried out by Y.T.L., A.T.A. and W.Z., who jointly prepared the manuscript, discussed the results and decided on the final version.
Conflicts of Interest
The authors declare no conflict of interest.
References
- International Energy Agency (IEA). World Energy Outlook 2012: Renewable Energy Outlook; International Energy Agency: Paris, France, 2012. [Google Scholar]
- Dunning, C.M.; Turner, A.G.; Brayshaw, D.J. The impact of monsoon intraseasonal variability on renewable power generation in India. Environ. Res. Lett. 2015, 10, 064002. [Google Scholar] [CrossRef]
- Reddy, B.S.; Assenza, G.B.; Assenza, D.; Hasselmann, F. Energy Efficiency and Climate Change: Conserving Power for a Sustainable Future; SAGE: New Delhidoi, India, 2009. [Google Scholar]
- Hendricks, B. Climate Leader Papers: Decarbonization—The Time Is Now. Available online: http://www.climateactionprogramme.org/climate-leader-papers/decarbonisation_the_time_is_now (accessed on 10 May 2017).
- Barros, K.J.; Mach, M.D.; Mastrandrea, M.; van Aalst, W.N.; Adger, D.J.; Arent, J.; Barnett, R.; Betts, T.E.; Bilir, J.; Birkmann, J.; et al. Technical summary. In Climate Change 2014: Impacts, Adaptation, and Vulnerability. Part A: Global and Sectoral Aspects. Contribution of Working Group II to the Fifth Assessment Report of the Intergovernmental Panel on Climate Change; Field, C.B., Barros, V.R., Dokken, D.J., Mach, K.J., Mastrandrea, M.D., Bilir, T.E., Chatterjee, M., Ebi, K.L., Estrada, Y.O., Genova, R.C., et al., Eds.; Cambridge University Press: Cambridge, UK; New York, NY, USA, 2014; pp. 35–94. [Google Scholar]
- Global Installed Wind Power Capacity in 2016—Regional Distribution. Available online: http://gwec.net/global-figures/graphs/ (accessed on 4 October 2017).
- Brayshaw, D.J.; Troccoli, A.; Fordham, R.; Methven, J. The impact of large scale atmospheric circulation patterns on wind power generation and its potential predictability: A case study over the UK. Renew. Energy 2011, 36, 2087–2096. [Google Scholar] [CrossRef]
- Vincent, C.; Kepert, J. Using kinetic energy spectra from NWP to forecast wind variability. BMRC Res. Lett. 2008, 8, 27. [Google Scholar]
- Davy, R.J.; Woods, M.J.; Russell, C.J.; Coppin, P.A. Statistical downscaling of wind variability from meteorological fields. Bound. Layer Meteorol. 2010, 135, 161–175. [Google Scholar] [CrossRef]
- Archer, C.L.; Jacobson, M.Z. Climate and Dynamics-D12110-Evaluation of global wind power. J. Geophys. Res. Part D Atmos. 2005, 110. [Google Scholar] [CrossRef]
- Thornton, H.E.; Scaife, A.A.; Hoskins, B.J.; Brayshaw, D.J. The relationship between wind power, electricity demand and winter weather patterns in Great Britain. Environ. Res. Lett. 2017, 12, 064017. [Google Scholar] [CrossRef]
- Clark, R.T.; Bett, P.E.; Thornton, H.E.; Scaife, A.A. Skilful seasonal predictions for the European energy industry. Environ. Res. Lett. 2017, 12, 024002. [Google Scholar] [CrossRef]
- Yu, L.; Zhong, S.; Bian, X.; Heilman, W.E. Climatology and trend of wind power resources in China and its surrounding regions: A revisit using Climate Forecast System Reanalysis data. Int. J. Climatol. 2016, 36, 2173–2188. [Google Scholar] [CrossRef]
- Ramage, C.S. Monsoon meteorology. Int. Geophys. Serv. 1971, 15, 296. [Google Scholar]
- Wu, M.L.C.; Schubert, S.; Huang, N.E. The development of the South Asian summer monsoon and the intraseasonal oscillation. J. Clim. 1999, 12, 2054–2075. [Google Scholar] [CrossRef]
- Xu, J.; Chan, J.C. First transition of the Asian summer monsoon in 1998 and the effect of the Tibet-tropical Indian Ocean thermal contrast. J. Meteorol. Soc. Jpn. 2001, 79, 241–253. [Google Scholar] [CrossRef]
- Zhou, T.; Gong, D.; Li, J.; Li, B. Detecting and understanding the multi-decadal variability of the East Asian summer monsoon—Recent progress and state of affairs. Meteorol. Z. 2009, 18, 455–467. [Google Scholar] [CrossRef]
- Wang, S.W.; Li, W. Climate of China; China Meteor Press: Beijing, China, 2007; 428p. [Google Scholar]
- Dee, D.P.; Uppala, S.M.; Simmons, A.J.; Berrisford, P.; Poli, P.; Kobayashi, S.; Andrae, U.; Balmaseda, M.A.; Balsamo, G.; Bauer, P.; et al. The ERA-Interim reanalysis: Configuration and performance of the data assimilation system. Q. J. R. Meteorol. Soc. 2011, 137, 553–597. [Google Scholar] [CrossRef]
- Pryor, S.C.; Barthelmie, R.J. Climate change impacts on wind energy: A review. Renew. Sustain. Energy Rev. 2010, 14, 430–437. [Google Scholar] [CrossRef]
- Ruiz-Arias, J.A.; Terrados, J.; Perez-Higueras, P.; Pozo-Vazquez, A. Assessment of the renewable energies potential for intensive electricity production in the province of Jaen, southern Spain. Renew. Sustain. Energy Rev. 2012, 16, 2994–3001. [Google Scholar] [CrossRef]
- Cannon, D.J.; Brayshaw, D.J.; Methven, J.; Coker, P.J.; Lenaghan, D. Using reanalysis data to quantify extreme wind power generation statistics: A 33 year case study in Great Britain. Renew. Energy 2015, 75, 767–778. [Google Scholar] [CrossRef]
- Zhou, W.; Chan, J.C.L. Intraseasonal oscillations and the South China Sea summer monsoon onset. Int. J. Climatol. 2005, 25, 1585–1609. [Google Scholar] [CrossRef]
- Zhang, Z.; Chan, J.C.; Ding, Y. Characteristics, evolution and mechanisms of the summer monsoon onset over Southeast Asia. Int. J. Climatol. 2004, 24, 1461–1482. [Google Scholar] [CrossRef]
- Fong, S.K.; Wang, A.Y. Climatological Atlas for Asian Summer Monsoon; Macau Meteorological and Geophysical Bureau and Macau Foundation: Macau, China, 2011; p. 318. [Google Scholar]
- Ding, Y.H. Seasonal march of the East-Asian summer monsoon. East Asian Monsoon 2004, 2, e53. [Google Scholar]
- Ding, Y.H. Monsoons over China; Kluwer Academic Publishers: Dordrecht, The Netherlands, 1994; 419p. [Google Scholar]
- Ding, Y.H.; Sun, Y. A study on anomalous activities of East Asian summer monsoon during 1999. J. Meteorol. Soc. Jpn. 2001, 79, 1119–1137. [Google Scholar] [CrossRef]
- Cressman, G.P. Circulations of the West Pacific jet stream. Mon. Weather Rev. 1981, 109, 2450–2463. [Google Scholar] [CrossRef]
- Chang, C.P.; Lau, K.M.W. Northeasterly cold surges and near-equatorial disturbances over the winter MONEX area during December 1974. Part II: Planetary-scale aspects. Mon. Weather Rev. 1980, 110, 933–946. [Google Scholar] [CrossRef]
- Ding, Y.H. Effects of the Qinghai-Xizang (Tibet) plateau on the circulation features over the plateau and its surrounding areas. Adv. Atmos. Sci. 1992, 9, 112–130. [Google Scholar]
- Chen, L.X.; Schmidt, F.; Li, W. Characteristics of the atmospheric heat source and moisture sink over the Qinghai-Tibetan Plateau during the second TIPEX of summer 1998 and their impact on surrounding monsoon. Meteorol. Atmos. Phys. 2003, 83, 1–18. [Google Scholar] [CrossRef]
- Zhao, P.; Chen, L.X. Impact of quasi-four year oscillation of atmospheric heat source/sink over Qinghai-Tibetian Plateau in winter on the interaction among ocean-land and atmosphere. China Sci. Bull. 2000, 45, 1666–1671. [Google Scholar]
- Yeh, T.C.; Luo, S.W.; Zhu, B.Z. Structure of the flow field over the Tibetan Plateau and the adjacent area and heat balance of the tropospheric atmosphere. Acta Meteorol. Sin. 1957, 28, 108–120. (In Chinese) [Google Scholar]
- Lu, L.; Yang, H.; Burnett, J. Investigation on wind power potential on Hong Kong islands—An analysis of wind power and wind turbine characteristics. Renew. Energy 2002, 27, 1–12. [Google Scholar] [CrossRef]
- Li, G. Feasibility of large scale offshore wind power for Hong Kong—A preliminary study. Renew. Energy 2000, 21, 387–402. [Google Scholar] [CrossRef]
Figure 1.
Location (boxed) of the select regions studied with inset of topographical characteristics overlain with 850 hPa wind vectors.
Figure 1.
Location (boxed) of the select regions studied with inset of topographical characteristics overlain with 850 hPa wind vectors.
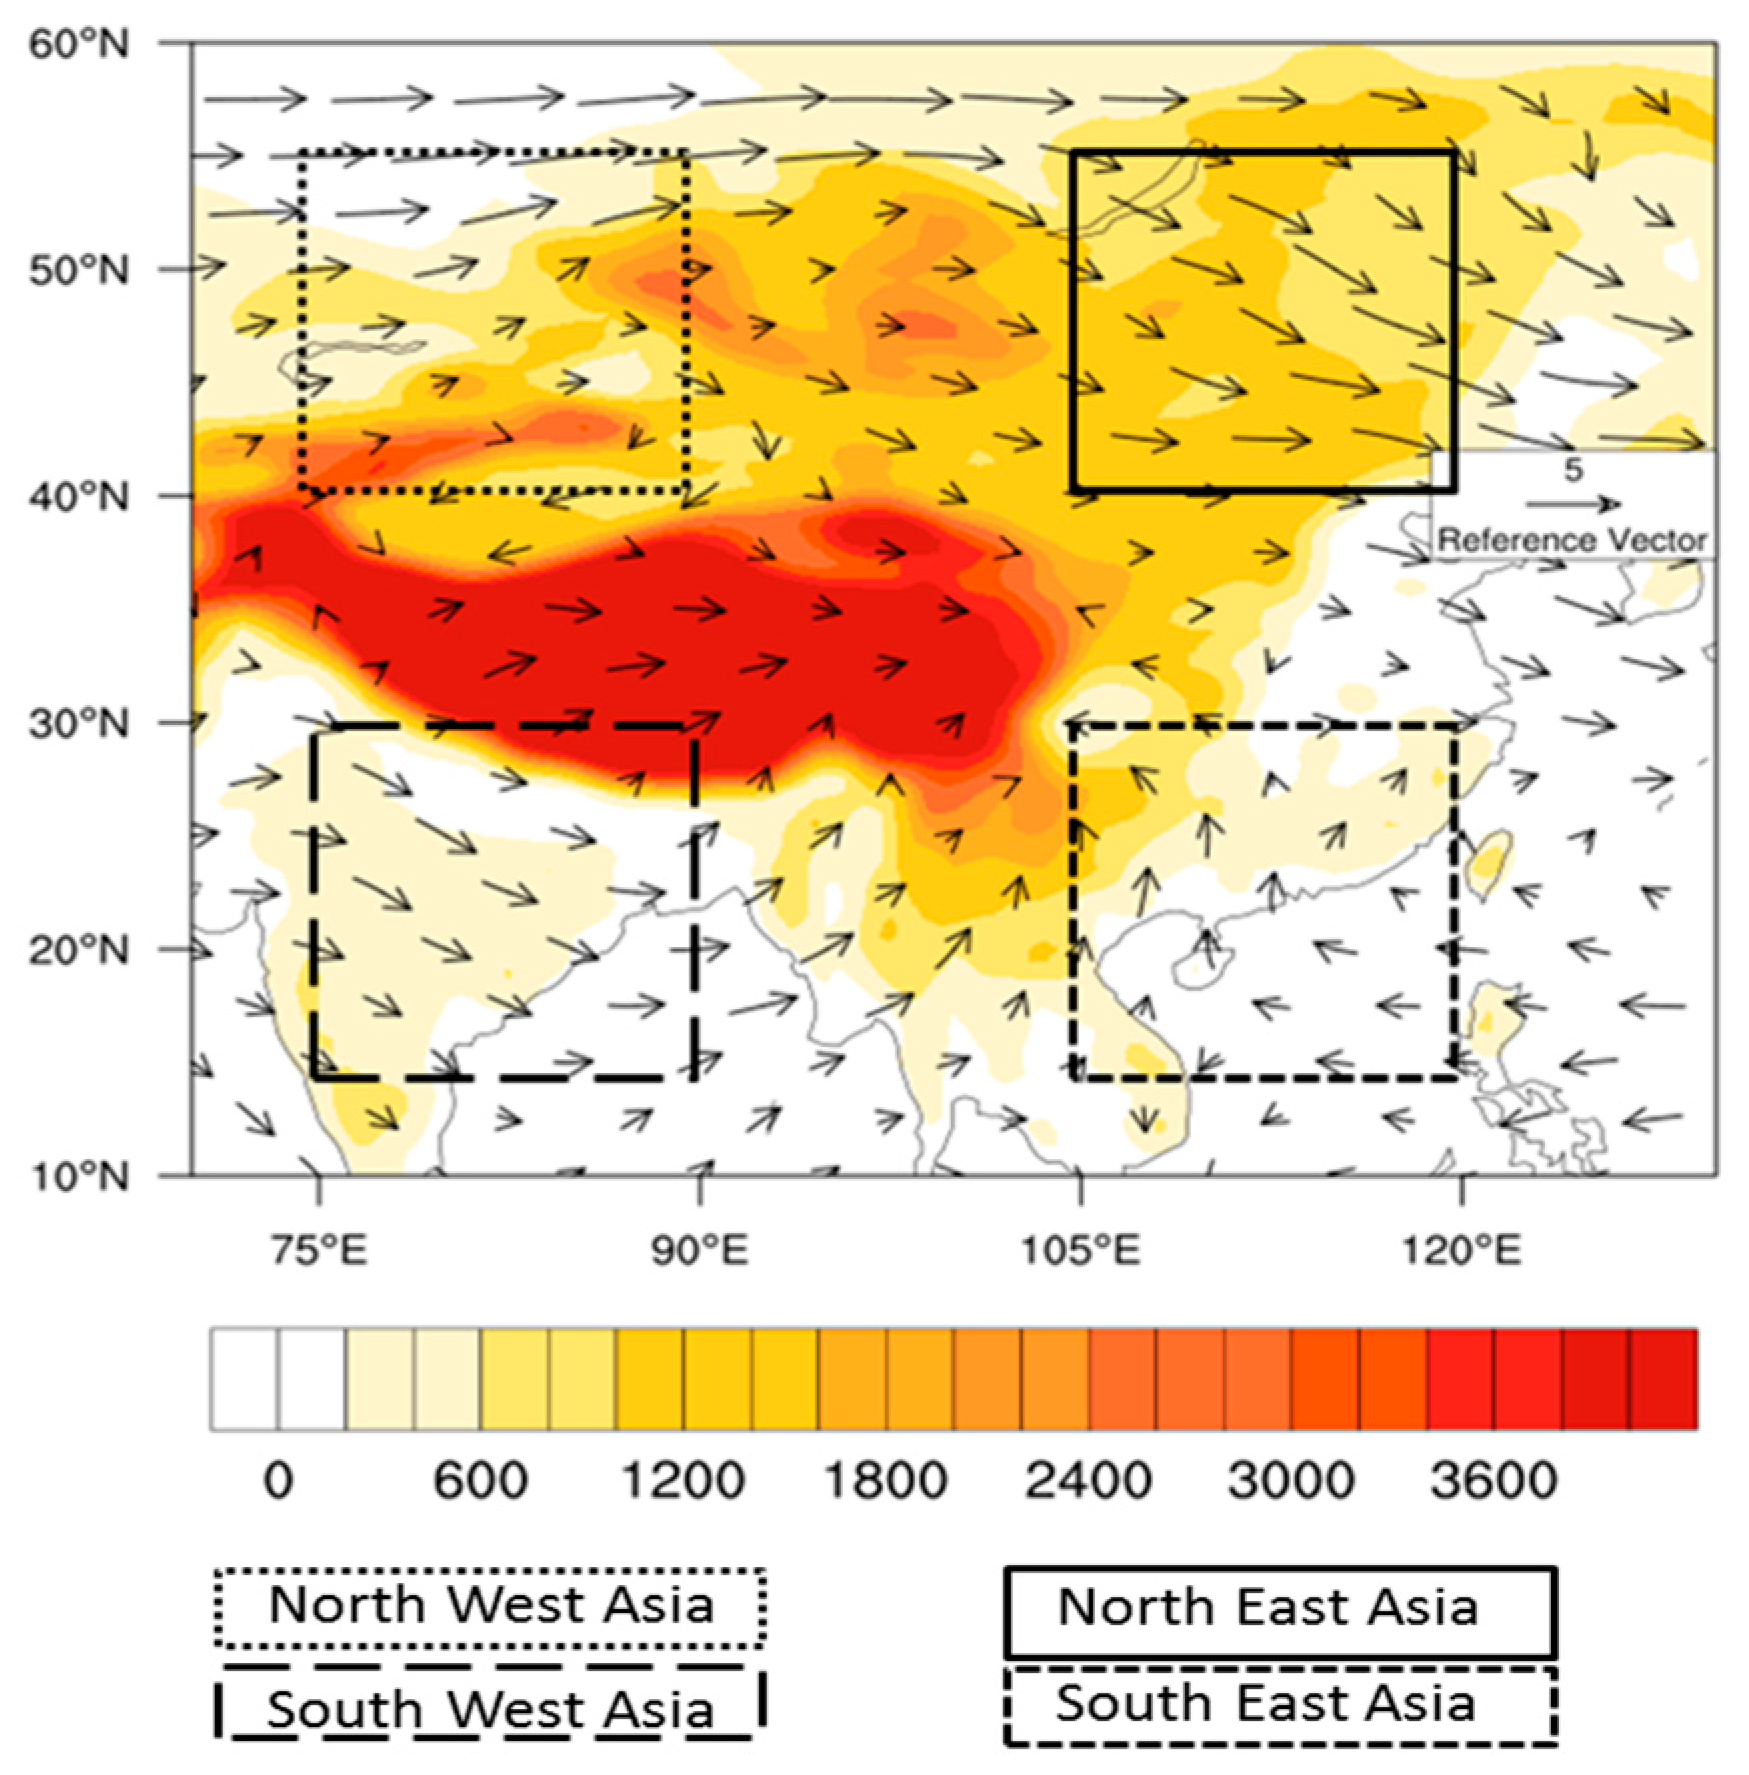
Figure 2.
Conceptualized wind power curves for different power-rated turbine models.
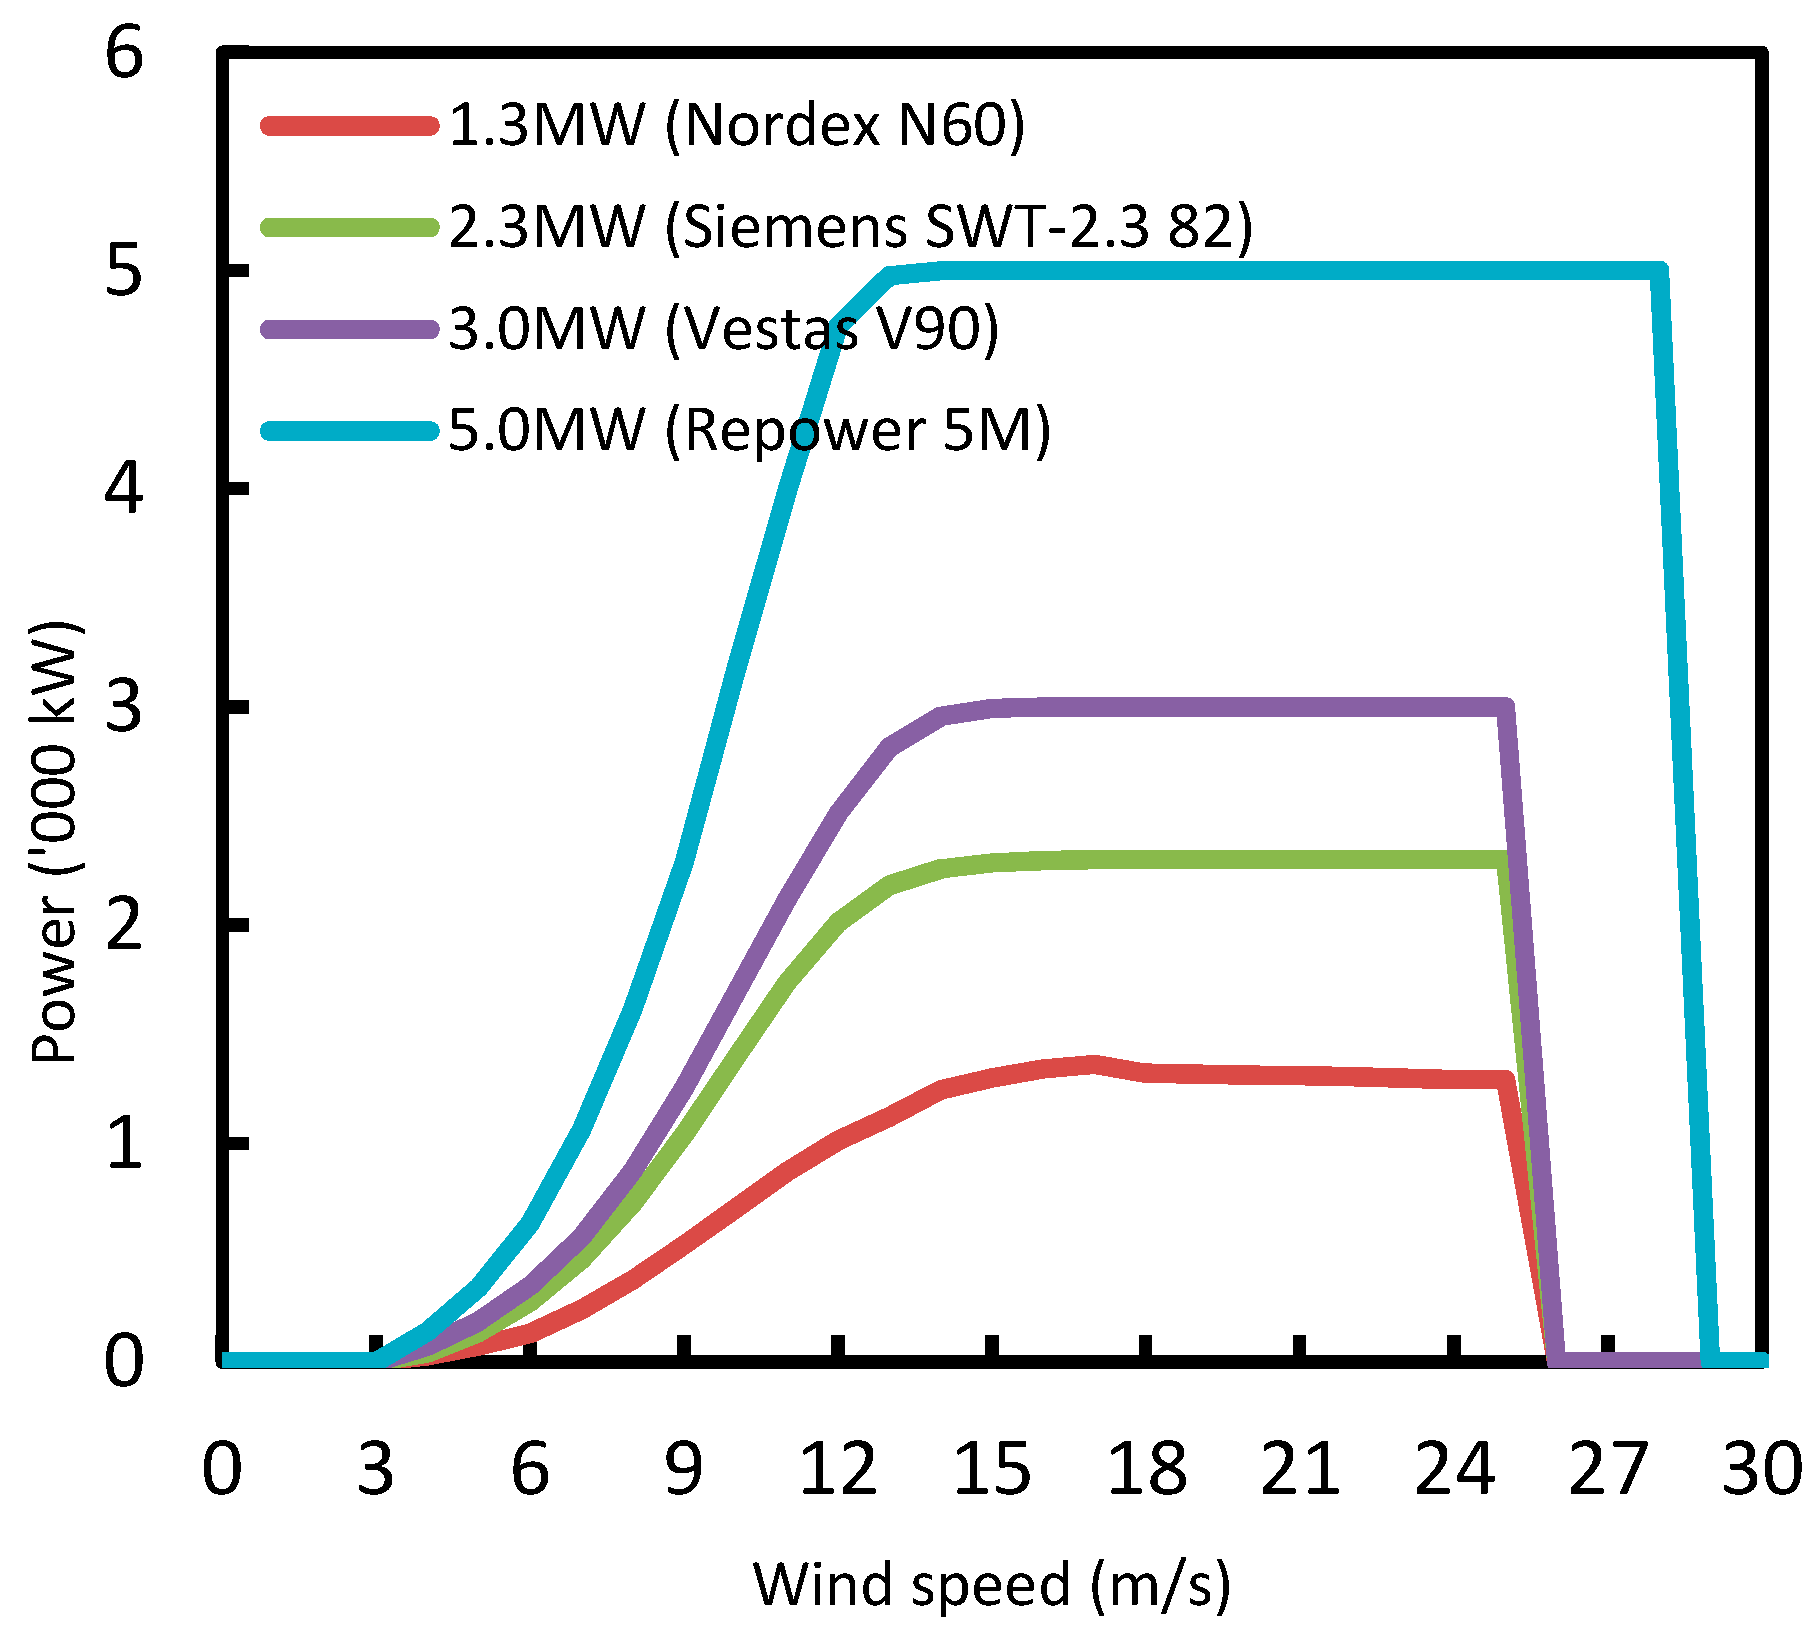
Figure 3.
Wind speed climatology and wind vector characteristics between 1979 and 2014 (a) in spring (MAM, March-April-May); (b) summer (JJA, June-July-August); (c) autumn (SON, September-October-November); and (d) winter (DJF, December-January-February).
Figure 3.
Wind speed climatology and wind vector characteristics between 1979 and 2014 (a) in spring (MAM, March-April-May); (b) summer (JJA, June-July-August); (c) autumn (SON, September-October-November); and (d) winter (DJF, December-January-February).

Figure 4.
Average wind energy (in kW) between 1979 and 2014 (a) spring MAM, (b) summer JJA, (c) autumn SON, and (d) winter DJF.
Figure 4.
Average wind energy (in kW) between 1979 and 2014 (a) spring MAM, (b) summer JJA, (c) autumn SON, and (d) winter DJF.
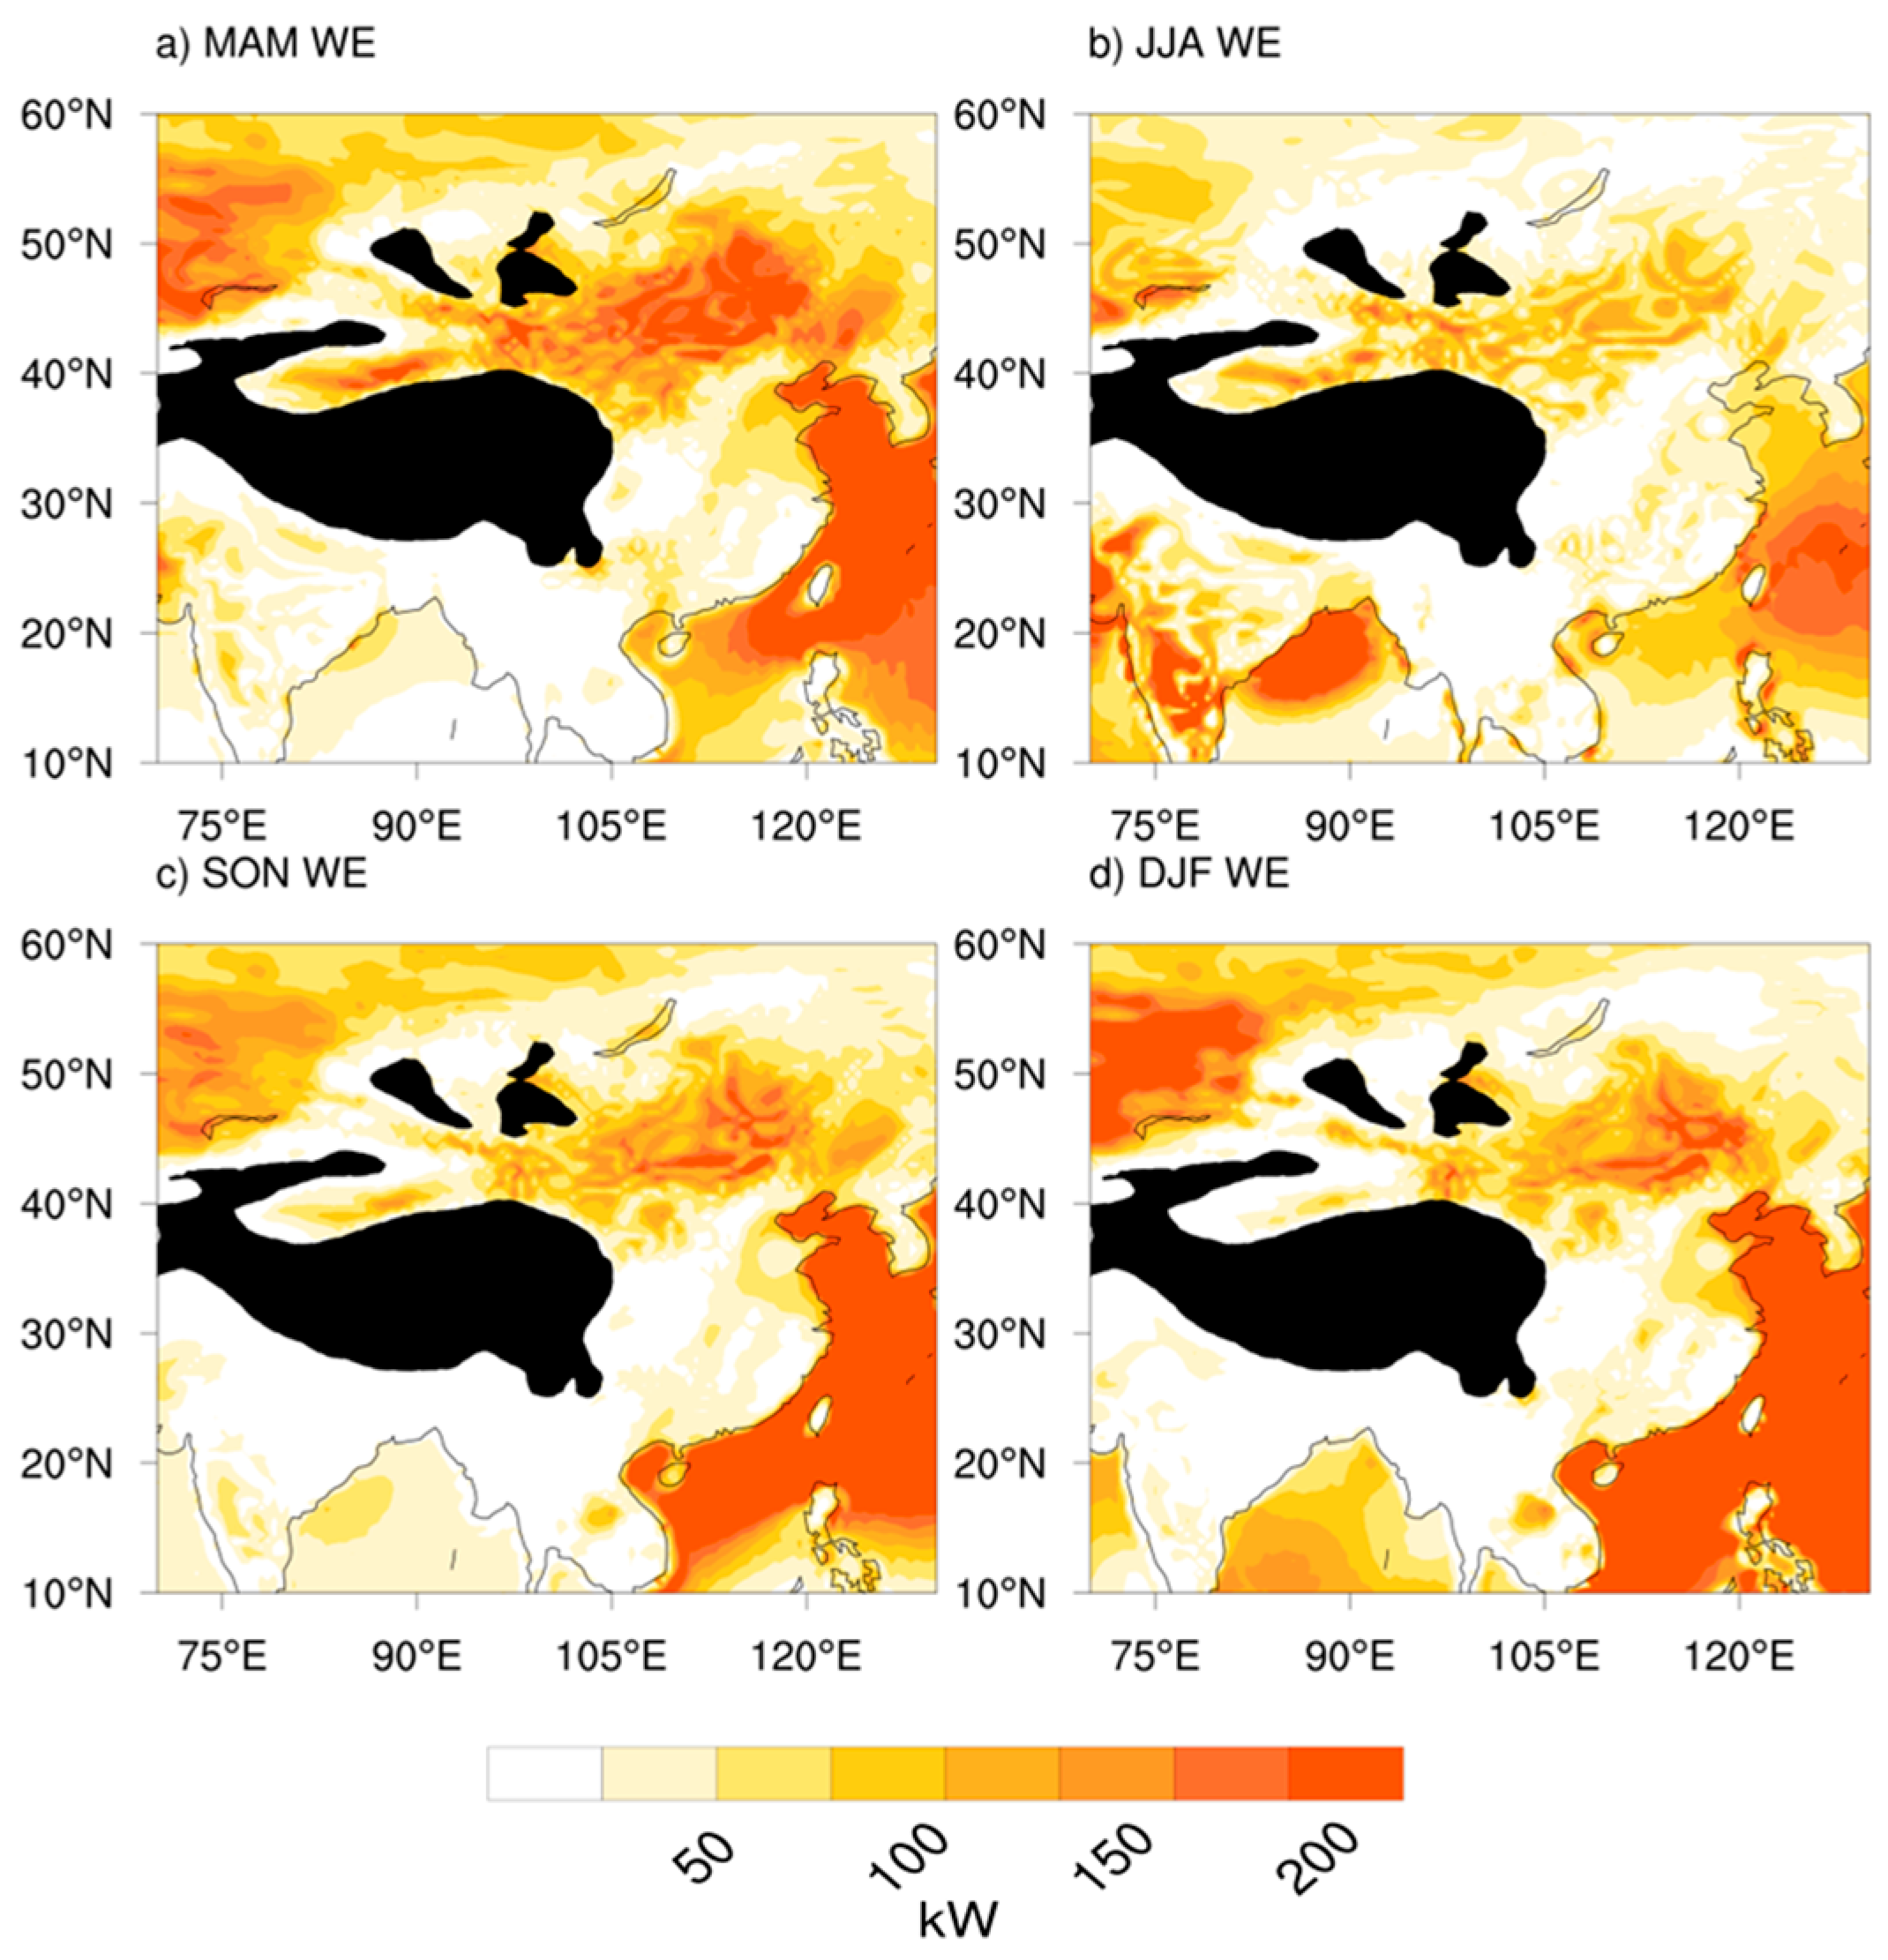
Figure 5.
Seasonal averages of wind power capacity factor in (a) spring MAM, (b) summer JJA, (c) autumn SON, and (d) winter DJF.
Figure 5.
Seasonal averages of wind power capacity factor in (a) spring MAM, (b) summer JJA, (c) autumn SON, and (d) winter DJF.

Figure 6.
Standard deviation of seasonal averages of wind power capacity factor in (a) spring MAM, (b) summer JJA, (c) autumn SON, and (d) winter DJF. (Tibetan region is masked in white colour).
Figure 6.
Standard deviation of seasonal averages of wind power capacity factor in (a) spring MAM, (b) summer JJA, (c) autumn SON, and (d) winter DJF. (Tibetan region is masked in white colour).

Figure 7.
Probability distribution function (PDFs) of wind speed for the four seasons over (a) North West region, (b) North East region, (c) South West region, and (d) South East region.
Figure 7.
Probability distribution function (PDFs) of wind speed for the four seasons over (a) North West region, (b) North East region, (c) South West region, and (d) South East region.

Figure 8.
Annual seasonal averages of wind power for the four seasons over (a) North West region, (b) North East region, (c) South West region, and (d) South East region.
Figure 8.
Annual seasonal averages of wind power for the four seasons over (a) North West region, (b) North East region, (c) South West region, and (d) South East region.
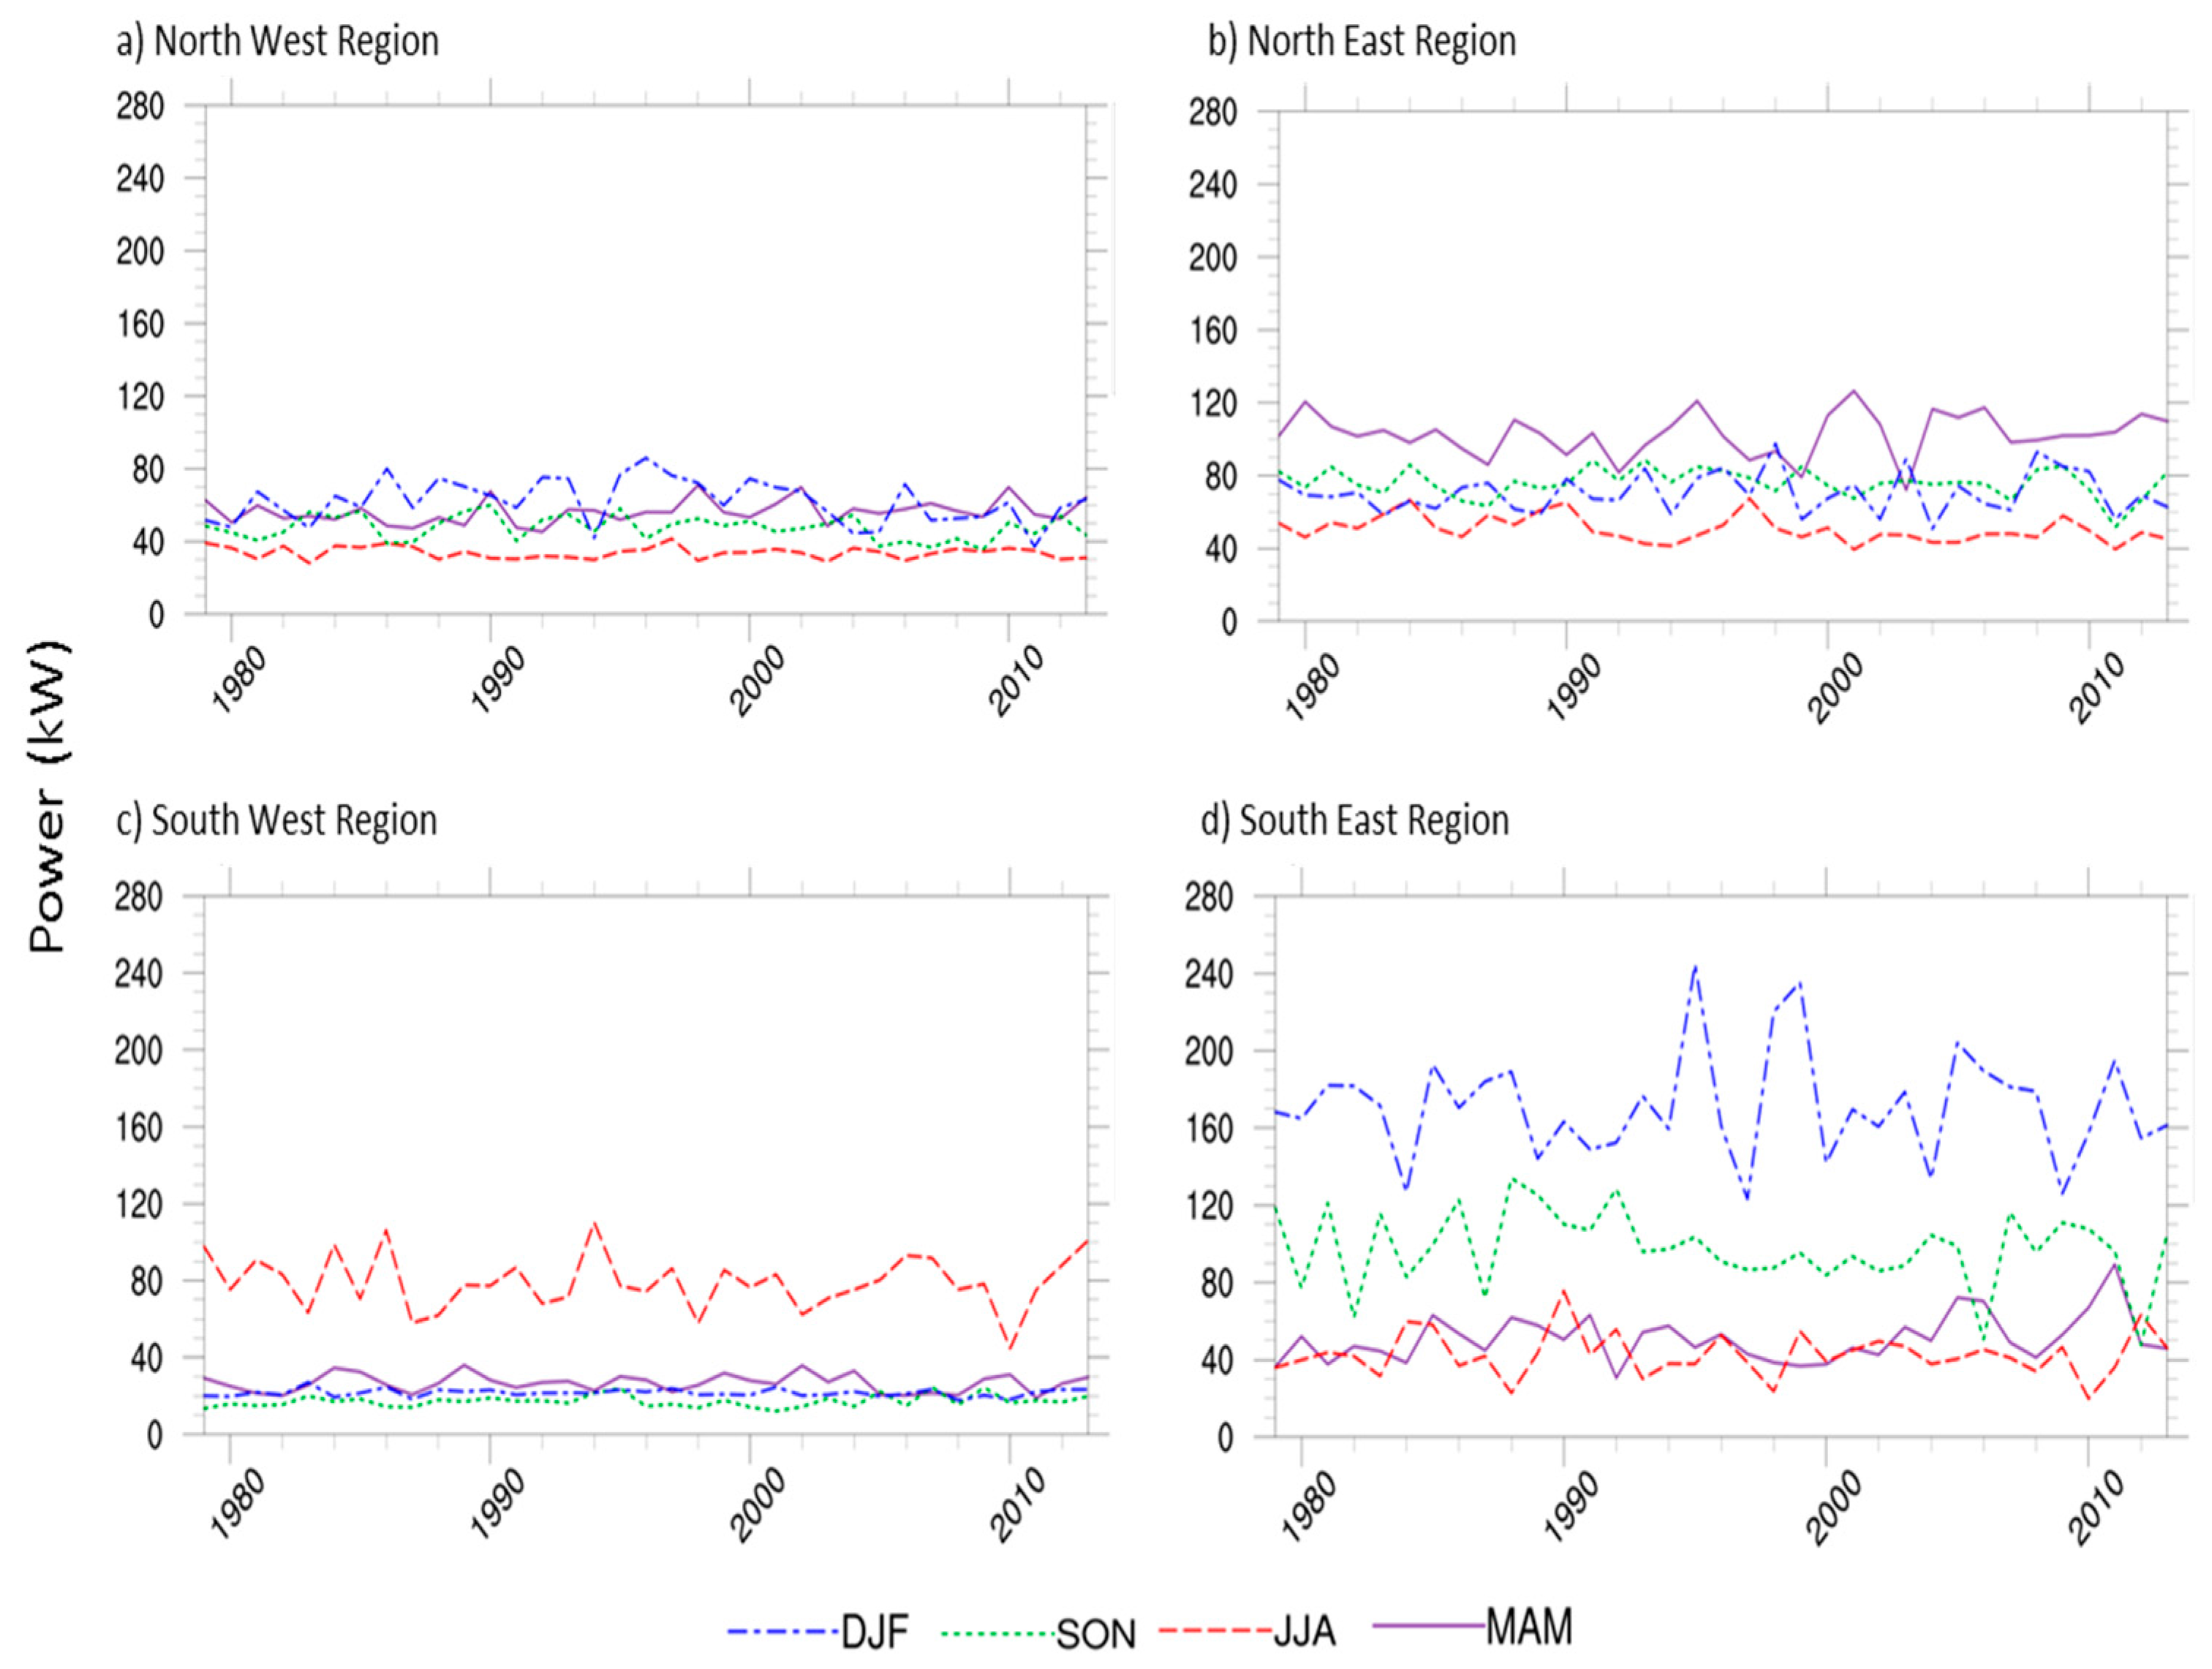
Figure 9.
Wind power in winter (WP-DJF) and summer (WP-JJA), South East region annual wind power (SE-ANN) and winter SOI (DJF-SOI) for the study period considered.
Figure 9.
Wind power in winter (WP-DJF) and summer (WP-JJA), South East region annual wind power (SE-ANN) and winter SOI (DJF-SOI) for the study period considered.
© 2017 by the authors. Licensee MDPI, Basel, Switzerland. This article is an open access article distributed under the terms and conditions of the Creative Commons Attribution (CC BY) license (http://creativecommons.org/licenses/by/4.0/).
Share and Cite
MDPI and ACS Style
Abolude, A.T.; Zhou, W.; Leung, Y.T. Regional Impact Assessment of Monsoon Variability on Wind Power Availability and Optimization in Asia. Atmosphere 2017, 8, 219. https://doi.org/10.3390/atmos8110219
AMA Style
Abolude AT, Zhou W, Leung YT. Regional Impact Assessment of Monsoon Variability on Wind Power Availability and Optimization in Asia. Atmosphere. 2017; 8(11):219. https://doi.org/10.3390/atmos8110219
Chicago/Turabian StyleAbolude, Akintayo T., Wen Zhou, and Yu Ting Leung. 2017. "Regional Impact Assessment of Monsoon Variability on Wind Power Availability and Optimization in Asia" Atmosphere 8, no. 11: 219. https://doi.org/10.3390/atmos8110219
Note that from the first issue of 2016, this journal uses article numbers instead of page numbers. See further details here.