Article

Annual Variability of Black Carbon Concentrations Originating from Biomass and Fossil Fuel Combustion for the Suburban Aerosol in Athens, Greece

by
Evangelia Diapouli
1,*,
Athina-Cerise Kalogridis
1,
Christina Markantonaki
1,
Stergios Vratolis
1,
Prodromos Fetfatzis
1,
Cristina Colombi
2 and
Konstantinos Eleftheriadis
1
1
Institute of Nuclear & Radiological Sciences & Technology, Energy & Safety, N.C.S.R. “Demokritos”, 15341 Athens, Greece
2
Environmental Monitoring Sector, Arpa Lombardia, 20124 Milan, Italy
*
Author to whom correspondence should be addressed.
Atmosphere 2017, 8(12), 234; https://doi.org/10.3390/atmos8120234
Submission received: 26 October 2017 / Revised: 16 November 2017 / Accepted: 21 November 2017 / Published: 25 November 2017
(This article belongs to the Special Issue Carbonaceous Aerosols in Atmosphere)

Abstract

:
The objective of this work was to assess the yearly contribution of fossil fuel combustion (BCff) and wood burning (BCwb) to equivalent black carbon (eBC) concentrations, in Athens, Greece. Measurements were conducted at a suburban site from March 2013 to February 2014 and included absorption coefficients at seven wavelengths and PM2.5 chemical composition data for key biomass burning markers, i.e., levoglucosan, potassium (K) and elemental and organic carbon (EC, OC). A well-documented methodology of corrections for aethalometer attenuation coefficients was applied with a resulting annual dataset of derived absorption coefficients for the suburban Athens’ atmospheric aerosol. The Aethalometer model was applied for the source apportionment of eBC. An optimum Ångström exponent for fossil fuel (αff) was found, based on the combined use of the model with levoglucosan data. The measured eBC concentrations were equal to 2.4 ± 1.0 μg m−3 and 1.6 ± 0.6 μg m−3, during the cold and the warm period respectively. The contribution from wood burning was significantly higher during the cold period (21 ± 11%, versus 6 ± 7% in the warm period). BCff displayed a clear diurnal pattern with a morning peak between 8 and 10 a.m. (during morning rush hour) and a second peak during the evening and night hours, due to the shallowing of the mixing layer. Regression analysis between BCwb concentrations and biomass burning markers (levoglucosan, K and OC/EC ratio) supported the validity of the results.

1. Introduction

During the past decade, black carbon (BC) has been identified as an aerosol component of particular interest and has become one of the key research targets for climate change and health impact assessment studies [1]. Airborne particles may affect the radiation balance by reflecting and absorbing solar radiation (direct effect), while they also act as cloud condensation nuclei, altering cloud properties (indirect effect) [2,3]. Light-absorbing particle components warm the atmosphere, counteracting the cooling caused by light-scattering particles. BC is the most efficient light-absorbing species of airborne particulate matter (PM) in the visible spectrum and is thus responsible for a large part of the positive radiation forcing caused by aerosols [4,5]. Jacobson has shown that BC may be considered the second most important component of global warming in terms of direct forcing, since its warming effect exceeds that of CH4 [6]. Due to the relatively short lifetime of BC in the atmosphere, its radiative forcing ends within weeks after emission, making this aerosol species very significant with respect to climate change mitigation strategies. In this framework, the identification of BC emission sources and their respective strength is crucial for global air pollution management and policy-making. It should be also noted that combustion-related aerosols (including BC) have been linked to adverse health effects and are considered more harmful than other anthropogenic and natural particle components [7]. Based on a systematic review and meta-analysis of data on PM and BC exposures and related health effects, Janssen et al. proposed the use of BC as an additional air quality indicator for health impact assessment [8]. Ostro et al. [9] also highlighted the health risks associated with increased exposures to BC, especially in large urban centres.
Black carbon is produced by the incomplete combustion of carbonaceous fuels. In the urban environment, BC is mainly emitted from traffic and residential heating (based on fossil or biomass fuels). Fossil fuel combustion, and especially traffic pollution, has been the focus of air quality research and management efforts for several decades; nevertheless, recently attention has also been given to biomass burning as a potentially significant air pollution source for urban populations. Biomass burning (BB) smoke may relate to controlled burns (such as agricultural fires) and wildfires, transported to the urban environment from regional or more distant sources, as well as residential biomass burning for domestic heating during the winter season. Epidemiological and toxicological studies have provided evidence on the association of exposure to wood smoke and a number of negative health outcomes, including decreased lung function and cardiovascular effects [10,11,12]. Taking into account that wood burning for domestic heating occurs mainly in residential areas and during the evening and nighttime, when people are at home and dispersion conditions are not favorable, it is evident that exposures and related risks may be enhanced [13,14]. Several studies have documented significant aerosol burden from residential wood burning during the winter season [15,16,17]. Nevertheless, emission estimates for wood burning are still very limited, while the corresponding uncertainty remains high. This is mainly due to the difficulty in obtaining reliable wood consumption data and appropriate emission factors. It should be noted that wood-burning emission factors are greatly dependent on the type of wood burnt, as well as on combustion conditions (type of appliance used, combustion temperature, biofuel’s water content) [18].
The use of biomass burning for residential heating is less frequent in Southern Europe compared to Central and Northern Europe, given the milder winters in this region. Nevertheless, several studies have demonstrated an increasing contribution from wood-burning emissions during recent years [19,20,21]. Greece is one of the countries that, besides the previously documented elevated background regional pollution levels in the warm period of the year [22], has seen a significant increase in the use of biomass burning for domestic heating. This was due to a dramatic increase in the price of residential diesel fuel during the period 2010–2013, leading urban populations towards cheaper, alternative fuels for heating [23]. It should be also noted that domestic wood burning in Athens is known to be based, in general, on low-efficiency combustion systems, further aggravating the air pollution burden from this source. Based on a source apportionment study on the evolution of PM source contributions over one decade in Athens, biomass burning contribution increased from 5–7% in 2002 to more than 30% for 2011–2012, with the cold period contributions reaching up 63% in the PM2.5 size fraction [21].
The present work aims at quantifying the yearly contribution of fossil fuel combustion (BCff) and wood burning (BCwb) to equivalent black carbon (eBC) concentrations at a suburban site in Athens. Seasonal, weekly and diurnal variability of these two source contributions were evaluated in order to identify the major activities responsible for the observed eBC levels. The Aethalometer model was applied for the source apportionment of eBC concentrations, while a sensitivity analysis, with respect to the selection of key parameters in the model, was also performed. In addition, BCwb and BCff concentrations were related to typical markers for the respective emission sources, namely levoglucosan, potassium and organic/elemental carbon for biomass burning and nitrogen oxides for fossil fuel combustion.

2. Experiments

2.1. Overview of the Measured Parameters

The present work reports results from measurements of aerosol physico-chemical properties performed at the NCSR Demokritos (DEM) station in Athens, Greece, during March 2013–February 2014. The DEM station is situated inside the NCSR Demokritos campus, in a suburban area 7 km to the North-East of the Athens historic centre and representative of the conditions in large parts of the Athens metropolitan area (37°59′42″ N, 23°48′57″ E) [24].
Real-time data of aerosol absorption at seven wavelengths (370, 470, 520, 590, 660, 880 and 950 nm) and of equivalent black carbon (eBC) at 880 nm were derived from a 7-wavelength aethalometer (Rack Mount Aethalometer Model AE31, Magee Scientific Corp., Berkeley, CA, USA). The instrument sampled from a PM10 cut-off inlet and recorded 5-min average attenuation coefficients. Since ambient BC is mainly related to fine particles [25,26], the obtained BC concentrations may be assessed together with PM2.5 chemical composition data, as described below. The raw data collected by the aethalometer were corrected for the multiple scattering and shadowing effects, with the use of parallel measurements of aerosol scattering obtained on a 1-min basis by a 3-wavelength nephelometer (Aurora 3000, Ecotech Pty Ltd, Victoria, Australia). The nephelometer also collected from a PM10 cut-off inlet, while both instruments were sampling under dry conditions (relative humidity below 40%). Details on the correction methodology applied for the aethalometer data are provided below.
Near-real time elemental (EC) and organic carbon (OC) concentration data were also collected on a 3-h basis, using the Thermo-optical transmittance (TOT) method (Model-4 Semi-Continuous OC-EC Field Analyzer, Sunset Laboratory, Inc., Tigard, OR, USA). The instrument was sampled at a flow rate of 8 lpm, from a PM2.5 cut-off inlet and was equipped with an in-line parallel carbon denuder for the removal of organic gases. The EUSAAR2 protocol was applied for sample analysis [27].
In addition, PM2.5 samples were collected on Teflon and Quartz fiber filters, by the use of a low-volume (2.3 m3 h−1) sampler (Sequential 47/50-CD with Peltier cooler, Sven Leckel GmbH, Berlin, Germany) and a high-volume (30 m3 h−1) sampler (Sequential High-Volume Sampler CAV-A/MSb, MCV, SA, 08293 Collbató, Barcelona, Spain), respectively. The Teflon filters were analysed for potassium (K) and other major and trace elements by Particle-Induced X-ray Emission (PIXE), while the Quartz fiber filters were analysed for levoglucosan by high-performance anion exchange chromatography with pulsed amperometric detection (HPAE-PAD) [28]. Details on the sampling protocol, number of samples collected and analytical procedures applied are provided in Amato et al. [29].
Standard meteorological conditions (including ambient temperature) were also collected at the site. In order to assess seasonal variability, the one-year data were separated into two periods as follows: cold period (1 March 2013–14 April 2013 and 15 October 2013–28 February 2014) and warm period (15 April–14 October 2013). The corresponding average 24-h temperatures were 12.8 ± 3.5 °C and 23.6 ± 4.2 °C, respectively. Additionally, nitrogen oxides (NOx) measurements on a 1-h basis were obtained for the whole study period from a National Monitoring Network station operated by the Hellenic Ministry of Environment & Energy inside the NCSR Demokritos campus, at a distance of about 300 m from the DEM station (available online: http://www.ypeka.gr).

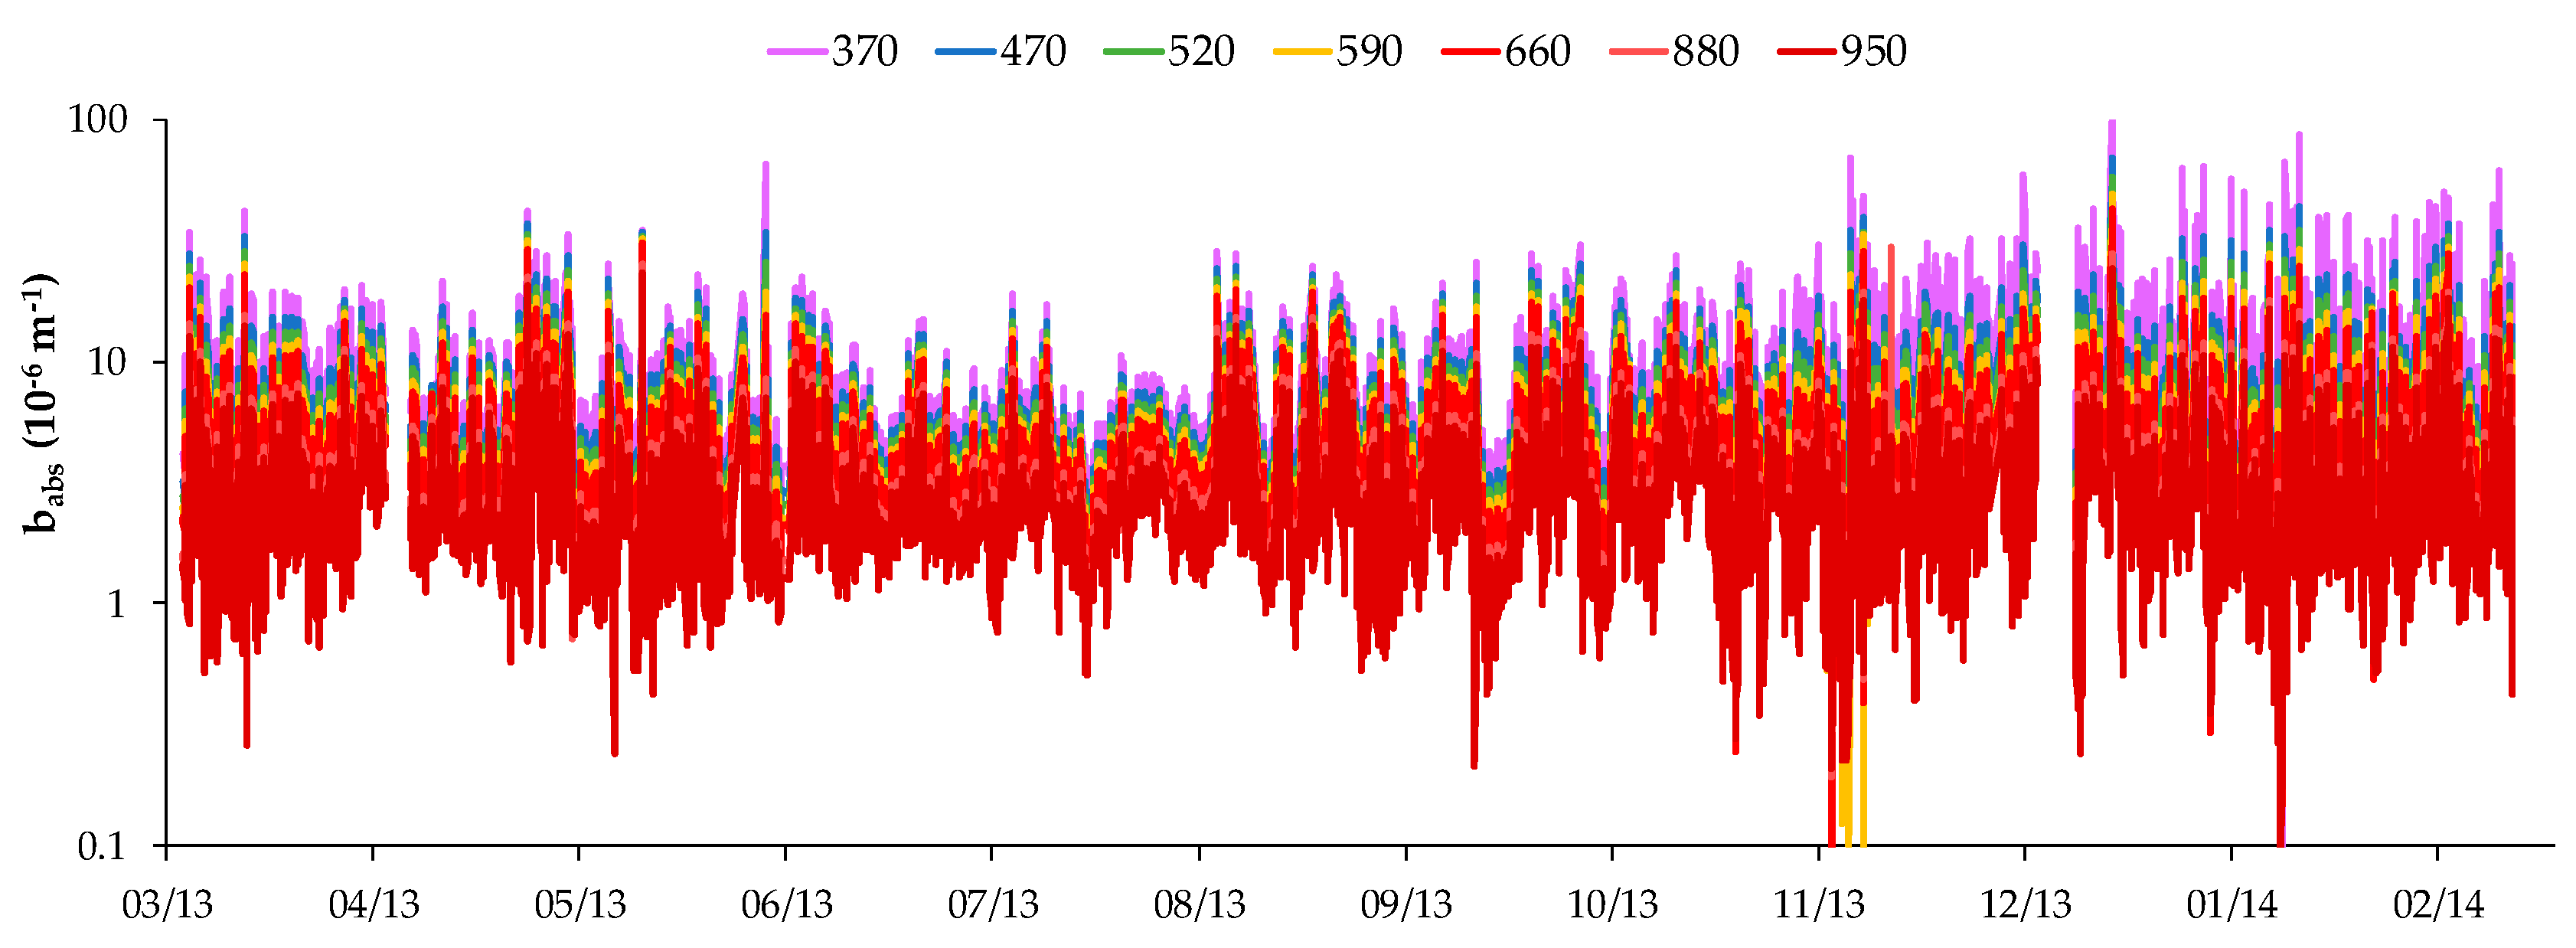
2.2. Correction of the Aethalometer Raw Data

The data collected by the AE31 aethalometer were affected by specific measurement artefacts, referred to, in general, as the multiple scattering and shadowing effects. In this work, the correction algorithm developed by Weingartner et al. [30] has been employed in order to compensate for these effects and obtain the aerosol absorption coefficients (babs). The BC raw data collected by the aethalometer at seven wavelengths were transformed to respective attenuation coefficients (batn), based on the “Sigma” specific attenuation parameters provided by the instrument. The attenuation coefficients were then used to calculate the absorption coefficients (babs), by applying the following equation:
b a b s ( λ ) t = b a t n ( λ ) t · 1 C · R ( A T N ) λ , t
where babs(λ)t and batn(λ)t are the absorption and attenuation coefficients at the λ wavelength for each time step t. Parameter C is a site-specific empirical constant and corresponds to the correction factor accounting for multiple scattering by the filter fibers and the scattering of the aerosol embedded in the filter. Based on parallel measurements performed by AE31 and a multi-angle absorption photometer (MAAP) (Model 5012, Thermo Electron Group, Waltham, MA, USA) during 2011 at the DEM station, a characteristic value for C equal to 3 was derived for the AE31 operating at the station, in line with WMO/GAW Aerosol Measurement Procedures, Guidelines and Recommendations [31]. Parameter R(ATN)λ,t is a parameter accounting for the shadowing effect and is again calculated for each wavelength λ and each time step t. R(ATN) varies with the amount of particles embedded in the filter and the optical properties of the deposited particles and was calculated from equation:
R ( A T N ) = ( 1 f 1 ) · ln ( A T N ) ln ( 10 % ) ln ( 50 % ) ln ( 10 % ) + 1
where ATN is the attenuation measured by the instrument during each 5-min time step. R(ATN) was set equal to 1 for values of the ATN below 10%. Parameter f was calculated as:
f = a · ( 1 ω 0 ) + 1
where ω0 is the aerosol single scattering albedo and α a constant parameter, varying in the range 0.82–0.88 for the different wavelengths (950–370 nm) [30]. The single scattering albedo is the ratio of scattering over total attenuation (scattering and absorption). It was calculated from absorption coefficient data (obtained from the aethalometer, after correcting for the multiple scattering effect) and scattering coefficient data (obtained by the nephelometer). Running 1-h averages were used for the calculation of ω0 and subsequently parameter f.

2.3. Estimation of BC from Wood Burning and Fossil Fuel Combustion

The absorption coefficients derived from the aethalometer were used for the estimation of the contribution of wood burning and fossil fuel to the total black carbon concentrations, through the application of the Aethalometer model. The model was developed by Sandradewi et al. and is based on the different spectral dependence of wood burning and fossil fuel combustion aerosol [32]. Aerosol absorption coefficients at two wavelengths, one in the ultraviolet (UV) and one in the infrared (IR) range, are used in order to apply the model through the following calculation formulas:
b a b s ( λ U V ) w b = 1 1 ( λ U V λ I R ) a f f · ( λ U V λ I R ) a w b · [ b a b s ( λ U V ) ( λ U V λ I R ) a f f · b a b s ( λ I R ) ]
b a b s ( λ I R ) w b = ( λ U V λ I R ) a w b · b a b s ( λ U V ) w b
b a b s ( λ U V ) f f = b a b s ( λ U V ) b a b s ( λ U V ) w b
b a b s ( λ I R ) f f = b a b s ( λ I R ) b a b s ( λ I R ) w b
where αff and αwb are the absorption Ångström exponents for pure fossil fuel combustion and pure wood burning aerosol, respectively; babs(λUV) and babs(λIR) are the absorption coefficients measured at the UV and IR wavelengths, respectively and babs(λUV)wb & babs(λIR)wb and babs(λUV)ff & babs(λIR)ff are the corresponding absorption coefficients at these two wavelengths that are related to wood burning (wb) and fossil fuel combustion (ff).
The Aethalometer model has been applied in several studies for apportioning carbonaceous aerosol to fossil fuel combustion and biomass burning [33,34,35,36,37,38], despite certain uncertainties, mainly associated with the selection of appropriate values for αff and αwb. In the present study, calculations were performed for the 470 (UV) and 950 nm (IR). In addition, a sensitivity analysis was carried out in order to assess the impact of the selected values for the Ångström exponents (αff and αwb) on the estimated contributions from wood burning and fossil fuel combustion.

3. Results

The BC data obtained by the aethalometer were transformed to raw aerosol attenuation coefficients and were then corrected according to the methodology described above. The time series of 1 h mean-corrected absorption coefficients (from henceforth absorption coefficients, babs) over the whole measurement period (March 2013–February 2014) are depicted in Figure 1.

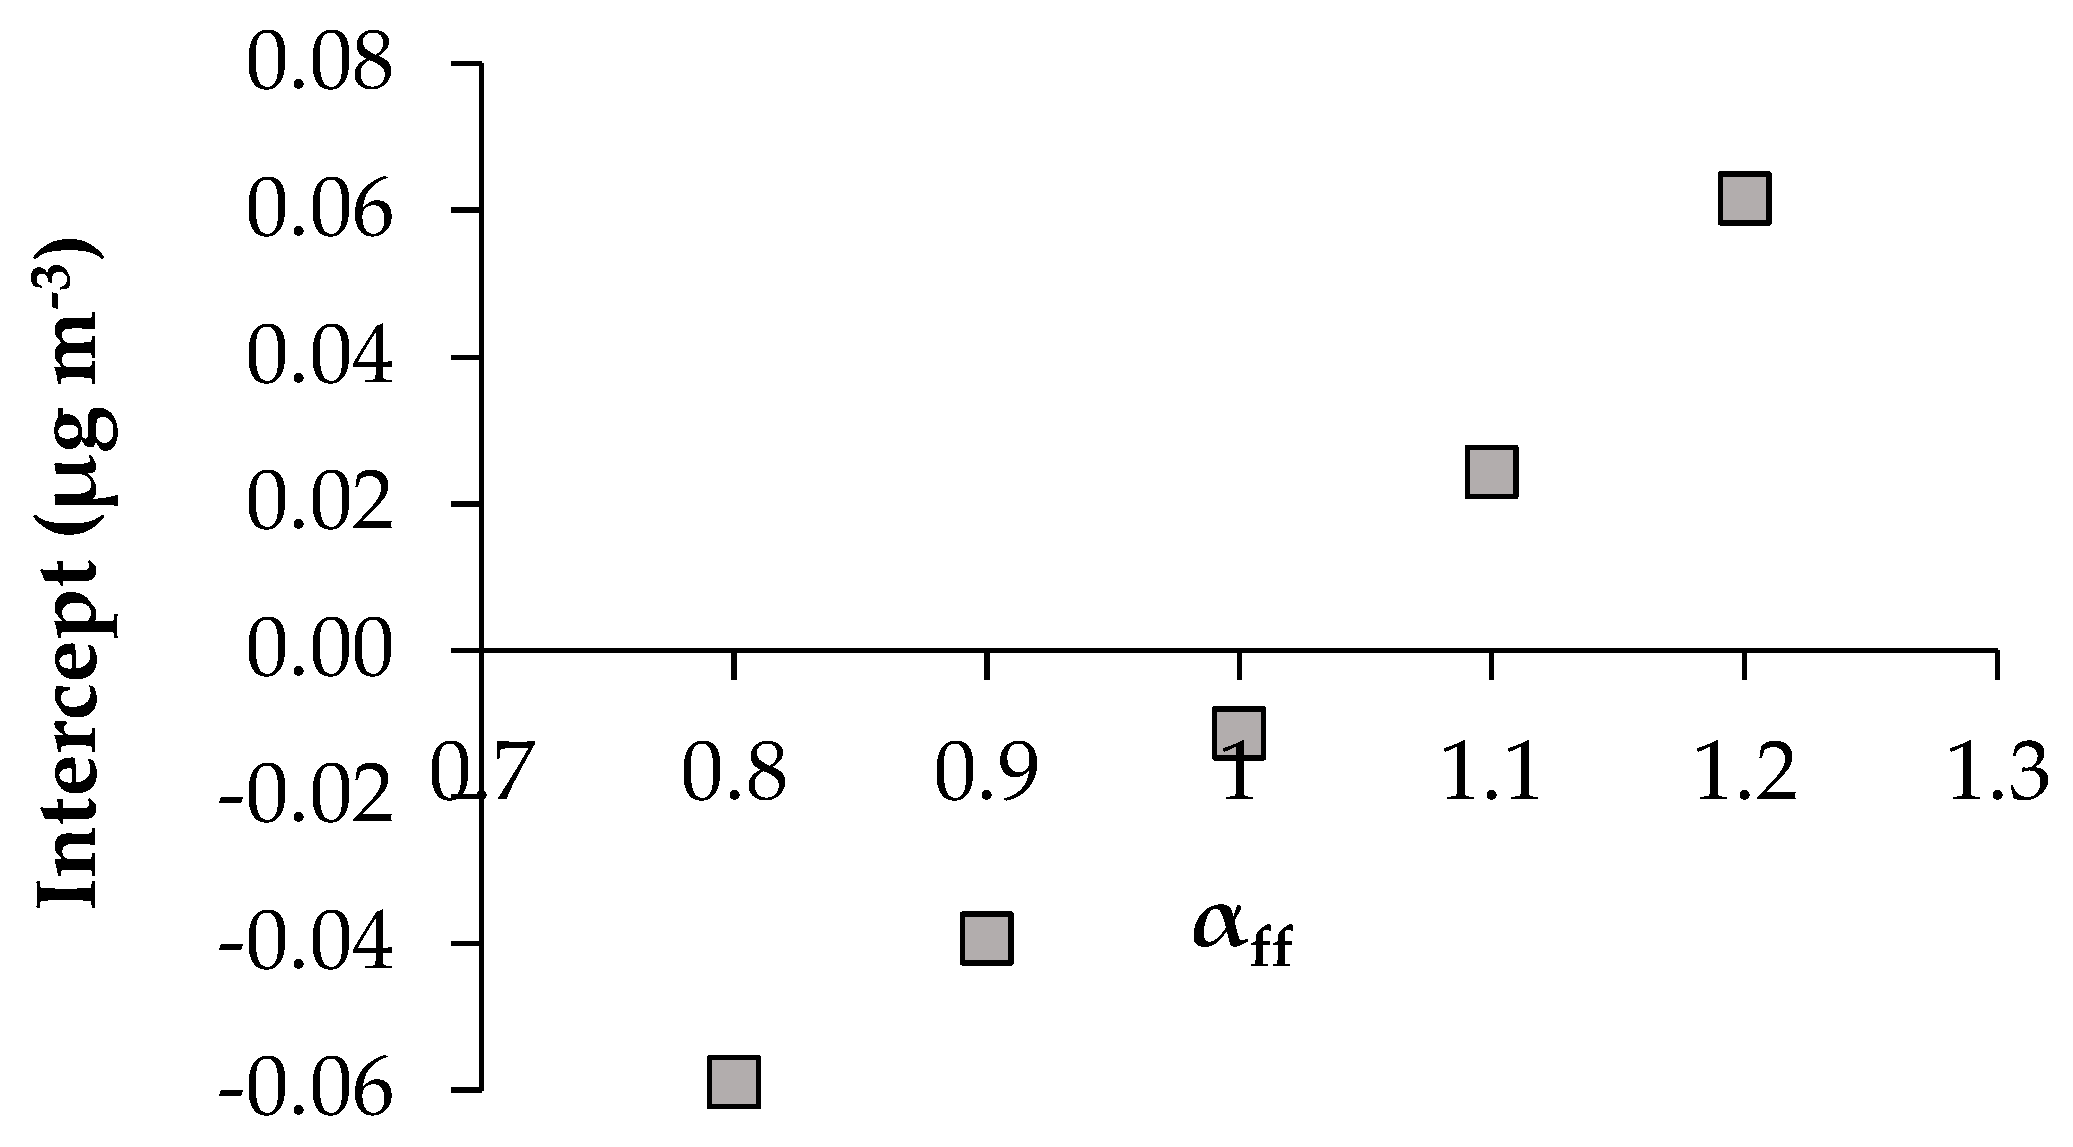
3.1. Sensitivity Analysis on the Aethalometer Model

The application of the Aethalometer model, described in Equations (4)–(7), requires the selection of suitable Ångström exponents for fossil fuel (αff) and wood burning (αwb). As is evident from Equation (4), the selection of αwb only affects the magnitude of the estimated babs(λ)wb, while αff has an impact on its temporal variability as well. A series of tests were therefore conducted with the value of αff ranging between 0.8 and 1.2, by a step of 0.1, based on typical values for fossil fuel combustion aerosol found in the literature [4,32,33,39]. The value of αwb was set at this point equal to 2.0, which is considered a typical value of the Ångström exponent for wood burning aerosol [38]. The estimated absorption coefficients for wood burning at 950 nm (babs(950)wb) were averaged over 24 h and were correlated with concentrations of levoglucosan measured at the site during the same period. Since levoglucosan is only emitted during wood-burning processes, no levoglucosan is expected to be measured during periods with zero contribution from wood burning. Therefore, the regression of levoglucosan concentrations over the estimated babs(950)wb was expected to yield a zero intercept. The calculated intercepts for the different αff values are presented in Figure 2. The obtained Pearson coefficients (0.78–0.86) indicated good correlation, further supporting the use of this methodology. Based on this analysis, the value of 1.03 was selected as optimum for αff value, since it produced a zero intercept in the linear regression of levoglucosan to babs(950)wb.
This αff value was then used in Equations (4)–(7), for the quantification of absorption coefficients related to wood burning and fossil fuel, at 470 and 950 nm. Calculations were made for different values of αwb, in the range 1.1–3.0, by a step of 0.1, according to typical values for wood burning aerosol found in the literature [4,40,41]. In order to identify an acceptable range of values for αwb, the calculated babs(950)ff were correlated with NOx data, which are mainly related to fossil fuel combustion emissions [33]. Values of αwb below 1.7 produced either no correlation or weak correlations (Pearson coefficients below 0.7). For αwb values in the range 1.7–3.0, the correlation of NOx and babs(950)ff was significant (at p = 0.01), with a Pearson coefficient of 0.71–0.72. For all these αwb values, babs(880)wb was calculated from babs(470)wb based on the spectral dependence of the absorption coefficient for wood burning aerosol:
b a b s ( 880 ) w b = ( 470 880 ) a w b · b a b s ( 470 ) w b
The corresponding babs(880)ff was found by subtracting the wood-burning contribution (babs(880)wb) from the total babs measured at 880 nm. The relative contributions of fossil fuel (FF) and wood burning (WB) to aerosol absorption at 880 nm, as estimated by the use of the different αwb values, over the whole year and during the warm and cold period, are presented in Table 1. All further analysis was performed with αwb equal to 2.0, since this is the value proposed by most studies [35,38]. This value is also very similar to the maximum Ångström exponent values during the winter period (2.03–2.04), observed during nighttime hours when wood-burning contributions are expected to be significant.

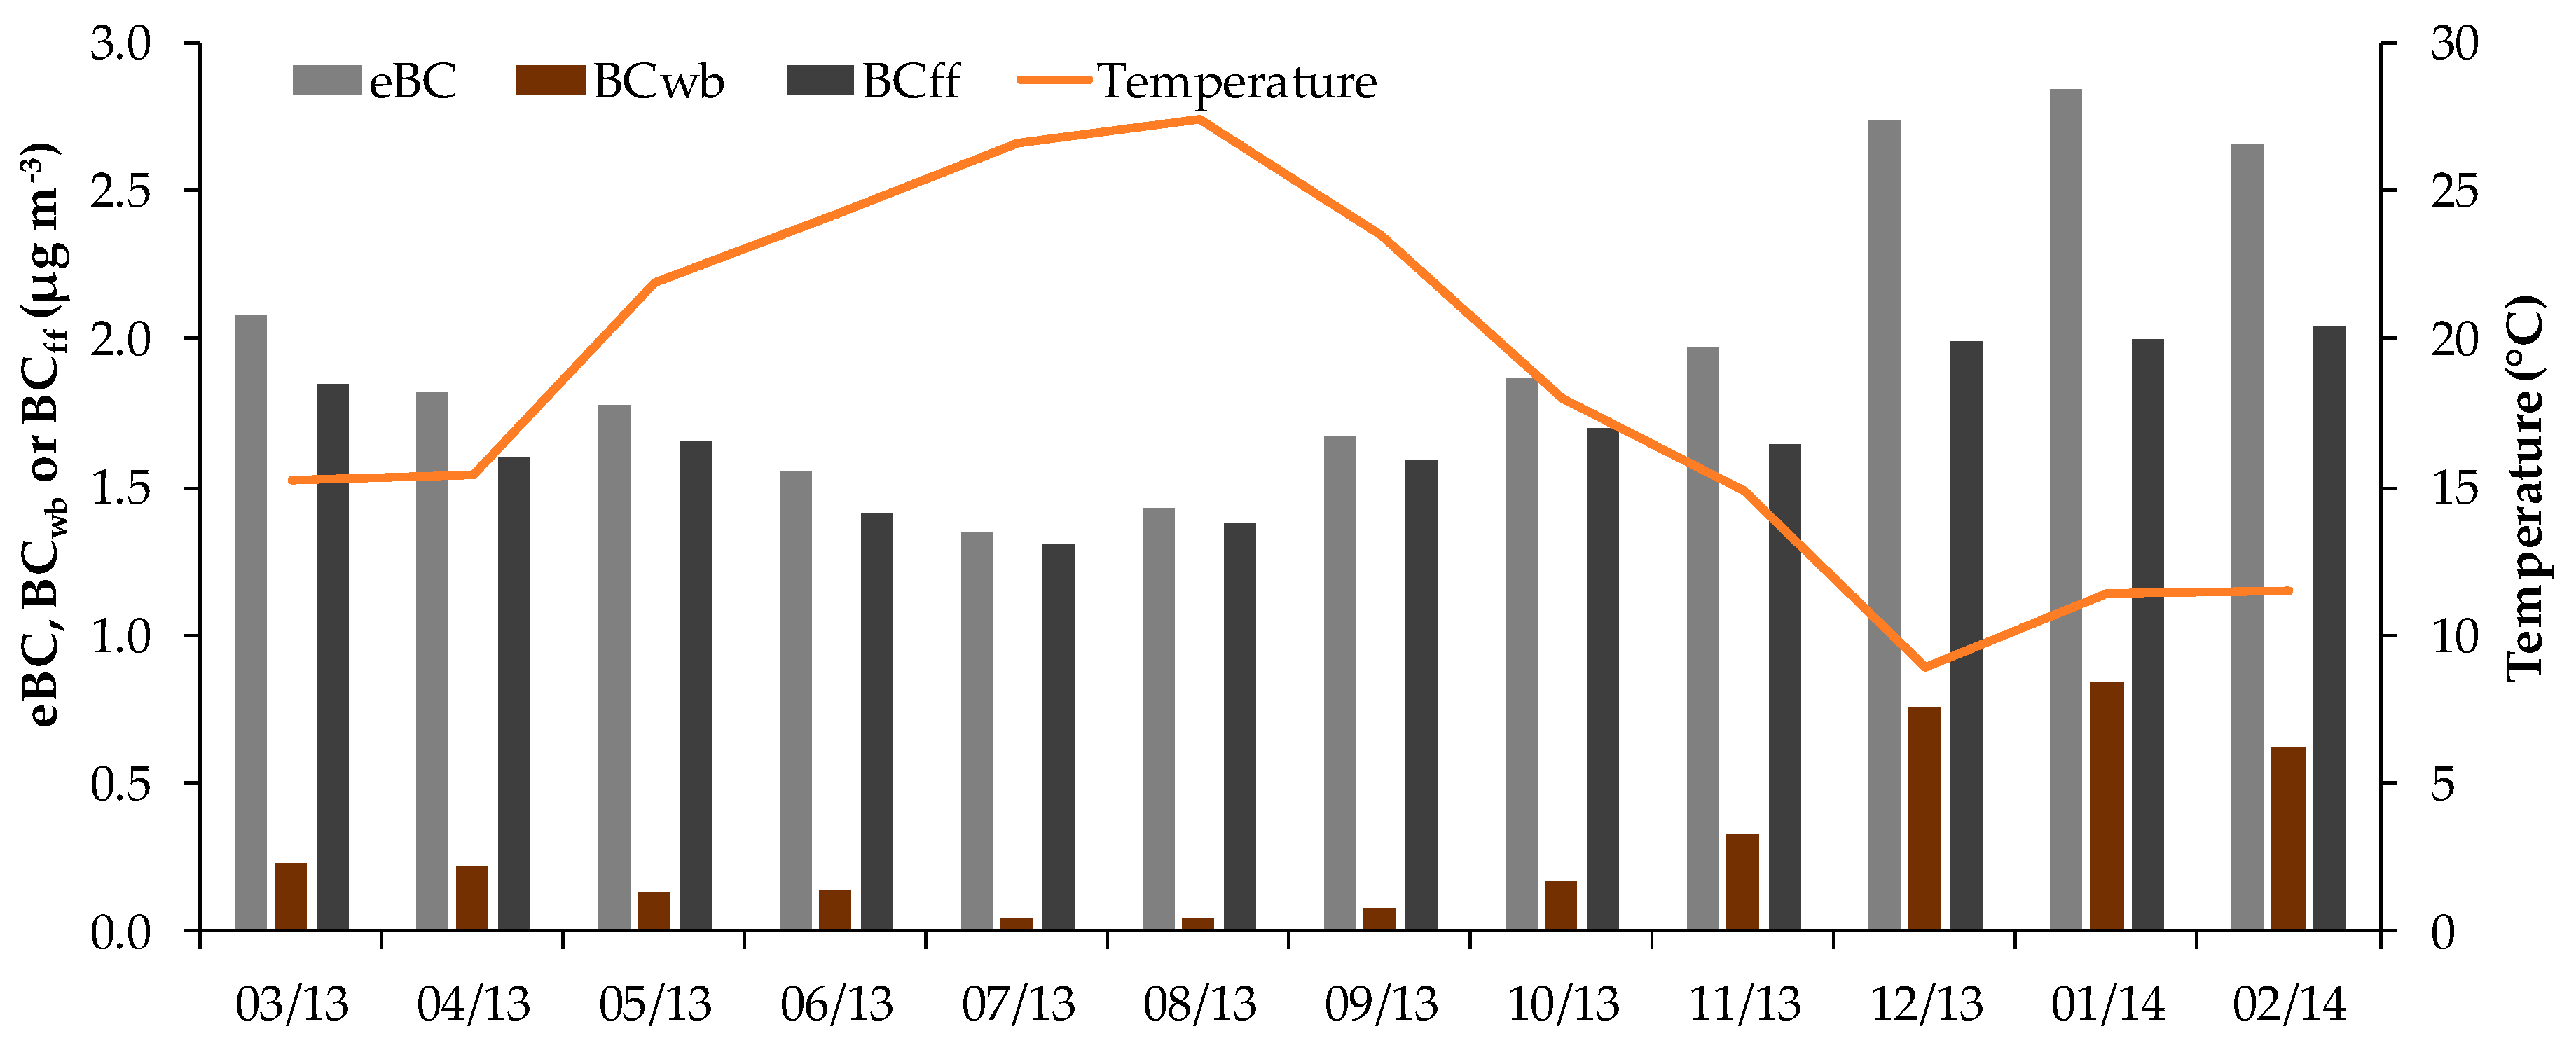
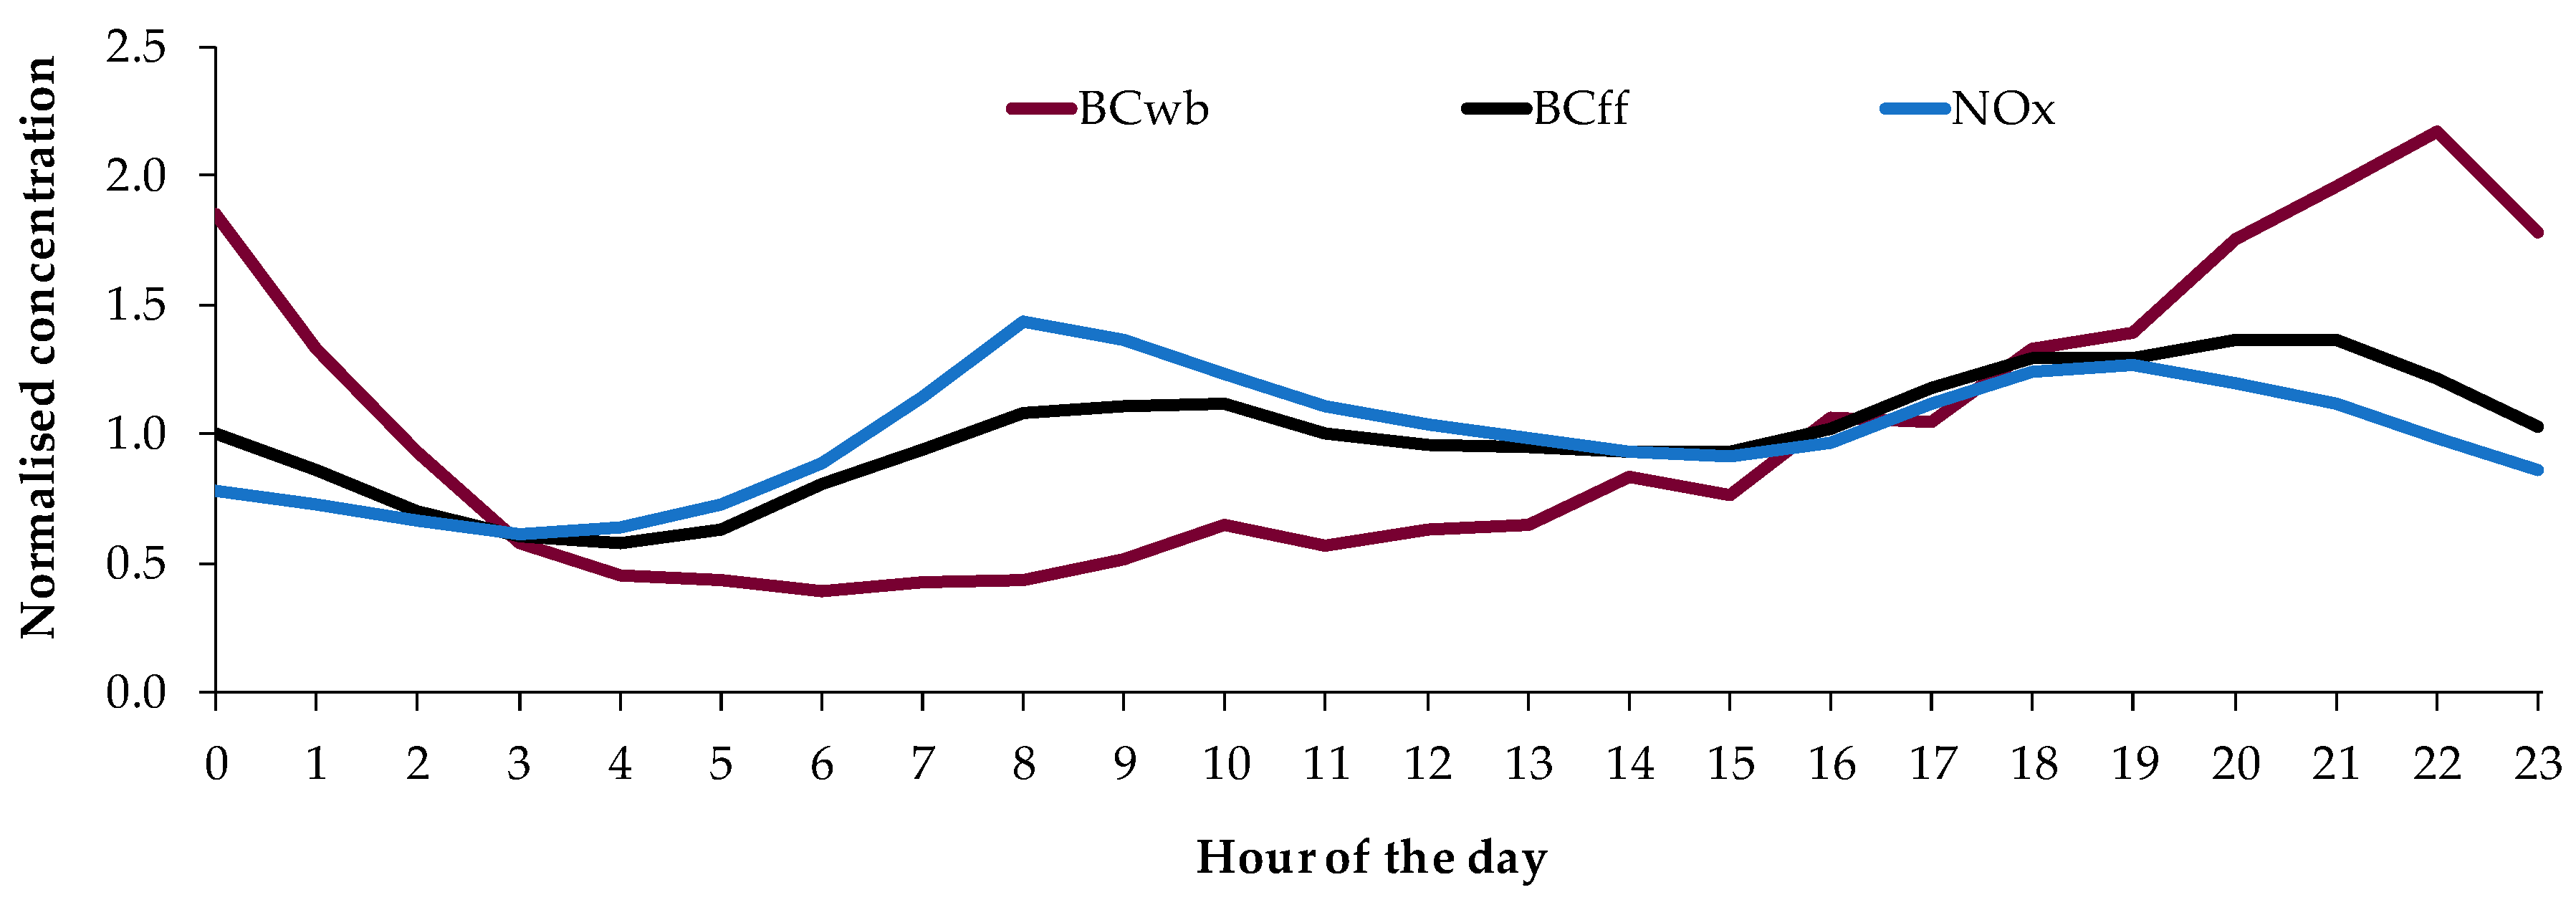
3.2. Seasonal and Diurnal Variability of Black Carbon from Fossil Fuel and Wood Burning

In order to quantify the equivalent BC (eBC) measured by the aethalometer, the mass absorption cross-section (MAC) for the study period was calculated by relating the babs(880) data with elemental carbon (EC) concentrations measured on a 3-h basis (Figure S1). An average MAC equal to 4.1 m2 g−1 was calculated for the entire study period, with 24-h values ranging from 2.0–9.9 (Figure S2). Kalogridis et al. calculated a MAC of 7.5 m2 g−1 for the DEM station during December 2014–March 2015 [38]. The lower MAC value found in the present work relates to the different study period. The MAC value of ambient aerosol is known to vary significanly in time and space, since it is strongly affected by the aerosol mixing state, size, and morphology [42]. Bond and Bergstrom have reviewed several studies and reported MAC values in the range 5–14 at 550 nm [43], which corresponds to 3–8 at 880 nm (as calculated for the average Ångström exponent in the present study, equal to 1.12). Our MAC value is at the lower limit of the values reported by Zanatta et al. (4.5–12, calculated for 880 nm) for nine rural background stations across Europe [44], and within the range of values reported by Hitzenberger et al. for an urban background site in Vienna (4–5 at 880 nm) [45].
The equivalent black carbon (eBC) concentration, as well as the BC concentrations related to wood burning (BCwb) and to fossil fuel combustion (BCff), were calculated based on a common MAC value (4.1 m2 g−1) and were equal to the corresponding absorption coefficients divided by the MAC. The concentration levels of eBC, BCwb and BCff, during the period March 2013–February 2014 and during the warm and cold periods are presented in Table 2. The respective concentrations on a monthly basis are depicted in Figure 3.
The difference between weekday and weekend concentrations of BCwb was not statistically significant. BCff concentrations during weekdays and weekends were statistically different during the cold period (at p = 0.05), with the weekend concentrations being lower than the levels observed during the work days. This difference was not statistically significant in the warm period; people tend to be more frequently outdoors in the weekends during the warm months compared to the cold months, which may result in high traffic during both weekdays and weekends. Mean diurnal cycles during the warm and cold period are presented in Figure 4. The BCwb and BCff diurnal cycles during the cold period are also displayed along with the corresponding NOx cycle (Figure 5). Concentrations of all three pollutants have been normalised based on their mean value, for a better comparison of the relevant time trends.

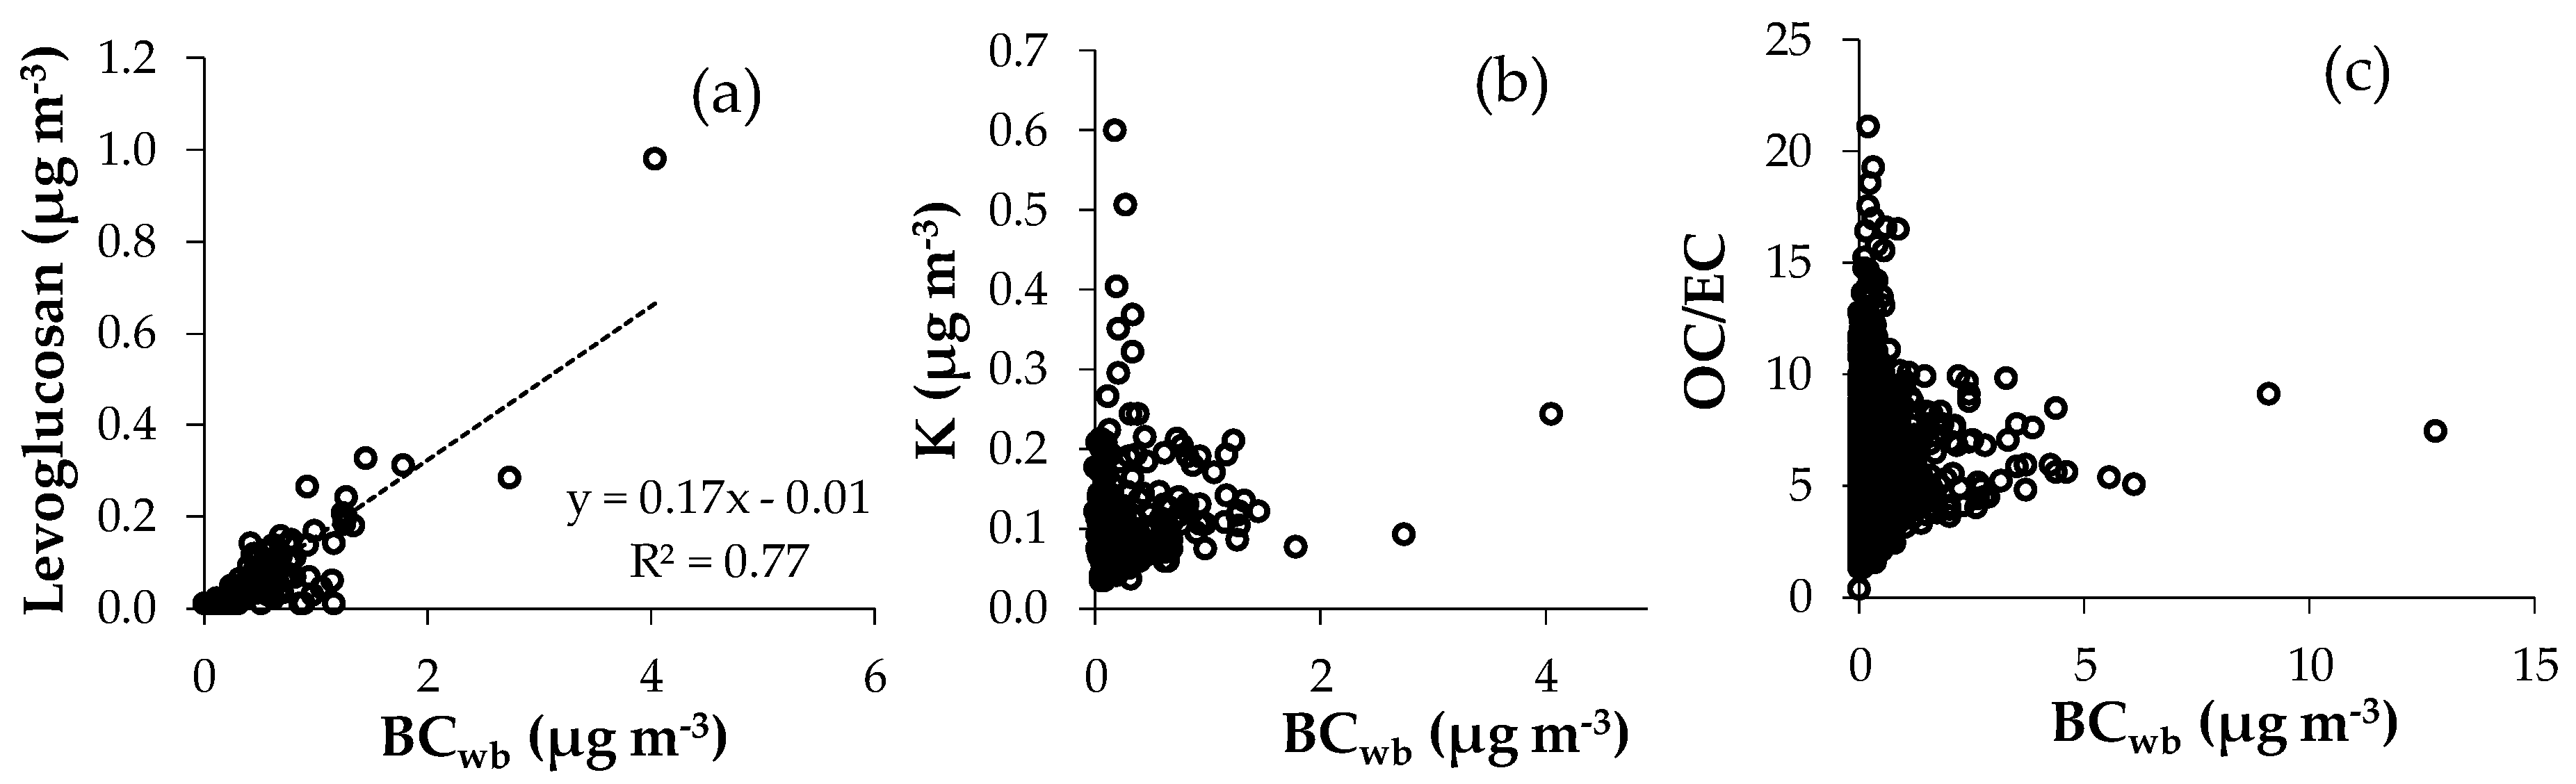
3.3. Correlation with Biomass Burning Markers

The estimated BCwb hourly concentrations were averaged on a 24-h basis and were compared to concentration data of levoglucosan and K, obtained through 24-h filter measurements (Figure 6a,b). These two species are commonly used as biomass burning markers, since they have been identified as dominant components of biomass burning smoke aerosol [46]. Potassium is emitted through the burning of K-rich plant material [47], while levoglucosan is produced during pyrolisis of cellulose and hemicelluloses [48]. In addition, elemental (EC) and organic carbon (OC) concentrations measured on a 3-h basis were used to calculate respective OC/EC ratios, for comparison with the BCwb concentrations (Figure 6c). The value of the OC/EC ratio is characteristic of the type of fuel burnt. Typical OC/EC ratios for biomass burning are around 6–8, with maximum values reaching up to 14–15 [49,50,51].

4. Discussion

The combined use of the Aethalometer model with levoglucosan data allowed for the selection of an optimum Ångström exponent for fossil fuel (αff), thus significantly decreasing the uncertainty associated with the model [14,35]. The optimum value for αff (1.03) defined in the present study is within the typical values reported in the literature [34]. It should be also noted that the 25th percentile of 1-h Ångström exponent values, calculated by the absorption coefficient (babs) data in all seven wavelengths, was equal to 0.99. This lowest range of values of the Ångström exponent should be representative of pure fossil fuel combustion and is very similar to the selected αff value of 1.03. In addition, the average value of the Ångström exponent during 8:00–9:00 a.m., the period with the highest traffic contribution (Figure 5), was equal to 1.02, further supporting the validity of our analysis.
The identification of a suitable value for the Ångström exponent for wood burning (αwb) is a more complex procedure, given the wide range of values reported for this parameter in the literature. αwb may be affected by the type of wood burnt and the combustion regime [33]; thus, representative αwb values for summer (when wood burning mostly relates to forest fires and/or agricultural fires) and winter conditions (when residential heating may contribute significantly to BB aerosol) can differ. The uncertainty related to the BB contribution was calculated in the order of ±50%. The FF contribution was much less sensitive to changes in αwb values (uncertainty in the order of ±5%). The significant impact of the Ångström exponent values on the estimated FF and BB contributions has been highlighted in other recent research works [14,33,36,52], while Sciare et al. have noted, in agreement with our study, the stronger impact of the αwb value on the estimated wood burning in comparison to fossil fuel contribution [34].
The measured eBC, BCwb and BCff concentrations are comparable to typical urban background levels [14,53] and are representative of the suburban character of the station. Despite the relatively low levels of concentrations, there was significant (at p = 0.05) seasonal variability, pointing towards different sources during the warm and cold periods. The monthly variability of BCwb clearly revealed the impact of residential heating; highest BCwb concentrations were observed during the winter months (December–February), when ambient temperatures were also at their minimum levels. Mean relative contribution of wood burning during these months was calculated equal to 27%. Kalogridis et al. reported a contribution from BCwb of 34% for the winter months of the following year (2014–2015) [38]. It should be noted that the period of 2013–2014 was characterised by an exceptionally mild winter, which may explain the slightly lower BCwb contributions. Sciare et al. have calculated very similar winter-time contributions for a suburban site in Paris, France (25%) [34]. Lower contributions (on average equal to 18%) have been found for an urban background site in Grenoble, France, possibly due to a higher contribution from fossil fuel combustion related to traffic [33]. Slightly higher contributions (30–47%) have been reported for the winter months in Granada, Spain [35]. The lowest BCff concentrations corresponded to the months of July and August, pointing towards reduced anthropogenic activities (e.g., traffic) during the summer vacations.
BCwb did not display statistically significant difference in the weekday and weekend concentrations during either season. No weekly pattern was expected for the warm period, since wood burning is related to forest fires or agricultural burning. On the other hand, the similarity in weekday and weekend BCwb concentrations during the cold period suggests that wood burning was used throughout the week for domestic heating and was not related only to the occasional use of fireplaces during leisure time. The same behaviour was observed by Fourtziou et al. at a site located in the Athens city centre [54].
Black carbon from fossil fuel displayed a clear diurnal pattern with a morning peak at 8–10 a.m., during morning rush hour, and a second peak in the evening and night hours, due to the shallowing of the mixing layer. This second peak was larger during the cold period, when this phenomenon was more intense (Figure 4). A very similar diurnal trend was observed for the NOx concentrations, confirming the common origin of NOx and BCff, during both the warm and cold period (Figure 5). A slight difference in the magnitude of the NOx and BCff peaks present in the diurnal cycles of the normalised concentrations may be related to varying NOx/BCff emission ratios, due to changes in the relative contribution of fossil fuel combustion sources (emissions from vehicular traffic and residential heating), as well as variability in driving modes during congestion and non-congestion hours [55]. It should be also noted that NOx and BCff display distinct formation and loss mechanisms, and thus resulting lifetimes. The BCwb hourly concentrations followed a very different pattern in comparison to BCff. During the cold period, concentrations were minimum during the day and gradually increased from the afternoon to the night hours. Even though the low mixing layer during nighttime impacts all pollutants, the much larger increase observed after 7 p.m., in comparison to BCff and NOx, clearly points towards another source active at these after-work hours, such as the residential heating (Figure 5). No pattern was observed for the wood-burning BC in the warm months, suggesting random BB events during that period. Similar diurnal trends of BCff and BCwb concentrations have been reported by Fuller et al. [14].
The estimated BCwb concentrations displayed good correlation with levoglucosan (Pearson coefficient equal to 0.88); nevertheless, there were several days (mainly in the warm period) when there was a measurable contribution from BCwb but levoglucosan concentrations were below the detection limit (Figure 6a). This discrepancy may be due to the instability of levoglucosan, especially during the warm period. Hoffmann et al. have demonstrated that levoglucosan can be readily oxidised by OH radicals during daytime with higher degradation flux during the summer period [56].
The regression between BCwb and K (Figure 6b) indicated the presence of two major sources for K. While there was a clear trend of increasing K concentrations with increasing BCwb, a large group of data revealed high K concentrations and minimum BCwb values. These data may be representative of another major source for K, such as mineral dust, which has been found to contribute significantly to PM2.5 concentrations at DEM station [57]. It should be also noted that potassium is produced in different amounts during wood-burning processes, depending on the type of fuel and combustion; it is thus a reliable wood-burning marker, but not a metric for a quantitative estimate of BCwb concentrations when assessing long-term data, including various types of BB smoke aerosol [34].
The regression between BCwb and the OC/EC ratio has produced a similar pattern to that of K (Figure 6c). The OC/EC ratio is increasing with BCwb, while for BCwb concentrations above 5 μg m−3, the OE/EC ratio remains in the range 5–10. From previous measurements at the DEM station, OC/EC ratios in the range 10–14 were obtained during a wildfire episode in the countryside areas around Athens in the summer of 2009 [58]. Diapouli et al. reported a mean value of this ratio in the range 7–10 at urban background and suburban sites in Athens, during the cold period of 2012, when intense use of fireplaces and wood stoves has been documented in the residential areas of big urban centres in Greece [21]. The OE/EC ratios measured in the present work, and during periods with significant contribution from BCwb, are in good agreement with the above mentioned studies, as well as with studies in other European urban centres [33]. The presence of very high OC/EC ratios that are not correlated to BCwb concentrations may be related to secondary organic aerosol formation, which has been shown to greatly impact our site [59].

5. Conclusions

The contribution of fossil fuel and wood burning to eBC concentrations was quantified for the suburban aerosol in Athens, Greece, through the application of the Aethalometer model. The combined use of the model with levoglucosan data allowed for the selection of an optimum Ångström exponent for fossil fuel (αff), significantly decreasing the uncertainty of the estimated BCwb and BCff concentrations. Fossil fuel combustion was found to be the major contributing source to eBC levels, during both the warm and cold period. Nevertheless, the impact of wood burning related to domestic heating cannot be ignored. BCwb increased during the winter period, reaching up to a mean monthly contribution of 30% during the coldest months. Until now, public policies mainly focus on transportations or industrial emissions, while wood is often promoted as a renewable energy source and a carbon-neutral fuel, in line with the EU efforts to reduce CO2 emissions. In this framework, demonstrating the impact of BB smoke on air quality and human exposure to health-related pollutants may assist in directing policy efforts towards this source, in order to discourage further increase of the use of wood burning for residential heating in densely populated urban areas, and to press for more efficient, low-polluting biomass burning systems.

Supplementary Materials

The following are available online at https://www.mdpi.com/2073-4433/8/12/234/s1, Figure S1: Regression of the aerosol absorption coefficients (babs) at 880 nm versus elemental carbon (EC) concentrations. The data represent 3-h averages and were collected during 03/2013–02/2014, Figure S2: Mean 24-h values of the mass absorption cross-section (MAC), based on the ratio of the absorption coefficients (babs) at 880 nm to EC concentrations, measured during 03/2013–02/2014.

Acknowledgments

Financial support from the EnTeC FP7 Capacities programme (REGPOT-2012-2013-1, FP7, ID: 316173) project and the AIRUSE LIFE+ (ENV/ES/584) EU project is acknowledged.

Author Contributions

Evangelia Diapouli, Athina-Cerise Kalogridis and Konstantinos Eleftheriadis conceived and designed the experiments; Christina Markantonaki, Stergios Vratolis, Prodromos Fetfatzis and Cristina Colombi and Evangelia Diapouli performed the experiments; Evangelia Diapouli and Athina-Cerise Kalogridis analysed the data; Evangelia Diapouli wrote the paper.

Conflicts of Interest

The authors declare no conflict of interest. The founding sponsors had no role in the design of the study; in the collection, analyses, or interpretation of data; in the writing of the manuscript, and in the decision to publish the results.

References

  1. Petzold, A.; Ogren, J.A.; Fiebig, M.; Laj, P.; Li, S.-M.; Baltensperger, U.; Holzer-Popp, T.; Kinne, S.; Pappalardo, G.; Sugimoto, N.; et al. Recommendations for the interpretation of “black carbon” measurements. Atmos. Chem. Phys. 2013, 13, 8365–8379. [Google Scholar] [CrossRef] [Green Version]
  2. Lohmann, U.; Feichter, J. Global indirect aerosol effects: A review. Atmos. Chem. Phys. 2005, 5, 715–737. [Google Scholar] [CrossRef]
  3. Satheesh, S.K.; Moorthy, K.K. Radiative effects of natural aerosols: A review. Atmos. Environ. 2005, 39, 2089–2110. [Google Scholar] [CrossRef]
  4. Kirchstetter, T.W.; Novakov, T.; Hobbs, P.V. Evidence that the spectral dependence of light absorption by aerosols is affected by organic carbon. J. Geophys. Res. 2004, 109, D21208. [Google Scholar] [CrossRef]
  5. Ramanathan, V.; Carmichael, G. Global and regional climate changes due to black carbon. Nat. Geosci. 2008, 1, 221–227. [Google Scholar] [CrossRef]
  6. Jacobson, M.Z. Strong radiative heating due to the mixing state of black carbon in atmospheric aerosols. Nature 2001, 409, 695–697. [Google Scholar] [CrossRef] [PubMed]
  7. WHO (World Health Organization). Health relevance of particulate matter from various sources. In Report on a WHO Workshop; EU/07/5067587; World Health Organization Regional Office for Europe: Copenhagen, Denmark, 2007. [Google Scholar]
  8. Janssen, N.A.H.; Hoek, G.; Simic-Lawson, M.; Fischer, P.; van Bree, L.; ten Brink, H.; Keuken, M.; Atkinson, R.W.; Anderson, H.R.; Brunekreef, B.; et al. Black carbon as an additional indicator of the adverse health effects of airborne particles compared with PM10 and PM2.5. Environ. Health Perspect. 2011, 119. [Google Scholar] [CrossRef]
  9. Ostro, B.; Tobias, A.; Karanasiou, A.; Samoli, E.; Querol, X.; Rodopoulou, S.; Basagaña, X.; Eleftheriadis, K.; Diapouli, E.; Vratolis, S.; et al. The risks of acute exposure to black carbon in Southern Europe: Results from the MED-PARTICLES project. Occup. Environ. Med. 2015, 72, 123–129. [Google Scholar] [CrossRef]
  10. Barregard, L.; Sallsten, G.; Andersson, L.; Almstrand, A.-C.; Gustafson, P.; Andersson, M.; Olin, A.-C. Experimental exposure to wood smoke: Effects on airway inflammation and oxidative stress. Occup. Environ. Med. 2007, 65, 319–324. [Google Scholar] [CrossRef]
  11. Naeher, L.P.; Brauer, M.; Lipsett, M.; Zelikoff, J.T.; Simpson, C.D.; Koenig, J.Q.; Smith, K.R. Woodsmoke health effects: A review. Inhal. Toxicol. 2007, 19, 67–106. [Google Scholar] [CrossRef]
  12. Bølling, A.K.; Pagels, J.; Yttri, K.E.; Barregard, L.; Sallsten, G.; Schwarze, P.E.; Boman, C. Health effects of residential wood smoke particles: The importance of combustion conditions and physicochemical particle properties. Part. Fibre Toxicol. 2009, 6, 29. [Google Scholar] [CrossRef] [PubMed]
  13. Reis, F.; Marshall, J.D.; Brauer, M. Intake fraction of urban wood smoke. Environ. Sci. Technol. 2009, 43, 4701–4706. [Google Scholar] [CrossRef]
  14. Fuller, G.W.; Tremper, A.H.; Baker, T.D.; Yttri, K.E.; Butterfield, D. Contribution of wood burning to PM10 in London. Atmos. Environ. 2014, 87, 87–94. [Google Scholar] [CrossRef] [Green Version]
  15. Lanz, V.A.; Alfarra, M.R.; Baltensperger, U.; Buchmann, B.; Hueglin, C.; Szidat, S.; Wehrli, M.N.; Wacker, L.; Weimer, S.; Caseiro, A.; et al. Source attribution of submicron organic aerosols during wintertime inversions by advanced factor analysis of aerosol mass spectra. Environ. Sci. Technol. 2008, 42, 214–220. [Google Scholar] [CrossRef] [PubMed]
  16. Favez, O.; Cachier, H.; Sciare, J.; Sarda-Estève, R.; Martinon, L. Evidence for a significant contribution of wood burning aerosols to PM2.5 during the winter season in Paris, France. Atmos. Environ. 2009, 43, 3640–3644. [Google Scholar] [CrossRef]
  17. Borrego, C.; Valente, J.; Carvalho, A.; Sá, E.; Lopes, E.; Miranda, A.I. Contribution of residential wood combustion to PM10 levels in Portugal. Atmos. Environ. 2010, 44, 642–651. [Google Scholar] [CrossRef] [Green Version]
  18. Alves, C.; Gonçalves, C.; Fernandes, A.P.; Tarelho, L.; Pio, C. Fireplace and woodstove fine particle emissions from combustion of western Mediterranean wood types. Atmos. Res. 2011, 101, 692–700. [Google Scholar] [CrossRef]
  19. Viana, M.; Reche, C.; Amato, F.; Alastuey, A.; Querol, X.; Moreno, T.; Lucarelli, F.; Nava, S.; Calzolai, G.; Chiari, M.; et al. Evidence of biomass burning aerosols in the Barcelona urban environment during winter time. Atmos. Environ. 2013, 72, 81–88. [Google Scholar] [CrossRef]
  20. Nava, S.; Lucarelli, F.; Amato, F.; Becagli, S.; Calzolai, G.; Chiari, M.; Giannoni, M.; Traversi, R.; Udisti, R. Biomass burning contributions estimated by synergistic coupling of daily and hourly aerosol composition records. Sci. Total Environ. 2015, 511, 11–20. [Google Scholar] [CrossRef] [PubMed]
  21. Diapouli, E.; Manousakas, M.; Vratolis, S.; Vasilatou, V.; Maggos, T.; Saraga, D.; Grigoratos, T.; Argyropoulos, G.; Voutsa, D.; Samara, C.; et al. Evolution of air pollution source contributions over one decade, derived by PM10 and PM2.5 source apportionment in two metropolitan urban areas in Greece. Atmos. Environ. 2017, 164, 416–430. [Google Scholar] [CrossRef]
  22. Lazaridis, M.; Spyridaki, A.; Solberg, S.; Smolík, J.; Zdímal, V.; Eleftheriadis, K.; Aleksanropoulou, V.; Hov, O.; Georgopoulos, P.G. Mesoscale modeling of combined aerosol and photo-oxidant processes in the Eastern Mediterranean. Atmos. Chem. Phys. 2005, 5, 927–940. [Google Scholar] [CrossRef]
  23. Saraga, D.E.; Makrogkika, A.; Karavoltsos, S.; Sakellari, A.; Diapouli, E.; Eleftheriadis, K.; Vasilakos, C.; Helmis, C.; Maggos, T. A pilot investigation of PM indoor/outdoor mass concentration and chemical analysis during a period of extensive fireplace use in Athens. Aerosol Air Qual. Res. 2015, 15, 2485–2495. [Google Scholar] [CrossRef]
  24. Triantafyllou, E.; Diapouli, E.; Tsilibari, E.M.; Adamopoulos, A.D.; Biskos, G.; Eleftheriadis, K. Assessment of factors influencing PM mass concentration measured by gravimetric & beta attenuation techniques at a suburban site. Atmos. Environ. 2016, 131, 409–417. [Google Scholar] [CrossRef]
  25. Laborde, M.; Crippa, M.; Tritscher, T.; Jurányi, Z.; Decarlo, P.F.; Temime-Roussel, B.; Marchand, N.; Eckhardt, S.; Stohl, A.; Baltensperger, U.; et al. Black carbon physical properties and mixing state in the European megacity Paris. Atmos. Chem. Phys. 2013, 13, 5831–5856. [Google Scholar] [CrossRef] [Green Version]
  26. Wang, Q.; Liu, S.; Zhou, Y.; Cao, J.; Han, Y.; Ni, H.; Zhang, N.; Huang, R. Characteristics of black carbon aerosol during the Chinese Lunar Year and weekdays in Xi’an, China. Atmosphere 2015, 6, 195–208. [Google Scholar] [CrossRef]
  27. Cavalli, F.; Viana, M.; Yttri, K.E.; Genberg, J.; Putaud, J.-P. Toward a standardised thermal-optical protocol for measuring atmospheric organic and elemental carbon: The EUSAAR protocol. Atmos. Meas. Tech. 2010, 3, 79–89. [Google Scholar] [CrossRef] [Green Version]
  28. Monteiro, A.; Gouveia, S.; Scotto, M.; Sorte, S.; Gama, C.; Gianelle, V.L.; Colombi, C.; Alves, C. Investigating PM10 episodes using levoglucosan as tracer. Air Qual. Atmos. Health 2017. [Google Scholar] [CrossRef]
  29. Amato, F.; Alastuey, A.; Karanasiou, A.; Lucarelli, F.; Nava, S.; Calzolai, G.; Severi, M.; Becagli, S.; Gianelle, V.L.; Colombi, C.; et al. AIRUSE-LIFE+: A harmonized PM speciation and source apportionment in five southern European cities. Atmos. Chem. Phys. 2016, 16, 3289–3309. [Google Scholar] [CrossRef]
  30. Weingartner, E.; Saathoff, H.; Schnaiter, M.; Streit, N.; Bitnar, B.; Baltensperger, U. Absorption of light by soot particles: Determination of the absorption coefficient by means of Aethalometers. J. Aerosol Sci. 2003, 34, 1445–1463. [Google Scholar] [CrossRef]
  31. WMO/GAW Aerosol Measurement Procedures, Guidelines and Recommendations, 2nd ed.; GAW Report No. 227; WMO No. 1177; GAW: Geneva, Switzerlandcity, 2016.
  32. Sandradewi, J.; Prévôt, A.S.H.; Szidat, S.; Perron, N.; Alfarra, M.R.; Lanz, V.A.; Weingartner, E.; Baltensperger, U. Using aerosol light absorption measurements for the quantitative determination of wood burning and traffic emission contributions to particulate matter. Environ. Sci. Technol. 2008, 42, 3316–3323. [Google Scholar] [CrossRef] [PubMed]
  33. Favez, O.; El Haddad, I.; Piot, C.; Boréave, A.; Abidi, E.; Marchand, N.; Jaffrezo, J.-L.; Besombes, J.-L.; Personnaz, M.-B.; Sciare, J.; et al. Inter-comparison of source apportionment models for the estimation of wood burning aerosols during wintertime in an Alpine city (Grenoble, France). Atmos. Chem. Phys. 2010, 10, 5295–5314. [Google Scholar] [CrossRef] [Green Version]
  34. Sciare, J.; d’Argouges, O.; Sarda-Estève, R.; Gaimoz, C.; Dolgorouky, C.; Bonnaire, N.; Favez, O.; Bonsang, B.; Gros, V. Large contribution of water-insoluble secondary organic aerosols in the region of Paris (France) during wintertime. J. Geophys. Res. 2011, 116, D22203. [Google Scholar] [CrossRef]
  35. Titos, G.; del Águila, A.; Cazorla, A.; Lyamani, H.; Casquero-Vera, J.A.; Colombi, C.; Cuccia, E.; Gianelle, V.; Močnik, G.; Alastuey, A.; et al. Spatial and temporal variability of carbonaceous aerosols: Assessing the impact of biomass burning in the urban environment. Sci. Total Environ. 2017, 578, 613–625. [Google Scholar] [CrossRef] [PubMed]
  36. Zotter, P.; Herich, H.; Gysel, M.; El-Haddad, I.; Zhang, Y.; Močnik, G.; Hüglin, C.; Baltensperger, U.; Szidat, S.; Prévôt, A.S.H. Evaluation of the absorption Ångström exponents for traffic and wood burning in the Aethalometer-based source apportionment using radiocarbon measurements of ambient aerosol. Atmos. Chem. Phys. 2017, 17, 4229–4249. [Google Scholar] [CrossRef]
  37. Healy, R.M.; Sofowote, U.; Su, Y.; Debosz, J.; Noble, M.; Jeong, C.-H.; Wang, J.M.; Hilker, N.; Evans, G.J.; Doerksen, G.; et al. Ambient measurements and source apportionment of fossil fuel and biomass burning black carbon in Ontario. Atmos. Environ. 2017, 161, 34–47. [Google Scholar] [CrossRef]
  38. Kalogridis, A.-C.; Vratolis, S.; Liakakou, E.; Gerasopoulos, E.; Mihalopoulos, N.; Eleftheriadis, K. Assessment of wood burning versus fossil fuel contribution to wintertime Black Carbon and Carbon monoxide concentrations in Athens, Greece. Atmos. Chem. Phys. Discuss. 2017. in review. [Google Scholar] [CrossRef]
  39. Sandradewi, J.; Prévôt, A.S.H.; Weingartner, E.; Schmidhauser, R.; Gysel, M.; Baltensperger, U. A study of wood burning and traffic aerosols in an Alpine valley using a multi-wavelength Aethalometer. Atmos. Environ. 2008, 42, 101–112. [Google Scholar] [CrossRef]
  40. Day, D.E.; Hand, J.L.; Carrico, C.M.; Engling, G.; Malm, W.C. Humidification factors from laboratory studies of fresh smoke from biomass fuels. J. Geophys. Res. 2006, 111, D22202. [Google Scholar] [CrossRef]
  41. Lewis, K.; Arnott, W.P.; Moosmüller, H.; Wold, C.E. Strong spectral variation of biomass smoke light absorption and single scattering albedo observed with a novel dual-wavelength photoacoustic instrument. J. Geophys. Res. 2008, 113, D16203. [Google Scholar] [CrossRef]
  42. Chan, T.W.; Brook, J.R.; Smallwood, G.J.; Lu, G. Time-resolved measurements of black carbon light absorption enhancement in urban and near-urban locations of southern Ontario, Canada. Atmos. Chem. Phys. 2011, 11, 10407–10432. [Google Scholar] [CrossRef] [Green Version]
  43. Bond, T.C.; Bergstrom, R.W. Light absorption by carbonaceous particles: An investigative review. Aerosol Sci. Technol. 2006, 40, 27–67. [Google Scholar] [CrossRef]
  44. Zanatta, M.; Gysel, M.; Bukowiecki, N.; Müller, T.; Weingartner, E.; Areskoug, H.; Fiebig, M.; Yttri, K.E.; Mihalopoulos, N.; Kouvarakis, G.; et al. A European aerosol phenomenology-5: Climatology of black carbon optical properties at 9 regional background sites across Europe. Atmos. Environ. 2016, 145, 346–364. [Google Scholar] [CrossRef]
  45. Hitzenberger, R.; Petzold, A.; Bauer, H.; Ctyroky, P.; Pouresmaeil, P.; Laskus, L.; Puxbaum, H. Intercomparison of thermal and optical measurement methods for elemental carbon and black carbon at an urban location. Environ. Sci. Technol. 2006, 40, 6377–6383. [Google Scholar] [CrossRef] [PubMed] [Green Version]
  46. Popovicheva, O.B.; Kozlov, V.S.; Engling, G.; Diapouli, E.; Persiantseva, N.M.; Timofeev, M.A.; Fan, T.-S.; Saraga, D.; Eleftheriadis, K. Small-scale study of siberian biomass burning: I. smoke microstructure. Aerosol Air Qual. Res. 2015, 15, 117–128. [Google Scholar] [CrossRef]
  47. Zhang, Z.; Engling, G.; Lin, C.-Y.; Chou, C.C.-K.; Lung, S.-C.C.; Chang, S.-Y.; Fan, S.; Chan, C.-Y.; Zhang, Y.-H. Chemical speciation, transport and contribution of biomass burning smoke to ambient aerosol in Guangzhou, a mega city of China. Atmos. Environ. 2010, 44, 3187–3195. [Google Scholar] [CrossRef]
  48. Saarnio, K.; Teinilä, K.; Aurela, M.; Timonen, H.; Hillamo, R. High-performance anion-exchange chromatographyemass spectrometry method for determination of levoglucosan, mannosan, and galactosan in atmospheric fine particulate matter. Anal. Bioanal. Chem. 2010, 398, 2253–2264. [Google Scholar] [CrossRef] [PubMed]
  49. Novakov, T.; Andreae, M.O.; Gabriel, R.; Kirchstetter, T.W.; Mayol-Bracero, O.L.; Ramanathan, V. Origin of carbonaceous aerosols over the tropical Indian Ocean: Biomass burning or fossil fuels? Geophys. Res. Lett. 2000, 27, 4061–4064. [Google Scholar] [CrossRef]
  50. Diapouli, E.; Popovicheva, O.; Kistler, M.; Vratolis, S.; Persiantseva, N.; Timofeev, M.; Kasper-Giebl, A.; Eleftheriadis, K. Physicochemical characterization of aged biomass burning aerosol after long-range transport to Greece from large scale wildfires in Russia and surrounding regions, Summer 2010. Atmos. Environ. 2014, 96, 393–404. [Google Scholar] [CrossRef]
  51. Pauraitė, J.; Mordas, G.; Byčenkienė, S.; Ulevicius, V. Spatial and temporal analysis of organic and black carbon mass concentrations in Lithuania. Atmosphere 2015, 6, 1229–1242. [Google Scholar] [CrossRef]
  52. Harrison, R.M.; Beddows, D.C.A.; Jones, A.M.; Calvo, A.; Alves, C.; Pio, C. An evaluation of some issues regarding the use of aethalometers to measure woodsmoke concentrations. Atmos. Environ. 2013, 80, 540–548. [Google Scholar] [CrossRef]
  53. Harrison, R.M.; Beddows, D.C.S.; Hu, L.; Yin, J. Comparison of methods for evaluation of wood smoke and estimation of UK ambient concentrations. Atmos. Chem. Phys. 2012, 12, 8271–8283. [Google Scholar] [CrossRef]
  54. Fourtziou, L.; Liakakou, E.; Stavroulas, I.; Theodosi, C.; Zarmpas, P.; Psiloglou, B.; Sciare, J.; Maggos, T.; Bairachtari, K.; Bougiatioti, A.; et al. Multi-tracer approach to characterize domestic wood burning in Athens (Greece) during wintertime. Atmos. Environ. 2017, 148, 89–101. [Google Scholar] [CrossRef]
  55. Park, S.S.; Kozawa, K.; Fruin, S.; Mara, S.; Hsu, Y.-K.; Jakober, C.; Winer, A.; Herner, J. Emission factors for high-emitting vehicles based on on-road measurements of individual vehicle exhaust with a mobile measurement platform. J. Air Waste Manag. 2011, 61, 1046–1056. [Google Scholar] [CrossRef] [PubMed]
  56. Hoffmann, D.; Tilgner, A.; Iinuma, Y.; Herrmann, H. Atmospheric stability of levoglucosan: A detailed laboratory and modeling study. Environ. Sci. Technol. 2010, 44, 694–699. [Google Scholar] [CrossRef] [PubMed]
  57. Vasilatou, V.; Diapouli, E.; Abatzoglou, D.; Bakeas, E.B.; Scoullos, M.; Eleftheriadis, K. Characterization of PM2.5 chemical composition at the Demokritos suburban station, in Athens Greece. The influence of Saharan dust. Environ. Sci. Pollut. Res. 2017, 24, 11836–11846. [Google Scholar] [CrossRef] [PubMed]
  58. Amiridis, V.; Zerefos, C.; Kazadzis, S.; Gerasopoulos, E.; Eleftheratos, K.; Vrekoussis, M.; Stohl, A.; Mamouri, R.E.; Kokkalis, P.; Papayannis, A.; et al. Impact of the 2009 Attica wild fires on the air quality in urban Athens. Atmos. Environ. 2012, 46, 536–544. [Google Scholar] [CrossRef]
  59. Kostenidou, E.; Florou, K.; Kaltsonoudis, C.; Tsiflikiotou, M.; Vratolis, S.; Eleftheriadis, K.; Pandis, S.N. Sources and chemical characterization of organic aerosol during the summer in the eastern Mediterranean. Atmos. Chem. Phys. 2015, 15, 11355–11371. [Google Scholar] [CrossRef]
Figure 1. Absorption coefficients (babs) at seven wavelengths measured at Demokritos (DEM) stations during 2013–2014.
Atmosphere 08 00234 g001
Figure 2. Values of the intercept of the linear regression of 24-h levoglucosan concentrations over respective 24-h mean babs(950)wb, calculated for different αff values.
Atmosphere 08 00234 g002
Figure 3. Mean monthly concentrations of eBC, BCwb and BCff and the corresponding ambient temperatures.
Atmosphere 08 00234 g003
Figure 4. Mean diurnal variability of eBC, BCwb and BCff concentrations during (a) the cold and (b) the warm period.
Atmosphere 08 00234 g004
Figure 5. Mean diurnal variability of BCwb, BCff and NOx normalised concentrations (based on corresponding mean values) during the cold period.
Atmosphere 08 00234 g005
Figure 6. Correlations of BCwb concentrations with (a) 24-h levoglucosan concentrations, (b) 24-h K concentrations and (c) 3-h organic and elemental carbon (OC/EC) ratios.
Atmosphere 08 00234 g006
Table 1. Mean relative contribution (%) of fossil fuel (FF) and wood burning (WB) to aerosol absorption at 880 nm, during 1 year and for the warm and cold period separately. The range of contributions provided corresponds to the estimates by the use of the different αwb values (1.7–3.0).
Emission Source3/2013–2/2104Cold PeriodWarm Period
MeanRangeMeanRangeMeanRange
FF (%)9182–968671–949590–98
WB (%)94–18146–2952–10
Table 2. 24-h concentrations (in μg m−3) of equivalent black carbon (eBC), and black carbon related to wood burning (BCwb) and fossil fuel combustion (BCff) (mean ± standard deviation). The relative contribution (%) of wood burning to eBC (BCwb/eBC) is also provided.
eBC (μg m−3)BCwb (μg m−3)BCff (μg m−3)BCwb/eBC (%)
2013–20142.0 ± 0.90.3 ± 0.41.7 ± 0.713 ± 11
Cold period2.4 ± 1.00.5 ± 0.51.9 ± 0.721 ± 11
Warm period1.6 ± 0.60.1 ± 0.11.5 ± 0.66 ± 7

