Analysis of the Long-Term Variability of Poor Visibility Events in the UAE and the Link with Climate Dynamics

Chemical and Environmental Engineering Department, Masdar Institute of Science and Technology, Khalifa University of Science and Technology, Masdar City, P.O. Box 54224, Abu Dhabi, UAE
*
Author to whom correspondence should be addressed.
Atmosphere 2017, 8(12), 242; https://doi.org/10.3390/atmos8120242
Submission received: 22 October 2017
/
Revised: 21 November 2017
/
Accepted: 28 November 2017
/
Published: 4 December 2017
(This article belongs to the Section Meteorology)
Abstract
:The goal of this study is to investigate the variability of poor visibility events occurring hourly in the UAE and their relationship to climate dynamics. Hourly visibility observation data spanning more than three decades from ten stations across the country were used. Four intervals of low visibility, between 0.10 km and 5.0 km, were considered. Poor visibility records were analyzed under wet and dry weather conditions. The Mann–Kendall test was used to assess the inferred trends of low visibility records. The relationships between poor visibility measurements and associated meteorological variables and climate oscillations were also investigated. Results show that Fujairah city has the highest average visibility values under wet weather conditions, while Abu Dhabi city has the lowest average visibility values under both wet and dry conditions. Wet weather conditions had a greater impact than dry weather conditions on visibility deterioration in seven out of the ten stations. Results confirm that fog and dust contribute significantly to the deterioration of visibility in the UAE and that Abu Dhabi has been more impacted by those events than Dubai. Furthermore, the numbers of fog and dust events show steep increasing trends for both cities. A change point in poor visibility records triggered by fog and dust events was detected around the year 1999 at Abu Dhabi and Dubai stations after the application of the cumulative sum method. Increasing shifts in the means and the variances were noticed in the total annual fog events when Student’s t-test and Levene’s test were applied. In Abu Dhabi, the mean annual number of dust events was approximately 112.5 before 1999, increasing to 337 dust events after 1999. In Dubai, the number of dust events increased from around 85.5 to 315.6 events. The inferred fog and dust trends were compared to four climate indices. Results showed a significant correlation (positive and negative) between four climate indices and the occurrence of fog and dust events in the UAE.
1. Introduction
Visibility is commonly known as ‘the longest distance at which an object can be recognized against the horizon in the background’ [1,2,3]. Visibility is also known in quantitative terminology as the visual range [4]. Good visibility, the ability to see and recognize objects situated on the ground at more than 5.0 km distance, is essential for the safety of all transport sectors including ground, air, and maritime [5,6,7,8,9,10,11,12]. Moreover, visibility can reflect changes in meteorological and air quality conditions and their impact on human health [13,14,15]. Several studies [2,3,8,13,14,16,17] have analyzed poor visibility records across the world to understand their variability in time and space and the specific triggers that may lead to such degradation [3,13,18,19,20] through an assessment of long-term visibility data from different geographic locations [3,14]. Overall, a significant decline in visibility across the world has been reported [2,3,13,21]. A study about the northern Arabian Gulf, [22] reported a regional decline of 0.8 km in visibility values based on observations from the northeastern part of Saudi Arabia, Kuwait, and Bahrain.
The analysis of long-term records of visibility and meteorological records led to the determination of the major factors that may cause visibility degradation [13,14,16]. The impact of meteorological factors on visibility has been extensively evaluated and examined in different countries including the USA [19,23], the UK [17,24], China [2,14,18], and Iran [8]. Several studies reported a negative correlation between visibility and temperature, relative humidity (RH), and wind speed [13,14,16,25]. Overall, previous findings indicate that visibility degradation can occur during wet or dry atmospheric conditions.
When dry conditions prevail, natural and anthropogenic sources of trace gases and aerosols, primary or secondary, can cause degradation in visibility as a result of absorption and scattering of light [8,14]. In their research, Jaswal et al. [16] reported significant downward temporal and spatial trends in visibility observations in India during the period from 1961–2008. They stated that visibility degradation is noticeable through increasing morning and decreasing afternoon visibility, which are spatially correlated with decreasing wind speed and increasing RH. Chen et al. [3] analyzed the long-term visibility trend in Chengdu and Chongqing in China, and suggested that the decrease is the result of a complex synoptic mechanism. In another study, Sabetghadam et al. [8] attributed the substantial decline in visibility in Tehran, Iran to air pollution. In their research, Abdi Vishkaee, Flamant et al. [26] concluded that visibility effects associated with the Shamal wind that lifts and transports dust in northern Iran was very low. However, Al Senafi and Anis [22] found a moderate positive relationship (Pearson r = 0.42) between the number of Shamal days and the number of dust storms per year. They concluded that dust is the controlling factor of visibility in the Arabian Gulf with 38% of all dust storms formed during Shamal wind events. A study by Xiao et al. [14] focused on analyzing the relationship between aerosols and visibility in Baoji, China, and showed that the extinction coefficient is proportionally related to the concentration of particulate matter but has an inverse relationship with visibility [27]. Organic matter was found to be the largest contributor to visibility degradation in Baoji [14]. On the other hand, Tiwari et al. [21] demonstrated a relationship between visibility degradation and anthropogenic urban aerosol in Delhi which is experiencing severe foggy conditions yearly during the windy period. The results of their linear regression model show that an increase in pollution levels, mainly aerosol concentration, and a lower depression temperature encourages fog formation.
Poor visibility days in the UAE and the region could be associated with dry or wet weather conditions. First, the aridity of the climate in the region increases the likelihood of dust emission especially when wind speed is high over the dry dust sources in the region. One should note that an increase of soil moisture should decrease the emission of dust. However, precipitation records showed low amounts in the region. The presence of aerosols in the air reduces visibility due to light scattering which depends on the morphology and the composition of particles. This implies the importance of soil characterization in arid regions through the determination of its composition and its spatial distribution through variables like soil emissivity especially over dust sources [28,29].
Second, despite the aridity of the region, the proximity to the Gulf along with the high temperature records lead to a significant evaporation over the sea and therefore increase in inland relative humidity with sea land breeze [30]. Hence, under wet conditions, the region is subjected to frequent mist and fog formation which lead to visibility degradation [31]. Moreover, high relative humidity lead to the growth of aerosol particles in the air through coalescence–collision which broaden their size distribution and therefore impact visibility by increasing scattering [32]. During the process of condensation, numerous small particles of atmospheric aerosols combine into more effective mid-visible light scattering particles that range in size and increase the amount of practical scattering in the atmosphere [27]. The subsequent increase in the scattering coefficient leads to reducing visibility [12]. In another study, Chen and Xie [3] confirmed that if relative humidity increases, hygroscopic particles progressively absorb more water, leading to increased scattering cross sections and proportionately reduced visibility. They have also highlighted the importance of the meteorological factors, relative humidity, wind speed, and air temperature on visibility reductions in the cities of Chengdu and Chongqing in China, and have confirmed the essential role of air pollution in degrading visibility. In Iran, Sabetghadam et al. [8] studied the correlation between visibility, relative humidity, and wind speed. The results show that wind speed has the highest correlation with visibility, while relative humidity has a high negative correlation with visibility.
In the UAE, there is no record of previous studies that address visibility trends and analyze their relationship with meteorological or air quality parameters, despite the rapid development of major cities and airports in the country which makes them more exposed to events leading to a reduction in visibility, especially those triggered by anthropogenic factors. This study is, to our knowledge, the first effort to thoroughly examine the variability of poor visibility records across the UAE. Trends of poor visibility records were inferred to identify areas where visibility is degrading or improving, and to understand the long-term variability of visibility and their links with climate oscillations and climate indices.
The study has three main sections that focus on (a) studying the variability of poor visibility records and temporal trends for ten airport stations; (b) studying the spatial variations of visibility observations and the link with the prevailing meteorological conditions; and (c) analyzing the occurrence of fog and dust events as possible triggers of visibility degradation, and their link with climate indices.
2. Data and Method
2.1. Study Domain
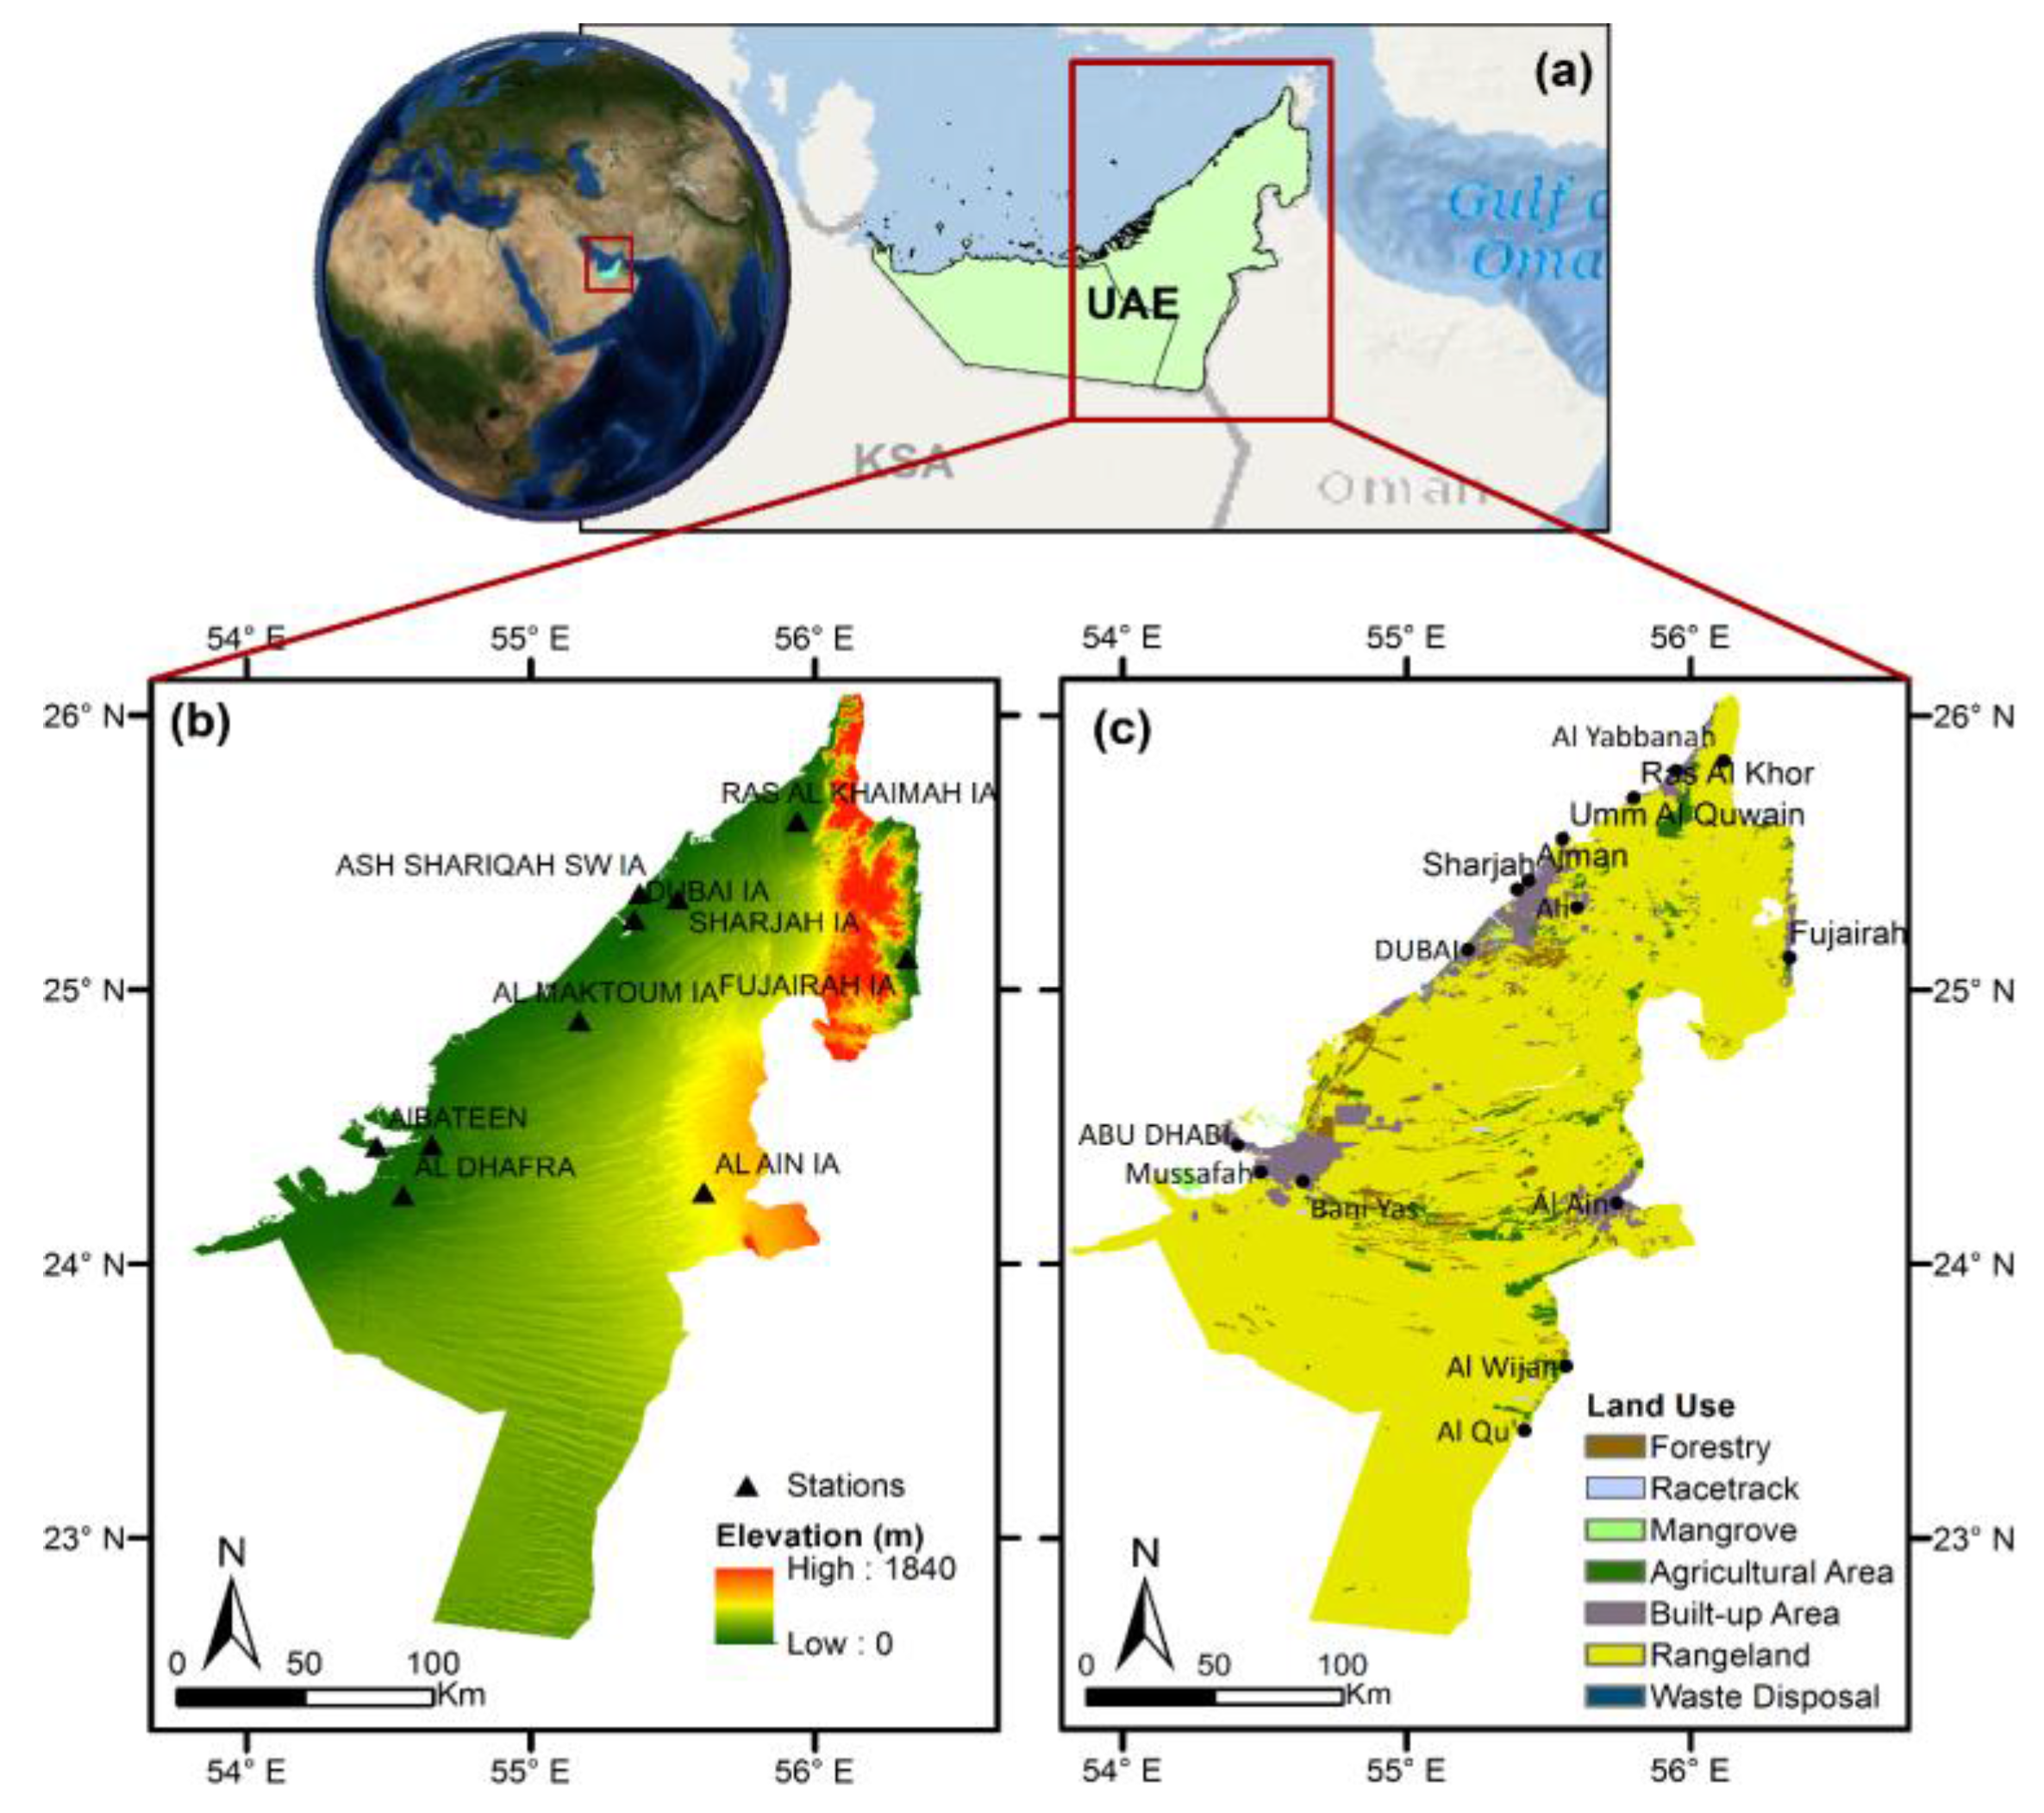
The study domain encompasses the northern and central regions of the UAE which include ten airport stations in the country (Figure 1a). The rest of the UAE, the western region of the country, is a desert stretching to the Empty Quarter Desert, which was excluded in this study because of the absence of visibility observation records and major urban development. The Arabian Gulf on the western side and the Sea of Oman on the eastern side limit the study domain. The eastern side of the study domain includes the Al Hajar mountain chain stretching along the eastern coast of the Arabian Peninsula. The mountain chain blocks moisture fluxes that are generated over the Sea of Oman. Wind velocity is stronger on the eastern side of the UAE with a stronger shear along the mountain valleys. Stronger winds are less favorable for fog formation [33]. The eastern coastal zones of the UAE dominated by mountainous terrains yield fewer dust sources. The western coastal side of the UAE, on the other hand, exhibits a terrain of gentle topography, which fosters a deeper inland propagation of moisture generated by the strong evaporation over the Gulf (see Figure 1b). The strong nocturnal temperature inversion, common in arid regions, creates condensation and therefore, fog, haze, and mist formation, which all negatively affect visibility.
The UAE has an average minimum daily air temperature of 14 °C in winter and an average maximum daily air temperature of 45 °C in summer. However, temperatures in the desert region may exceed 50 °C during the summer, and fall to around 4 °C in winter [34]. Relative humidity can reach 90% in summer, with prevailing North West winds. The evaporation rate is high, reaching an average of up to 2–3 m per year [34]. The northeastern mountains receive the highest amount of rainfall (160 mm), while the southern desert receives less than 40 mm per year.
In addition, all cities in the UAE, mainly the coastal ones (Figure 1c), have undergone rapid economic growth and urban expansion during the last few decades [35]. The total population grew to an estimated 9.39 million people as of March 2017, with an average population growth of about 5.37% during the last three decades [36]. This implies a significant change in anthropogenic emissions which leads to increase in aerosols concentration, mainly secondary ones, which contributes to visibility degradation.
2.2. Datasets
Hourly visibility data provided by the National Oceanic and Atmospheric Administration—National Climatic Data Center/National Centers for Environmental Information (NOAA—NCDC/NCEI) (https://www.ncdc.noaa.gov/) [37] for ten airport stations in the UAE were used. All selected stations are inland (Figure 1b). All stations are located between 5.0 m and 265 m above mean sea level (See Table 1). In addition to visibility, the analysis included hourly meteorological observations of relative humidity which were used to separate between dry and wet atmospheric conditions when poor visibility events were recorded.
Records of aerosols optical depth (AOD) which corresponds to a measure of the extinction of solar radiation by atmospheric particles, were also compared to low visibility observations under dry weather conditions. AOD data were used as an indication of the amount of aerosol in the total vertical column of the atmosphere whereas visibility data are surface observations. AOD values for the period of 2000–2015 were extracted from the Moderate Resolution Imaging Spectroradiometer (MODIS)-AOD database that is available at www.ladsweb.nascom.nasa.gov/.
Climate indices were used to investigate the relationship between changes in visibility values throughout the years and climate variability. The cumulative values of the following indices were used: southern oscillation index (SOI), Pacific decadal oscillation (POD), east Atlantic oscillation (EA) and Atlantic multidecadal oscillation [38]. The indices’ values are available at www.ncdc.noaa.gov/teleconnections/.
2.3. Methods
According to Lambert’s law of extinction, the change in the intensity of radiation emerging from the end of the path is proportional to the incoming intensity of the beam. This proportionality coefficient (known also as the atmospheric coefficient (bext) is a function of the scattering and absorption of particles and gases and varies with the wavelength of light and pollutants’ concentration. According to [5] the atmospheric coefficient can be determined as follows:
where denote the scattering coefficient for aerosols without liquid water, the scattering coefficient for liquid phase water associated with hygroscopic aerosol constituent, the Rayleigh scattering coefficient, the absorption coefficient for particles and the absorption coefficient for gases, respectively.
Visual range (V) is explained and discussed in details by Malm [6], and is defined according to the Koschmieder equation, Equation (2), as:
V = 3.912/bext,
In line with the above definition of visibility, in this study, the analysis of visibility records distinguishes between poor visibility occurring during wet and dry weather conditions. Dominant meteorological factors that trigger low visibility events are different depending on whether wet or dry weather conditions prevail. Hence, the variability of visibility records should differ for each group of weather conditions. Relating poor visibility events to weather conditions necessitates an operational definition of weather conditions, however, we could not find a standard and agreed upon definition of wet and dry weather conditions in the literature. Thus, we defined dry weather conditions as the atmospheric conditions characterized by a lack of water molecules in the atmosphere with relative humidity ≤50% that could be associated with dust events. Consequently, wet weather conditions are the atmospheric conditions characterized by available water molecules in the atmosphere with RH > 50%, and with fog, or mist, or haze associated events. These definition were used to break down the analysis. First, the raw data were screened for different meteorological events using the METAR code (fog (FG), haze (HZ) and mist (BR) for wet weather conditions, and dust (DU) for dry weather conditions). Then, remaining visibility measurements were screened and classified depending on relative humidity values. Previous studies that analyzed visibility records have focused on observations of visibility when the relative humidity was >90% [8,17] which provides a coarse meteorological screening. In this study, we selected a class of 50% to differentiate between wet and dry conditions as suggested by [39].
Monthly and yearly visibility averages for each station were computed from hourly values to obtain a series of the long-term means over the period of the study. Annual averages from monthly mean values were analyzed for each station under wet and dry weather conditions. Then, annual variability of the records at each station was analyzed. As the focus of this study is on examining poor visibility observations of less than 5 km, the analysis was carried out using four classes for poor visibility within the following ranges; 0–0.1 km, 0.1–1.0 km, 1.0–2.5 km, and 2.5–5.0 km. The classes should reflect the magnitude of the degradation of visibility values. The first 5 km threshold used in this study corresponds to the threshold used in the METAR reports in aviation meteorology to indicate a first degradation of the visibility conditions from the white to the green color state [40].
Linear trend analyses were performed on the obtained time series. Trends were tested, for each visibility classes under wet and dry weather conditions, for significance at 95% level of confidence using the Mann–Kendall test. Mann–Kendall is a non-parametric test that is largely applied to time series for trend detection and assessment [41]. A positive value of the coefficient indicates an increasing trend, while the negative value indicates a decreasing trend. The null hypothesis can be rejected at a significance level of the p-value.
Focus was also directed towards determining potential change points in the obtained time series using the cumulative sum method (CUSUM) which is a graphical approach that is often used for the detection of changes in time series. Substantial negative or positive slopes indicate sequences of values below or above the mean value. The positions at the intersection of change of slope indicate change points. The significance of the change in the mean and in the variance is evaluated with the Student’s t-test and the Levene’s test, respectively. A detailed description of the used statistical methods is provided in Appendix A.
3. Results and Discussion
3.1. Analysis of Raw Visibility Data
Examples of daily visibility data for different stations between the 1980s and 2016 are shown in Figure 2 to illustrate the fluctuation of visibility observations on a daily basis. One can observe frequent drops below the 5 km threshold selected to analyze poor visibility records in this study. For example, at Abu Dhabi Airport Station, on average, visibility values between 5.0–2.5 km, 2.5–1.0 km, 1.0–0.1 km, and below 0.1 km are reported during 71 days, 50 days, 23 days, and 17 days per year, respectively. The analysis of raw visibility records at all airports shows significant fluctuations of visibility throughout the year. The absence of a particular seasonal pattern in the visibility records implies that the factors triggering visibility degradation vary throughout the year and that they may be associated with wet or dry atmospheric conditions which prevail in different seasons. Such low values could be observed during all seasons with variability in the magnitude of the degradation below 5 km that can reach values lower than 0.1 km. Trends analyses showed significant downward temporal trends in visibility observations at all stations. See Table 1 for the annual average visibility values at all stations.
Visibility trends at Abu Dhabi airport during months with records below the annual average (low visibility months) and above the annual average (high visibility months) are shown in Figure 3. A decreasing trend is noticeable in both cases. A trends significance assessment at the 5% confidence level shows that both trends are significant. Moreover, a steeper decrease was noticed in the case of high visibility values at a rate of 0.076 km per year compared to 0.043 km per year in the case of low visibility ranges. This led to a reduction in the difference between low and high visibility values which reflects an overall deterioration of visibility conditions. This could lead to a higher frequency of poor visibility days and/or the occurrence of frequent events with extreme degradation of visibility, which could be investigated further by analyzing the frequency and the magnitude of visibility degradation across the country and its link with prevailing meteorological parameters.
3.2. Long-Term Visibility Variability and Trend Analysis
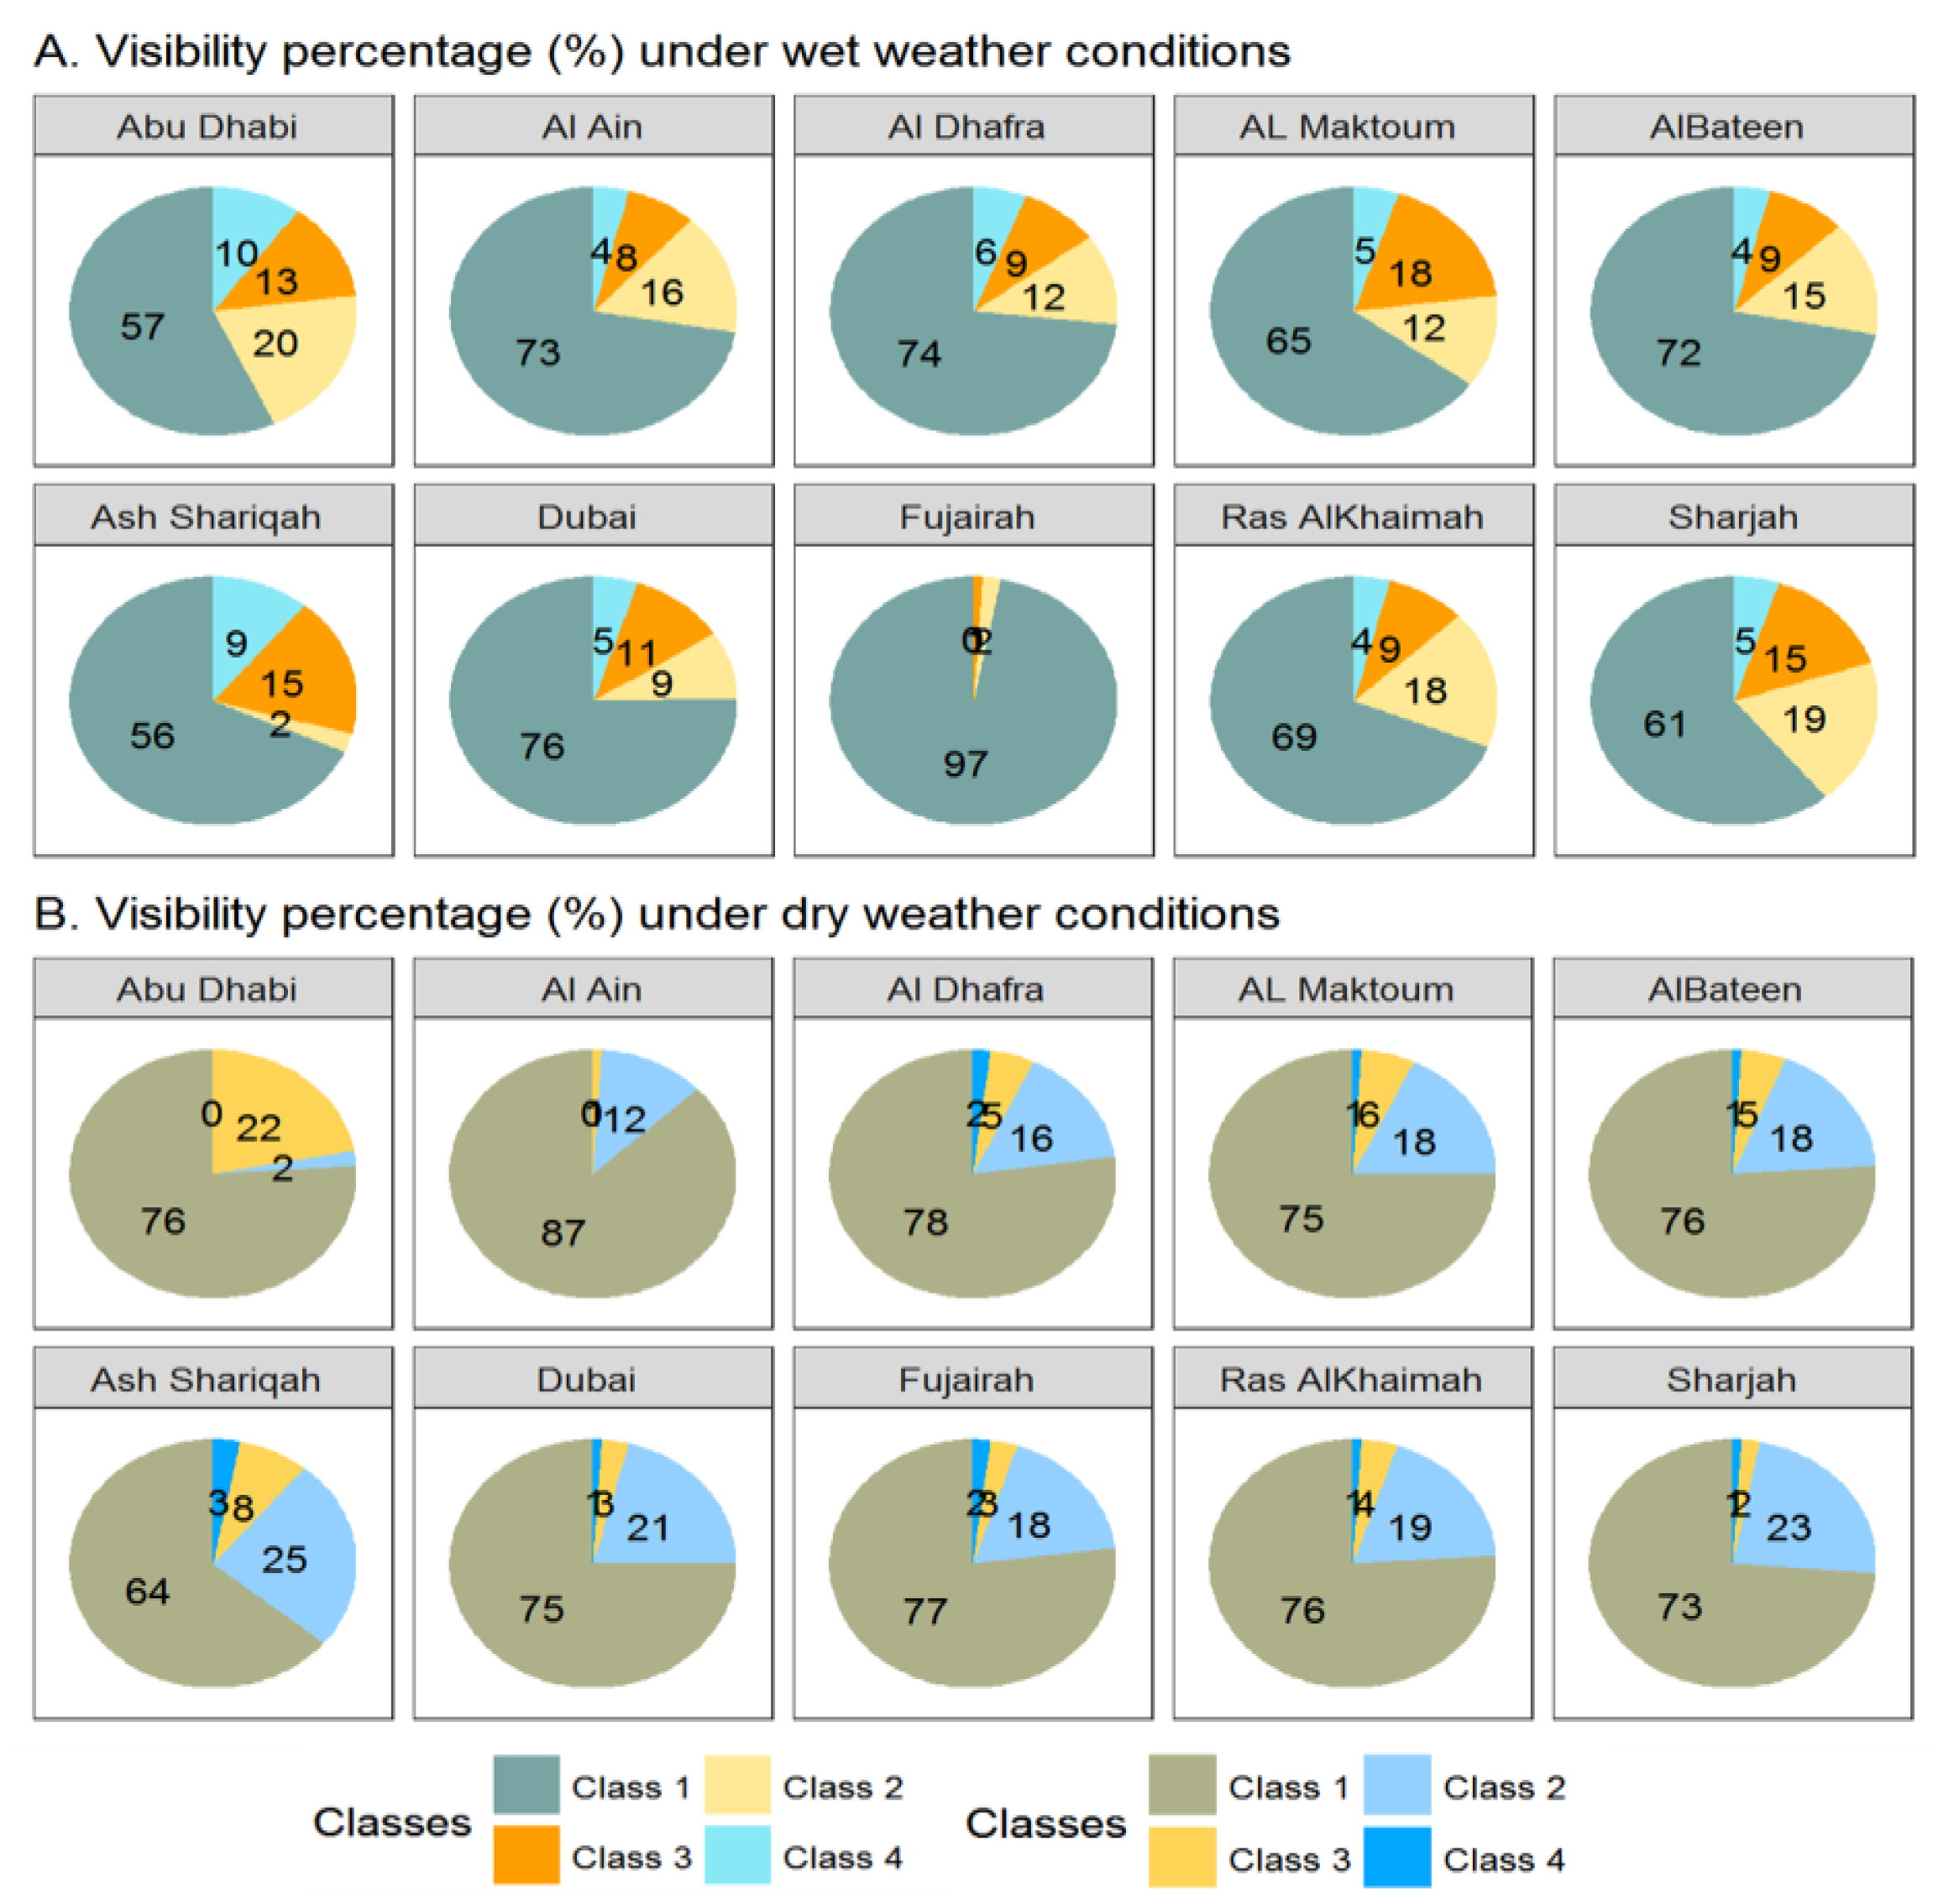
The long-term mean visibility values and number of low visibility events under wet and dry weather conditions analyzed under four visibility classes are summarized in Table 2 and Figure 4. Three main findings can be highlighted. First, under the first visibility class (5.0–2.5 km), it is observed that dry weather conditions have a greater impact than wet weather conditions on visibility deterioration in six stations out of ten, except for Abu Dhabi, Al Maktoum, Al Ain, and Dubai stations, while wet and dry weather conditions have the same impact on visibility deterioration in Dubai station. Wet weather conditions have more impact on visibility deterioration under classes 2 (2.5–1.0 km) and 3 (1.0–0.1 km). Second, based on the frequency of poor visibility events, visibility observations of less than 0.1 km are mainly associated with wet weather conditions in all stations, except for the Fujairah station, where dry weather conditions dominate visibility in the same range. Third, Fujairah has the best visibility with the long-term averaged poor visibility under wet weather conditions very close to those under dry conditions, which average between 0.00456–0.00430 km, respectively. However, Abu Dhabi has the lowest long-term visibility average among all stations for classes 1 and 2. Furthermore, Al Maktoum and Al Dhafra airports showed the lowest long-term average visibility under the third class (1.0–0.1 km) with 0.48 km.
With respect to the geographic location of the station (Figure 1b), the analysis of the records in Table 2 reveals a reduction in horizontal surface visibility at all stations in the western coastal side of the UAE. Visibility is decreasing mainly in the central and some northeastern regions (over Dubai and Sharjah). The geographic coverage of poor visibility under wet weather conditions extends to include Abu Dhabi in addition to the other coastal Emirates on the Arabian Gulf, mainly over Ras Al Khaimah station. Abu Dhabi station’s location near the shoreline might have more pronounced negative impacts when it comes to fog onset and its impact on visibility [21,31].
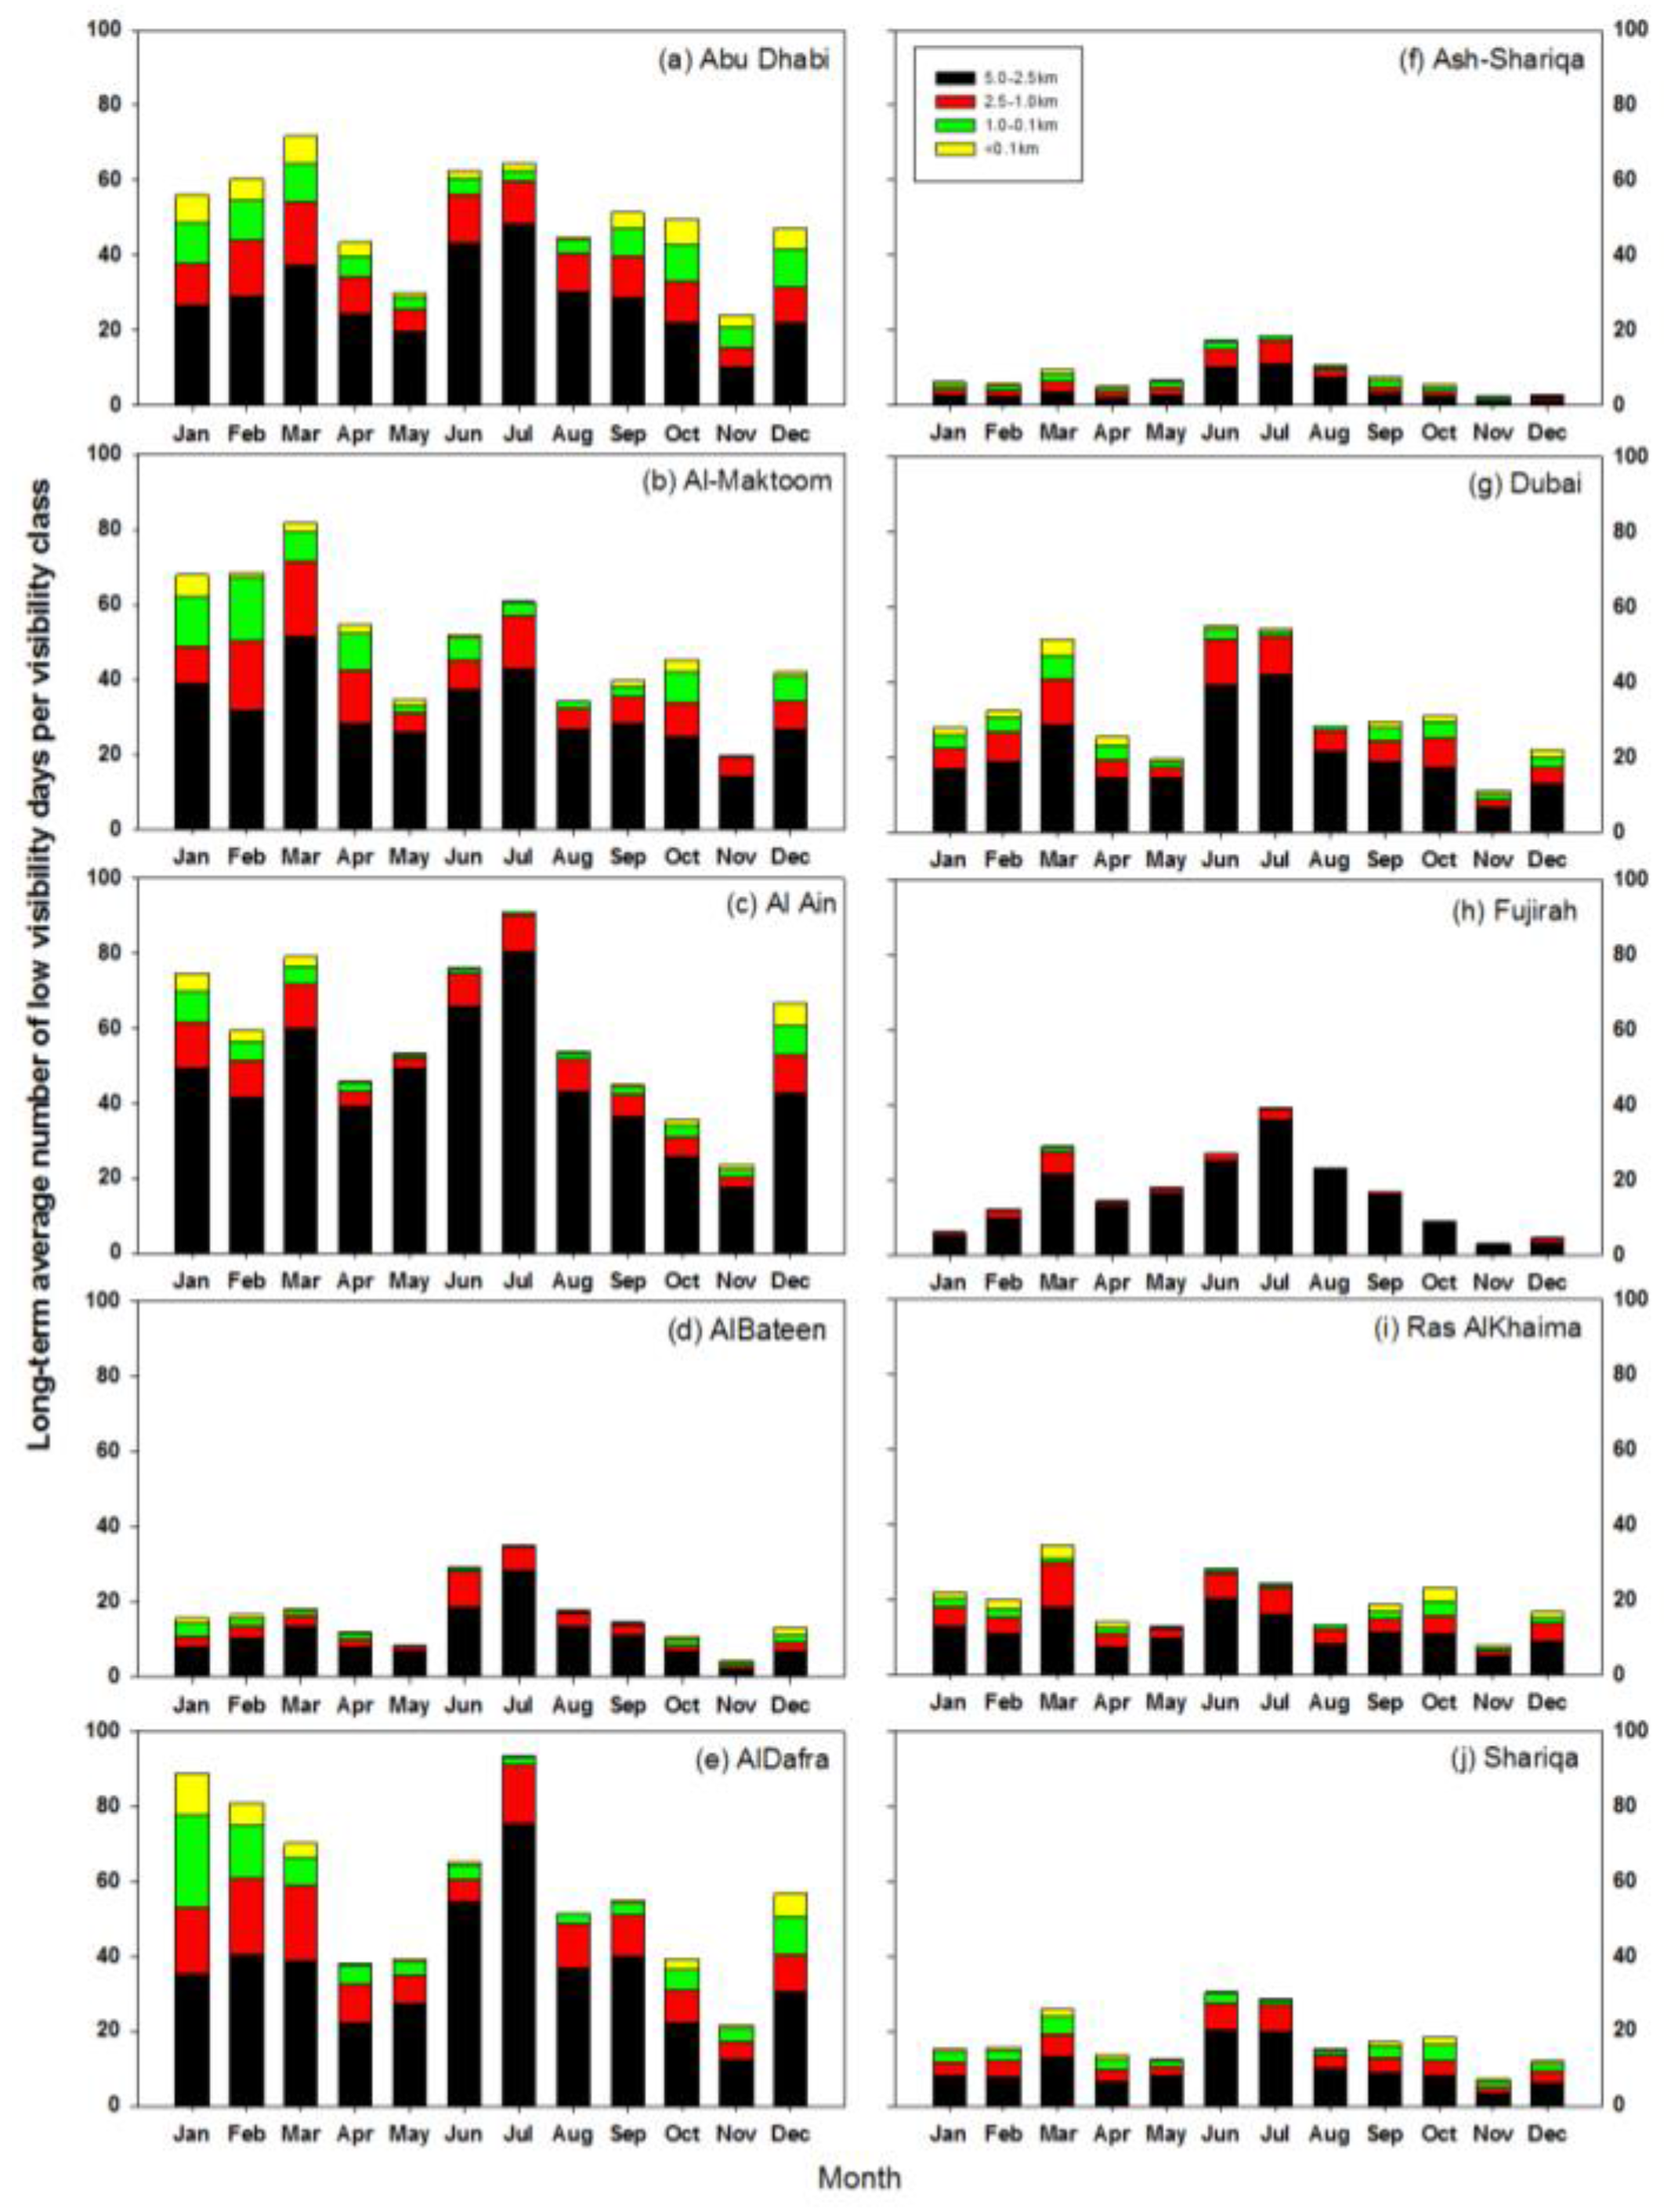
A monthly comparison of poor visibility events (per class, per station) was conducted. Figure 5 shows the monthly mean number of occurrences of poor hourly visibility events for all stations within each class to link the frequency of the degradation to its magnitude. Comparisons show monthly variations in visibility observations in different cities, and for all classes within each location. Results show that poor visibility events occur more frequently during summer (June–August) and in winter (December–March). These periods have the highest number of poor hourly visibility events. Furthermore, Abu Dhabi, Al-Maktoum, Al Ain, and Al Dafra Stations have a high number of poor visibility values (less than 0.10 km), while far fewer events were recorded in Ash-Shariqa, Dubai, Fujairah, Ras AlKhaima, and Shariqa Stations. This suggests that cities in the eastern part of the country encounter fewer poor visibility events than the remaining cities in the study area.
The noticeable drop in visibility in summer is likely due to the presence of micro to mesoscale forcing mechanisms such as the Haboob wind (Arabic name of this wind) [42]. Haboobs occur mainly during spring and summer months when strong insolation combines with the influences of monsoonal moisture. At the synoptic scale, the westerly Shamal winds mobilize dust and sand, and transport it east and northeastward through the UAE, resulting in greater visibility impairment in summer [42]. Shamal winds are mostly strongest over the winter and summer seasons, so are the Shamal events (northwesterly winds blowing from the sea over the land) that are associated with low pressure, very high temperature, and relative humidity, which explains the low visibility observations during the summer. Furthermore, the UAE is located in an arid region with low-lying sandy deserts, gravelly plains, alluvial plains, and salts flats in the coastal areas [43]. Around 75% of the country is covered by Torripsamments soil (loamy fine sand, or coarser) which is swept away by wind in dry conditions. It can be inferred that deterioration of visibility in the UAE due to soil-derived aerosols under dry weather conditions is highly probable.
In addition, the region is exposed to significant transboundary pollution with frequent summer dust storms leading to high background aerosol concentrations as the region [26]. A study on dust sources by the National Center of Meteorology and Seismology indicated that the horizontal wind speed class for the start of the movement of dust or sand, ranging in diameter from 80–100 microns, ranges from 4.9 m/s to 13.4 m/s [44]. High speed northern and northwesterly winds enhance regional dust, aerosols, and air pollution transport, leading to visibility deterioration [22]. The long-term average maximum wind speed in Abu Dhabi of 15.0 m/s and 17.42 m/s in Dubai, and a northwesterly direction, may explain visibility deterioration under dry weather conditions.
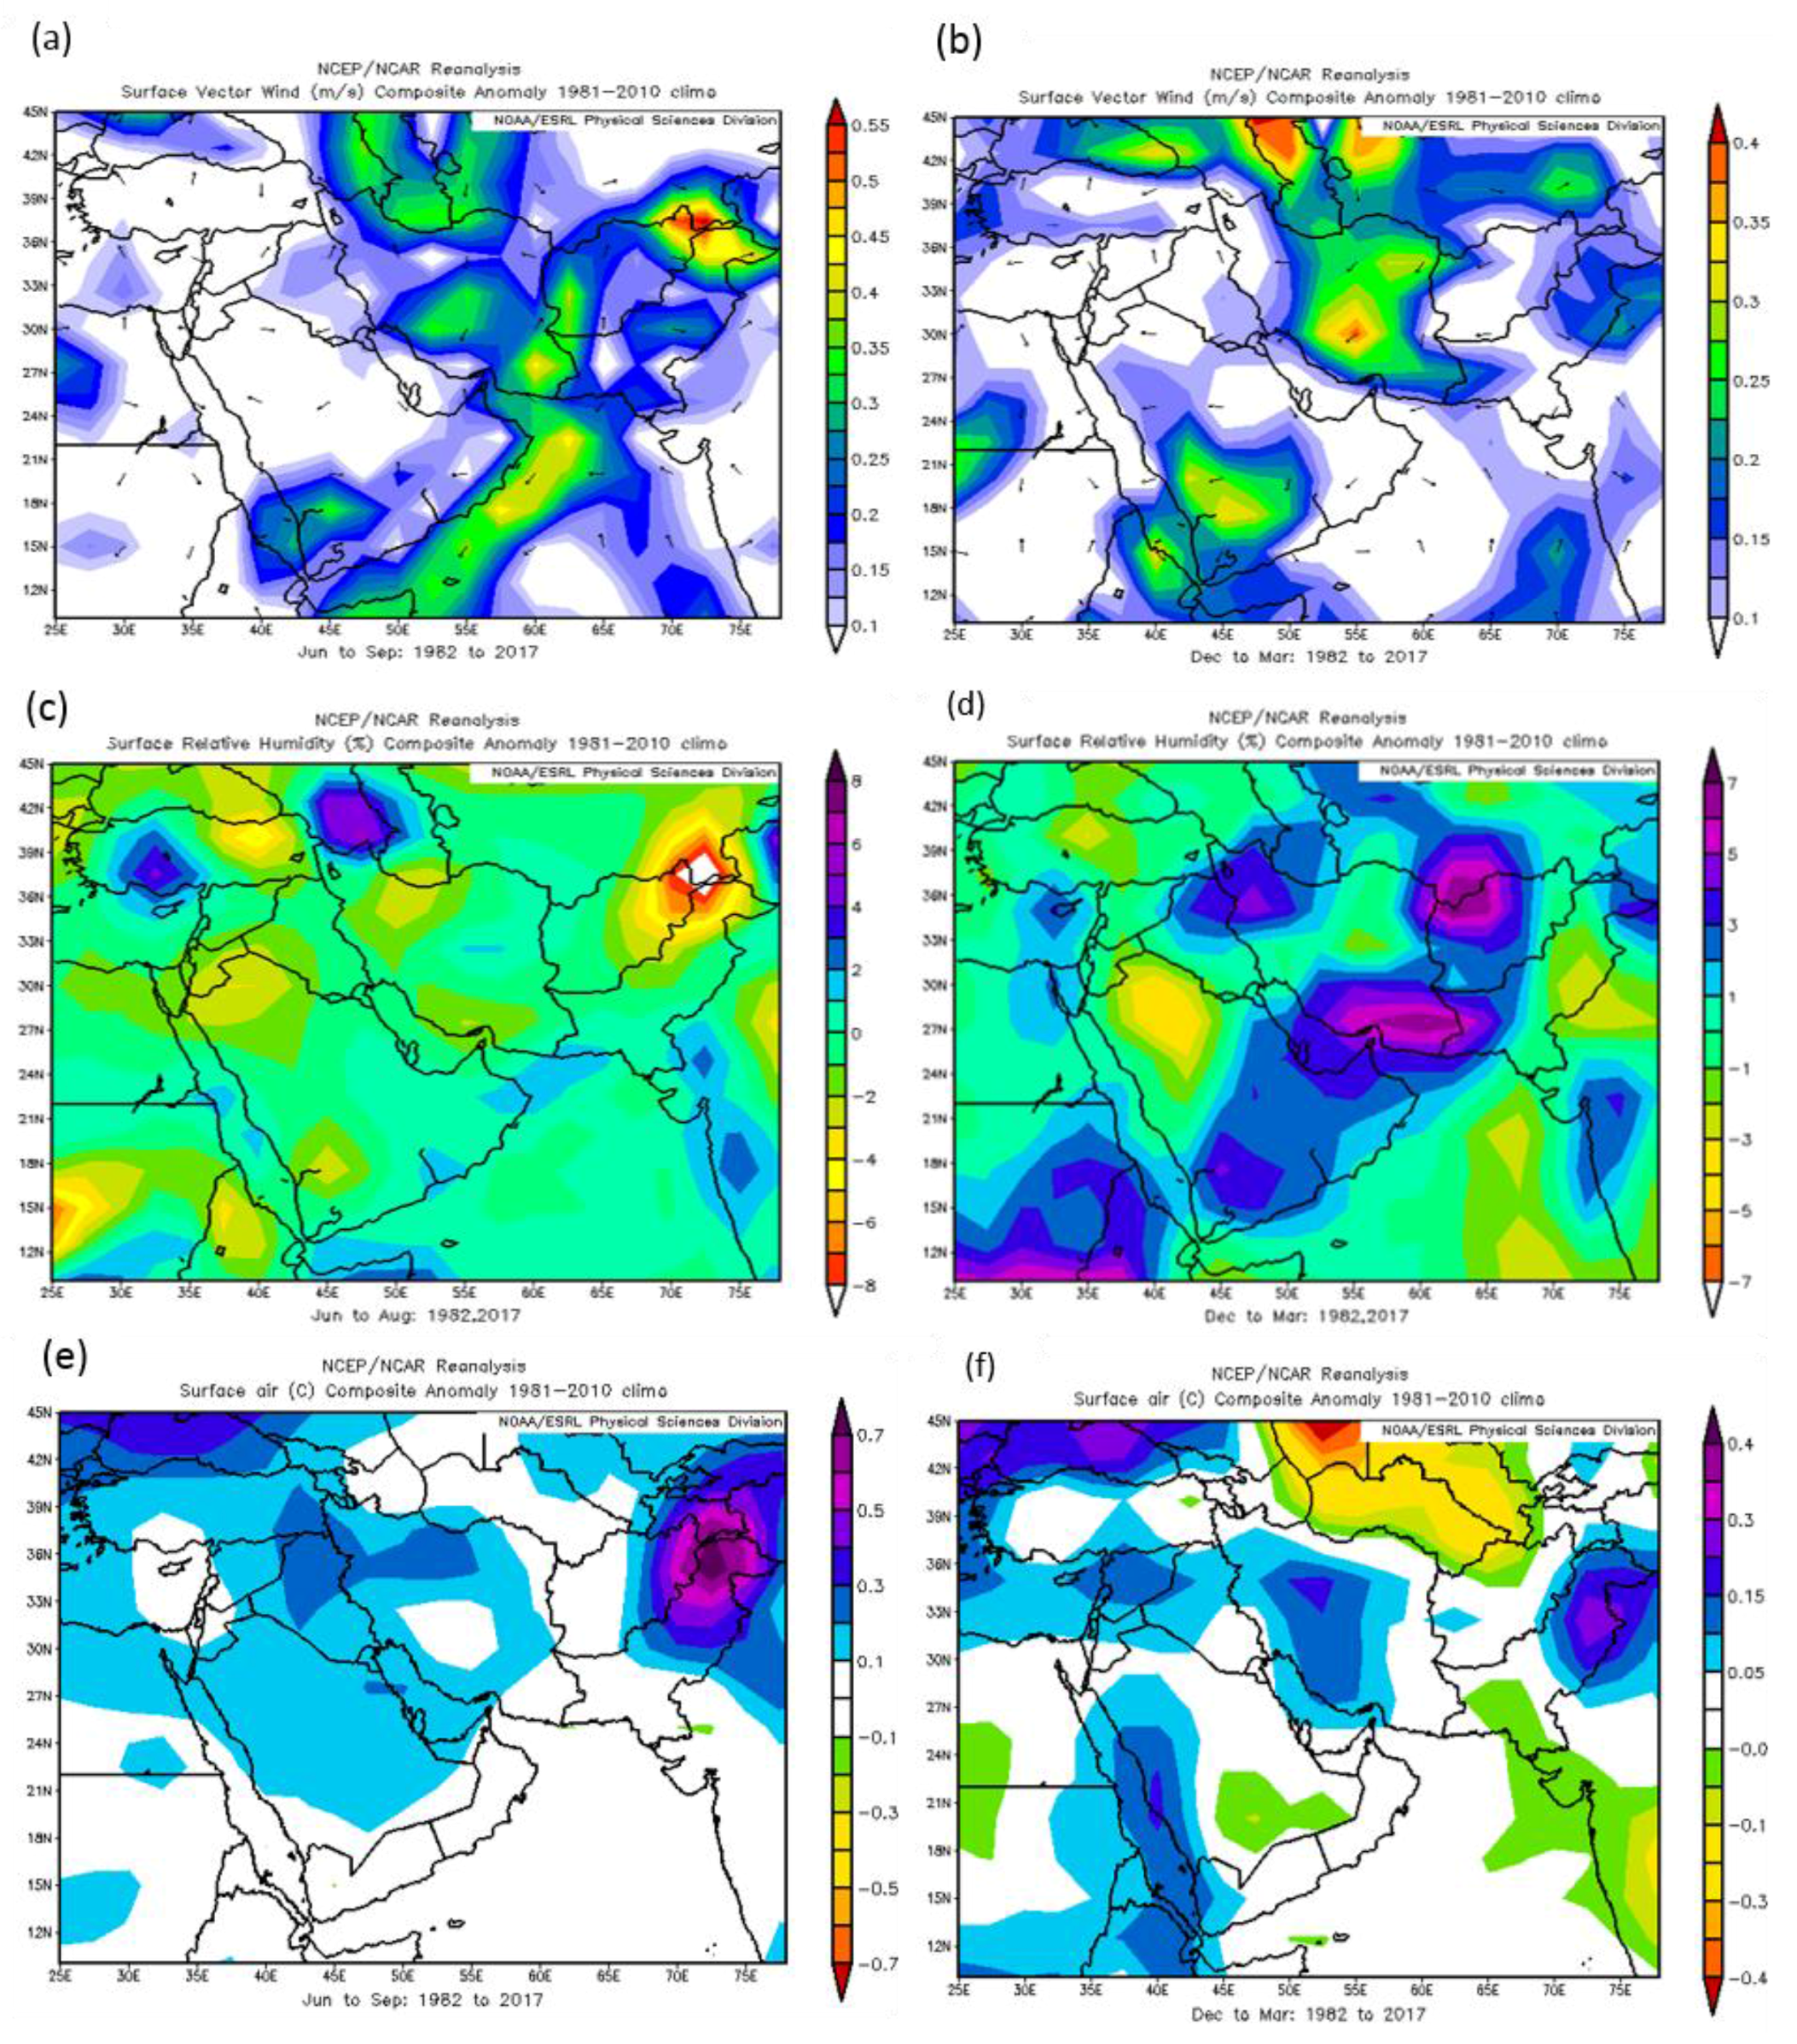
The presence of more synoptic systems in spring in the UAE along with the northwesterly wind contribute to transporting air pollutants and improving the visual range [8]. This is in line with the findings of [8] on improved visibility in Tehran city during spring where the highest long-term average values of wind speed over 50 years was 10.3 m/s, that is associated with high visibility [8], most likely due to improved dilution of air pollutants [13]. In contrast, visibility decreases when RH increases most likely because higher RH promotes the growth of hygroscopic particles into larger sized particles that scatter more light, as suggested by [12,13,38]. Decrease in overall wind speed, increase in RH, and decrease in temperature depression in winter periods could foster the occurrence of such events, as illustrated in Figure 6a–d. Derived from the National Center for Environmental Prediction Reanalysis data [45], it shows the long-term composite anomalies of RH and vector wind speed at surface level in summer and winter. One can observe that anomalies in surface vector wind, over the UAE, in summer (Figure 6a) are higher than those in winter (Figure 6b) and that RH anomalies in summer (Figure 6c) are lower than those in winter (Figure 6d), changing from almost zero to four. In addition, air surface temperature anomalies in summer (Figure 6e) are higher than those in winter (Figure 6f).
Coastal cities in the UAE are subject to perennial sea–land breezes (SLBs), with diurnal and seasonal variations [30,46]. The majority of variations occur during summer (June through September). Two types of SLBs are distinguished in the Arabian Gulf Region, the bay breeze and the ocean breeze [31]. These thermal circulations occur as a result of a weak synoptic force associated with the southwest monsoon [46]. In winter, the strong nocturnal temperature inversion and surface cooling effects, associated with low wind shear and low-level jet formation, weaken and ultimately stop turbulence above ground. As the process of radiative cooling continues, excess water vapor begins to condense, which leads to the formation of the radiation fog [31]. The wind coming from the Arabian Gulf triggers the transportation of the water vapor inland through sea–land breeze processes. However, during the night, the south–southeasterly winds dominate, moving from the desert and cooling down over the sea, thus forming the land–sea breeze.
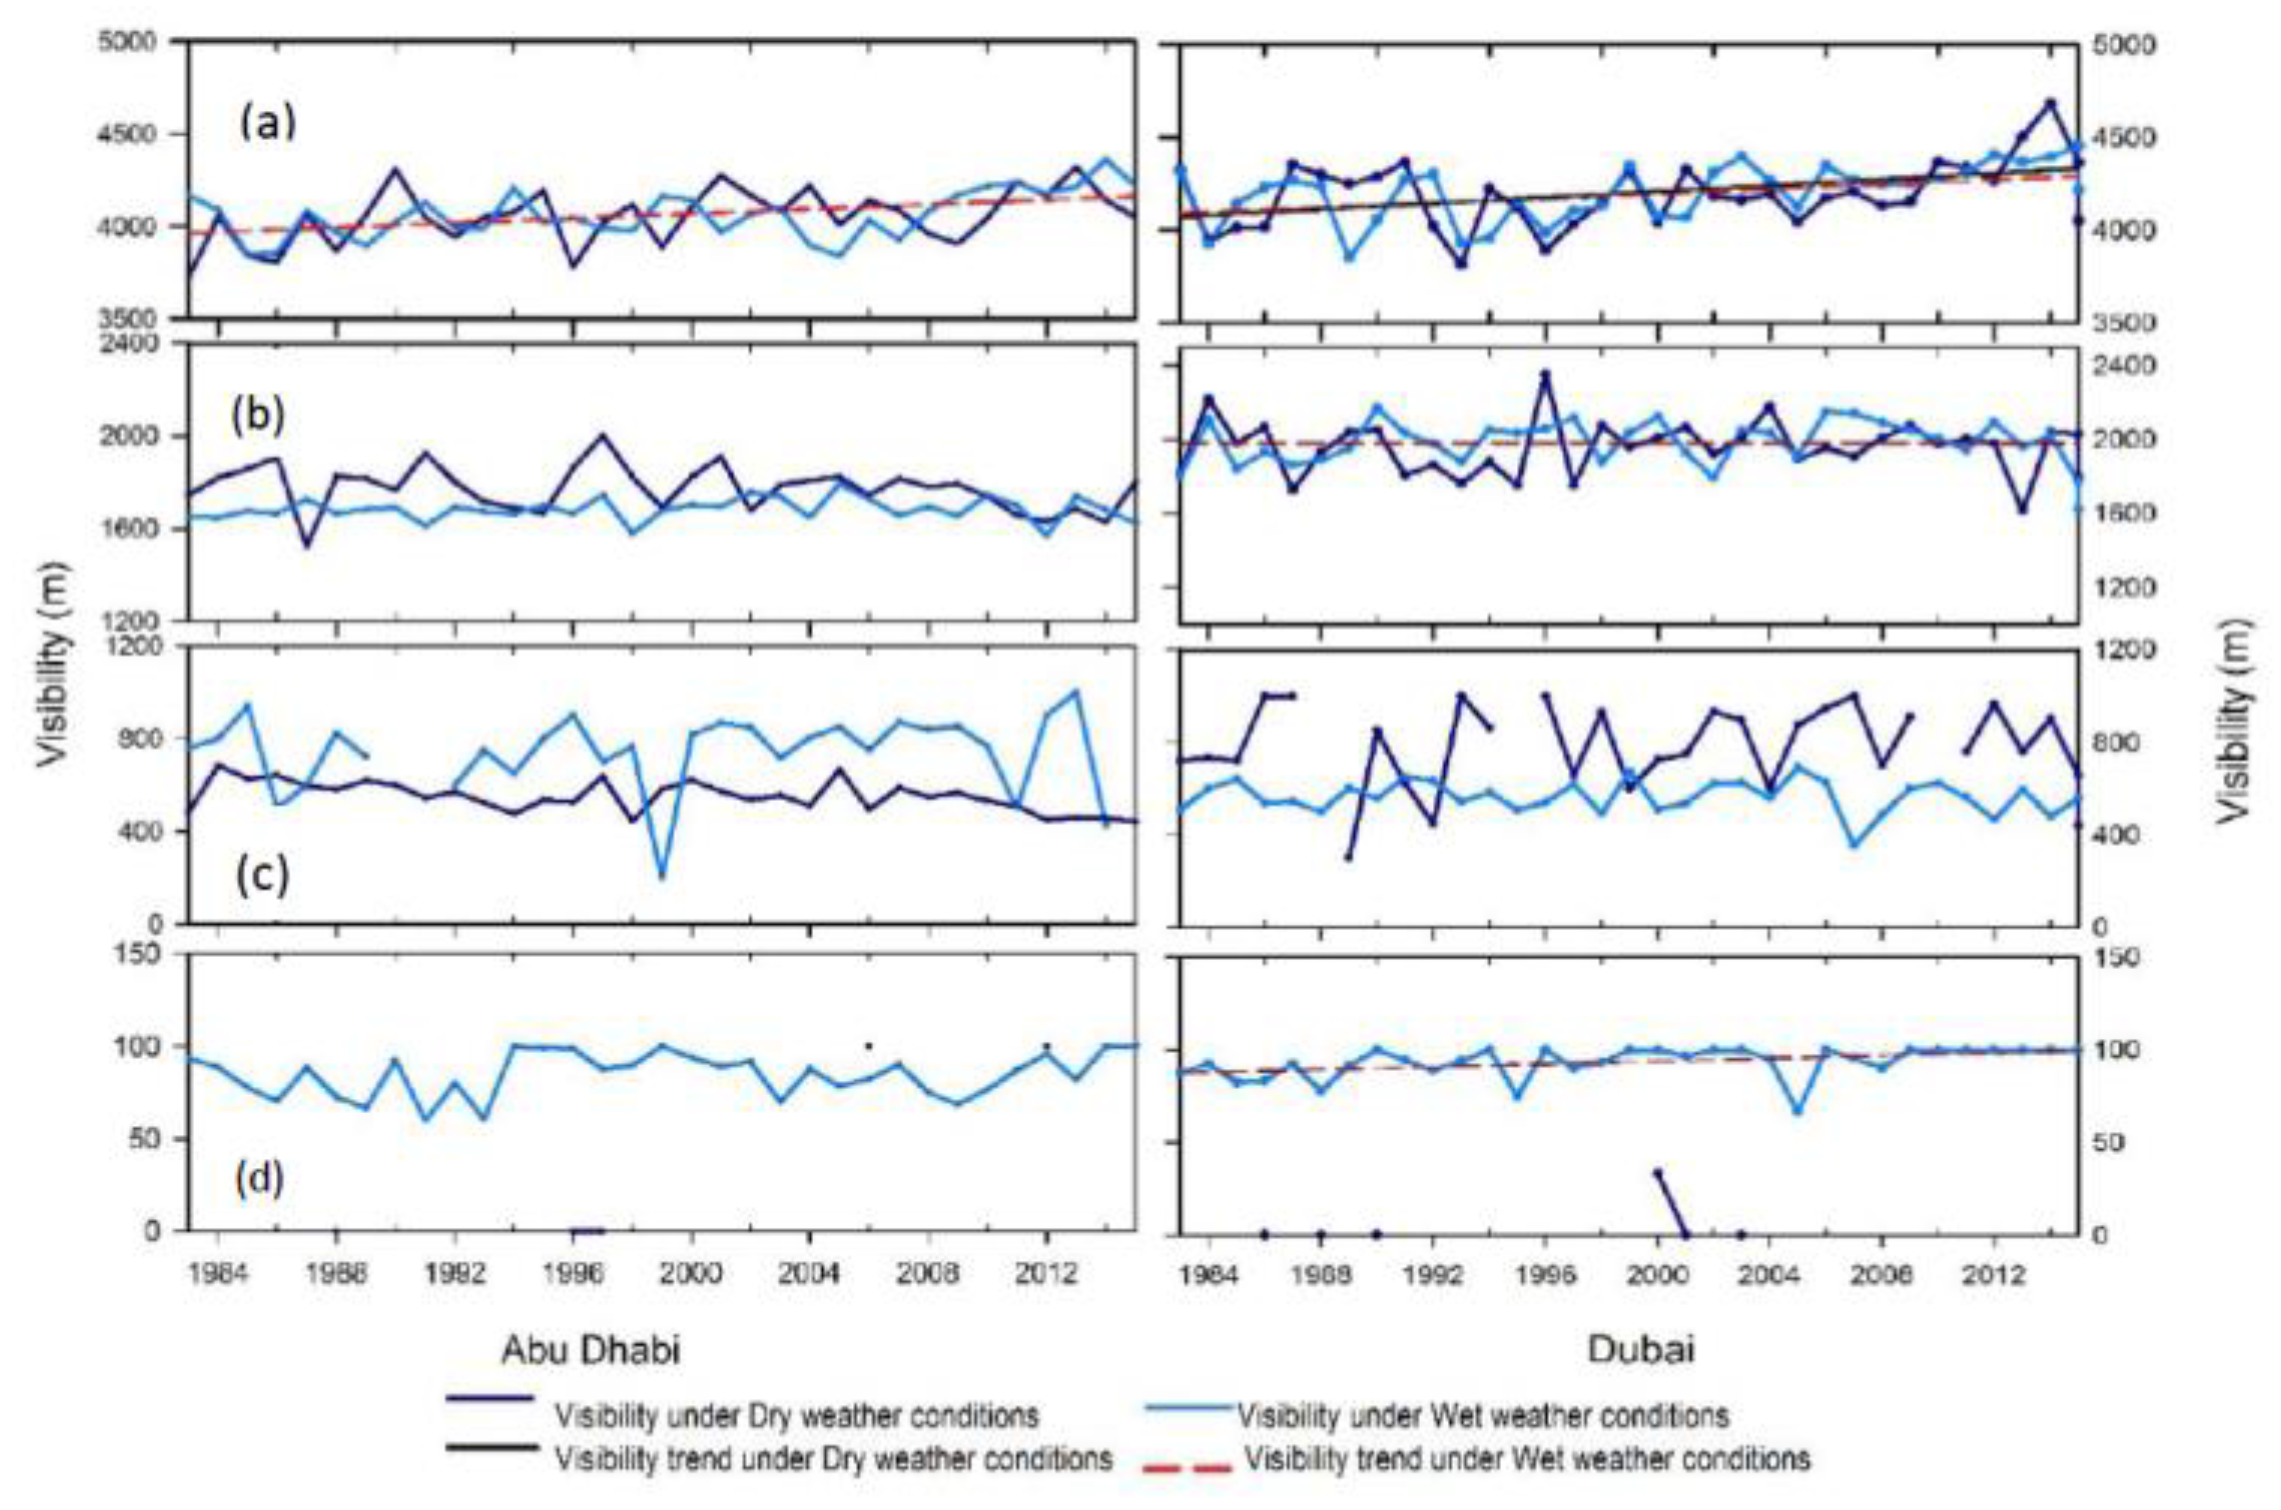
Figure 7 shows the visibility time series of yearly averaged values, as well as linear regression lines, fit under wet and dry conditions, for four different visibility class levels in Abu Dhabi and Dubai stations, respectively (only two representative stations are included here). Results show that under dry weather conditions, the overall visibility values are always higher than those under wet weather conditions except for the third class (1.0–0.1 km) at both stations. The trends always increase in both stations under dry weather conditions except for the second class (2.5–1.0 km) in Abu Dhabi station. Results also show that under wet weather conditions the trend decreases under class 2 in Abu Dhabi which could be explained by the increasing influence of factors that may trigger fog, mist, and haze events in the region.
In Abu Dhabi, the general trend of poor visibility records under 5 km between 1982 and 2016 shows a small increase, with an average rate of 2.5 m and 5.8 m per year under dry and wet conditions, respectively (Figure 7). This means that dry weather conditions have more impact on visibility deterioration than wet weather conditions for the first class. However, this trend shows a decline under wet weather conditions, for visibility values under class 2, with an average decline of −2.5 m per year, and −0.22 m per year under dry weather conditions. This suggests that wet weather conditions have a more significant negative impact on visibility in Abu Dhabi under class 2, as visibility values are lower than those under dry weather conditions. Furthermore, wet weather conditions have an increasing impact on visibility deterioration, mainly for visibility ranges of 1.0–2.5 km, while dry weather conditions have a decreasing impact on deterioration in the same range. This is more pronounced for visibility values under 1.0 km. In this category, the general trend of poor visibility shows an average increase of 1.5 m per year under wet weather condition, as opposed to an average decline of −3.95 m per year under dry weather conditions. It is also observed that while dry weather conditions have no impact on visibility observations under class 4, wet weather conditions have an impact on visibility observations, with a trend showing a negligible increase rate of 0.24 m per year.
In Dubai, the general trend of poor visibility during the entire period of 1983–2016 under all classes is increasing, except for class 3 under wet weather conditions, which reflects a general enhancement in visibility conditions. Under wet weather conditions, the average rates vary between −1 m per year under class 4, to 8.8 m per year under class 1 (Figure 7). This increase in the annual average long-term trends suggests that visibility is improving under wet and dry weather conditions in Dubai. However, the average rate of improvement under wet conditions is higher for visibility values under classes 1 and 2.
Results of trends-significance assessment at the 5% level using the Mann–Kendall test of Abu Dhabi and Dubai stations data for the different visibility classes show that two trends are significant in Abu Dhabi and four trends are significant in Dubai. No significant trends mean that the observations obtained are not serially correlated over time (independent) and are identically distributed.
Results also show decreasing trends under dry weather conditions in Al Ain and Al Dhafra stations in which reflected aerosol emissions might play an important role in decreasing in occurrences of poor visibility. The formulation of a thermal low depression, resulting from high insolation over the Empty Quarter, and moving towards the UAE eventually reaching Al Hajar Mountain in Oman (to the northeast of the UAE—See Figure 1b), deepens the thermal low and accelerates the southerly wind over the mountain, carrying dust and sand towards the UAE [47]. Furthermore, as confirmed by Naizghi, and Ouarda [48] Al Ain city has the highest wind speed, which triggers more significant dust emission and transport.
3.3. Frequency Analysis of Wet- and Dry-Related Poor Visibility Events
Figure 8 shows the total number of poor visibility events per city for the ten cities in relation to the four visibility classes. Under wet weather conditions (fog, mist and haze), fog events dominated reports. The impact of wet weather conditions is more pronounced as it influences visibility values at all classes with most readings less than or equal to 5.0–2.5 km in all stations. Under dry conditions, poor visibility is mainly attributed to dust, which is common in a hyper-arid environment like the UAE. The greater frequency of fog events in fall and winter can be attributed to dry air aloft in subsiding conditions, which promotes surface cooling while suppressing surface wind. Light wind associated with a clear sky, and in the presence of dry air above the moist boundary layer, allows much more heat to escape from the earth surface, leading to fog formulation [49].
Further analysis is conducted on fog and dust frequency to understand their role in visibility deterioration in Abu Dhabi and Dubai airport stations since both have a high pronounced impact on visibility. Figure 9 shows the total annual total number of fog events in Abu Dhabi and Dubai from the years 1982–2016, and 1984–2016, respectively. The analysis of the total number of fog events over the last three decades at both stations reveals a significant variability. Results show that Abu Dhabi station is more impacted by fog events, with an average annual total of 75 h compared to 34 h in Dubai. However, the total number of fog events shows steep increasing trends for both cities. Fog events occur about 64 times, on average, per year in Abu Dhabi, whereas the average number of fog events per year in Dubai is significantly lower at around 28 days per year for the past three decades. The year 2000 also showed the highest increase in the number of fog events in both cities.
Figure 10 shows the total annual hours of dust events of Abu Dhabi and Dubai for the same duration as for fog analysis. The analysis of the number of hourly dust events at both stations reveals also a significant variation of the total number of hourly dust events. Both stations are impacted by dust events, however, Abu Dhabi station is more impacted as it encountered a higher number of dust events. In addition, the total number of hourly dust events shows steep increasing trends in both cities.
The annual variability of fog events could be related to the fact that Abu Dhabi airport station is located very close to the shoreline, the warm Gulf, and the desert, which makes it prone to more fog events [31,49], especially the radiation type of fog events. Abu Dhabi airport is also located at the limits of the city which makes it closer to cooler nocturnal surface temperatures in the desert. Unlike Abu Dhabi Airport, Dubai Airport is located in the heart of the city and surrounded by large industrial and residential districts which implies a significant difference between land use conditions around both airports. The particular land use conditions around Dubai airport led to different radiative transfer processes, which may not foster strong temperature inversion, as is the case in the desert around Abu Dhabi Airport.
To understand the overall trend in the frequency of events, the CUSUM method was used. It confirmed the presence of a change point in the mean value of the number of fog and dust events for both cities that occurred around the year 1999. Figure 11 illustrates the identified change points and presents the mean and trends for the various segments for the number of fog events per year for Abu Dhabi and Dubai airport stations. Results show that the annual time series is split into two subgroups at the change point year of 1999 and that there is a shift in the mean of the number of fog events for the two stations. In Abu Dhabi, the mean value is about 25 fog events for the period 1982–1998. For the period of 1999–2016, the mean increases to 99 fog events. A previous study reported 38 foggy nights a year over the period 1982–2003 [49]. The average value of fog events increased fourfold in Abu Dhabi after 1999, and fivefold in Dubai. This is in line with the findings of [50] who analyzed the increase in the frequency of foggy days in India over the period of 1976–2010. They indicated that the largest shift in the mean and variance of fog frequency was observed in 1998, due to a combination of two major factors: changes in large-scale circulation, and the effects of local factors like changes in the RH (gradual increasing trend), land use, and the role of aerosols. In Dubai, the number of fog events increased from about nine events before 1999 to 44 events after 1999. The Levene’s test results also indicate a change in the variance of the total number of fog events for Abu Dhabi and Dubai. This means that one variance is different from the other as the computed p-value is <0.0001 and 0.0004 for Abu Dhabi and Dubai, respectively, both lower than the significance level alpha = 0.05. The risk of rejecting the null hypothesis (H0: The variances are identical), while it is true is lower than 0.01% and 0.04%, respectively.
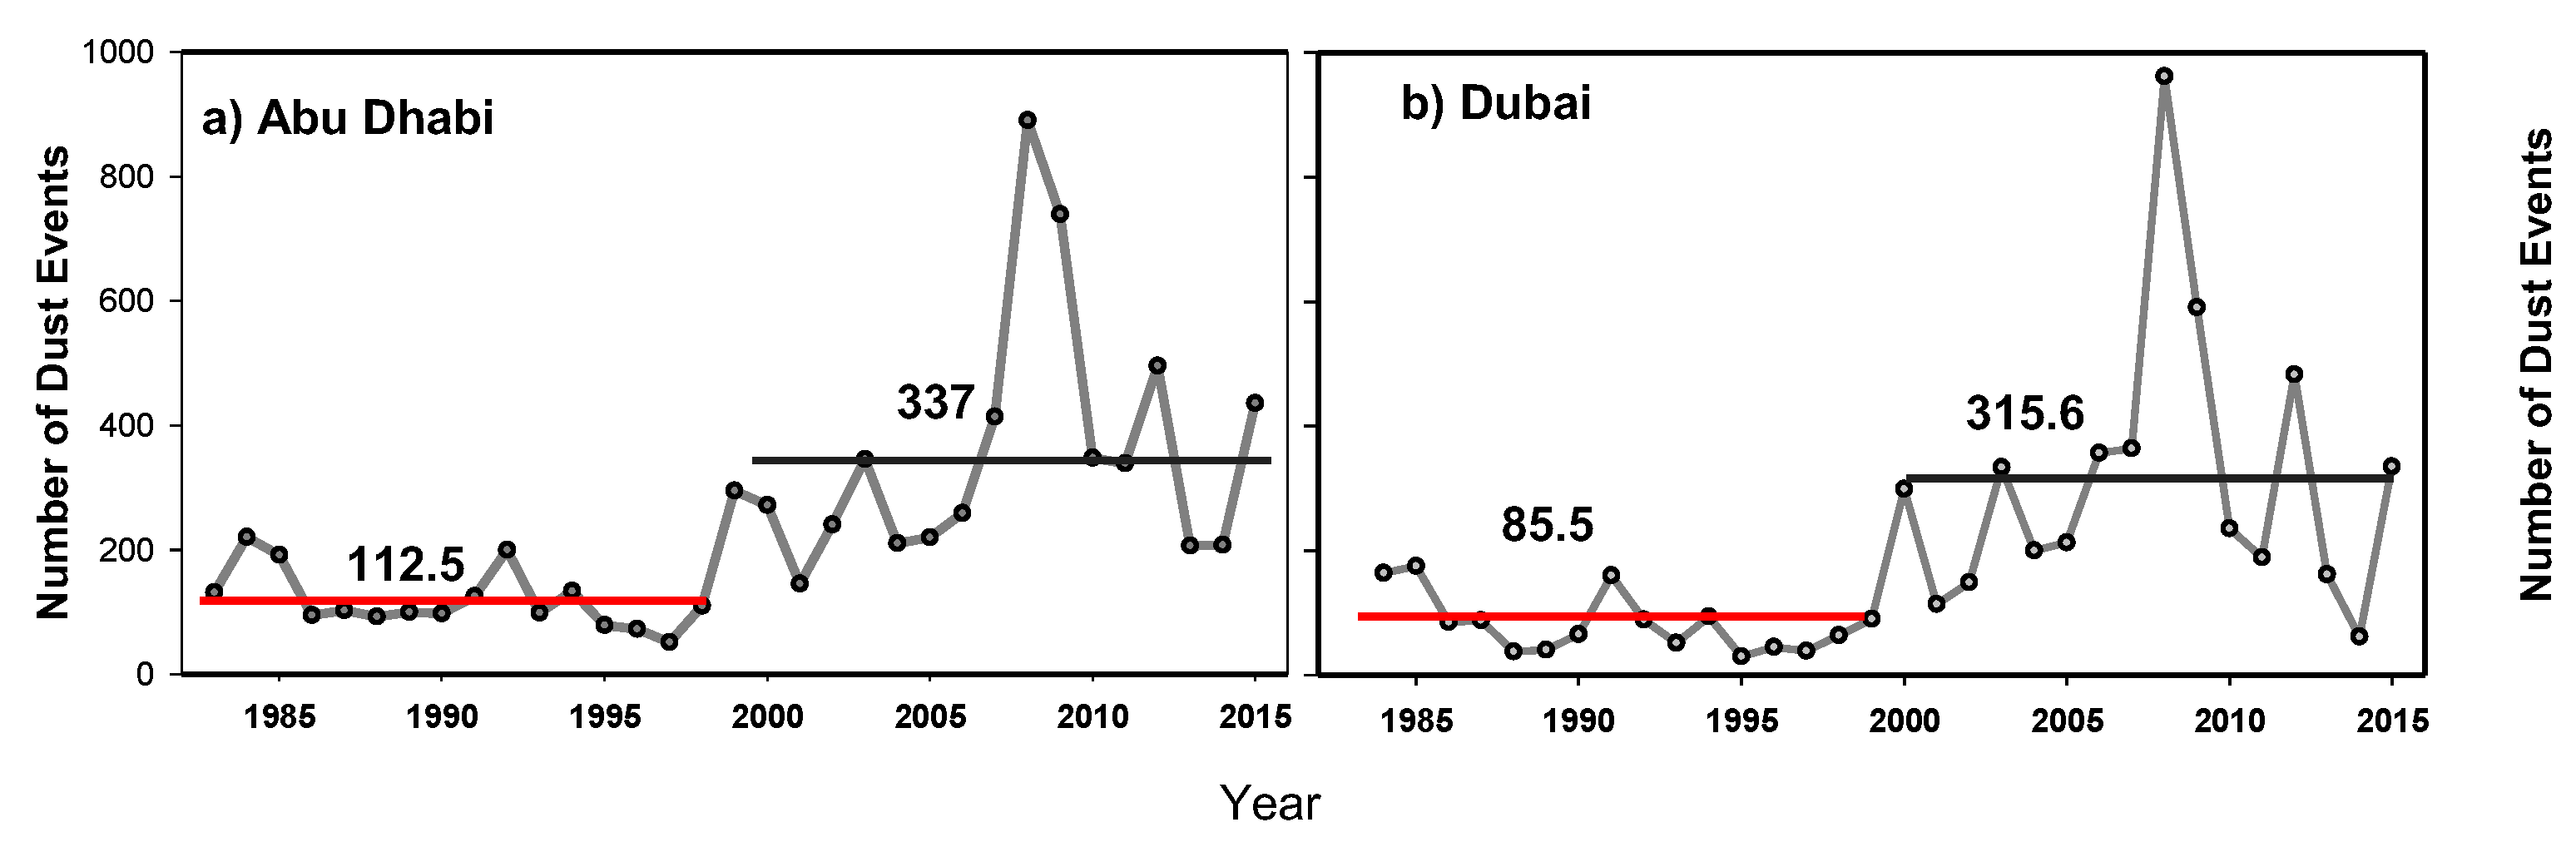
Figure 12 shows the identified change points and presents the mean and trends for the various segments for the number of dust events per year for both cities. The trend analyses show a significant upward increase in both cities. The mean and variance of the number of dust events for the two stations, before and after 1999 are significantly different. In Abu Dhabi, the mean value increased from about 112.5 to 337 dust events. In Dubai, the number of dust events increases from about 85.5 to 315.6 events after 1999. The Levene’s test results also indicate a change in the variances of the total number of dust events for Abu Dhabi and Dubai.
3.4. Links with Climate Dynamics
3.4.1. Fog and Climate Oscillations
The noticeable change between the mean number of fog events before and after 1999 could be associated with an ENSO event, as confirmed by other studies that tackled climatic variables in the UAE like precipitation and wind [48,51]. In their research, [51] explained the role of large-scale atmospheric teleconnection patterns in altering the surface energy balance and how they operate when the strong westerly jet streams persistent in the upper atmosphere are favorable for the propagation of Rossby waves (Section 3.2, Figure 6). In a similar case in Japan, Zhang et al. [52] analyzed how the Pacific-Japan teleconnection pattern influences July sea fog. They stated that the covariance indicated a close correlation, with a coefficient of 0.62 exceeding the 0.99 confidence level. They also discussed the meridional sea surface temperature gradient and the geopotential heights roles in creating a favorable condition in high Pacific Japan index years, for the warm and humid air, when crossing the surface sea temperature front, to fog formation. In their study, Cao et al. [53] found that there were more fog events over the North China Plain in the summers that followed La Niña events. They also found that there is a strong relationship between strong El Niño and La Niña events and the circulation anomaly [54]. These regional and global studies have shown the connections between ENSO events and some climate variables. However, understanding how teleconnection mechanisms like ENSO change the weather patterns at a regional scale over the UAE is still needed, with controls for fog and dust storm formulation.
To understand the reasons for this change of phase before and after 1999, the relationship between fog variability and climate oscillations was investigated (Figure 13) which indicates that there are changes of phase for a few climate indices around the year 1999. This could explain the change in the mean and variance of the number of fog events before and after that year. Absolute correlation values between those climate indices and the number of fog events at Abu Dhabi station are high. Only PDO shows a negative correlation with the number of fog events (r = −0.568). The SOI, EAO, and AMO show a positive correlation with r = 0.467, 0.513, and 0.509, respectively. The positive and negative correlations between the climate oscillations (SOI, PDO, EAO, and AMO) and the number of fog events have shown that climate oscillations play a role in the occurrence of fog in the UAE, thus affecting visibility.
3.4.2. Dust and Climate Oscillations
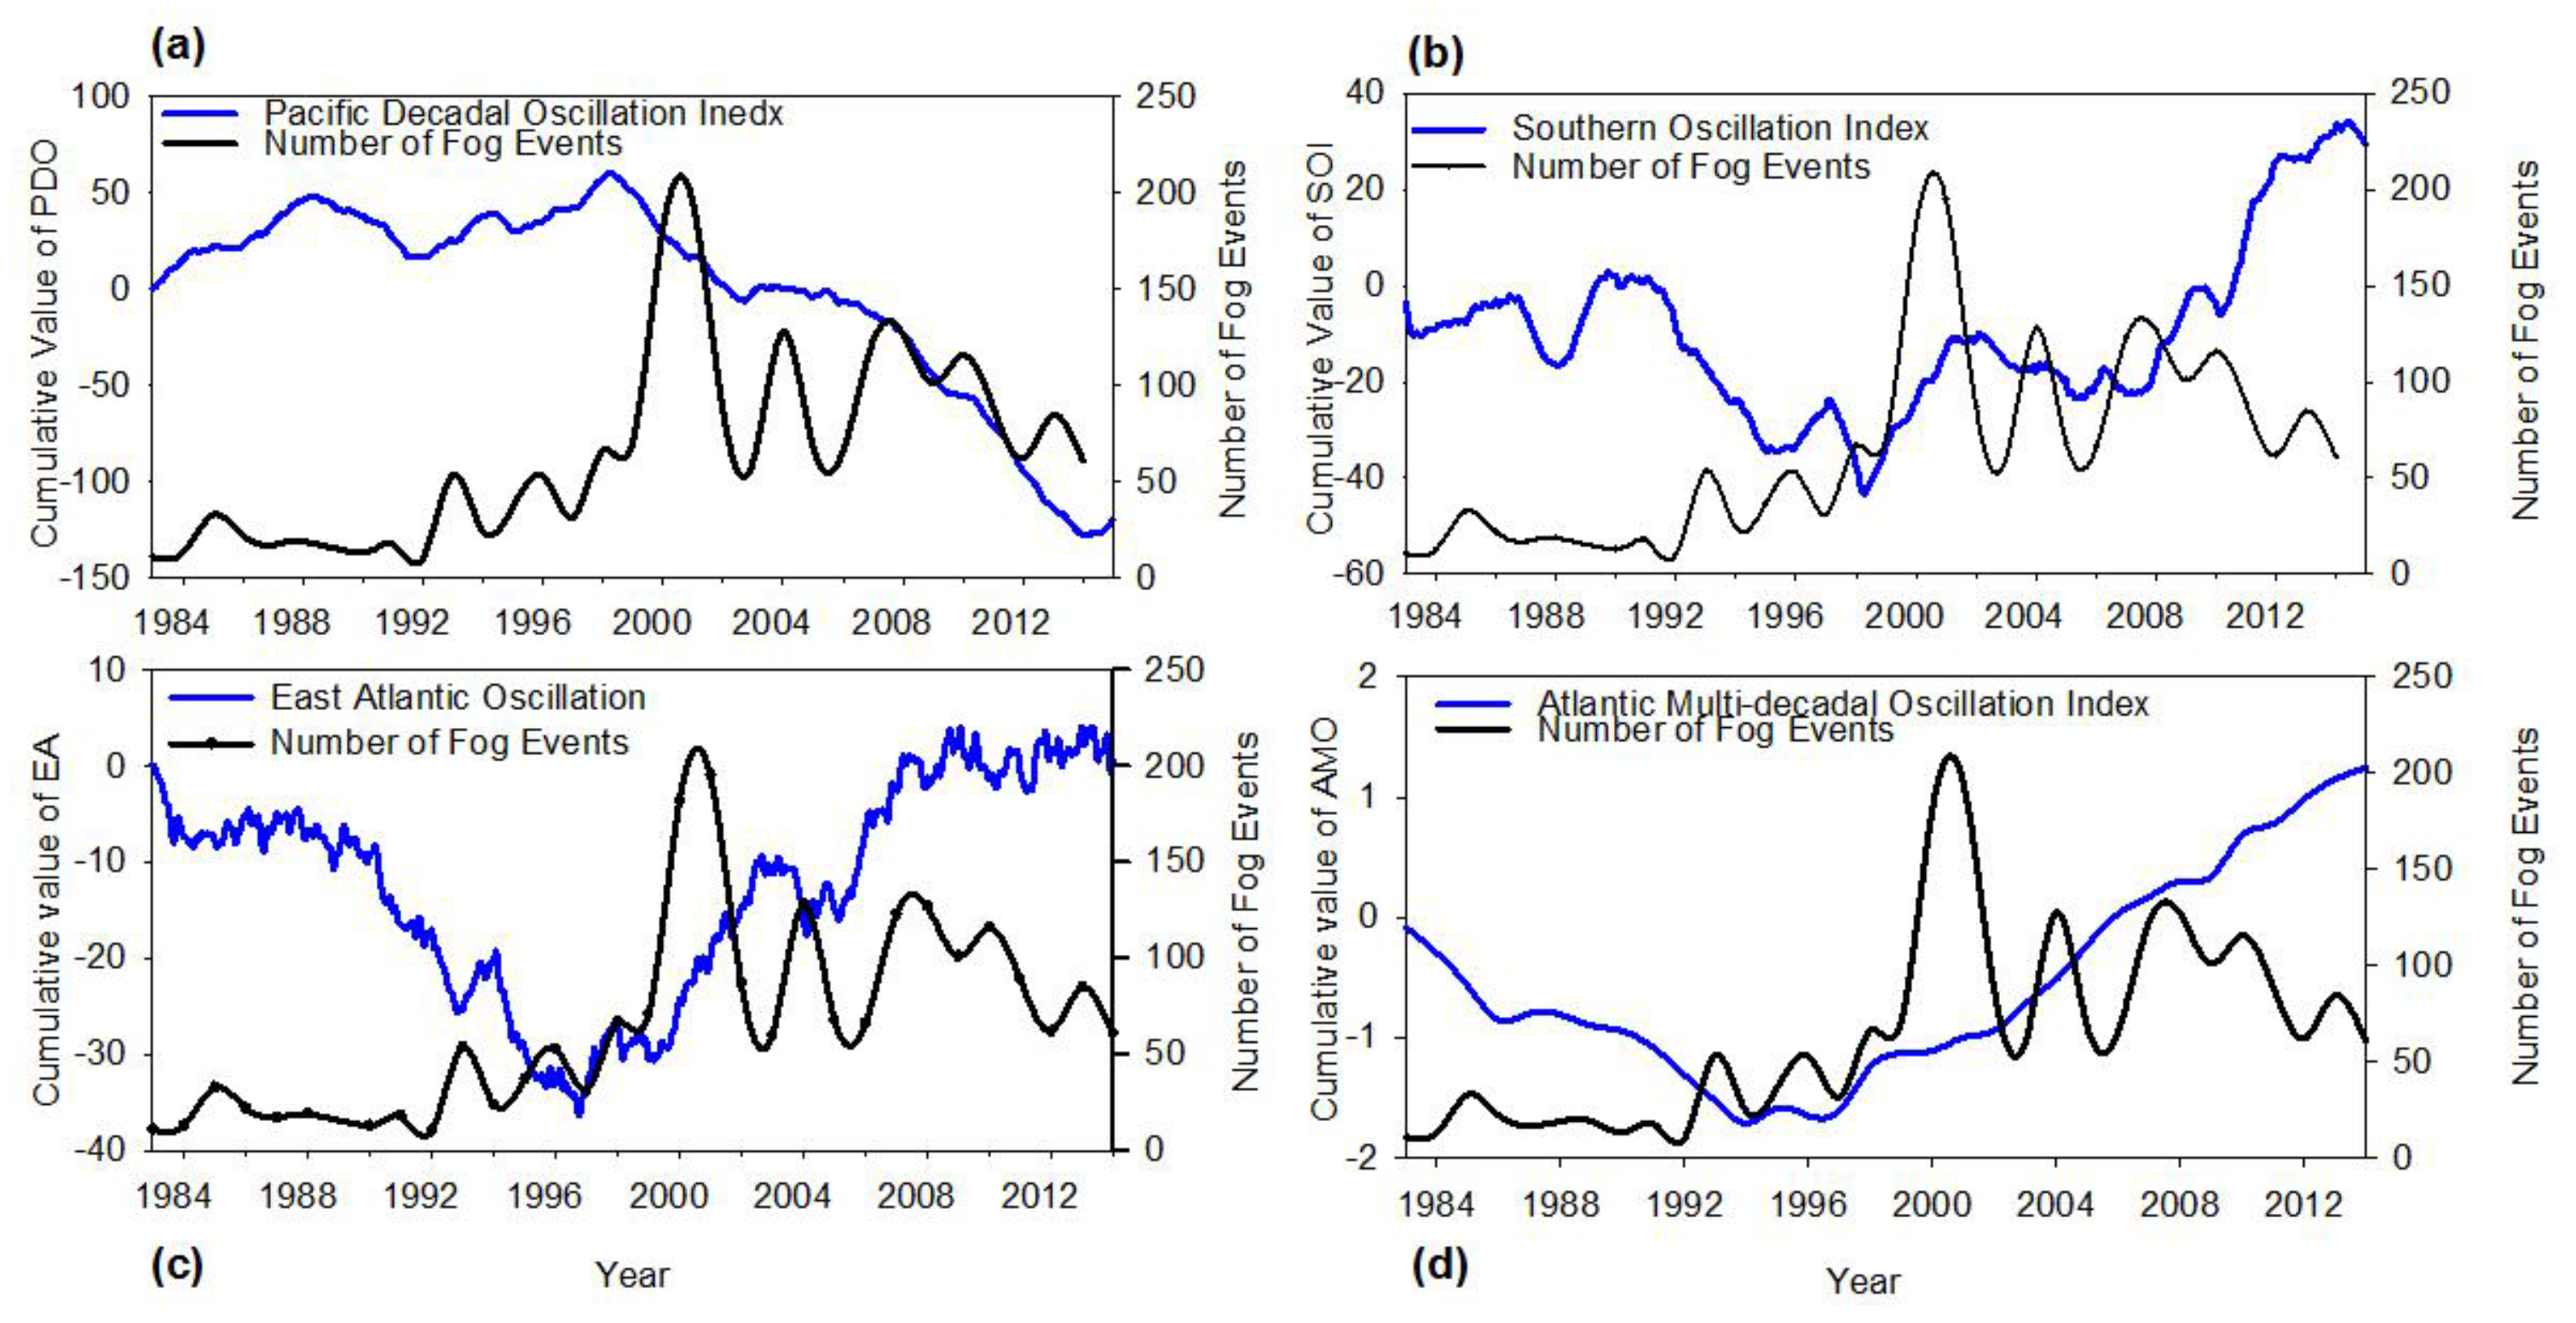
Figure 14 illustrates the relationship between dust events and climate oscillations. It indicates that there are changes of phase for these climate indices around 1999, such as fog. This may explain the change in the mean and variance of the number of dust events before and after the year 1999. Correlation values between those climate indices and the number of dust events at Abu Dhabi station are high. Only PDO shows a negative correlation with the number of dust events (r = −0.571). The SOI and EAO show positive but moderate correlation with r = 0.236 and 0.301, respectively. However, AMO shows a positive correlation with r = 0.561. The positive and negative correlations between the climate indices (SOI, PDO, EAO, and AMO) and the number of dust events have shown that climate oscillations play a role in the occurrence of dust storms in the UAE, thus causing visibility deterioration. In their research, [22] stated that dust is a controlling factor of visibility in the Arabian Gulf as dust events are significantly correlated to the visibility data.
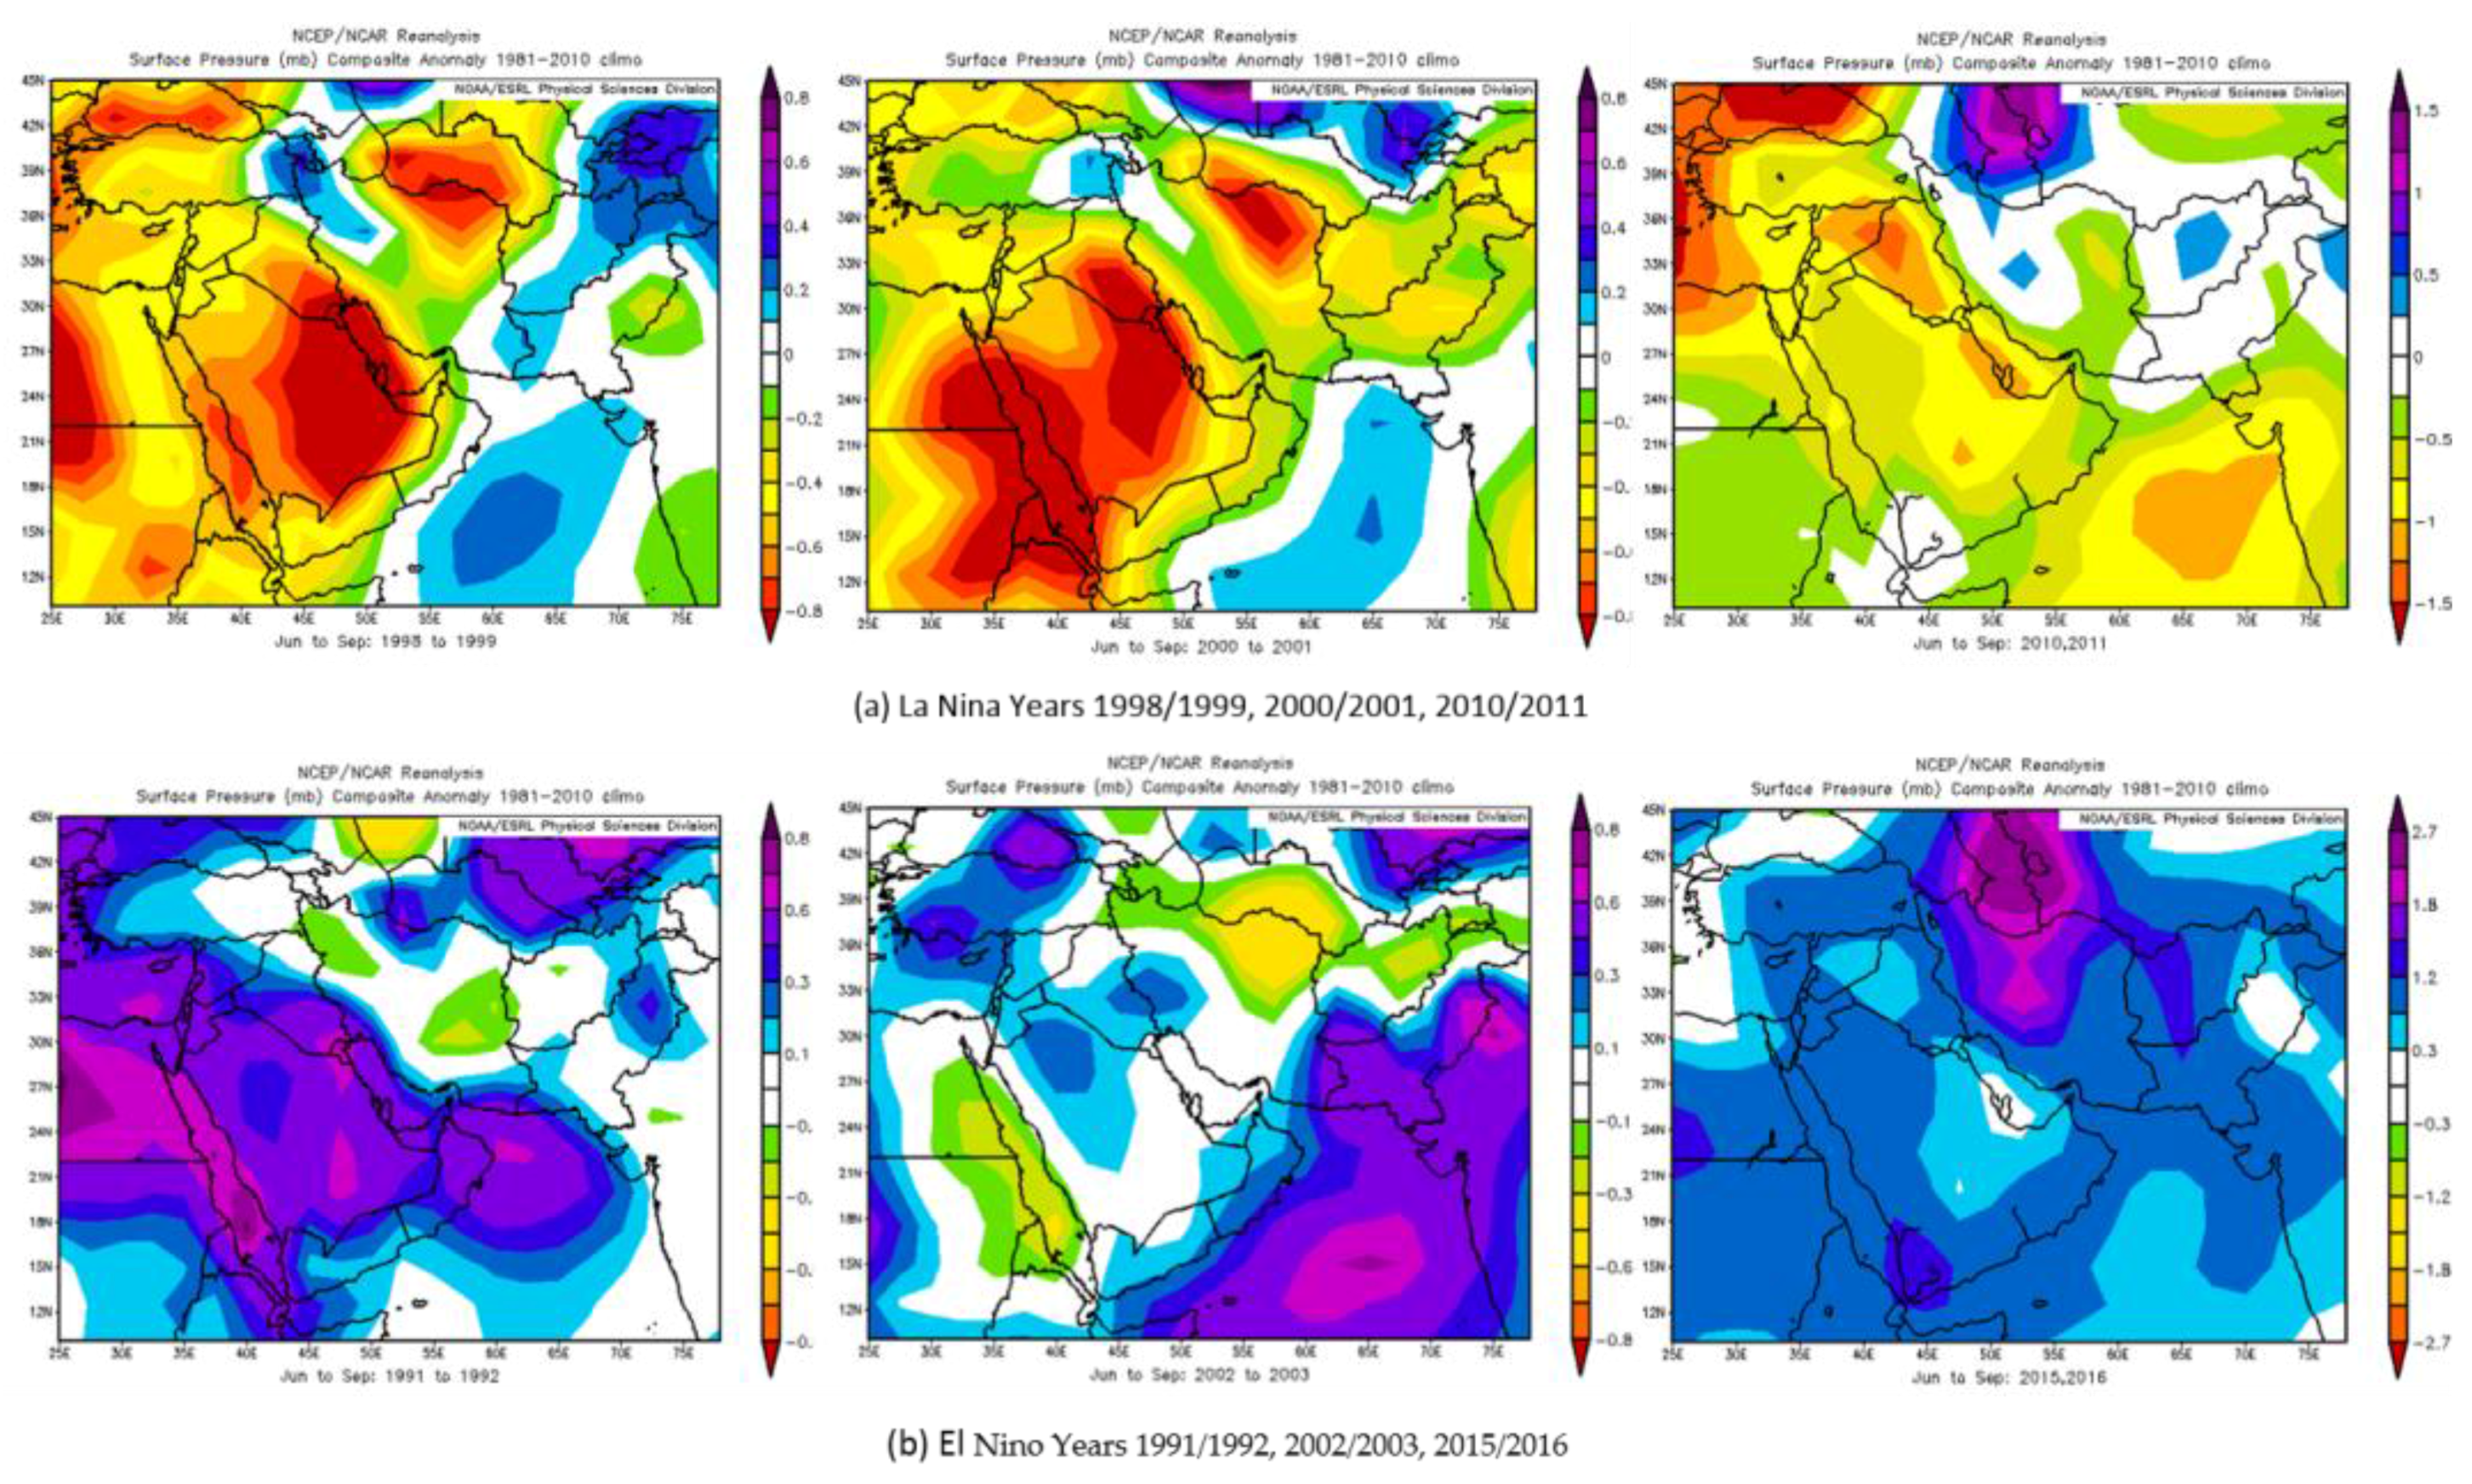
To understand the role of climate oscillations and synoptic conditions in dust movement, further analyses were carried out on two ENSO events (linked to the SOI index used earlier). The atmospheric pressure maps derived from the National Center for Environmental Prediction Reanalysis data [55] at earth surface level during six ENSO events; the strong positive events in 1991/1992, 2002/2003, and 2015/2016 (El Niño-warm phase) and the negative events in 1998/1999, 2000/2001, and 2010/2011 (La Niña-cold phase) are presented in Figure 15 [55]. In summer, the changes associated with the summer monsoon low-pressure system over northwestern India affect the Arabian Gulf region and generate Shamal winds. These changes also reduce the atmospheric pressure and increase the temperature during Shamal events. As a result of the weakening of the summer monsoon during ENSO positive phase events (Figure 15a,b), the tropical convection shifts toward the east cause a weaker low pressure monsoon over India. This leads to a disturbance to the Jet Stream [22] which guides the planetary Rossby waves in the upper troposphere by altering them based on the anomalous warming and cooling of ENSO events [51]. The divergence of air raised at upper levels of the atmosphere during the ENSO positive phase and associated vorticity changes in the upper troposphere drive the atmospheric Rossby waves that affect global atmospheric circulation. These changes in planetary waves affect the global atmospheric circulations by altering the surface energy balance in extra-tropics, mainly due to surface wind speed anomalies which affect latent and sensible heat fluxes [51,56]. It is noticeable from Figure 15 that there is a clear change of phase of surface atmospheric pressure associated with the ENSO warm and cold events. This teleconnection mechanism shows that ENSO has an impact on the formulation of dust storms in the region during summer periods, and thus an effect on visibility. In their research, Naizghi, and Ouarda [48] prove that climate oscillations play a role in dust transportation in the UAE, hence affecting visibility. High temperature and wind speed improve visibility by enhancing the dispersive capability of the atmosphere via thermal and mechanical turbulence respectively and reducing aerosol concentration levels [13].
Although this work generates important findings in relation to visibility, temporal and spatial variability and its associated factors in the UAE, it is worth mentioning that deeper analysis could be done using satellite data to infer visibility value, or factors that may impact visibility, capture its spatial distribution, and analyze the synoptic conditions that contribute to inter-annual and seasonal visibility variability. To further investigate the predominant factors affecting visibility and better predict visibility degradation, future work should focus on the microphysics and additional variables like liquid water path and droplet size distribution should be analyzed. To understand and assess the impact of Shamal-related dust events and Haboob wind on visibility, additional studies with reliable regional models are needed. Dust particles’ elemental and morphological characterization is also needed to determine its radiative and scattering effects, respectively.
4. Conclusions
This study presents the results of analyzing historically recorded data in ten airport stations over a 30-year period to reveal visibility spatial and temporal variations. The selected stations were mainly located in or close to major cities in the eastern and central parts of the UAE. The western region and the deep desert are not covered by existing stations. Observations from ten stations are taken onward for further analysis based on the continuity and reliability of available records.
Analyzing the hourly visibility observations at four visual ranges (<0.1 km, 0.1–1.0 km, 1.0–2.5 km, 2.5–5.0 km) for ten airport stations in the UAE reveals that there are different temporal trends (decreasing/increasing), as well as spatial variations. Analyzing the correlation with fog, mist, and relative humidity, as well as aerosols, reveals that visibility varies temporally and spatially under wet and dry weather conditions. In general, wet and dry weather conditions have more pronounced negative impacts on visibility in Abu Dhabi than in Dubai, due to the increased impact of fog and dust frequency resulting from synoptic and mesoscale climatic conditions. On average 62 fog events have occurred in Abu Dhabi City in comparison with 27 fog events in Dubai. However, 225 dust events have occurred in Abu Dhabi during the last three decades, in comparison with 200 events in Dubai over the same time period.
Recent massive land use changes have led to changes in energy balance and net radiation. Highly reflective roofs and surfaces, in addition to the dominant light and dry soil, have a high albedo; this leads to a lower net of solar radiation. Net radiation available to be transformed into latent, sensible, and soil heat fluxes generate a warming effect and lead to moisture loss due to dew deposition, which would trigger fog formulation. Furthermore, the turbulent mixing in the boundary layer during stable conditions and the presence of the Al Hajar Mountains on the eastern side of the study domain promotes the initiation of local convection. Therefore, recent land use changes, heat and moisture transport in soil, and topographic effects are important factors in the formation of fog, leading to visibility impairment in the UAE.
This study confirms that climate teleconnections play a crucial role in altering the synoptic conditions responsible for fog formulation and dissipation as well as dust movements and transportation in the region, and hence influencing visibility.
A change point of the number of fog events was detected around the year 1999, which is significantly correlated with climate indices namely ENSO, IOD, EAO, and PDO. The same trend and change point are detected around the same year for the number of dust events. A brief discussion on the impact of Shamal-related dust events and impacts of Haboob wind on visibility was done. Correlation between the mesoscale and synoptic conditions and visibility observations explained their roles in visibility deteriorations under wet and dry weather conditions. Results not only highlight the importance of meteorological factors on visibility reductions in the study domain but also confirm the essential role of aerosols in degrading visibility in the UAE.
Acknowledgments
Authors thank Jun Zhao for his technical assistance in data processing. This study was conducted with the support from Masdar Institute of Science and Technology Student Support Grant (SSG)-SSG2015-000066.
Author Contributions
Amal Aldababseh conceived, designed and applied the methodology, analyzed the data, developed the results and wrote the paper. Marouane Temimi, in his capacity as advisor, oversaw the application of the approach and development of the obtained results.
Conflicts of Interest
The authors declare no conflict of interest.
Appendix A. Description of Statistical Methods Used
The Mann–Kendall statistic, denoted as S, for a given data set of size n, is defined as follows:
where Xi is the data value for the period i and Xj are the data value for period j. The sgn(Xj − Xi) is the sign function given by:
For a given time series y1, y2, …, yn, the cumulative sum of deviations [57], for any time t, is given by:
The Student’s t-test is a statistical hypothesis test, used to determine if two sets of data are significantly different from each other. The test statistic follows a student’s t-distribution under the null hypothesis, H0 [58]. For a sample of size n = x1, x2, …, xn, s is the ratio of sample standard deviation overpopulation standard deviation, σ is the population standard deviation of the data, is the mean for the sample size n, and µ is the population mean. The t-test is calculated as follows:
The Levene’s test is an inferential statistic used to test the homogeneity of variances, calculated for two or more groups [59]. It is one of the preferable tests as it attempts to test the assumption of having the same variances of the populations from which different samples were drawn [60,61]. It is usually conducted before a comparison of the two groups’ means, using Student’s t-test.
The Levene’s test statistic, W, is defined as follows:
where W is the result of the test, k is the number of the groups. In our case, we have two groups; N is the number of cases in all groups, Ni is the number of cases in the ith group. The significance of W is tested against , where F is a quantile of the F-test distribution, with k − 1 and N − k its degrees of freedom, and α is the chosen level of significance (usually 0.05 or 0.01). Z.. and Zi. are defined as follows [58,60]:
and Zij can be calculated as followed:
References
- Luo, C.-H.; Yuan, C.-S.; Wen, C.-Y.; Liaw, J.-J.; Chiu, S.-H. Investigation of urban atmospheric visibility using Haar wavelet transform. Aerosol Air Qual. Res. 2005, 5, 39–47. [Google Scholar]
- Che, H.; Zhang, X.; Li, Y.; Zhou, Z.; Qu, J.J. Horizontal visibility trends in China 1981–2005. Geophys. Res. Lett. 2007, 34. [Google Scholar] [CrossRef]
- Chen, Y.; Xie, S.-D. Long-term trends and characteristics of visibility in two megacities in southwest China: Chengdu and Chongqing. J. Air Waste Manag. Assoc. 2013, 63, 1058–1069. [Google Scholar] [CrossRef] [PubMed]
- Yang, L.-X.; Wang, D.-C.; Cheng, S.-H.; Wang, Z.; Zhou, Y.; Zhou, X.-H.; Wang, W.-X. Influence of meteorological conditions and particulate matter on visual range impairment in Jinan, China. Sci. Total Environ. 2007, 383, 164–173. [Google Scholar] [CrossRef] [PubMed]
- Appel, B.; Tokiwa, Y.; Hsu, J.; Kothny, E.; Hahn, E. Visibility as related to atmospheric aerosol constituents. Atmos. Environ. 1985, 19, 1525–1534. [Google Scholar] [CrossRef]
- Malm, W. Considerations in the measurement of visibility. J. Air Pollut. Control Assoc. 1979, 29, 1042–1052. [Google Scholar] [CrossRef]
- Smirnova, T.G.; Benjamin, S.G.; Brown, J.M. Case study verification of RUC/MAPS fog and visibility forecasts. In Proceedings of the 9th Conference on Aviation, Range, and Aerospace Meteorology, Orlando, FL, USA, 11–15 September 2000; pp. 31–36. [Google Scholar]
- Sabetghadam, S.; Ahmadi-Givi, F.; Golestani, Y. Visibility trends in Tehran during 1958–2008. Atmos. Environ. 2012, 62, 512–520. [Google Scholar] [CrossRef]
- Abdelfatah, A.S.; Marzouk, M.; Garib, A.; Al-Harthei, H. A framework for Abu Dhabi police traffic monitoring and response center. J. Traffic Logist. Eng. 2013, 1, 243–248. [Google Scholar] [CrossRef]
- Al-Harthei, H.; Ben Ali, O.; Garib, A. Real-time traffic patrol allocation for Abu Dhabi emirate (UAE). J. Traffic Logist. Eng. 2013, 1, 64–68. [Google Scholar] [CrossRef]
- Funk, W.E.; Pleil, J.D.; Pedit, J.A.; Boundy, M.G.; Yeatts, K.B.; Nash, D.G.; Trent, C.B.; El Sadig, M.; Davidson, C.A.; Leith, D. Indoor air quality in the United Arab Emirates. J. Environ. Prot. 2014, 5, 709. [Google Scholar] [CrossRef]
- Balarabe, M.; Abdullah, K.; Nawawi, M. Long-Term Trend and Seasonal Variability of Horizontal Visibility in Nigerian Troposphere. Atmosphere 2015, 6, 1462–1486. [Google Scholar] [CrossRef]
- Lin, M.; Tao, J.; Chan, C.-Y.; Cao, J.-J.; Zhang, Z.-S.; Zhu, L.-H.; Zhang, R.-J. Regression analyses between recent air quality and visibility changes in megacities at four haze regions in China. Aerosol Air Qual. Res. 2012, 12, 1049–1061. [Google Scholar] [CrossRef]
- Xiao, S.; Wang, Q.; Cao, J.; Huang, R.-J.; Chen, W.; Han, Y.; Xu, H.; Liu, S.; Zhou, Y.; Wang, P. Long-term trends in visibility and impacts of aerosol composition on visibility impairment in Baoji, China. Atmos. Res. 2014, 149, 88–95. [Google Scholar] [CrossRef]
- Pui, D.Y.; Chen, S.-C.; Zuo, Z. PM2.5 in China: Measurements, sources, visibility and health effects, and mitigation. Particuology 2014, 13, 1–26. [Google Scholar] [CrossRef]
- Jaswal, A.K.; Kumar, N.; Prasad, A.K.; Kafatos, M. Decline in horizontal surface visibility over India (1961–2008) and its association with meteorological variables. Natl. Hazards 2013, 68, 929–954. [Google Scholar] [CrossRef]
- Doyle, M.; Dorling, S. Visibility trends in the UK 1950–1997. Atmos. Environ. 2002, 36, 3161–3172. [Google Scholar] [CrossRef]
- Xiao, Z.-M.; Zhang, Y.-F.; Hong, S.-M.; Bi, X.-H.; Jiao, L.; Feng, Y.-C.; Wang, Y.-Q. Estimation of the main factors influencing haze, based on a long-term monitoring campaign in Hangzhou, China. Aerosol Air Qual. Res. 2011, 11, 873–882. [Google Scholar] [CrossRef]
- Sloane, C.S. Visibility trends—I. Methods of analysis. Atmos. Environ. 1982, 16, 41–51. [Google Scholar] [CrossRef]
- Lee, H.-H.; Bar-Or, R.Z.; Wang, C. Biomass burning aerosols and the low-visibility events in Southeast Asia. Atmos. Chem. Phys. 2017, 17, 965–980. [Google Scholar] [CrossRef]
- Tiwari, S.; Payra, S.; Mohan, M.; Verma, S.; Bisht, D.S. Visibility degradation during foggy period due to anthropogenic urban aerosol at Delhi, India. Atmos. Pollut. Res. 2011, 2, 116–120. [Google Scholar] [CrossRef]
- Al Senafi, F.; Anis, A. Shamals and climate variability in the Northern Arabian/Persian Gulf from 1973 to 2012. Int. J. Climatol. 2015, 35, 4509–4528. [Google Scholar] [CrossRef]
- Mathai, C.; Tombach, I. A critical assessment of atmospheric visibility and aerosol measurements in the eastern United States. JAPCA 1987, 37, 700–707. [Google Scholar] [CrossRef]
- Singh, A.; Bloss, W.J.; Pope, F.D. 60 years of UK visibility measurements: Impact of meteorology and atmospheric pollutants on visibility. Atmos. Chem. Phys. 2017, 17, 2085–2101. [Google Scholar] [CrossRef]
- Luo, C.-H.; Wen, C.-Y.; Yuan, C.-S.; Liaw, J.-J.; Lo, C.-C.; Chiu, S.-H. Investigation of urban atmospheric visibility by high-frequency extraction: Model development and field test. Atmos. Environ. 2005, 39, 2545–2552. [Google Scholar] [CrossRef]
- Abdi Vishkaee, F.; Flamant, C.; Cuesta, J.; Oolman, L.; Flamant, P.; Khalesifard, H.R. Dust transport over Iraq and northwest Iran associated with winter Shamal: A case study. J. Geophys. Res. Atmos. 2012, 117. [Google Scholar] [CrossRef] [Green Version]
- Gultepe, I.; Pearson, G.; Milbrandt, J.; Hansen, B.; Platnick, S.; Taylor, P.; Gordon, M.; Oakley, J.; Cober, S. The fog remote sensing and modeling field project. Bull. Am. Meteorol. Soc. 2009, 90, 341. [Google Scholar] [CrossRef]
- Norouzi, H.; Temimi, M.; Prigent, C.; Turk, J.; Khanbilvardi, R.; Tian, Y.; Furuzawa, F.; Masunaga, H. Assessment of the consistency among global microwave land surface emissivity products. Atmos. Meas. Tech. 2015, 8, 1197. [Google Scholar] [CrossRef]
- Norouzi, H.; Temimi, M.; AghaKouchak, A.; Azarderakhsh, M.; Khanbilvardi, R.; Shields, G.; Tesfagiorgis, K. Inferring land surface parameters from the diurnal variability of microwave and infrared temperatures. Phys. Chem. Earth Parts A/B/C 2015, 83, 28–35. [Google Scholar] [CrossRef]
- Al Azhar, M.; Temimi, M.; Zhao, J.; Ghedira, H. Modeling of circulation in the Arabian Gulf and the Sea of Oman: Skill assessment and seasonal thermohaline structure. J. Geophys. Res. Oceans 2016, 121, 1700–1720. [Google Scholar] [CrossRef]
- Chaouch, N.; Temimi, M.; Weston, M.; Ghedira, H. Sensitivity of the meteorological model WRF-ARW to planetary boundary layer schemes during fog conditions in a coastal arid region. Atmos. Res. 2017, 187, 106–127. [Google Scholar] [CrossRef]
- McMurry, P.H.; Stolzenburg, M.R. On the sensitivity of particle size to relative humidity for Los Angeles aerosols. Atmos. Environ. 1989, 23, 497–507. [Google Scholar] [CrossRef]
- Filonczuk, M.K.; Cayan, D.R.; Riddle, L.G. Variability of Marine Fog along the California Coast; Scripps Institution of Oceanography: La Jolla, CA, USA, 1995. [Google Scholar]
- Environment Agency Abu Dhabi, E.A.A.D. Climate Change Impacts, Vulnerability & Adaptation; Report; Environment Agency Abu Dhabi: Abu Dhabi, UAE, 2009.
- Kazim, A.M. Assessments of primary energy consumption and its environmental consequences in the United Arab Emirates. Renew. Sustain. Energy Rev. 2007, 11, 426–446. [Google Scholar] [CrossRef]
- Worldometers. United Arab Emirates Population. Available online: http://www.worldometers.info/world-population/united-arab-emirates-population/ (accessed on 10 September 2017).
- NCEI, N.C.f.E.I. NOAA’s U.S. Integrated Surface Global Hourly Data. NCEI DSI 3505. gov.noaa.ncdc:C00532, 1982–2016. Available online: https://www.esrl.noaa.gov (accessed on 17 January 2017).
- Tan, J.; Duan, J.; He, K.; Ma, Y.; Duan, F.; Chen, Y.; Fu, J. Chemical characteristics of PM2.5 during a typical haze episode in Guangzhou. J. Environ. Sci. 2009, 21, 774–781. [Google Scholar] [CrossRef]
- Lawrence, M.G. The relationship between relative humidity and the dewpoint temperature in moist air: A simple conversion and applications. Bull. Am. Meteorol. Soc. 2005, 86, 225–233. [Google Scholar] [CrossRef]
- Department of the Air Force. Aircrew Quick Reference to the METAR and TAF Codes. Air Force Pamphlet 11-238, 2005. Available online: http://www.e-publishing.af.mil (accessed on 1 November 2005).
- Yue, S.; Wang, C. The Mann-Kendall test modified by effective sample size to detect trend in serially correlated hydrological series. Water Resour. Manag. 2004, 18, 201–218. [Google Scholar] [CrossRef]
- Miller, S.D.; Kuciauskas, A.P.; Liu, M.; Ji, Q.; Reid, J.S.; Breed, D.W.; Walker, A.L.; Mandoos, A.A. Haboob dust storms of the southern Arabian Peninsula. J. Geophys. Res. Atmos. 2008, 113. [Google Scholar] [CrossRef]
- Shahid, S.A.; Abdelfattah, M.A. Soils of Abu Dhabi Emirate. In Terrestrial Environment of Abu Dhabi Emirate; Environment Agency: Abu Dhabi, UAE, 2008; pp. 71–91. [Google Scholar]
- National Center of Meteorlogoy and Seismology. Dust—United Arab Emirates 2001–2011; A National Report; National Center of Meteorlogoy and Seismology: Abu Dhabi, UAE, 2011.
- Kalnay, E.; Kanamitsu, M.; Kistler, R.; Collins, W.; Deaven, D.; Gandin, L.; Iredell, M.; Saha, S.; White, G.; Woollen, J. The NCEP/NCAR 40-year reanalysis project. Bull. Am. Meteorol. Soc. 1996, 77, 437–471. [Google Scholar] [CrossRef]
- Eager, R.E.; Raman, S.; Wootten, A.; Westphal, D.L.; Reid, J.S.; Al Mandoos, A. A climatological study of the sea and land breezes in the Arabian Gulf region. J. Geophys. Res. Atmos. 2008, 113, D15. [Google Scholar] [CrossRef]
- Hamza, W.; Enan, M.R.; Al-Hassini, H.; Stuut, J.-B.; de-Beer, D. Dust storms over the Arabian Gulf: a possible indicator of climate changes consequences. Aquat. Ecosyst. Health Manag. 2011, 14, 260–268. [Google Scholar] [CrossRef]
- Naizghi, M.S.; Ouarda, T.B.M.J. Teleconnections and analysis of long-term wind speed variability in the UAE. Int. J. Climatol. 2016. [Google Scholar] [CrossRef]
- De Villiers, M.; Van Heerden, J. Fog at Abu Dhabi international airport. Weather 2007, 62, 209–214. [Google Scholar] [CrossRef]
- Syed, F.S.; Körnich, H.; Tjernström, M. On the fog variability over south Asia. Clim. Dyn. 2012, 39, 2993–3005. [Google Scholar] [CrossRef]
- Ouarda, T.; Charron, C.; Kumar, K.N.; Marpu, P.; Ghedira, H.; Molini, A.; Khayal, I. Evolution of the rainfall regime in the United Arab Emirates. J. Hydrol. 2014, 514, 258–270. [Google Scholar] [CrossRef]
- Zhang, S.-P.; Xie, S.-P.; Liu, Q.-Y.; Yang, Y.-Q.; Wang, X.-G.; Ren, Z.-P. Seasonal variations of yellow sea fog: Observations and mechanisms. J. Clim. 2009, 22, 6758–6772. [Google Scholar] [CrossRef]
- Cao, Z.; Sheng, L.; Liu, Q.; Yao, X.; Wang, W. Interannual increase of regional haze-fog in North China Plain in summer by intensified easterly winds and orographic forcing. Atmos. Environ. 2015, 122, 154–162. [Google Scholar] [CrossRef]
- Qu, W.; Wang, J.; Zhang, X.; Yang, Z.; Gao, S. Effect of cold wave on winter visibility over eastern China. J. Geophys. Res. Atmos. 2015, 120, 2394–2406. [Google Scholar] [CrossRef]
- NCEP. El Niño and La Niña Years and Intensities Based on Oceanic Niño Index (ONI). Updated September 2017. Available online: http://www.cpc.necp.noaa.gov/products/analysis_monitoring/ensostuff/ensoyears/shtml (accessed on 15 August 2017).
- Deser, C.; Blackmon, M.L. On the relationship between tropical and North Pacific sea surface temperature variations. J. Clim. 1995, 8, 1677–1680. [Google Scholar] [CrossRef]
- Woodall, W.H.; Ncube, M.M. Multivariate cusum quality-control procedures. Technometrics 1985, 27, 285–292. [Google Scholar] [CrossRef]
- Xue, J.H.; Titterington, D.M. t-Tests, F-tests and Otsu’s Methods for Image Thresholding. IEEE Trans. Image Process. 2011, 20, 2392–2396. [Google Scholar] [PubMed]
- Pallmann, P.; Hothorn, L.A.; Djira, G.D. A Levene-type test of homogeneity of variances against ordered alternatives. Comput. Stat. 2014, 29, 1593–1608. [Google Scholar] [CrossRef]
- Schultz, B.B. Levene’s test for relative variation. Syst. Biol. 1985, 34, 449–456. [Google Scholar] [CrossRef]
- O’Neill, M.E.; Mathews, K.L. Levene Tests of Homogeneity of Variance for General Block and Treatment Designs. Biometrics 2002, 58, 216–224. [Google Scholar] [CrossRef] [PubMed]
Figure 1.
(a) Study domain; (b) locations of the ten stations and elevation map; and (c) land use map and location of major cities in the UAE.
Figure 1.
(a) Study domain; (b) locations of the ten stations and elevation map; and (c) land use map and location of major cities in the UAE.

Figure 2.
An illustrative example of long-term averaged daily visibility observations for two stations, Abu Dhabi and Dubai, during the period of 1982–2016. The dashed line shows the 5 km threshold.
Figure 2.
An illustrative example of long-term averaged daily visibility observations for two stations, Abu Dhabi and Dubai, during the period of 1982–2016. The dashed line shows the 5 km threshold.
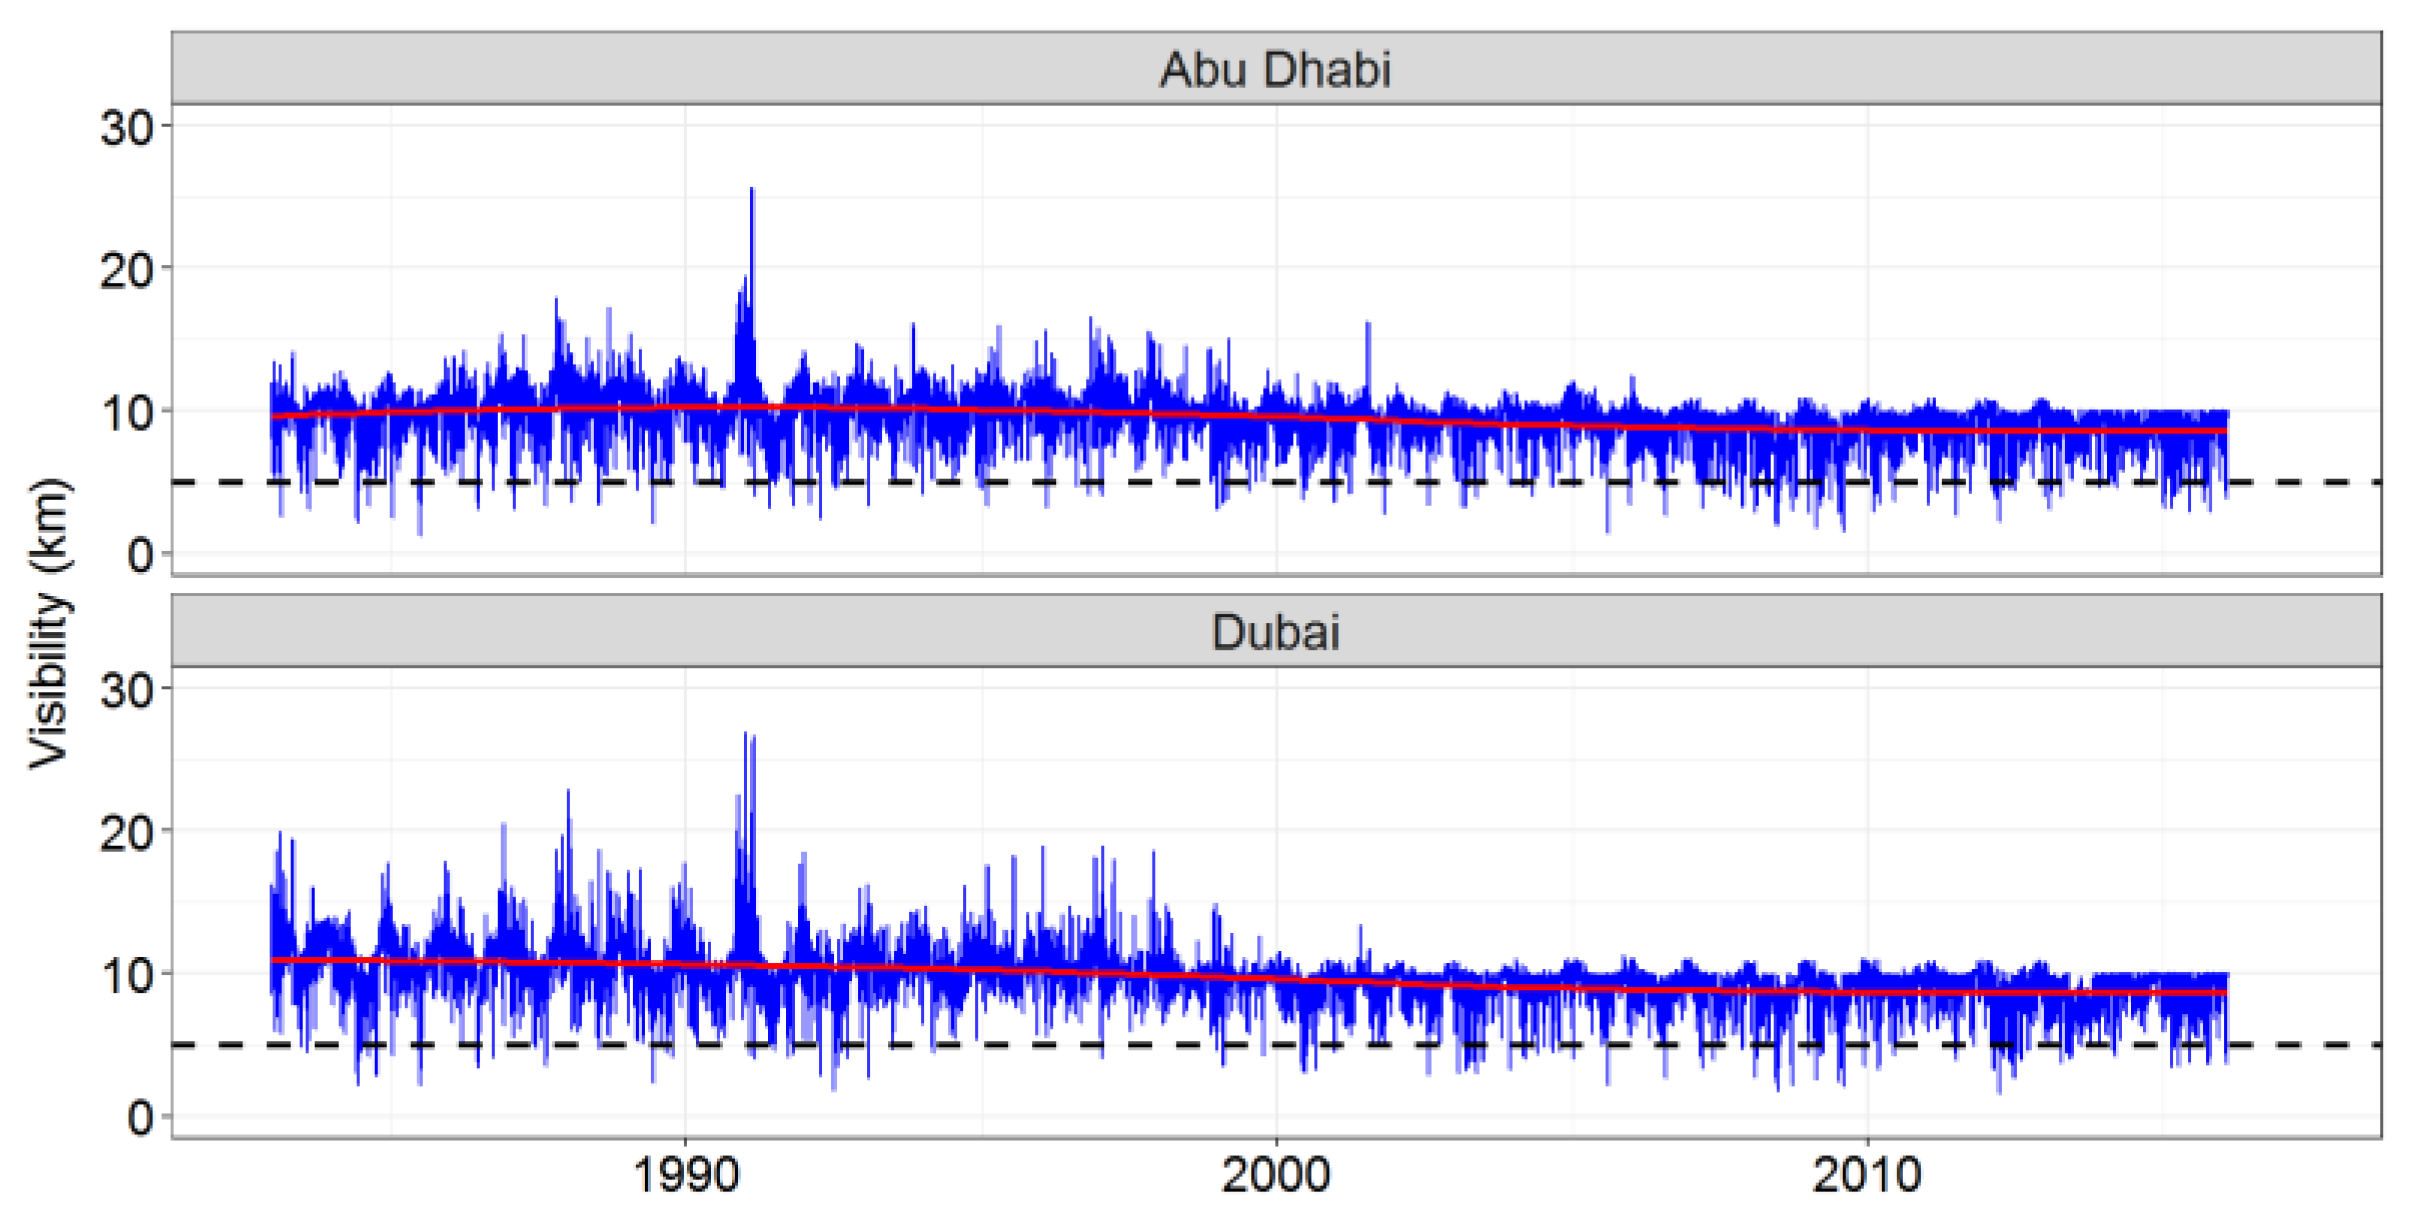
Figure 3.
Trends of visibility mean values during months with records below and above the annual visibility averages in Abu Dhabi station.
Figure 3.
Trends of visibility mean values during months with records below and above the annual visibility averages in Abu Dhabi station.
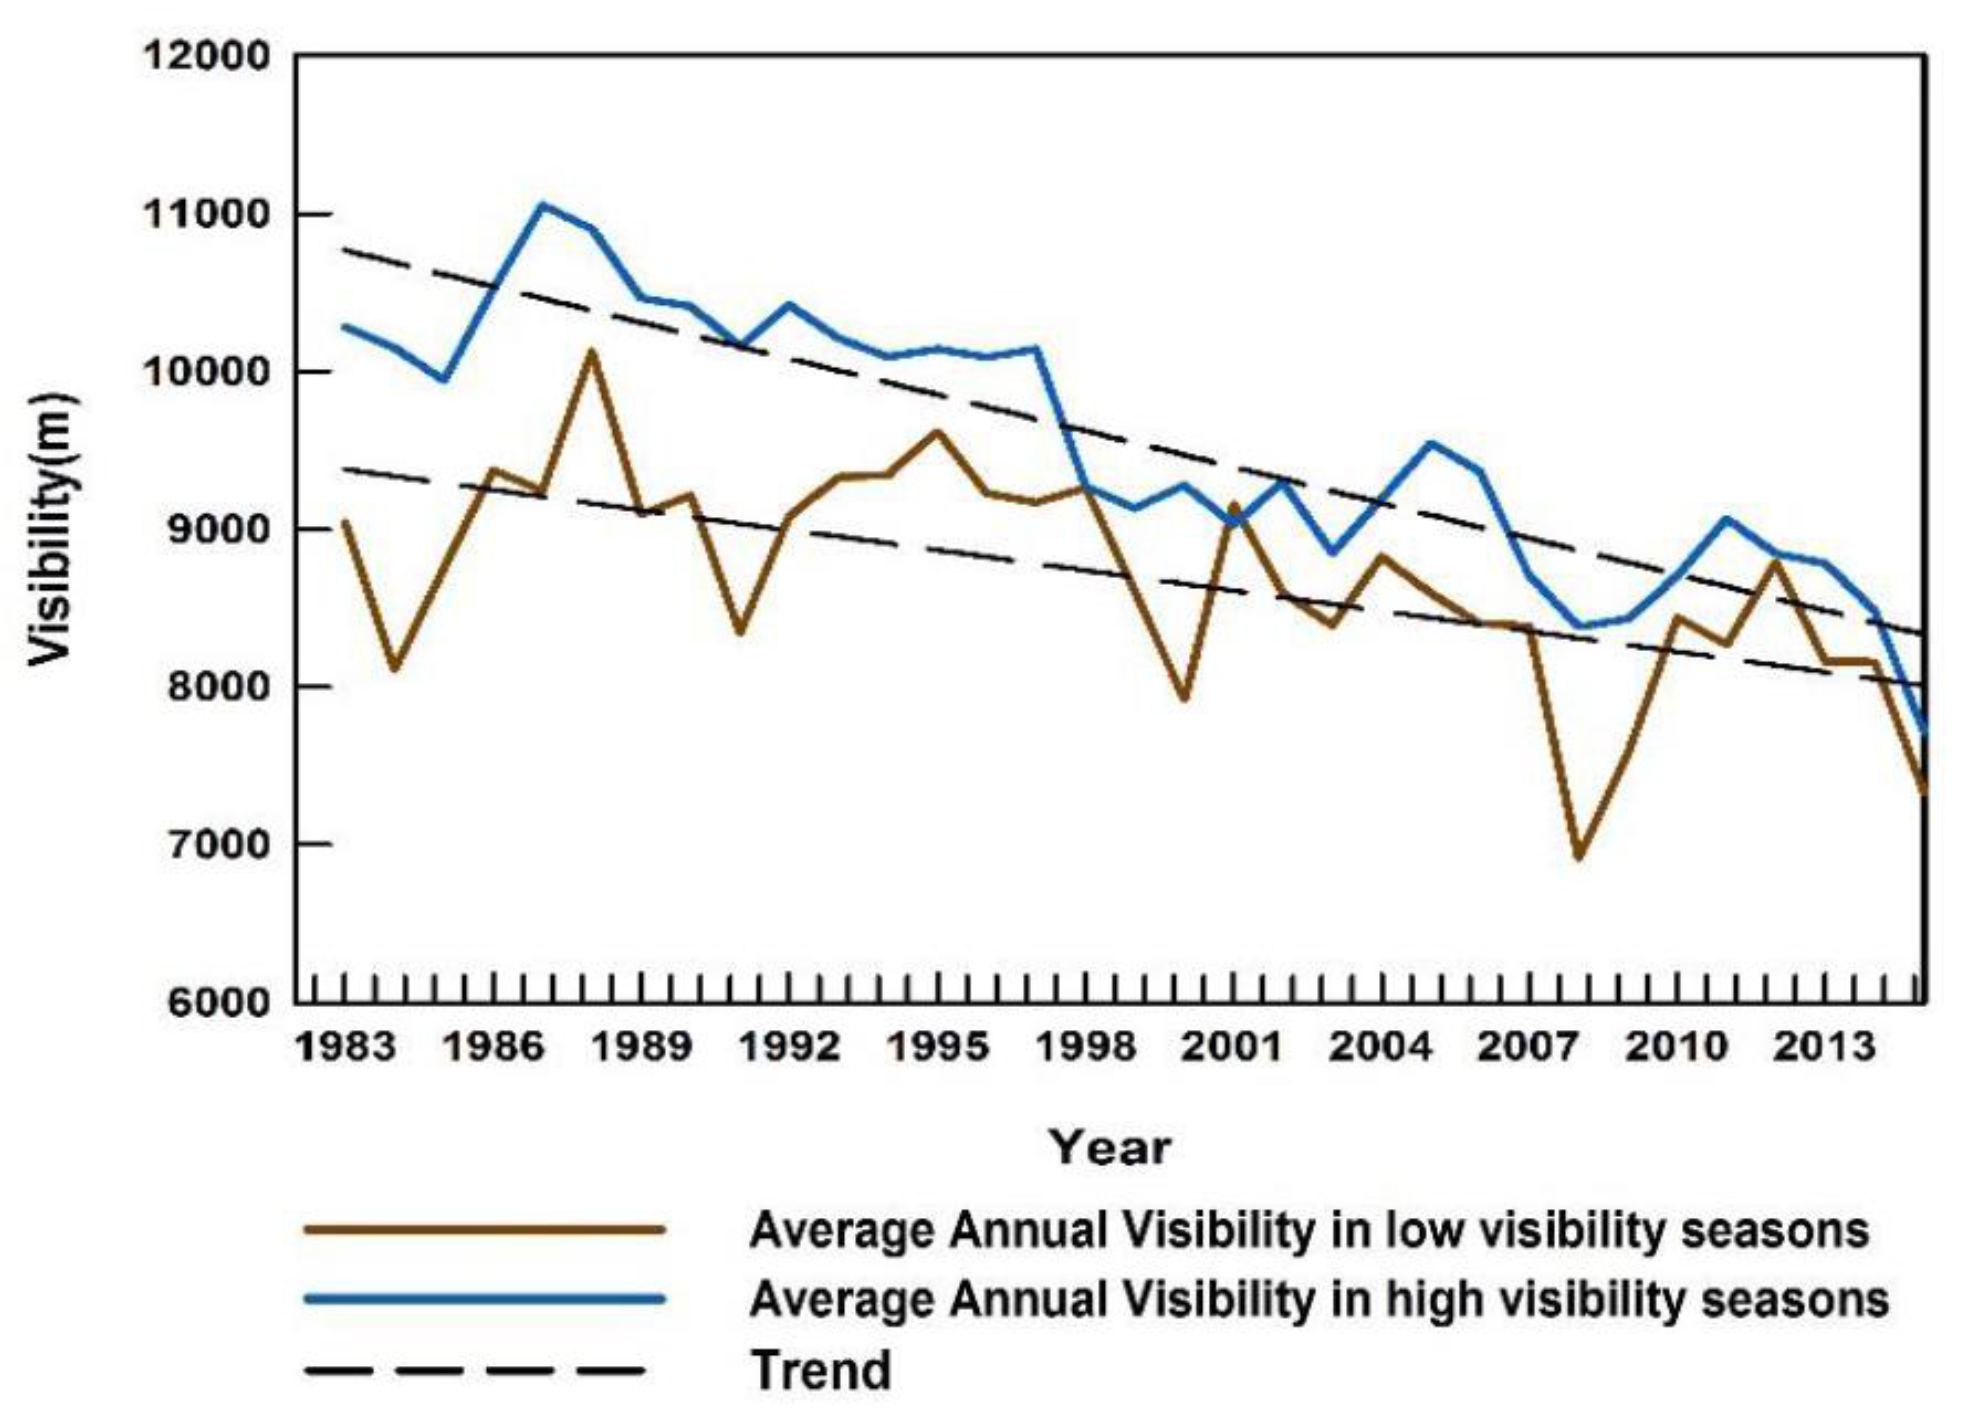
Figure 4.
Low visibility caused by (A) wet and (B) dry weather conditions per visibility class, per station (%).
Figure 4.
Low visibility caused by (A) wet and (B) dry weather conditions per visibility class, per station (%).

Figure 5.
The distribution per month of the number of poor visibility days per class, for the entire record, per station: (a) Abu Dhaib; (b) Al Maktoom; (c) Al Ain; (d) AlBateen; (e) AlDafra; (f) Ash-Shariqa; (g) Dubai; (h) Fujirah; (i) Ras AlKhaima; and (j) Shariqa.
Figure 5.
The distribution per month of the number of poor visibility days per class, for the entire record, per station: (a) Abu Dhaib; (b) Al Maktoom; (c) Al Ain; (d) AlBateen; (e) AlDafra; (f) Ash-Shariqa; (g) Dubai; (h) Fujirah; (i) Ras AlKhaima; and (j) Shariqa.

Figure 6.
Thirty three years of wind speed, relative humidity, and air temperature averaged anomalies at surface level, (a) vector wind in summer; (b) vector wind in winter; (c) relative humidity in summer (d) relative humidity in winter; (e) air temperature in summer; and (f) air temperature in winter over the Middle East, Latitude 12°–45° N, and Longitude 25°–75° E, with the study area located in the middle of the map.

Figure 7.
Abu Dhabi and Dubai long-term average visibility values under wet and dry weather conditions for different visibility classes: (a) 5.0–2.5 km; (b) 2.5–1.0 km; (c) 1.0–0.10 km; and (d) <0.1 km. Only significant trends are presented.
Figure 7.
Abu Dhabi and Dubai long-term average visibility values under wet and dry weather conditions for different visibility classes: (a) 5.0–2.5 km; (b) 2.5–1.0 km; (c) 1.0–0.10 km; and (d) <0.1 km. Only significant trends are presented.

Figure 8.
Frequency analysis of wet and dry visibility events in all stations: (a) Abu Dhaib; (b) Al Maktoum; (c) Al Ain; (d) Al Bateen; (e) AL Dafrah; (f) Ash-Shariqa; (g) Dubai; (h) Fujairah; (i) Ras Al-Khaimah; and (j) Sharjah. With visibility caused by wet conditions in Back, and visibility caused by dry weather conditions in Red. For four visibility classes: 1 (5–2.5 km), 2 (2.5–1.0 km), 3 (1.0–0.1 km), and 4 (<0.1 km).
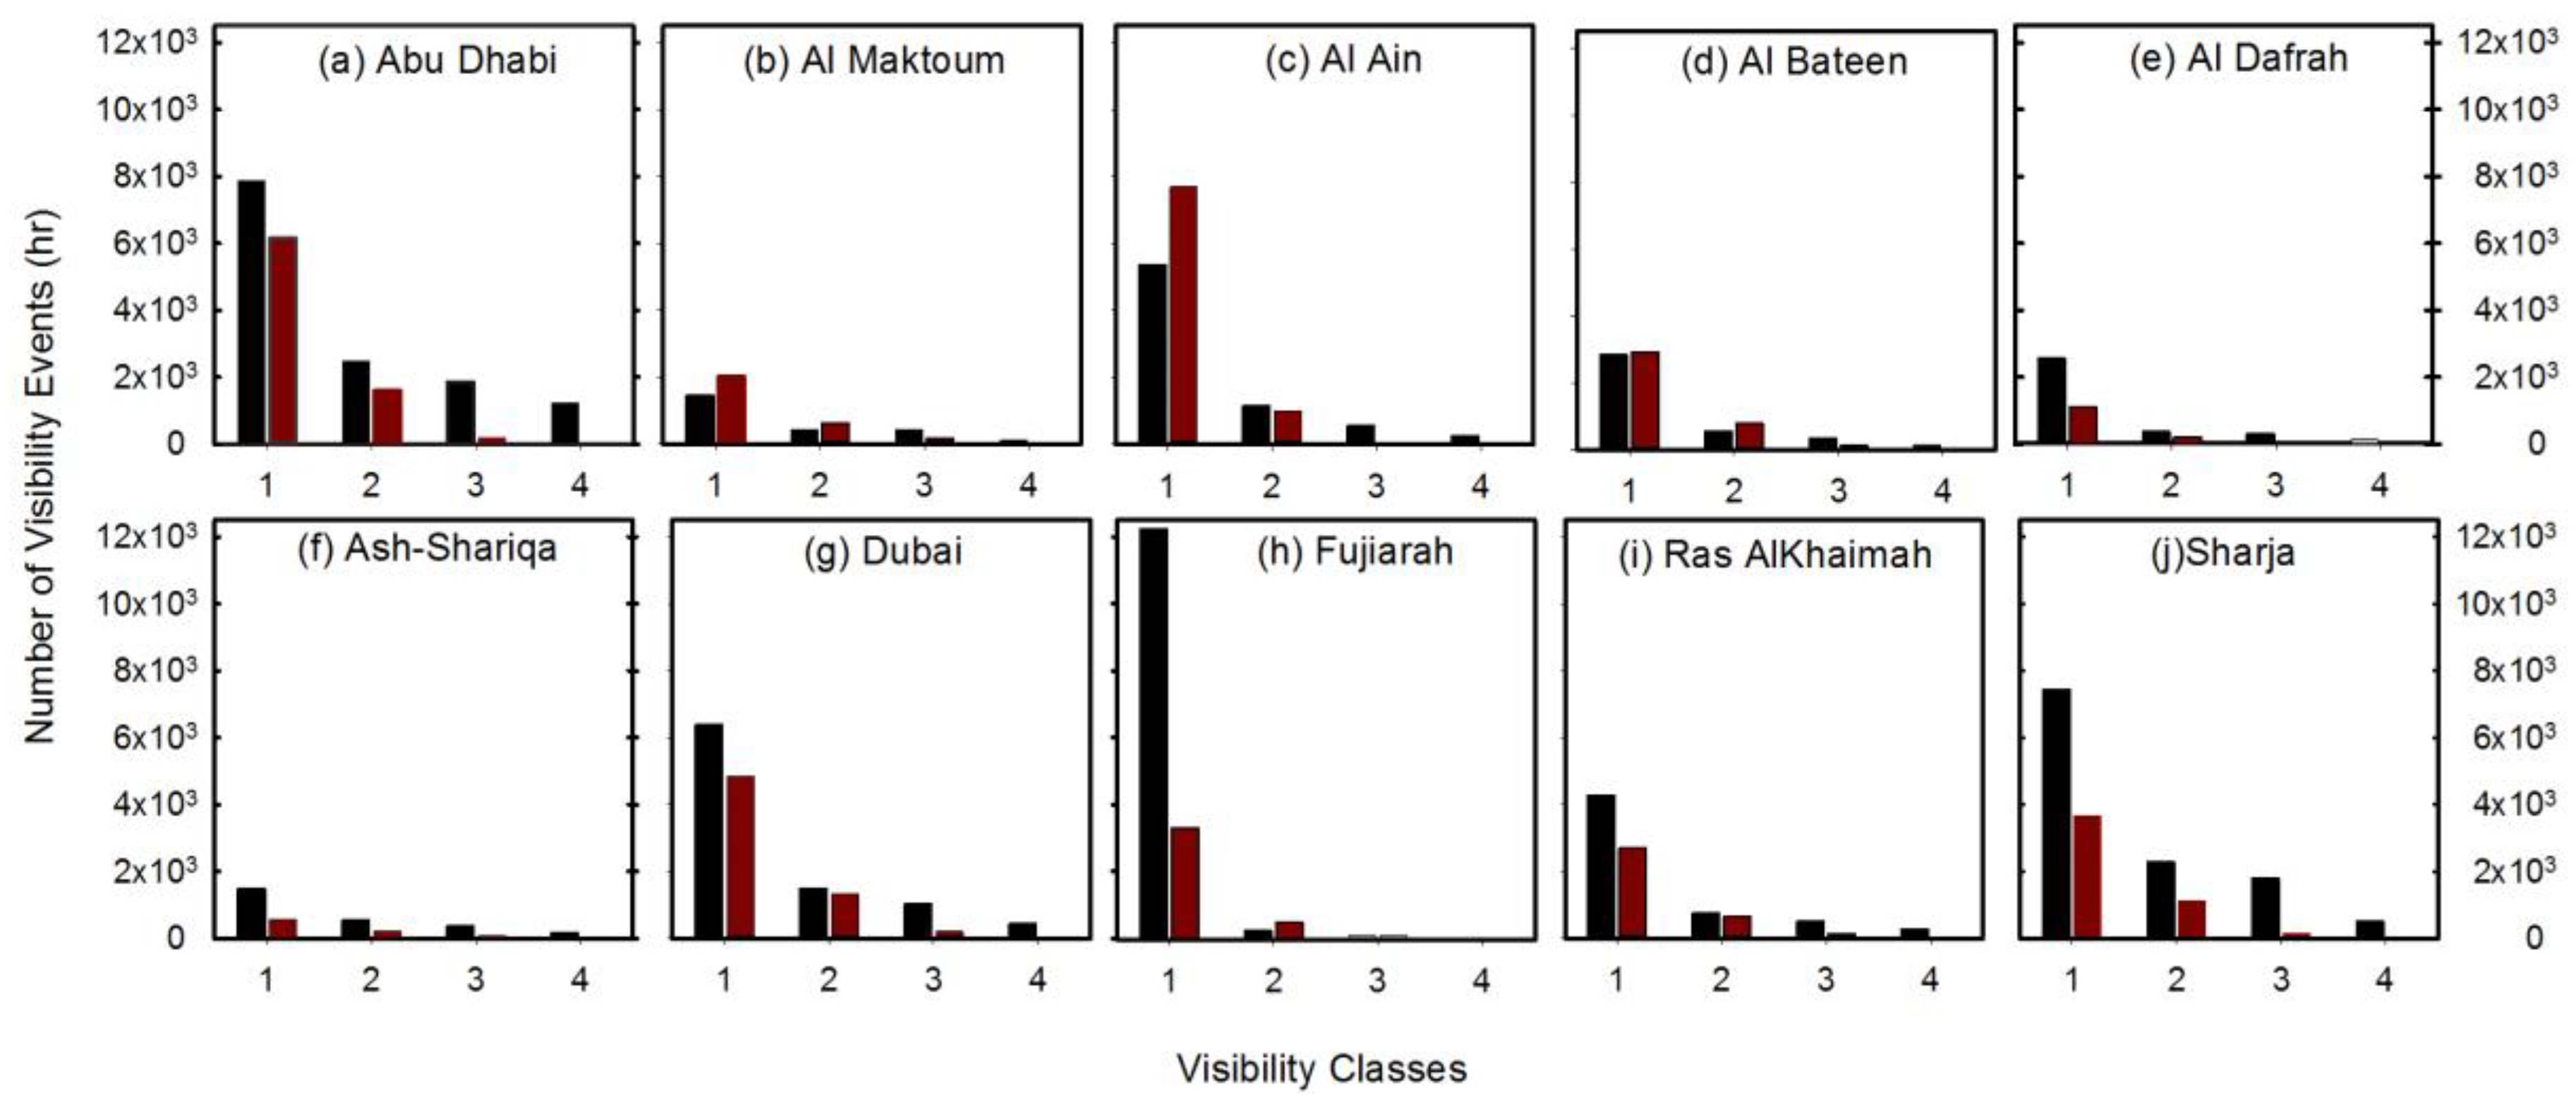
Figure 9.
Total annual hourly fog events of Abu Dhabi and Dubai from the years 1982–2016, and 1984–2016, respectively.
Figure 9.
Total annual hourly fog events of Abu Dhabi and Dubai from the years 1982–2016, and 1984–2016, respectively.
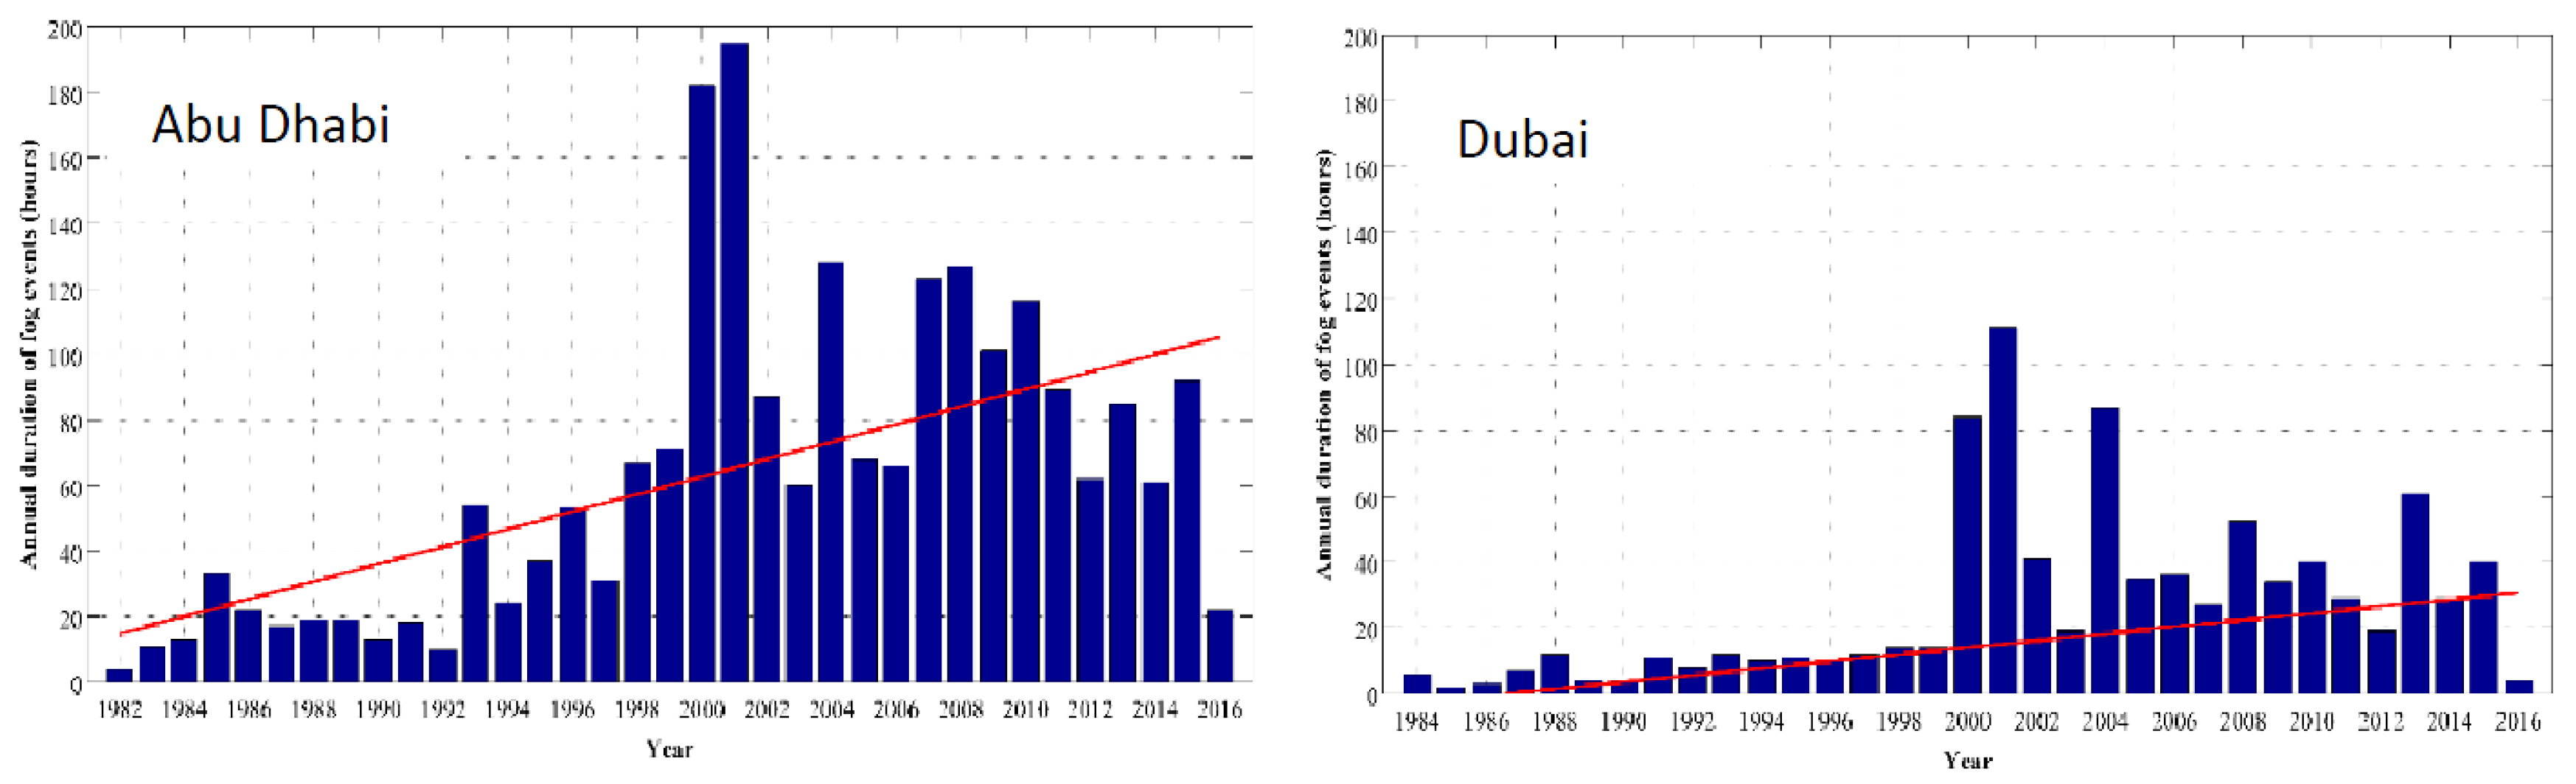
Figure 10.
Total annual hourly dust events of Abu Dhabi (1982–2016), and Dubai (1984–2016).
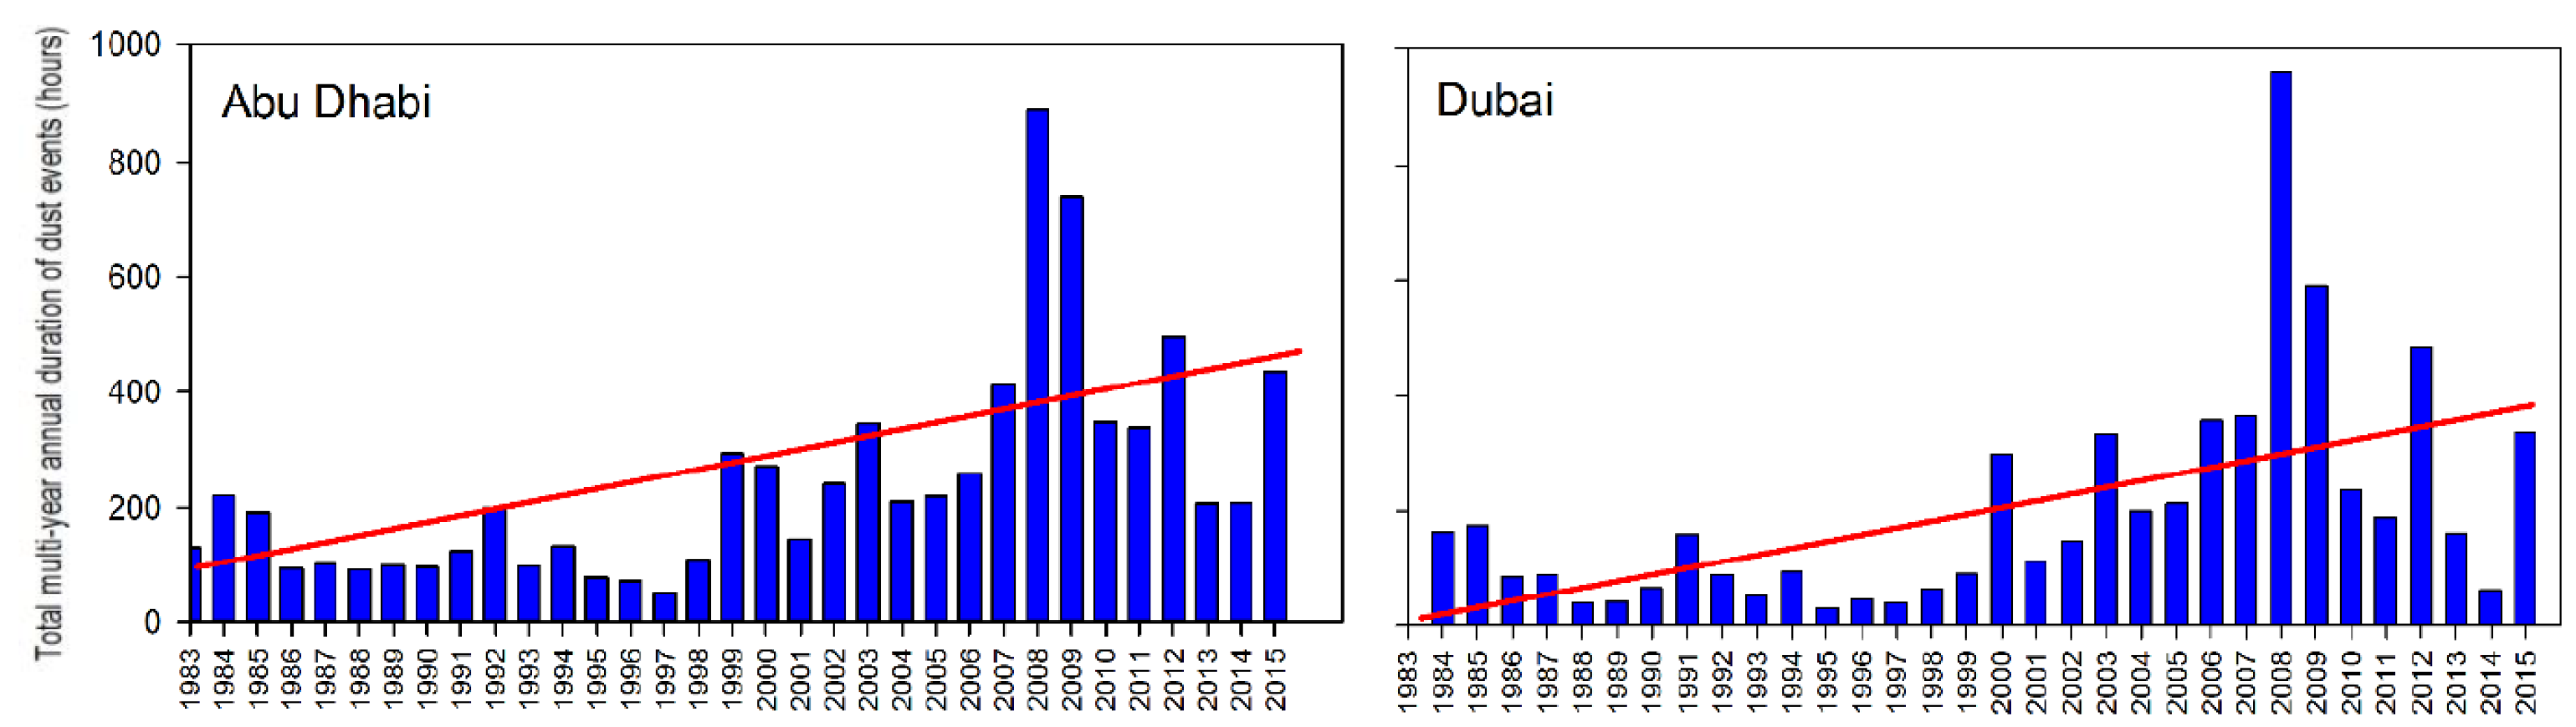
Figure 11.
A homogeneity analysis for number of fog events in (a) Abu Dhabi and (b) Dubai cities.
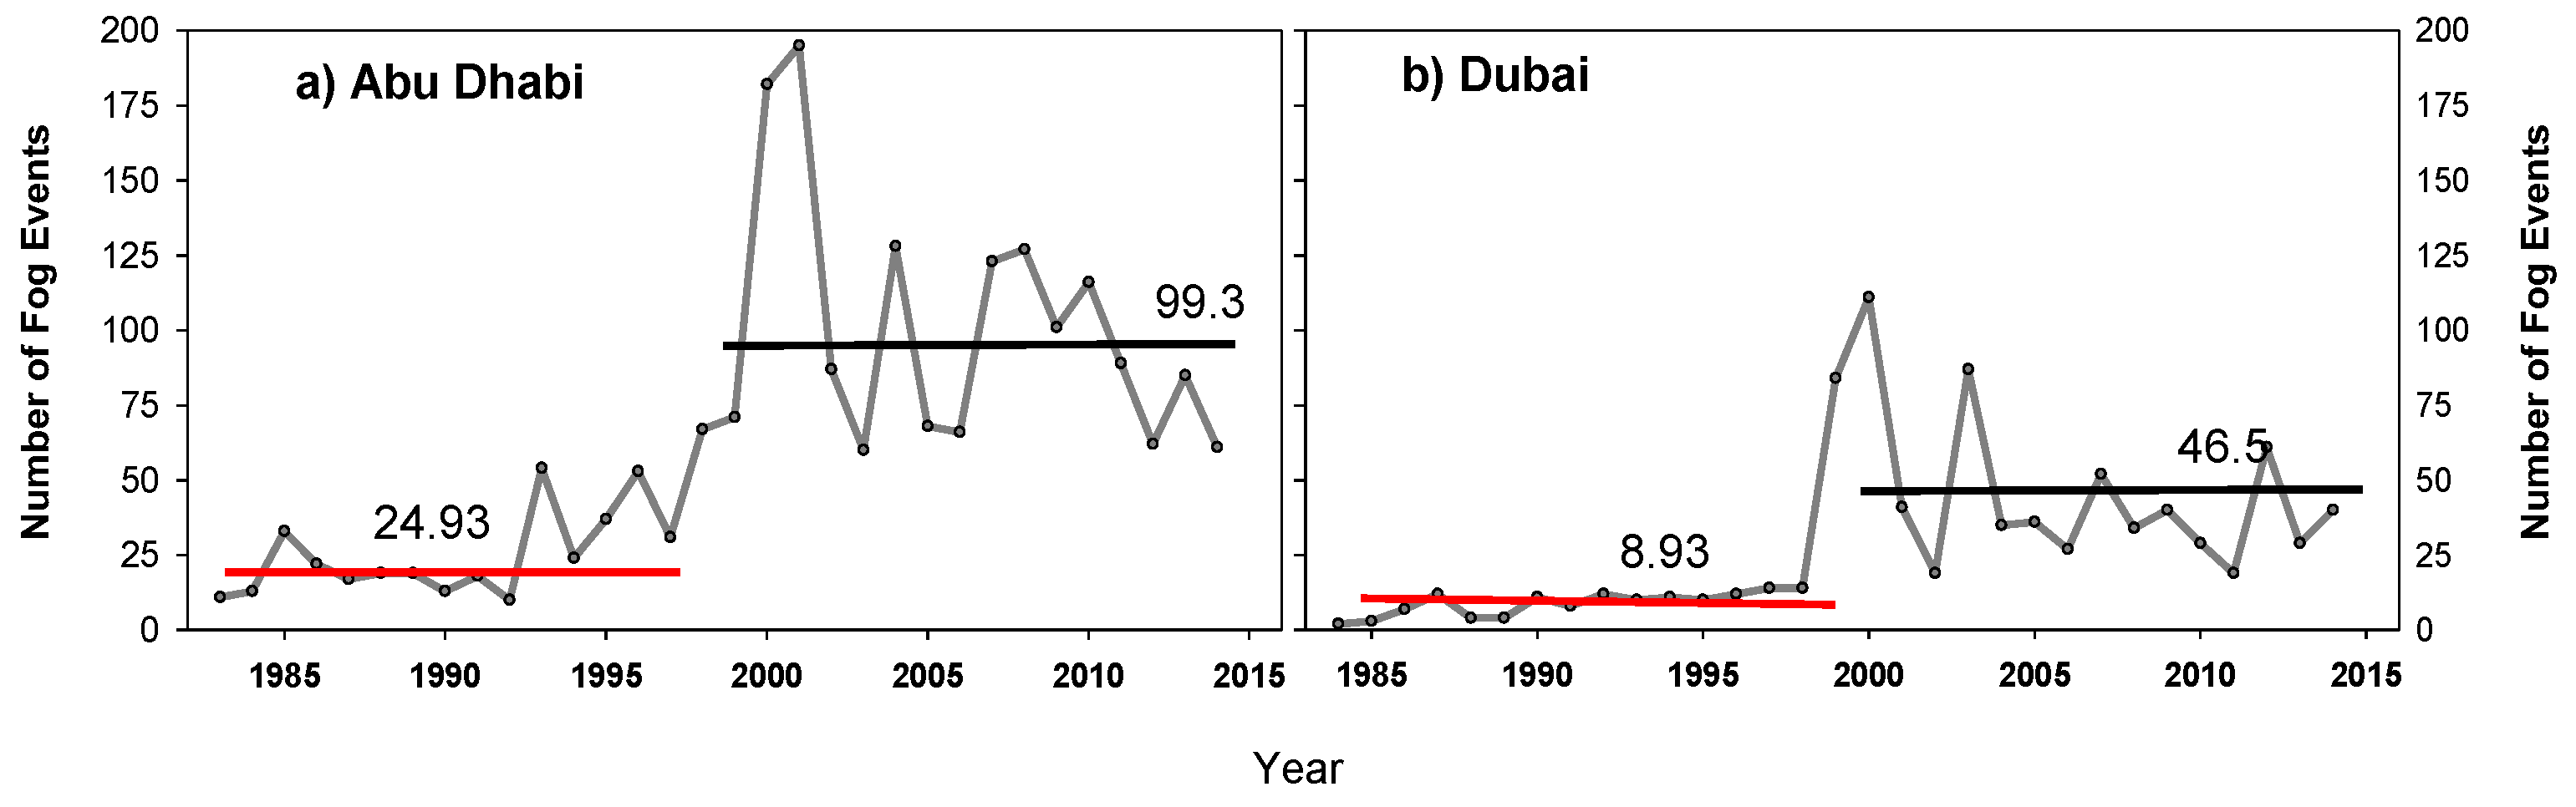
Figure 12.
A homogeneity analysis for number of dust events in (a) Abu Dhabi and (b) Dubai cities.

Figure 13.
Relationship between climate Indices and fog frequency occurrence in Abu Dhabi City, (a) Pacific Decadal Oscillation Index; (b) Southern Oscillation Index; (c) East Atlantic Oscillation Index; and (d) Atlantic Multi-Decadal Oscillation Index.
Figure 13.
Relationship between climate Indices and fog frequency occurrence in Abu Dhabi City, (a) Pacific Decadal Oscillation Index; (b) Southern Oscillation Index; (c) East Atlantic Oscillation Index; and (d) Atlantic Multi-Decadal Oscillation Index.

Figure 14.
Relationship between climate Indices and dust frequency occurrence in Abu Dhabi City, (a) Pacific decadal oscillation index; (b) Southern oscillation index; (c) East Atlantic oscillation index; and (d) Atlantic multi-decadal oscillation index.
Figure 14.
Relationship between climate Indices and dust frequency occurrence in Abu Dhabi City, (a) Pacific decadal oscillation index; (b) Southern oscillation index; (c) East Atlantic oscillation index; and (d) Atlantic multi-decadal oscillation index.
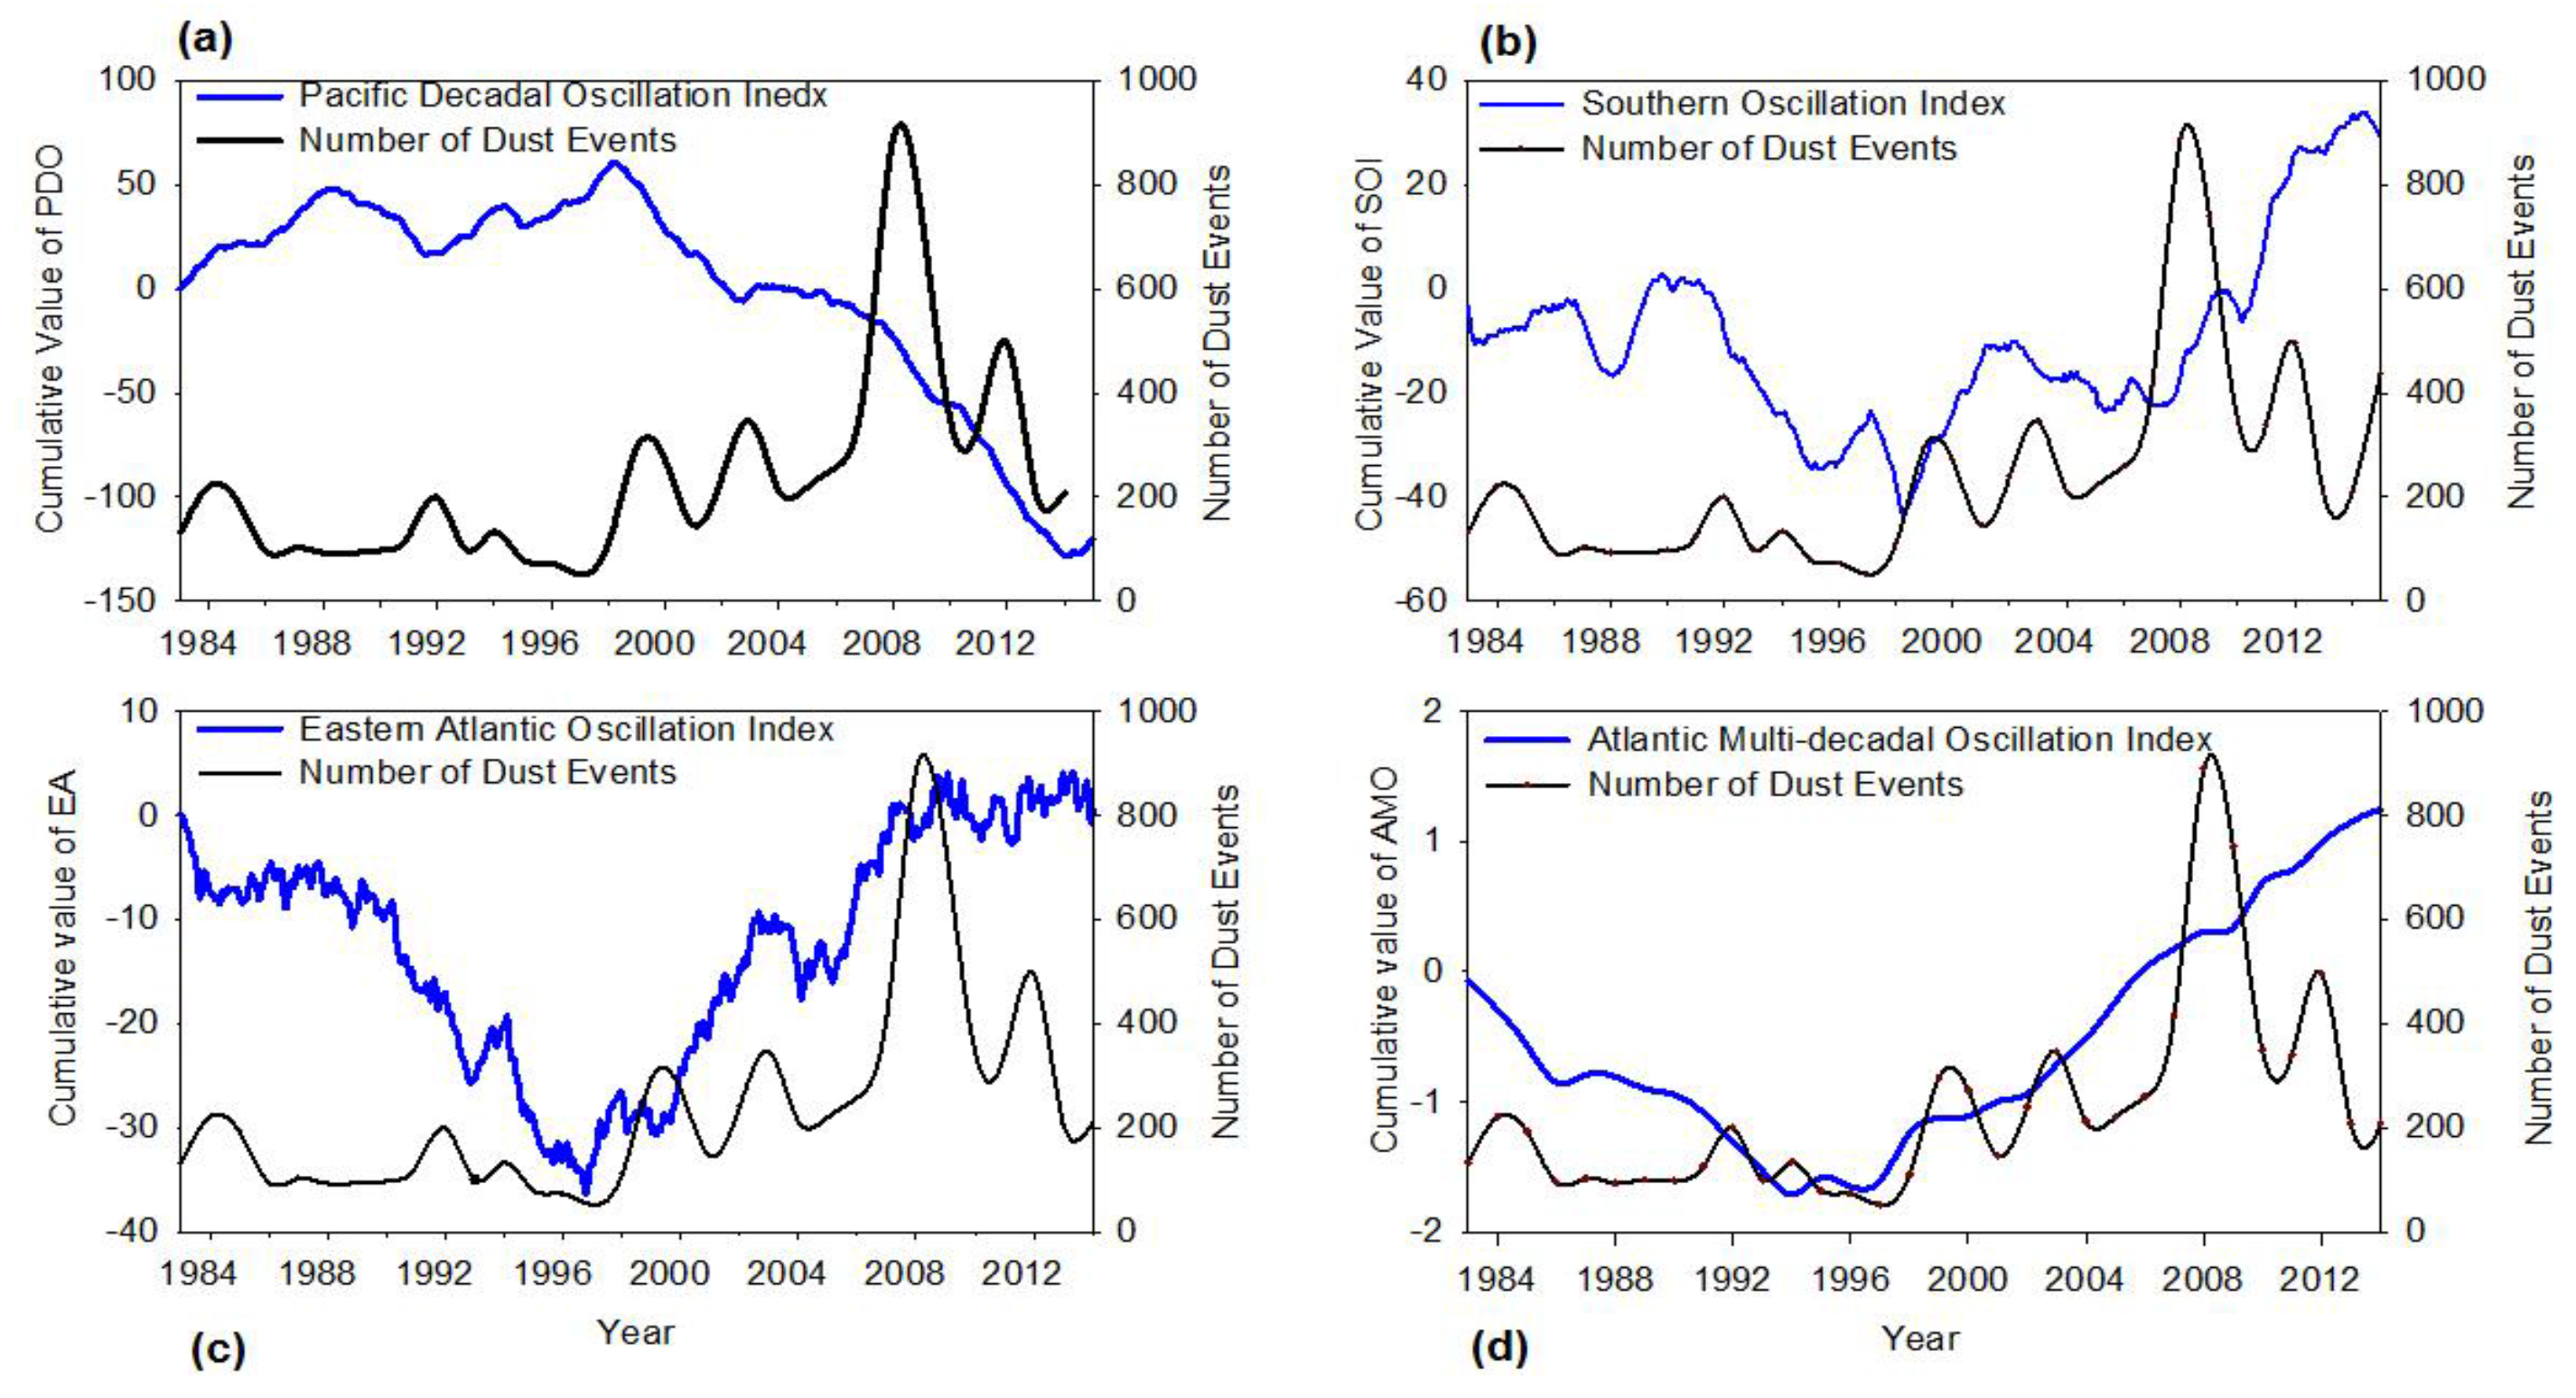
Figure 15.
The seasonal mean surface atmospheric pressure anomalies obtained from NCEP Reanalysis-2 for (a) La Nina years 1998/1999, 2000/2001, 2010/2011; and (b) El Nino years 1991/1992, 2002/2003, 2015/2016.
Figure 15.
The seasonal mean surface atmospheric pressure anomalies obtained from NCEP Reanalysis-2 for (a) La Nina years 1998/1999, 2000/2001, 2010/2011; and (b) El Nino years 1991/1992, 2002/2003, 2015/2016.


Table 1.
Stations used in this study along with the length of the observation records, coordinates, elevation as well as average visibility record for each station and its standard deviation.
Table 1.
Stations used in this study along with the length of the observation records, coordinates, elevation as well as average visibility record for each station and its standard deviation.
| Station Name | Length of Records | Annual Average Visibility (m) | Standard Deviation (m) | Latitude (N) | Longitude (E) | Elevation (m) |
|---|---|---|---|---|---|---|
| Abu Dhabi IA | 09/1982–03/2016 | 9399 | 3156 | 24.433 | 54.651 | 26.8 |
| AL Maktoum IA | 05/2010–03/2016 | 8355 | 2508 | 24.886 | 55.172 | 18.9 |
| Al Ain IA | 03/1994–03/2016 | 8926 | 2717 | 24.262 | 55.609 | 264.9 |
| AlBateen A. | 01/1983–03/2016 | 9797 | 2594 | 24.428 | 54.458 | 4.9 |
| Al Dhafra A. | 04/1986–03/2015 | 9725 | 2374 | 24.25 | 54.55 | 23 |
| Ash Shariqa IA. | 01/1949–12/1982 | 15,327 | 10,829 | 25.35 | 55.383 | 5 |
| Dubai IA. | 01/1983–03/2016 | 9659 | 3039 | 25.255 | 55.364 | 10.4 |
| Fujairah IA. | 11/1988–03/2016 | 8723 | 2607 | 25.112 | 56.324 | 46.3 |
| Ras AlKhaimah IA. | 01/1983–03/2016 | 9389 | 1806 | 25.613 | 55.939 | 31.1 |
| Sharjah IA. | 03/1944–03/2016 | 10,589 | 5722 | 25.8 | 55.933 | 27 |
Table 2.
Long-term visibility observations averages and average number of hourly events under wet and dry conditions for four classes for ten stations. Bold numbers represent the highest value per category.
Table 2.
Long-term visibility observations averages and average number of hourly events under wet and dry conditions for four classes for ten stations. Bold numbers represent the highest value per category.
| Station Name | Weather Conditions | Visibility Class 1 5.0–2.5 km | Visibility Class 2 2.5–1 km | Visibility Class 3 1–0.1 km | Visibility Class 4 <0.1 km | ||||
|---|---|---|---|---|---|---|---|---|---|
| Average Visibility | Annual Average number of Hourly Events | Average Visibility | Annual Average number of Hourly Events | Average Visibility | Annual Average number of Hourly Events | Average Visibility | Annual Average number of Hourly Events | ||
| Abu Dhabi IA. | Dry | 4.08 | 173 | 1.77 | 49 | 0.55 | 5 | 0.05 | 1 |
| Wet | 4.07 | 221 | 1.69 | 75 | 0.74 | 51 | 0.08 | 38 | |
| AL Maktoum IA. | Dry | 4.30 | 363 | 1.95 | 87 | 0.74 | 29 | 0.10 | 3 |
| Wet | 4.27 | 271 | 1.93 | 52 | 0.48 | 74 | 0.95 | 21 | |
| Al Ain IA. | Dry | 4.34 | 332 | 2.10 | 44 | 0.76 | 3 | 0.02 | 2 |
| Wet | 4.30 | 233 | 2.00 | 50 | 0.52 | 24 | 0.09 | 12 | |
| AlBateen A. | Dry | 4.22 | 114 | 2.05 | 27 | 0.92 | 7 | 0.07 | 1 |
| Wet | 4.35 | 98 | 2.01 | 20 | 0.50 | 12 | 0.09 | 6 | |
| Al Dhafra A. | Dry | 4.20 | 83 | 1.85 | 17 | 0.79 | 5 | 0.06 | 2 |
| Wet | 4.40 | 148 | 1.95 | 23 | 0.48 | 17 | 0.07 | 12 | |
| Ash Shariqa IA. | Dry | 4.10 | 23 | 1.90 | 9 | 0.72 | 3 | 0.05 | 1 |
| Wet | 4.12 | 58 | 1.84 | 21 | 0.57 | 15 | 0.07 | 9 | |
| Dubai IA. | Dry | 4.20 | 146 | 1.96 | 41 | 0.79 | 6 | 0 | 2 |
| Wet | 4.20 | 207 | 1.99 | 24 | 0.56 | 30 | 0.09 | 13 | |
| Fujairah IA. | Dry | 4.30 | 123 | 2.06 | 29 | 0.83 | 5 | 0.08 | 3 |
| Wet | 4.56 | 487 | 2.14 | 11 | 0.63 | 4 | 0.04 | 2 | |
| Ras AlKhaimah AI | Dry | 4.23 | 106 | 1.89 | 27 | 0.79 | 6 | 0.08 | 1 |
| Wet | 4.34 | 171 | 1.85 | 45 | 0.61 | 23 | 0.09 | 9 | |
| Sharjah IA | Dry | 4.12 | 58 | 1.91 | 18 | 0.79 | 2 | 0.04 | 1 |
| Wet | 4.18 | 113 | 1.89 | 35 | 0.54 | 27 | 0.08 | 10 | |
© 2017 by the authors. Licensee MDPI, Basel, Switzerland. This article is an open access article distributed under the terms and conditions of the Creative Commons Attribution (CC BY) license (http://creativecommons.org/licenses/by/4.0/).
Share and Cite
MDPI and ACS Style
Aldababseh, A.; Temimi, M. Analysis of the Long-Term Variability of Poor Visibility Events in the UAE and the Link with Climate Dynamics. Atmosphere 2017, 8, 242. https://doi.org/10.3390/atmos8120242
AMA Style
Aldababseh A, Temimi M. Analysis of the Long-Term Variability of Poor Visibility Events in the UAE and the Link with Climate Dynamics. Atmosphere. 2017; 8(12):242. https://doi.org/10.3390/atmos8120242
Chicago/Turabian StyleAldababseh, Amal, and Marouane Temimi. 2017. "Analysis of the Long-Term Variability of Poor Visibility Events in the UAE and the Link with Climate Dynamics" Atmosphere 8, no. 12: 242. https://doi.org/10.3390/atmos8120242
Note that from the first issue of 2016, this journal uses article numbers instead of page numbers. See further details here.