The Exceptionally Cold January of 2017 over the Balkan Peninsula: A Climatological and Synoptic Analysis


Department of Meteorology and Climatology, School of Geology, Faculty of Sciences, Aristotle University of Thessaloniki, 54124 Thessaloniki, Greece
*
Author to whom correspondence should be addressed.
Atmosphere 2017, 8(12), 252; https://doi.org/10.3390/atmos8120252
Submission received: 30 October 2017
/
Revised: 8 December 2017
/
Accepted: 12 December 2017
/
Published: 15 December 2017
(This article belongs to the Special Issue Temperature Extremes and Heat/Cold Waves)
Abstract
:An exceptionally cold episode occurred in January 2017 over the Balkan Peninsula. Analysis of historical records showed that it was one of the coldest extreme episodes. Even though the low temperatures of January 2017 did not break previous low records for all stations, the long duration was quite extreme, resulting in strong socioeconomic impacts in the region of interest. The 10-year to 100-year return values of minimum temperatures were calculated based on block maxima method and the maximum likelihood estimates. The estimated return periods of the absolute minimum temperature are approximately 15 or 20 years for almost all stations. For only one station, the absolute minimum temperature of January 2017 might happen once in every 300 years according to the return level results. Moreover, the extreme cold episode over the Balkans during the period of 5 January 2017 to 12 January 2017 was associated with a significant outbreak of arctic air masses into eastern–central Europe and the Balkans and a cutoff low at the level of 500 hPa over the region.
1. Introduction
Southeastern European, and especially Balkan winters, are characterized by strong temperature variability. Generally, westerly winds transport mild, moist Mediterranean air towards the Balkan Peninsula, but occasionally the large-scale atmospheric circulation changes, resulting in colder conditions with northern flow from Scandinavia (December 1953, January 2012) [1,2] or northeasterly flow from Siberia (Winter 1956, 1963) [3]. These quasi-stationary larger scale circulation patterns are often referred to as “weather regimes” and can persist a few days or even a few weeks [4,5]. Generally, these anomalous cold winter temperatures are associated with atmospheric blocking over the Atlantic or Europe [6,7,8]. In addition, extremely low winter temperatures in mid-latitudes are associated with cold air outbreaks (a displacement of polar or arctic air) over the northern [9] or southern hemisphere [10,11,12]. This association of northerly air outbreaks of polar air was also frequent during significantly cold periods in the past (even during the Last Glacial Maximum) [13,14] Moreover, Hurrell [15] associated the occurrence of low temperatures with the NAO (North Atlantic Oscillation) index and Brown et al. [16] documented that the negative NAO phase significantly reduces extreme winter daily temperatures (approximately by 2 °C) over Eurasia. Especially for southern Europe, the index’s influence to temperature variability is more complex, since the temperature conditions are related not only to the NAO phase but also to the exact geographical position of its poles [17]. In the case of the cold winter of 2010 over Europe, Cattiaux et al. [18] showed that the anomalous low temperatures were strongly related with the negative phase of the NAO, while Unkasevic and Tosic [19] indicated that even for the Balkans (Belgrade) the NAO index is highly linked with the winter minimum temperatures.
January 2017 was one of the coldest on record in the Balkan Peninsula (https://data.giss.nasa.gov/gistemp/maps/) due to extremely low temperatures and the long duration of the cold spell over the largest part of the central and southern Balkans. Eastern continental Greece received intense sea-effect snowfall from the Aegean Sea. Athens and Santorini, as well as many islands and mainland coasts, received high amounts of snow, with snow cover depth ranging between 75 cm and 1 m. Over the central Balkans a blizzard occurred, and locally the snowfall reached 60 cm. Very cold air masses were established over the Balkans for many days, with temperatures below zero. A strong severe Bora wind was observed at the western coasts of the Balkan Peninsula across the Croatian coasts.
Many homeless people died from the cold in Poland and the Czech Republic. The Danube River and Bosporus straits were closed to shipping. Migrants in Greece suffered due to very low temperatures and moved to heated tents, commercial buildings, and ships. The Greek islands Eubea, Skopelos, and Alonissos declared a state of emergency. Public transport collapsed due to severe snowfall and flights and shipping services were suspended for many hours. Schools in Greece were closed for a week as a result of the plumbing and heating problems caused by the very low temperatures.
The aim of this study is to examine this unusually cold episode of January 2017 over the Balkan Peninsula. The intensity and duration of the physical conditions of this cold episode will be compared with a reference period for a climatological–statistical analysis of the event. Moreover, the synoptic conditions associated with this event will be investigated and the return period of the extreme temperature will be estimated using the Generalized Extreme Value (GEV) distribution.
2. Data and Methodology
2.1. Data
In order to analyze this extreme temperature cold event, daily minimum temperature (Tmin) datasets recorded at eight meteorological stations (Table 1) across the Balkans over January 2017 were used. A long reference period of 56 years (1958–2012) was selected for the climatological analysis. Data were freely downloaded from the European Climate Assessment and Database project database [20] and the National Observatory of Athens [21].
Synoptic analysis is based on maps for the 500 hPa level and Sea Level Pressure (SLP), while the composite maps were derived using the composites tool from the Earth System Research Laboratory of NOAA (Real-time Environmental Applications and Display sYstem (READY). Available online: https://www.ready. noaa.gov/index.php.)
2.2. Methodology
The GEV distribution is used to model block temperature minima. It can be described by the location parameter (μ) representing the overall position of the distribution, the scale parameter (σ) that characterizes the spread of the distribution, and the shape parameter (ξ) that determines the type of extreme value distribution.
The case of ξ = 0 in GEV distribution defines the Gumbel distribution, which is a limiting distribution of extremes including the normal and exponential distributions. The Fréchet distribution (σ > 0) has a bounded upper tail, while the Weibull distribution (ξ < 0) is heavy-tailed, and is bounded above [22].
The most commonly used methods to estimate the distribution parameters are maximum likelihood estimators and L-moments [23]. Based on our previous work [22], which shows that L-moments is the less appropriate method for temperature parameters, we employed the maximum likelihood d method. Extreme temperatures were expressed in terms of return levels. The return value was associated with different T return periods (5-year to 100-year) by inverting the fitted GEV distribution [22]:
where z is the threshold that is expected to be exceeded on average once every T years.
3. Results
3.1. Climatology
January 2017 was colder than normal across Central, Northeastern and Eastern Europe, including Italy and the whole Balkan Peninsula, while it was warmer than normal in Ireland, Great Britain, and North Scandinavia. Temperatures over the Iberian Peninsula were normal.
In order to gain a more thorough insight from a statistical point of view of how exceptional this winter was, several climatological–statistical parameters were computed, such as: the Mean Tmin (MTN, °C), Absolute daily Tmin (ATN, °C), the 95th percentile of the Tmin (95TN, °C), the mean annual number of frost days (MFD, days) and the 95th percentile of the frost days (95FD) for the available time series for stations over the Balkan area. The results found for January 2017 were compared with the climatic parameters of the reference period 1958–2012 (Table 2).
It was found that the Greek stations show MTN higher than zero, while the other four stations show negative temperature for the reference period. The mean monthly Tmin of January 2017 was lower than MTN for all stations; the differences range between −2.0 °C (Larissa) and −4.7 °C (Bucharest and Mytilini) and 75% of the stations presented differences lower than −3.0 °C. On the other hand, ATN of January 2017, for all stations except Mytilini, was higher than the reference ones. For the station of Mytilini it was the first time that such negative ATN values were recorded. The 95TN, a commonly used index for extreme temperatures, had a similar pattern, with the MTN with three of the eight stations presenting differences lower than −4.0 °C.
The duration of the frost days (days with Tmin < 0) in January 2017 was exceptionally long. During the reference period, there were 12 and 13 mean frost days for Alexandroupoli and Larissa, respectively, with seven for Thessaloniki and only one for Mytilini. For the other four stations, frost days were more frequent. The MFD is equal to 19 days for Zagreb and Belgade, 22 days for Nis, and 27 for Bucharest. For January 2017, the MFD number presents an increase of about 6–7% for all stations (Table 2). This rise ranges from one day in Larissa to 10 days in Belgrade. For half of the stations, 29 to 31 days in January presented Tmin <0 °C. In the case of Mytilini, an island meteorological station in the Aegean Sea, 10 frost days were recorded in January 2017. The 95th percentile of the frost days is presented in Table 2, too. Most of the stations present 95FD higher than 24 days; only two Greek stations present lower values. During January 2017, the 95th percentile of frost days for many stations was very close to climatological 95FD; the FD of Mytilini was six days higher than the climatological 95FD, while for Larissa it was 10 days lower than the corresponding threshold.
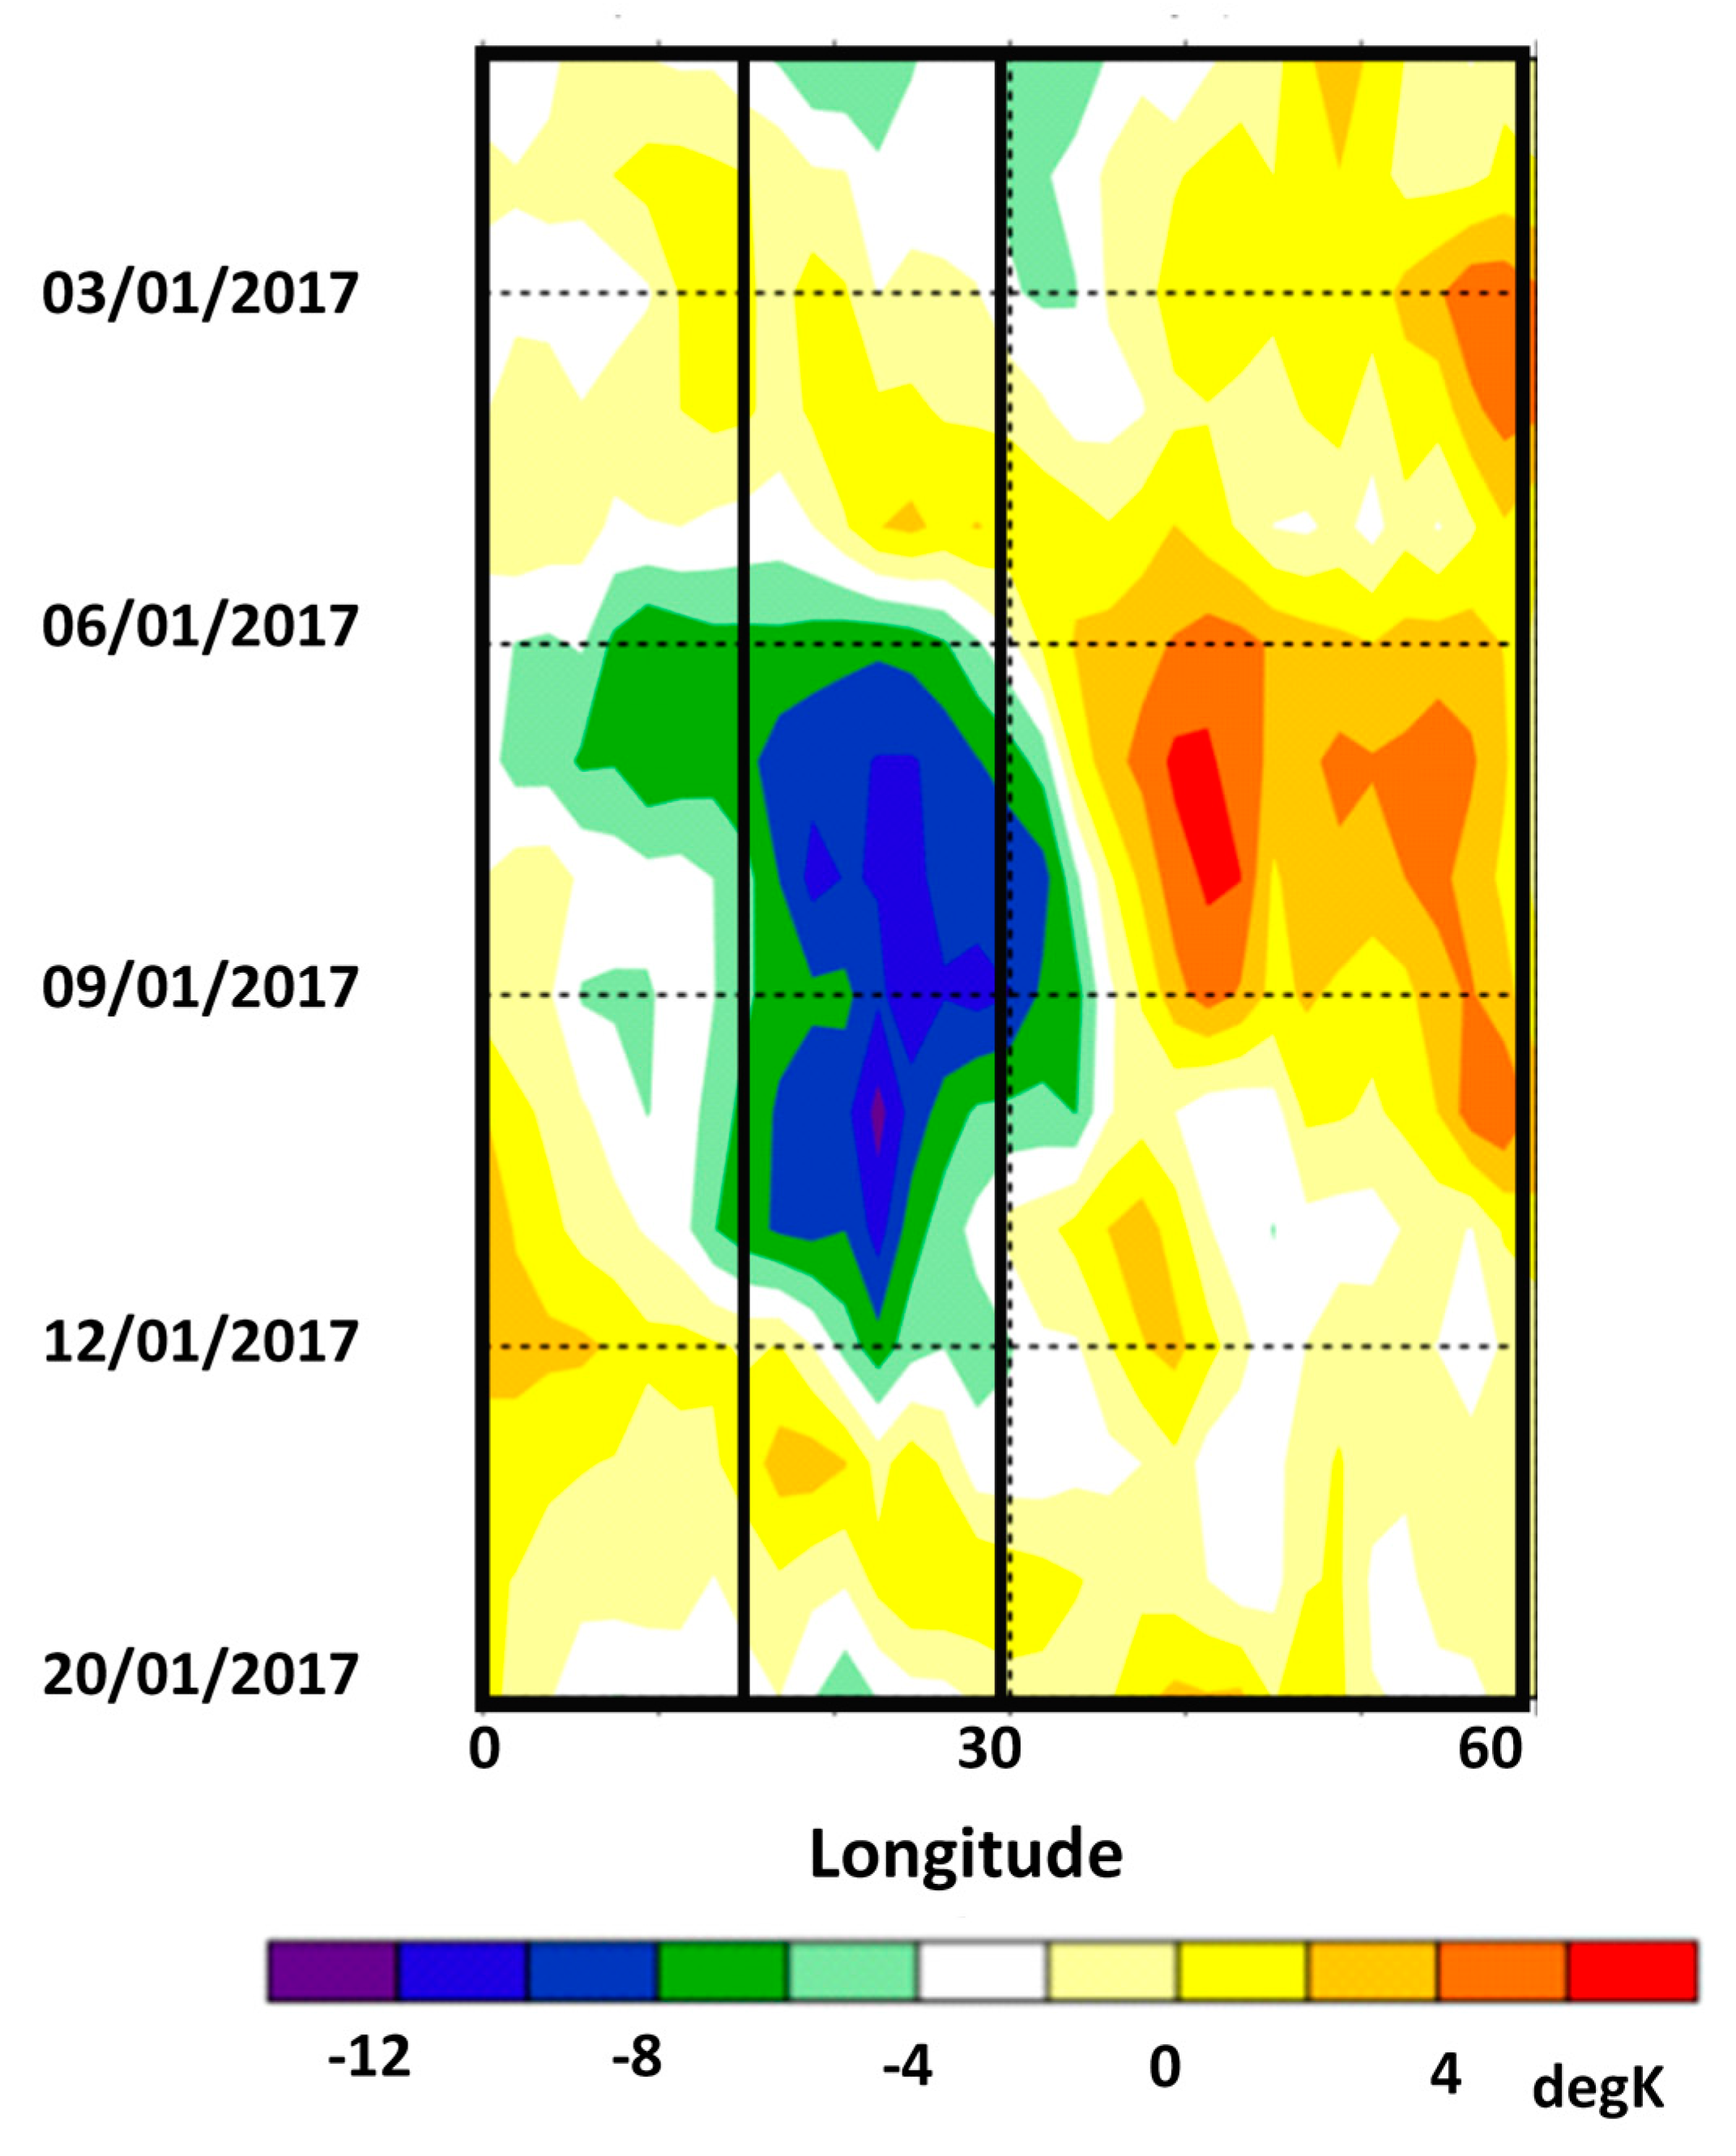
From Figure 1 it is obvious that the coldest time period of January 2017 is the eight-day period of 5–12 January in the Balkan Peninsula. The absolute minimum temperatures occurred on 8 January 2017 for 50% of the selected stations (Figure 2). At Mytilini station, it occurred one day earlier, on 7 January, while at Bucharest it was two days later (10 January).
3.2. Extreme Analysis
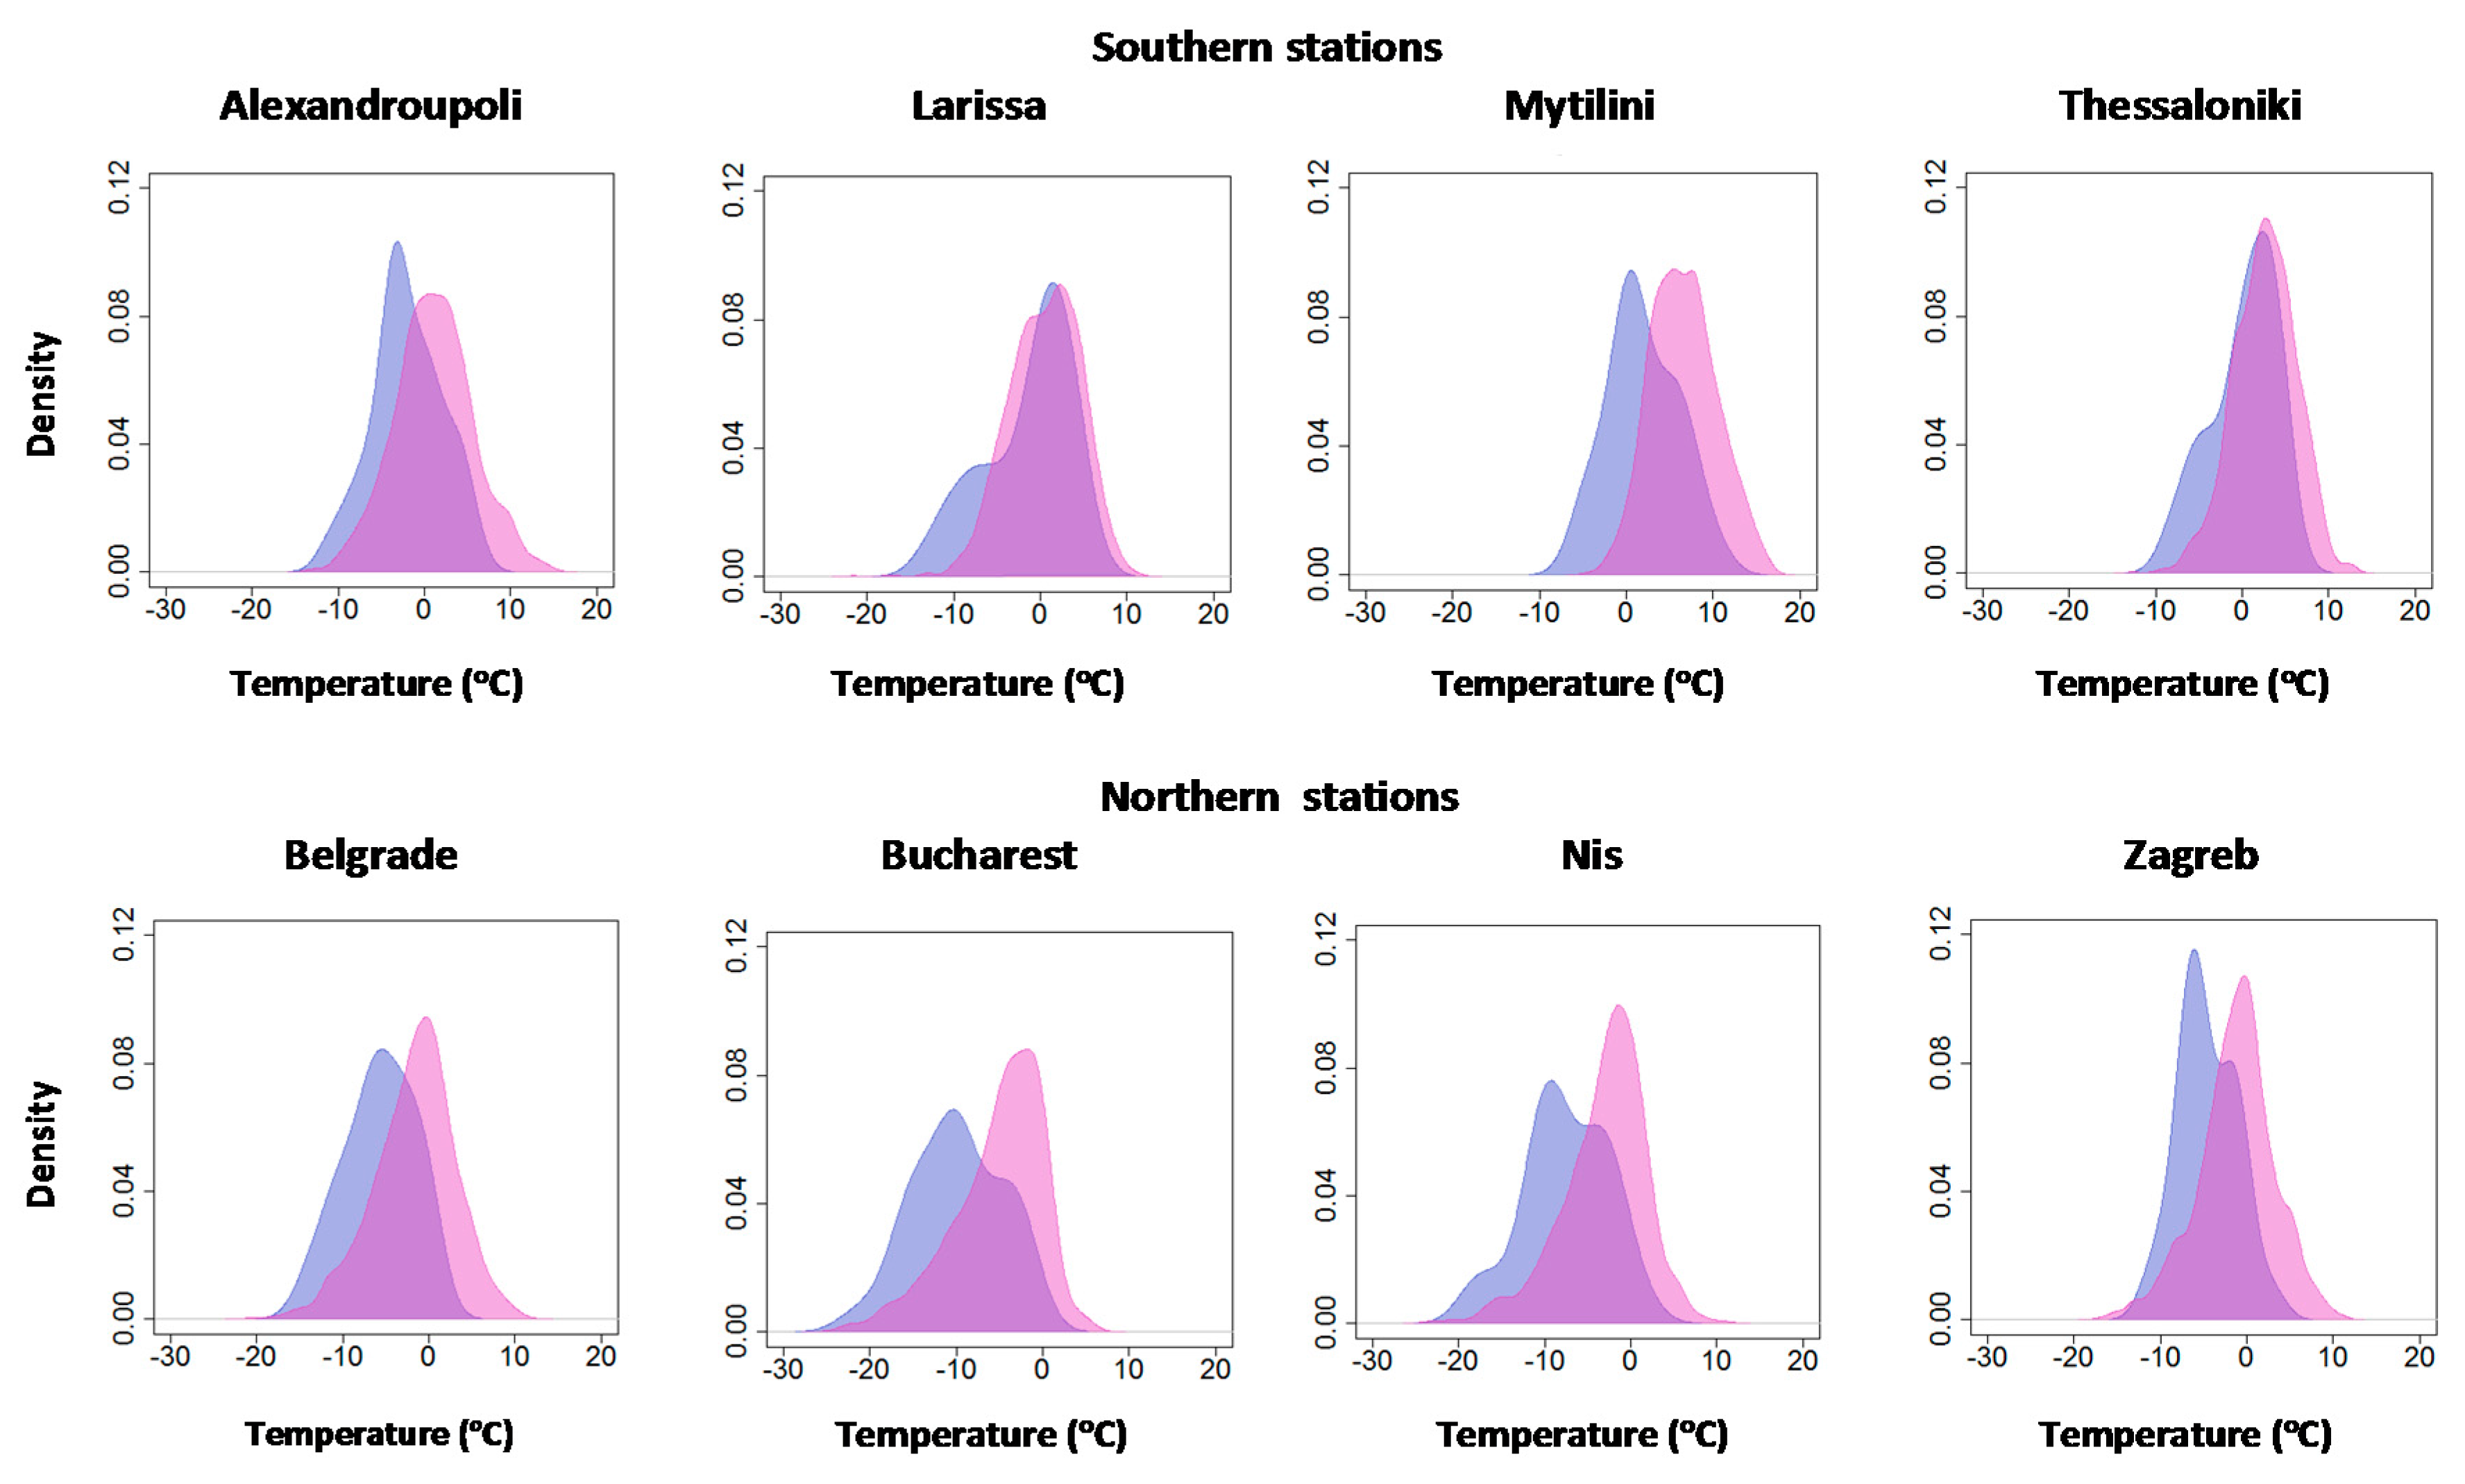
January 2017 provide an example of the extreme events that the Balkans is expected to face more frequently. In Figure 3, the vertical axis is the frequency of occurrence of January minimum temperatures in degrees Celsius (horizontal axis). Minimum temperature in the reference period 1951–2012 closely matches the normal distribution (“bell curve”—purple area), with mean values close to zero, except for Mytilini station, where the mean values are positive. The corresponding distribution of January 2017 minimum temperatures (light blue area) for all stations has shifted to the left, probably as a consequence of climate change. According to Figure 3, extremely cold outliers did not occur during January 2017, since lower absolute Tmin values have been reported during the reference period in most of the stations except Mytilini. However, the frost days (days with Tmin <0 °C) in January 2017 presented a higher frequency, resulting in long cold spells.
For each station, GEV parameter estimations were obtained by maximum likelihood analysis (Table 3) on the block minima of the minimum January temperatures. The maximized value (nllh) and the standards errors of the log-likelihood were also estimated for all stations. The location parameter μ is mainly governed by the elevation, the latitude, and the stations’ distance from the sea. The scale parameter σ, which indicates the interannual variability of extreme January minimum temperatures, is highly affected by the meridional flow of the air masses: σ is higher over the northern part of Balkan Peninsula and decreases towards the equator (Table 3). In the case of minimum temperature, the shape parameter should be negative [24,25,26], resulting in the Weibull distribution being fitted to TM. It is a short-tailed distribution with finite upper bounds. The negative values of ξ for all stations reflect the presence of a few abnormally low extreme temperature events that dominate in the tail of the distribution. However, due to the fact that it is upper-bounded, there are specific temperature thresholds that the minimum temperature cannot exceed.
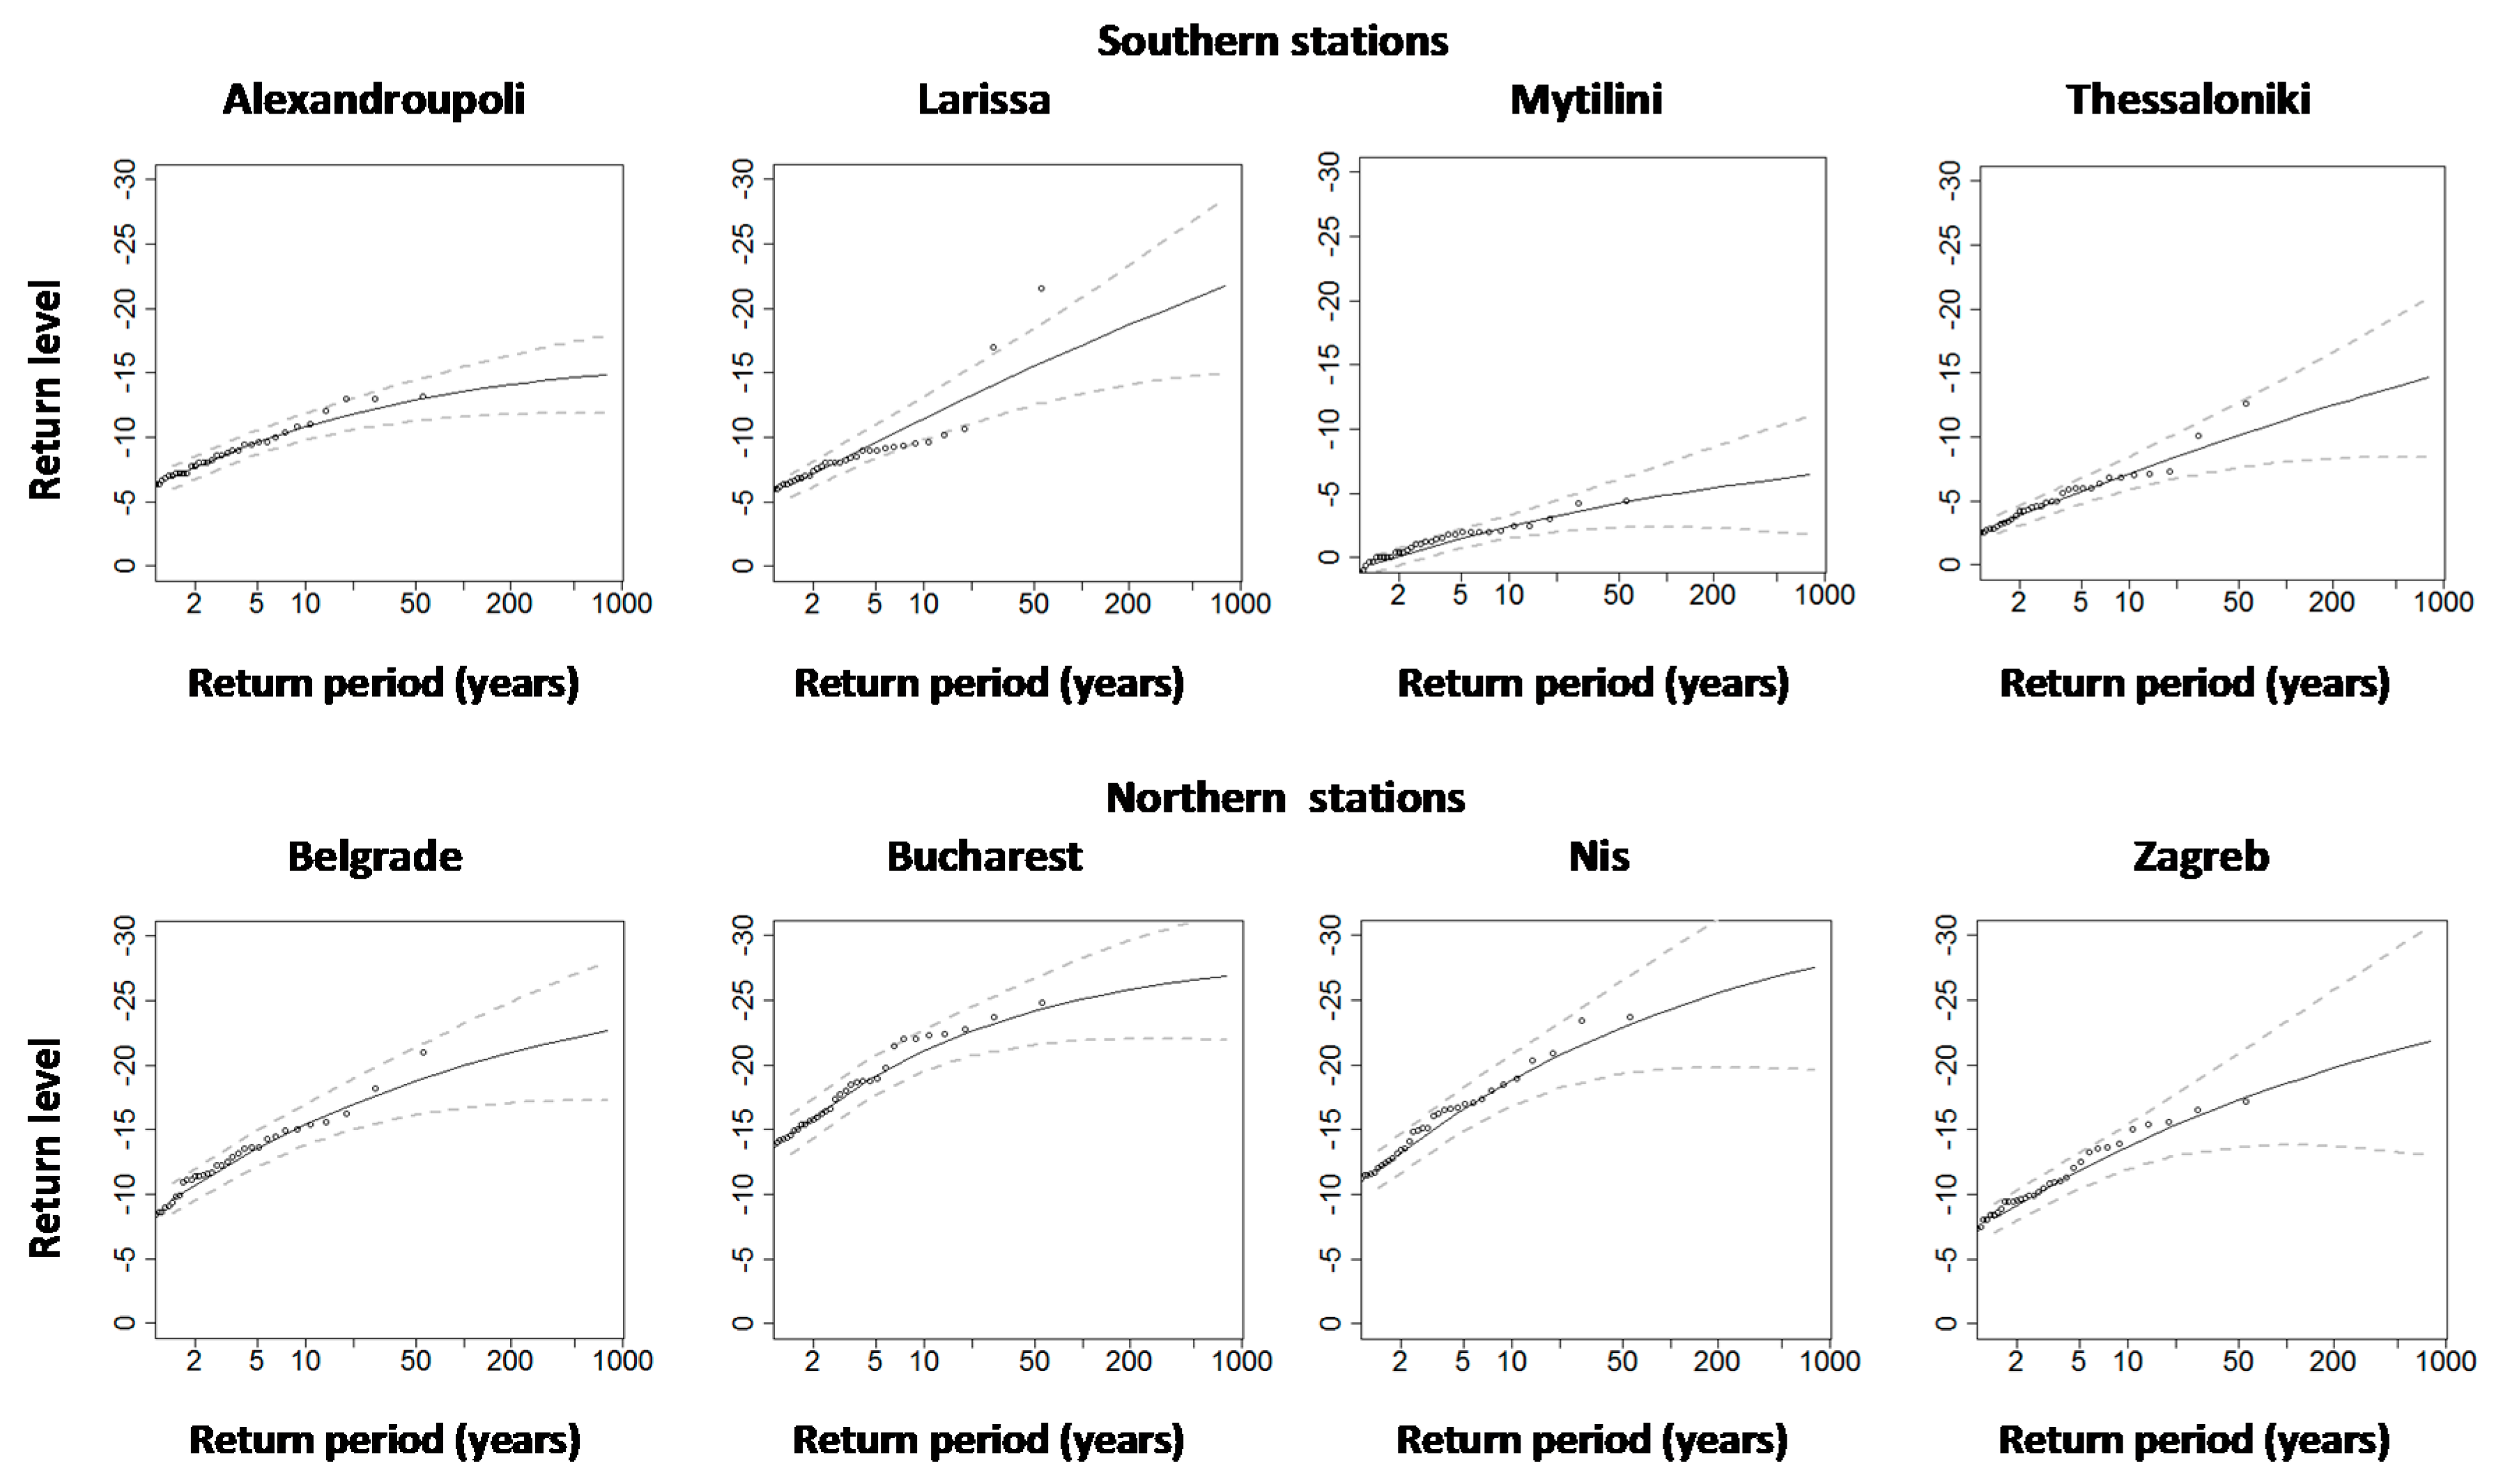
The return levels for block minima temperature are shown in Figure 4, along with the 95% confidence intervals. The estimated parameters of GEV distribution using the maximum likelihood method were used to calculate 10-, 15-, 20-, 25-, 50-, 70-, and 100-year return temperature values (Table 4). Return levels gradually decrease with larger return periods, while the confidence level becomes wider as the return periods increase (Figure 4). More specifically, the estimated return level for the 100-year and 10-year return periods are −11.3 °C and −7.1 °C, respectively, for Thessaloniki and Zagreb they are −18.6 °C and −13.6 °C, respectively. The highest values of return levels presented in Mytilini station (−4.9 °C for 100-year return period), while the lowest values were estimated for Bucharest (−25.1 °C for 100-year return period).
The maximum likelihood return level curves (Figure 4) are in accordance with the range of the observed data or included in 95% confidence intervals for all stations except Larissa. Using the maximum likelihood estimates, we predicted the values of the return period associated with the January 2017 absolute minimum temperature for all stations. For all the northern stations, as well as Alexandroupoli, the estimated return period for the absolute minimum temperature was smaller than 15 year (Zagreb: 5 year; Belgrade: 10 year; Alexandroupoli: 12 year; Nis: 12 year; Bucharest: 15 year). For the two Greek stations, Thessaloniki and Larissa, the estimated return periods are close to 20 year, while the absolute minimum temperature of Mytilini can be considered extreme as it happens once every 300 years.
3.3. The Cold Spell of January 2017: A Synoptic Analysis
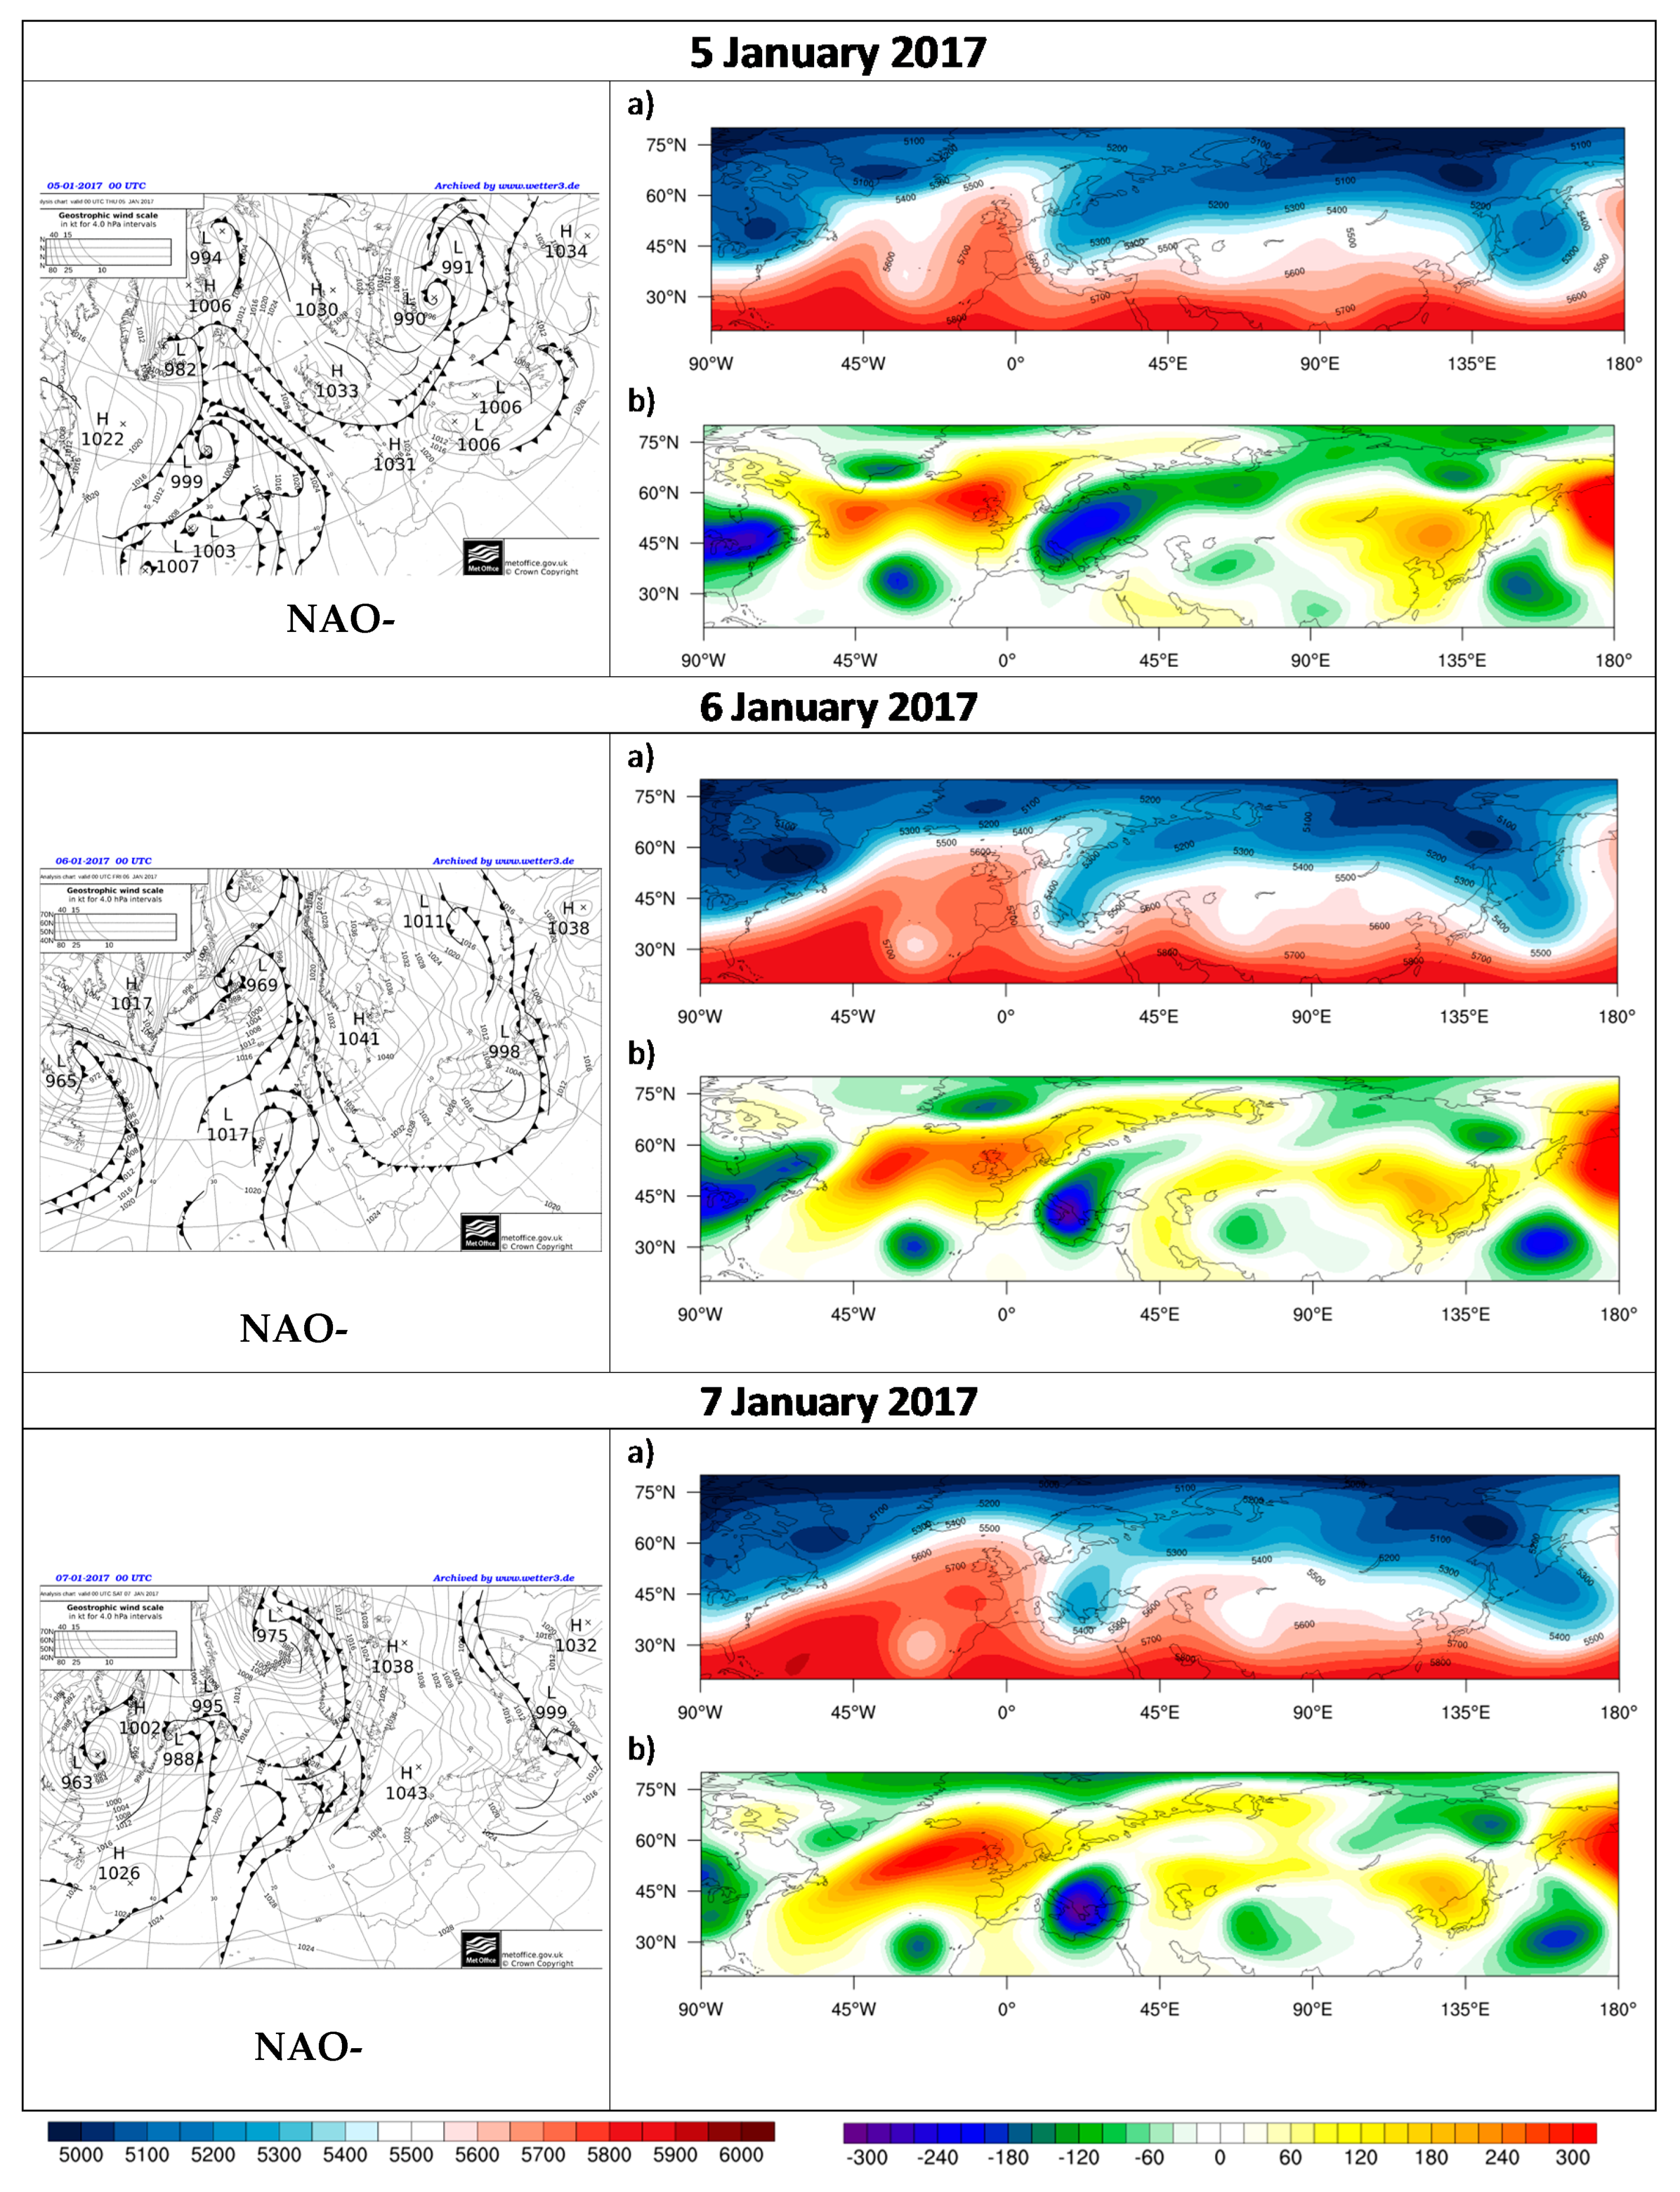
In order to understand the day-to-day driving synoptic processes associated with this event, 5–12 January 2017 was divided into three distinct stages. The P-1 stage is defined as the three-day period (5–7 January) that preceded the development of a pressure trough over the domain of study. The P-0 stage is (8–10 January) and is characterized by the formation of a cutoff low over the Balkans. The P+1 stage is a two-day period (11 and 12 January) characterized by the weakening of the cutoff low (Figure 5, Figure 6 and Figure 7). The Azores High was weaker than normal at the beginning of the month and influenced the weather over Western Europe. A strong high dominated over the North Atlantic, close to Ireland, clearly reflected in the negative NAO phase (Available online: ftp://ftp.cpc.ncep.noaa.gov/cwlinks/norm.daily.nao.index.b500101.current.ascii).
The gradual shift of the anticyclone to the eastern rate in the transport of cold air masses from Scandinavia to the northeast Europe and the Balkans. At the same time, a low-pressure system accompanied by the appearance of cold fronts moved from the NNW to the SSE along the east anticyclone side. It resulted in a significant outbreak of arctic air masses into east–central Europe and the Balkan Peninsula that lasted until 5 January. Such a pressure system plunged deep into the Balkans and formed a cutoff low at the level of 500 hPa. Moreover, a secondary low-pressure system developed over central–southern Italy and the southern Balkan Peninsula, causing severe storms in the Aegean Sea and snowfall and frost in the Southern Balkans, the Adriatic Sea, and on the eastern coast of Italy. More specifically, during the P-1 stage, the flow at 500 hPa was meridional over central Europe, with a ridge over the Iberian Peninsula that reached the British Isles, while a weak pressure trough was apparent over central and eastern Europe (Figure 5). The jet stream changed and a high-amplitude trough extended from Scandinavia to the Adriatic Sea. Most of the air masses moving in the jet stream flow originated over the North Atlantic. Zonal winds are weaker and meridional wavy jet stream occurred over the Balkan Peninsula, resulting in an extreme cold outbreak and cyclogenesis over the Mediterranean, in the Gulf of Genoa, and in the North Adriatic Sea.
In the P-0 stage (Figure 6), the cold bottom end of the trough is detached from the main circulation, forming a cutoff low (negative anomaly pole at 500 hPa level) over the Balkans that subsided cold air in the region. At the surface, behind cold fronts (5–7 January), anticyclonic centers moved into the eastern part of Europe, intensifying over the Balkan Peninsula. Arctic air from higher latitudes was forced to flow equatorward to the Balkans; the air masses were cold enough to cause precipitation to fall as snow instead of rain. The negative phase of the NAO weakened and was followed by the positive phase of EMP teleconnection pattern (Figure 6).
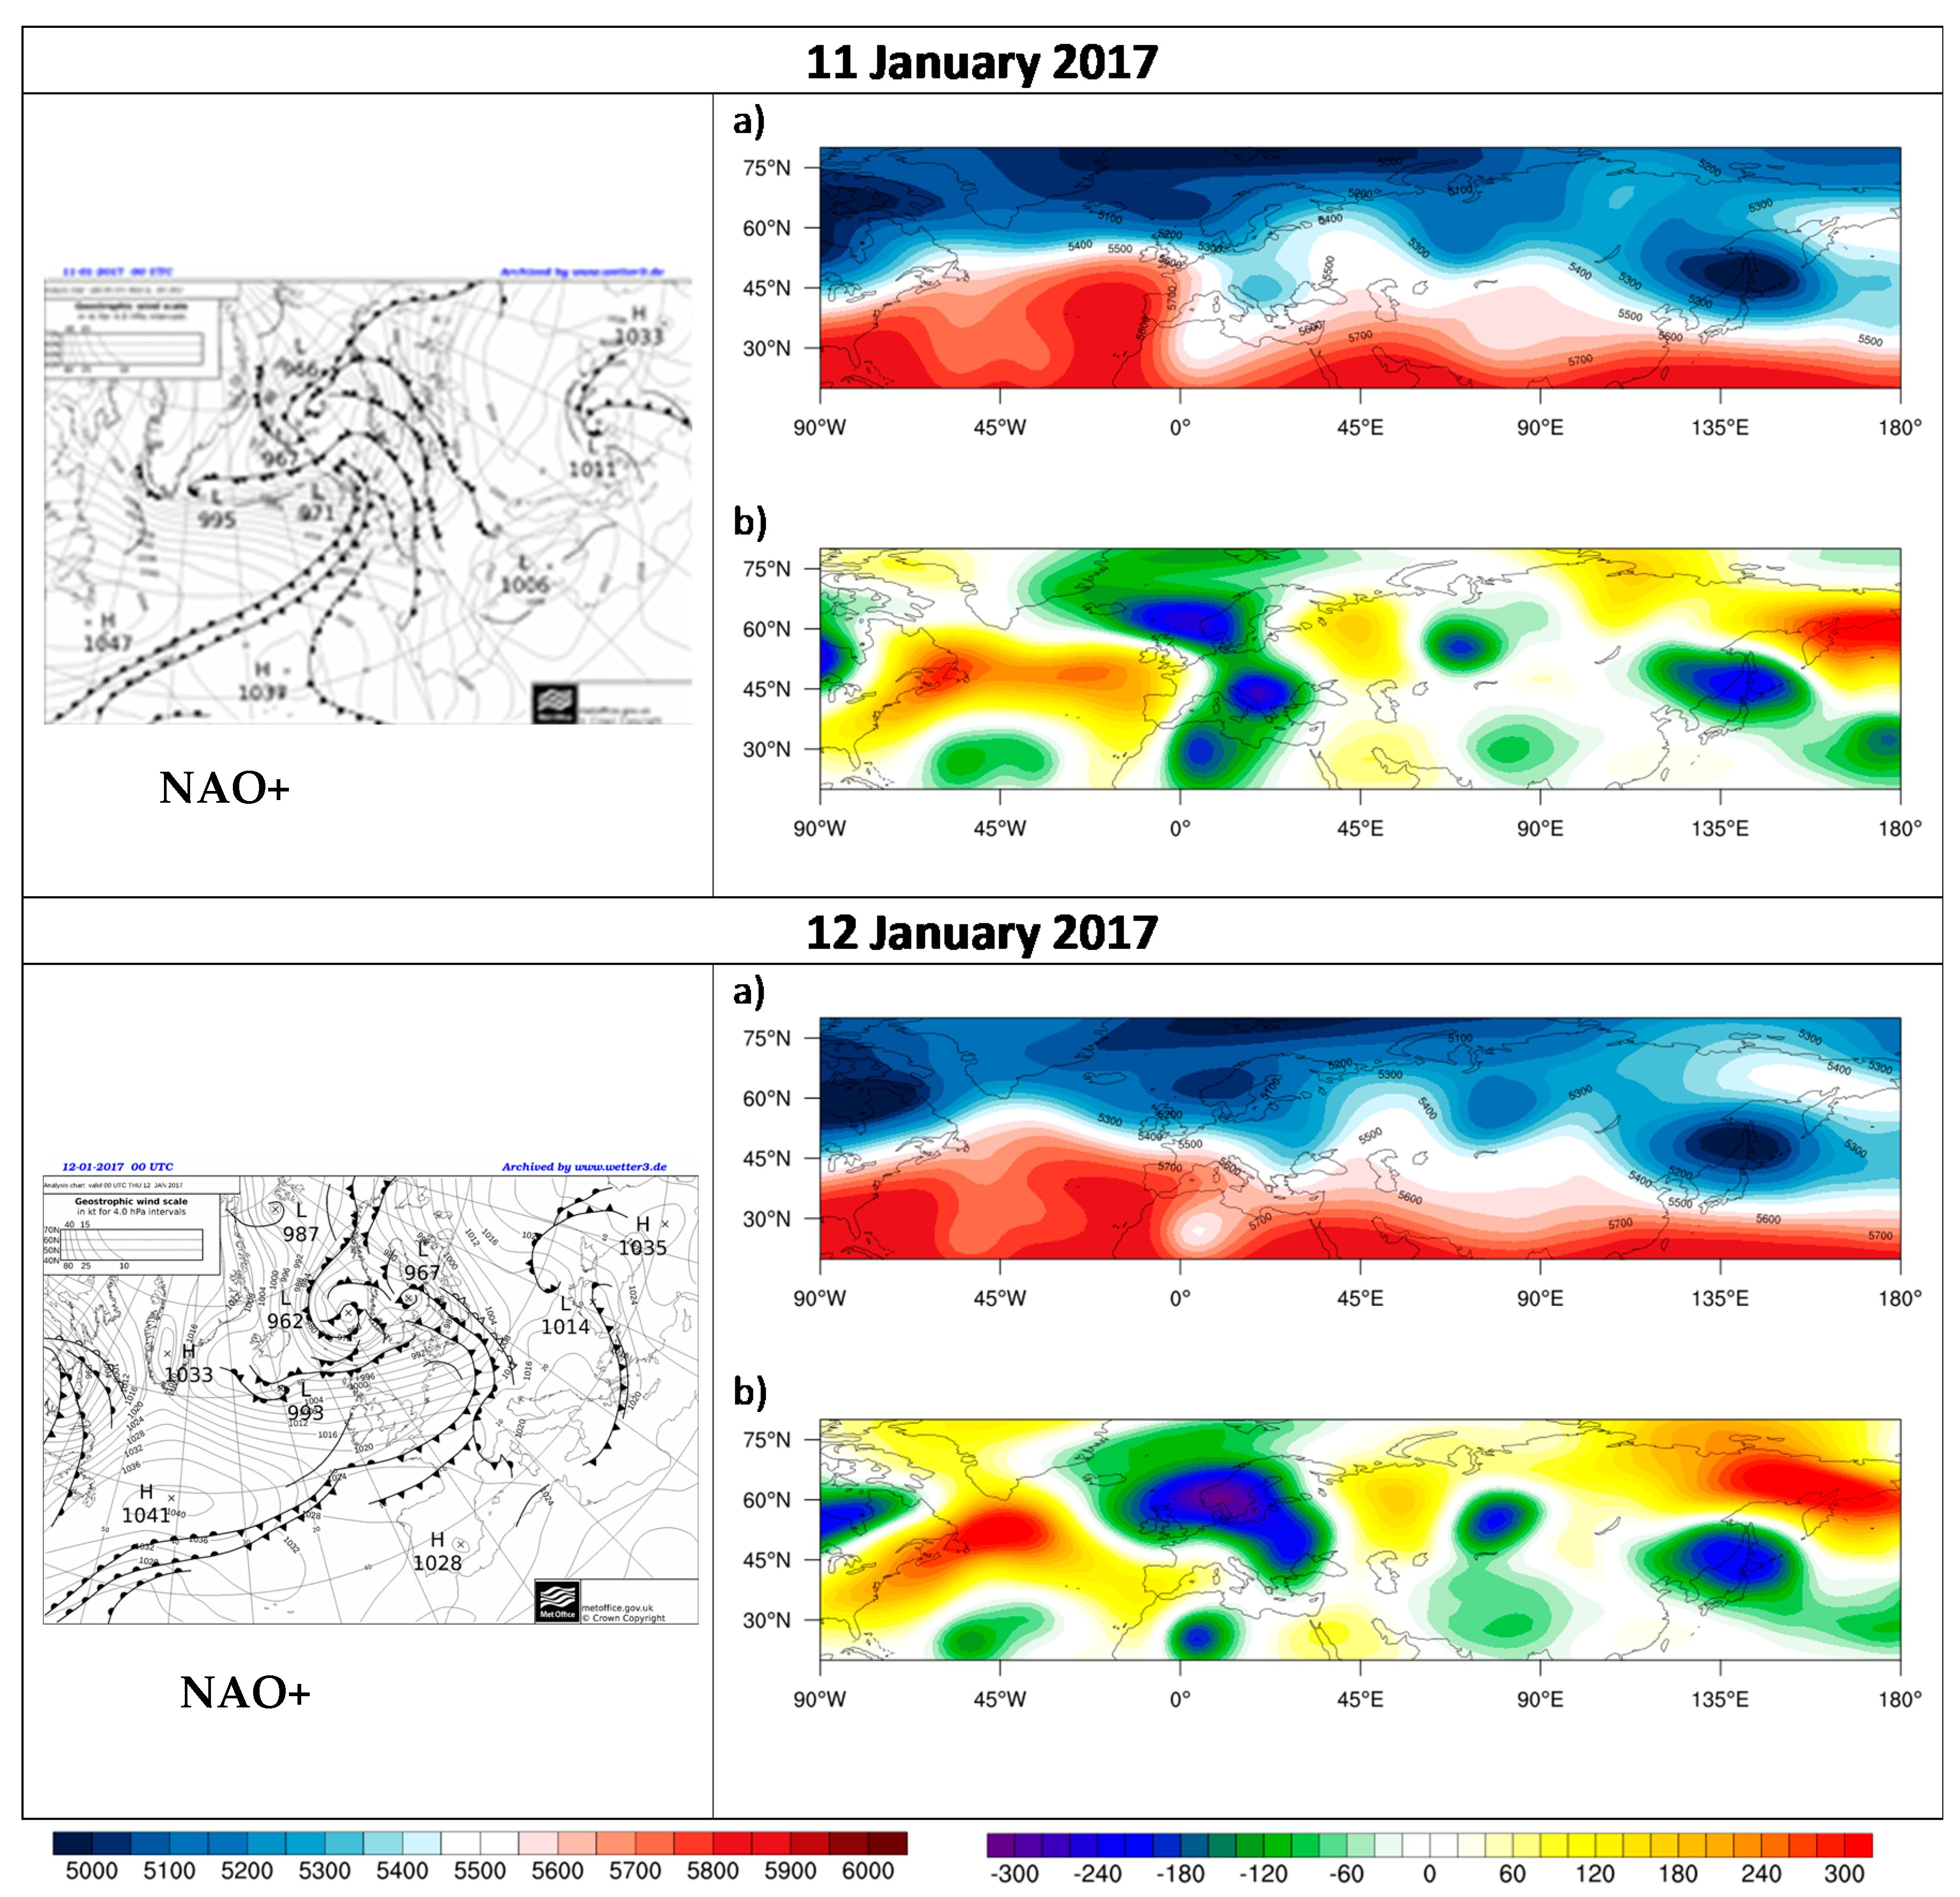
During the P+1 stage, a gradually merging of the cutoff with the main stream was observed (Figure 7). The anticyclonic center declined to the east and fronts passed through the Balkan Peninsula. The anomalous negative pole at 500 hPa level over the Balkans remained until the end of this stage. The polar jet stream (not shown) moved far south over the northern part of Africa, allowing the cold polar air to extend to the mid latitudes.
4. Discussion and Conclusions
January 2017, characterized by extreme cold weather over the Balkan Peninsula, caused several socioeconomic problems in the region. The temperature anomalies were out of the bounds of the 1958–2012 climatological means over the Balkan Peninsula. Minimum temperature for January 2017 exceeded −3.0 °C over most of the studied stations, with peak differences reaching −4.7 °C in Bucharest and Mytilini. For Larissa and Thessaloniki, the temperature anomalies were equal to −2.0 °C and −2.5 °C, respectively. Although the aforementioned low temperatures did not break previous lower records (except for some local records), their duration was extreme, resulting in severe cold conditions over the domain of interest. This extreme event was also described in terms of return values estimated from the GEV distribution of annual minima extremes. Gubanova and Li [27] and Kioutsoukis et al. [24] used a GEV model to produce the statistics of extreme minimum temperature values in Mediterranean and the Balkan Peninsula. Cueto et al. [28] found that the extreme minimum temperature will be less severe compared with the extreme maximum temperatures. These results are in agreement with our results that showed that January 2017 was extreme due to the duration of the cold spell and not due to its severity. The return-level threshold periods were different for the studied stations in Balkans. As a result, a rare temperature extreme equal to −15 °C is regarded as having an almost a 1000-year return period for Thessaloniki and Alexandroupoli, while this temperature can be observed one time in 40 years in Larissa. −15 °C is a rather common cold episode in northern stations since it can happen every year.
January 2017 started with a characteristic negative phase of NAO that further supports the previous findings that extremely cold European winters are generally related to –NAO (e.g., [29,30,31]), while Peterson et al. [32] showed that the main driver of winter temperature variability in Europe is North Atlantic dynamics. In 2011, Gattiaux and co-authors [18] demonstrated that the negative phase of NAO accounted for the low temperature anomalies of winter 2010. Likewise, Guirguis et al. [33] showed that the winters for two continuous years (2009–2010 and 2010–2011) in NE Eurasia and SE USA were associated with the anomalous and persistent negative NAO. Moreover, it is likely that there was a westward extension of the Siberian Anticyclone to interact with –NAO. This negative NAO phase association with cold European winters was also detected in the extreme cold winter of 1962–1963 according to Hirshi and Sinha [34], who mentioned that, especially over Western Europe, these low-temperature extremes are highly connected with the weakening of westerlies and the reduction in the influence of ocean circulation over the region. However, the same authors underline in their study that, even though the NAO anomalies could by a “predicting” tool for the occurrence of extreme temperatures in Europe, the spatial distribution of low- or high-temperature anomalies is not always coherent over the European region [34]. Thus, the investigation of other physical processes and synoptic conditions at different geopotential levels, as well as a stratospheric and an SST analysis [35], can provide more detailed insight into the factors leading to extreme temperature conditions.
Specifically, for the extreme episode of January 2017, the atmospheric circulation over the Balkan Peninsula started to change on 5 January. The negative phase of the NAO teleconnection pattern weakened and the positive phase of the Eastern Mediterranean Pattern was established (EMP, [35,36,37]). The synoptic pattern of the cold episode at January 2017 was similar to that in January–February 2012 [2], in which significant snowfalls and low temperature in southern Balkan were observed. During this cold episode, the extension of the Siberian Anticyclone towards Scandinavia blocked the westerly circulation and forced frozen arctic air to move towards the equator. The main difference between the two episodes is that the air mass in January 2017 came from much higher latitudes. Three days before the cold episode that occurred over the Balkans, a cold-air outbreak formed over Europe, and cold fronts were observed over the Balkans. Such mid-latitude disturbances (e.g., intense cold fronts and cutoff lows) are also associated with severe temperature events over South America [10,11,38]. Subsequently, the 500-hPa height anomalies of January 2017 presented a strong negative pole over the study region, suggesting the formation of a well-organized cutoff low pressure over the Balkans. This cutoff low (COL) lasted three days, a common duration for COL in the northern hemisphere [39]. At the surface, an anticyclonic center was located over the studied region. Nieto et al. [40] studied the relationship between the cutoff lows associated with cold extremes, the air mass transfer between the stratosphere and the troposphere, and the flow of tropospheric ozone. Moreover, Scaife and Knight [31] demonstrated in their study on the extreme cold winter of 2005–2006 over Europe that the intense stratospheric warming in synergy with SST over the Atlantic was a main factor that led to these extreme low-temperature conditions. Thus, future research should concentrate on the relationship between the extreme January 2017 weather conditions and the stratospheric air transfer as well as the hemispherical or planetary factors that were responsible for this abnormal circulation over Southeastern Europe, which caused relatively long duration cold spells and high-intensity phenomena. Such factors could be El Niño or stratospheric cooling or heating.
Acknowledgments
The authors would like to thank the European Climate Assessment and Database (ECAD) and the National Observatory of Athens for enabling access to database and NOAA for enabling access to the climate indices. The authors would like to thanks the MDPI Editorial office for giving the opportunity to publish in open access.
Author Contributions
All authors contributed equally in carrying out this research work and writing the paper. All authors have read and approved the final manuscript.
Conflicts of Interest
The authors declare no conflict of interest.
References
- Maheras, P. Climatologie de la mer Egée et de ces Marges Continentales. Etude de Climatologie Descriptive et de Climatologie Dynamique. Thèse d ‘Etat, Atelier de Reproduction de Thèses de Lille III, Université de Lille III, France, 1982. [Google Scholar]
- Tolika, K.; Maheras, P.; Pytharoulis, I.; Anagnostopoulou, C. The anomalous low and high temperatures of 2012 over Greece—An explanation from a meteorological and climatological perspective. Nat. Hazards Earth Syst. Sci. 2014, 14, 501–507. [Google Scholar] [CrossRef]
- Makrogiannis, T.J.; Giles, B.D.; Flocas, A.A. The problem of the extension of the Siberian Anticyclone towards southeast Europe, and its relation to atmospheric circulation anomalies over the northern hemisphere. Arch. Meteorol. Geophys. Bioclimatol. Ser. A 1981, 30, 185–196. [Google Scholar] [CrossRef]
- Reinhold, B.; Pierrehumbert, R. Dynamics of weather regimes: Quasi-stationary waves and blocking. Mon. Weather Rev. 1982, 110, 1105–1145. [Google Scholar] [CrossRef]
- Legras, B.; Ghil, M. Persistent anomalies, blocking and variations in atmospheric predictability. J. Atmos. Sci. 1985, 42, 433–471. [Google Scholar] [CrossRef]
- Sillmann, J.; Croci-Maspoli, M.; Kallache, M.; Katz, R.W. Extreme cold winter temperatures in Europe under the influence of North Atlantic atmospheric blocking. J. Clim. 2011, 24, 5899–5913. [Google Scholar] [CrossRef]
- Anstey, J.A.; Davini, P.; Gray, L.J.; Woollings, T.J.; Butchart, N.; Cagnazzo, C.; Yang, S. Multi-model analysis of Northern Hemisphere winter blocking: Model biases and the role of resolution. J. Geophys. Res. Atmos. 2013, 118, 3956–3971. [Google Scholar] [CrossRef]
- Whan, K.; Zwiers, F.; Sillmann, J. The influence of atmospheric blocking on extreme winter minimum temperatures in North America. J. Clim. 2016, 29, 4361–4381. [Google Scholar] [CrossRef]
- Wheeler, D.D.; Harvey, V.L.; Atkinson, D.E.; Collins, R.L.; Mills, M.J. A climatology of cold air outbreaks over North America: WACCM and ERA-40 comparison and analysis. J. Geophys. Res. Atmos. 2011, 116. [Google Scholar] [CrossRef]
- Fortune, M.; Kousky, V.E. Two severe freezes in Brazil: Precursors and synoptic evolution. Mon. Weather Rev. 1983, 111, 181–196. [Google Scholar] [CrossRef]
- Vera, C.S.; Vigliarolo, P.K. A diagnostic study of cold-air outbreaks over South America. Mon. Weather Rev. 2000, 128, 3–24. [Google Scholar] [CrossRef]
- Marengo, J.A.; Ambrizzi, T.; Kiladis, G.; Liebmann, B. Upper-air wave trains over the Pacific Ocean and wintertime cold surges in tropical-subtropical South America leading to Freezes in Southern and Southeastern Brazil. Theor. Appl. Climatol. 2002, 73, 223–242. [Google Scholar] [CrossRef]
- Kuhlemann, J.; Rohling, E.J.; Krumrei, I.; Kubik, P.; Ivy-Ochs, S.; Kucera, M. Regional synthesis of Mediterranean atmospheric circulation during the Last Glacial Maximum. Science 2008, 321, 1338–1340. [Google Scholar] [CrossRef] [PubMed]
- Hayes, A.; Kucera, M.; Kallel, N.; Sbaffi, L.; Rohling, E.J. Glacial Mediterranean sea surface temperatures based on planktonic foraminiferal assemblages. Quat. Sci. Rev. 2005, 24, 999–1016. [Google Scholar] [CrossRef]
- Hurrell, J. Decadal trends in the North Atlantic Oscillation: Regional temperatures and precipitation. Science 1995, 26, 676–679. [Google Scholar] [CrossRef] [PubMed]
- Brown, S.J.; Caesar, J.; Ferro, C.A.T. Global changes in extreme daily temperature since 1950. J. Geophys. Res. 2008, 113. [Google Scholar] [CrossRef]
- Castro-Dıez, Y.; Pozo-Vazquez, D.; Rodrigo, F.S.; Esteban-Parra, M.J. NAO and winter temperature variability in southern Europe. Geophys. Res. Lett. 2002, 29. [Google Scholar] [CrossRef]
- Cattiaux, J.; Vautard, R.; Cassou, C.; Yiou, P.; Masson-Delmotte, V.; Codron, F. Winter 2010 in Europe: A cold extreme in a warming climate. Geophys. Res. Lett. 2010, 37. [Google Scholar] [CrossRef]
- Unkasevic, M.; Tosic, I. Changes in extreme daily winter and summer temperatures in Belgrade. Theor. Appl. Climatol. 2009, 95, 27–38. [Google Scholar] [CrossRef]
- Klein Tank, A.M.G.; Wijngaard, J.B.; Konnen, G.P.; Böhm, R.; Demaree, G.; Gocheva, A.; Mileta, M.; Pashiardis, S.; Hejkrilik, L.; Kern-Hansen, C.; et al. Daily dataset of 20th-century surface air temperature and precipitation series for the European climate assessment. Int. J. Climatol. 2002, 22, 1441–1453. [Google Scholar] [CrossRef]
- Lagouvardos, K.; Kotroni, V.; Bezes, A.; Koletsis, I.; Kopania, T.; Lykoudis, S.; Mazarakis, N.; Papagiannaki, K.; Vougioukas, S. The automatic weather stations NOANN network of the National Observatory of Athens: Operation and database. Geosci. Data J. 2017, 4, 1–16. [Google Scholar] [CrossRef]
- Coles, S.; Bawa, J.; Trenner, L.; Dorazio, P. An Introduction to Statistical Modeling of Extreme Values; Springer: London, UK, 2001; Volume 208. [Google Scholar]
- Hosking, J.R.M. L-moments: Analysis and estimation of distributions using linear combinations of order statistics. J. R. Stat. Soc. Ser. B 1990, 52, 105–124. [Google Scholar]
- Lazoglou, G.; Anagnostopoulou, C.; Tolika, K.; Kolyva-Machera, F. A review of statistical methods to analyze the extreme precipitation and temperature events in the Mediterranean region. Proceedings 2017, 1, 681. [Google Scholar]
- Katz, R.W.; Grotjahn, R. Statistical methods for relating temperature extremes to large-scale meteorological patterns. US Clivar Var. 2014, 12, 4–7. [Google Scholar]
- Kioutsioukis, I.; Melas, D.; Zerefos, C. Statistical assessment of changes in climate extremes over Greece (1955–2002). Int. J. Climatol. 2010, 30, 1723–1737. [Google Scholar] [CrossRef]
- Goubanova, K.; Li, L. Extremes in temperature and precipitation around the Mediterranean basin in an ensemble of future climate scenario simulations. Glob. Planet. Chang. 2007, 57, 27–42. [Google Scholar] [CrossRef]
- Cueto, O.G.; Soto, N.S.; Núñez, M.Q.; Benítez, S.O.; Limón, N.V. Extreme temperature scenarios in Mexicali, Mexico under climate change conditions. Atmósfera 2013, 26, 509–520. [Google Scholar] [CrossRef]
- Luterbacher, J.; Dietrich, D.; Xoplaki, E.; Grosjean, M.; Wanner, H. European seasonal and annual temperature variability, trends, and extremes since 1500. Science 2004, 303, 1499–1503. [Google Scholar] [CrossRef] [PubMed]
- Yiou, P.; Nogaj, M. Extreme climatic events and weather regimes over the North Atlantic: When and where? Geophys. Res. Lett. 2004, 31. [Google Scholar] [CrossRef]
- Scaife, A.A.; Knight, J.R. Ensemble simulations of the cold European winter of 2005-2006. Q. J. R. Meteorol. Soc. 2008, 134, 1647–1659. [Google Scholar] [CrossRef]
- Peterson, T.C.; Stott, P.A.; Herring, S. Explaining extreme events of 2011 from a climate perspective. Bull. Am. Meteorol. Soc. 2012, 93, 1041–1067. [Google Scholar] [CrossRef]
- Guirguis, K.; Gershunov, A.; Schwartz, R.; Bennett, S. Recent warm and cold daily winter temperature extremes in the Northern Hemisphere. Geophys. Res. Lett. 2011, 38. [Google Scholar] [CrossRef]
- Hirschi, J.J.M.; Sinha, B. Negative NAO and cold Eurasian winters: How exceptional was the winter of 1962/1963? Weather 2007, 62, 43–48. [Google Scholar] [CrossRef]
- Jung, T.; Palmer, T.N.; Rodwell, M.J.; Serrar, S. Understanding the Anomalously Cold European Winter of 2005/06 Using Relaxation Experiments. Mon. Weather Rev. 2010, 138, 3157–3173. [Google Scholar] [CrossRef]
- Hatzaki, M.; Flocas, H.A.; Asimakopoulos, D.N.; Maheras, P. The eastern Mediterranean teleconnection pattern: Identification and definition. Int. J. Climatol. 2007, 27, 727–737. [Google Scholar] [CrossRef]
- Hatzaki, M.; Flocas, H.A.; Giannakopoulos, C.; Maheras, P. The impact of the eastern Mediterranean teleconnection pattern on the Mediterranean climate. J. Clim. 2009, 22, 977–992. [Google Scholar] [CrossRef]
- Godoy, A.A.; Possia, N.E.; Campetella, C.M.; García Skabar, Y. A cut-off low in southern South America: Dynamic and thermodynamic processes. Rev. Bras. Meteorol. 2011, 26, 503–514. [Google Scholar] [CrossRef]
- Nieto, R.; Gimeno, L.; de La Torre, L.; Ribera, P.; Gallego, D.; García-Herrera, R.; Lorente, J. Climatological features of cutoff low systems in the Northern Hemisphere. J. Clim. 2005, 18, 3085–3103. [Google Scholar]
- Nieto, R.; Sprenger, M.; Wernli, H.; Trigo, R.M.; Gimeno, L. Identification and Climatology of Cut-off Lows near the Tropopause. Ann. N. Y. Acad. Sci. 2008, 1146, 256–290. [Google Scholar] [CrossRef] [PubMed]
Figure 1.
Hovmöller diagrams of minimum temperature on 2 m anomalies (reference period 1981–2010) over the 35° N–50° N latitude sector for January 2017. Black solid frame indicates the region of the Balkan Peninsula.
Figure 1.
Hovmöller diagrams of minimum temperature on 2 m anomalies (reference period 1981–2010) over the 35° N–50° N latitude sector for January 2017. Black solid frame indicates the region of the Balkan Peninsula.

Figure 2.
The minimum temperature variability of January 2017 for the (a) the southern stations and (b) the northern stations.
Figure 2.
The minimum temperature variability of January 2017 for the (a) the southern stations and (b) the northern stations.
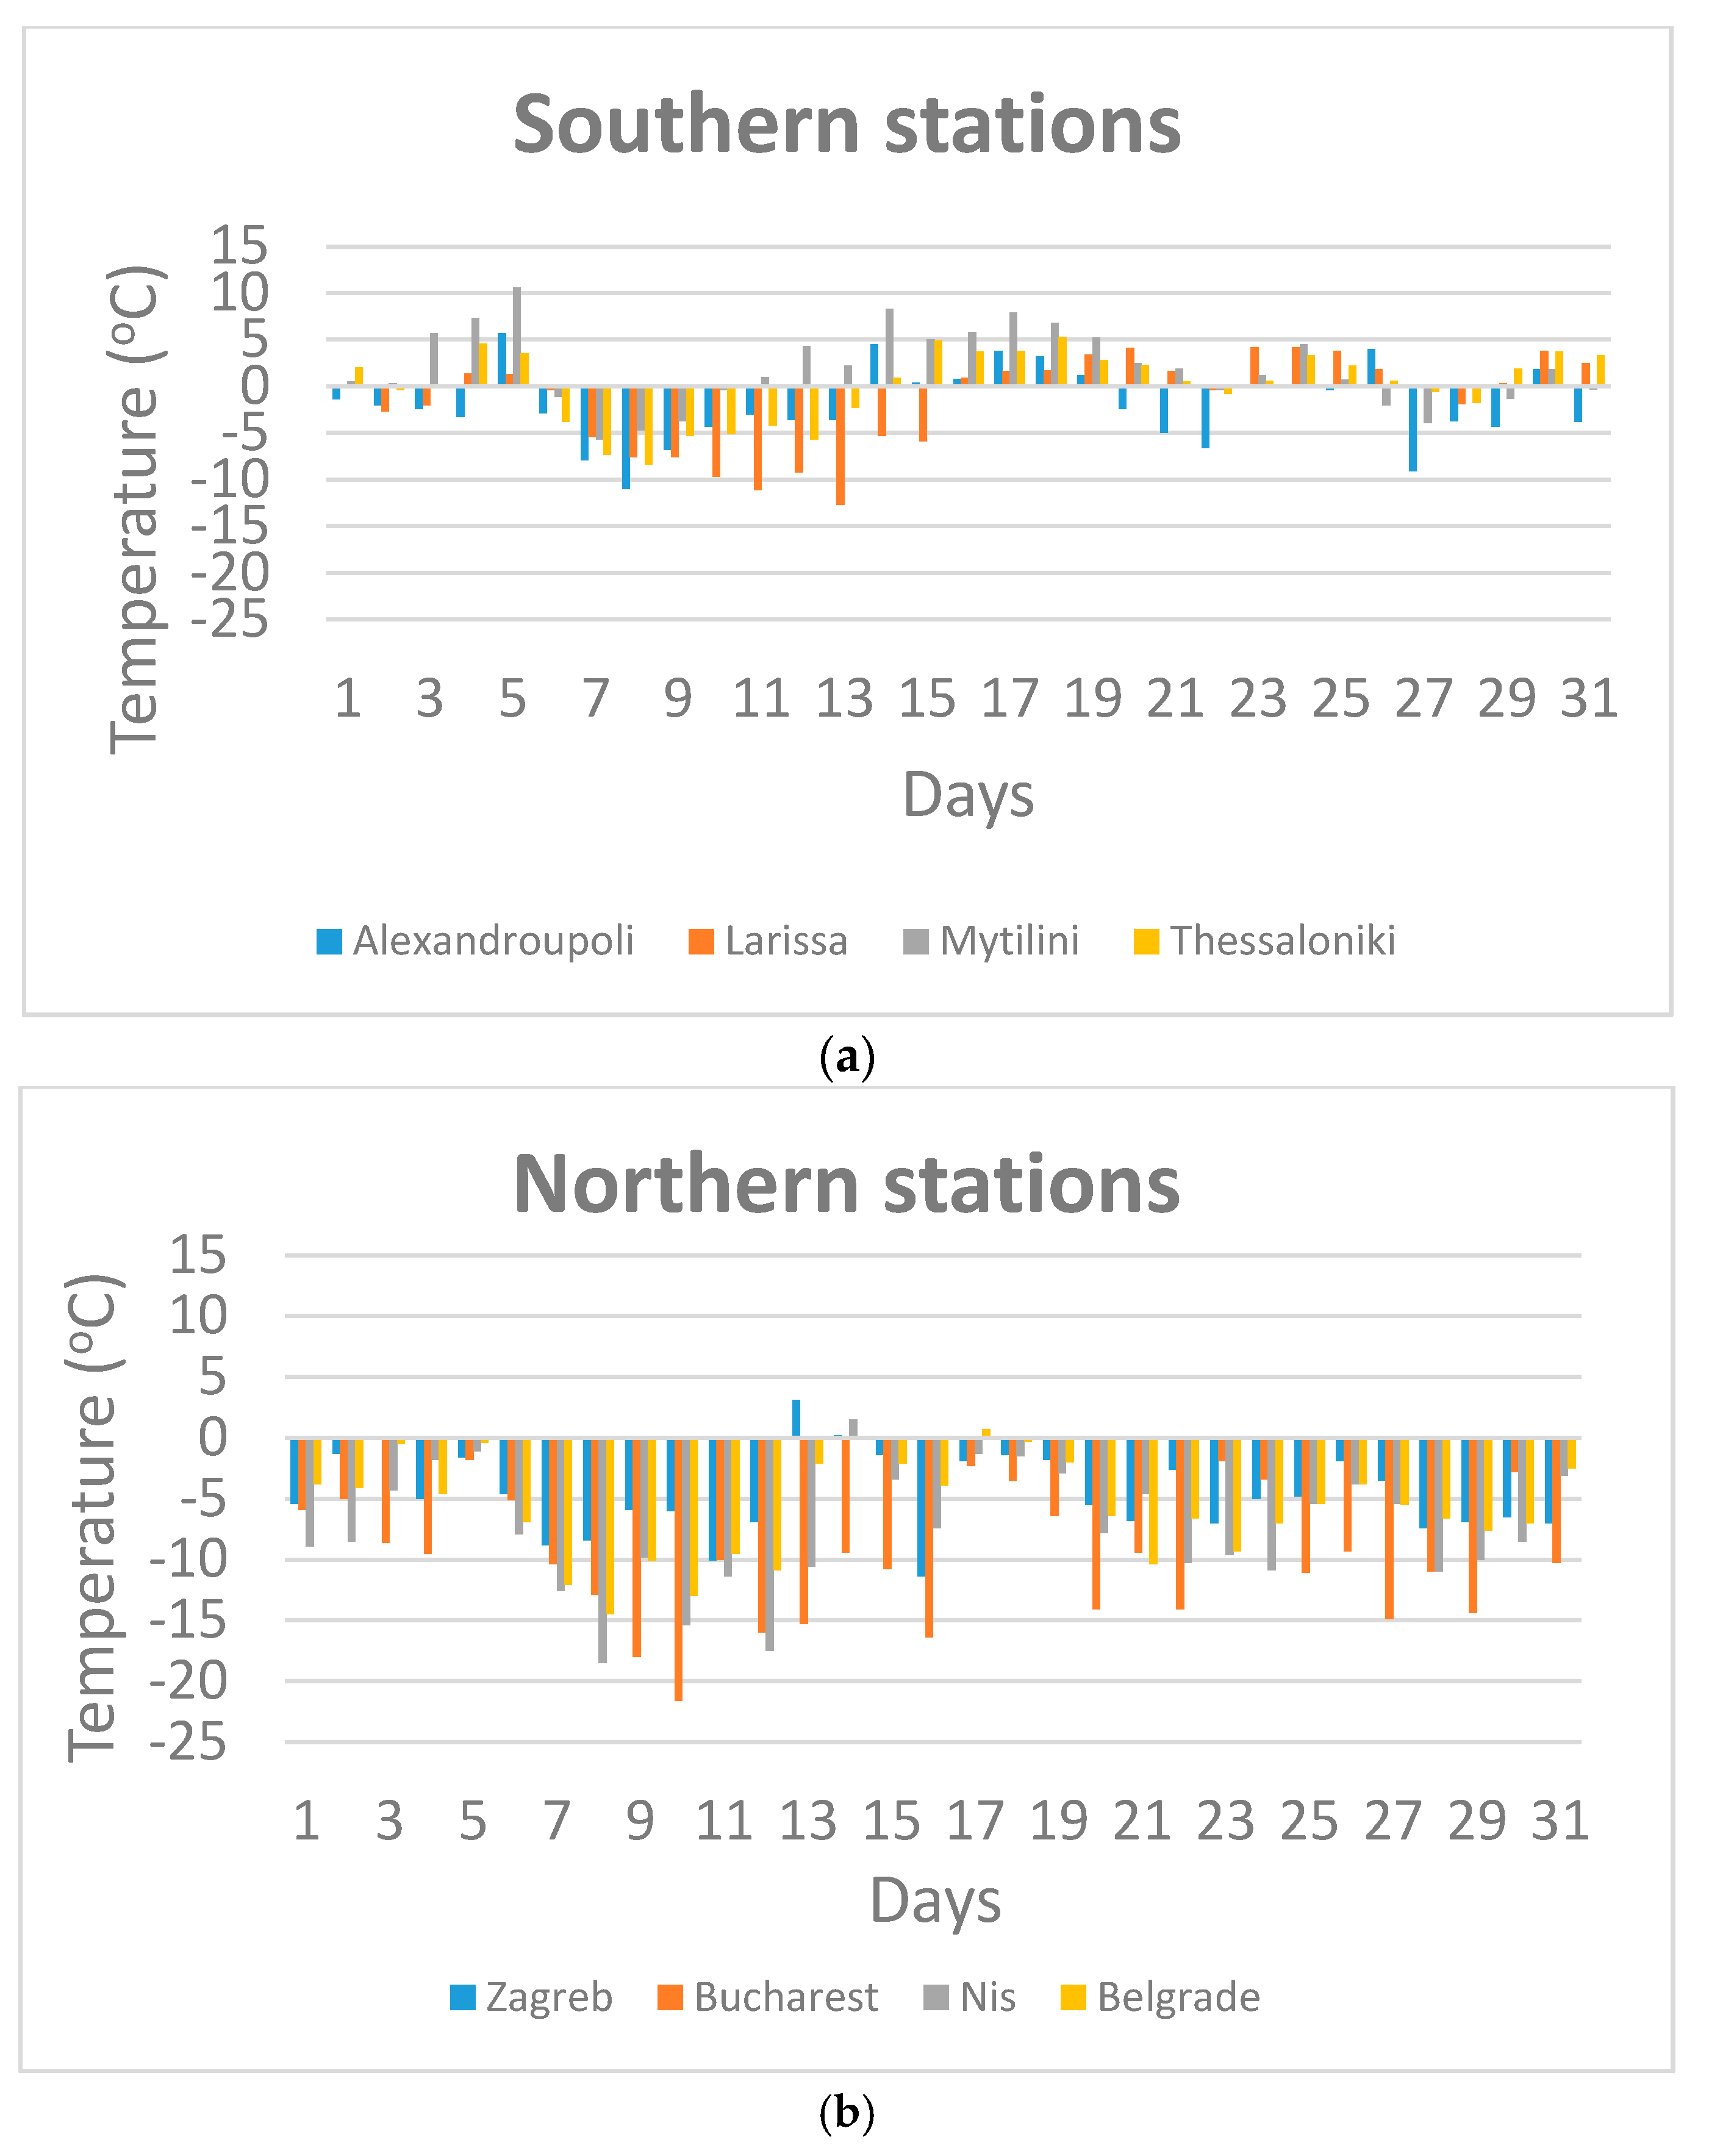
Figure 3.
Density plots for the minimum temperature of January, for the reference period 1958–2012 (purple) and 2017 (light blue).
Figure 3.
Density plots for the minimum temperature of January, for the reference period 1958–2012 (purple) and 2017 (light blue).

Figure 4.
The return levels curves for the eight stations with the 95% confidence interval (dashed line).
Figure 4.
The return levels curves for the eight stations with the 95% confidence interval (dashed line).

Figure 5.
The synoptic pattern for the P-1 stage (5–7 January 2017) and the temporal variation of the NAO. First column: SLP (Met Office; www.wetter3.de); second column: (a) geopotential height of 500 hPa and (b) anomalies of geopotential heights at 500 hPa level.
Figure 5.
The synoptic pattern for the P-1 stage (5–7 January 2017) and the temporal variation of the NAO. First column: SLP (Met Office; www.wetter3.de); second column: (a) geopotential height of 500 hPa and (b) anomalies of geopotential heights at 500 hPa level.

Figure 6.
The synoptic pattern for the P-0 stage (8–10 January 2017) and the temporal variation of the NAO and the EMP. First column: SLP (Met Office; www.wetter3.de); second column: (a) geopotential height of 500 hPa and (b) anomalies of geopotential heights at 500 hPa level.
Figure 6.
The synoptic pattern for the P-0 stage (8–10 January 2017) and the temporal variation of the NAO and the EMP. First column: SLP (Met Office; www.wetter3.de); second column: (a) geopotential height of 500 hPa and (b) anomalies of geopotential heights at 500 hPa level.
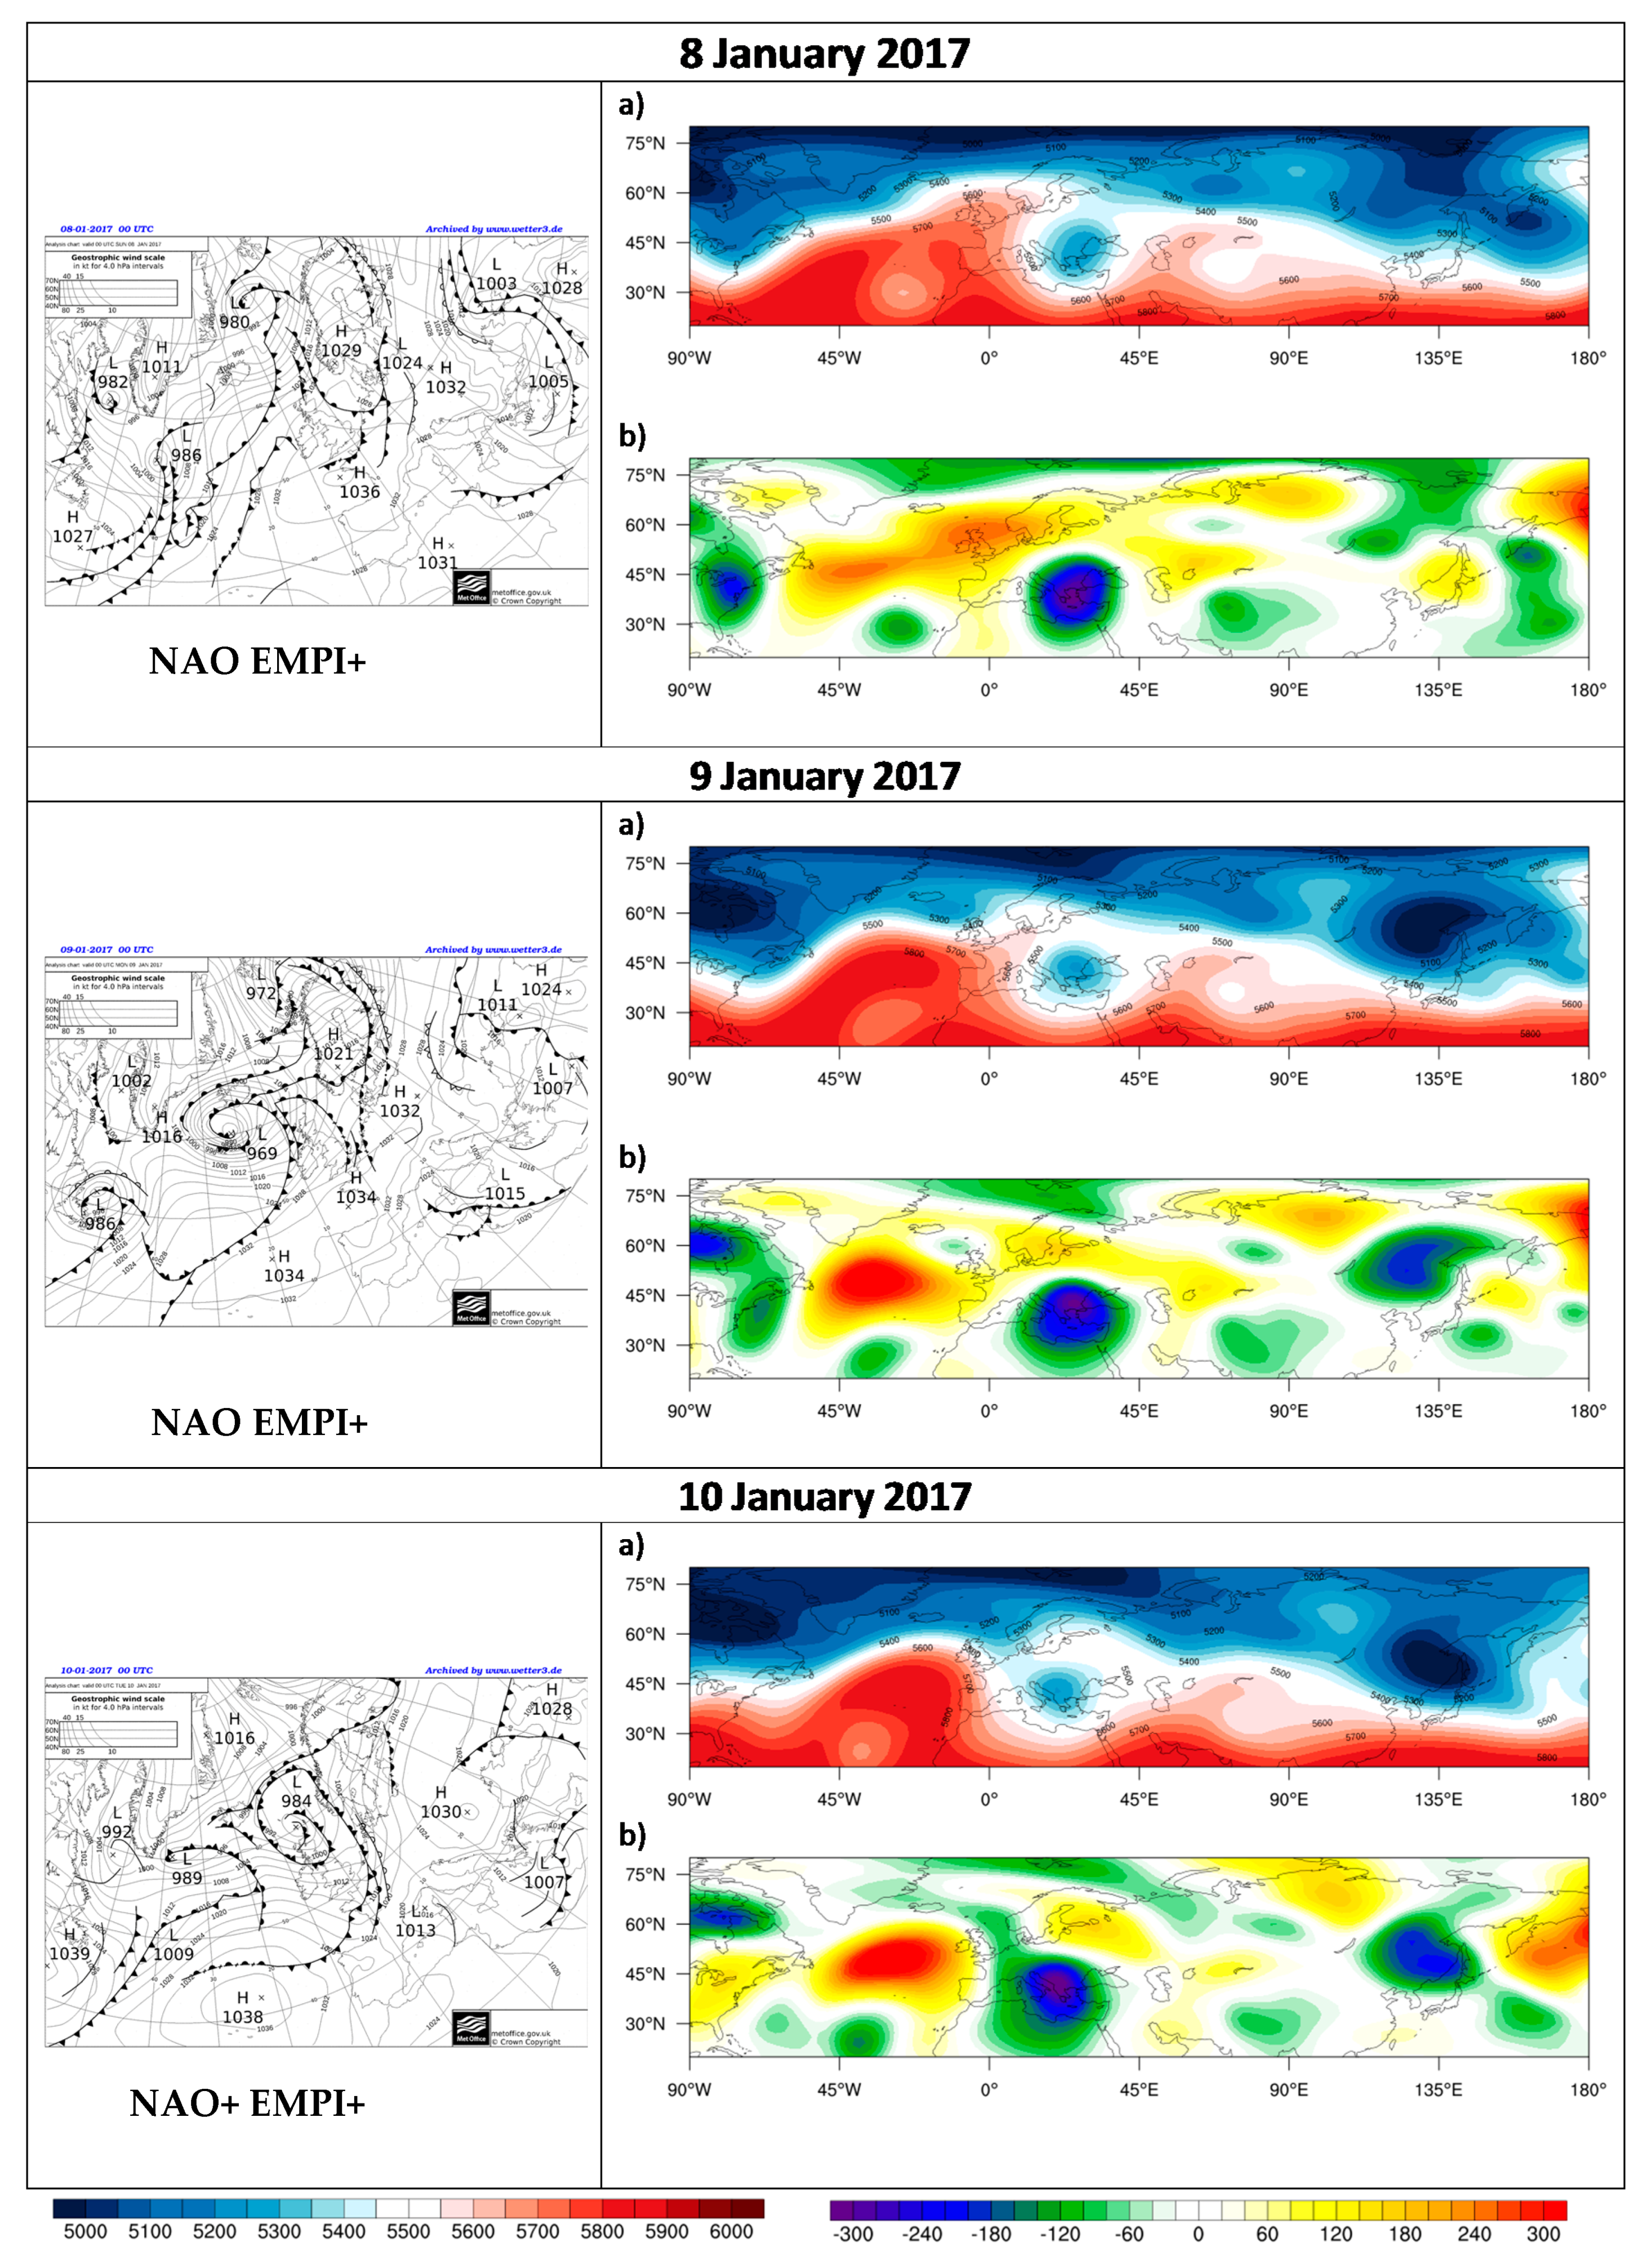
Figure 7.
The synoptic pattern for the P+1 stage (11–12 January 2017) and the temporal variation of the NAO. First column: SLP (Met Office; www.wetter3.de); second column: (a) geopotential height of 500 hPa and (b) anomalies of geopotential heights at 500 hPa level.
Figure 7.
The synoptic pattern for the P+1 stage (11–12 January 2017) and the temporal variation of the NAO. First column: SLP (Met Office; www.wetter3.de); second column: (a) geopotential height of 500 hPa and (b) anomalies of geopotential heights at 500 hPa level.

Table 1.
The geographical characteristics of the stations used in the study.
| Stations | Country | Longitude (°) | Latitude (°) | Altitude (m) |
|---|---|---|---|---|
| Alexandroupoli | Greece | 25.92 | 40.85 | 19 |
| Belgrade | Serbia | 20.5 | 44.8 | 132 |
| Bucharest | Romania | 27.1 | 44.5 | 90 |
| Larissa | Greece | 22.42 | 39.63 | 83 |
| Mytilini | Greece | 26.50 | 39.07 | 7 |
| Nis | Serbia | 21.9 | 44.3 | 201 |
| Thessaloniki | Greece | 22.95 | 40.62 | 36 |
| Zagreb | Croatia | 16.7 | 45.8 | 156 |
Table 2.
January Minimum Temperature (TN) climatological characteristics for the 8 stations in the Balkan Peninsula. MTN: mean daily minimum temperature; ATN: Absolute daily minimum temperature; 95TN: the 95th percentile of minimum temperature; MFD: mean number of frost days pre year; 95FD: the 95th percentile of frost days. The number in parenthesis indicates the differences between the temperature in 2017 and the reference period.
| Alex | Belg | Buch | Lari | Myti | Nis | Thes | Zag | ||
|---|---|---|---|---|---|---|---|---|---|
| 1958–2012 | MTN | 1.1 | −1.1 | −5.2 | 0.5 | 6.6 | −3.1 | 2.6 | −1.3 |
| ATN | −13.2 | −21.0 | −24.8 | −21.6 | −4.4 | −23.7 | −12.6 | −17.2 | |
| 95TN | −6.6 | −10.4 | −15.3 | −6.4 | 0.6 | −12.0 | −3.6 | −9.3 | |
| MFD | 12 | 19 | 27 | 13 | 1 | 22 | 7 | 19 | |
| 95FD | 22 | 28 | 31 | 24 | 4 | 29 | 16 | 28 | |
| 2017 | Mean Tmin (MTN) | −2.0 (−3.1) | −5.7 (−4.6) | −9.9 (−4.7) | −1.5 (−2.0) | 1.9 (−4.7) | −7.5 (−4.5) | 0.1 (−2.5) | −4.7 (−3.5) |
| Absolute daily Tmin (ATN) | −11.0 (2.2) | −14.5 (6.5) | −21.6 (3.2) | −12.7 (8.9) | −5.7 (−1.3) | −18.5 (5.2) | −8.4 (4.2) | −11.4 (5.8) | |
| 95% Tmin (95TN) | −8.5 (−1.9) | −12.6 (−2.2) | −17.2 (−1.9) | −10.4 (−4.0) | −4.3 (−4.9) | −16.5 (−4.5) | −6.5 (−2.9) | −9.5 (−0.2) | |
| Frost day (FD − MFD) | 20 (8) | 29 (10) | 31 (4) | 14 (1) | 10 (9) | 30 (8) | 13 (6) | 27 (8) | |
| Frost day (FD − 95FD) | 20 (−2) | 29 (+1) | 31 (0) | 14 (−10) | 10 (+6) | 30 (+1) | 13 (−3) | 27 (−1) |
Table 3.
Generalized Extreme Value (GEV) parameter estimations of the January minimum temperatures.
| Parameter | Alexandroupoli | Belgrade | Bucharest | Larissa | Mytilini | Nis | Thessaloniki | Zagreb |
|---|---|---|---|---|---|---|---|---|
| conv | 0 | 0 | 0 | 0 | 0 | 0 | 0 | 0 |
| nllh | 137.1025 | 153.9713 | 165.6344 | 144.1673 | 113.1896 | 163.6932 | 129.0399 | 149.4803 |
| μ | −7.9267 | −11.1367 | −16.1069 | −7.57662 | −0.16256 | −13.3961 | −4.11905 | −9.36616 |
| σ | 2.981497 | 4.22103 | 5.159328 | 3.816938 | 2.202056 | 5.365457 | 2.9152 | 4.225243 |
| ξ | −0.30545 | −0.38014 | −0.38044 | −0.47508 | −0.52346 | −0.51108 | −0.52346 | −0.53942 |
| se/μ | 0.43886 | 0.619902 | 0.789264 | 0.5492 | 0.322445 | 0.812977 | 0.426804 | 0.626169 |
| se/σ | 0.308325 | 0.445967 | 0.601719 | 0.377757 | 0.262616 | 0.658809 | 0.322992 | 0.503753 |
| se/ξ | 0.07679 | 0.08006 | 0.118376 | 0.059275 | 0.095402 | 0.1222069 | 0.08765 | 0.104188 |
Table 4.
Return levels for different return periods.
| Periods | Alexandroupoli | Belgrade | Bucharest | Larissa | Mytilini | Nis | Thessaloniki | Zagreb |
|---|---|---|---|---|---|---|---|---|
| 10 year | −10.8 | −15.3 | −21.0 | −11.3 | −2.3 | −18.7 | −7.1 | −13.5 |
| 15 year | −11.4 | −16.3 | −21.9 | −12.4 | −2.9 | −19.9 | −7.9 | −14.6 |
| 20 year | −11.8 | −16.9 | −22.6 | −13.2 | −3.2 | −20.7 | −8.4 | −15.3 |
| 25 year | −12.1 | −17.4 | −23.0 | −13.7 | −3.5 | −21.2 | −8.9 | −15.8 |
| 50 year | −12.9 | −18.8 | −24.2 | −15.5 | −4.2 | −22.9 | −10.1 | −17.2 |
| 75 year | −13.3 | −19.5 | −24.7 | −16.4 | −4.6 | −23.7 | −10.8 | −18.0 |
| 100 year | −13.5 | −19.9 | −25.1 | −17.1 | −4.8 | −24.3 | −11.3 | −18.6 |
© 2017 by the authors. Licensee MDPI, Basel, Switzerland. This article is an open access article distributed under the terms and conditions of the Creative Commons Attribution (CC BY) license (http://creativecommons.org/licenses/by/4.0/).
Share and Cite
MDPI and ACS Style
Anagnostopoulou, C.; Tolika, K.; Lazoglou, G.; Maheras, P. The Exceptionally Cold January of 2017 over the Balkan Peninsula: A Climatological and Synoptic Analysis. Atmosphere 2017, 8, 252. https://doi.org/10.3390/atmos8120252
AMA Style
Anagnostopoulou C, Tolika K, Lazoglou G, Maheras P. The Exceptionally Cold January of 2017 over the Balkan Peninsula: A Climatological and Synoptic Analysis. Atmosphere. 2017; 8(12):252. https://doi.org/10.3390/atmos8120252
Chicago/Turabian StyleAnagnostopoulou, Christina, Konstantia Tolika, Georgia Lazoglou, and Panagiotis Maheras. 2017. "The Exceptionally Cold January of 2017 over the Balkan Peninsula: A Climatological and Synoptic Analysis" Atmosphere 8, no. 12: 252. https://doi.org/10.3390/atmos8120252
Note that from the first issue of 2016, this journal uses article numbers instead of page numbers. See further details here.