Article

Different Characteristics of New Particle Formation Events at Two Suburban Sites in Northern China

1
Meteorological Institute of Shaanxi Province, Xi’an 710016, China
2
State Key Laboratory of Loess and Quaternary Geology, Institute of Earth Environment, Chinese Academy of Sciences, Xi’an 710061, China
3
University of Chinese Academy of Sciences, Beijing 100049, China
4
School of Human Settlements and Civil Engineering, Xi’an Jiaotong University, Xi’an 710049, China
5
Key Laboratory of Ecosystem Network Observation and Modeling, Institute of Geographic Sciences and Natural Resources Research, Chinese Academy of Sciences, Beijing 100101, China
*
Author to whom correspondence should be addressed.
Atmosphere 2017, 8(12), 258; https://doi.org/10.3390/atmos8120258
Submission received: 8 November 2017 / Revised: 8 December 2017 / Accepted: 16 December 2017 / Published: 19 December 2017
(This article belongs to the Special Issue Urban Particulate Matters: Composition, Sources, and Exposure)

Abstract

:
The formation of new atmospheric aerosol particles and their subsequent growth have been observed under different environmental conditions globally; such observations are few over northwest China. Here, we present an analysis of some case studies for new particle formation (NPF) events from two distinct suburban locations in northern China during May and June of two consecutive years, and provide more information to understand the characteristics of NPF events in North China. Particle number size distribution was measured at suburbs of Beijing (39.75° N, 116.96° E) during 1 June to 2 July 2013 and at suburbs of Xi’an (34.09° N, 108.55° E) during 1 to 25 May 2014. The average of total particle number concentration in the similar size range of 10–487 nm at the suburbs of Beijing (9.0 × 103 cm−3) was about two times higher than those observed at Xi’an (4.7 × 103 cm−3), and the mean particle mode diameter at Beijing was 1.4-fold higher than that at Xi’an. The estimated total condensation sink (CS) at Beijing (3.11 × 10⁻² s−1) was also higher than at Xi’an (1.13 × 10⁻² s−1). The frequency of NPF events at suburb of Beijing was 24%, lower than that in Xi’an (50%), and also lower than urban site of Beijing (35% in June) and another suburb of Beijing (over 50% in June). The NPF events with (Class I) or without (Class II) subsequent growth were both observed at the two suburb sites. The derived GR at the suburb of Beijing (range from 4.6 to 8.6 nm h−1) was a little higher than that at Xi’an (range from 3.3 to 6.7 nm h−1), which are generally comparable to typical values in mid-latitude reported in previous studies. The air masses coming from north or northwest China favor the occurrence of NPF event under low condensation sink and clear days. The number size distributions of freshly nucleated particles showed clear bimodal distributions on both sites. Additionally, Mode Dp of nucleated particles at the two sites was 17 ± 1 nm and 22 ± 4 nm, respectively during the periods with NPF events. The case study of NPF events at the two suburb sites shows that the surface area concentration and total scattering coefficient (SC) was significant decreased during the NPF events at both sites. High temperature, low condensation sink and low relative humidity furthered the occurrence of NPF events, and wind direction shifts were important for the subsequent growth of particles. NPF events in the suburbs of Beijing usually occurred when relative humidity (RH) < 55%, CS < 0.02 s−1, or 55% < RH < 68%, CS < 0.01 s−1. However, there is no clear range for Xi’an. Furthermore, we observed that some NPF events occurred at higher RH and very low CS in this study on both sites, which means that low CS may be more important than low RH for the particle formation on clear days.

1. Introduction

Atmospheric aerosol particles play an important role in the earth’s radiative balance through absorption and scattering of the incoming radiation. The aerosol particles exert their influence in several ways, partially through the indirect climate effect by acting as cloud condensation nuclei (CCN) or ice nuclei (IN) changing the characteristics and life-time of clouds. Meanwhile the size distribution and concentration of the aerosol particles, together with their composition and so on, affect the visibility and human health through inhalation [1,2,3,4,5,6,7]. The atmospheric particles are produced directly (primary particles) by anthropogenic (traffic, cooking, industry etc.) and natural sources (seas prays, volcanic eruptions and forest fires) [8,9,10] or are formed from gas precursors (secondary particles) [11,12,13]. Kulmala et al. [14] showed that the secondary particle formation and condensation growth of nanoparticles are key processes that determine the dynamics of atmospheric aerosols.
New particle formation (NPF) is an important source of atmospheric aerosols, and is a key factor for influencing the properties of aerosol particles. New particles are formed by nucleation of non-volatile or low-volatile gas-phase compounds, emitted from either biogenic or anthropogenic sources, followed by growth into small particles. The laboratory studies have shown the main five nucleation mechanisms in the atmosphere [15], including binary nucleation of H2SO4–H2O [16], ternary nucleation of H2SO4–H2O involving ammonia amines [17], nucleation of H2SO4–H2O assisted by organic acids [18], nucleation of iodine oxides [19] and ion-induced nucleation [20]. The formation of new particles in the atmosphere and its effects on the budget of the number concentration of submicron particles are a vital issue in atmospheric science [20]. Fortunately, it is readily easy to find the new particle formation (NPF) events and growth from the measurements of particle size distributions. Typical particle growth rates range from 1 to 20 nm h−1 in mid-latitudes depending on the temperature and the availability of condensable vapors [21]. It has been reported that sulfuric acid plays a dominant role in new particle formation and growth [22,23], the increase of non-methane hydrocarbon may play an important role in the growth of freshly nucleated particles at the urban site [24], and organic compounds have also been thought to have a potential role [25,26]. Condensation and coagulation are also important for new particle formation events. The nucleation mechanisms are dependent on the gas chemical composition, meteorological parameters, the presence of specific organic and inorganic compounds, the gas molecule ionization factor, and the total particle number concentration. The NPF events also influence the deposition rate [27,28], and during nucleation events there was an increase in particle deposition.
New particle formation events and particle size distribution have been observed at many sites around the world, in Europe and North America, e.g., Birmingham [29], Atlanta [30], Helsinki [31], Leipzig [32,33], and Pittsburgh [34], and Aspvreten, Sweden [35]. During recent years, efforts have been made to characterize particle number size distributions and NPF events in developing countries as well, because their air pollution problems are of significant local and even regional concern, such as in New Delhi, Pune and Kanpur [36,37]. In China, the systematic analysis for NPF events and particle size distribution are conducted at some locations, such as urban and rural sites of Beijing [38,39,40], Pearl River Delta [41,42], Yangtze River Delta [43,44,45,46,47], Shandong [48], Shanghai [49], and Lanzhou [50] and Xi’an [51]. All these observations reveal that NPF is a common phenomenon that can occur in clean and polluted environments, but the nucleation and growth property of the process vary by a great margin due to the difference of the precursors and the complexity of the meteorological conditions. Furthermore, most of the available measurements have been done in forests and rural sites and the information in urban and suburban sites is relative limited. Therefore, we measured particle size distributions in the diameter range of 10–487 nm at a Beijing suburb in June 2013. In addition, we conducted analogous measurements at a Xi’an suburb in May 2014 by using the same equipment. The objective of this study is to compare NPF characteristics at two distinct suburb locations.

2. Site, Measurements and Methods

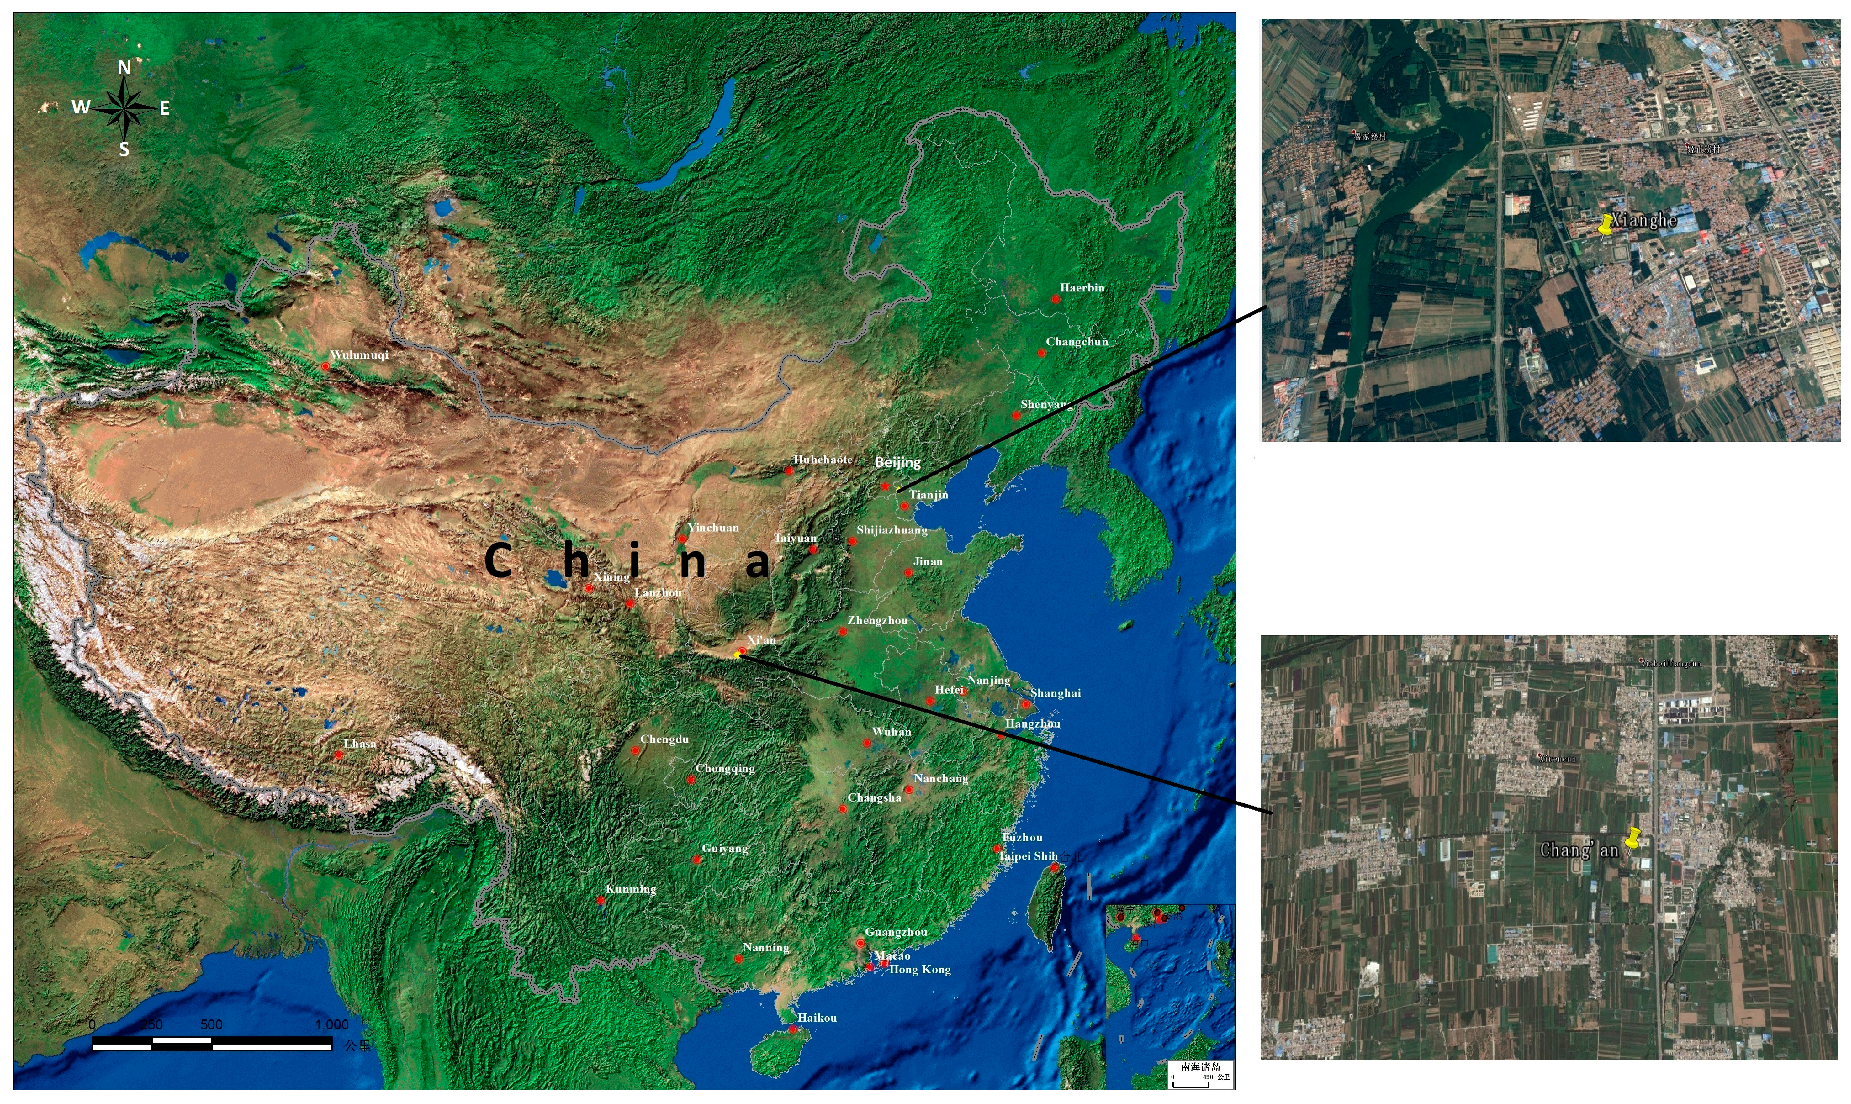
2.1. Description of the Measurement Site

Measurements were made at two distinct suburbs of Beijing from 1 June to 2 July 2013, and Xi’an from 1 to 26 May 2014 in north China (Figure 1). The observations of NPF have recently been reported from Beijing [38,39,40] and Xi’an [51].
The measurement site of Xi’an is located at Chang’an national meteorological observation station (34.09° N, 108.55° E) (Figure 1), approximately 20 km away from the downtown center. No local emission sources are located within a radius of 500 m, which includes two country roads and a small village to the east and north edge, highway to the south located about 5 km away from the site, farmland, a small piece of ginkgo and poplar forest to the west. Qinling Mountains lies about 16 km on the south of the station.
The site of Beijing is located at Xianghe (39.75° N, 116.96° E), in a mainly plain area, 70 km southeast of Beijing (Figure 1). It is a comprehensive atmospheric and environmental observation station under the direction of the Institute of Atmospheric Physics, Chinese Academy of Sciences. It is surrounded by agricultural land and densely populated residences with low buildings. No large factories are in this area.

2.2. Observational Instruments

The Observational instrument is TSITM Scan Mobility Particle Sizer (SMPS, TSI model 3034/N3087, TSI Inc., St. Paul, MN, USA). Its measuring range is 10–487 nm. Sample inlets were installed at 4 m height above ground level. Ambient air was drawn through an Environmental Sampling System (Model 3031200, TSI Inc., St. Paul, MN, USA) which consists of a PM1 cyclone inlet with a flow rate of 16.7 L per minute (LPM) and dryer before being introduced to the SMPS. Sample flow and sheath flow rates were 1.0 LPM and 4.0 LPM, respectively. Based on the particle transmission efficiency given by Model 3031200, 82% at 25 nm, 87% at 40 nm, 93% at 60 nm, 97% at 150 nm and 100% at 300 nm, the method of logarithmic function fitting was used to get the particle transmission efficiency from 10 nm to 500 nm, which subsequently was employed to estimate its influence on particle size distribution and concentration. The estimated losses caused by transmission efficiency would be 10% for the total particle number concentration. Although these losses slightly affect the observed size distribution, it does influence the concentrations. The particle number size distributions were measured continuously with a time resolution of 5 min. In this study, raw data, not corrected with the transmission efficiency were hourly, daily and monthly averaged and used to analyze the characteristics of aerosol size distribution.
An integrating nephelometer (model 3563, TSI Inc., St. Paul, MN, USA) was used to measure the scattering and backscattering coefficients of aerosol particles at 450, 500 and 700 nm with a sampling interval of 5 min. All measurements have undergone strict quality control.

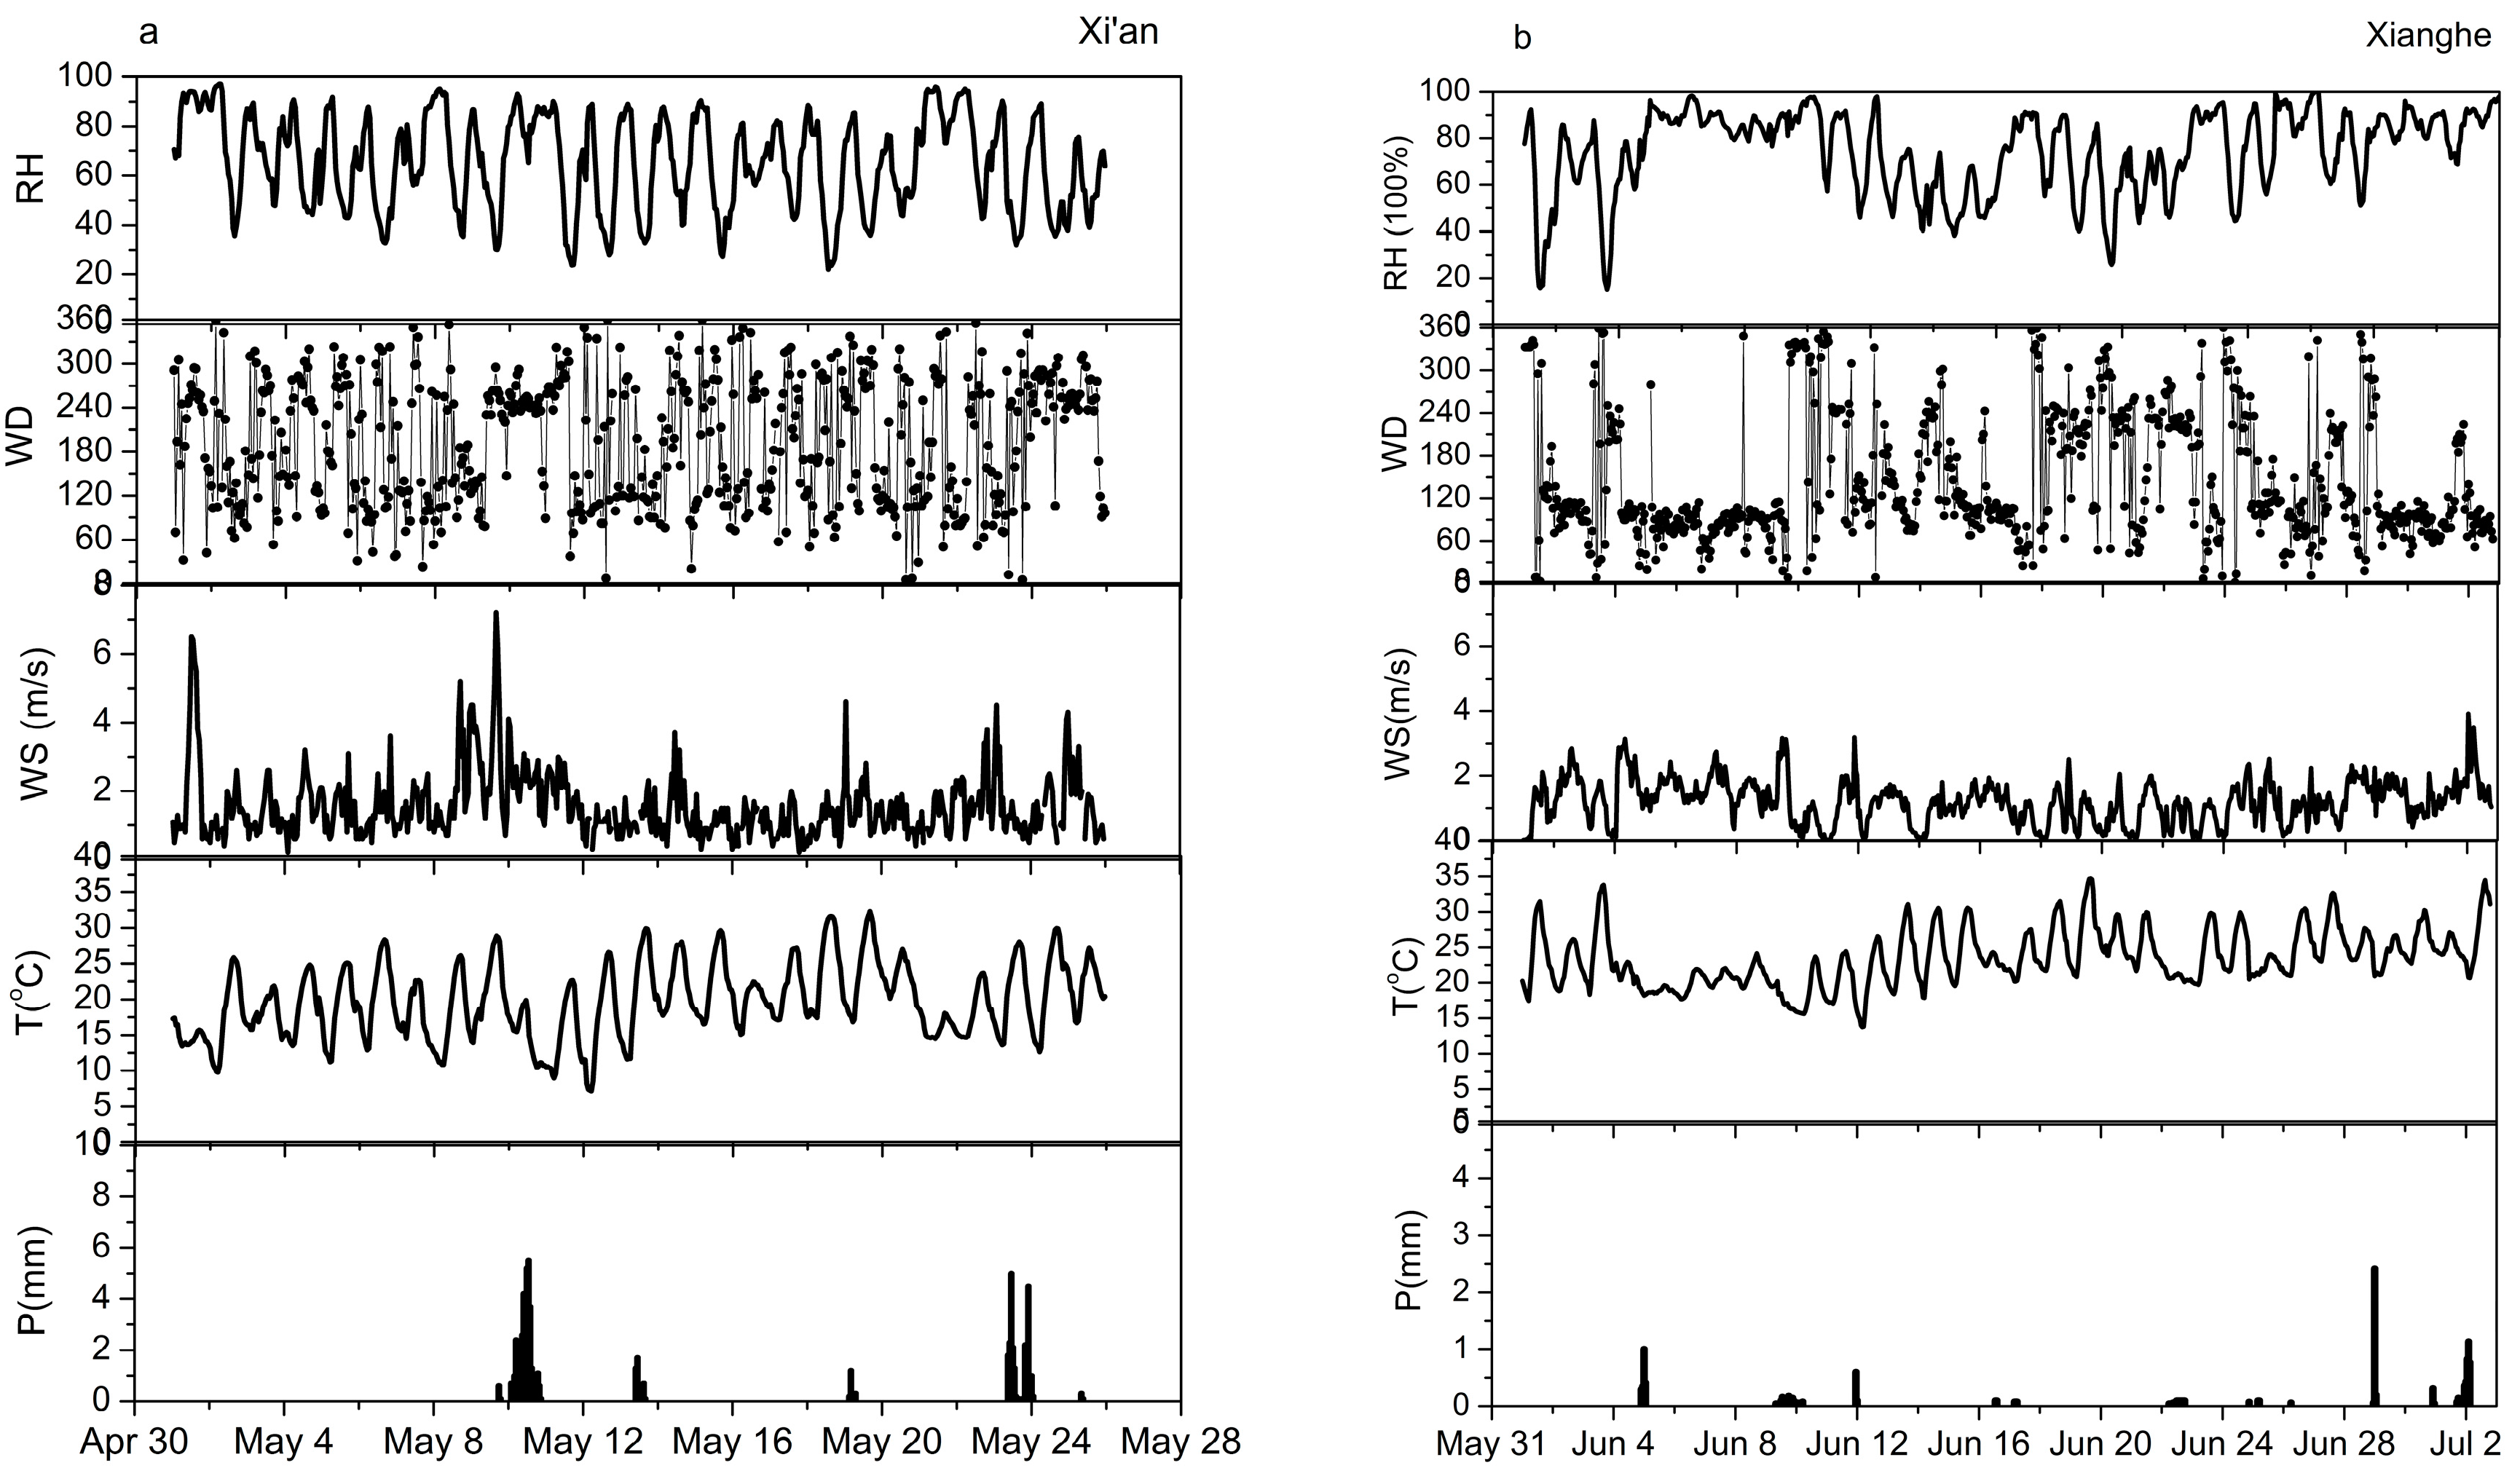
2.3. Meteorological Conditions

The meteorological data were also obtained at two sites by using an automatic weather transmitter (WXT-510 produced by Vaisala at Beijing, and CAWS3000 by Huayun at Xi’an). Hourly averaged data (Figure 2) were used in this study. Average ambient temperature ranged from 7.2 to 32.4 °C with an average of 19.7 °C during the Xi’an campaign, was a little lower than that during the Beijing campaign, which ranged from 13.7 to 34.7 °C with an average of 23.5 °C, and also RH was a slightly lower at Xi’an than at Beijing. The dominant local wind direction was westerly/easterly and easterly at the suburb of Xi’an and Beijing. The wind speed ranged from 0.2 to 7.2 m s−1 with an average of 1.5 m s−1 at the suburb of Xi’an, while, it ranged from 0 to 3.9 m s−1 with an average of 1.2 m s−1 at the suburb of Beijing.

2.4. Classification of New Particle Formation Events

In this study, particle number size distributions were assumed to have a three modal structure, a nucleation mode (10–30 nm, NNUC), an Aitken mode (30–100 nm, NAIT), and an accumulation mode (100–487 nm, NACC) [47,52]. The term “ultrafine size range’ (10–100 nm, NUFP) was used to define particles with a diameter below 100 nm (nucleation plus Aitken modes). The total number concentration (NTOT) means particle number within 10–487 nm.
New particle formation (NPF) event is generally defined as a two-phase process involving the burst of nucleation mode particles and the growth of these particles into Aitken or accumulation mode by condensation and/or coagulation [23,53]. Based on precious studies [23,53,54,55], a NPF event in this study was defined as a sharp increase in the NNUC/NUFP ratios of >0.5 with elevated NUFP [26] and observed for at least 30 min. An additional criterion was the possibility to quantify basic characteristics such as the particle growth rate (GR), which is defined by the gradient of Mode Dp during a NPF event.
The NPF events were commonly classified into two main classes:
Class I: The GR rates can be determined with a good confidence level, and particle diameters grew to approximately 40–50 nm or larger after the burst of nucleation mode particles.
Class II: NPF events for which the determination of the GR was not possible or the accuracy of the results was questionable, and subsequent growth of freshly nucleated particles did not occur.
The days when no new particles were formed were classified as “non-event”.

2.5. Condensation Sinks

The condensation sink (CS) indicates how rapidly condensable vapors will condense on pre-existing particles. The CS can be calculated by integrating or summing over a particle size spectrum [n(Dp)] as follows [14,53]:
CS = 2 π D 0 D p β M ( D p ) n ( D p ) d D p = 2 π D i β M D p i N i
where D is the diffusion coefficient, Dpi is the particle diameter of a particle in size class i, Ni is the particle concentration in the respective size class. βM is the transitional regime correction factor, and typically calculated using the expression given by Fuchs and Sutugin [56]. In this study, we calculated the CS from 10 to 500 nm.

3. Results and Discussion

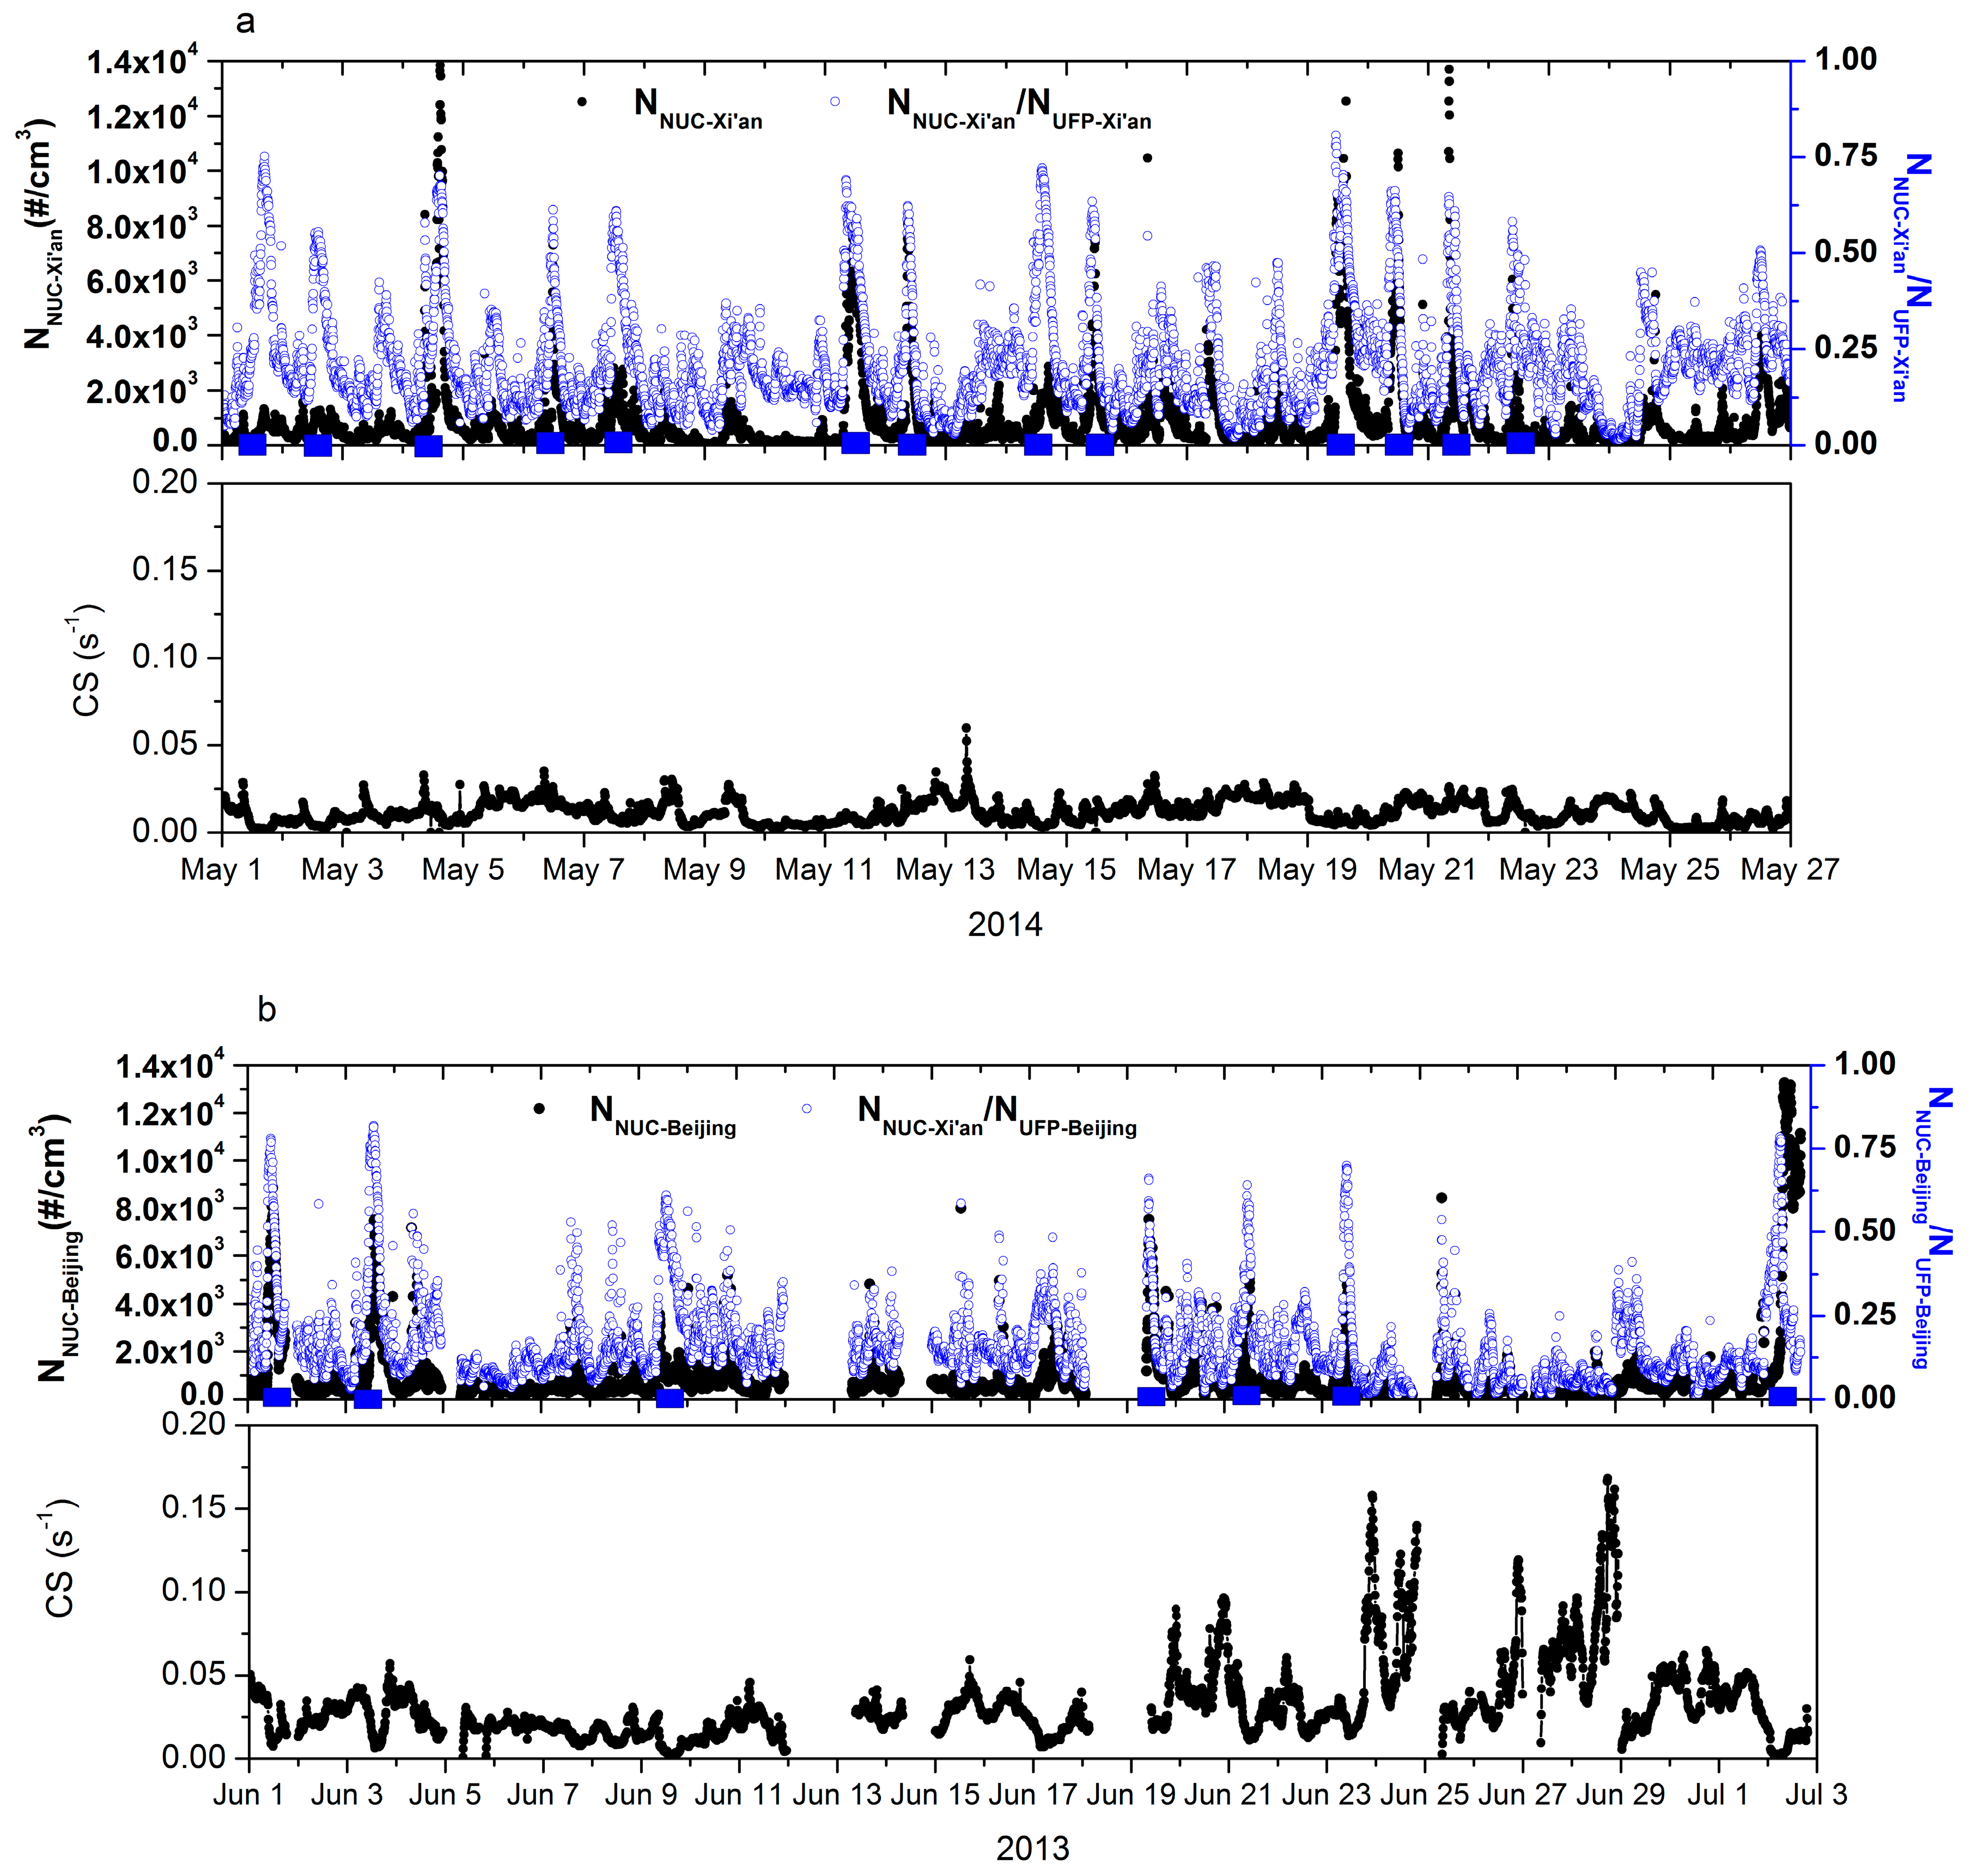
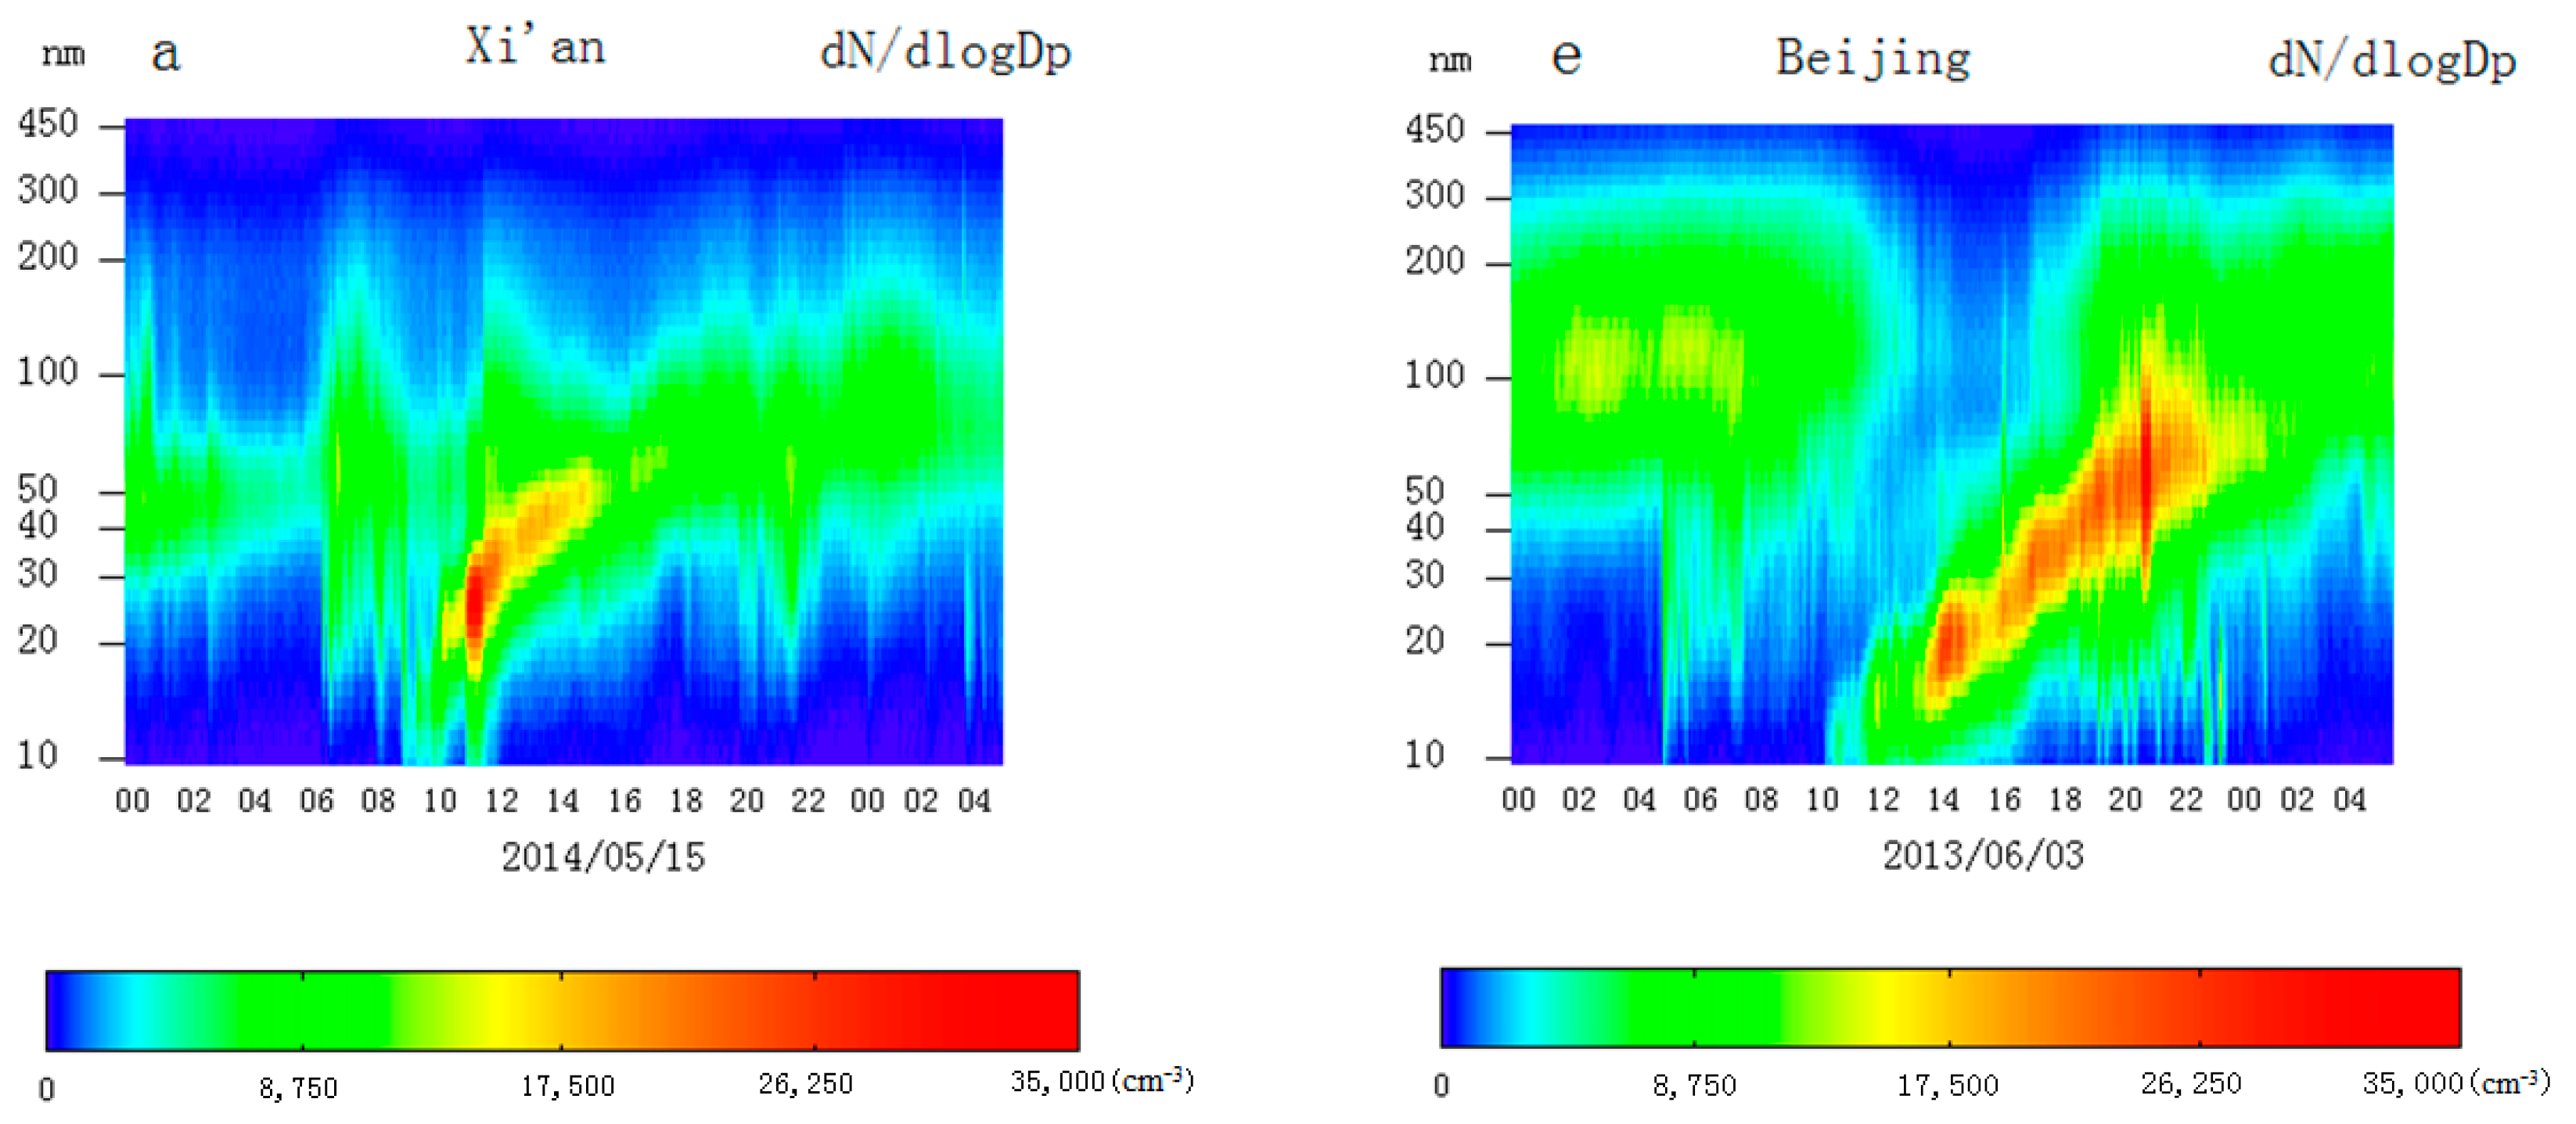
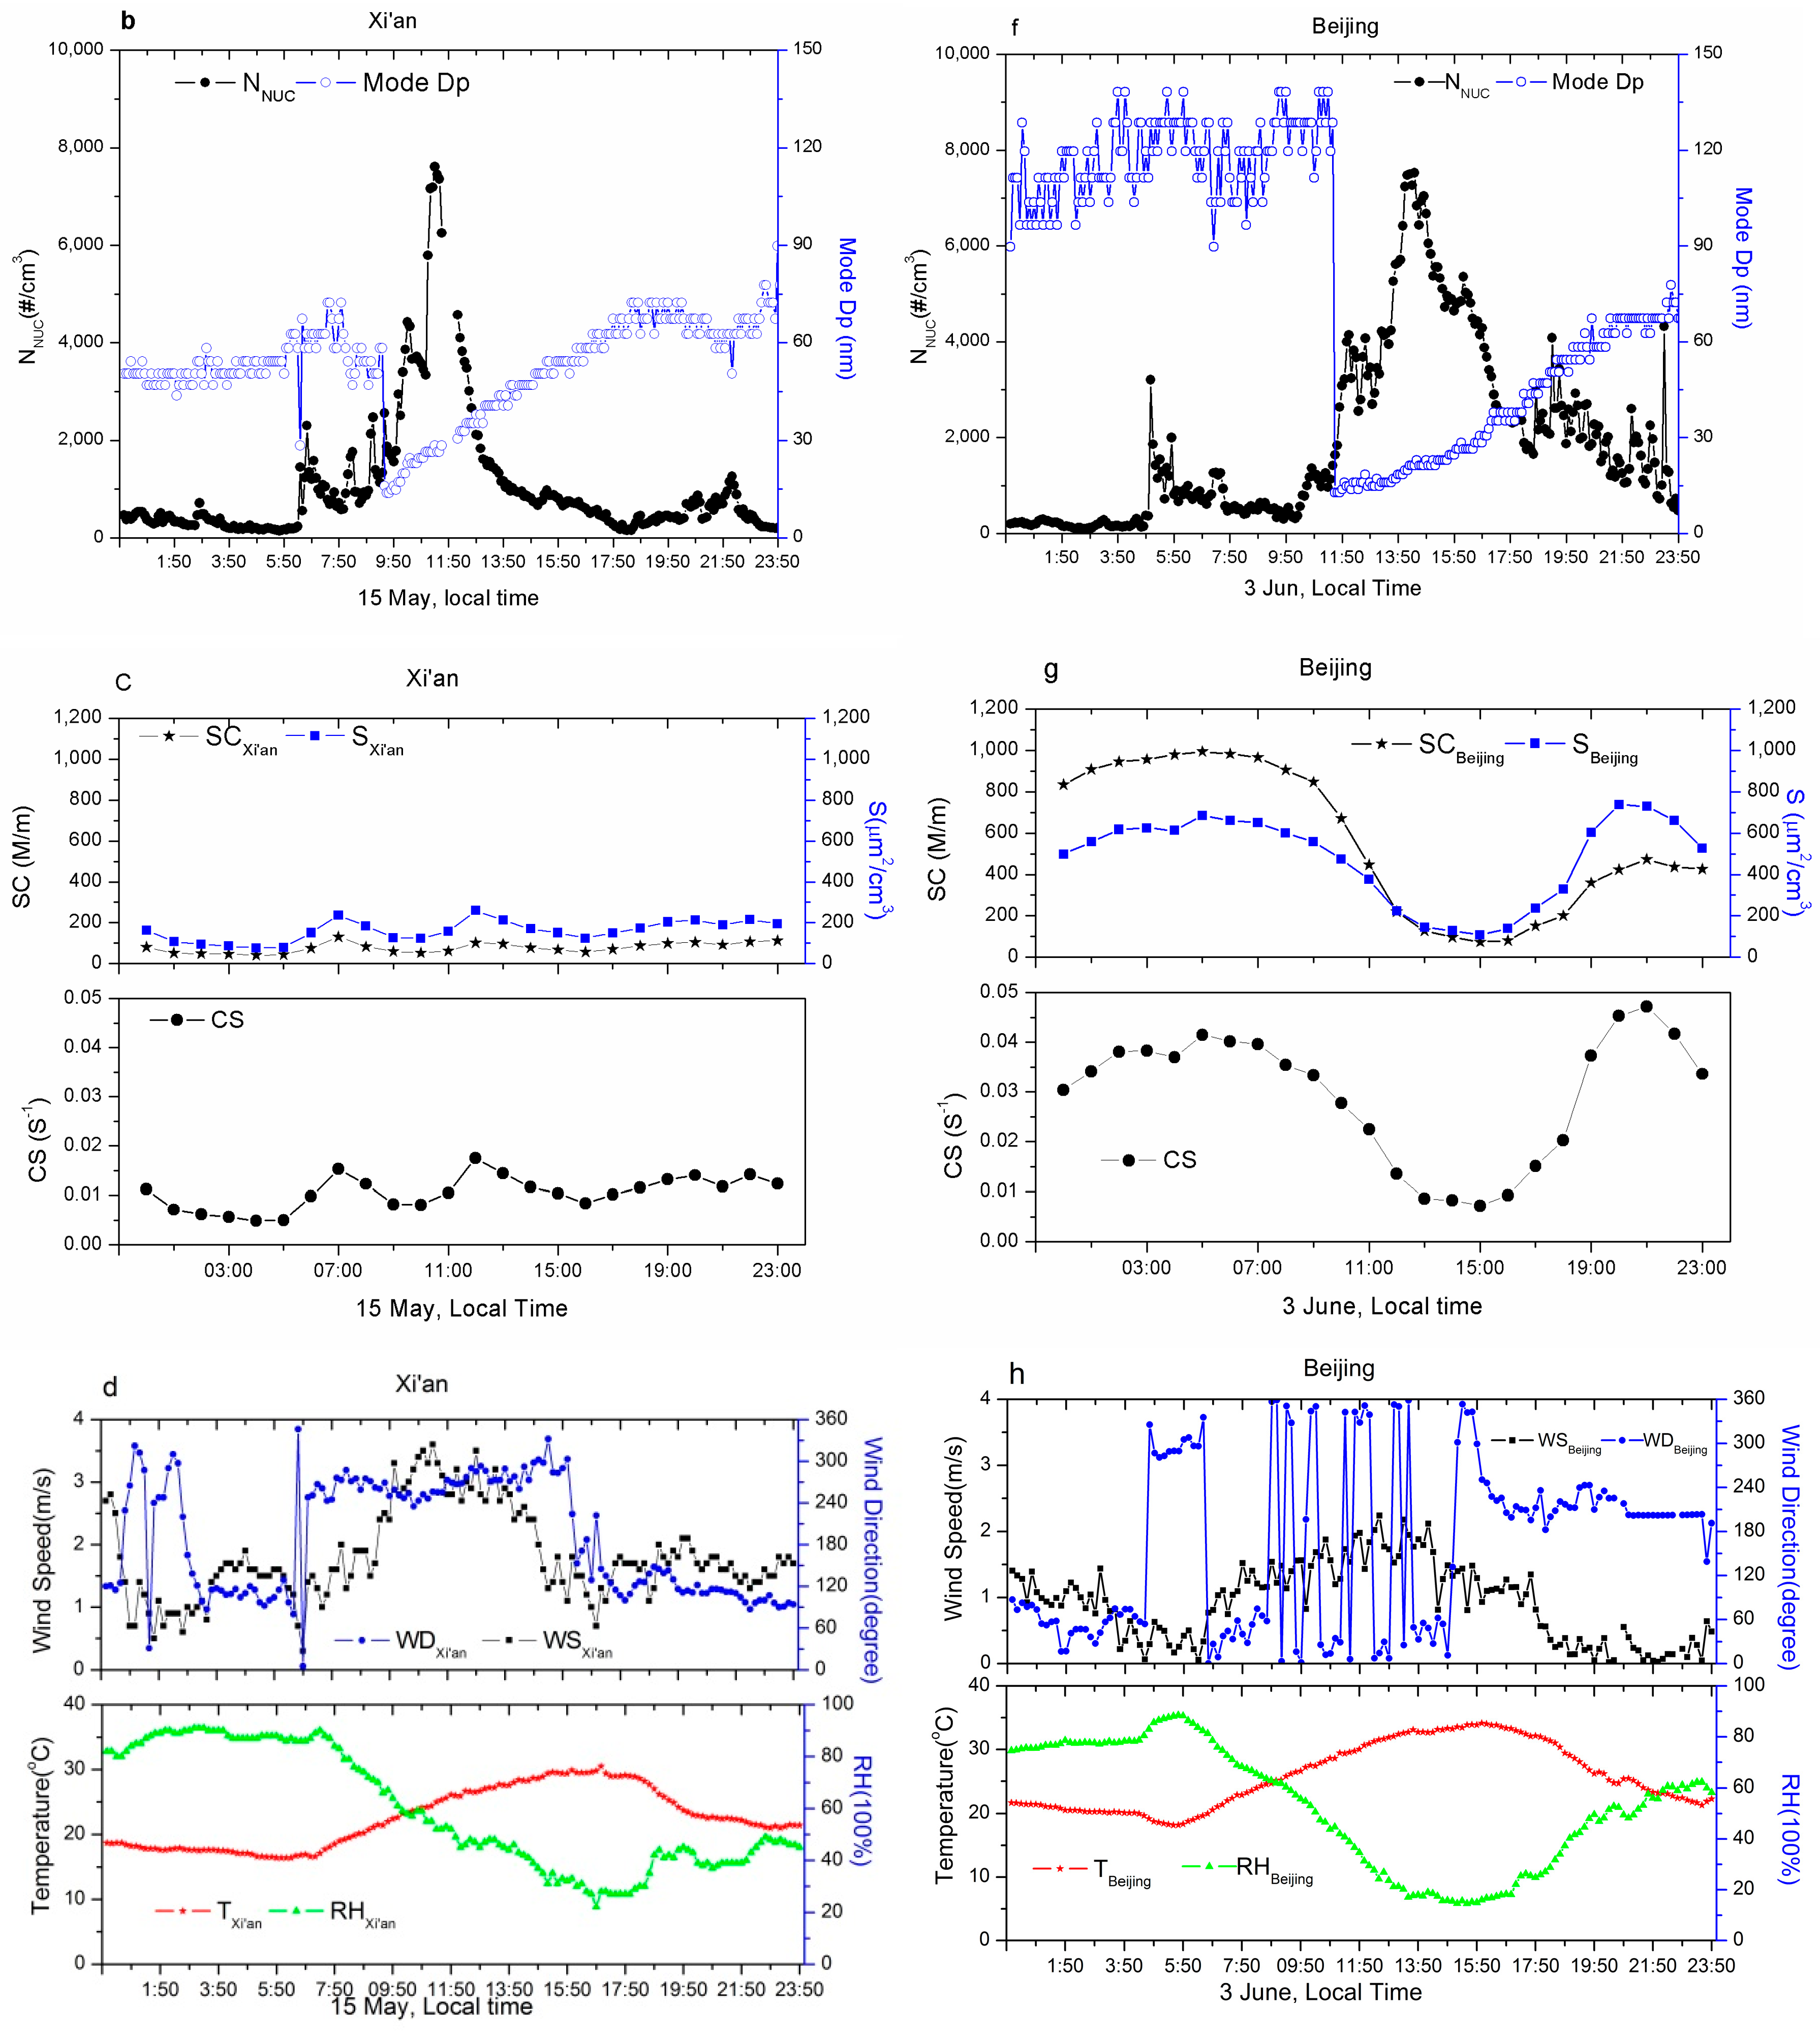
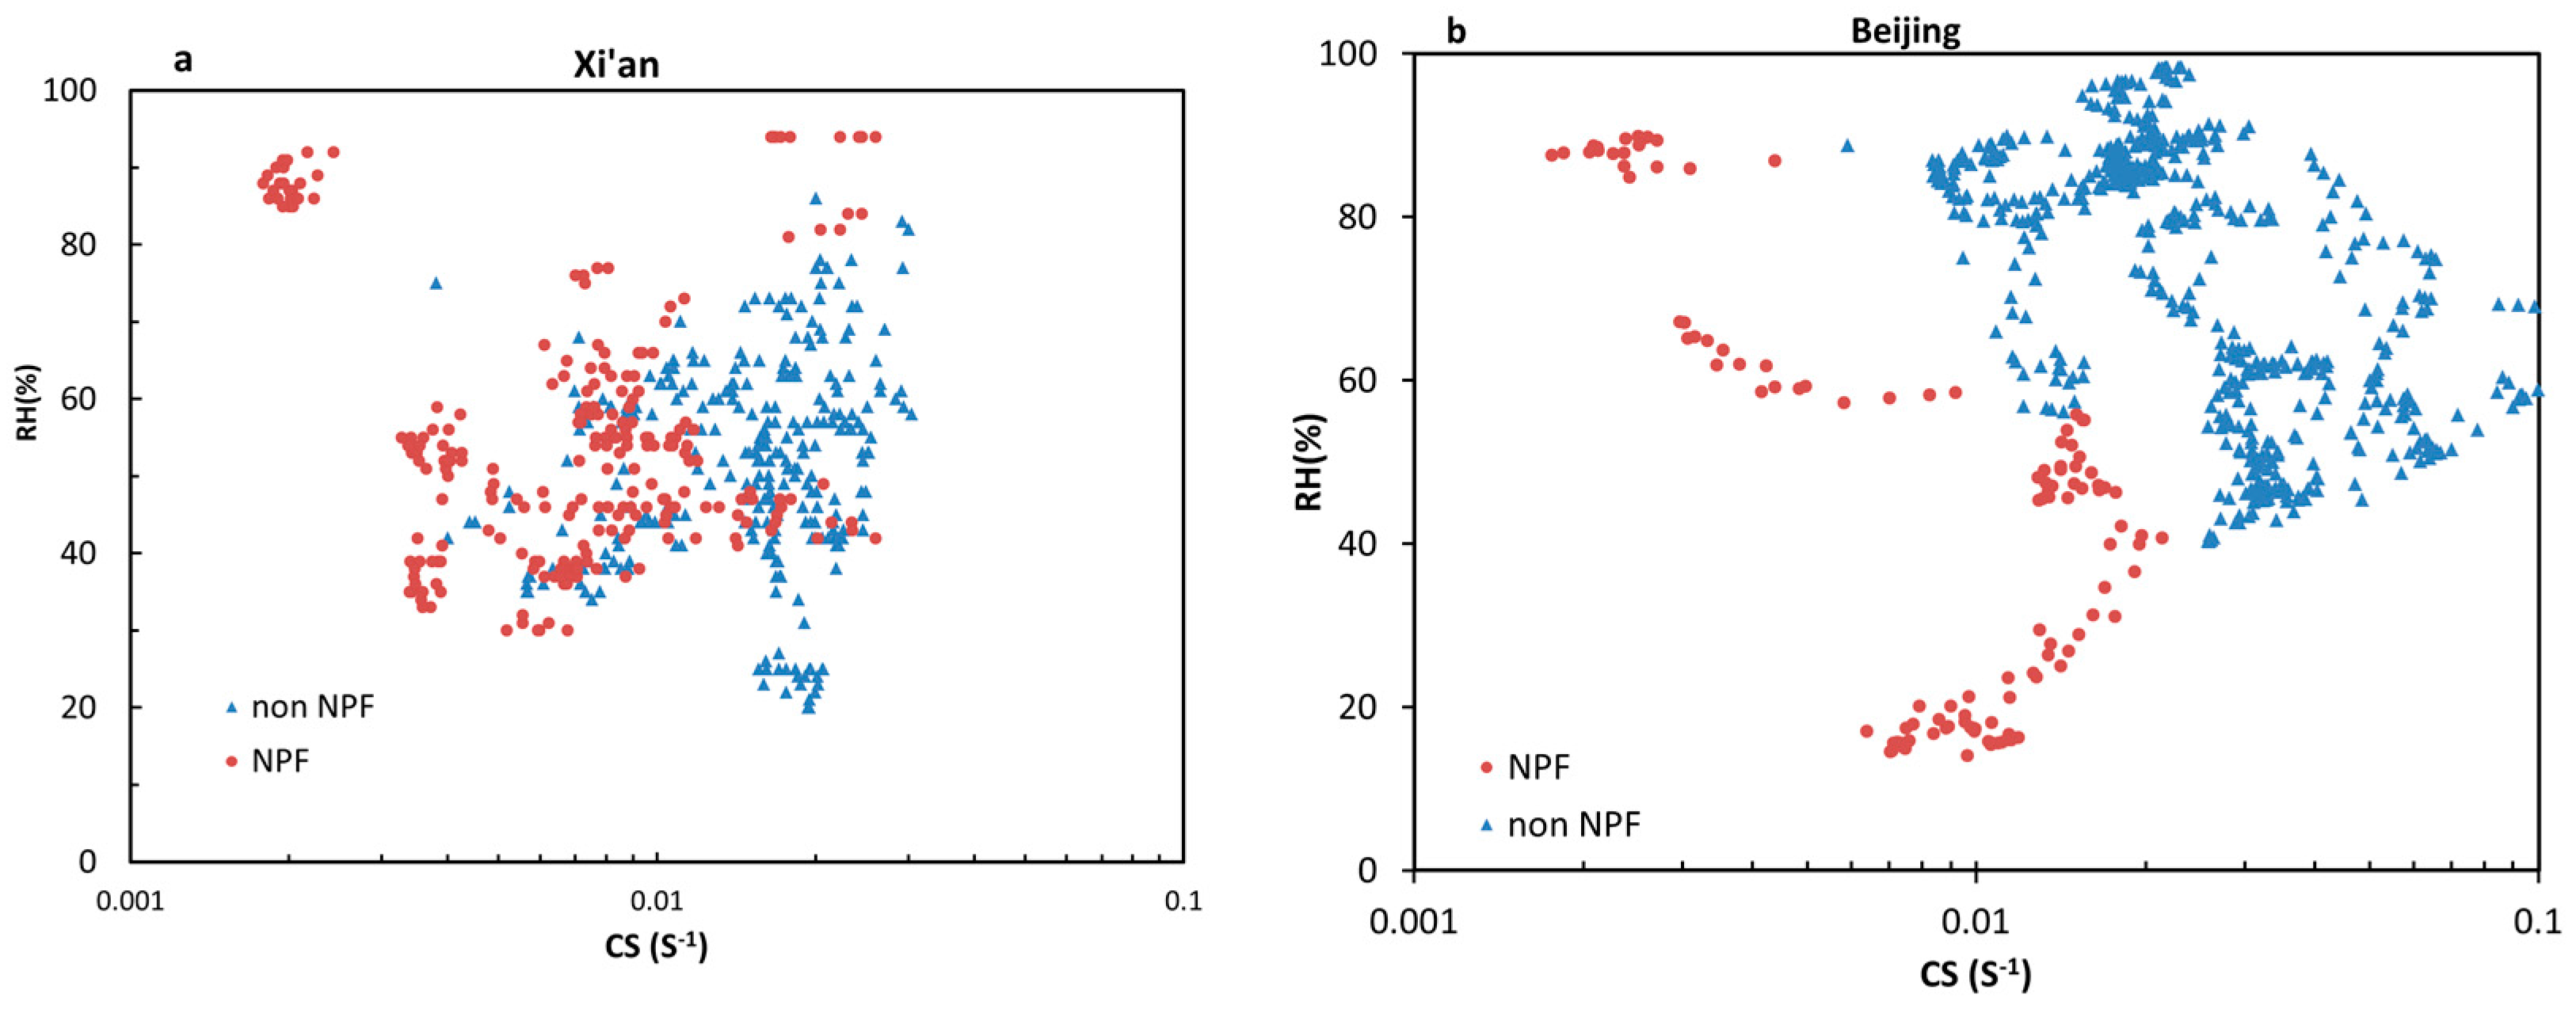
3.1. Particle Size Distributions and NPF Events at the Suburb of Xi’an and Beijing

Table 1 gives the arithmetic mean, standard deviation, median, minimum and maximum of NNUC, NAIT, NACC, NUFP, CS, and Mode Dp. NNUC at suburban site of Xi’an was 872 ± 1324 cm−3, a little higher than that at suburban site of Beijing, which was 855 ± 998 cm−3. Particles in Aitken mode were predominant in both sites, the NACC and NUFP were lower at the site of Xi’an, 1314 ± 783 cm−3 and 3373 ± 2525 cm−3 respectively, than that at the site of Beijing, 3923 ± 3140 cm−3 and 5120 ± 2673 cm−3 respectively. The NTOT in suburb of Beijing was about 2 times higher than in Xi’an, and mainly predominate by the particles larger than 30 nm (90.6% for suburb of Beijing, 81.4% for the suburb of Xi’an). The previous study at Shangdianzi, another suburb site of Beijing, also shows the similar concentration of the three modes in May and June. The higher number concentration of Aitken and Accumulation modes in the suburb of Beijing could be due to elevated anthropogenic sources (e.g., biomass/biofuel burring and cooking aside from traffic emissions around the village). Furthermore, the CS was also much higher at the suburban site of Beijing, with an average of 0.0311 ± 0.023 s−1, to that at the site of Xi’an, 0.0113 ± 0.006 s−1, especially during the biomass burning process observed on 10, 20, 24 and 26 June over this region (Figure 3b), the highest value of CS reached 0.1503 s−1. The mean and standard deviation of the particle mode diameter at suburban site of Beijing was 89 ± 30 nm, which is about 1.4-fold higher than that at Xi’an, 67 ± 29 nm.
A total of 13 NPF events (about 50% of the total observation day) were observed out of 26 observation days at Xi’an (Figure 3a). For the suburban site of Beijing, the occurrence of NPF events was 7 days (about 24% of the total observation day) (Figure 3b). Compared with the previous study at urban [57] and rural site [40] of Beijing, the occurrence of NPF events in Xi’an was similar as that in May at urban site of Beijing and lower than that at rural site of Beijing, while for the frequency of NPF events of Beijing in this study, it was similar as that observed in June in 2008 at Shangdianzi [40], but much lower than that observed in June 2009 at Shangdianzi [40] and in June 2004 at urban site of Beijing [57]. One important reason is that the CS is much higher observed in June in the suburbs of Beijing in this study; a higher condensation sink will prevent the occurrence of NPF events. Moreover, the NPF frequency in the suburbs of Xi’an was comparable to that in other urban areas in the spring months such as Kanpur and Pune [37], Pittsburgh [34] and in the summer months in southeastern Italy [27]. While for the site of Beijing it was a little lower.
Based on NPF classification scheme, the 13 NPF events at the suburban site of Xi’an can be broken into 10 days of Class I, 3 days of Class II, and 13 non-event days. At the site of Beijing, 4 days of Class I, 3 days of Class II, and 22 non-event days. The burst of nucleation mode particles at the suburban site of Xi’an typically started in the morning and noon (07:15–15:25 LST. Table 2). The burst of nucleation mode particles at the suburban site of Beijing typically started in the morning (07:30–12:50 LST. Table 3). The GR for all observed NPF events at both sites was showed in Table 2 and Table 3. The GR ranged from 3.3 to 6.7 nm h−1 for Xi’an, with a mean and standard deviation of 4.8 ± 1.4 nm h−1 (Table 2), whereas it ranged from 4.6 to 8.6 nm h−1, with a mean and standard deviation of 6.6 ± 1.5 nm h−1 at Beijing (Table 3). Similar to the reported growth rate in other sites: i.e., range of 3.6–7.4 nm h−1 (6.4 ± 1.6 nm h−1) in the Yangtze River delta, China in summer [49], 0.3 to 14.5 nm h−1 (average 4.3 nm h−1) in Shangdianzi, suburb of Beijing, China [40] and 1.79–7.78 nm h−1 (average 4.6 nm h−1) in Brisbane, Australia in spring-winter [58], and 1.28 to 16.97 nm h−1 (average 4.4 nm h−1) Lanzhou [50], 3.4–13.3 nm h−1 at Kanpur and Pune in India [37], but slightly lower compared to that observed at Pearl River Delta (4.0–22.7 nm h−1) [59], Gaul Pahari in India (11.6–18.1 nm h−1) [60].
Average number size distributions of freshly nucleated particles at the two sites were obtained from data collected over a one hour period from the beginning of the burst of nucleation mode particles as shown in Figure 4 (for 6, 22 May 2014 and 19 June 2013 it is from the beginning of NPF events to the ending). Average number size distributions of freshly nucleated particles at the suburb of Xi’an showed clear bimodal distributions with one peaks centered at 10–30 nm (Figure 4a) and another in the Aitken mode. The number size distributions of freshly nucleated particles at the suburb of Beijing showed one peaks centered at 10–30 nm but additional peaks were often observed in the Accumulation mode (Figure 4b), resulting in relatively broad particle number size distributions compared to the suburb of Xian. The size distribution on 19 June was a little different with other NPF events, there was a peak value at 40 nm which maybe related to local emissions. The Mode Dp of freshly nucleated particles in the suburbs of Xi’an ranged from 17 nm to 28 nm with an average of 22 ± 4 nm (Figure 4c and Table 2) whereas those in the suburbs of Beijing ranged from 15 nm to 18 nm with an average of 17 ± 1 nm (Figure 4d and Table 3).
Peak number concentrations of nucleation and Aitken mode particles of NPF events at the two sites are summarized in Table 2 and Table 3. Peak NNUC at the suburb of Xi’an ranged from 1268 to 14,478 cm−3 with an average of 7235 ± 4430 cm−3, whereas peak NAIT ranged from 507 to 8751 cm−3 with an average of 6069 ± 5249 cm−3 (Table 2 and Figure 4c). Lower peak number concentrations were at the suburban site of Beijing, 1770–9927 cm−3 (average 6534 ± 2567 cm−3) for NNUC and 1608–4016 cm−3 (average 2935 ± 903 cm−3) for NAIT (Table 3 and Figure 4d).
The condensation sink during the NPF events at the suburbs of Xi’an and Beijing is shown in Table 2 and Table 3, the average value of CS was 0.0093 ± 0.0054 and 0.0091 ± 0.0053 separately, which 7 was lower than that at Shangdianzi [40] and urban site of Beijing [57]. This means that for the two suburban sites of this study the occurrence of the NPF events needed a lower condensation sink.
In order to study the influence of air mass on NPF events, the sources of air masses for all the observation days of the two sites were simulated by the Hybrid Single Particle Lagrangian Integrated Trajectory (HYSPLIT) model [61]. The backward trajectories were calculated for 24 h at 12:00 (LST) and at 500 m above the two observational sites (Figures not shown here). The result shows that for the observation days, the air mass from northwest direction was about 46.2%, from south direction was 46.2% for the suburb of Xi’an. While for the suburb of Beijing, the air mass at observation period was about 62.1% from south direction and only 27.6% from north directions. Previous studies have shown that air masses from north or northwest China favor the occurrence of NPF events at the suburb of Xi’an [51] and Beijing [40] and the air mass from southern directions was relatively pollutant which would enhance the condensation sink of observed stations [40]. The higher frequency of air mass from the relative pollutant direction may be the main reason of lower frequency of the suburbs of Beijing in this study. While in this study we found that in some cases of air mass from northwest direction, there was no NPF events occurred. In addition, the study of relative meteorological factors and condensation sink shows that these cases were regular with high value of condensation sink, or without solar radiation. Based on previous research, the occurrence of the NPF events in north China needs solar radiation, relatively clear air mass from north or northwest China, low relative humidity and low condensation sink.

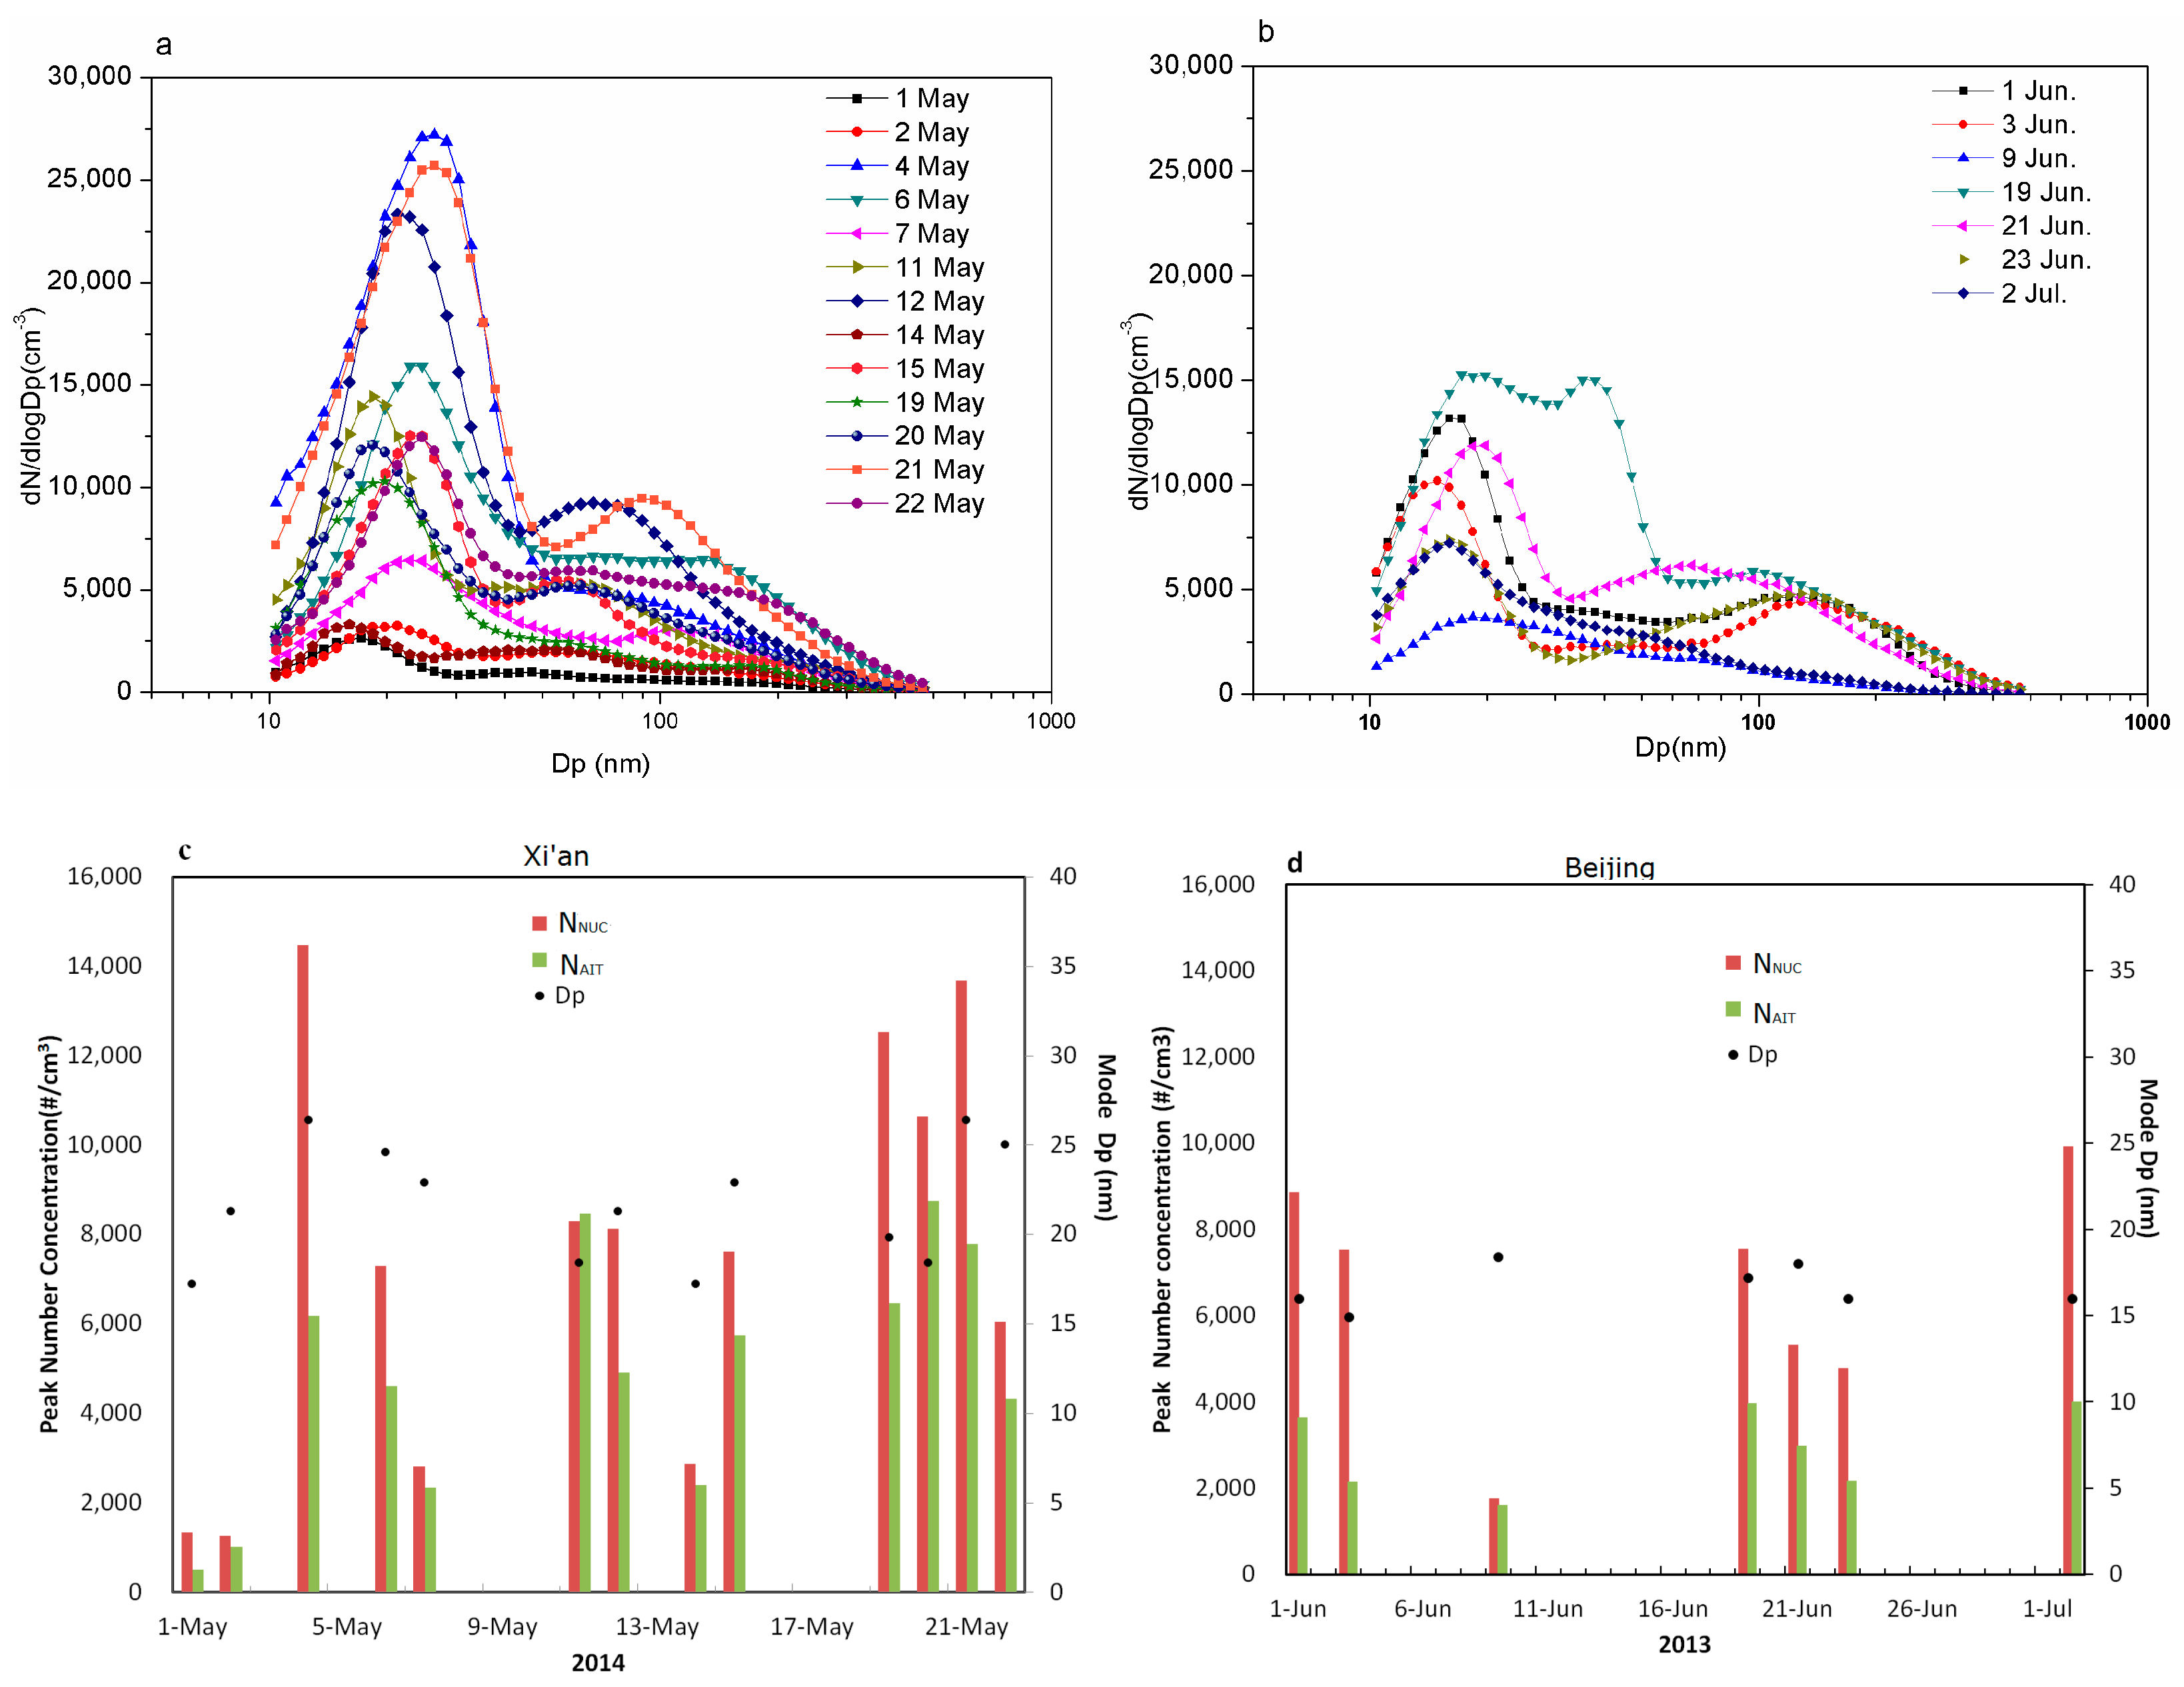
3.2. Characteristics of NPF Events at Two Suburban Sites: Case Study

Figure 5 shows the typical NPF events observed at the suburb of Xi’an (15 May 2014) and Beijing (3 June 2013), and the five-min evolution of particle size distributions, NNUC, Mode Dp, hourly time evolution of scattering coefficient, total surface area concentration and CS, and ten-minutes evolution of air temperature (T), relative humidity (RH), wind speed (WS) and wind direction (WD) on the respective event days. For these events, particle size distributions displayed a burst of ultrafine particles and a sustained growth in size (Figure 5a,b,e,f), and thus appearing as a conventional noontime “banana-shaped” size growth. These traditional “banana” events are typically observed when NPF occurs over a large spatial scale, indicative of regional NPF event [62]. These typical events occurred at about 09:30 LST at the suburb of Xi’an and 11:35 LST at that of Beijing. The NNUC increased sharply from 2588 to 7608 cm−3 in about two hours at Xi’an site and for Beijing from 967 to 7479 cm−3 in about three hours. Interestingly, for the two sites, with the increasing of Mode Dp, there was an increase of wind speed and shifts of wind direction; for Xi’an from west to south-east while for Beijing from north to south, which means the controlling air mass was changed.
A simultaneous decrease of total surface area concentration and total scattering coefficient at 450, 500 and 700 nm (here only a variation of 450 nm is shown) was observed at the suburb of Beijing during the NPF events. They reached the minimum value, 108.3 μm2/cm3 and 73.6 M/m, respectively, when the NNUC reached maximum, 7479 cm−3.While for the suburb of Xi’an, the surface area concentration and scattering coefficient was much lower than that of Beijing, and the minimum value of them occurred at 10:00 LST, which was 80.1 μm2/cm3 and 52.5 M/m, respectively, not at the peak of NNUC, which was at 11:20 LST. One possible reason is that the NPF events mainly occurred under clear, relatively clean and dry conditions [63], the relatively clean air mass will decrease the pre-existing relative large particles which have a large surface area. Another reason was that during NPF events, particles mainly gathered at small particles which have a relative small surface area. Thus, during the two NPF events observed in north China, there was a decrease in total surface area concentration and total scattering coefficient.
Pre-existing particles can act as a sink for condensable organic or inorganic vapors of low volatility and for initially nucleated clusters of 1–2 nm particles, thus inhibiting a burst of nucleation mode particles [21]. To examine the effect of the pre-existing particles on a nucleation burst event, the average CS during NPF event at two suburban sites was calculated. The variation in condensation sinks during NPF events was similar at the two sites. CS showed a significant reduction before the start of NPF and steadily decreased reaching a minimum at the end of NPF events, then increased. The CS was larger in Beijing site than that of Xi’an. At about 7:00 LST, the CS was 15.3 × 10⁻³ s−1 and 39.6 × 10⁻³ s−1 at Xi’an and Beijing, and at the start of NPF events, the value of CS decreased to 8.21 × 10⁻³ s−1 and 19.3 × 10⁻³ s−1, respectively. It appears that sufficiently reducing pre-existing particles was due to the occurrence of the NPF event at the suburb of Beijing and Xi’an. A sustained growth in size at the two suburban sites was continued to midnight, particles reaching ~70 nm for the two sites. For these events, the mean GR were 6.1 nm/h and 4.6 nm/h, respectively.
Studies have suggested that the occurrence of NPF is linked to condensation sink (its increase prevents NPF), a product of SO2 and solar radiation (its increase favors NPF via H2SO4 production) and the relationship between the RH and condensation sink [34,64]. For NPF event days, these parameters were chosen over a particular time period when a nucleation event was taking place. However, they were chosen from 8:00 to 16:00 LST on non-event days (here non-event days do not include rain and cloudy days). These parameters were then calculated at 10 min time interval for both event types. Figure 6 shows scatter plot of CS versus RH during the NPF and non-event days at both sites. For the suburb of Xi’an, there was no clear distinction between NPF and non-event days, while for the suburb of Beijing, NPF events usually occurred when RH < 55% and CS < 0.02 s−1, or 55% < RH < 68% and CS < 0.01 s−1. Low CS and low RH values favor the occurrence of the NPF events on clear days at both sites. While the result shows that a few NPF events occurred at low CS and high RH (mainly after rainfall), which means that low condensation sink had more impact on particle formation than low RH.

4. Conclusions

Particle size distribution and NPF events were studied using Scan Mobility Particle Sizer at suburb of Xian and Beijing, two distinct suburban sites in northern China. Total particle number concentration at the suburb of Beijing was about two times higher than those observed at Xi’an, and the mean value of mode diameter at suburb of Beijing was 89 nm, which is about 1.4-fold higher than that at Xi’an (67 nm). Moreover, the condensation sink of Beijing during the observed period was also 2.7-fold higher compared to that at Xi’an, which suggest that the anthropogenic sources of larger aerosol particles (e.g., biomass/biofuel burning and cooking, besides the traffic emissions) was much higher at suburban site of Beijing. High CS suppressed the occurrence of NPF events. The frequency of NPF events at suburb of Beijing was only 24%, much lower than that in Xi’an (50%). Also lower than another suburb of Beijing (over 50% in June) and urban site of Beijing (35% in June).
The burst of nucleation mode particles at the two sites typically started in the daytime. The NPF events with (Class I) or without (Class II) subsequent growth after the burst of nucleation mode particles were both observed at the two suburb sites. The derived GR at the suburb of Beijing (range from 4.6 to 8.6 nm h−1) was a little higher than that at Xi’an (range from 3.3 to 6.7 nm h−1), which were also comparable to typical values reported in mid-latitudes. The air masses coming from north or northwest China favor the occurrence of NPF event under low condensation sinks and clear days. The number size distributions of freshly nucleated particles showed clear bimodal distributions at both sites, with one peak at 10–30 nm and additional peaks were often observed in the Aitken mode at suburb of Xi’an and in Accumulation mode in suburbs of Beijing. The Mode Dp of nucleated particles at the two sites was 17 ± 1 nm and 22 ± 4 nm, respectively during the periods with NPF events.
The case study of NPF events at the two suburb sites shows that the surface area concentration and total scattering coefficient (SC) was significant decreased during the NPF events at both sites. High temperature, low condensations sink and low relative humidity favored the occurrence of NPF events, and wind direction shifting was important for the subsequent growth of particles.
An examination of NPF and non-event days at the two sites indicated that lower CS and lower RH were the most favorable conditions for NPF to occur. Low RH is related to sunny days with strong radiation, which favor the formation of OH [65], and a low RH will decrease the condensation sink by slowing the hygroscopic growth [66]. In this study, NPF events in suburb of Beijing usually occurred when RH < 55%, CS < 0.02 s−1, or 55% < RH < 68%, CS < 0.01 s−1. While no clear range for Xi’an. Furthermore, we also observed some NPF events occurred at higher RH and very low CS in this study at both sites, which means that low CS was more favor particle formation than low RH under clear day. However, the solar radiation, SO2, O3 and other gas-phase pollutants were absent here, so dedicated long-term NPF and chemical observations are crucial and required over northern China, which has been largely unstudied so far.

Acknowledgments

This work was jointly supported by the National Natural Science Foundation of China (41375155), the National Key Research and Development Program of China (2016YFA0601904) and the National Natural Science Foundation of China (41572150).

Author Contributions

This work was completed with the collaboration of all the authors. Xingmin Li and Xiaodong Liu designed the study and plan the measurement. Yan Dong, Chuang Chen and Zipeng Dong performed the measurement and collected the data. Yan Peng and Jin Dai performed most of the post processing. All authors contributed to the interpretation of data and reviewed and commented on the paper.

Conflicts of Interest

The authors declare no conflict of interest.

References

  1. Sokolik, I.N.; Toon, O.B. Direct radiative forcing by anthropogenic airborne mineral aerosols. Nature 1996, 381, 681–683. [Google Scholar] [CrossRef]
  2. O’Dowd, C.D. Biogenic coastal aerosol production and its influence on aerosol radiative properties. J. Geophys. Res. 2001, 106, 1545–1549. [Google Scholar] [CrossRef]
  3. Jung, C.H.; Kim, Y.P. Numerical estimation of the effects of condensation and coagulation on visibility using the moment method. J. Aerosol Sci. 2006, 37, 143–161. [Google Scholar] [CrossRef]
  4. Samet, J.M.; Dominici, F.; Curriero, F.C.; Coursac, I.; Zeger, S.L. Fine particulate air pollution and mortality in 20 U.S. Cities, 1987–1994. N. Engl. J. Med. 2000, 343, 1742–1749. [Google Scholar] [CrossRef] [PubMed]
  5. Lippmann, M.; Ito, K.; Nffadas, A.; Burnett, R.T. Association of Particulate Matter Components with Daily Mortality and Morbidity in Urban Populations; Research Report 95; Health Effects Institute: Cambridge, MA, USA, 2000. [Google Scholar]
  6. Peters, A.; Wichmann, H.E.; Tuch, T.; Heinrich, J.; Heyder, J. Respiratory effects are associated with the number of ultrafine particles. Am. J. Respir. Crit. Care Med. 1997, 155, 1376–1383. [Google Scholar] [CrossRef] [PubMed]
  7. Penttinen, P.; Timonen, K.L.; Tiittanen, P.; Mirme, A.; Ruuskanen, J.; Pekkanen, J. Number concentration and size of particles in urban air: Effects on spirometric lung function in adult asthmatic subjects. Environ. Health Perspect. 2001, 109, 319–323. [Google Scholar] [CrossRef] [PubMed]
  8. Clarke, A.D.; Owens, S.R.; Zhou, J. An ultrafine sea-salt flux from breaking waves: Implications for cloud condensation nuclei in the remote marine atmosphere. J. Geophys. Res. 2006, 111, D06202. [Google Scholar] [CrossRef]
  9. Mordas, G.; Prokopciuk, N.; Byčenkienė, S.; Ulevicius, V. Optical properties of the urban aerosol particles obtained from ground-based measurements and satellite-based modeling studies. Adv. Meteorol. 2015, 2015, 898376. [Google Scholar] [CrossRef]
  10. O’Dowd, D.; Facchini, M.C.; Cavalli, F.; Ceburnis, D.; Mircea, M.; Decesari, S.; Fuzzi, S.; Yoon, Y.J.; Putaud, J.P. Biogenically-driven organic contribution to marine aerosol. Nature 2004, 431, 676–780. [Google Scholar] [CrossRef] [PubMed]
  11. Kulmala, M. Atmospheric science: How particles nucleate and grow. Science 2003, 302, 1000–1001. [Google Scholar] [CrossRef] [PubMed]
  12. Kumar, P.; Robins, A.; Vardoulakis, A.; Quincey, P. Technical challenges in tackling regulatory concerns for urban atmospheric nano particles. Particuology 2011, 9, 566–571. [Google Scholar] [CrossRef] [Green Version]
  13. Oberdörster, G.; Oberdörster, E.; Oberdörster, J. Nanotoxicology: An emerging discipline evolving from studies of ultrafine particles. Environ. Health Perspect. 2005, 113, 823–839. [Google Scholar] [CrossRef] [PubMed]
  14. Kulmala, M.; DalMaso, M.; Mäkelä, M.; Pirjola, M.; Väkevä, M.; Aalto, P.P.; Miikkulainen, P.; Hämeri, K.; O’Dowd, C.D. On the formation, growth and composition of nucleation mode particles. Tellus 2001, 53, 479–490. [Google Scholar] [CrossRef]
  15. Zhang, R.; Khalizov, A.; Wang, L.; Hu, M.; Xu, W. Nucleation and growth of nanoparticles in the atmosphere. Chem. Rev. 2011, 112, 1957–2011. [Google Scholar] [CrossRef] [PubMed]
  16. Kulmala, M.; Laaksonen, A.; Pirjola, L. Parameterizations for sulfuric acid/water nucleation rates. J. Geophys. Res. 1998, 103, 8301–8307. [Google Scholar] [CrossRef]
  17. Korhonen, P.; Kulmala, M.; Laaksonen, A.; Viisanen, Y.; McGraw, R.; Seinfeld, J.H. Ternary nucleation of H2SO4, NH3; H2O in the atmosphere. J. Geophys. Res. 1999, 104, 26349–26353. [Google Scholar] [CrossRef]
  18. Odum, J.R.; Jungkamp, T.P.; Griffin, R.J.; Flagan, R.C.; Seinfeld, J.H. The atmospheric aerosol-forming potential of whole gasoline vapor. Science 1997, 276, 96–99. [Google Scholar] [CrossRef] [PubMed]
  19. Holmes, N.S. A review of particle formation events and growth in the atmosphere in the various environments and discussion of mechanistic implications. Atmos. Environ. 2007, 41, 2183–2201. [Google Scholar] [CrossRef] [Green Version]
  20. Seinfeld, J.H.; Pandis, S.N. Atmospheric Chemistry and Physics; John Wiley and Sons, Inc.: New York, NY, USA, 2007. [Google Scholar]
  21. Kulmala, M.; Vehkamäki, H.; Petäjä, T.; Dal Maso, M.; Lauri, A.; Kerminen, V.M.; Birmili, W.; McMurry, P.H. Formation and growth rates of ultrafine atmospheric particles: A review of observations. J. Aerosol Sci. 2004, 35, 143–176. [Google Scholar] [CrossRef]
  22. Boy, M.; Kulmala, M.; Ruuskanen, T.M.; Pihlatie, M.; Reissell, A.; Aalto, P.P.; Keronen, P.; Dal Maso, M.; Hellen, H.; Hakola, H.; et al. Sulphuric acid closure and contribution to nucleation mode particle growth. Atmos. Chem. Phys. 2005, 5, 863–878. [Google Scholar] [CrossRef]
  23. Riipinen, I.; Sihto, S.-L.; Kulmala, M.; Arnold, F.; Dal Maso, M.; Birmili, W.; Saarnio, K.; Teinil¨a, K.; Kerminen, V.-M.; Laaksonen, A.; et al. Connections between atmospheric sulfuric acid and new particle formation during QUEST III–IV campaigns in Heidelberg and Hyytiälä. Atmos. Chem. Phys. 2007, 7, 1899–1914. [Google Scholar] [CrossRef]
  24. Jung, J.; Miyazaki, Y.; Kawamura, K. Different characteristics of new particle formation between urban and deciduous forest sites in Northern Japan during the summers of 2010–2011. Atmos. Chem. Phys. 2013, 13, 51–68. [Google Scholar] [CrossRef]
  25. Zhang, K.M.; Wexler, A.S. A hypothesis for growth of fresh atmospheric nuclei. J. Geophys. Res. 2002, 107, 4577. [Google Scholar] [CrossRef]
  26. Barsanti, K.C.; McMurry, P.H.; Smith, J.N. The potential contribution of organic salts to new particle growth. Atmos. Chem. Phys. 2009, 9, 2949–2957. [Google Scholar] [CrossRef]
  27. Conte, M.; Donateo, A.; Dinoi, A.; Belosi, F.; Contini, D. Case Study of Particle Number Fluxes and Size Distributions during Nucleation Events in Southeastern Italy in the summer. Atmosphere 2015, 6, 942–959. [Google Scholar] [CrossRef]
  28. Held, A.; Klemm, O. Direct measurement of turbulent particle exchange with a twin CPC eddy covariance system. Atmos. Environ. 2006, 40, S92–S102. [Google Scholar] [CrossRef]
  29. Harrison, R.M.; Jones, M.; Collins, G. Measurements of the physical properties of particles in the urban atmosphere. Atmos. Environ. 1999, 33, 309–321. [Google Scholar] [CrossRef]
  30. Woo, K.S.; Chen, D.R.; Pui, D.; McMurry, P. Measurements of Atlanta aerosol size distributions: Observations of ultrafine particle events. Aerosol Sci. Technol. 2001, 34, 75–87. [Google Scholar] [CrossRef]
  31. Hussein, T.; Puustinen, A.; Aalto, P.P.; Mäkelä, J.M.; Hämeri, K.; Kulmala, M. Urban aerosol number size distributions. Atmos. Chem. Phys. 2004, 4, 391–411. [Google Scholar] [CrossRef]
  32. Birmili, W.; Wiedensohler, A.; Heintzenberg, J.; Lehmann, K. Atmospheric particle number size distribution in central Europe: Statistical relations to air mass and meteorology. J. Geophys. Res. 2001, 32, 5–18. [Google Scholar] [CrossRef]
  33. Wehner, B.; Wiedensohler, A. Long term measurements of submicrometer urban aerosols: Statistical analysis for correlations with meteorological conditions and trace gases. Atmos. Chem. Phys. 2003, 3, 867–879. [Google Scholar] [CrossRef]
  34. Stanier, C.O.; Khlystov, A.Y.; Pandis, S.N. Ambient aerosol size distributions and number concentrations measured during the Pittsburgh Air Quality Study (PAQS). Atmos. Environ. 2004, 38, 3275–3284. [Google Scholar] [CrossRef]
  35. Dal Maso, M.; Sogacheva, L.; Aalto, P.P.; Riipinen, I.; Komppula, M.; Tunved, P.; Korhonen, L.; Suur-Uski, V.; Hirsikko, A.; Kurten, T.; et al. Aerosol size distribution measurements at four Nordic field stations: Identification, analysis and trajectory analysis of new particle formation bursts. Tellus 2007, 59, 350–361. [Google Scholar] [CrossRef]
  36. Laakso, L.; Koponen, I.K.; Mönkkönen, P.; Kulmala, M.; Kerminen, V.-M.; Wehner, B.; Wiedensohler, A.; Wu, Z.J.; Hu, M. Aerosol particles in the developing world: A comparison between New Delhi in India and Beijing in China. Water Air Soil Pollut. 2006, 173, 5–20. [Google Scholar] [CrossRef]
  37. Kanawade, V.P.; Tripathi, S.N.; Siingh, D.; Gautam, A.S.; Srivastava, A.K.; Kamra, A.K.; Soni, V.K.; Virendra, S. Observations of new particle formation at two distinct Indian subcontinental urban locations. Atmos. Environ. 2014, 96, 370–379. [Google Scholar] [CrossRef]
  38. Wu, Z.J.; Hu, M.; Lin, P.; Liu, S.; Wehner, B.; Wiedensohler, A. Particle number size distribution in the urban atmosphere of Beijing, China. Atmos. Environ. 2008, 42, 7967–7980. [Google Scholar] [CrossRef]
  39. Yue, D.L.; Hu, M.; Wu, Z.J.; Wang, Z.B.; Guo, S.; Wehner, B.; Nowak, A.; Achtert, P.; Wiedensohler, A.; Jung, J.S.; et al. Characteristics of aerosol size distributions and new particle formation in the summer in Beijing. J. Geophys. Res. 2009, 114, D00G12. [Google Scholar] [CrossRef]
  40. Shen, X.J.; Sun, J.Y.; Zhang, Y.M.; Wehner, B.; Nowak, A.; Tuch, T.; Zhang, X.C.; Wang, T.T.; Zhou, H.G.; Zhang, X.L.; et al. First long-term study of particle number size distributions and new particle formation events of regional aerosol in the North China Plain. Atmos. Chem. Phys. 2011, 11, 1565–1580. [Google Scholar] [CrossRef] [Green Version]
  41. Liu, S.; Hu, M.; Wu, Z.J.; Wehner, B.; Wiedensohler, A.; Cheng, Y.F. Aerosol number size distribution and new particle formation at a rural/coastal site in Pearl River Delta (PRD) of China. Atmos. Environ. 2008, 25, 6275–6283. [Google Scholar] [CrossRef]
  42. Gong, Y.G.; Hu, M.; Cheng, Y.F.; Su, H.; Yue, D.G.; Liu, F.; Wiedensohler, A.; Wang, Z.B.; Kalesse, H.; Liu, S.; et al. Competition of coagulation sink and source rate: New particle formation in the Pearl River Delta of China. Atmos. Environ. 2010, 44, 3278–3285. [Google Scholar] [CrossRef]
  43. Xiao, S.; Wang, M.Y.; Yao, L.; Kulmala, M.; Zhou, B.; Yang, X.; Chen, J.; Wang, D.; Fu, Q.; Worsnop, D.; et al. Strong atmospheric new particle formation in winter in urban Shanghai, China. Atmos. Chem. Phys. 2015, 15, 1769–1781. [Google Scholar] [CrossRef]
  44. Du, J.; Cheng, T.; Zhang, M.; Chen, J.; He, Q.; Wang, X.; Zhang, R.; Tao, J.; Huang, G.; Li, X.; et al. Aerosol size spectra and particle formation events at urban Shanghai in Eastern China. Aerosol Air Qual. Res. 2012, 12, 1362–1372. [Google Scholar] [CrossRef]
  45. Herrmann, E.; Ding, A.J.; Kerminen, V.M.; Petäjä, T.; Yang, X.Q.; Sun, J.N.; Qi, X.M.; Manninen, H.; Hakala, J.; Nieminen, T.; et al. Aerosols and nucleation in eastern China: First insights from the new SORPES-NJU station. Atmos. Chem. Phys. 2014, 14, 2169–2183. [Google Scholar] [CrossRef]
  46. Qi, X.M.; Ding, A.J.; Nie, W.; Petäjä, T.; Kerminen, V.; Xie, Y.; Zheng, L.; Manninen, H.; Aalto, P.; Sun, J.; et al. Aerosol size distribution and new particle formation in the western Yangtze River Delta of China: 2 years of measurements at the SORPES station. Atmos. Chem. Phys. 2015, 15, 12445–12464. [Google Scholar] [CrossRef]
  47. Zhu, B.; Wang, H.L.; Shen, L.J.; Kang, H.Q.; Yu, X.N. Aerosol Spectra and New Particle Formation Observed in Various Seasons in Nanjing. Adv. Atmos. Sci. 2013, 30, 1632–1644. [Google Scholar] [CrossRef]
  48. Gao, J.; Wang, J.; Cheng, S.H.; Xue, L.K.; Yan, H.Z.; Hou, L.J.; Jiang, Y.Q.; Wang, W.X. Number concentration and size distributions of submicron particles in Jinan urban area: Characteristics in summer and winter. J. Environ. Sci. 2007, 19, 1466–1473. [Google Scholar] [CrossRef]
  49. Gao, J.; Wang, T.; Zhou, X.H.; Wu, W.S.; Wang, W.X. Measurement of aerosol number size distributions in the Yangtze River delta in China: Formation and growth of particles under polluted conditions. Atmos. Environ. 2009, 43, 829–836. [Google Scholar] [CrossRef]
  50. Gao, J.; Chai, F.H.; Wang, T.; Wang, W.X. Particle number size distribution and new particle formation (NPF) in Lanzhou, Western China. Particuology 2011, 9, 611–618. [Google Scholar] [CrossRef]
  51. Peng, Y.; Liu, X.D.; Dai, J.; Wang, Z.; Dong, Z.P.; Dong, Y.; Chen, C.; Li, X.M.; Zhao, N.; Fan, C. Aerosol size distribution and new particle formation events in the suburb of Xi’an, northwest China. Atmos. Environ. 2017, 153, 194–205. [Google Scholar] [CrossRef]
  52. Sorribas, M.; de la Morena, B.A.; Wehner, B.; López, J.F.; Prats, N.; Mogo, S.; Wiedensohler, A.; Cachorro, V.E. On the sub-micron aerosol size distribution in a coastal-rural site at El Arenosillo Station (SW–pain). Atmos. Chem. Phys. 2011, 11, 11185–11206. [Google Scholar] [CrossRef] [Green Version]
  53. Dal Maso, M.; Kulmala, M.; Riipinen, I.; Wagner, R.; Hussein, T.; Aalto, P.; Lehtinen, E.J. Formation and growth rates of fresh atmospheric aerosols: Eight years of aerosol size distribution data from SMEARII, Hyytiälä, Finland. Boreal Environ. Res. 2005, 10, 323–336. [Google Scholar]
  54. Park, K.; Park, J.Y.; Kwak, J.H.; Cho, G.N.; Kim, J.S. Seasonal and diurnal variations of ultrafine particle concentration in urban Gwangju, Korea: Observation of ultrafine particle events. Atmos. Environ. 2008, 42, 788–799. [Google Scholar] [CrossRef]
  55. Watson, J.G.; Chow, J.C.; Park, K.; Lowenthal, D.H. Nanoparticle and ultrafine particle events at the Fresno supersite. J. Air Waste Manag. Assoc. 2006, 56, 417–430. [Google Scholar] [CrossRef] [PubMed]
  56. Fuchs, N.A.; Sutugin, A.G. Highly Dispersed Aerosol. In Topics in Current Aerosol Research; Hidy, G.M., Brock, J.R., Eds.; Pergamon: New York, NY, USA, 1971. [Google Scholar]
  57. Wu, Z.J.; Hu, M.; Liu, S.; Wehner, B.; Bauer, S.; Ma ßling, A.; Wiedensohler, A.; Petäjä, T.; Dal Maso, M.; Kulmala, M. New particle formation in Beijing, China: Statistical analysis of a 1-year data set. J. Geophys. Res. 2007, 112, D09209. [Google Scholar] [CrossRef]
  58. Cheung, H.C.; Morawska, L.; Ristovski, Z.D. Observation of new particle formation in subtropical urban Environment. Atmos. Chem. Phys. 2011, 11, 3823–3833. [Google Scholar] [CrossRef] [Green Version]
  59. Yue, D.L.; Hu, M.; Wang, Z.B.; Wen, M.T.; Guo, S.; Zhong, L.J.; Wiedensohler, A.; Zhang, Y.H. Comparison of particle number size distributions and new particle formation between the urban and rural sites in the PRD region, China. Atmos. Environ. 2013, 76, 181–188. [Google Scholar] [CrossRef]
  60. Mönkkönen, P.; Koponen, I.K.; Lehtinen, K.E.J.; Hämeri, K.; Uma, R.; Kulmala, M. Measurements in a highly polluted Asian mega city: Observations of aerosol number size distribution, modal parameters and nucleation events. Atmos. Chem. Phys. 2005, 5, 57–66. [Google Scholar] [CrossRef]
  61. Draxler, R.R.; Rolph, G.D. HYSPLIT (HYbrid Single-Particle Lagrangian Integrated Trajectory) Model Access via Noaa ARL READY Website (http://ready.arl.noaa.gov/HYSPLIT.php); NOAA Air Resources Laboratory: Silver Spring, MD, USA, 2012.
  62. Kulmala, M.; Petäjä, T.; Nieminen, T.; Sipilä, M.; Manninen, H.E.; Lehtipalo, K.; Dal Maso, M.; Aalto, P.P.; Junninen, H.; Paasonen, P.; et al. Measurement of the nucleation of atmospheric aerosol particles. Nat. Protoc. 2012, 7, 1651–1667. [Google Scholar] [CrossRef] [PubMed]
  63. Birmili, W.; Wiedensohler, A. New particle formation in the continental boundary layer: Meteorological and gas phase parameter influence. Geophys. Res. Lett. 2000, 27, 3325–3328. [Google Scholar] [CrossRef]
  64. Hyvönen, S.; Junninen, H.; Laakso, L.; Dal Maso, M.; Grönholm, T.; Bonn, B.; Keronen, P.; Aalto, P.; Hiltunen, V.; Pohja, T.; et al. A look at aeionrosol format using data mining techniques. Atmos. Chem. Phys. 2005, 5, 3345–3356. [Google Scholar] [CrossRef]
  65. Hamed, A.; Joutsensaari, J.; Mikkonen, S.; Sogacheva, L.; Dal Maso, M.; Kulmala, M.; Cavalli, F.; Fuzzi, S.; Facchini, M.C.; Decesari, S.; et al. Nucleation and growth of new particles in Po Valley, Italy. Atmos. Chem. Phys. 2007, 7, 355–376. [Google Scholar] [CrossRef]
  66. Hamed, A.; Korhonen, H.; Sihto, S.L.; Joutsensaari, J.; Jarvinen, H.; Petaja, T.; Arnold, F.; Nieminen, T.; Kulmala, M.; Smith, J.N.; et al. The role of relative humidity in continental new particle formation. J. Geophys. Res. 2011, 116, D03202. [Google Scholar] [CrossRef]
Figure 1. Measurement sites of Xi’an and Beijing (from Google Earth).
Atmosphere 08 00258 g001
Figure 2. Observed meteorological conditions at the suburban site of Xi’an during 1–25 May 2014 (a) and the suburban site of Beijing during 1 June–2 July 2013 (b).
Atmosphere 08 00258 g002
Figure 3. Temporal evolution of NNUC, its ratio to NUFP and the corresponding CS at the suburban site of Xi’an (a) and at the suburban site of Beijing (b). Blue filled rectangles represent new particle formation (NPF) events.
Atmosphere 08 00258 g003
Figure 4. Average number size distributions of freshly nucleated particles at the suburban site of Xi’an (a) and the suburban site of Beijing (b) during the periods with NPF events as well as maximum peak number concentrations of nucleation and Aitken size mode particles and mode peak diameter (Mode Dp) during the periods with NPF events at the suburban site of Xi’an (c) and suburban site of Beijing (d).
Atmosphere 08 00258 g004
Figure 5. NNUC-Xi’an, Mode Dp, Surface area concentration (S), Scattering Coefficient (SC) and Condensation Sink (CS) and surface meteorological elements (wind speed, wind direction, temperature and RH) during the NPF events at the suburban sites of Xi’an (ad) and Beijing (eh).
Atmosphere 08 00258 g005aAtmosphere 08 00258 g005b
Figure 6. Relationship between the relative humidity (RH) and CS during NPF and non-NPF events for Xi’an (a) and Beijing (b).
Atmosphere 08 00258 g006
Table 1. The arithmetic average, standard deviation (S.D.), median, minimum and maximum of particle number concentrations in different size ranges, CS, and Mode Dp at the two suburban sites of Xi’an and Beijing based on hourly averaged data.
ParameterXi’anBeijing
AVG ± S.D.MedianMinMaxAVG ± S.D.MedianMinMax
NNUC (cm−3)872 ± 13244472410,582855 ± 98855738496
NAIT (cm−3)2501 ± 1560219333810,6264265 ± 226137058212,611
NACC (cm−3)1314 ± 783116220151173923 ± 314031555119,855
NUFP (cm−3)3373 ± 2525274836316,3205120 ± 267343498516,735
CS (s−1)0.0113 ± 0.0060.01020.00190.04180.0311 ± 0.0230.02550.00110.150
Mode Dp (nm)67 ± 29641717689 ± 309115189
Table 2. Summary of NPF events at the suburban site of Xi’an from 1 to 25 May in 2014.
DataNucleation (Starting–Ending Time)Mode Dp (nm)Growth Rate (nm/h)Peak Particle Number Concentration * (cm−3)CS (s−1) **
NNUCNAIT
1 May 201415:25–19:25 LST17N/A13395070.0020
2 May 201412:30–15:30 LST213.9126810140.0038
4 May 201413:25–16:25 LST263.314,47861720.0122
6 May 201411:25–12:05 LST256.7729146090.0217
7 May 201411:05–14:10 LST233.3282223480.0074
11 May 201407:25–13:20 LST183.3829184600.0080
12 May 201408:30–10:00 LST215.5811749170.0163
14 May 201412:20–17:10 LST173.3287224020.0039
15 May 201409:30–12:30 LST236.1760857510.0087
19 May 201410:55–16:15 LST20N/A12,52564580.0069
20 May 201408:30–12:05 LST185.810,64087510.0107
21 May 201407:15–08:45 LST26N/A13,69077790.0198
22 May 201409:15–10:00 LST255.1603643310.0216
Max 286.714,47887510.0260
Min 173.312685070.0033
AVG 224.8723560690.0093
S.D. 41.4443052490.0054
* Peak particle number concentration is the highest measurement during the NPF events; ** Condensation sink was average from the starting to ending time during the NPF events.
Table 3. Summary of NPF events at the suburban site of Beijing from 1 June to 2 July in 2013.
DataNucleation (Starting–Ending Time)Mode Dp (nm)Growth Rate (nm/h)Peak Particle Number Concentration (cm−3)CS (s−1)
NNUC-BeijingNAIT-Beijing
1 June 201309:50–13:15 LST166.0885736450.0113
3 June 201311:35–16:30 LST154.6752621510.0103
9 June 201312:50–15:55 LST18N/A177016080.0025
19 June 201310:25–11:10 LST17N/A754339750.0191
21 June 201310:50–12:30 LST.18N/A532529830.0138
23 June 201310:45–13:05 LST167.3478721730.0153
2 July 201307:30–10:10 LST168.6992740160.0047
Max 188.6992740160.0214
Min 154.6177016080.0018
AVG 176.6653429350.0091
S.D. 11.525679030.0053

