Article

On the Implementation of a Regional X-Band Weather Radar Network

1
LaMMA Consortium, via Madonna del Piano 10, Sesto Fiorentino (FI) 50019, Italy
2
CNR IBIMET, Via Giovanni Caproni 8, Firenze 50145, Italy
*
Author to whom correspondence should be addressed.
Atmosphere 2017, 8(2), 25; https://doi.org/10.3390/atmos8020025
Submission received: 5 November 2016 / Revised: 12 January 2017 / Accepted: 19 January 2017 / Published: 26 January 2017
(This article belongs to the Special Issue Radar Meteorology)

Abstract

:
In the last few years, the number of worldwide operational X-band weather radars has rapidly been growing, thanks to an established technology that offers reliability, high performance, and reduced efforts and costs for installation and maintenance, with respect to the more widespread C- and S-band systems. X-band radars are particularly suitable for nowcasting activities, as those operated by the LaMMA (Laboratory of Monitoring and Environmental Modelling for the sustainable development) Consortium in the framework of its institutional duties of operational meteorological surveillance. In fact, they have the capability to monitor precipitation, resolving very local scales, with good spatial and temporal details, although with a reduced scanning range. The Consortium has recently installed a small network of X-band weather radars that partially overlaps and completes the existing national radar network over the north Tyrrhenian area. This paper describes the implementation of this regional network, detailing the aspects related with the radar signal processing chain that provides the final reflectivity composite, starting from the acquisition of the signal power data. The network performances are then qualitatively assessed for three case studies characterised by different precipitation regimes and different seasons. Results are satisfactory especially during intense precipitations, particularly regarding what concerns their spatial and temporal characterisation.

1. Introduction

The increasing frequency of severe weather phenomena is a typical sign of climate change at mid-latitudes. Such phenomena are generally very localised in space, so high precision in monitoring and forecasting is necessary to warn citizens and institutions in a timely manner. Undoubtedly, weather radars are among the most relevant tools for accurately monitoring precipitation events, therefore they are a key instrument for the development of nowcasting and early warning systems. In addition, radar systems have been and still are an indispensable tool for observing weather and increasing the knowledge on precipitation dynamics and hydrometeor statistics [1,2,3,4], subjects of primary interest both in meteorology and in climatology.
A recent report of the World Meteorological Organisation (WMO) [5] states that the number of X-band weather radars in use in WMO member countries has grown to almost 20% of the total counted radars. This increase is a clear signal of the power of an emerging technology that guarantees high observational skills as well as reduced installation and maintenance costs, and that has also been shown to be particularly suitable for mobile radar applications, compared to more widespread systems such as the conventional C- and S-band radars.
Conventional weather radars still offer higher scanning ranges and measurement accuracies than X-band systems, but the latter can provide much higher spatial and temporal resolutions, although over limited spatial domains. Indeed, the use of X-band radar systems for monitoring weather events at very local scales (for small basins or urban areas) has been tested in several sites and different countries [6,7,8,9,10], and the benefits of rainfall characterisation has been clearly assessed [11,12], even if for non-coherent systems. An additional capability comes from the small wavelength of the X-band that increases the sensitivity of the radar system to small raindrops, thus improving light rain detection. Conversely, the strong attenuation during the wave propagation in atmosphere limits the maximum scanning range to a typical distance of 70–80 km (in some cases up to 100 km). Such a limit can be somehow overcome through a network densification. X-band radars can also be suitable for addressing beam blockage problems of C- and S-band long-range radars in areas with complex terrain. For this purpose, it is interesting to mention a study of the US weather radar network [13] that has investigated the possibility of replacing the Next Generation Weather Radar (NEXRAD) network with a much denser and properly organised X-band radar.
The integration of these data with other meteorological observing instruments can significantly improve nowcasting capabilities of operational weather services. In Tuscany these activities are in charge of the LaMMA Consortium (Laboratory of Monitoring and Environmental Modelling for the sustainable development).
LaMMA is a partnership between the regional government of Tuscany (Regione Toscana) and the Italian National Research Council (CNR) (www.lamma.rete.toscana.it). It is the regional meteorological service for Tuscany, and includes the institutional duties of the daily operational meteorological surveillance. It is obvious that the LaMMA is interested in reliable instruments for monitoring weather events at high spatial and temporal resolution, primarily for supporting nowcasting and for the service of early warning alerts for the regional civilian protection.
The Italian operational weather radar network is currently composed of 21 systems, managed by a federation of national and regional bodies including the Department of Civil Protection (DPC), the Air Force, the regional weather services, and the National Aviation Authority. The network is composed of 19 C-band and 2 X-band pulse Doppler radars. In total, 14 of the 21 radars are dual-polarised. Composite products of the Constant Altitude Plan Position Indicator (CAPPI), Vertical Maximum Indicator (VMI), and Surface Rainfall Intensity (SRI) are generated in real time. DPC is responsible for the generation and dissemination of such products at the national level [14,15].
In the framework of two European projects, ResMar (Réseau pour l’Environnement dans l’Espace Maritime) and PROTERINA-Due (La seconde étape pour la protection contre les risques naturels: les investissements sur le territoire), and spin-off activities (under the Cross-Border Cooperation Programme Italy-France “Maritime”), three new X-band radar systems have been installed in Tuscany that cover almost all the regional coasts and partially overlap and complement the existing national radar network. The choice of these systems derived from a balance between the available economic and financial resources and the need for qualitatively valuable observations, related to operational LaMMA nowcasting activities for civil protection purposes.
This paper describes the implementation of this regional X-band network, detailing each step of the radar signal processing chain that generates the final reflectivity products, starting from the acquisition of the signal power data. Section 2 describes the regional X-band radar network and its operational configuration. The signal processing chain is explained in Section 3, with particular attention to the sea and ground clutter identification schemes, and to the 3D spatial data infrastructure and mosaicking procedures. The evaluation of the network performances is presented in Section 4, for an application of the whole signal processing chain to three case studies. Conclusions and future developments are provided in the last section.

2. The X-Band Weather Radar Network in Tuscany

2.1. Set Up of the Radar Systems

The X-band radar system used for the network implementation is the WR10X produced by the ELDES s.r.l company. Three radar systems have been deployed along the Tuscan coastal area. Due to the compact size (90 × 130 cm2) and limited weight (about 100 kg), the system can be installed almost everywhere and the installation requirements are practically reduced based on the availability of electric power (the consumption is less than 300 W on average) and the connectivity for data transfer. The radar transmitter is based on a magnetron cavity and on a solid-state modulator. The receiver is logarithmic in order to avoid amplifier saturation at intermediate frequencies and it has a dynamic range larger than 90 dB. Some general technical specifications of the radar system are shown in Table 1.
With such technical characteristics, a large number of sites can be found that are suitable for the installation without the need of new infrastructure, but with just minor adaptation works.
In Tuscany, the implementation of the network started from the coverage of the coastal areas, because they are periodically lashed by storms coming from the sea, generally with a southwest flow.
The first weather radar has been installed at Cima di Monte, the top of a small isolated mountain of about 470 m high in the western part of Elba Island, funded by the ResMar project. The site is within the protected area of the Tuscan Archipelago National Park, and therefore a number of studies and permissions were mandatory for obtaining the final authorisation to install the radar. Despite some difficulties, the radar has been installed on a pre-existing antenna tower.
The second weather radar has been placed in the port of Livorno on a building of the Port Authority. The latter, which is the owner of the radar, in fact had the need of implementing a local precipitation monitoring system to support the management of the port operations, in particular to guarantee high levels of safety also during heavy rainfall events. In this context, the capability of a radar system to identify the precipitation dynamics is undoubtedly extremely useful. The system is installed on the top of a silo, at an elevation of about 72 m above sea level.
Finally, the third radar has been installed in Castiglione della Pescaia about 25 km north of Grosseto. It has been funded by the PROTERINA-Due project and it is positioned over the local municipality building, at a height of about 15 m.
The configuration of the network offers a good coverage of the Tuscan coastal area and archipelago, providing early detection of precipitations from the sea, which often cause great damage as a consequence of floods and landslides.
For a realistic characterisation of the system capability, the Plan Position Indicator (PPI) geometry has been simulated assuming standard atmospheric conditions [16] and then interconnected with a Digital Terrain Model (DTM). This procedure has been implemented according to the 3D spatial data infrastructure described in Section 3.1. Thus, a visibility percentage (with reference values of 16%, 33%, 50%, 66%, 83%, and with 0% and 100% corresponding respectively to null and full visibility) has been assigned to each volumetric cell, by considering the fraction of beam blockage. The merged visibility of the three radars is shown in Figure 1, and it is characterised by an excellent coverage, also redundant, over the sea and inland.
Each single radar presents some partial or total shading areas: a southern limit due to hills and a number of northern sectors with low visibility towards the Apuan Alps are present for the Livorno radar; the Elba radar, positioned on a local top of an island, ensures a more homogeneous latitudinal coverage, with just two occultation sectors in the south and west directions; the Castiglione della Pescaia radar provides an optimal coverage of the Maremma region (southwestern Tuscany), but is completely blocked in the northerly direction due to orography.

2.2. Real Time Operativity

The operational configuration of the three radar systems has been set in order to complete a scan every 15 min, with synchronised start times. For each scan, the atmospheric scenario is reconstructed through 10 elevations from 0.5° to 5.0° in steps of 0.5°. The maximum selectable range is 108 km allowing the observation of eventual intense phenomena also at the range limit. The best nominal selectable range resolution is 90 m, but this is only allowed for very short ranges (21 km). Due to a technological limit of the system in the data transfer from the receiver to the processing unit (using a serial communication protocol), when the maximum range increases, not all of the acquired signal power samples can be transferred to the processing unit. At the maximum range of 108 km, the range resolution is degraded to 450 m despite a nominal resolution of 90 m, due to the forced subsampling of one sample every five. The available products used for monitoring real time phenomena are the Horizontal and Vertical Maximum Intensity (HVMI), VMI, PPI, and the Range Height Indicator (RHI). These products allow a continuous monitoring of the 3D structure of the atmosphere for weather observation and nowcasting purposes.
The choice of such a scan configuration that includes ten elevations with the maximum range was made to meet two requirements: the necessity of monitoring the full area and of finding the optimal set of elevations to be used for the clutter signal filtering. The scan repetition time has been set to 15 min, according to the time needed for processing ten elevations.
The real time use of the network together with other meteorological instruments has demonstrated good performances in identifying and tracking the target phenomena, in some cases even at long distances, different to what often occurs with the X-band radars [3,6]. The use of the HVMI product is crucial for the correct interpretation of convective phenomena and heavy rain events. However, some limitations exist due to strong signal attenuation in the presence of rain. In the proximity of the radar, a small water coverage on the radome can introduce a very strong attenuation and in extreme cases even affects the signal extinction. Moreover, at distance of some tens of kilometres, intense precipitation can hinder the detection of more distant phenomena. Sometimes stratiform rain is not detected, especially for very light precipitation in areas far from the radar.
The densification of the network with the synergic analysis of the radar signals can help to overcome these limitations and the radar composite can effectively help in the correct identification of the structure and dynamics of the precipitation systems.
A further problem of radar systems is the presence of sea and ground clutter that can mimic or overlap to precipitation signatures. In the operational phase, an animation of the next PPI images can help to identify the precipitation through the motion of a reflectivity field; nevertheless, for a more accurate assessment of the meteorological situation, it is essential to remove the unwanted signals.
An analysis has been made to improve the monitoring efficiency of the radar network. This study started from the power data received and collected by the radar systems. The complete signal processing chain has been implemented. It applies the radar equation to retrieve the reflectivity value for each observed volumetric cell and includes all the software modules for estimating and removing clutter signals. Moreover, a procedure has been developed for geolocating the volumetric cells in a non-conventional manner.
All these software modules are described in the following paragraphs, detailing major innovations and the final results.

3. Signal Processing

The signal processing begins with the acquisition of raw data (i.e., received power data) and ends with the formulation of some final products, through a series of procedures dedicated to data calibration, georeferencing, and noise removal. The used weather radar system is non-coherent and cannot take advantage of the Doppler effect for sea and ground clutter signal removal. A specific software module has been developed and implemented to remove clutter effects. The following paragraphs describe in detail each of the algorithmic modules that have been implemented to obtain composite reflectivity maps.

3.1. Reflectivity Computation

During the scan the receiver produces raw data, collecting the output signal of the analogic to digital (AD) converter, encoded in 8 bits. The receiver dynamics must be routinely characterised and calibrated during both the radar setup and the maintenance operations, to optimise the digital conversion process. Two parameters characterise the AD converter of the receiver: the Minimum Detectable Signal (MDS) and the slope. It is possible to reconstruct the analogic signal power (Pr) from the digital count in the output from the AD converter:
P r = M D S + c o u n t s l o p e
The radar equation is a relationship between the transmitted power and the average power received by the radar system relative to a single weather scattering cell volume [16] (p. 82). The reflectivity computation formula can be easily derived from the radar equation:
Z = 2 10   l n 2   λ 2   r 2   l 2   l r   P r π 3   P t   g 2   g s   θ a z θ e l   c   τ   | K W | 2
where:
  • λ is the wavelength of the transmitted signal carrier
  • r is the distance from the radar to the observed volumetric cell
  • l is the attenuation due to atmospheric gases (0.00835 dB/km in this study [17])
  • lr is the weather signal power loss at the receiver caused by the finite bandwidth of the receiver, the radome, the circulator, and the transmission limiter (this parameter must be computed for each system during laboratory calibration)
  • Pt is the peak power of the signal radiated by the radar
  • g is the antenna gain (g2 assuming transmission and reception gains are equal)
  • gs is the system power gain
  • θaz and θel are the antenna beamwidths in azimuth and elevation axis respectively
  • c is the speed of light
  • τ is the pulse width
  • KW is the water scattering coefficient (0.93 in this study [16] p. 36).
The reflectivity is then converted to dBZ. The application of Equation (2) to each volumetric cell (determined by azimuthal, elevation, and range resolutions) generates the generic PPI. The radar system takes 18 s to complete a rotation (the antenna rotation speed is 20°/s). As the Pulse Repetition Frequency (PRF) is 800 Hz, 14,400 rays compose a 360° scan. Each ray counts 240 cells. Thus, 14,400 × 240 volumetric cells compose the raw reflectivity product.

3.2. 3D Spatial Data Infrastructure

Many radar data are in complex and sometimes proprietary binary formats. Their use requires some skills in handling or commercial software products. Other technical barriers regard the difficulty to work with polar coordinates and to geo-reference 3D scan data, as well as the lack of out-of-the-box spatial visualisation tools outside Geographic Information System (GIS) working environments [18]. For these reasons, a specific procedure has been designed to build a proper spatial infrastructure. The target was to compare and analyse data coming from different radars located along the Tuscan coasts, each related to its own characteristics (elevation, resolution, range, etc.).
Given the radar beam propagation geometry and taking into account the refractivity of the atmosphere, the beam height is calculated as [16]:
h = H 0 + r 2 + ( k e r e ) 2 + 2 r k e r e sin θ k e r e ,
where:
  • H0—antenna height above sea level (m)
  • r—range from the radar site (m)
  • θ—elevation angle in degrees with 0° at the horizontal and +90° pointing vertically upwards from the radar
  • re—spherical earth’s mean radius (m)
  • ke—adjustment factor to account for the refractivity gradient that affects the radar beam propagation. In principle this is wavelength dependent. The default of 4/3 is a good approximation for most of the weather radar wavelengths.
Then a 3D vector Shapefile has been obtained according to the following steps:
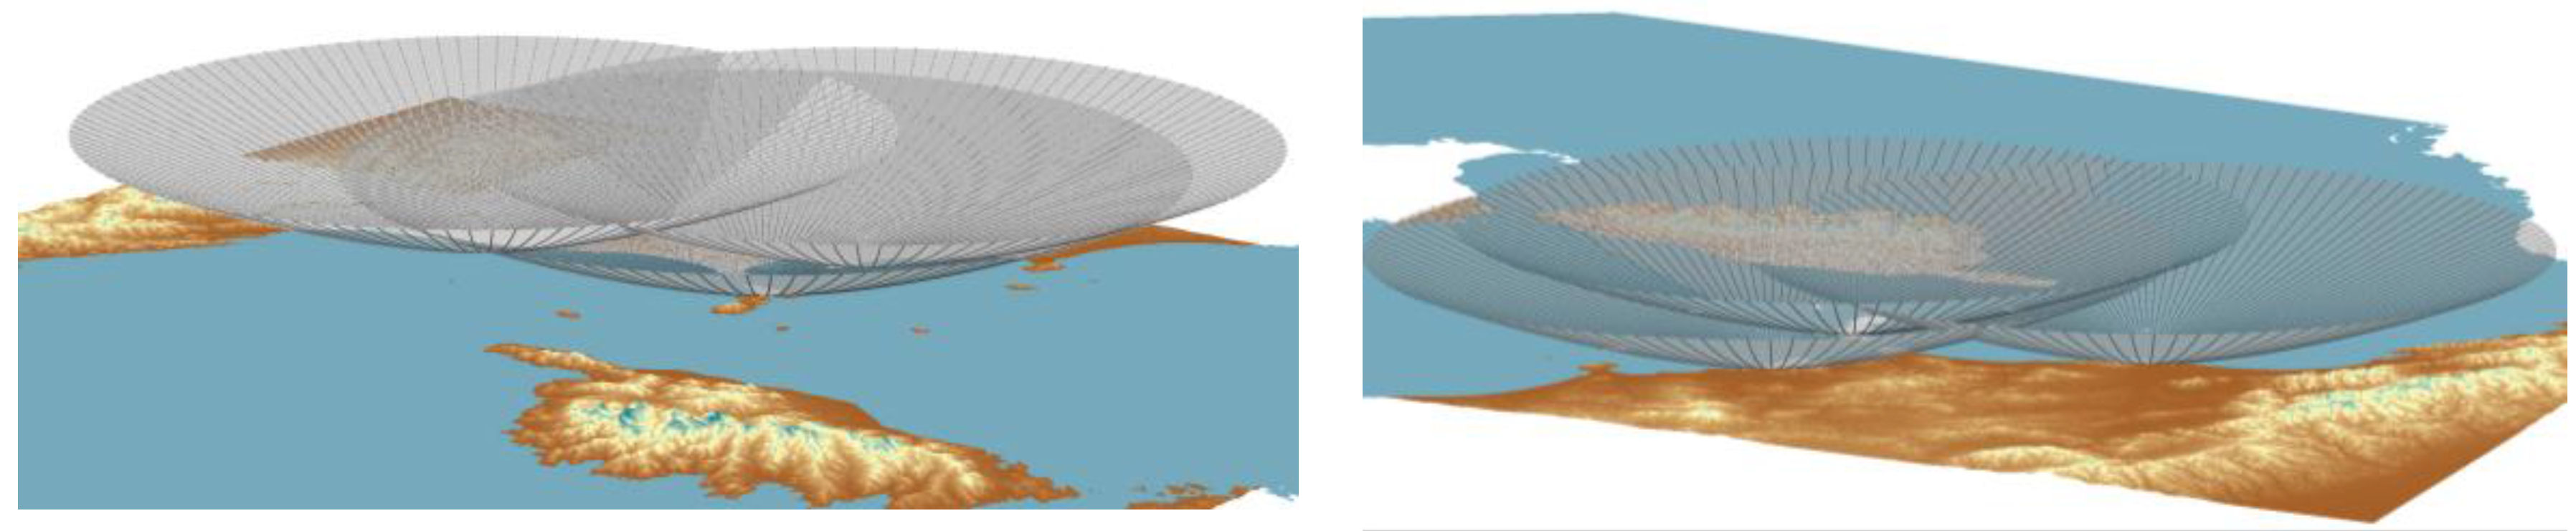
  • A transformation of the PPI “standard mask” from a polar coordinate system (azimuth, elevation, range) to a Cartesian coordinate system (X, Y, Z). The “standard mask” was set up on a number of points related to the specific radar characteristics (e.g., azimuth, resolution, elevation, frequency, etc.). The volumetric cell number for each elevation is 14,400 × 240, and a corresponding 3D shapefile (with 3D Point Z geometry) has been created.
  • A georeferencing of each radar system into a specific Spatial Reference System (SRS); in the present case ETRS89 UTM32N (EPSG: 32632) [19].
  • A rigid translation of the standard mask points into the selected SRS. The approach is based on the Puiseux-Weingarten system [20] where, within a range of about 100 km, the planimetric projection from a spheroid (Equation (3)) is almost interchangeable with that of an ellipsoid (at the cartographic level). Regarding the third dimension (i.e., Z is the orthometric height), the assumption is that the geoid undulation is constant within the radar range (108 km).
Then, once the spatial infrastructure has been set up, different analyses can be made. As a minimal tool, the spatial reference infrastructure can be used to generate a PPI DEM (Digital Elevation Model) surface based on the emission cone for each radar elevation (see Figure 2).
This surface can be used to visualise and compare different raster radar PPI outputs in a 3D framework. However, the research approach has been oriented to study in depth how the reflectivity cells can be associated to the nearest neighbour mask point and inserted in a GIS environment, so that radar data can be combined, processed, and analysed through spatial/topological operators. For instance, different radar system reflectivities could be compared to each other or with ancillary geodata information, as in the ASTER Digital Terrain Model (DTM) dataset [21] in particular, very important in the voxel visibility evaluation. Moreover, spatial analysis with different thematic information (i.e., landslide phenomena, meteorological critical events, etc.) could be developed in real time alert system applications. Finally, this interoperable infrastructure could easily ingest data coming from each new radar site that is made available. Some critical issues linked to different specific accuracies (geospatial and temporal) came out during the integration process of the radar information with different thematic datasets. Traditional geographical themes (landslides, land use, etc.), even coming from different sources (remote sensing, topographical data, etc.) and related to specific SRS, can be easily ingested and managed by GIS environments. In fact, radar data, based on a polar reference system, have a granularity that decreases proportionally to the distance from the source, while the homogeneous accuracies of the geographical data only depend on the chosen cartographic projection. For these reasons, in future developments, the tuning of geodetical propagation parameters in the formula (Equation (3)) will be studied in depth, not only limited to a sferoidic terrestrial surface as assumed in Equation (3).

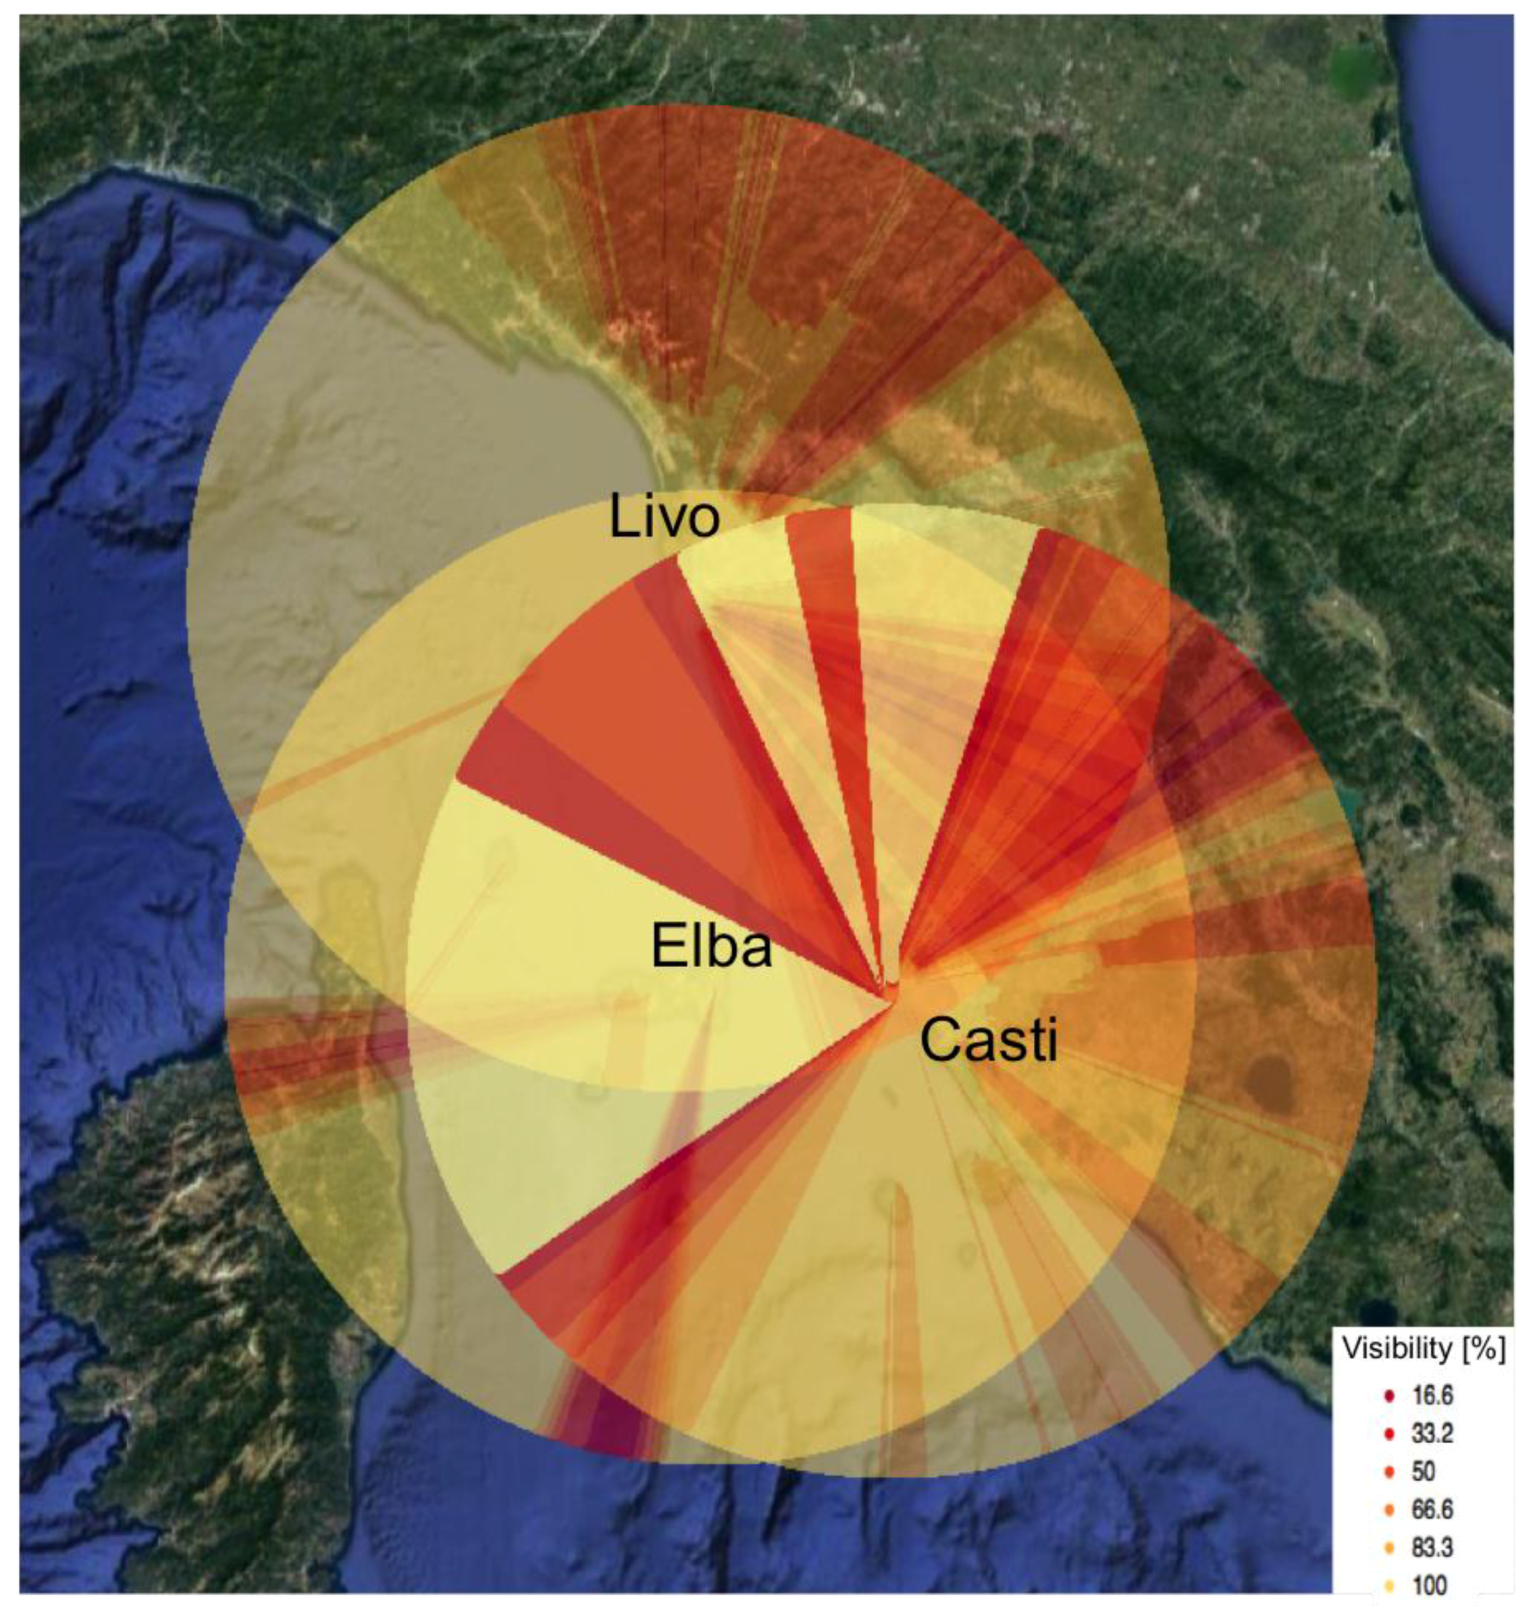
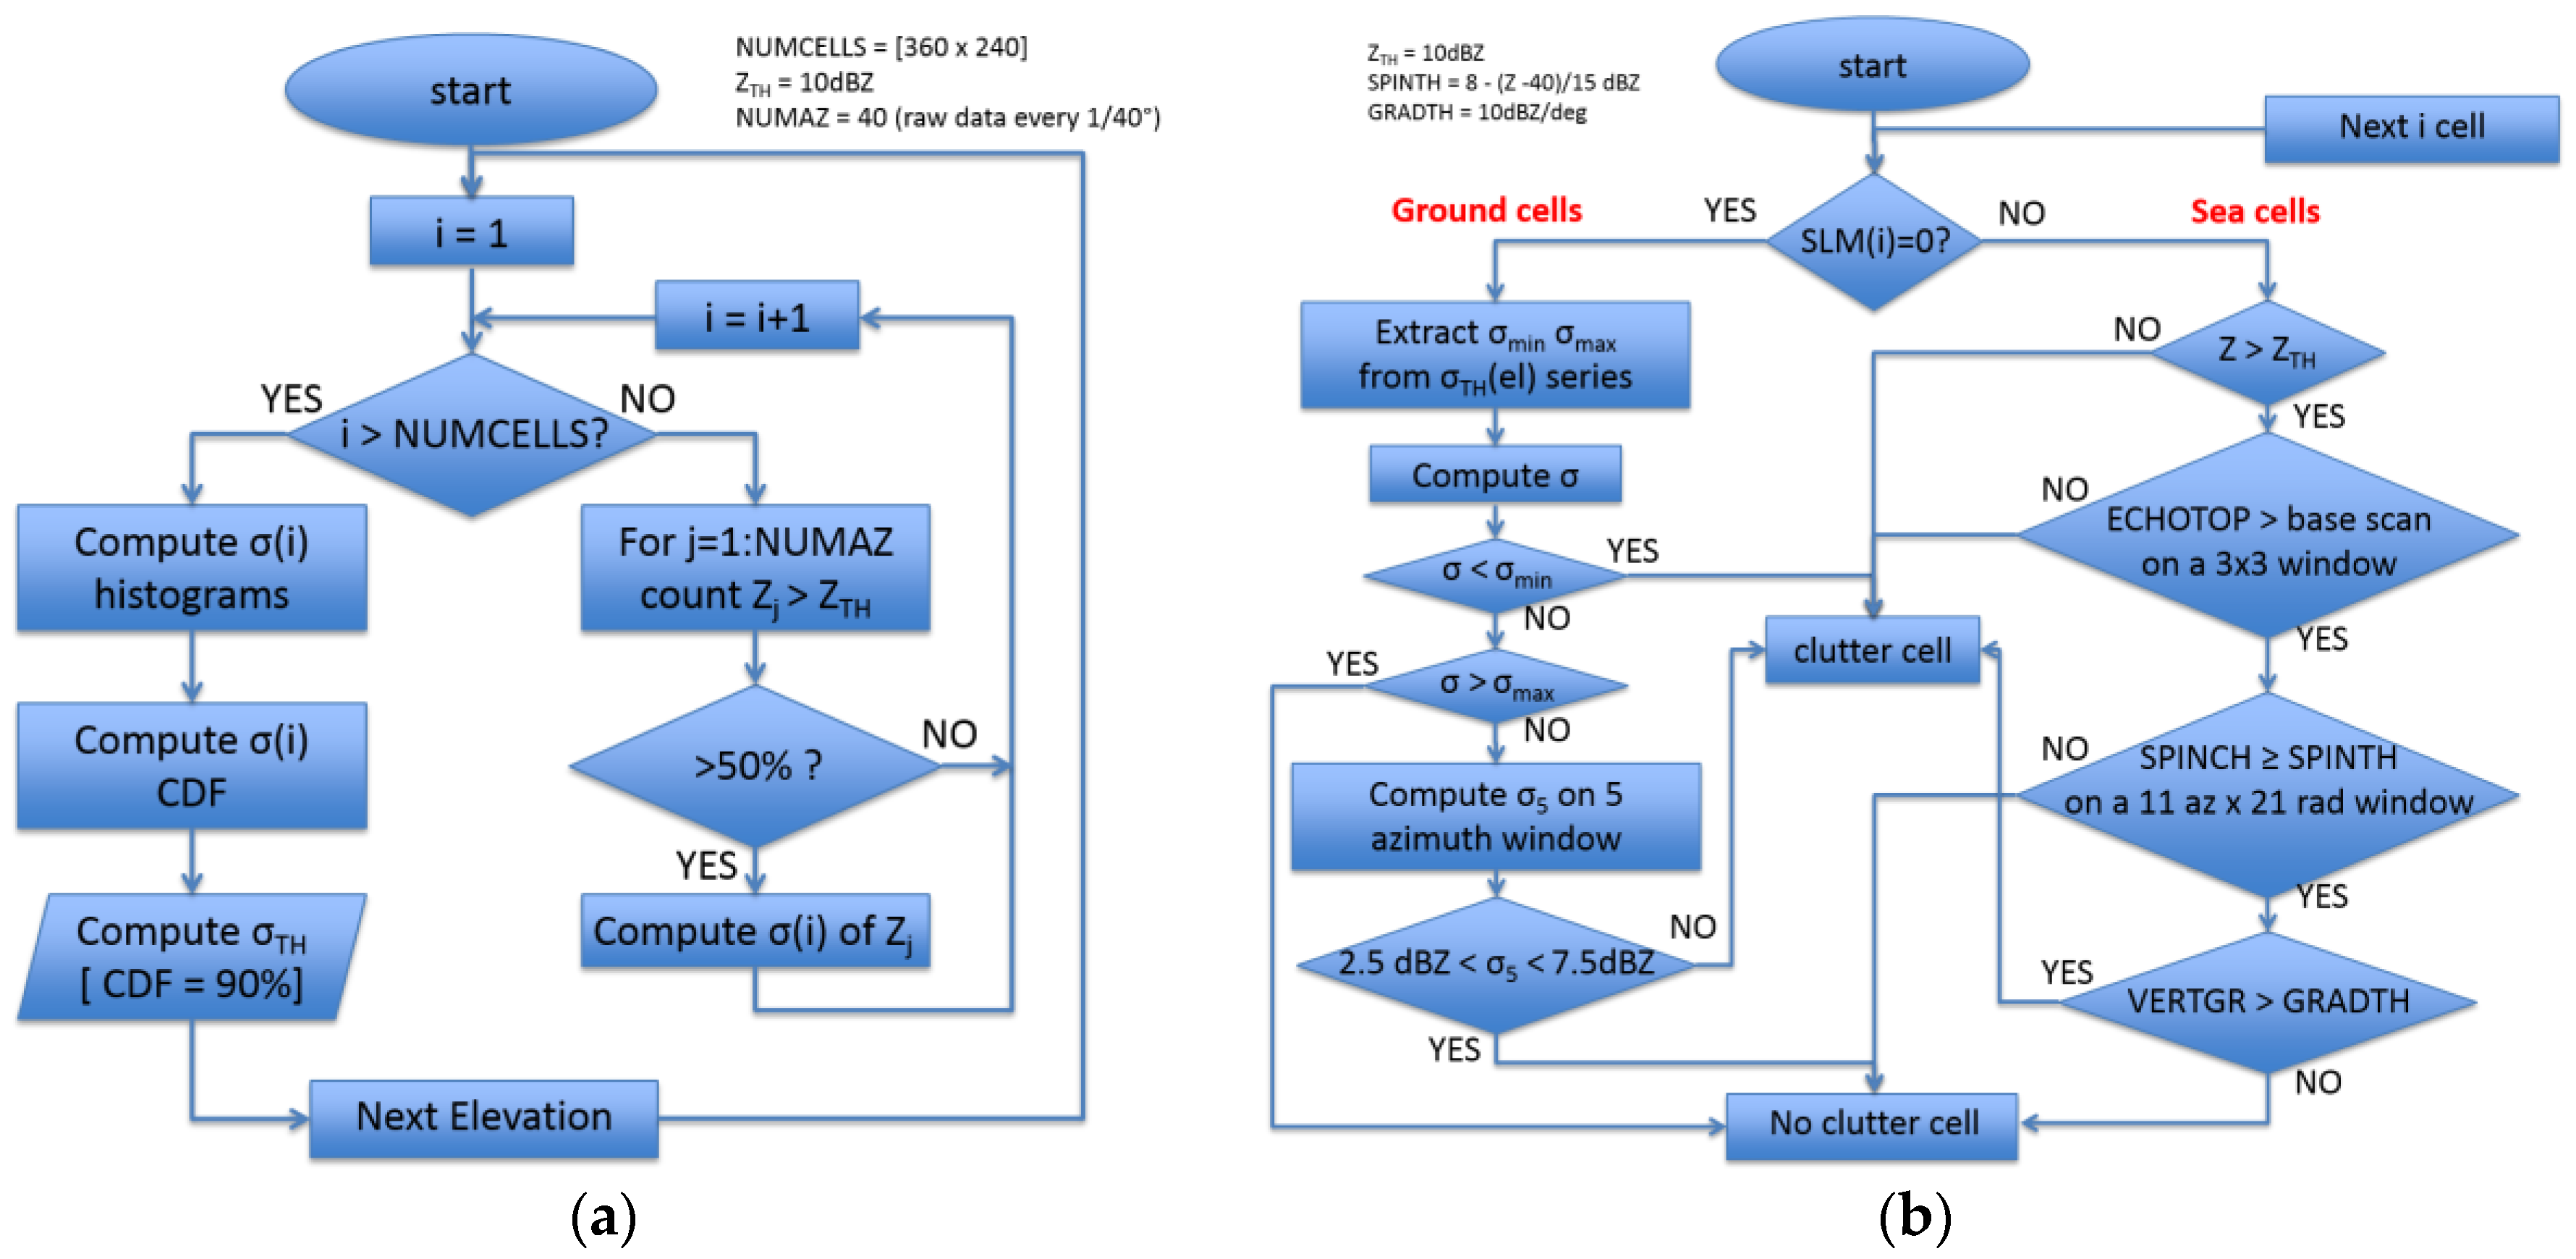
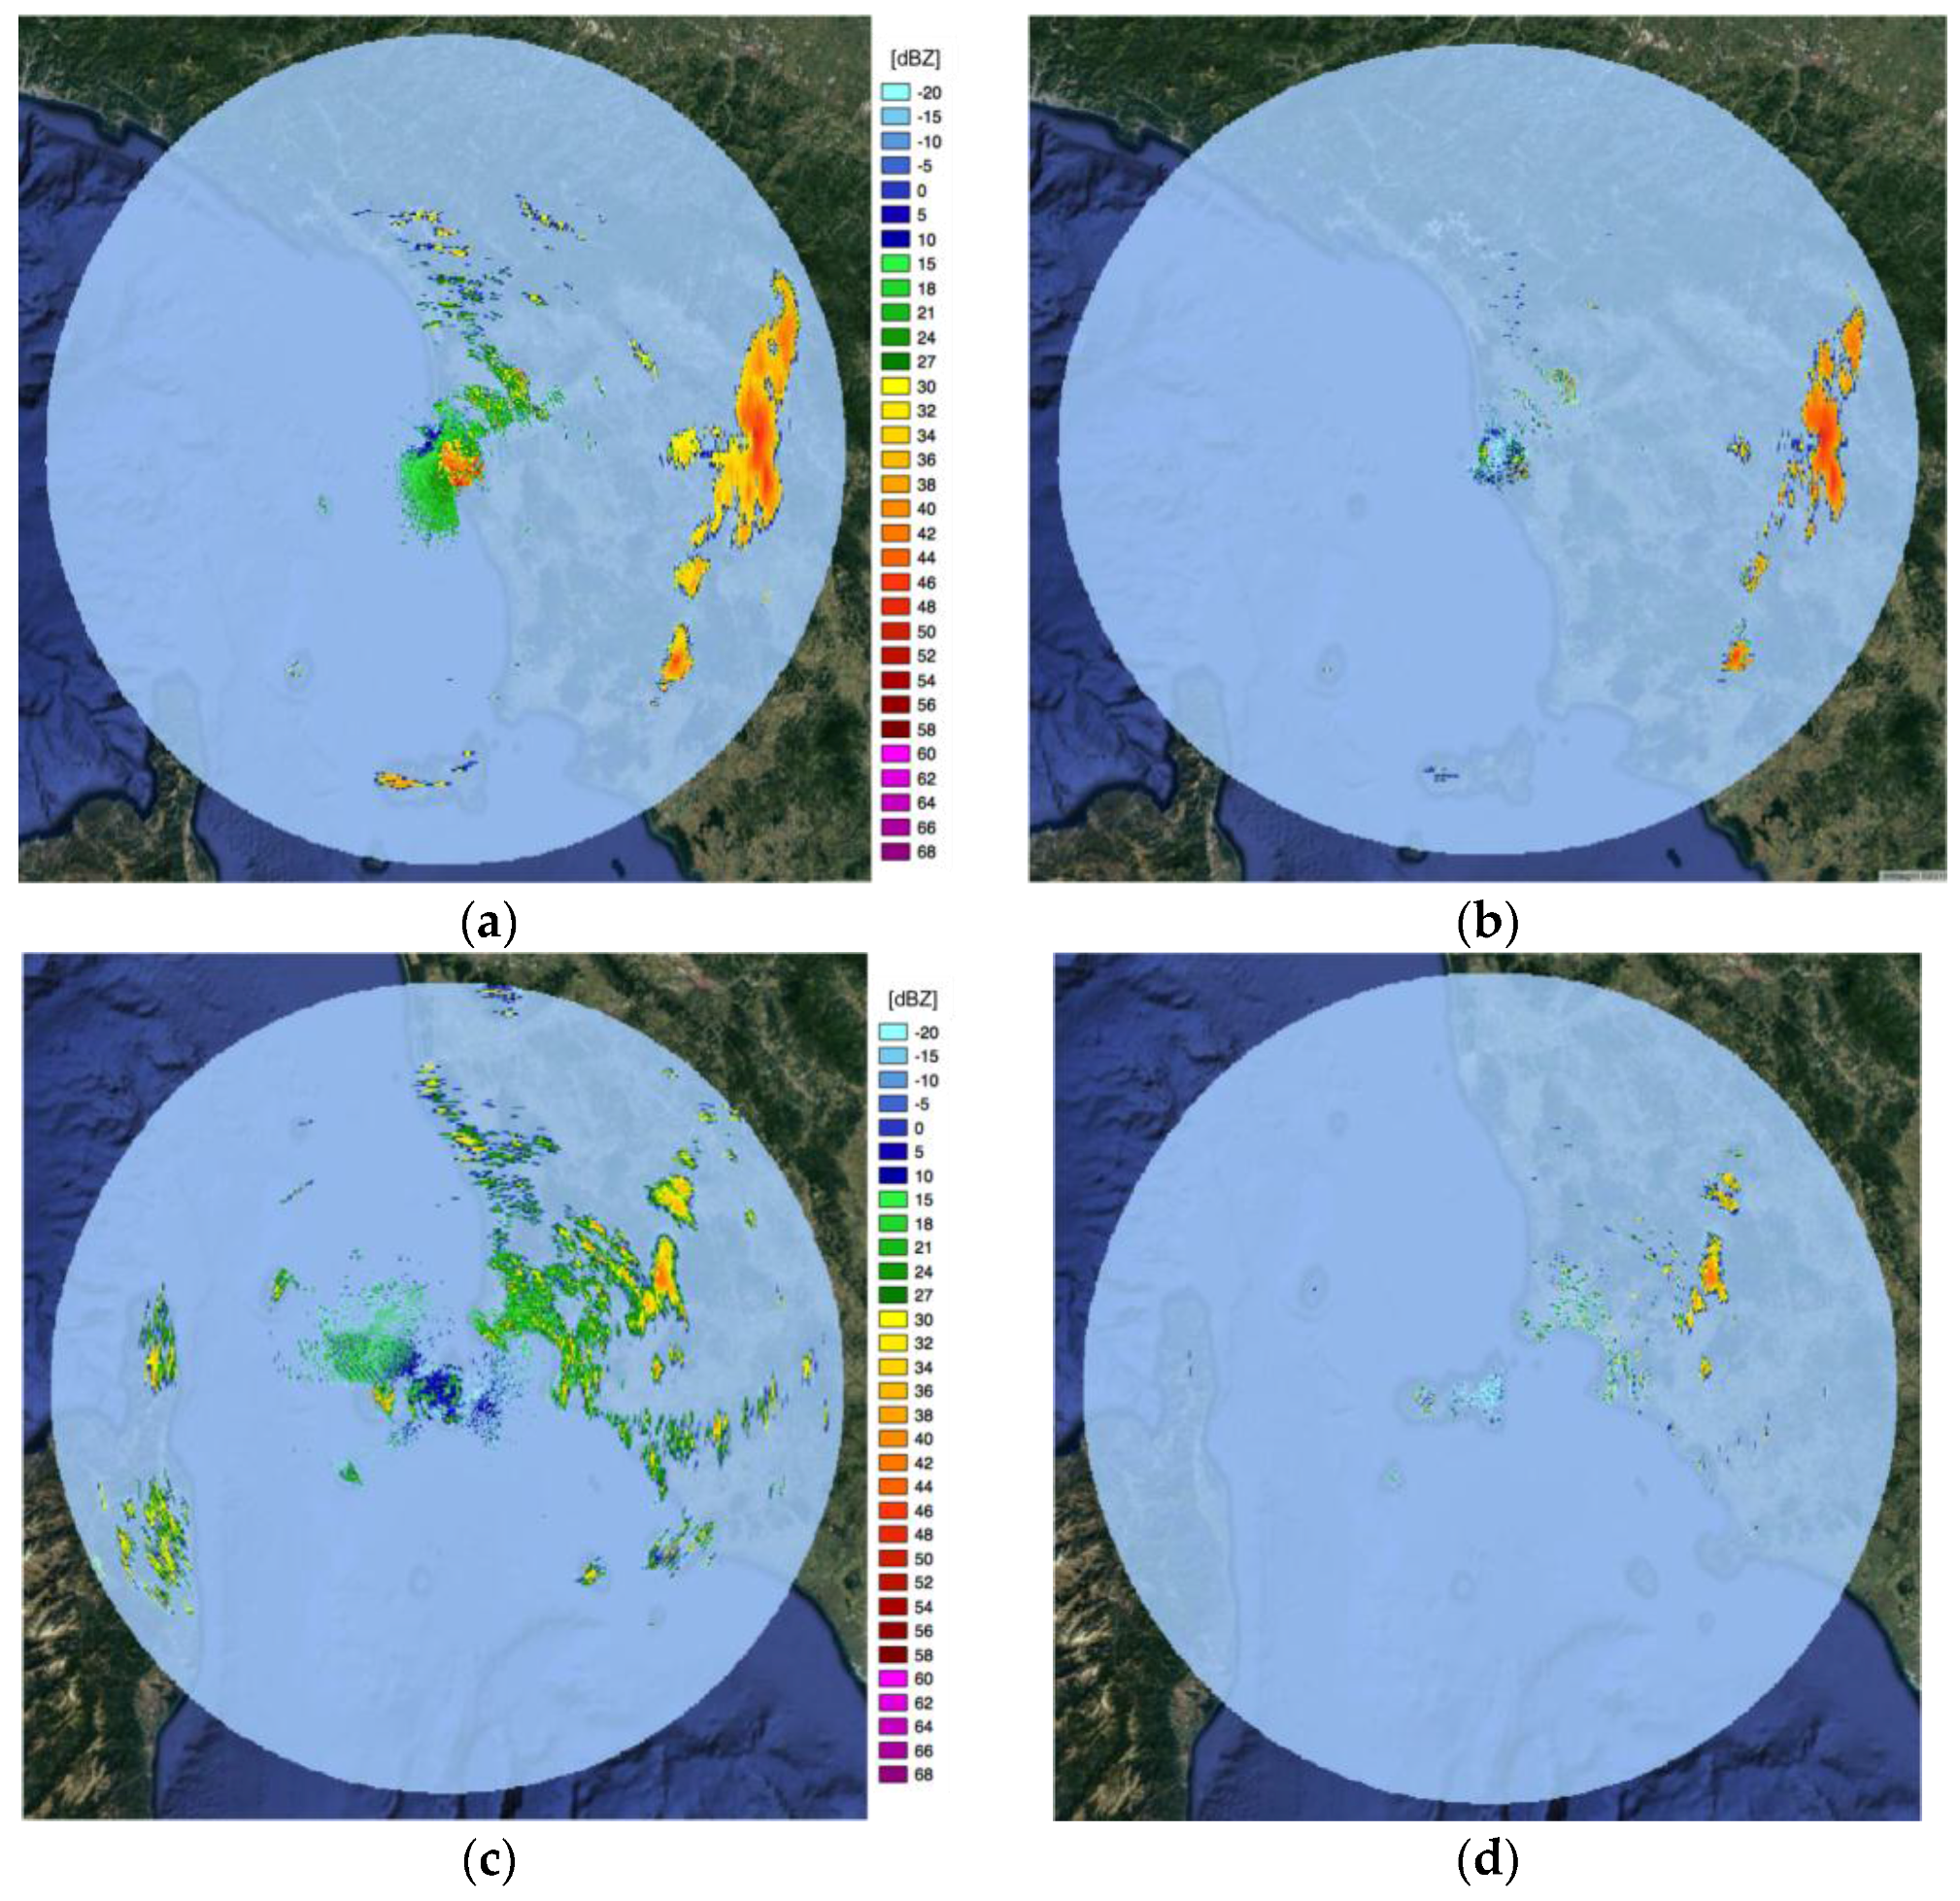
3.3. Sea and Ground Clutter Removal

Radar echoes of non-meteorological targets have to be identified and removed since they may introduce relevant biases in the estimation of precipitation fields and may also negatively impact the performances of other algorithms, which use radar patterns for nowcasting, meteorological, and hydrological issues. Due to the high variability of atmospheric conditions, clutter echoes can vary in intensity, vertical extent, and location [16]. However, some peculiar characteristics or features of clutter signals can help to differentiate them from meteorological returns. In the present work, two different algorithms that exploit these features have been used to remove clutter noises for sea and land surfaces.
For marine areas, the algorithm proposed in [22] was used. It is a decision-tree algorithm in which the features used in the clutter-identification scheme are analysed according to a sequential logical chain by means of thresholds: each pixel of the polar base-scan is examined to determine if it should be kept, removed, or potentially replaced (see Figure 3b). The clutter scheme takes advantage of the three-dimensional radar reflectivity structure. Three key parameters, namely, the vertical extent of radar echoes (ECHOTOP), the vertical gradient of reflectivity (VERTGR), and the spatial variability of the reflectivity fields (SPINCH) constitute the kernel of the algorithm. Several other parameters were evaluated in [23], showing marginal effects on the algorithm performances. Generally, clutter echoes mainly affect the lowest radar tilts. Therefore, the echo in clutter regions not affected by precipitation is quasi limited to the lowest elevations. Many authors used this feature to characterise clutter [22,24,25,26,27]. In areas affected only by clutter, the reflectivity fields present higher spatial variability and more significant fluctuation with respect to rainfall echoes. Some statistical indices exploit this variability to characterise clutter. The SPINCH, proposed by [28], was such an example. It allows us to catch the spatial variability of clutter echoes, especially when embedded in precipitation [22,27,29]. Finally, the vertical gradient of reflectivity has been used to characterise the shallow extent of clutter in several techniques by several authors: even when rainfall affects meaningful clutter areas, the negative values of the vertical gradient of reflectivity tend to be high [24,30,31,32,33]. The algorithm was applied to each single raw PPI data in polar space to avoid the introduction of undesired range dependent artefacts [34] due to data interpolation in a different grid (e.g., Cartesian).
The algorithm for ground clutter identification is based on the stability of the radar signature when the radar beam intersects and is backscattered by mountains and reliefs [35]. Because of the Gaussian shape of the antenna radar beam, both weather and undesired clutter signals are Gaussian in shape. However, the reflectivity autocorrelation over time is a way to distinguish between them [36]. Reflectivity cells affected by ground clutter that are next in azimuth are in most cases very strongly correlated due to the high spatio-temporal proximity of the measurements, while this does not happen between two precipitation backscattering cells that are intrinsically variable in time and space. Along range ground clutter observations have a lower correlation due to non-overlapping scenarios, beam blockage, and signal attenuation effects. In the absence of Doppler measurements, as in the present case, this is a good way to simulate the Doppler moments [37]. According to these considerations, the implemented algorithm is based on literature studies [38]. It operates a statistical scheme based on the standard deviation of neighbour cells along azimuth. As each radar scan produces raw data collected in a large number of rays (up to 14,400 corresponding to rays spaced of 140° degree), a synthesis process is needed to operationally use the data and to make the information actionable.
Generally, operational weather radar products have an azimuth resolution of 1°. Therefore 1° azimuth resolution is the value used in this work, in order to have also a sufficient statistic on the final cell volume. For each cell of the final product (1° × 450 m), up to 40 observations are available; their standard deviation is used to distinguish the ground clutter from precipitation. The former is characterised by low fluctuating values and low standard deviations; the latter presents more variable values and higher standard deviations. The ground clutter removal scheme is based on two thresholds that are calibrated on the basis of the specific characteristics of the area covered by radar echoes. These thresholds can be determined during clear air conditions (total absence of precipitation and cloudiness) and by collecting a sufficient number of scans (Figure 3a).
For each scan, all the ground 1° × 450 m cells that have more than 50% of the reflectivity values (20 in the present case) greater than 10 dBZ are considered and the relative standard deviations are collected. For all the PPI scans, the histogram of the standard deviation values shows a peak for low values and a tail spanning to high values, resulting in a typical trend of a Weibull distribution. The relative cumulative distribution function is used to determine a threshold (σTH) in correspondence to 90% of the values. An example of a histogram of standard deviation values during clear air conditions is shown in Figure 4a, and the cumulative distribution function in Figure 4b. The threshold value nominally indicates the largest standard deviation value for the clutter cells. This process is repeated in clear air conditions for all different elevations and for all selected timestamps. Once the entire dataset has been processed, a range of threshold values is available. The minimum and maximum values (σmin, σmax) are extracted from this range. If the standard deviation is below the minimum threshold, the corresponding cell is classified as ground clutter, and if it is above the maximum threshold, it is classified as precipitation. Each ground cell with an intermediate standard deviation value is further processed by a module based on the KNMI (the Royal Netherlands Meteorological Institute) operational clutter removal scheme [39,40]. Reflectivity fluctuation over a volumetric cell (1° × 450 m) is computed by considering a five cell moving window over each 1/40° azimuth, extracting the relative running average and computing the standard deviation (σ5) of the overall 40 values. If the resulting value is between 2.5 dBZ and 7.5 dBZ, the signal is processed as precipitation echo, otherwise it is discarded. For all the clutter free cells, the mode of reflectivity values is assigned. Figure 3b shows the flowchart of the decision tree algorithm and the threshold values for each test.

3.4. Mosaic Implementation

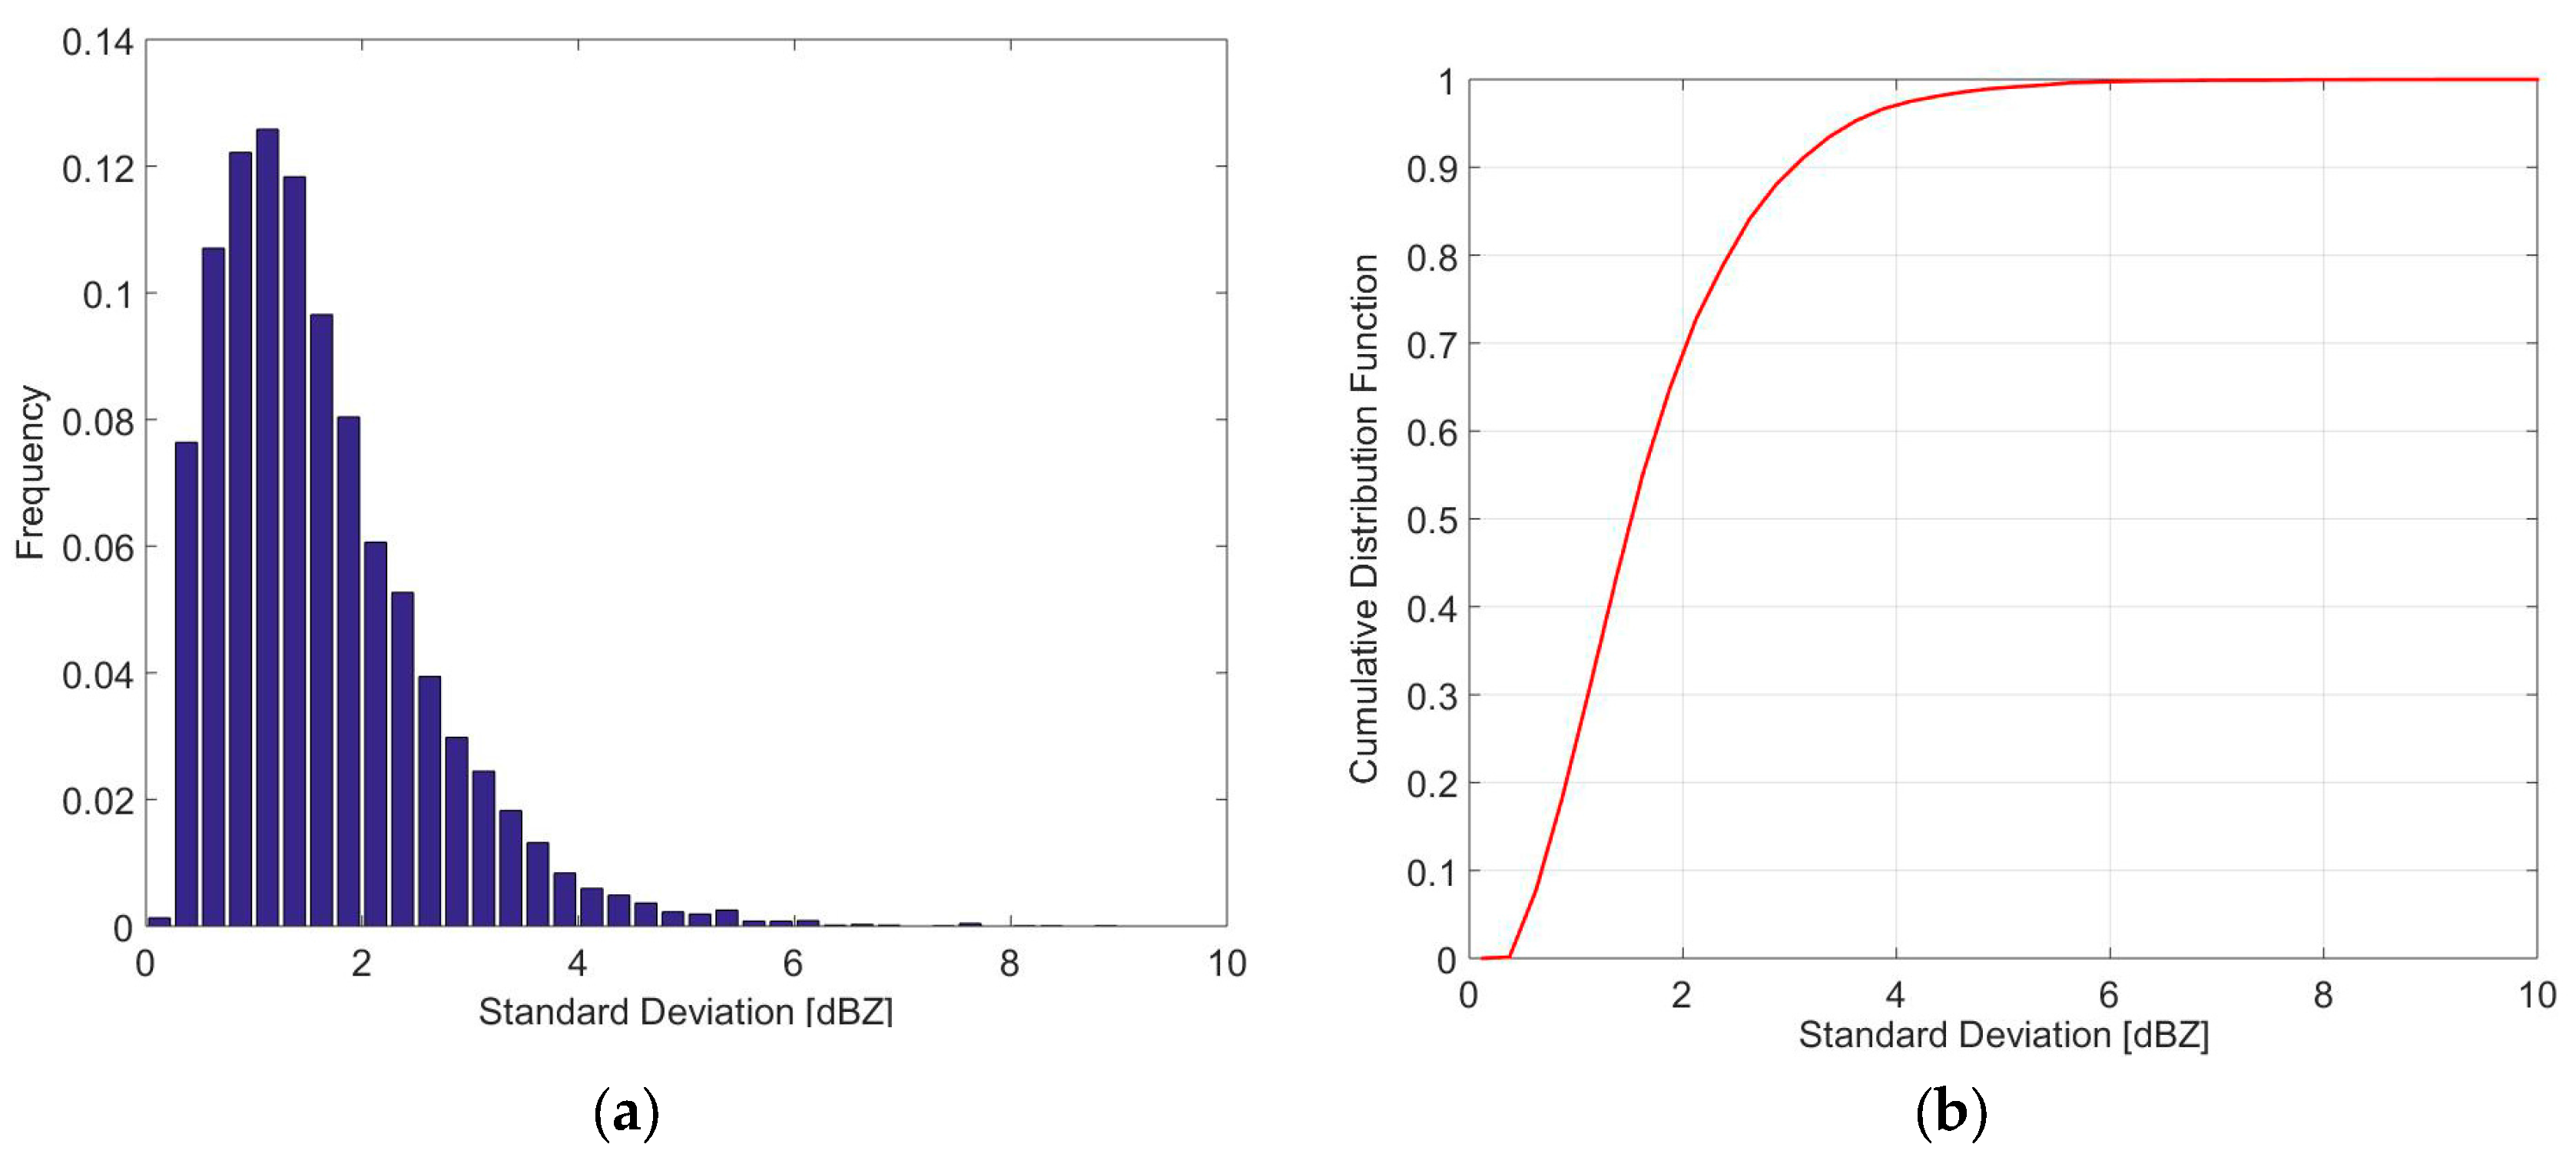
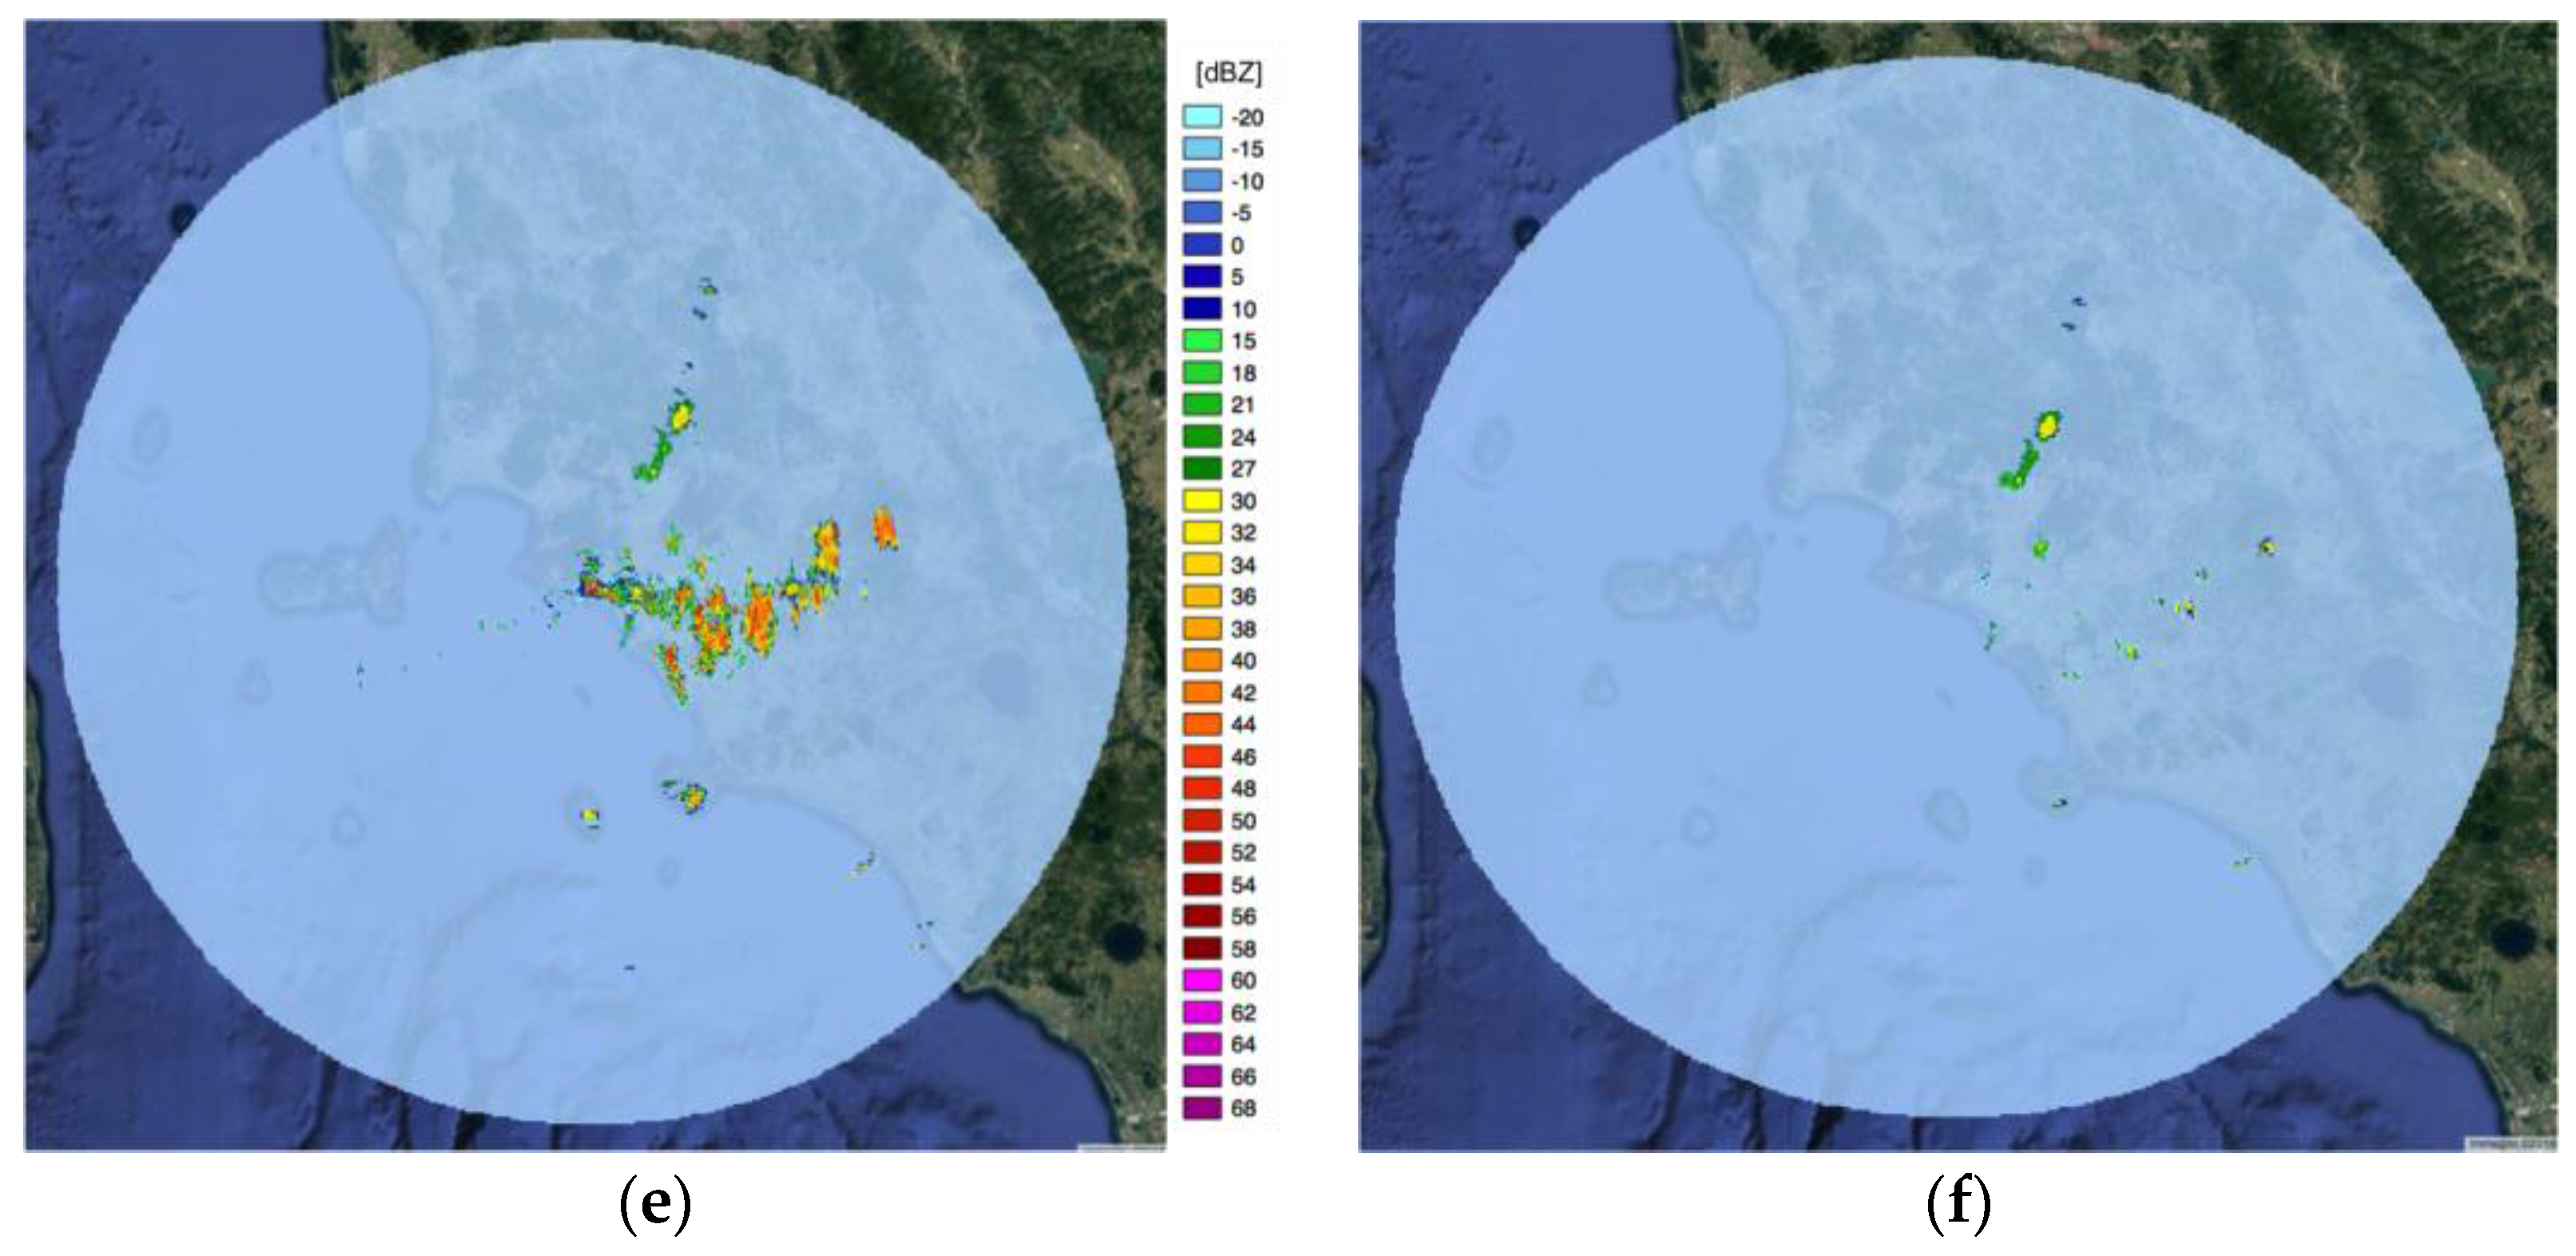
3.4.1. Radar Signals Preliminary Qualitative Evaluation

An intercomparison study (still under testing) has been developed. Some very preliminary results are described for a still limited dataset, that can provide important information for assessing the best strategy for merging information collected by the three different radars. In addition, as the Castiglione radar is strongly affected from beam blockage in the northern area due to the mountains close to the installation site, the comparison with the Livorno radar is not performed because of the small dimension of the overlapping area. Two different intercomparisons have been made: the first between the radars of Livorno and Elba, and the second between that of Elba and Castiglione. 3D coincident pixels have been considered for the intercomparison and a minimum threshold of 10 dBZ for the reflectivity has been used to classify a pixel as rainy. The number of pixels for which both radars detect precipitation in a given time step is taken as an indication of the instantaneous spatial extension of the precipitation. If the number of rainy pixels observed in a certain area from two different radars is quite similar, there is an agreement in the weather system localisation. The reflectivity values measured from different radars depend instead on a number of different factors, including the observation geometry, the visibility, and the signal attenuation. If the precipitation cell is close to a radar system, in the absence of obstacles, the accuracy of the reflectivity measurement should be greater for that radar, as the beam is near to the ground and the radar detects a backscattered signal from the lower part of the storm. As the distance increases, the beam altitude also increases and can overshoot the core of the precipitation system. Visibility is also a key factor, as it can limit the radar detection capability. Attenuation happens for the simple signal propagation in atmosphere and can be critically enhanced by the presence of a precipitation cell. Intense rainfall fields cause strong radar signal attenuation, and in some cases the received signal is not sufficiently intense to be correctly distinguished from noise.
The preliminary results of this analysis reveal some different behaviors depending on the precipitation type. In the case of the Livorno and Elba radars, the overlapping areas mostly fall over the sea. The agreement between the two radars in rainfall detection exceeds 70% for precipitation events characterised by reflectivity values greater than 30 dBZ and for areas of some hundreds of pixels. The comparison between the Elba and Castiglione radars has better results. An agreement up to 85% can be achieved over the inland areas in southern Tuscany, where both radars have high visibility. Lower reflectivity values (<30 dBZ) and reduced precipitation areas are very often associated to stratiform precipitation. Therefore, the weakness of the received signal power can cause some mismatching in the observations of the different radars that can jeopardise the correct interpretation of phenomena. In fact, distinct elevation PPI scans can give discordant reflectivity values that can make the obtained measurements inconsistent.
A further analysis has been performed to evaluate the minimum set among the 10 possible elevations that ensures a lossless sampling of the meteorological phenomena. The lower elevations are definitely those that provide information more directly related to the precipitation content. However, because of the large antenna beam width (more than 3°), elevations of 0.5° and 1.0° are very strongly affected by sea and ground clutters that partially remain after the filtering process. Therefore, the minimum elevation considered is 1.5°, that ensures a complete coverage of the lower atmospheric layers because of the beam width. The analysis also showed that spacing elevations of 1° or 1.5° is sufficient to ensure continuity in the observations and the redundancy of the data.
On the basis of these considerations, and with the objective of decreasing the processing time and therefore the latency between successive scans, the number of used elevations has been limited to 4 (1.5°, 2.5°, 4.0°, 5.0°).
Among the available synthesis products, only these four PPI elevations have been used. For each case study a comparison was made to verify that no loss of information occurred with respect to the use of the whole set of 10 PPI elevations.

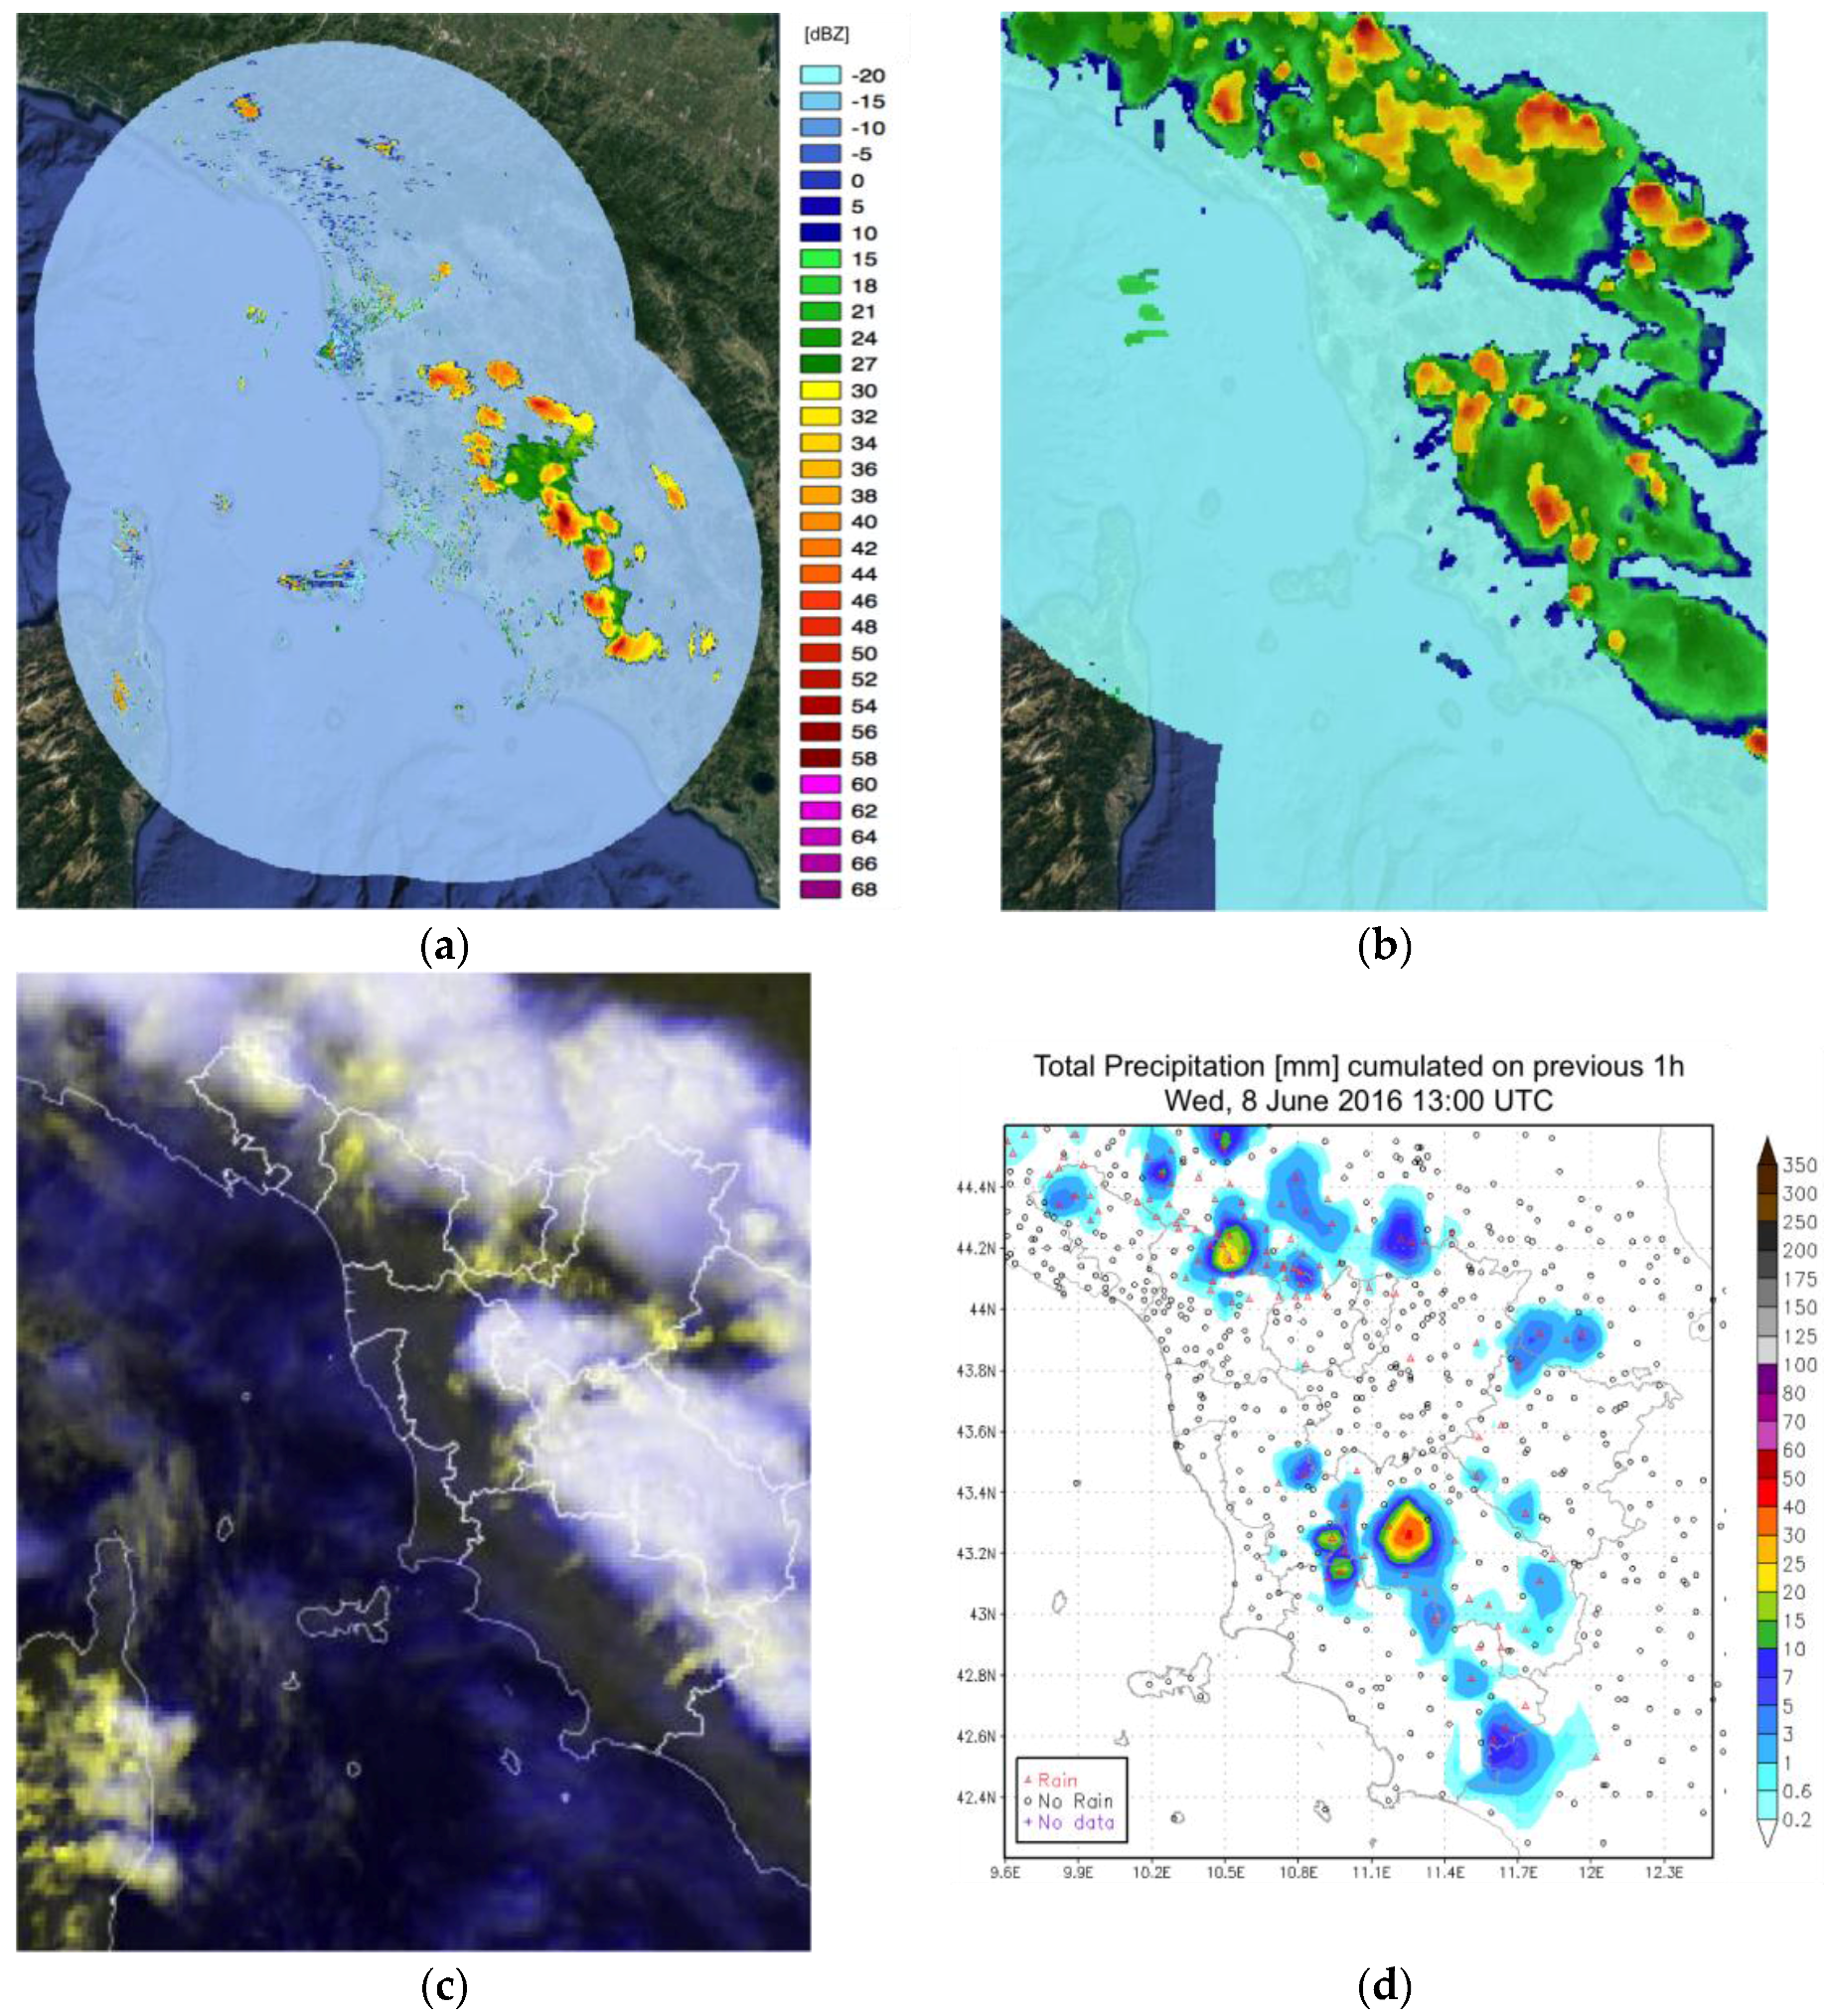
3.4.2. Radar Composite

As explained in the previous section, the reflectivity at lower elevation should provide measurements closely related to the actual ground precipitation, but problems may occur due to the presence of obstacles (buildings, mountains, etc.), anomalous propagation, and signal attenuation that reduces the signal power and causes errors (typically underestimation) in the precipitation intensity. An additional problem can happen for vertically developed thunderstorms, due to strong updrafts: in such conditions, precipitation loading caused by suspending precipitation particles (rain, ice, snow) high in the cumulonimbus cloud can sometimes generate reflectivity values much higher in the upper atmosphere than close to the surface [41]. This phenomenon works as energy storage when the load of raindrops and hailstones exceed the balance of the updraft. This effect may be associated to locally persistent precipitation systems that sometimes seem to be auto-regenerating, relatively frequent in the Ligurian gulf in proximity of the Apuan Alps.
The composite of the vertical maximum reflectivity can reveal important features in a storm structure that might not be visible in the base reflectivity product. Vertical Maximum Reflectivity values are the results of a data combination of all the PPI elevations for creating a single product useful to examine storm structure and intensity features. For each grid point, it selects the maximum value of reflectivity over the vertical direction, which allows it in some cases to overcome limitations related to visibility and attenuation problems and to provide an indication of the convective nature of precipitation. Vertical maximum reflectivity instead of base reflectivity is also used in the USA national composite [42].
Once the polar volumes have been properly geolocated and processed by the clutter filtering algorithms as described in the previous sections, a 3D reflectivity structure is available for each scheduled radar scan. To obtain a first viewable product, a multiband geotiff format is used, in which any single band is a PPI elevation. As the geotiff is in a Cartesian grid, a conversion scheme from polar coordinates is implemented in the geolocation phase. The final product gives an overview of the precipitation systems observed by each radar. Then VMI is computed by extracting the maximum reflectivity value in the vertical column for each single gridded pixel. The resulting composite 2D product is finally projected on a wider grid and the highest reflectivity value is assigned in any overlapping points.
The purpose of this preliminary composite is to provide an overview of the observation network, with emphasis on identifying the location and structure of the precipitation system. It means that it is not intended for rainfall estimation. Indeed, some intercalibration and calibration campaigns (with rain gauges or other ancillary data) are needed for estimating precipitation from reflectivity fields and further signal processing works should be carried out for improving the clutter filtering. Nevertheless, the product is reliable enough to be used in operational phase for meteorological vigilance purposes.
As an alternative, a 3D product has been studied in this work for merging the information collected by different radars in single PPI scans, while preserving the information of the height of the reflectivity cells. The advantage of such a merged product is to effectively maintain the vertical atmospheric structure and to have a clearer and easier interpretation of the observed phenomena.

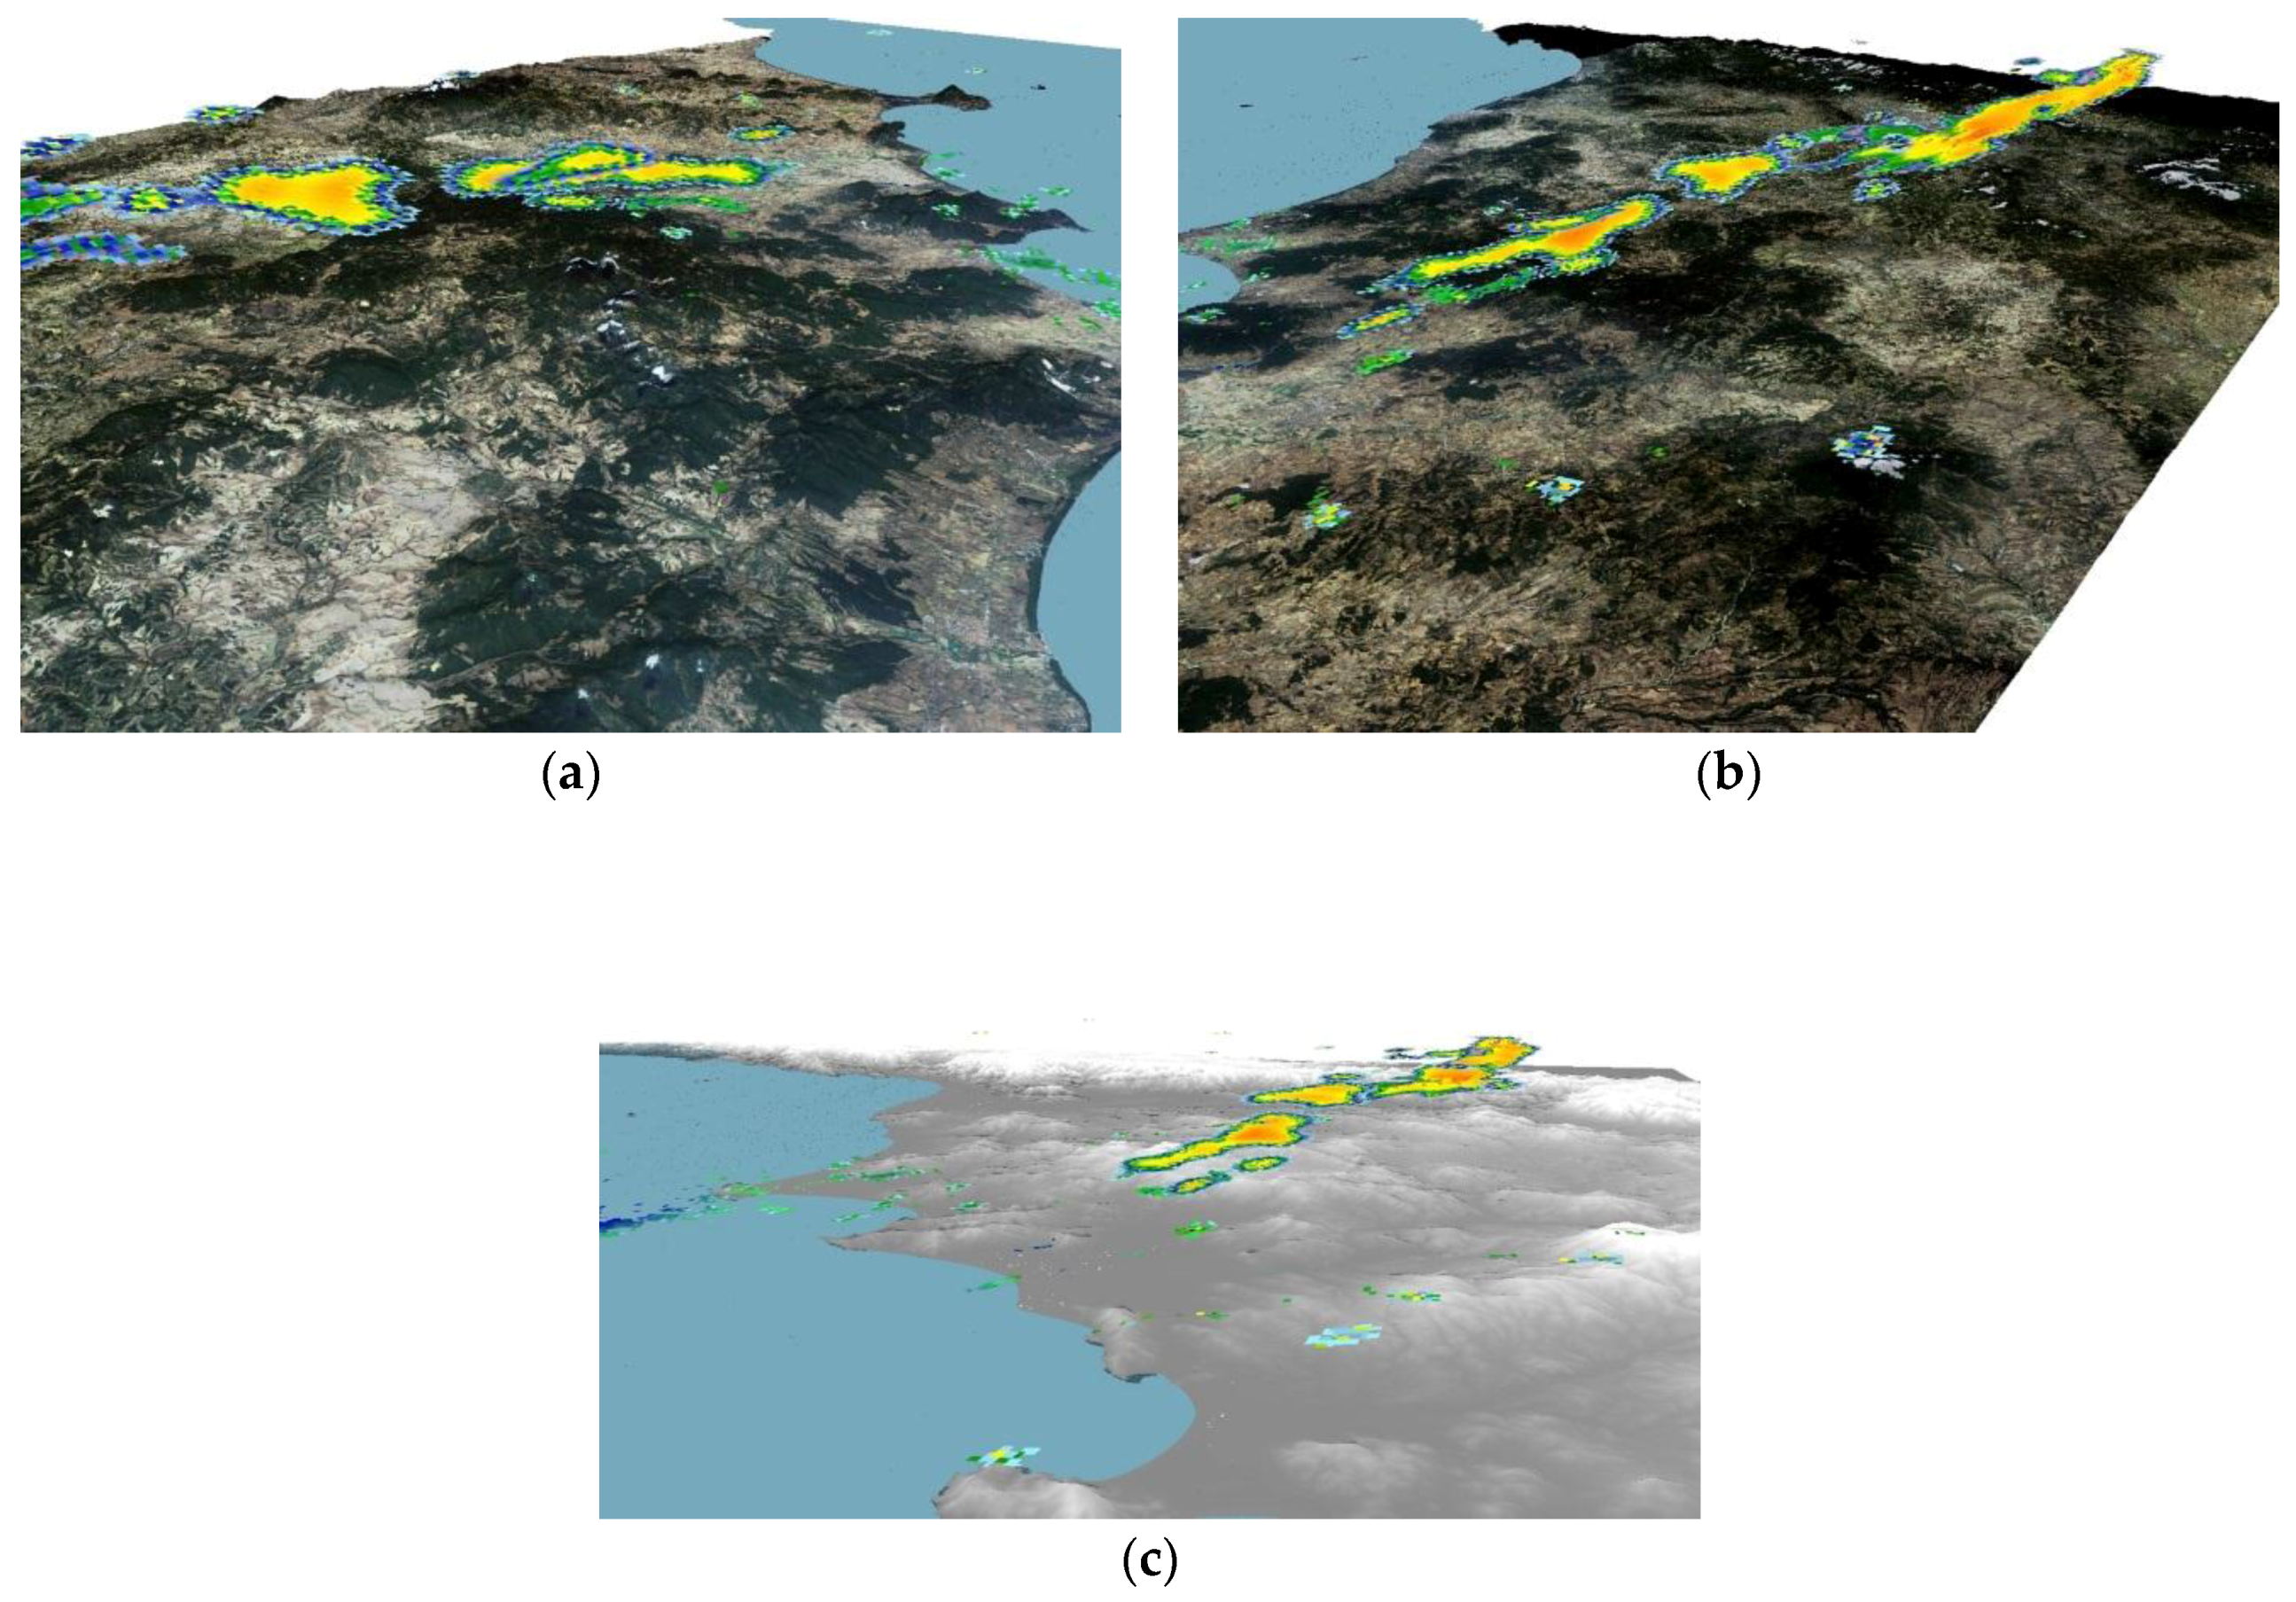
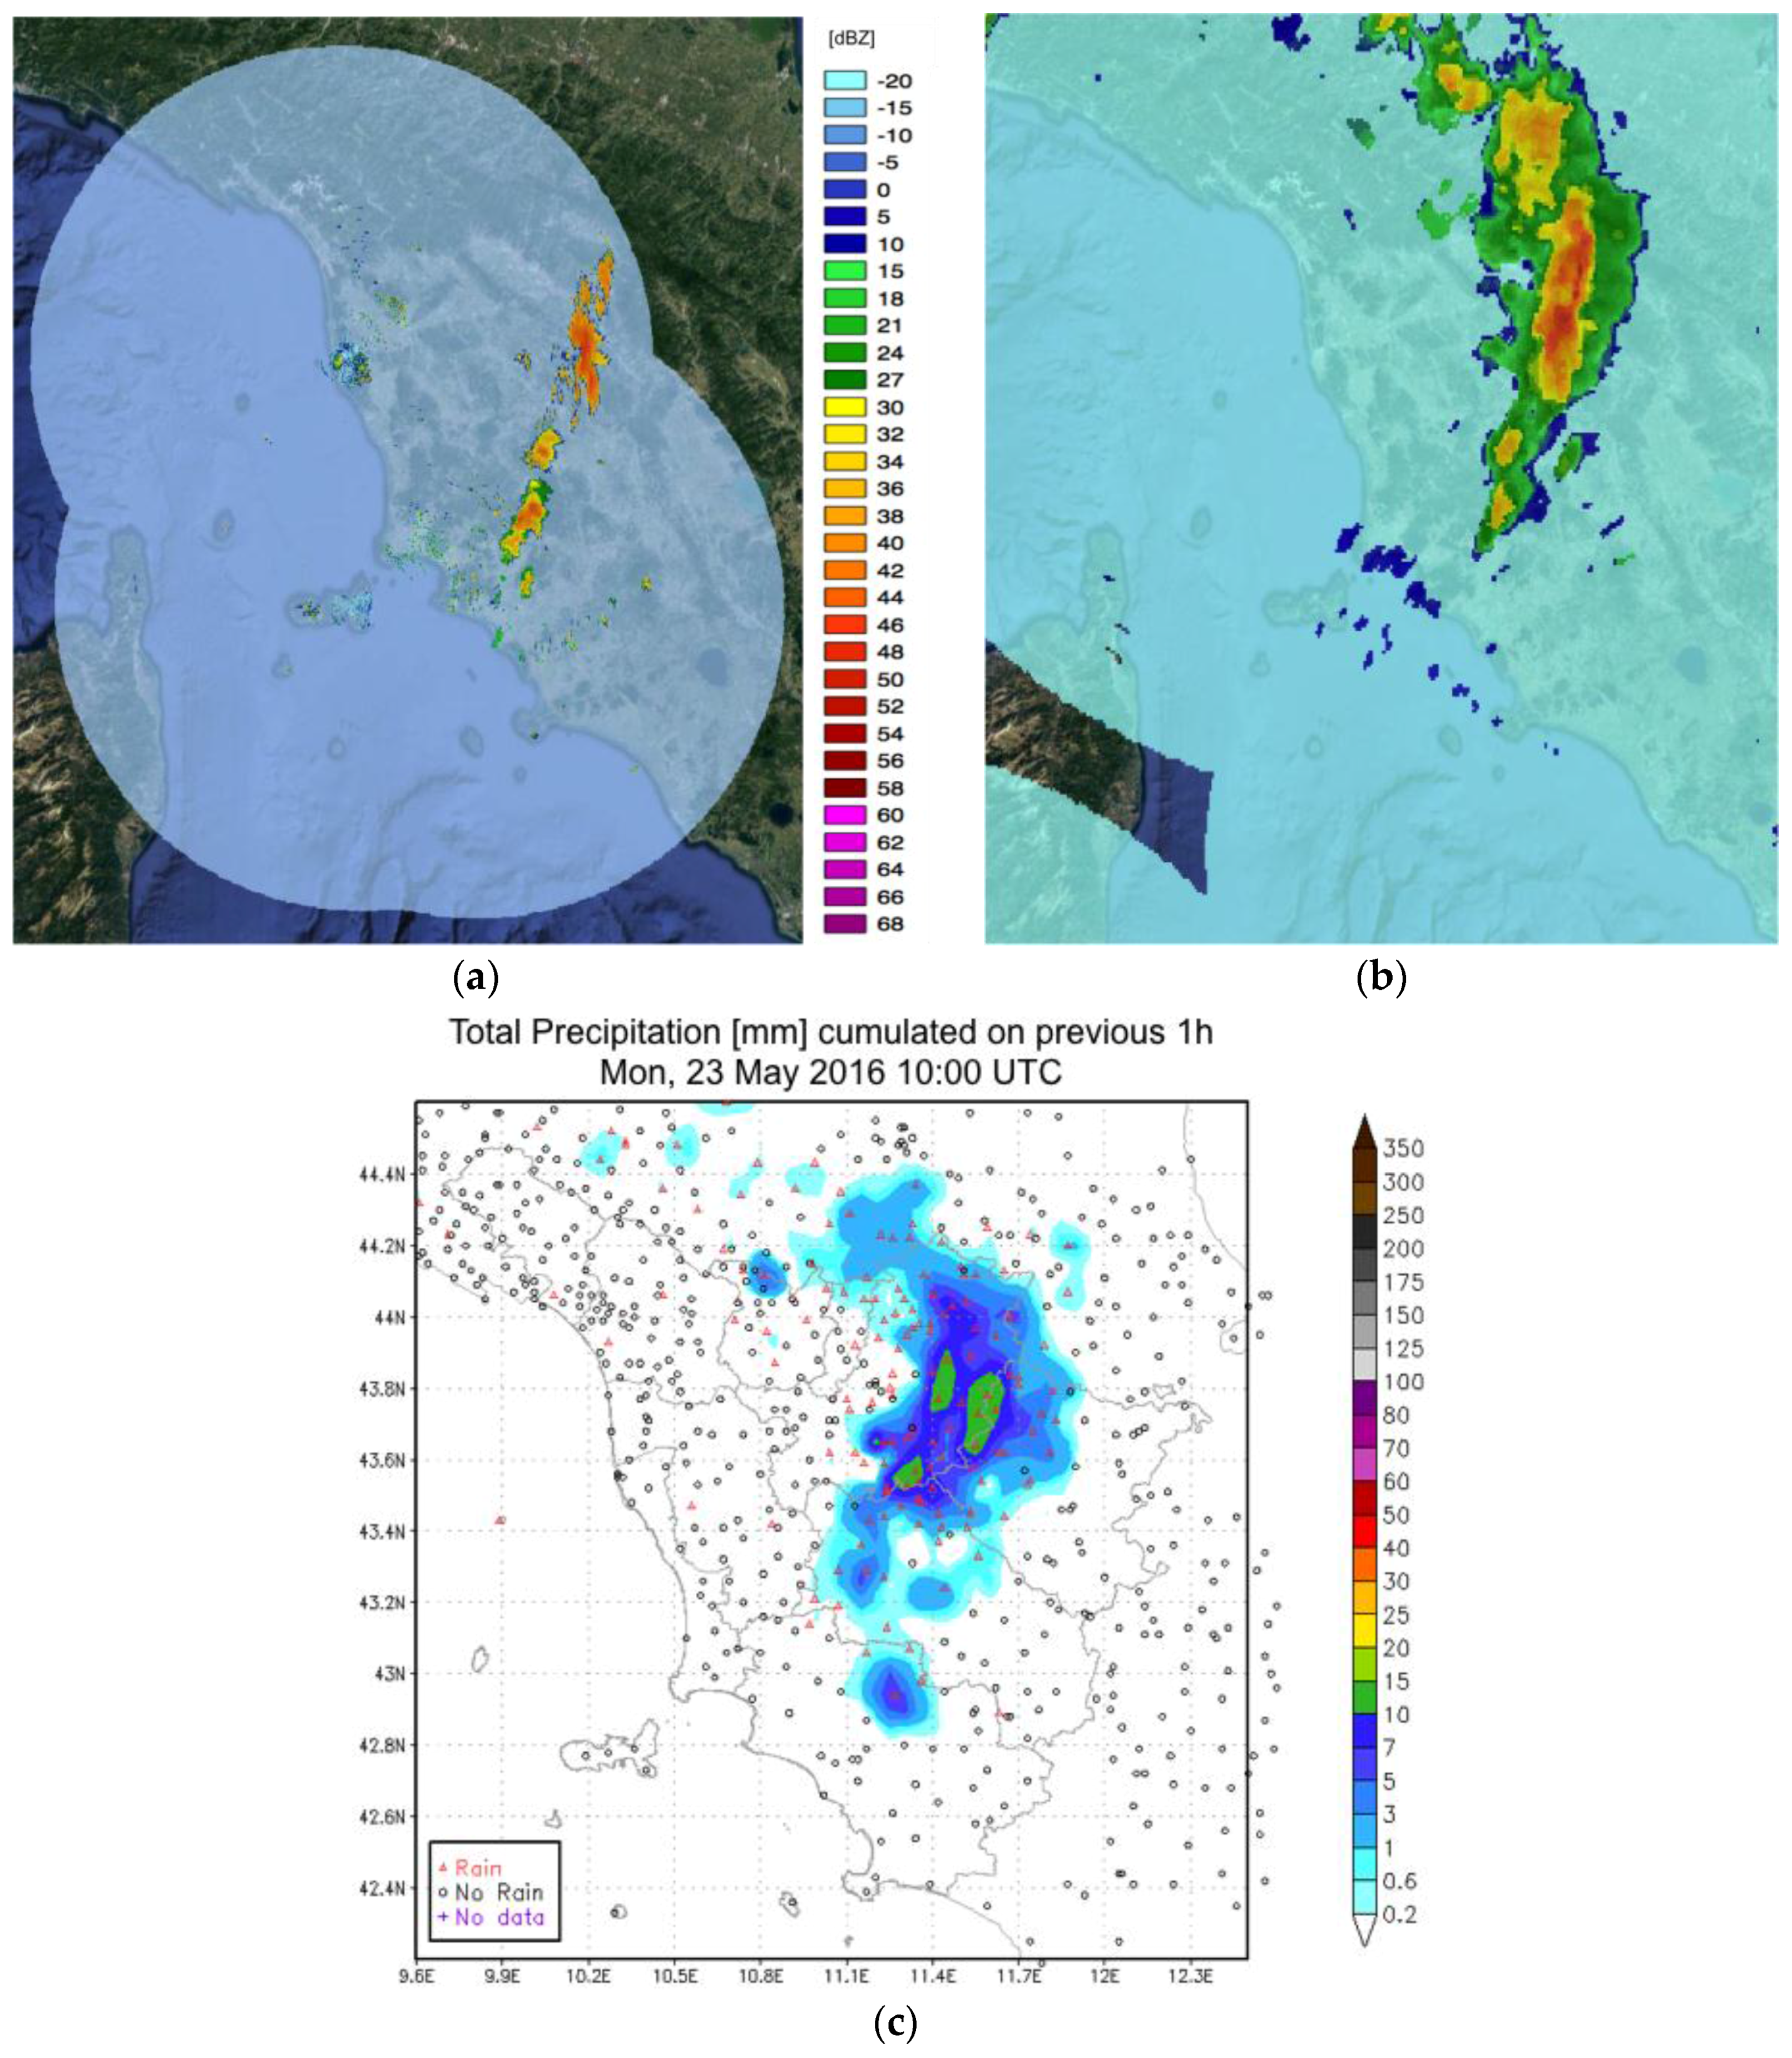
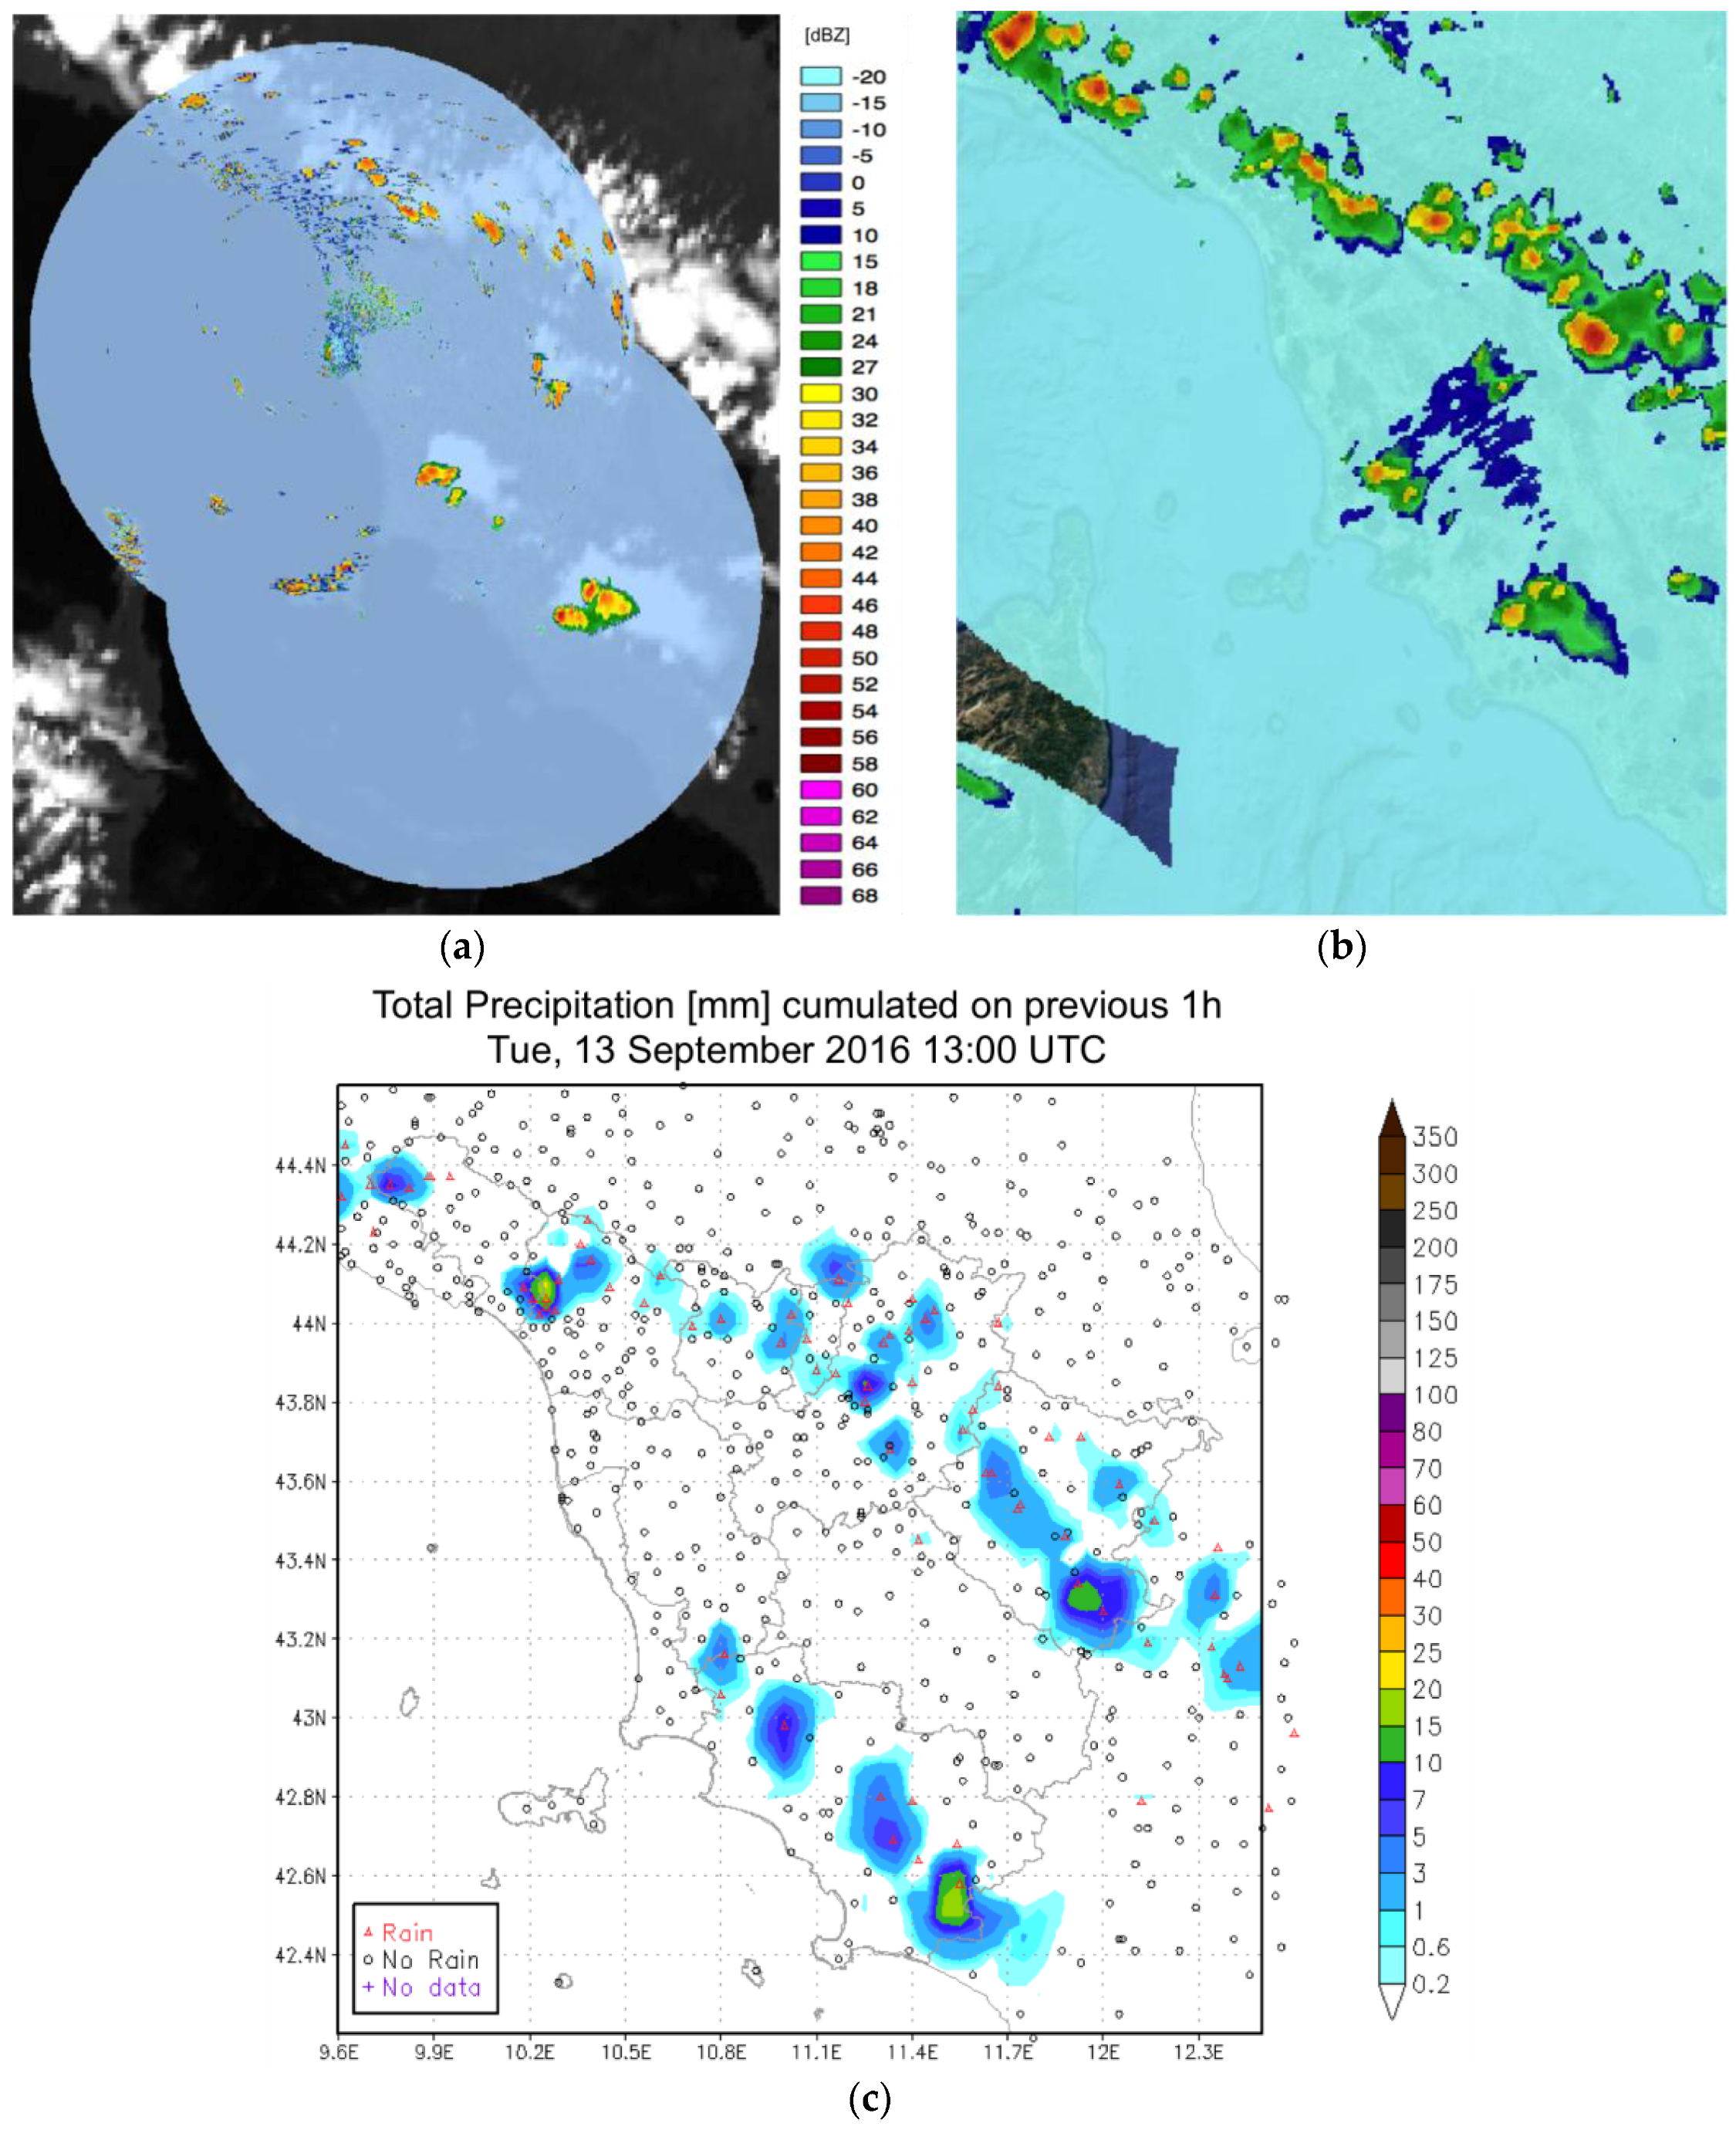
4. Analysis of Three Case Studies

The signal processing chain was tested on three selected case studies, in order to assess the reliability of the regional radar network in monitoring the precipitation events with the spatial and temporal resolutions necessary for very short range forecasting activities.
The case study of 23 May 2016, 09:00 UTC, is characterised by a cyclogenesis originating between the regions of PACA (Provence-Alpes-Côte d'Azur, France) and Piedmont (Italy) with strong atmospheric instability brought to a sequence of train fronts, that developed several convective precipitation phenomena. The fronts reached the Tuscan coasts in the early morning while moving towards the inland areas. In the late-afternoon and early-evening, new showers and thunderstorms, initially located in the northwestern areas, were in gradual shift towards the inland areas. Peaks of 24 h-cumulated precipitation up to 40 mm were registered in the internal areas along the Apennine and in the eastern part of the region.
In Figure 5a,c,e, no clutter removal is applied, and large ground clutter echoes are clearly visible near the Tuscan coasts and over Corsica, while sea clutter disturbances are also present around the radar sites of Livorno and Elba.
After the application of both (i.e., sea and ground) clutter removal schemes, most of the ground clutter is removed over the Corsican and Tuscan coasts (Figure 5b,d), as well as in the inner areas of the southern part of the region (Figure 5f), even if some disturbances still remain, mainly close to the radar sites of Elba and Livorno. The sea clutter is largely reduced around the Elba radar site (Figure 5d) and also around Livorno (Figure 5b), however with less effectiveness; in fact, some noisy echoes with low reflectivity values still remain due to the persistence of clutter. The same also occurs in the scans at higher elevations (up to 2.5°) for both radars. Note the semi-circular shape of the sea clutter with rather high values of reflectivity around the Livorno site (Figure 5a) due to its low altitude above the sea level, which facilitates unwanted interactions of the radar signal with the marine surface. Additionally, around Elba Island (Figure 5c) there is often the presence of circular clutter echoes, which, however, rapidly disappear at higher elevations thanks to the radar position at about 470 m above the sea level (a.s.l.).
After the clutter filtering, the principal precipitation patterns of the systems impacting the south-eastern part of Tuscany are retained, although slightly reduced in their extension. Undoubtedly, the algorithm has to properly balance the efficient removal of clutter echoes while keeping the relevant rainfall features.
A mosaic of the three radars has been implemented for the above described case study, after the application of both the sea and ground clutter removal processes (Figure 6a). The good performances of the clutter removal schemes in eliminating most of the sea and ground disturbances is clearly evident.
In order to assess the quality of this final product, a comparison was performed with the Italian national radar mosaic (Figure 6b) and with hourly-cumulated precipitation fields, elaborated from measurements of the regional rain gauge network (Figure 6c). The weather station network in Tuscany consists of 801 measurement sites equipped with rain gauges and other meteorological sensors. The rain gauge measurements are representative for an area of a few dm2 with a typical accuracy of 0.2 mm for the tipping bucket gauges.
The precipitation events are correctly detected in space and time and the higher spatial resolution of the X-band systems with respect to the C- and S-band radars allows for the non-upgraded spatial characterisation of the precipitation systems, with an improved definition of the rainfall field patterns, as noted for the cells in the south- and north-eastern part of the region.
On the other hand, due to the rapid attenuation of the signal with the distance, some reflectivity echoes far from the Livorno radar site were lost, observed by both the rain gauge and the national radar networks in the northern part of Tuscany. For this reason, it is important to proceed towards an integrated network approach that is capable to reducing the signal loss problems, improving attenuation correction, and increasing the spatial and temporal resolutions of the final products.
The second case study is for 13 September 2016, for which we show an example of a radar mosaic image superimposed to the Meteosat Second Generation (MSG) High Resolution Visible (HRV) channel at 12:00 UTC (Figure 7a). In this case, only the Livorno and the Castiglione della Pescaia radars are processed, because the Elba system was out of order during the case study period. Over the central Mediterranean, the atmospheric pressure maintained medium to high values, with a weak flow of current from the northeast towards the Italian peninsula. Infiltration of cold air at high altitudes from the Balkans determined instability conditions in the Tuscan inland areas. In the late morning, cumulus clouds developed in the inner areas behind the reliefs and scattered thunderstorms developed in the hinterland in the afternoon. A maximum precipitation of about 50 mm cumulated in 24 h was registered in the proximity of the Apuan Alps and up to 40 mm in the hinterland of Grosseto.
Very localised precipitation cells that are widespread across Tuscany are well detected by the regional network, as shown from the overlapping with the MSG reflectance image, in which cloud systems are clearly visible in bright white color (Figure 7a). In addition, the greater spatial resolution of the regional X-band radars allows the detection of the precipitation patterns more accurately than the national C- and S-band ones, and allows the observation of more and finer structures within the precipitation cells with respect to the National Mosaic (Figure 7b). Finally, the comparison with the 1-h (12:00–13:00 UTC) cumulated precipitation obtained from the regional rain gauge network further confirms the reliability of the implemented signal processing chain in detecting the precipitation systems and their fine spatial structure (Figure 7c), reminding us that we are comparing instantaneous radar imagery with precipitation fields obtained from rain gauge measurements cumulated for one hour.
Some clutter disturbances over the sea and near the coasts still remain: for this purpose, the development of additional filters which account, for example, for the range dependence of the sea clutter near the Livorno site is in progress, and it should further improve the performances of the present schemes for removing the clutter effects.
A third case study, characterised by local heavy precipitations, was further investigated. On 8 June 2016, the central Mediterranean was characterised by an increasing surface pressure with moderate conditions of atmospheric instability caused by the intrusion of fresh air at high altitudes. In the early morning, a few clouds associated with mist and fog developed in the inland plains and hilly areas. By the late morning, cumulus clouds generated in the internal areas gave rise in the afternoon to scattered showers and thunderstorms, locally heavy, in the Garfagnana and in the provinces of Florence, Siena, and Arezzo. A cumulated value of precipitation of about 40 mm in 1 h was registered in the hinterland of Florence.
Figure 8c shows the MSG HRV reflectance image in which an extended cloud system developed in the inland areas of Tuscany is visible. Very bright, white clouds attest for a great vertical development of the systems. Also in this case, the precipitation cells, whose rainfall intensity was measured by the rain gauge network (Figure 8d), were correctly localised in time and space, with valuable pattern details (see Figure 8a). The precipitation structures are observed in a more detailed way by the regional network than by the national mosaic, which shows a reflectivity signal that is spread over most of the Tuscan territory (Figure 8b). The finer spatial resolution of the X-band systems results in a better characterisation of the precipitation events. Conversely, the greater attenuation of the X-band wavelength with the distance sometimes causes the partial loss of reflectivity signal, as in the north-eastern areas of the region.
Moreover, the regional radar network (Figure 8a) identifies a small precipitation cell in central-eastern Corsica in an area not covered by the Italian weather radar network (Figure 8c shows a cloud system originating in the Corsican mountains). Only a few pixels of the national network have low reflectivity values (<25 dBZ) in this area (Figure 8b).
Some ground clutter disturbances still remained along the Tuscan coasts and on Elba Island and Corsica: further methods for assessing the reflectivity thresholds are under development to remove these spurious signals.
Finally, a 3D preliminary product has been realised in a GIS environment (see Figure 9) for the case study of 23 May 2016, 09:00 UTC. The shapefiles for the 3D contour reflectivity of the three radars with an elevation of 2° have been superimposed to an ASTER DTM (10 m resolution), in order to obtain a 3D view of the observed cloud systems.
Undoubtedly, the combination of homogeneous information coming from different layers in the atmosphere allows us to directly characterise the spatial distribution of the precipitation clouds. The partial overlapping of the radar footprints provides significant information about different heights and stages of cloud formation. Using this 3D approach, the reflectivity value is assigned to its effective height in the atmosphere, showing the centroid of each 3D cell.

5. Conclusions

In this paper, the setup of a regional X-band radar network is described, with focus on the reasons leading to the different development steps, both from the technical and scientific points of view. In Tuscany, most of the precipitation events originate in the southwest direction with orographic triggering. Indeed, the combined effect of mountains in proximity of the coast with the airmass flow over the sea ingesting humidity is one of the principal causes of heavy precipitations. Therefore, the implementation of the network in this initial phase mainly involved the coverage of coastal areas, including a large portion of the Tyrrhenian Sea, to improve the monitoring over this area and to fill some coverage gaps of the national weather radar network in Italy. Once the radar sites were defined and the installation procedures were completed, the network became operational. It is currently used for carrying out the institutional surveillance duties of the LaMMA Consortium, which is the weather service of the regional administration of Tuscany. The standard products are presently used as provided by the company that supplied the radar systems. At the same time, the development of a chain for processing the radar signals has been set up to exploit the whole information content of the volume scans. This work has involved the whole processing chain from the acquisition of the signal power to its conversion in reflectivity before addressing the issues of geolocation and signal filtering for clutter removal. Finally, a composite method has been implemented for merging all the information provided by the radars into an integrated weather monitoring system. A minimum set of four elevations for each scan has been identified, suitable for signal processing and clutter filtering, essentially without information loss. The signal processing results were shown, with particular focus on sea and ground clutter removal. The mosaic results were then compared with ancillary data for three case studies relating to different seasons and precipitation types.
The present paper describes what is still a preliminary product currently under testing, which is providing good results especially on monitoring intense events and their spatial and temporal characterisation (as validated during the LaMMA operational surveillance duties). It still has some limitations and critical aspects from which suggestions for future studies can be derived. For example, the information on the visibility field should be included in the composite generation, in order to avoid contamination of uncorrected clutter or signal power weakness due to partial beam blockage. Additionally, the vertical profile of reflectivity should be considered to improve the assessment of the weather patterns and to correct for the effects of the attenuation and bright band [43]. Regarding the clutter removal algorithms, more sophisticated techniques should be investigated such as Bayesian approaches [44] or adaptive filtering schemes [45], to evaluate their impacts on the signal processing. In addition, as proposed by [45], the range should be considered as a further parameter to discriminate clutter free cells, because large distances imply great sampling heights in the atmosphere and consequently a lower probability of finding clutter echoes.
Some additional efforts will be put to further investigate the best operational scanning strategy consisting of a proper combination of time and space resolutions. This configuration should better exploit the technical characteristics of the X-band radar systems for resolving and monitoring precipitation dynamics at very local scales.

Acknowledgments

The Central Department of National Civil Protection (DPCN), in the framework of its institutional activities of weather monitoring, provided radar data. Rain gauge data were provided by the Tuscan regional meteorological network managed by the Hydrological Service of regional administration of Tuscany. MSG imagery is the copyright of EUMETSAT, and it was made available by EUMETSAT’s Unified Meteorological Archive and Retrieval Facility (UMARF).

Author Contributions

Andrea Antonini and Samantha Melani conceived and designed the network, analysed the data, and wrote the paper. Manuela Corongiu and Stefano Romanelli conceptually designed and implemented the 3D spatial data infrastructure and wrote the relative contribution to the paper. Alessandro Mazza made the radar intercomparison and wrote the relative contribution to the paper. Alberto Ortolani revised the whole paper and with Bernardo Gozzini supervised the working team and coordinated the activities.

Conflicts of Interest

The authors declare no conflict of interest.

References

  1. Chang, P.L.; Lin, P.F.; Jou, B.J.D.; Zhang, J. An Application of Reflectivity Climatology in Constructing Radar Hybrid Scans over Complex Terrain. J. Atmos. Ocean. Technol. 2009, 26, 1315–1327. [Google Scholar] [CrossRef]
  2. Matyas, C.J. Use of Ground-based Radar for Climate-Scale Studies of Weather and Rainfall. Geogr. Compass 2010, 4, 1218–1237. [Google Scholar] [CrossRef]
  3. Antonini, A.; Melani, S.; Ortolani, A.; Pieri, M.; Gozzini, B. Qualitative weather radar mosaic in a multi-sensor rainfall monitoring approach. J. Appl. Remote Sens. 2012, 6, 063572. [Google Scholar] [CrossRef]
  4. Mazza, A.; Antonini, A.; Melani, S.; Ortolani, A. Re-calibration of cumulative rainfall estimates by weather radar over a large area. J. Appl. Remote Sens. 2015, 9, 095993. [Google Scholar] [CrossRef]
  5. Assess the Current and Potential Capabilities of Weather Radars for the Use in WMO Integrated Global Observing System (WIGOS). In Proceedings of the Joint Meeting of the CIMO Expert Team on Remote Sensing Upper-air Technology and Techniques and CBS Expert Team on Surface Based Remote Sensing, Geneva, Switzerland, 23–27 November 2009; Available online: http://www.wmo.int/pages/prog/www/IMOP/meetings/Upper-Air/ET-RSUATT-2/DocPlan.html (accessed on 20 October 2016).
  6. Antonini, A.; Melani, S.; Corongiu, M.; Mazza, A.; Ortolani, A. Radar Networking over the Tyrrenian Sea. In Proceedings of the 8th European Conference on Radar in Meteorology and Hydrology ERAD 2014, Garmisch-Partenkirchen, Germany, 1–5 September 2014.
  7. Shah, S.; Notarpietro, R.; Branca, M. Storm Identification, Tracking and Forecasting Using High-Resolution Images of Short-Range X-Band Radar. Atmosphere 2015, 6, 579–606. [Google Scholar] [CrossRef]
  8. Chandrasekar, V.; Wang, Y.; Chen, H. The CASA quantitative precipitation estimation system: A five year validation study. Nat. Hazards Earth Syst. Sci. 2012, 12, 2811–2820. [Google Scholar] [CrossRef]
  9. Van de Beek, C.Z.; Leijnse, H.; Stricker, J.N.M.; Uijlenhoet, R.; Russchenberg, H.W.J. Performance of high-resolution X-band radar for rainfall measurement in The Netherlands. Hydrol. Earth Syst. Sci. 2010, 14, 205–221. [Google Scholar] [CrossRef]
  10. Lengfeld, K.; Clemens, M.; Münster, H.; Ament, F. Performance of high-resolution X-band weather radar networks—The PATTERN example. Atmos. Meas. Tech. 2014, 7, 4151–4166. [Google Scholar] [CrossRef]
  11. Capozzi, V.; Picciotti, E.; Mazzarella, V.; Budillon, G.; Marzano, F.S. Hail storm hazard in urban areas: Identification and probability of occurrence by using a single-polarization X-band weather radar. Hydrol. Earth Syst. Sci. 2016. [Google Scholar] [CrossRef]
  12. Lo Conti, F.; Francipane, A.; Pumo, D.; Noto, L.V. Exploring single polarization X-band weather radar potentials for local meteorological and hydrological applications. J. Hydrol. 2015, 531, 508–522. [Google Scholar] [CrossRef]
  13. McLaughlin, D.; Pepyne, D.; Philips, B.; Kurose, J.; Zink, M.; Westbrook, D.; Lyons, E.; Knapp, E.; Hopf, A.; Defonzo, A.; et al. Short-Wavelength Technology and the Potential For Distributed Networks of Small Radar Systems. Bull. Am. Meteorol. Soc. 2009, 90, 1797–1817. [Google Scholar] [CrossRef]
  14. Vulpiani, G.; Montopoli, M.; Passeri, L.; Gioia, A.; Giordano, P.; Marzano, F. On the Use of Dual-Polarized C-Band Radar for Operational Rainfall Retrieval in Mountainous Areas. J. Appl. Meteorol. Climatol. 2012, 51, 405–425. [Google Scholar] [CrossRef]
  15. Mappa Radar. Available online: http://www.protezionecivile.gov.it/jcms/it/mappa_radar.wp (accessed on 1 November 2016).
  16. Doviak, R.J.; Zrnić, D.S. Doppler Radar and Weather Observations, 2nd ed.; Dover Publications: Mineola, NY, USA, 1993. [Google Scholar]
  17. International Telecommunication Union. Recommendation ITU-R P.676-11 Attenuation by Atmospheric Gases; International Telecommunication Union: Geneva, Switzerland, 2016. [Google Scholar]
  18. Heistermann, M.; Jacobi, S.; Pfaff, T. Technical Note: An open source library for processing weather radar data (wradlib). Hydrol. Earth Syst. Sci. 2013, 17, 863–871. [Google Scholar] [CrossRef]
  19. EPSG Dataset. Available online: http://www.epsg.org/ (accessed on 1 November 2016).
  20. Photogrammetry Round the World. Photogramm. Rec. 1961, 3, 545–551.
  21. Advanced Spaceborne, Thermal Emission and Reflection Radiometer. ASTER GDEM Is a Product of METI and NASA. Available online: http://asterweb.jpl.nasa.gov/GDEM.ASP (accessed on 1 November 2016).
  22. Steiner, M.; Smith, J.A. Use of three-dimensional reflectivity structure for automated detection and removal of non-precipitating echoes in radar data. J. Atmos. Ocean. Technol. 2002, 19, 673–686. [Google Scholar] [CrossRef]
  23. Steiner, M.; Smith, J.A.; Kessinger, C.; Ferrier, B.S. Evaluation of algorithm parameters for radar data quality control. In Proceedings of the 29th International Conference on Radar Meteorology, Montreal, QC, Canada, 12–16 July 1999; pp. 582–585.
  24. Moszkowicz, S.; Ciach, G.J.; Krajewski, W.F. Statistical detection of anomalous propagation in radar reflectivity patterns. J. Atmos. Ocean. Technol. 1994, 11, 1026–1034. [Google Scholar] [CrossRef]
  25. Rosenfeld, D.; Amital, E.; Wolff, D.B. Classification of rain regimes by the three dimensional properties of reflectivity fields. J. Appl. Meteorol. 1995, 34, 198–211. [Google Scholar] [CrossRef]
  26. Kulie, M.S.; Robinson, M.; Marks, D.A.; Ferrier, B.S.; Rosenfeld, D.; Wolff, D.B. Operational processing of ground validation data for the Tropical Rainfall Measuring Mission. In Proceedings of the 29th International Conference on Radar Meteorology, Montreal, QC, Canada, 12–16 July 1999; pp. 736–739.
  27. Grecu, M.; Krajewski, W.E. An efficient methodology for detection of anomalous propagation echoes in radar reflectivity data using neural networks. J. Atmos. Ocean. Technol. 2000, 17, 121–129. [Google Scholar] [CrossRef]
  28. Smith, J.A.; Baeck, M.L.; Steiner, M.; Bauer-Messmer, B.; Zhao, W.; Tapia, A. Hydrometeorological Assessments of the NEXRAD Rainfall Algorithms; NOAA National Weather Service Final Report; Office of Hydrology—Hydrologic Research Laboratory: Silver Springs, MA, USA, 1996; p. 59.
  29. Kessinger, C.; Ellis, S. The radar echo classifier: A fuzzy logic algorithm for the WSR-88D. In Proceedings of the 3rd Conference on Artificial Intelligence Applications to the Environmental Science, Long Beach, CA, USA, 9–13 February 2003; pp. 1–11.
  30. Lee, R.; della Bruna, G.; Joss, J. Intensity of ground clutter and of echoes of anomalous propagation and its elimination. In Proceedings of the 27th Conference on Radar Meteorology, Vail, CO, USA, 9–13 October 1995; pp. 651–652.
  31. Andersson, T.; Alberoni, P.P.; Mezzasalma, P.; Michelson, D.B.; Nanni, S. Anomalous propagation: Identification from terrain and sea waves using vertical reflectivity profile analysis. In Proceedings of the 28th Conference on Radar Meteorology, Austin, TX, USA, 7–12 September 1997; pp. 93–94.
  32. Bellon, A.; Kilambi, A. Updates to the McGill RAPID (Radar Data Analysis, Processing and Interactive Display) system. In Proceedings of the 29th Conference on Radar Meteorology, Montreal, QC, Canada, 12–16 July 1999; pp. 121–124.
  33. Lee, G.W.; Cho, Y.-H.; Kim, K.-E.; Zawadzki, I. Identification and removal of non-precipitation echoes using the characteristics of radar echoes. In Proceedings of the 29th Conference on Radar Meteorology, Albuquerque, NM, USA, 23–29 October 2005.
  34. Trapp, R.J.; Doswell, C.A., III. Radar data objective analysis. J. Atmos. Ocean. Technol. 2000, 17, 105–120. [Google Scholar] [CrossRef]
  35. Andrieu, H.; Creutin, J.-D.; Faure, D. Use of a weather radar for the hydrology of a mountainous area. Part I: Radar measurement interpretation. J. Hydrol. 1997, 193, 1–25. [Google Scholar] [CrossRef]
  36. Aoyagi, J. A study on the MTI weather radar system for rejecting ground clutter. Pap. Meteorol. Geophys. 1983, 33, 187–243. [Google Scholar] [CrossRef]
  37. Passarelli, R.E., Jr. Parametric estimation of Doppler spectral moments: An alternative ground clutter rejection technique. ]. Clim. Appl. Meteorol. 1983, 22, 850–857. [Google Scholar] [CrossRef]
  38. Sugier, J.; Chatelet, J.P.D.; Roquain, P.; Smith, A. Detection and removal of clutter and anaprop in radar datausing a statistical scheme based on echo fluctuation. Proc. ERAD 2002, 17–24. Available online: http://copernicus.org/erad/online/erad-17.pdf / (accessed on 1 November 2016). [Google Scholar]
  39. Wessels, H.R.A.; Beekhuis, J.H. Automatic Suppression of Anomalous Propagation Clutter for Noncoherent Weather Radars; Scientific Report WR-92-06; Royal Netherlands Meteorological Institute (KNMI): De Bilt, The Netherlands, 1992. [Google Scholar]
  40. Holleman, I.; Beekhuis, H. Review of the KNMI Clutter Removal Scheme; Technical Report, KNMI TR-284; Royal Netherlands Meteorological Institute (KNMI): De Bilt, The Netherlands, 2004; Available online: https://www.researchgate.net/profile/Hans_Beekhuis/publication/265355631_Review_of_the_KNMI_clutter_removal_scheme/links/54d881bd0cf2970e4e77e3c7.pdf (accessed on 1 September 2016).
  41. Orville, H.D.; Kopp, F.J.; Myers, C.G. The dynamics and thermodynamics of precipitation loading. Pure Appl. Geophys. 1975, 113, 983–1004. [Google Scholar] [CrossRef]
  42. NEXRAD Products. Available online: https://www.ncdc.noaa.gov/data-access/radar-data/nexrad-products (accessed on 1 November 2016).
  43. Zhang, J.; Langston, C.; Howard, K. Brightband Identification Based on Vertical Profiles of Reflectivity from the WSR-88D. J. Atmos. Ocean. Technol. 2008, 25, 1859–1872. [Google Scholar] [CrossRef]
  44. Nicol, J.C.; Illingworth, A.J.; Darlington, T.; Sugier, J. Techniques for improving ground clutter identification. In Weather Radar and Hydrology, Proceedings of the Exeter Symposium, Exeter, UK, 18–21 April 2011; Moore, R.J., Cole, S.J., Illingworth, A.J., Eds.; IAHS Press: Wallingford, UK, 2011; pp. 45–51. [Google Scholar]
  45. Berenguer, M.; Sempere-Torres, D.; Corral, C.; Sánchez-Diezma, R. A fuzzy logic technique for identifying nonprecipitating echoes in radar scans. J. Atmos. Ocean. Technol. 2006, 23, 1157–1180. [Google Scholar] [CrossRef]
Figure 1. Simulated visibility map of the Tuscan X-band weather radar network over the whole coverage area considering a scan elevation angle of 1.5° (Livo: Livorno, Elba, and Casti: Castiglione della Pescaia radars).
Atmosphere 08 00025 g001
Figure 2. Different overviews of the 3D geolocation of the Plan Position Indicator (PPI) conical scans geometry for the three X-band radars. Elevation is 5°.
Atmosphere 08 00025 g002
Figure 3. Flow chart of the clutter removal scheme: (a) Set-up in clear air conditions; (b) Operational sea and ground clutter identification algorithm.
Atmosphere 08 00025 g003
Figure 4. Example of values computed during clear air conditions for the 5 February 2016, 15:00 UTC: (a) Histogram of standard deviation of reflectivity for 1° cells; (b) Resulting cumulative distribution function.
Atmosphere 08 00025 g004
Figure 5. PPI radar scans at an elevation of 1.5° for 23 May 2016, 09:00 UTC, without (left panels) and with (right panels) the application of the sea and ground clutter removal algorithms for the radars of Livorno (a,b); Elba (c,d); and Castiglione della Pescaia (e,f).
Atmosphere 08 00025 g005aAtmosphere 08 00025 g005b
Figure 6. Case study of 23 May 2016, 09:00 UTC: (a) Mosaic of VMI (Vertical Maximum Indicator) reflectivity for the regional X-band radar network; (b) Mosaic of VMI reflectivity for the Italian National weather radar network; (c) 1-h (09:00–10:00 UTC) cumulated precipitation obtained from measurements of the regional rain gauge network.
Atmosphere 08 00025 g006
Figure 7. For the case study of 13 September 2016, 12:00 UTC: (a) Mosaic of VMI reflectivity for the regional X-band radar network, only for the Livorno and Castiglione della Pescaia radars, superimposed to the MSG (Meteosat second Generation) HRV (High Resolution Visible) channel; (b) Mosaic of VMI reflectivity for the Italian National weather radar network; (c) 1-h (12:00–13:00 UTC) cumulated precipitation obtained from measurements of the regional rain gauge network.
Atmosphere 08 00025 g007
Figure 8. For the case study of 8 June 2016: (a) Mosaic of VMI reflectivity for the regional X-band radar network (12:45 UTC); (b) Mosaic of VMI reflectivity for the Italian National weather radar network (12:50 UTC); (c) MSG HRV channel (12:45 UTC); (d) 1-h (12:00–13:00 UTC) cumulated precipitation obtained from measurements of the regional rain gauge network.
Atmosphere 08 00025 g008
Figure 9. For the case study of 23 May 2016, 09:00 UTC, different overviews of the 3D reflectivity mosaic for an elevation of 2°, merging the radars of Livorno, Elba Island, and Castiglione della Pescaia: (a) northern perspective drawing, (b) southeastern perspective drawing, (c) southwestern perspective drawing.
Atmosphere 08 00025 g009
Table 1. WR10X radar technical specifications.
ParameterValue
Operating frequency9.410 ± 0.03 GHz
Peak power10 kW
Pulse width0.6 μs
Pulse Repetition Frequency800 Hz
Receiver dynamics>90 dB, 8 bits codify
Sensitivity10 dBZ @ 25 km
Noise figure<4 dB
Minimum Detectable Signal<−100 dB
Antenna typeCircular Pencil beam diameter 70 cm
Antenna 3 dB lobe<3.2° in elevation and in azimuth
Antenna gain35/40 dB
Antenna speed20°/s

