Article

Lightning and Rainfall Characteristics in Elevated vs. Surface Based Convection in the Midwest that Produce Heavy Rainfall

Department of Atmospheric Science, School of Natural Resources, University of Missouri, Columbia, MO 65211, USA
*
Author to whom correspondence should be addressed.
Atmosphere 2017, 8(2), 36; https://doi.org/10.3390/atmos8020036
Submission received: 3 January 2017 / Revised: 27 January 2017 / Accepted: 7 February 2017 / Published: 14 February 2017

Abstract

:
There are differences in the character of surface-based and elevated convection, and one type may pose a greater threat to life or property. The lightning and rainfall characteristics of eight elevated and eight surface-based thunderstorm cases that occurred between 2007 and 2010 over the central Continental United States were tested for statistical differences. Only events that produced heavy rain (>50.8 mm·day−1) were investigated. The nonparametric Mann–Whitney test was used to determine if the characteristics of elevated thunderstorm events were significantly different than the surface based events. Observations taken from these cases include: rainfall–lightning ratios (RLR) within the heavy rain area, the extent of the heavy rainfall area, cloud-to-ground (CG) lightning flashes, CG flashes·h−1, positive CG flashes, positive CG flashes·h−1, percentage of positive CG flashes within the heavy rainfall area, and maximum and mean rainfall amounts within the heavy rain area. Results show that elevated convection cases produced more rainfall, total CG lightning flashes, and positive CG lightning flashes than surface based thunderstorms. More available moisture and storm morphology explain these differences, suggesting elevated convection is a greater lightning and heavy rainfall threat than surface based convection.

1. Introduction

Research into elevated convection has been ongoing for many years. A climatology of elevated thunderstorms [1,2] showed that the central United States is the focus for occurrences of elevated convection. Elevated thunderstorm complexes are often associated with heavy rain and can lead to flash flooding [3,4,5]. However, surface based thunderstorms also produce heavy rain and flash flooding.
This study aims to investigate the observed differences in the mesoscale environment between elevated thunderstorms and surface based thunderstorms that produced heavy rain. The environmental differences will be explored using both plan-view and sounding composites of elevated and surface based convection. Observational differences will be examined in rainfall–lightning ratios (RLR) within the heavy rain area, the extent of the heavy rainfall area, cloud-to-ground (CG) lightning flashes, CG flashes per hour, positive CG flashes, positive CG flashes per hour, percentage of positive CG flashes within the heavy rainfall area, and maximum and mean rainfall amounts within the heavy rain area. The heavy rainfall area is defined as the continuous area in which >50.8 mm·day−1 (two inches) of rain fell in association with elevated thunderstorms or surface based thunderstorms. This threshold was selected due to previous work with elevated convection [5]. All of the cases investigated during this study occurred over Missouri, Kansas and Iowa in the central USA (Figure 1) during the months of May to September 2007–2010.
The results of this study are important as they show that there is a clear difference in mesoscale environmental conditions between elevated and surface based cases. These differences directly point to higher observations in rainfall and lightning amounts and coverage. Furthermore, these differences are not subtle, but rather predictable and therefore should be able to be forecasted.
Heavy rainfall is commonly caused by deep moist convection, and can lead to flash flooding. Flash flooding is responsible for the second greatest number of weather-related fatalities in the United States, behind only extreme heat [6]. Convective rainfall is very well correlated with cloud-to-ground (CG) lightning flashes [7,8,9]. It is now understood that the common processes necessary for heavy rainfall are similar to those which cause lightning, and were discussed as early as 1965 (e.g., [10,11]). While flash flooding is more dangerous, lightning also poses a threat to life and property. The most recent weather related fatalities assessment covering the last 30 years (1984–2013) by the National Weather Service (NWS) [12] found lightning to be the third highest cause of fatalities. CG lightning is a serious, well documented, threat from any thunderstorm [13,14]. This study shows that CG lightning (total and positive CG flash counts) remains a threat from elevated thunderstorms as well. Positive CG flashes are arguably the more dangerous type of flashes [15], given their ability to produce stronger peak currents [16] and can cause serious harm to people and their property. These facts motivated the current work.
Section 1 discusses the background of previously conducted studies and provide reasons as to why these cases were selected. Section 2 discusses the methods used and their rationale. In Section 3, the results and analyses are presented. Section 4 consists of discussion and the conclusions of the study.

2. Data and Methods

2.1. Data

A direct comparison of surface-based and elevated convection in the context of lightning and heavy rain characteristics has yet to appear in the literature. We look first to the research on RLRs, which began in earnest with [10]. A relationship had been established between lightning flashes and rainfall before [10], but this work was the foundation for many studies to follow. The work of [17] conducted a RLR study on the storm scale, analyzing 22 thunderstorms over Florida. The median RLR, which expressed the convective rainfall volume per CG lightning flash, for the 22 storms was 4.3 × 10⁷ kg·fl−1. An important conclusion of the study was that the RLR varies with convective regime. They [17] also concluded that high lightning frequencies led to lower RLR values. If RLR values remain high, along with elevated lightning flashes, then the corresponding rainfall would need to increase as well. This could be used as a tool in the short-term prediction of flash floods and in the hydrological analyses of the spatial distribution of rainfall in regions where radar coverage is poor.
In addition, Peterson [11] took a different approach to analyzing the RLRs. They completed a climatology of RLRs for the Continental United States (CONUS). They broke the USA into various regions of similar geography. They also computed the RLR values using a time period of one month. They found an average RLR value for the country to be 1 × 10⁸ kg·fl−1. They [
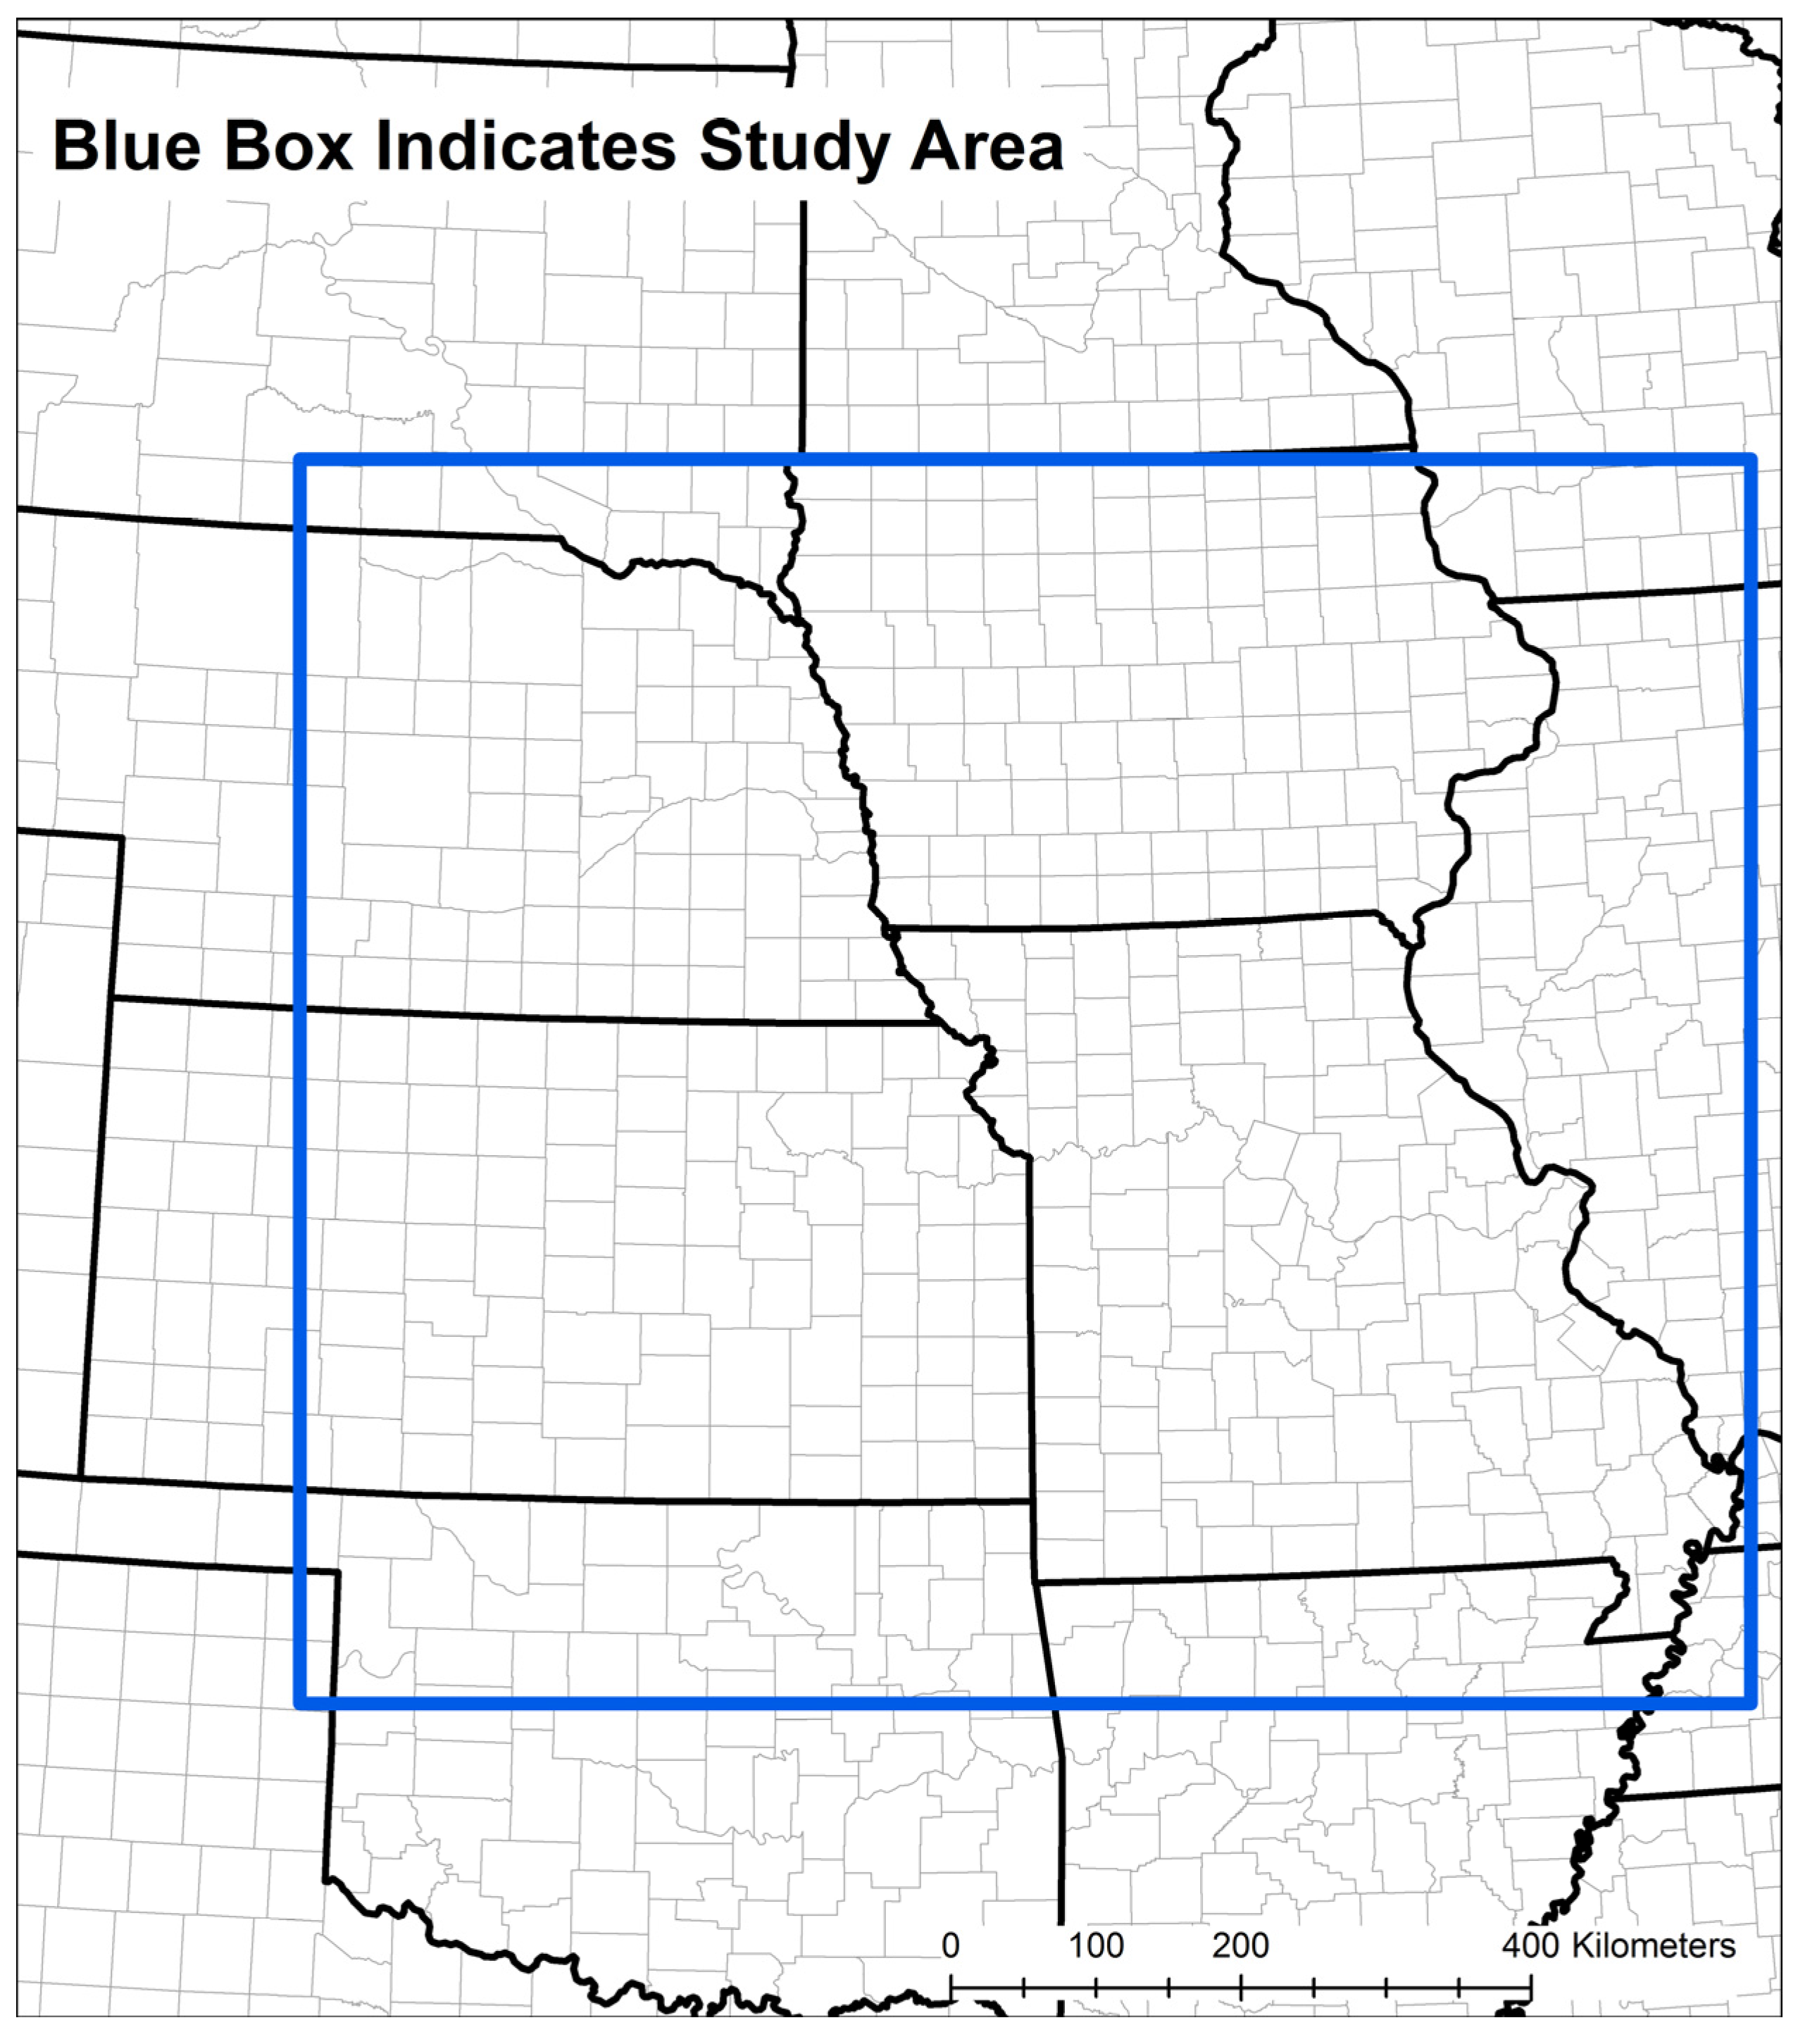
11] also stated that results seemed to be highly dependent on weather regime and geographic regime. This suggestion was taken into consideration when cases were selected for the current study. However, rather than focus on weather regime, differences in mesoscale environment were of particular interest here. Only cases that had a surface based thunderstorm and elevated thunderstorm events occurring over a similar geographic area (central United States), during a similar temporal timeframe (within 30 days), were used for this study. This study would fall into the “Mid-Continent” geographic region used by [11], which both include Missouri. Both [11] and [17] concluded that convective regimes played a large role in the distribution of RLRs. The idea of differing convective regimes is an important one, and impacts maximum and mean rainfall amounts between elevated and surface-based thunderstorms. It should be noted that this study focuses on the mesoscale convective environment and not the regime.
Looking more closely at lightning characteristics, Fuquay [18] conducted research describing positive CG lightning of 48 thunderstorm days over three consecutive summers. He found by averaging CG lightning over three years that 3% of the ground flashes were positive flashes. The data [18] compiled were ambient electric field and electric field change. The study conducted for this paper found differences between elevated and surface based thunderstorms in positive CG lightning flash percentages using data from the National Lightning Detection Network (NLDN).
Elevated convection is also a known flash flood threat as stated by [4], and was defined by [1] as a storm that is isolated from surface diabatic effects and found above a frontal inversion. The studies of [1,2] defined an elevated thunderstorm via the following selection criteria based on observations from stations reporting a thunderstorm: (1) the observation must lie on the cold side of an analyzed front that shows a clear contrast in temperature, dew point, and wind; (2) the station’s wind, temperature, and dew point must be qualitatively similar to the immediately surrounding values; and (3) the surface air on the warm side of the analyzed front must have a higher equivalent potential temperature (θe) than the air on the cold side of the front. Similar criteria were also used by [3,4,5,19,20] for studies involving elevated thunderstorms and will be used for this study as well.
The work of [3] focused on elevated mesoscale convective systems (MCS), highlighting the synoptic regimes favorable for elevated MCS and episodes of heavy rain and elevated thunderstorms. This was also the theme of [4]. The elevated thunderstorm cases occurred in synoptically favored conditions, i.e., synoptic regimes with a well-defined thermal inversion, though most occurred with boundaries (cold fronts, warms fronts and stationary fronts), which led to a wide area of heavy rainfall. The surface based thunderstorms that produces a widespread area of heavy rainfall occurred in broad synoptic conditions, similar to what is presented in [3,4] (ample moisture, lift, and instability, minus the frontal boundary). However, the surface based cases that had smaller areas of heavy rainfall did not occur over a frontal zone, or in synoptically favorable conditions. These storms often were slow moving and that was a significant cause for the heavy rainfall, not simply an atmosphere primed for heavy rainfall through moisture and instability. Then [20] also touched on the idea of favorable synoptic conditions leading to widespread heavy precipitation, however that study also included cold-season precipitation. None of the studies above make any comparison to surface based thunderstorms, but do highlight regimes that are favorable for elevated thunderstorms. Simply put, elevated convection tends to occur in environments with greater large scale organization for moisture and lift, with a thermal boundary (often a front with an inversion): surface based convection can thrive in synoptically more marginal conditions, without an inversion.
Additionally, McCoy [5] investigated over 250 cases of elevated thunderstorms over the central CONUS, which produced composites of conditions that were found just prior to elevated convection. This work proved useful as they provided a list of elevated cases in the time frame of this study. These cases were confirmed using similar methods in [1,2]. The main difference between the two regimes was the presence or absence of an inversion often below the 850-hPa level.

2.2. Methods

For comparison, statistics were calculated separately for each thunderstorm type (both within the heavy rain area): RLR within the heavy rain area, the extent of the heavy rainfall area, cloud-to-ground (CG) lightning flashes, CG lightning per hour, positive CG flashes, positive CG flashed per hour, percentage of positive CG flashes within the heavy rainfall area, and maximum and mean rainfall amounts within the heavy rain area were calculated for each category of thunderstorm. The locations of the cases were confined to the central CONUS, specifically areas in or near Missouri.
Cases were selected for investigation with the intention of minimizing bias. Elevated thunderstorm cases were selected for dates between May and September during the years 2007 to 2010. Cases identified in [5] were used. Surface based thunderstorms were only selected if they occurred during the same months and year as the elevated thunderstorm case. This does not guarantee the sets of thunderstorms occurred in a similar weather regime (as in [11]), but rather shows that both elevated and surface based thunderstorms with heavy rainfall are possible within the warm season near a given date. If more than one surface based thunderstorm case occurred in a month, the case closest to the elevated case date was used. This allowed for a balanced dataset with each thunderstorm type represented equally. This also ensured that elevated and surface based thunderstorms occurred during a similar timeframe. However, this limited the number of each type of case to eight for a total of 16 cases. Again, mesoscale environment was examined, not regime. Composites of 18 elevated and 18 surface based convective reanalysis environments are discussed further in Section 3.
The goal of this study is to compare the two populations of convective storms based on the extent of the heavy rainfall areas (>50.8 mm per 24 h) for surface based and elevated convection. The heavy rainfall area is being used as the investigation area for a few reasons: (1) it provides a common threshold for both sets of thunderstorms; (2) it focuses on the most dangerous portion of the storm (from a flooding and lightning perspective); (3) the size of the area itself is telling about the thunderstorm complexes; and (4) numerous studies [11,17,21] link heavy convective rainfall and CG lightning flashes.
The data used for this project came from a variety of sources. The lightning data were obtained from the National Lightning Detection Network (NLDN) via Vaisala, for the period 2007–2011. As noted by [17], the NLDN has a detection efficiency of 85%. This is much better than satellite sources, which vary greatly between day and night and, according to [22], can have detection efficiency of ~70%. The lightning data supply a latitude and longitude and whether the flash was CG or cloud-to-cloud (or cloud-to-air). Lightning flash rates of flashes per hour over the heavy rainfall area were used. This was calculated by dividing the total number of CG strikes within the heavy rainfall area and dividing by lightning start time and end time within the same area. Hourly flashes rates were selected as these cases are focused on the heavy rain foot print, which falls into the mesoscale temporal and spatial scale. Hourly observations are appropriate for investigating mesoscale phenomena per [23]. In addition, Reap [24] showed CG lightning flashes broken into hour bins. Radar data in Level II format was acquired through the National Climate Data Center (NCDC). The precipitation data were acquired through the National Weather Service’s (NWS) Advanced Hydrologic Prediction Service. These data are radar-estimated daily (24 h) liquid precipitation accumulation and comes as a point dataset. This dataset is rain gauge augmented as well as satellite augmented, and it treats the rain gauge values as absolute (ground) truth-values. Because the rain gauge network is neither uniform nor complete in coverage, gaps are filled in with radar-estimated precipitation accumulations. If radar data are not available, then satellite data are used to fill in the gaps. The daily data begin at 12:00 UTC and end at 11:59 UTC the day of recording. For example, the daily rainfall amounts recorded for 4 April are data from 12:00 UTC 3 April to 11:59 UTC 4 April.
In order to be selected, elevated convection events had to meet the following criteria:
(1)
each event day (12:00–11:59 UTC) had to have an area of an average convective rainfall accumulation depth (>50.8 mm·day−1);
(2)
the majority of precipitation had to occur as convective rainfall (radar reflectivity ≥40 dBZ);
(3)
CG lightning flashes had to occur over the heavy rain area;
(4)
each thunderstorm type had to occur during a similar timeframe and over a similar geographical location; and
(5)
had to meet the selection criteria of [1], and/or exist above a significant thermal inversion [5].
The radar reflectivity threshold of ≥40 dBZ was selected because Xu [
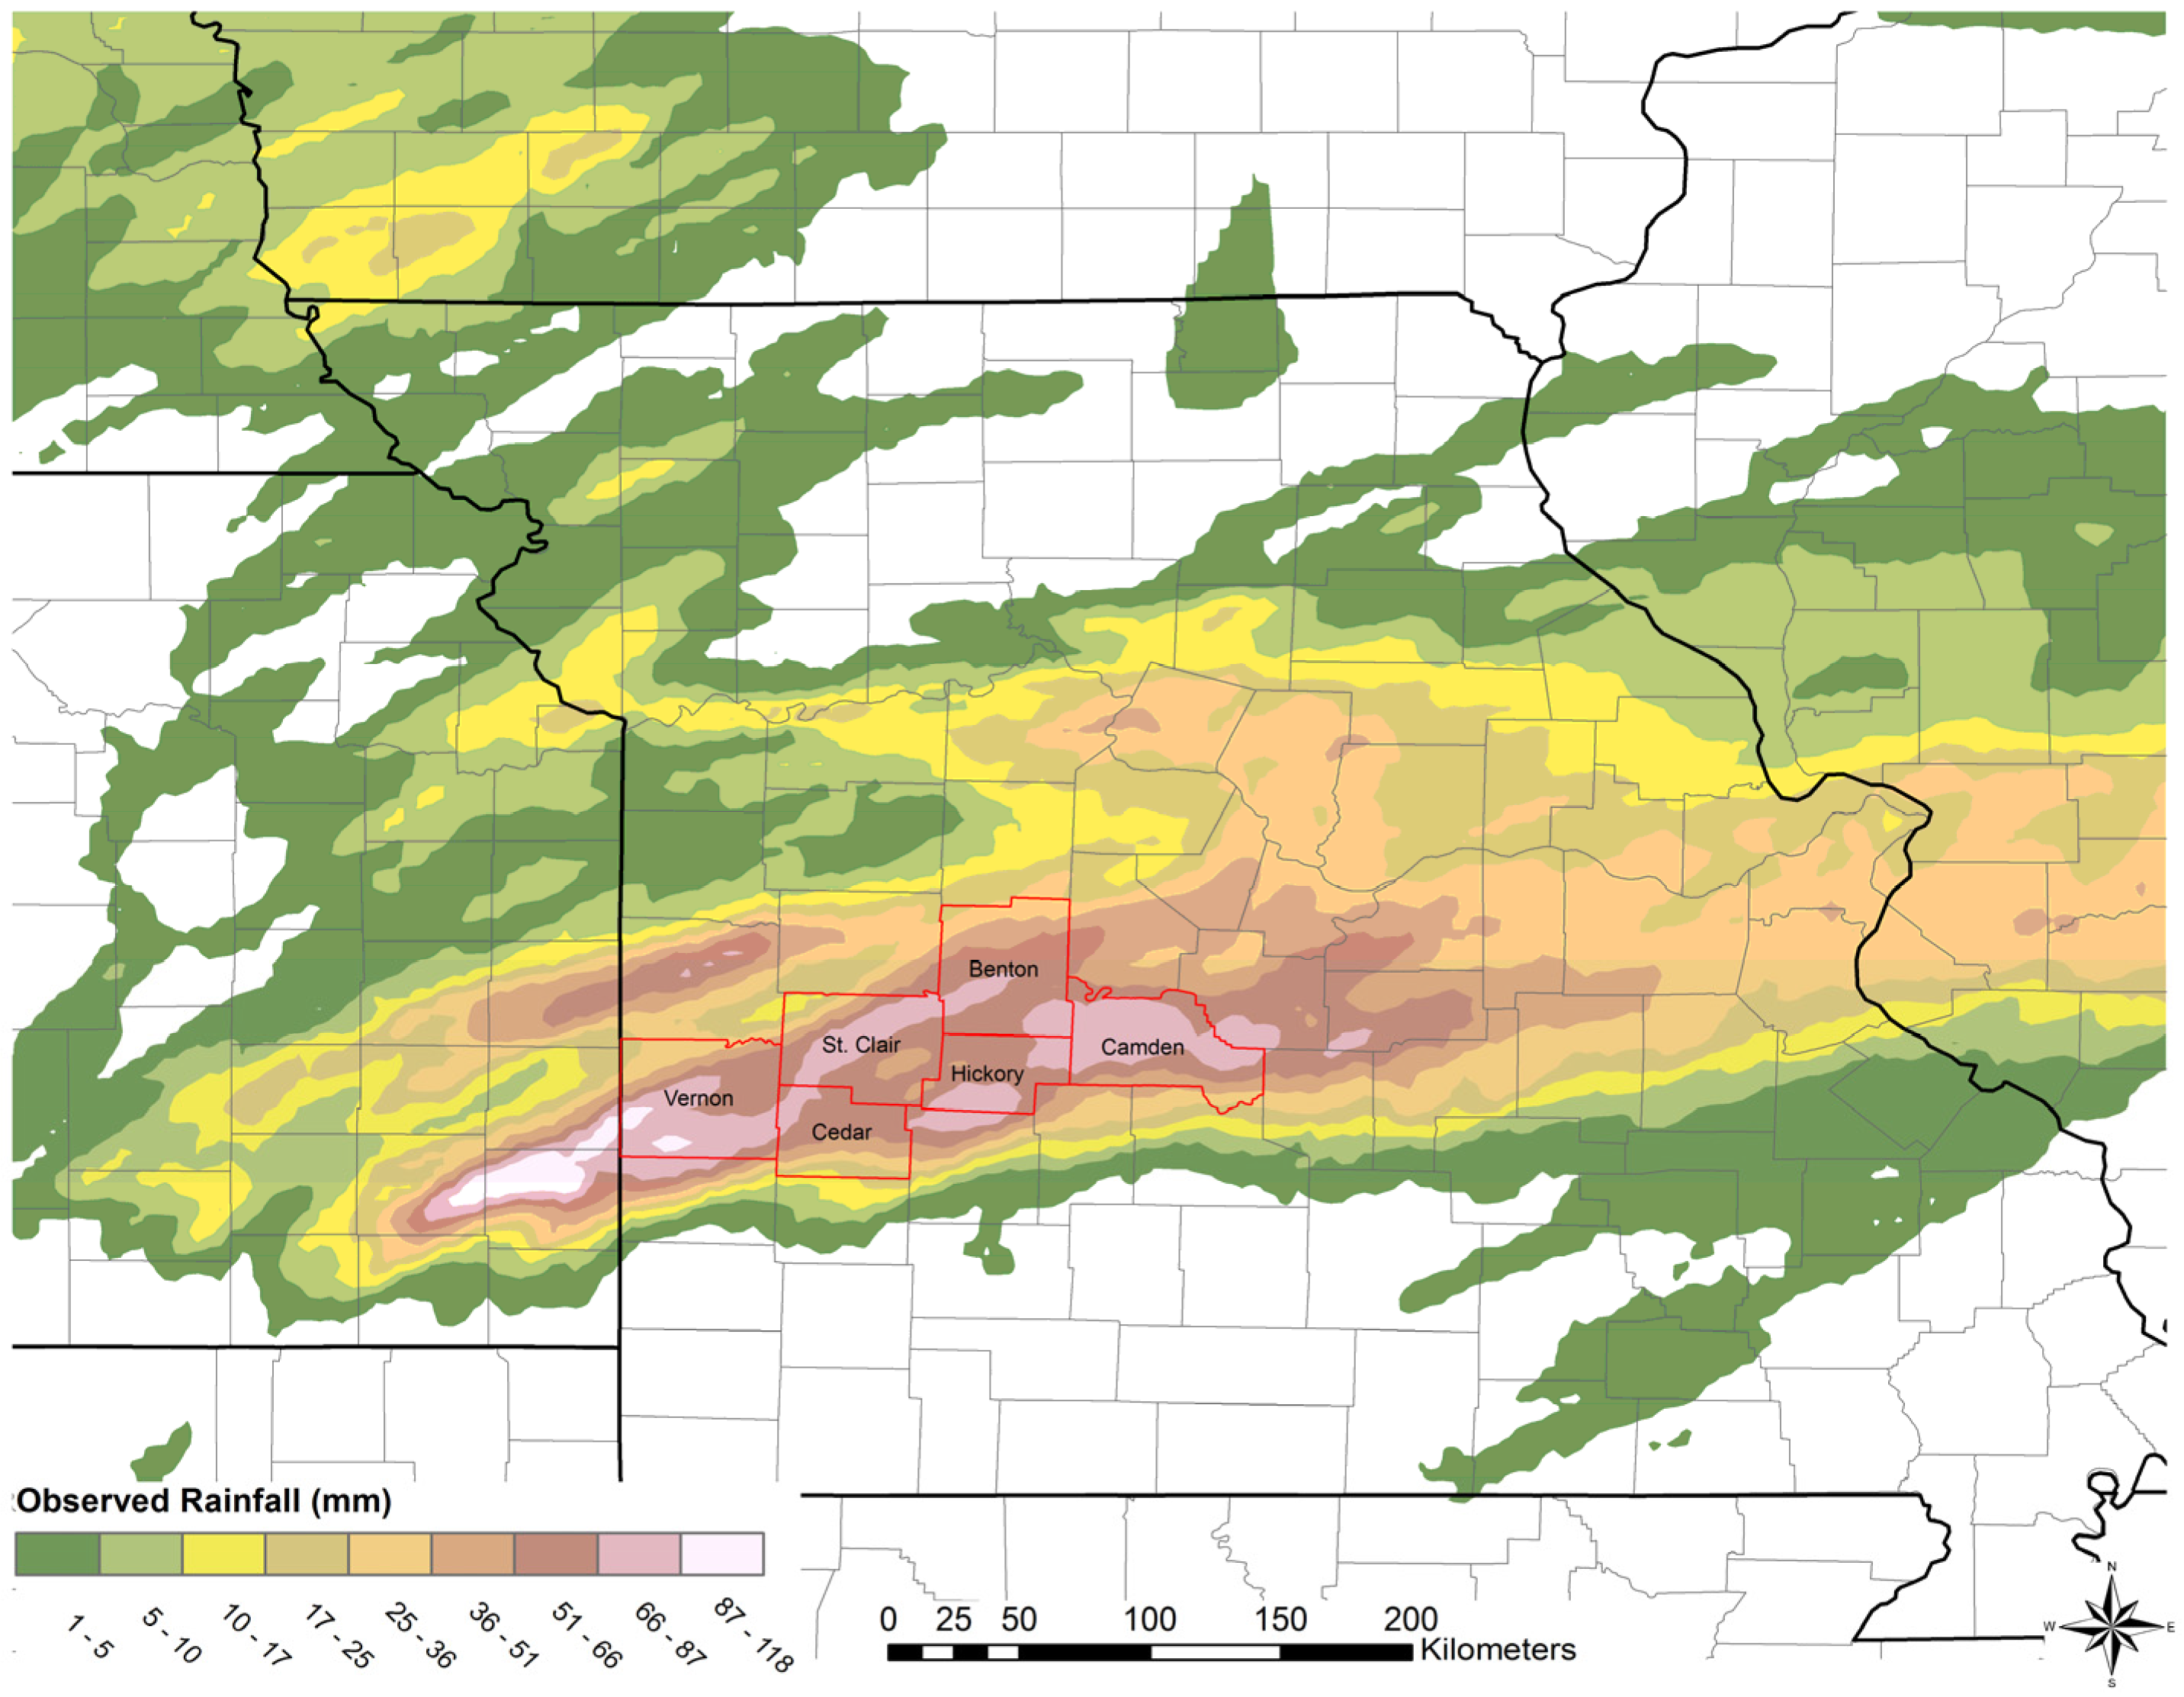
22] showed that convective rainfall was associated with values of ≥40 dBZ. Radar data were inspected for each potential case to ensure convective rainfall occurred. Precipitation data were then plotted for the central CONUS. Because the precipitation is a point dataset, interpolation using the Aeronautical Reconnaissance Coverage Geographical Information System (ArcGIS) ArcMAP software package (Version 10.1, ESRI, New York, NY, USA) licensed to the University of Missouri, via kriging, was conducted to highlight areas that had an average precipitation accumulation depth ≥50.8 mm·day−1.
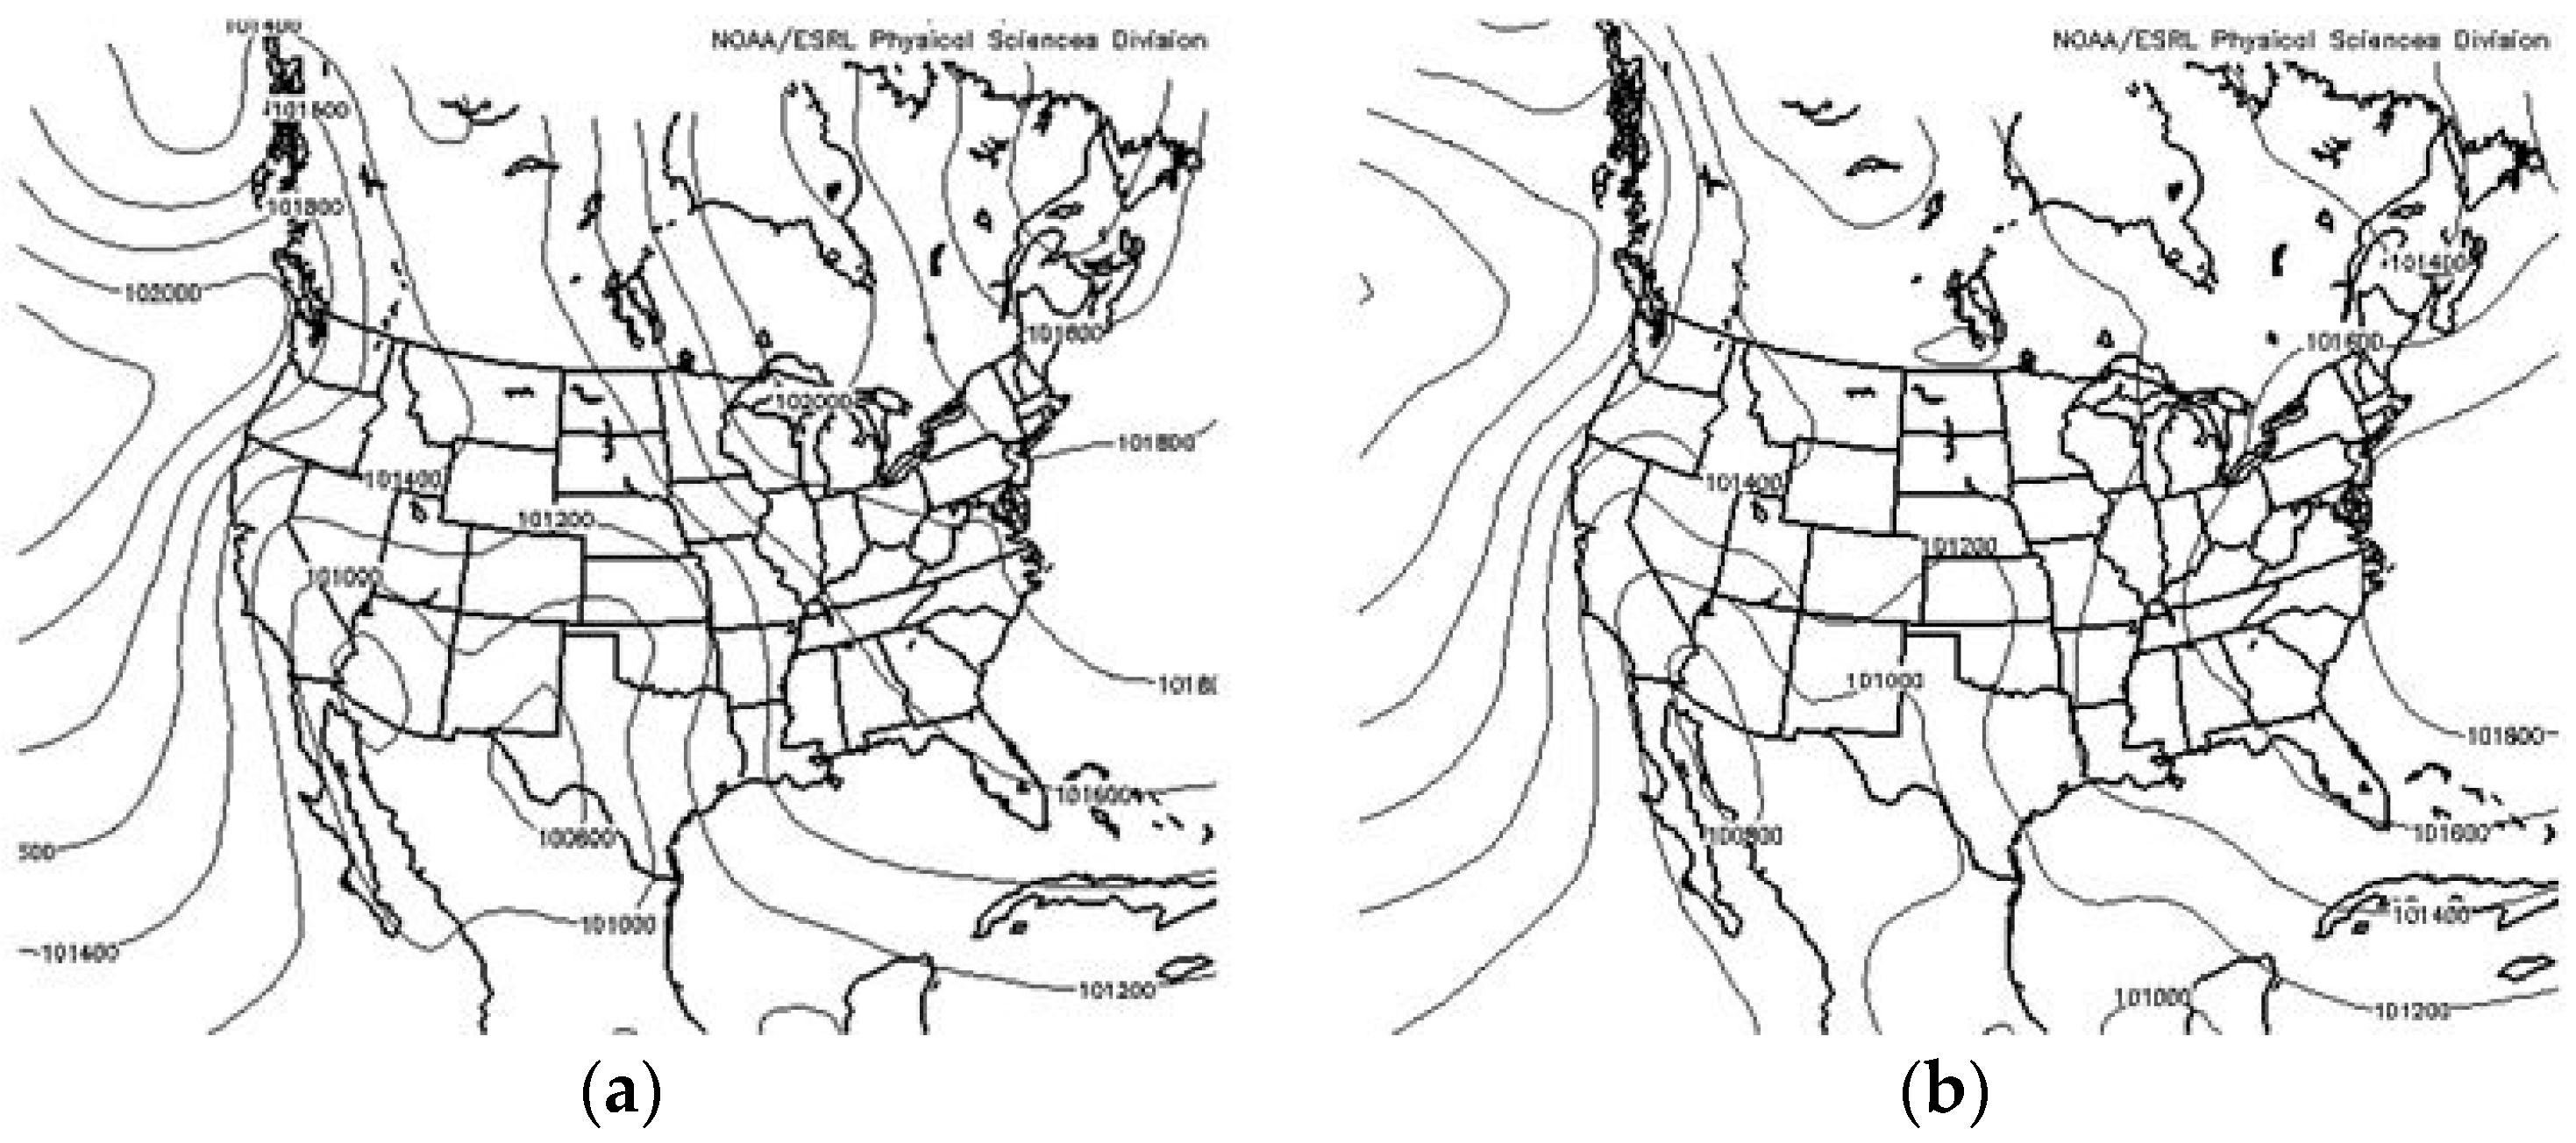
Figure 2 shows the results of the kriging interpolation of the point file acquired from the NWS Advanced Hydrologic Prediction Service. Kriging was shown to be the best interpolation method when using radar-derived precipitation accumulation [
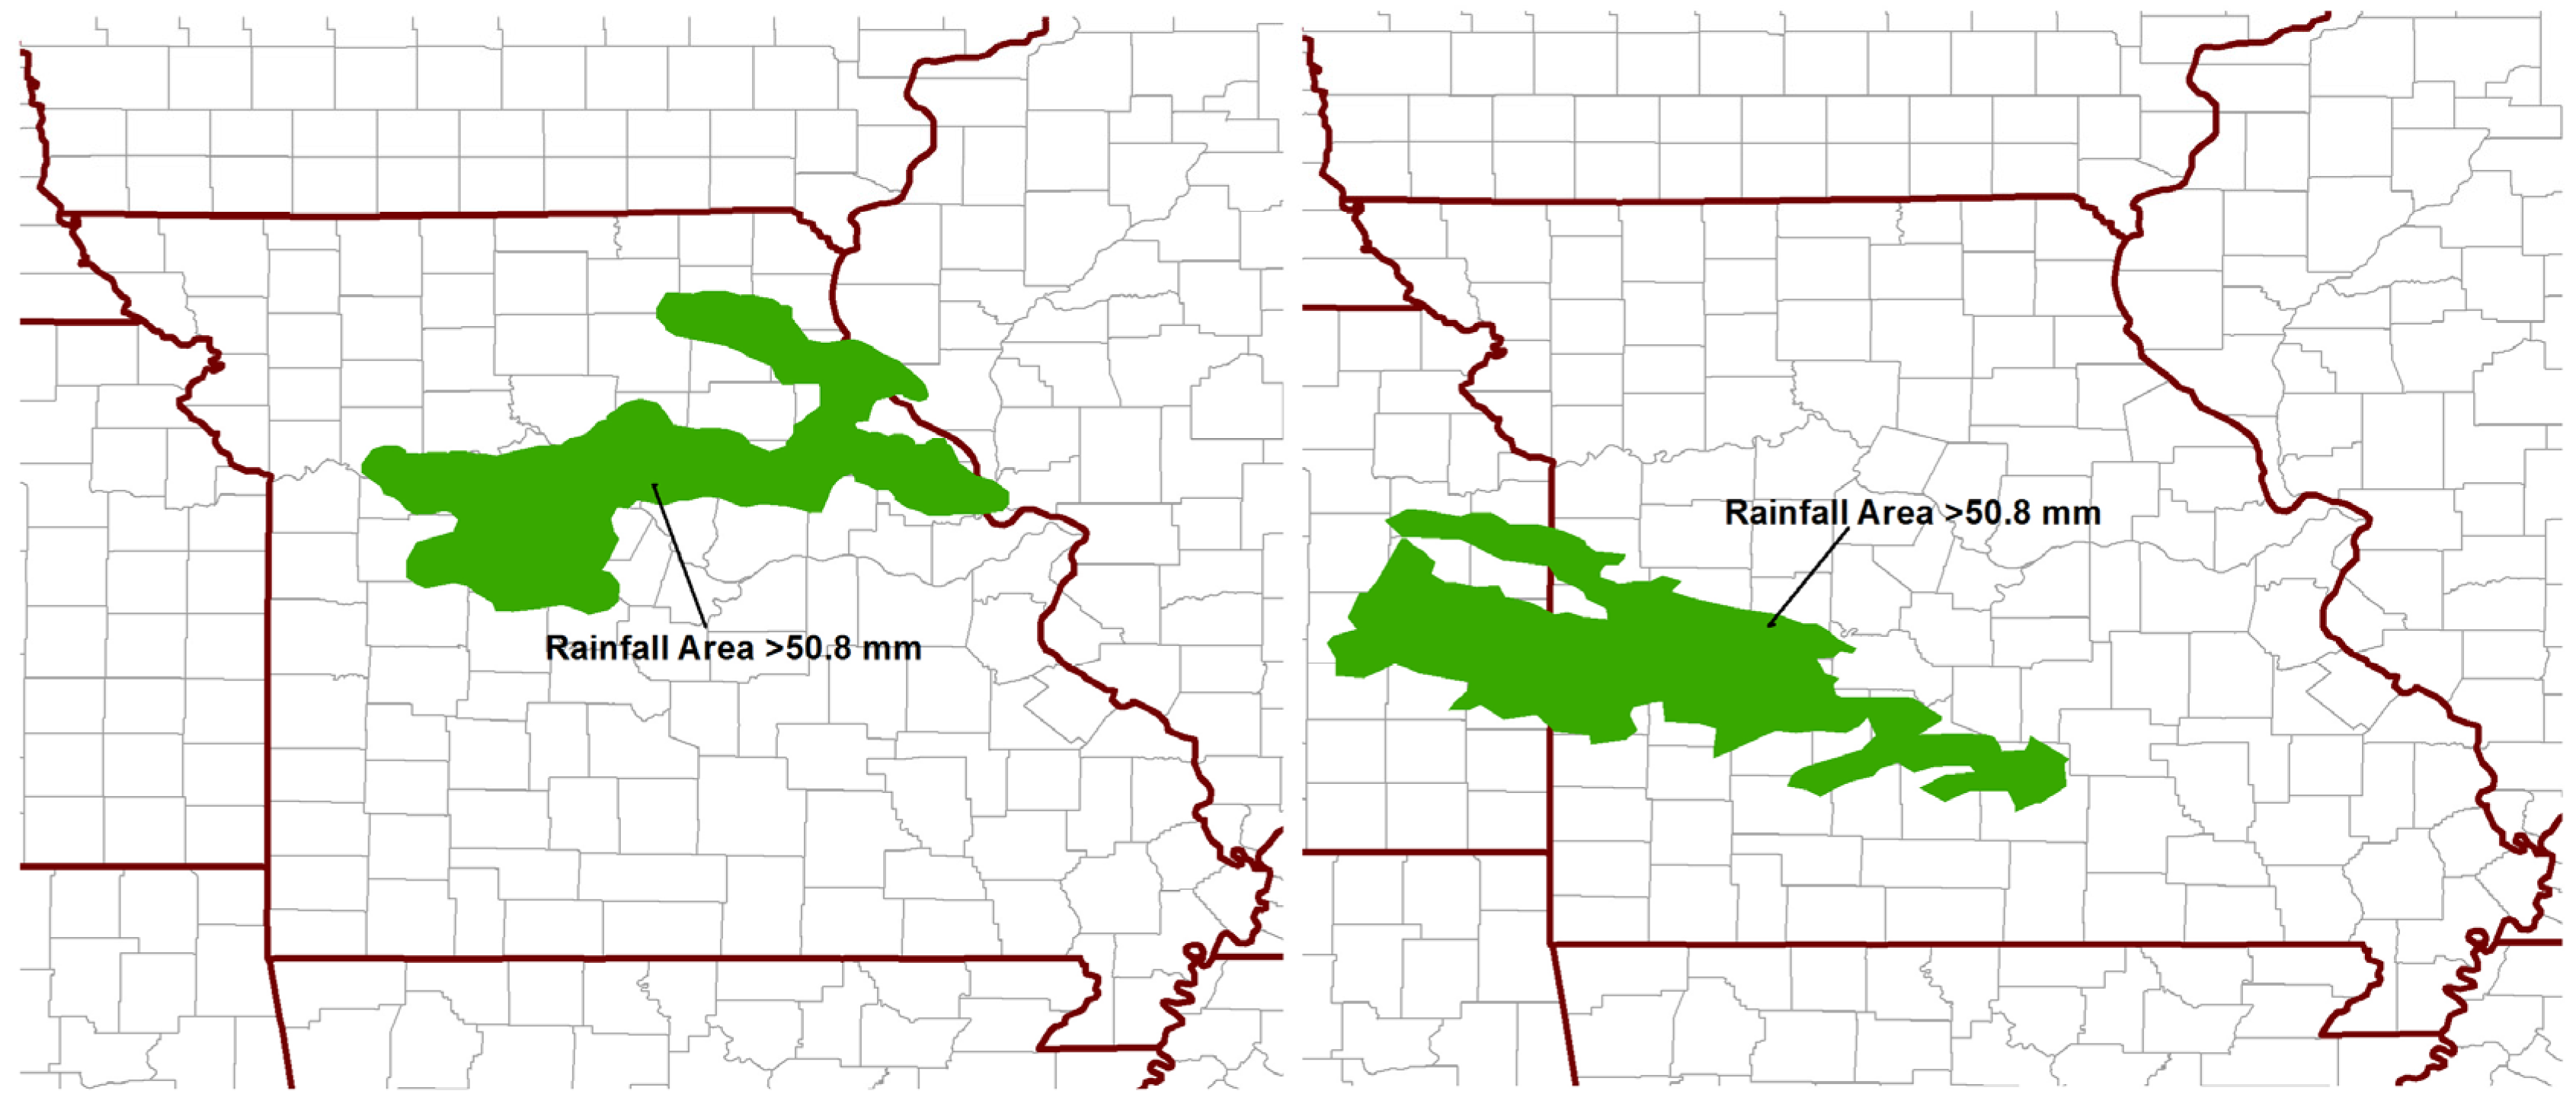
25]. Through a series of tests on the data, it was found that ordinary kriging, using a spherical semivariogram model, with a variable search radius of 10 would yield the best results. This conserved both maxima and minima of accumulated precipitation. The kriging process revealed areas of >50.8 mm·day−1 (referred to as the heavy rain areas), as seen in Figure 3. These areas of heavy rain were traced from the precipitation interpolation and a new layer was created. Lightning and point rainfall data were then clipped to these heavy rain area layers. This clipping revealed total CG lightning flashes within the heavy rain area as well the maximum and average rainfall within the heavy rain area. CG flashes were then sorted to determine positive and negative flash counts. This allowed percentages of positive flashes to be calculated.
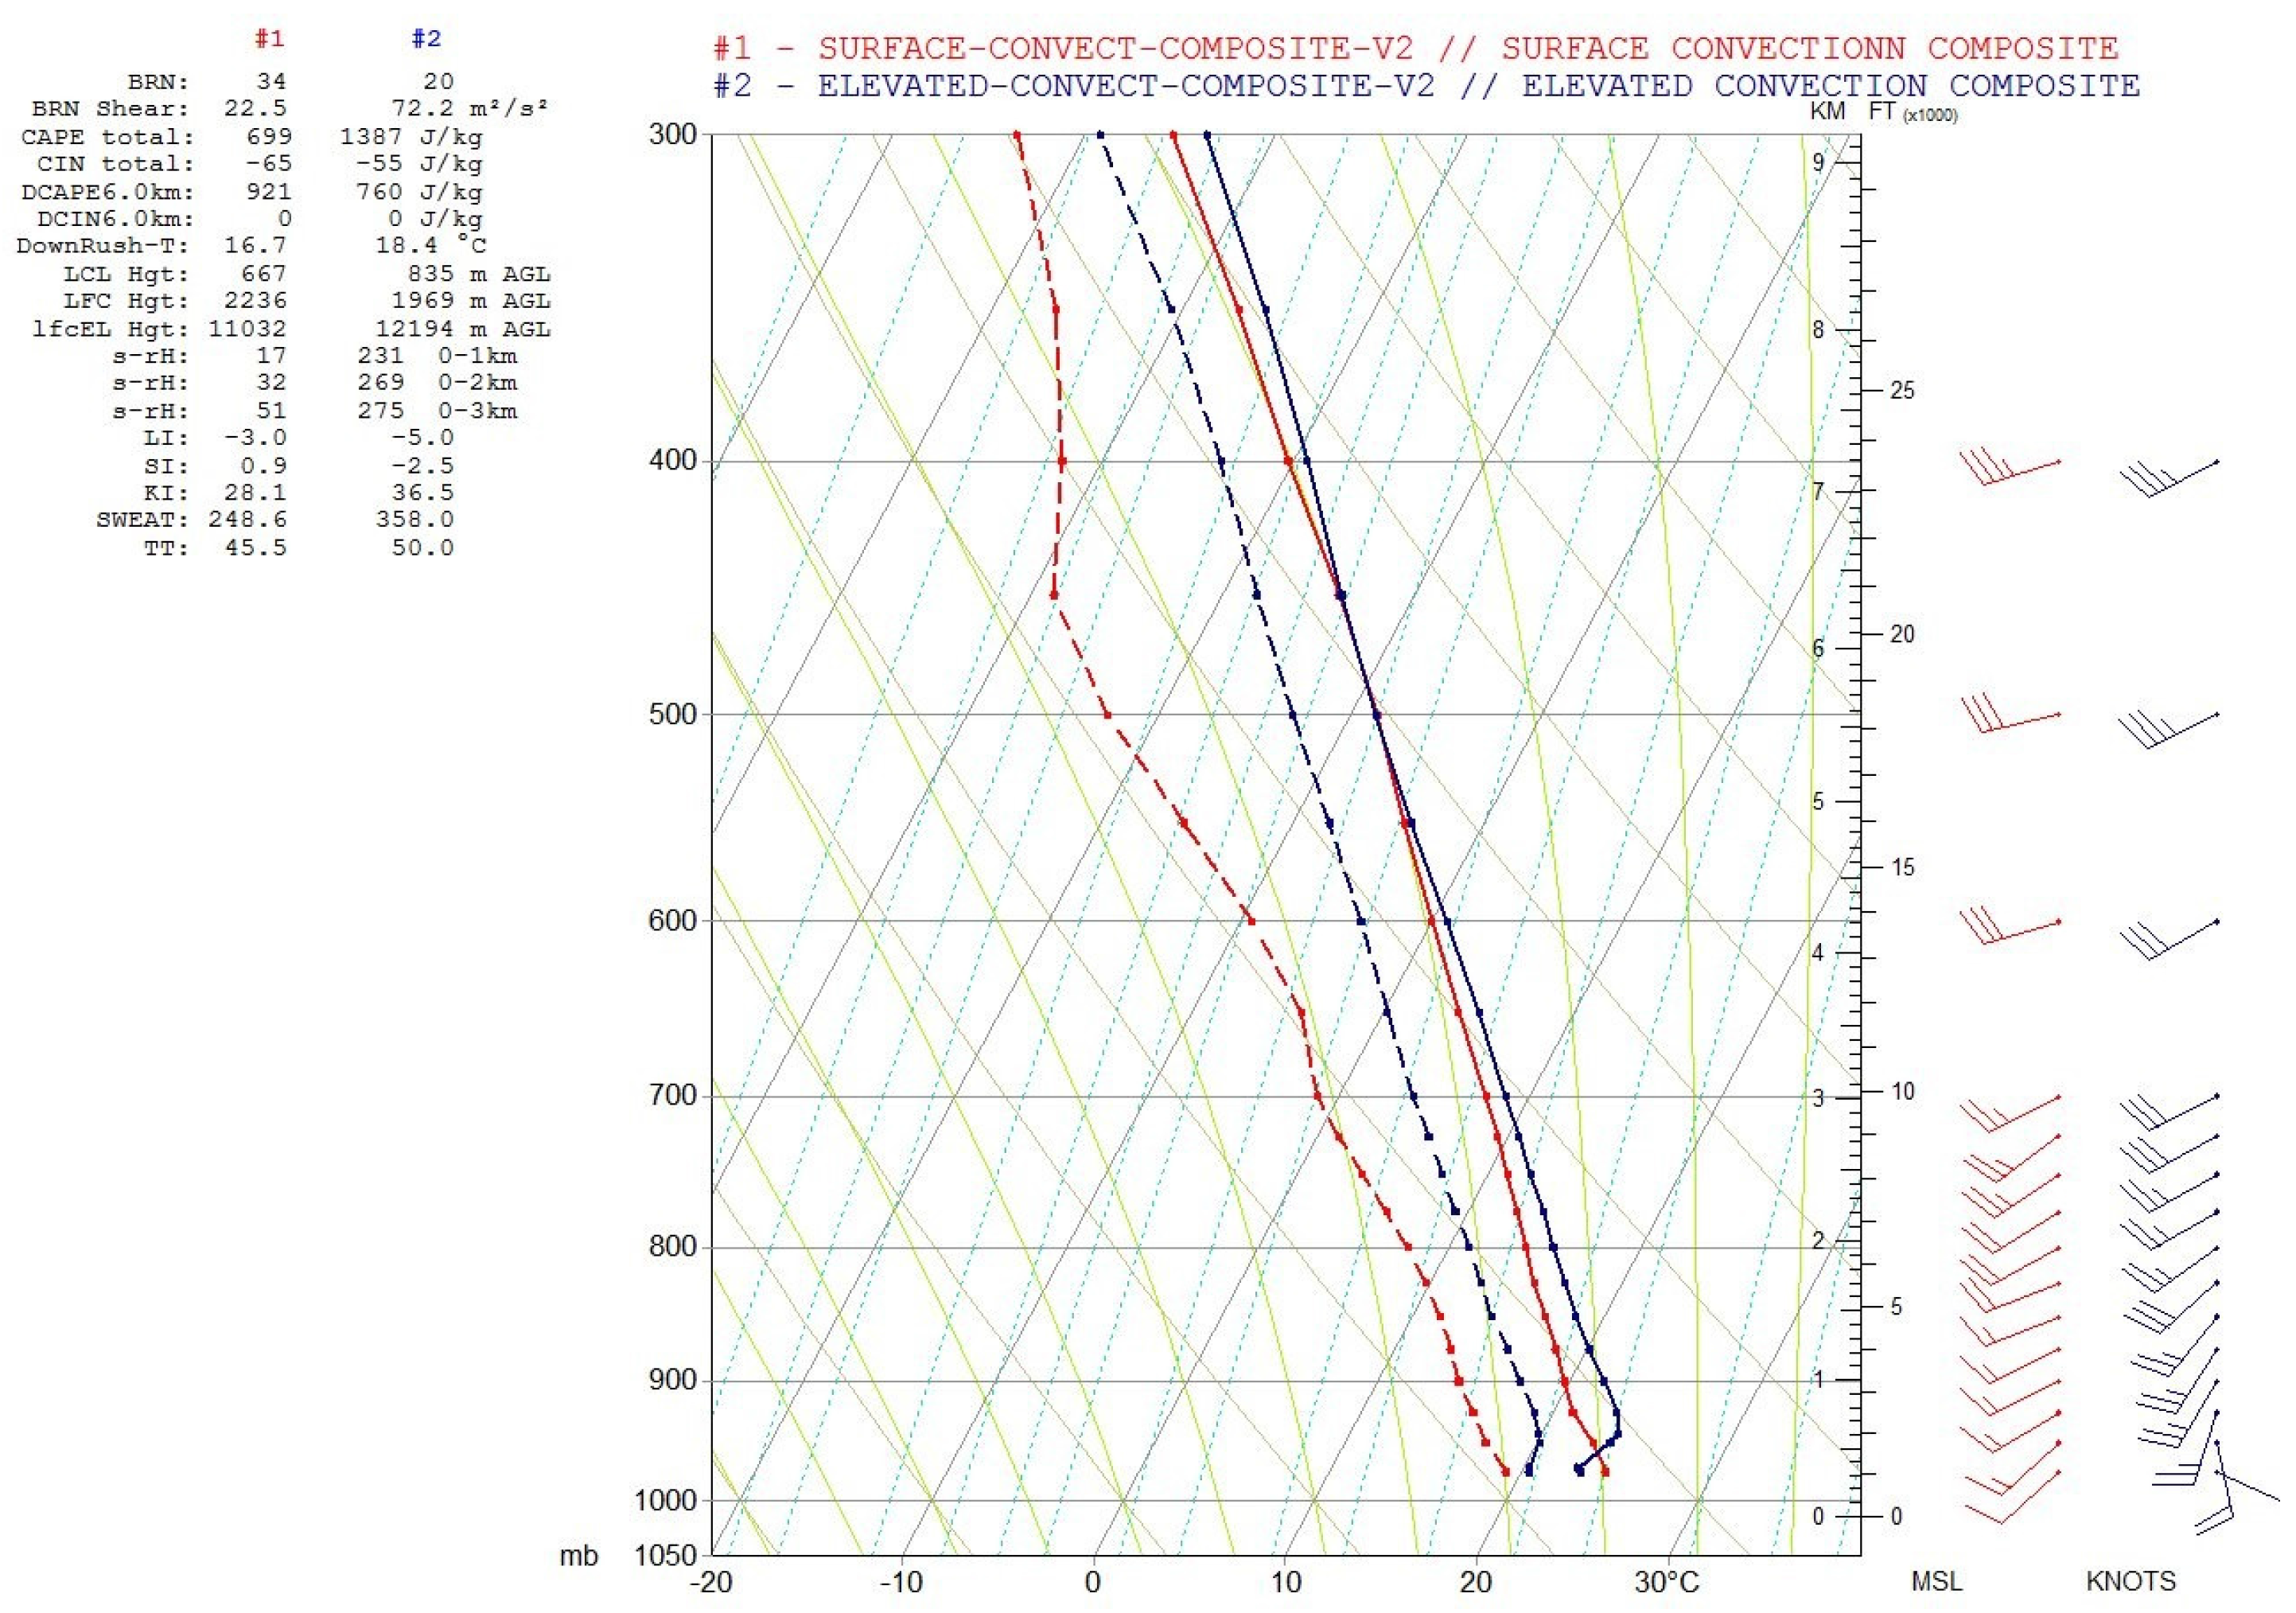
Vertical profiles from the North American Regional Reanalysis (NARR) were inspected to confirm whether storms were elevated or surface based, which used by [5] for initial case identification. The latitude and longitude of the heaviest rainfall location was used to determine sounding location. The nearest time step (to the hour) prior to precipitation occurring at that location was used for the soundings. In a further effort to minimize bias between the two groups of thunderstorms, sounding parameters were calculated, including the depth of the warm cloud layer, for both elevated and surface based convection. This was done for both individual soundings, as well as their composites as suggested by [26] and employed by [27]. In addition, the two sets were examined for the dominant mode of convection. Here, the NARR profiles and Level II radar data were employed, respectively, to help establish commonality between the two groups.
RLRs for both sets of thunderstorms were also calculated, using the heavy rain area (km2), total event period (12:00 UTC to 12:00 UTC) CG lightning flashes within the heavy rainfall area, and average accumulated rainfall within the heavy rainfall area. Next, the precipitation accumulation average depth was established. While the kriging highlighted areas of interest, it did not provide a mean precipitation depth. The mean rainfall within the heavy rain area point precipitation file was used to find the mean depth.
Finally, the Mann–Whitney nonparametric statistical approach was used to test for differences between surface based thunderstorms and elevated thunderstorms in the following categories; RLR within the heavy rain area, the extent of the heavy rainfall area, CG lightning flashes, positive CG flashes, and percentage of positive strikes in the heavy rainfall area, maximum and mean rainfall amounts within the heavy rain area. The Mann–Whitney test was used as opposed to a two-sample t-test because the variables tested are not normally distributed. This was done in a similar manner by [27] for proximity soundings of thunder snow and non-thundering snow events in the central United States. All surface based thunderstorm cases (n = 8) were considered one set of data and the elevated thunderstorm cases (n = 8) were considered the other set of data for the Mann–Whitney tests. Given the low number of cases, the null hypothesis was rejected if p > 0.10. A summary of all the p-values can be found in Table 1.

3. Results and Analysis

3.1. Event Characteristics—Storm Scale

For each case, the first step was to establish the heavy rainfall area from the NWS Advanced Hydrologic Prediction Service data. Figure 3 shows an example of the heavy rainfall area for the 11 September 2010 and 16 September 2010 cases. The green area in each panel represents the area where >50.8 mm·day−1 of rainfall was accumulated over a designated 24 h period which occurred as a result of convection. Once this was completed, all other analysis could proceed, as all other data was clipped to this heavy rainfall area.

3.1.1. Rainfall–Lightning Ratios

The RLR (kg·fl−1) was the first parameter calculated for all 16 of the events, as it was the initial goal of this study. The medians of RLR were 3.916 × 10⁷ and 3.997 × 10⁷ for surface based and elevated thunderstorms, respectively, with a Mann–Whitney test result of p = 0.47. Table 2 shows all RLR values for elevated and surface based convection events within the heavy rainfall area. It should be noted that the average RLR for all 16 cases was 5.79 × 10⁷ kg·fl−1. This result was similar to the findings of [11,17,21].

3.1.2. Extent of the Heavy Rainfall Area

Determination of the extent of the heavy rain areas for each storm type was necessary for calculation of other parameters. The medians for the heavy rainfall area were 15,381 km2 for elevated thunderstorms and 5209 km2 for surface based thunderstorms. While the differences in the averages seems substantial, the Mann–Whitney test returned a modest p = 0.11. The extent of the heavy rainfall area for all elevated convection events and surface based convection events can be found in Table 3.

3.1.3. Lightning Flashes

CG lightning flashes produced by surface based and elevated thunderstorms were the next dataset to be evaluated. Only CG lightning flashes that occurred within the heavy rain area were counted. The median CG lightning flash count for the eight elevated thunderstorm cases was 27,249 flashes and 9386 for surface based convection, producing a Mann–Whitney result of p-value = 0.05, showing that elevated thunderstorms produced more CG flashes than surface based thunderstorms. Table 4 shows the lightning flash activity for elevated convection events, including total CG lightning flashes, positive CG lightning flashes, and percentage of positive CG lightning flashes. Table 5 shows the same for surface based convection events.
Positive CG flashes are the most dangerous types of lightning flashes [15]. Therefore, these types of flashes were also investigated within the heavy rainfall area. Median positive CG flashes were 919 for elevated thunderstorms and 197 for surface based thunderstorms. A p-value = 0.06 was found with the Mann–Whitney test. This also indicated that the elevated thunderstorm cases produced more positive CG flashes than surface based thunderstorms did.
The percentage of the polarity in CG flashes within the heavy rain area was also of interest. The median percentage positive percentage of CG flashes was 2.95% for the elevated thunderstorms cases and 2.22% for surface based thunderstorms. A p-value = 0.04 suggesting this is a significant result because thunderstorm complexes can produce thousands of CG flashes.
Peak current of positive flashes was also investigated. It was found that elevated convection had a higher average peak current at 172 kA compared to 139.25 kA in surface based storms. However, the results of the Mann–Whitney test revealed a p-vale of 0.13.
Finally, lightning was broken down into CG flashes per hour and CG flashes per area within the heavy rainfall area per each set. The elevated thunderstorm set had a much higher value for the median flashes per hour at 2212.3 fl·h−1 compared to only 1216.7 fl·h−1 for surface based set with a p-value = 0.08. CG Flashes per area and the median values were close (1.73 fl·km−2 for elevated sets and 1.65 fl·km−2 for surface based sets). Positive CG lightning per hour between each thunderstorm set was also tested, with a p-value = 0.06 found. The elevated thunderstorm set also had a higher mean positive CG hourly flash rate at 63.5 CG fl·h−1 compared to just 20.0 CG fl·h−1 for the surface based thunderstorm set.

3.1.4. Maximum and Mean Rainfall Amounts

Maximum and mean rainfall amounts within the heavy rain area are important to investigate as it reveals how serious of a flash flooding threat these storms pose. Table 6 shows the maximum and mean rainfall amounts for elevated convection events and surface based convection events. The maximum amount of rainfall for all cases was 264.2 mm (10.4 in) which occurred 25 July 2008 with elevated convection. The highest maximum amount of rainfall from a surface based thunderstorm case was 136.4 mm (5.34 in). This was below the average of maximum rainfall amounts observed in the elevated thunderstorm cases, which was 166 mm (6.53 in). The median value of maximum rainfall was 128 mm for elevated thunderstorms and 105 mm for surface based thunderstorms. The Mann–Whitney test showed a p-value = 0.03, indicating that elevated thunderstorms produced higher maximum amounts than surface based thunderstorms.
The mean rainfall within the heavy rainfall area showed a very similar pattern. The median for the mean rainfall within the heavy rain area was 71 for elevated thunderstorms and 66 for surface based thunderstorms with a p-value = 0.04. Both tests clearly indicate that there were statistical differences between these data sets. Both point to the same conclusion that elevated thunderstorm cases produced more rainfall than surface based thunderstorm cases, and thus elevated convection cases posed a more serious threat for flash flooding.

3.2. Event Characteristics – Mesoscale Environment

Rainfall initiation to dissipation values indicate elevated convection lasted longer than surface based convection, on average by around one hour. Average rainfall time of 9.89 h for elevated storms compared to 8.94 for surface based storms. This assuredly contributes to the larger rainfall footprint and higher rainfall amounts. It also speaks to the larger lightning coverage: as persistent convection is able to sustain itself, there is more opportunity for lightning strikes and heavy rainfall. However, the difference is not so great to solely account for the higher amounts and areas seen in elevated convection. Therefore, synoptic composites and soundings will be investigated to look at the environmental differences.

3.2.1. Composite Analysis

Composites of elevated and surface based convection which occurred during the period of study and over the geographical area were created in order to establish that the cases presented in the study are representative of the respective phenomena. Composites were derived on a regional scale (southwest corner; 25° N, 108° W; northeast corner; 50° N, 80° W) and the continental scale at the closest time (00:00 UTC, 06:00 UTC, 12:00 UTC or 18:00 UTC) prior to convective initiation. This was done to ensure convection had not altered the composited environment. Composites (18 elevated convection environments; 18 surface based convection environments) were created using the Earth Systems Research Laboratory’s (ESRL) 20th Century Reanalysis tool [28]. The following parameters were composited for both surface based and elevated cases at the times and locations previously described; MSLP (Pa), 700-hPa omega (Pa·s−1), precipitable water (kg·m−2), 850-hPa vector wind (m·s−1), 500-hPa geopotential heights (dkm), and 2-m Surface Temperature (K). Noticeable differences are seen between the surface based cases and elevated cases, most of which revolve around intensity.
Figure 4 shows that the 500-hPa geopotential height pattern composites for elevated (Figure 4a) and surface based (Figure 4b) convection have some similarities and differences. Both generally show troughing west of Missouri and ridging to the east. However, the location and intensity of these features differ. Surface based composites show a very weak trough to the west and weak ridge near the Great Lakes. The pattern could be described as more zonal given the weak intensities of the ridges and troughs. The elevated convection composite, on the other hand, shows a distinct, deeper, shortwave across the Intermountain West and more substantial ridge over the Great Lakes region, similar to what [5] showed in their composite work on elevated convection.
Figure 5 depicts the 700-hPa vertical motion (ω) for elevated (Figure 5a) and surface based (Figure 5b) composites. The elevated composites reveal much stronger upward vertical velocities (−0.12 Pa·s−1 compared to −0.06 Pa·s−1) and a larger coverage area. This figure is perhaps best viewed along with Figure 6, which is the 850-hPa isotachs (Figure 6a elevated, Figure 6b surface based). Together, these figures show that the Low level jet (LLJ) was stronger, more southerly and exhibited a much sharper wind gradient in the elevated convection composites. Additionally, the bulk of the omega (including maximum value) occurred along and to the left of the leading edge of the LLJ gradient. This pattern is a known influencer of elevated convection (see [3,4,29]) and speaks to increased coverages and longevity of elevated convection.
Surface-based composites also showed differences. Precipitable water values (Figure 7) were similar for both composite sets in terms of intensity (maximum values of 44 kg·m−2 for elevated, 40 kg·m−2 for surface based) which is logical given high moisture content is essential for heavy rain, which both elevated and surface based data sets have in common. However, the elevated composite (Figure 7a) clearly exhibits a south-to-north orientation of precipitable water, similar to that of the LLJ, while the surface based composite (Figure 7b) displays a less intense southwest-to-northeast oriented pattern of precipitable water. Clearly, the intensity and orientation of the LLJ played a role in moisture advection for these cases. The LLJ, in fact, is one of the main differences between the elevated and surface based composites and likely one of the primary sources of differences in overall rainfall amounts and areal coverage.
Figure 8 shows the 2-m temperature differences in the elevated (Figure 8a) and surface based (Figure 8b) composites. Figure 8a clearly shows a tighter thermal gradient across the central United States. Figure 9 depicts a sharper mean sea level pressure (MSLP) gradient in the elevated (Figure 9a) composite compared to the surface based composite (Figure 9b). Both show an inverted surface pressure trough over the Southern Plains and southern Rockies extending into Kansas. However, the elevated composite shows a stronger surface low pressure system and a pressure trough, perhaps a warm front, extending into Missouri. In the surface based composite the influence of the Bermuda High is clearly evident as far west as Missouri. This feature is confined along and to the east of the Appalachian Mountains in the elevated composites. Both modes of convection were associated with upstream (140° E to 100° W – Pacific Region) blocking [30] about 50% of the time (Table 7). Upstream blocking, especially in the East Pacific, frequently impacts the weather during the winter and occasionally summer season weather in the central United States [31]. The frequency indicated above is approximately twice the climatological occurrence of blocking in Pacific Region during the warm season [32,33]. This association warrants further study.
Clearly, there are significant synoptic differences between the elevated and surface based composites with the elevated composites exhibiting stronger synoptic signals for heavy rainfall. Indeed, these composites support the results of larger rainfall coverage and higher rainfall amounts for elevated convection. These composites also indicate that the specific cases shown throughout the study are representative of synoptic regimes which support heavy rainfall from elevated convection and surface based convection.

3.2.2. Sounding Analysis

In addition to seeking pairs of events from similar geographic areas and similar time frames, finer-scale aspects of the convection cells and their parent MCS were also examined. NARR profiles were used to compare the atmospheres that engendered the elevated and surface-based classes of soundings, both on a case-by-case basis, and as composites (Figure 10). The composite figure shows two atmospheres with different characteristics. The composite for surface-based convection is warmer at the surface, but cools with height at a nearly adiabatic lapse rate. Above the surface, the surface-based convection sounding is uniformly and drier than its elevated counterpart. Additionally, the flow is nearly unidirectional from the southwest, and only modest speed increases with height. By contrast, the composite elevated convection sounding is warmer, moister, with easterly flow near the surface (below the inversion) and significant veering up to ~700 hPa, and a low-level speed maximum in the profile at 825 hPa. Indeed, the stronger wind speeds are corroborated by the low-level plan view analyses discussed earlier (Figure 6). Most unstable convective available potential energy (MUCAPE) values roughly double those of the surface-based composite. Even when examining the original NARR soundings on a case-by-case basis, the mean MUCAPE value of the elevated cases was 1984 J·kg−1, as opposed to 1612 J·kg−1 for the surface-based case collection.
Additionally, warm cloud depths were examined between the surface based convective events and those in the elevated group (Table 7). Previously, Anip [34] had shown that warm cloud depth was more of a seasonal control on MCS precipitation efficiency, and analyses of these two sets support that conclusion, with no significant difference between storm types under a Mann–Whitney test. Indeed, the mean (median) values for warm cloud depth for surface based parcel were 4300 m (4183 m), and for elevated parcels were 4358 m (4409 m). In addition, Level II Doppler radar data were examined to determine MCS mode. Most individual cases in the elevated convection set were of the trailing stratiform morphology [35], with a scattering of other modes in the surface-based convection cases (Table 8).
These two sets of cases are rather similar, with the presence of a thermal inversion for elevated cases being the primary difference between them. However, the elevated case set is known to be dominated by trailing stratiform (TS) precipitation (Table 8). Such a precipitation configuration is known to favor a higher number of positive flashes, as the depth of the cloud decreases [36], with the upper portion of most cumulonimbi known to be dominated by positive charge.

4. Conclusions

This study aims to investigate environmental and observed differences between elevated thunderstorms and surface based thunderstorms that produced heavy rain and sheds light on some of the sensible weather differences between sets of elevated thunderstorms and surface based thunderstorms. Cases were selected only if an elevated and surface based case occurred during a similar timespan and geographic location. The heavy rain area (the area covered by >50.8 mm·day−1 of rainfall) was chosen as the crucial area to explore for each of the cases. It should be noted that dangerous CG lightning will occur outside of the heavy rainfall area throughout the MCS regardless of the system being elevated or surface based. The nonparametric Mann–Whitney test was performed on various parameters within the heavy rain area. It was found that the RLR tests, CG flashes per area and extent of the heavy rain area failed to reach the 90% confidence interval. However, it was shown that CG flashes, CG flashes per hour, positive CG flashes, positive CG flashes per hour and percentage of positive flashes were all higher in the elevated convection dataset. All of these observed parameters passed the 90% confidence interval indicating that the differences were statistically meaningful. The same was true for elevated thunderstorm cases in regard to maximum and mean rainfall amounts within the heavy rainfall area.
Composites of the mesoscale environment for elevated convection surface based convection were examined and depicted several key differences, particularly in the 850-hPa vector wind field and 700-hPa omega field. The composites support the result that elevated convection produced rain longer and over a larger area which leads to higher rainfall amounts and a longer opportunity for CG lightning strikes to occur.
Although a low number of cases were used in each dataset, the lightning and rainfall categories had very strong statistical signals associated with them. The results indicate that for the groups of thunderstorms studied, elevated thunderstorm events pose a statistically significantly greater risk of heavy rainfall and have a higher potential for flash flooding than surface based thunderstorms. The results also show that higher frequencies of positive CG lightning flashes were found in the elevated thunderstorm set. These two results are significant as positive lightning flashes and heavy rain are serious threats to life and property.

Acknowledgments

The authors would like to thank the two anonymous reviewers for their time and effort and constructive comments that made this work stronger. This work is supported in part by the National Science Foundation (NSF), Award No. AGS-1258358. Any opinions, findings, conclusions or recommendations expressed herein are those of the author(s) and do not necessarily reflect the views of NSF. The lightning data were obtained from the National Lightning Detection Network data via Vaisala. Observed precipitation data were provided by the National Weather Service Advanced Hydrologic Prediction Service. Special thanks go out to Ron Holle who helped obtain the lightning data; to Scott Rochette and Anna Kastman for reading prior drafts of the manuscript; and to Clayton Blogett who helped focus attention to CG lightning events during a remote sensing lecture. A special thank you goes out to Bohumil Svoma and Katherine Wunsch for their contributions.

Author Contributions

Patrick S. Market, Joshua S. Kastman and Neil I. Fox conceived and designed the experiments; Joshua S. Kastman, Anthony R. Lupo, and Alzina L. Foscato; and all of the coauthors analyzed the data and wrote the paper.

Conflicts of Interest

The authors declare no conflict of interest. The founding sponsors had no role in the design of the study; in the collection, analyses, or interpretation of data; in the writing of the manuscript, and in the decision to publish the results.

References

  1. Colman, B.R. Thunderstorms above frontal surfaces in environments without positive CAPE. Part I: A climatology. Mon. Weather Rev. 1990, 118, 1103–1122. [Google Scholar] [CrossRef]
  2. Colman, B.R. Thunderstorms above frontal surfaces in environments without positive CAPE. Part II: Organization and instability mechanisms. Mon. Weather Rev. 1990, 118, 1123–1144. [Google Scholar] [CrossRef]
  3. Rochette, S.M.; Moore, J.T. Initiation of an elevated mesoscale convective system associated with heavy rainfall. Weather Forecast. 1996, 11, 443–457. [Google Scholar] [CrossRef]
  4. Moore, J.T.; Glass, F.H.; Graves, C.E.; Rochette, S.M.; Singer, M.J. The environment of warm-season elevated thunderstorms associated with heavy rainfall over the Central United States. Weather Forecast. 2003, 18, 861–878. [Google Scholar] [CrossRef]
  5. McCoy, L.P. Analysis of Heavy-Rain-Producing Elevated Thunderstorms in the MO-KS-OK Region of the United States. Master’s Thesis, University of Missouri, Columbia, MO, USA, 17 May 2014. [Google Scholar]
  6. Ashley, S.; Ashley, W. Flood fatalities in the United States. J. Appl. Meteorol. Climatol. 2008, 47, 806–818. [Google Scholar] [CrossRef]
  7. Gungle, B.; Krider, P. Cloud-to-ground lightning and surface rainfall in warm-season Florida thunderstorms. J. Geophys. Res. 2006, 111, D19203. [Google Scholar] [CrossRef]
  8. Rutledge, S.A.; MacGorman, D.R. Cloud-to-ground lightning activity in the 10–11 June 1985 mesoscale convective system observed during the Oklahoma-Kansas PRE-STORM Project. Mon. Weather Rev. 1988, 116, 1393–1408. [Google Scholar] [CrossRef]
  9. Holle, R.L.; Watson, A.I.; López, R.E.; MacGorman, D.R.; Otto, W.D. The life cycle of lightning and severe weather in a 3–4 June 1985 PRE-STORM mesoscale convective system. Mon. Weather Rev. 1994, 122, 1798–1808. [Google Scholar] [CrossRef]
  10. Battan, L.J. Some factors governing precipitation and lightning from convective clouds. J. Atmos. Sci. 1965, 22, 79–84. [Google Scholar] [CrossRef]
  11. Peterson, W.A.; Rutledge, S.A. On the relationship between cloud-to-ground lightning and convective rainfall. J. Geophys. Res. 1998, 103, 14025–14040. [Google Scholar] [CrossRef]
  12. Nation Weather Service (USA). Available online: http://www.nws.noaa.gov/os/hazstats.shtml (accessed on 3 January 2017).
  13. Cooper, M.A.; Andrews, C.J.; Holle, R.L. Lightning injuries. In Wilderness Medicine; Mosby: Maryland Heights, MO, USA, 2007; pp. 67–108. [Google Scholar]
  14. Holle, R.L.; López, R.E.; Navarro, B.C. Deaths, injuries, and damages from lightning in the United States in the 1890s in Comparison with the 1990s. J. Appl. Meteorol. 2005, 44, 1563–1573. [Google Scholar] [CrossRef]
  15. Uman, M.A. The Lightning Discharge; Academic Press: Cambridge, MA, USA, 1987. [Google Scholar]
  16. Rakov, V.A. A review of positive and bipolar lightning discharges. Bull. Am. Meteorol. Soc. 2003, 84, 767–776. [Google Scholar] [CrossRef]
  17. Tapia, A.; Smith, J.A.; Dixon, M. Estimation of convective rainfall from lightning observations. J. Appl. Meteorol. 1998, 37, 1497–1509. [Google Scholar] [CrossRef]
  18. Fuquay, D.M. Positive cloud-to-ground lightning in summer thunderstorms. J. Geophy. Res. 1982, 87, 7131–7140. [Google Scholar] [CrossRef]
  19. Grant, B.N. Elevated cold-sector severe thunderstorms: A preliminary study. Natl. Weather Dig. 1995, 19, 25–31. [Google Scholar]
  20. Moore, J.T.; Czarnetzki, C.A.; Market, P.S. Heavy precipitation associated with elevated thunderstorms formed in a convectively unstable layer aloft. Meteorol. Appl. 1998, 5, 373–384. [Google Scholar] [CrossRef]
  21. Soriano, L.R.; de Pablo, F.; Díez, E.G. Relationship between convective precipitation and cloud-to-ground lightning in the Iberian Peninsula. Mon. Weather Rev. 2001, 129, 2998–3003. [Google Scholar] [CrossRef]
  22. Xu, W.; Adler, R.F.; Wang, N. Improving geostationary satellite rainfall estimates using lightning observations: Underlying lightning–rainfall–cloud relationships. J. Appl. Meteorol. Climatol. 2013, 52, 213–229. [Google Scholar] [CrossRef]
  23. Orlanski, I. A rational subdivision of scales for atmospheric processes. Bull. Am. Meteorol. Soc. 1975, 56, 527–530. [Google Scholar]
  24. Reap, R.M.; MacGorman, D.R. Cloud-to-ground lightning: Climatological characteristics and relationships to model fields, radar observations, and severe local storms. Mon. Weather Rev. 1989, 117, 518–535. [Google Scholar] [CrossRef]
  25. Earls, J.; Dixon, B. Spatial Interpolation of Rainfall Data Using ArcGIS: A Comparative Study. ESRI Professional Papers. 2007. Available online: http://www.oalib.com/references/8952057 (accessed on 9 February 2017).
  26. Brown, R.A. A compositing approach for preserving significant features in atmospheric profiles. Mon. Weather Rev. 1993, 121, 874–880. [Google Scholar] [CrossRef]
  27. Market, P.S.; Oravetz, A.M.; Gaede, D.; Bookbinder, E.; Lupo, A.R.; Melick, C.J.; Smith, L.L.; Thomas, R.; Redburn, R.; Pettegrew, B.P.; et al. Proximity soundings of thundersnow in the central United States. J. Geophys. Res. 2006, 111, D19. [Google Scholar] [CrossRef]
  28. Earth Systems Research Laboratory’s (ESRL) 20th Century Reanalysis Tool. Available online: http://www.esrl.noaa.gov/psd/data/composites/subdaily_20thc/ (accessed on 10 October 2016).
  29. Corfidi, S.F. Cold Pool and MCS Propagation: Forecasting the Motion of Downwind-Developing MCSs. Weather Forecast. 2003, 18, 997–1017. [Google Scholar] [CrossRef]
  30. University of Missouri Blocking Archive: Global Climate Change Group. Available online: http://weather.missouri.edu/gcc/blocknh.pdf (accessed on 10 December 2016).
  31. Lupo, A.R.; Kelsey, E.P.; Weitlich, D.K.; Davis, N.A.; Market, P.S. Using the monthly classification of global SSTs and 500 hPa height anomalies to predict temperature and precipitation regimes one to two seasons in advance for the mid-Mississippi region. Nat. Wea. Dig. 2008, 32, 11–33. [Google Scholar]
  32. Wiedenmann, J.M.; Lupo, A.R.; Mokhov, I.I.; Tikhonova, E.A. The climatology of blocking anticyclones for the Northern and Southern Hemispheres: Block intensity as a diagnostic. J. Clim. 2002, 15, 3459–3473. [Google Scholar] [CrossRef]
  33. Newberry, R.G.; Lupo, A.R.; Jensen, A.D.; Rodriges- Zalypinis, R.A. An Analysis of the Spring-to-Summer Transition in the West Central Plains for Application to Long Range Forecasting. Atmos. Clim. Sci. 2016, 6, 375–393. [Google Scholar] [CrossRef]
  34. Anip, M.H.M.; Market, P.S. Dominant factors influencing precipitation efficiency in a continental mid-latitude location. Tellus A 2007, 59, 122–126. [Google Scholar] [CrossRef]
  35. Parker, M.D.; Johnson, R.H. Organizational modes of midlatitude mesoscale convective systems. Mon. Weather Rev. 2000, 128, 3413–3436. [Google Scholar] [CrossRef]
  36. Engholm, C.D.; Williams, E.R.; Dole, R.M. Meteorological and electrical conditions associated with positive cloud-to-ground lightning. Mon. Weather Rev. 1990, 118, 470–487. [Google Scholar] [CrossRef]
Figure 1. Map showing the study area for this project.
Atmosphere 08 00036 g001
Figure 2. An example of kriging interpolation method for 24-h precipitation (mm) that ended at 12:00 UTC 12 May 2010.
Atmosphere 08 00036 g002
Figure 3. Example of the heavy rainfall area for an elevated thunderstorm case (left); and surface based thunderstorm case (right). The elevated thunderstorm case occurred 11 September 2010. The surface based thunderstorm case occurred 16 September 2010.
Atmosphere 08 00036 g003
Figure 4. The 500-hPa geopotential heights (dkm) every 30 dkm from 5500 to 6000: (a) composites for elevated convection; and (b) composites for surface based convection.
Atmosphere 08 00036 g004
Figure 5. The 700-hPa vertical motion (ω) (Pa·s−1) (shaded; every 0.02 Pa·s−1) from −0.2 to 0.2: (a) composites for elevated convection; and (b) composites for surface based convection.
Atmosphere 08 00036 g005
Figure 6. The 850-hPa isotach wind (shaded; every m·s−1) from 0 to 12: (a) composites for elevated convection; and (b) composites for surface based convection.
Atmosphere 08 00036 g006
Figure 7. Precipitable water (shaded; every 2 kg·m−2 from) 20 to 50: (a) composites for elevated convection; and (b) composites for surface based convection.
Atmosphere 08 00036 g007
Figure 8. The 2-m temperature (K) every 3 K from 270 to 320: (a) composites for elevated convection; and (b) composites for surface based convection.
Atmosphere 08 00036 g008
Figure 9. Pressure reduced to mean sea level; every 200 Pa from 100,000 to 10,300: (a) composites for elevated convection; and (b) composites for surface based convection.
Atmosphere 08 00036 g009
Figure 10. Composite sounding profiles for surface-based convection (red) and elevated convection (blue) on a standard skew-T log p diagram. Temperature traces (°C; solid) and dew point traces (°C; dashed) are accompanied by standard wind plots (right) with speeds in represented in knots.
Atmosphere 08 00036 g010
Table 1. p-Values determined by nonparametric Mann–Whitney test for elevated thunderstorms vs. surface based thunderstorms.
Parameterp-Value
RLR0.47
Heavy Rainfall Extent0.11
CG Lightning Flashes0.05
CG Positive Flashes0.06
CG Percent Positive Flashes0.04
Maximum Rainfall0.03
Mean Rainfall0.04
CG Flashes·h−10.08
Positive CG Flashes·h−10.06
Table 2. RLR values for elevated convection events (left) and surface based convection events (right) within the heavy rain area.
RLR for Elevated ConvectionRLR for Surface Based Convection
DateRLR (×107 kg·fl−1)DateRLR (×107 kg·fl−1)
6 May 20073.24 24 May 200734.1620
2 June 20073.68 19 June 20073.7588
24 August 20074.15 8 August 20071.9963
14 June 20086.80 20 June 20084.5091
25 July 20086.74 22 July 20081.8558
12 May 20102.1913 May 20104.2325
11 September 20105.70 25 July 20103.4422
20 July 20102.65 16 September 201010.6170
Median3.92 Median3.9956
Table 3. Extent of the heavy rainfall areas (km2) for elevated convection events (left) and surface based convection events (right).
Heavy Rain Area for Elevated ConvectionHeavy Rain Area for Surface Based Convection
DateHeavy Rain Area (km2)DateHeavy Rain Area (km2)
6 May 2007837424 May 20073380
2 June 200712,25619 June 20075312
24 August 200713,4638 August 200729,247
14 June 2008934120 June 20083700
25 July 200842,71322 July 20082912
12 May 201017,29913 May 201049,532
20 July 201034,12525 July 20105105
11 September 201028,19116 September 201030,831
Median15,381Median5209
Table 4. Lightning flash characteristics within the heavy rainfall area for elevated convection events.
Lightning Flash Activity for Elevated Convection
DateCG Lightning Total FlashesCG Lightning Positive FlashesPositive CG Lightning Flash Percentage
6 May 200718,4964872.63%
2 June 200722,3245032.25%
24 August 200722,8416312.76%
14 June 200810,1524274.21%
25 July 200861,93517882.89%
12 May 201050,06324324.86%
20 July 2010117,96135483.01%
11 September 201031,65712073.81%
Median27,2499192.95%
Table 5. Lightning flash characteristics within the heavy rainfall area for surface based convection events.
Lightning Flash Activity for Surface Based Convection
DateCG Lightning Total FlashesCG Lightning Positive FlashesPositive CG Lightning Flash Percentage
24 May 2007653152.30%
19 June 200792991932.08%
8 August 200799,33223592.37%
20 June 200855471021.84%
22 July 200893992012.14%
13 May 201077,23932144.16%
25 July 201093731912.04%
16 September 201020,3569254.54%
Median93861972.22%
Table 6. Maximum and mean rainfall amounts for elevated convection events (left) and surface based convection events (right).
Maximum and Mean Rainfall Amounts for Elevated ConvectionMaximum and Mean Rainfall Amounts for Surface Based Convection
DateDaily Mean Rainfall (mm)Maximum Observed RainDateDaily Mean Rainfall (mm)Maximum Observed Rain
6 May 20077212424 May 20076684
2 June 20076712819 June 200766104
24 August 2007701008 August 200768157
14 June 20087421320 June 200868105
25 July 20089826422 July 20086092
12 May 20106312813 May 201066102
20 July 20109224625 July 201063106
11 September 20106412516 September 201070136
Median71128Median66105
Table 7. Warm cloud depth (m) for all convection cases. An asterisk (*) indicates that atmospheric blocking was present in the Pacific Region (140° E–100° W).
Convection TypeConvection DateWarm Cloud Depth (m)
Elevated Convection6 May 20073529
Surface Based Convection24 May 2007 *-
Elevated Convection2 June 2007 *4211
Surface Based Convection18 June 2007 *4125
Elevated Convection24 August 20074493
Surface Based Convection7 August 20073973
Elevated Convection13 June 20084410
Surface Based Convection19 June 2008 *3847
Elevated Convection25 July 20084409
Surface Based Convection22 July 20084382
Elevated Convection12 May 2010 *3566
Surface Based Convection12 May 2010 *4183
Elevated Convection20 July 20104982
Surface Based Convection25 July 2010 *4809
Elevated Convection11 September 2010 *5260
Surface Based Convection15 September 2010 *4782
Table 8. Classification of thunderstorm complexes for all cases. TS indicates trailing stratiform; PS indicates parallel stratiform; LS indicates leading stratiform; and NL indicates the system was non-linear and was not classified.
Convection TypeConvection DateMCS Classification
Elevated Convection6 May 2007TS
Surface Based Convection24 May 2007NL
Elevated Convection2 June 2007TS
Surface Based Convection18 June 2007PS
Elevated Convection24 August 2007TS
Surface Based Convection7 August 2007PS
Elevated Convection13 June 2008PS
Surface Based Convection19 June 2008LS
Elevated Convection25 July 2008LS
Surface Based Convection22 July 2008LS
Elevated Convection12 May 2010TS
Surface Based Convection12 May 2010TS
Elevated Convection20 July 2010TS
Surface Based Convection25 July 2010NL
Elevated Convection11 September 2010TS
Surface Based Convection15 September 2010TS

