
Spatial and Temporal Variation of the Extreme Saharan Dust Event over Turkey in March 2016

Abstract
:1. Introduction
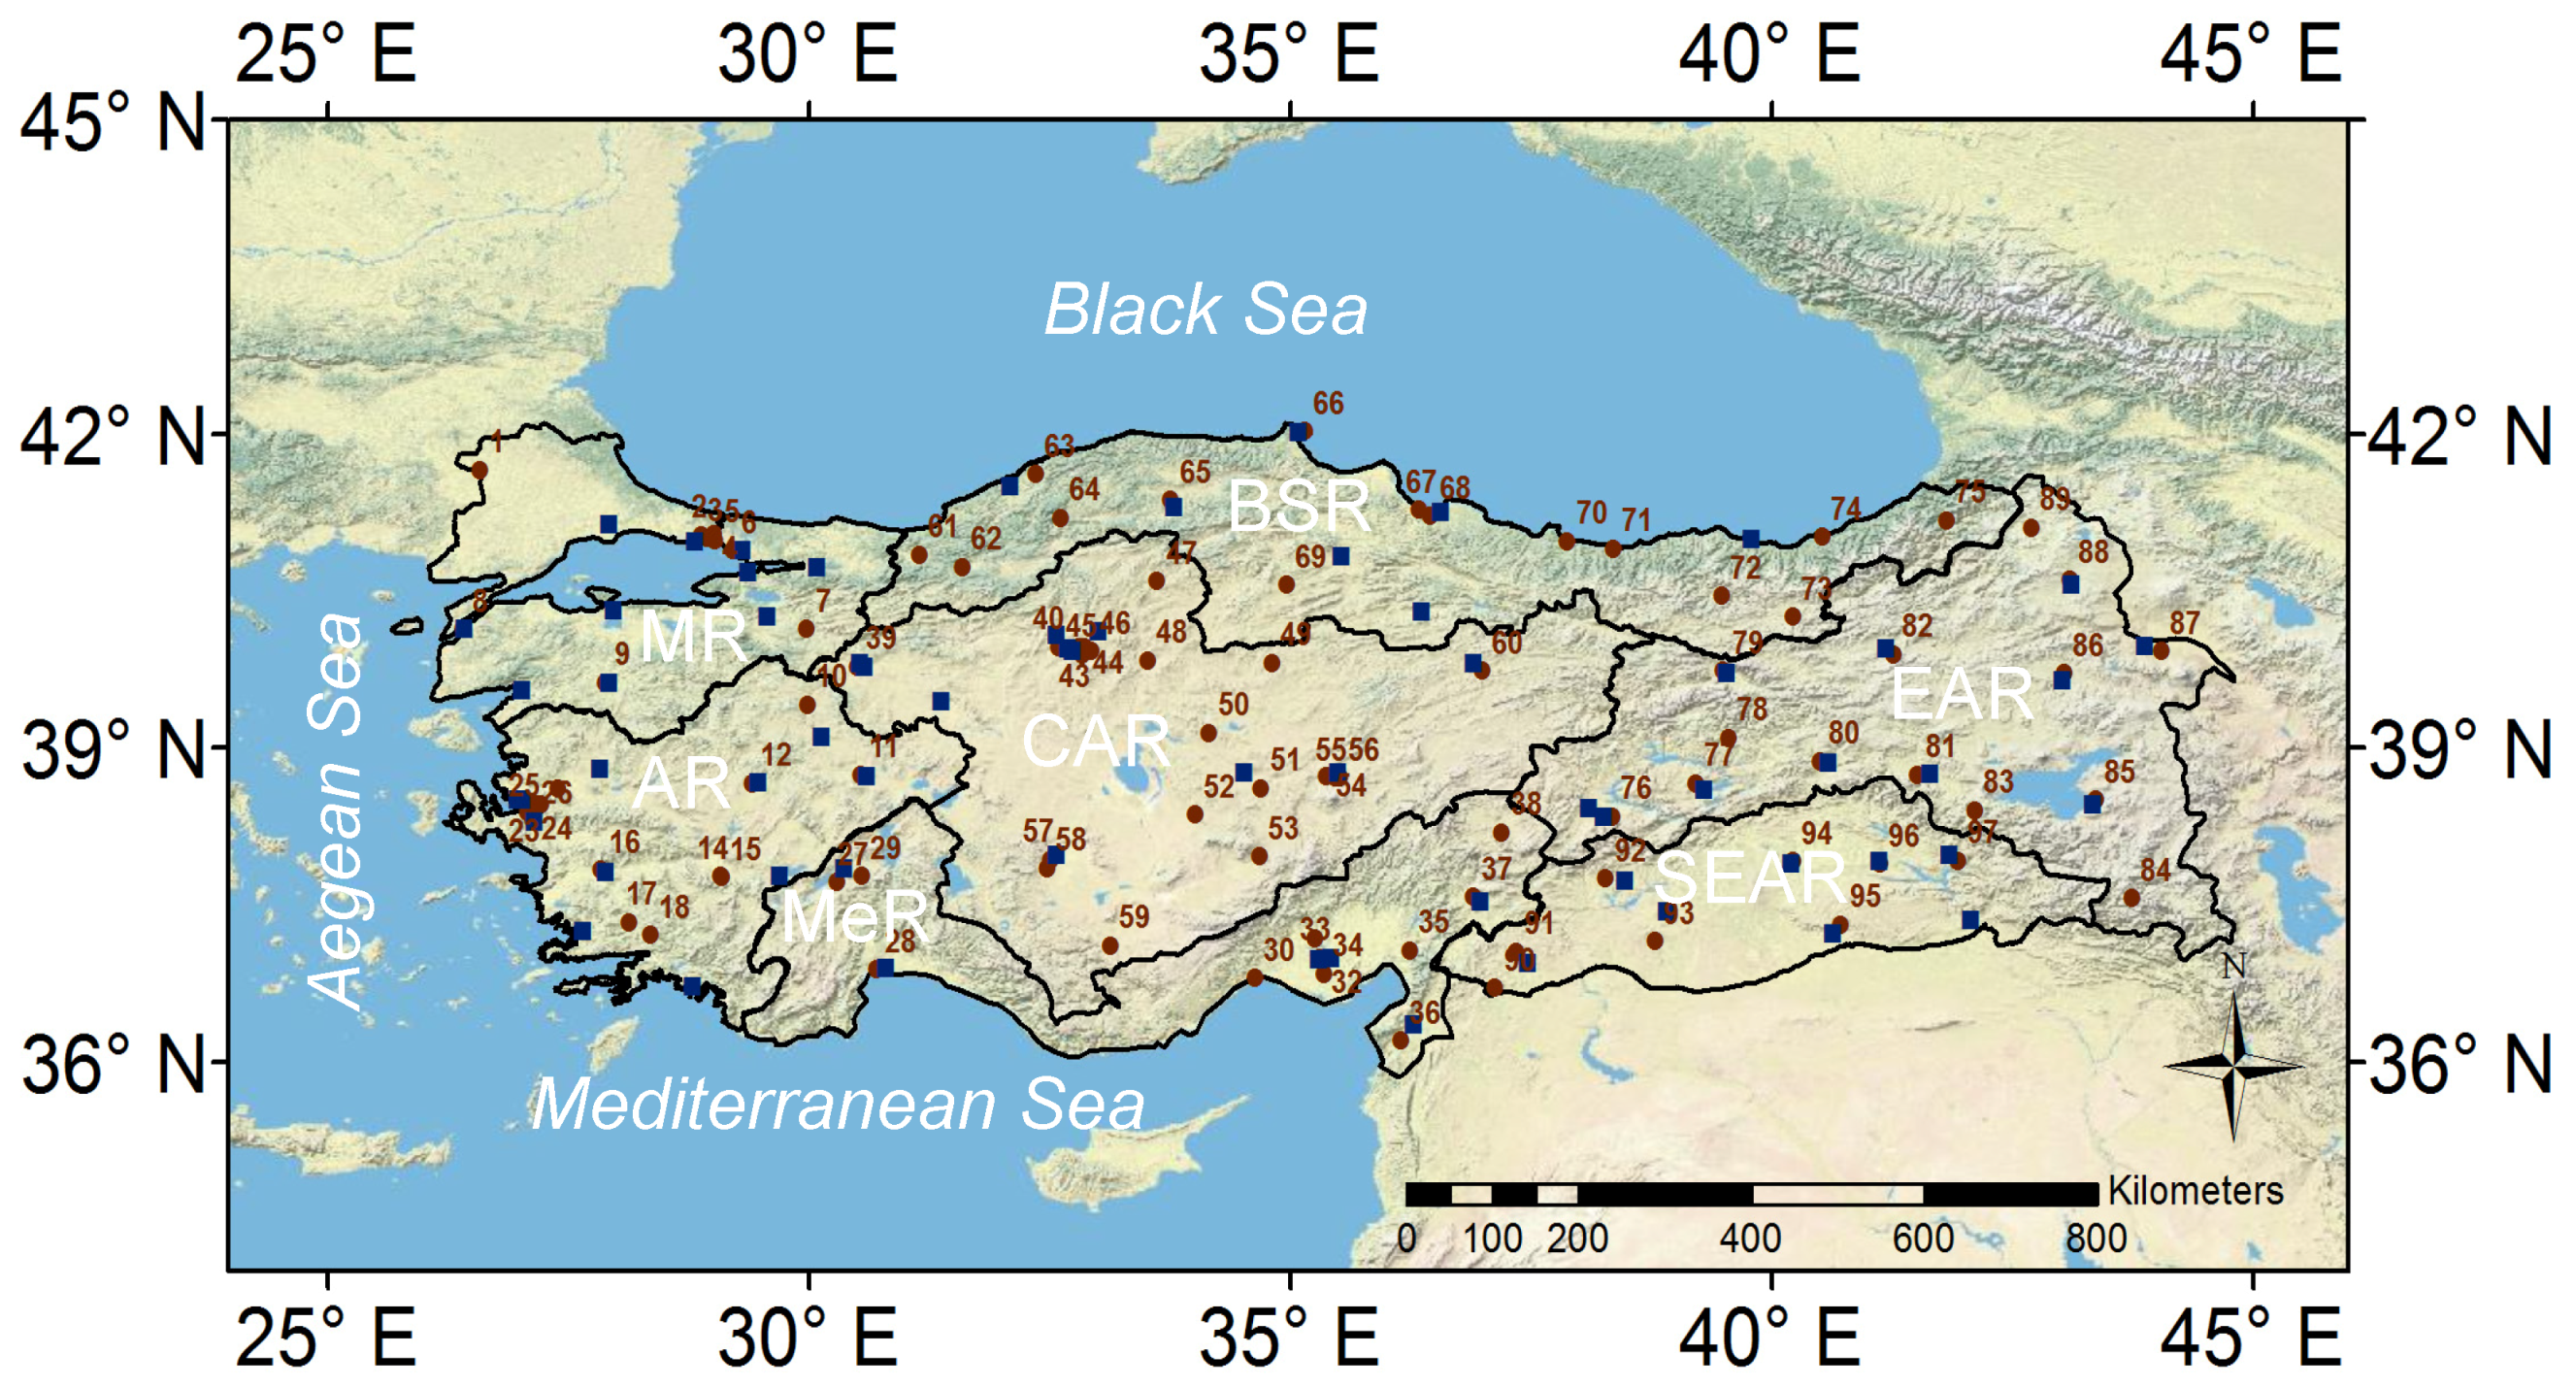
2. Data Sources
3. Results and Discussion
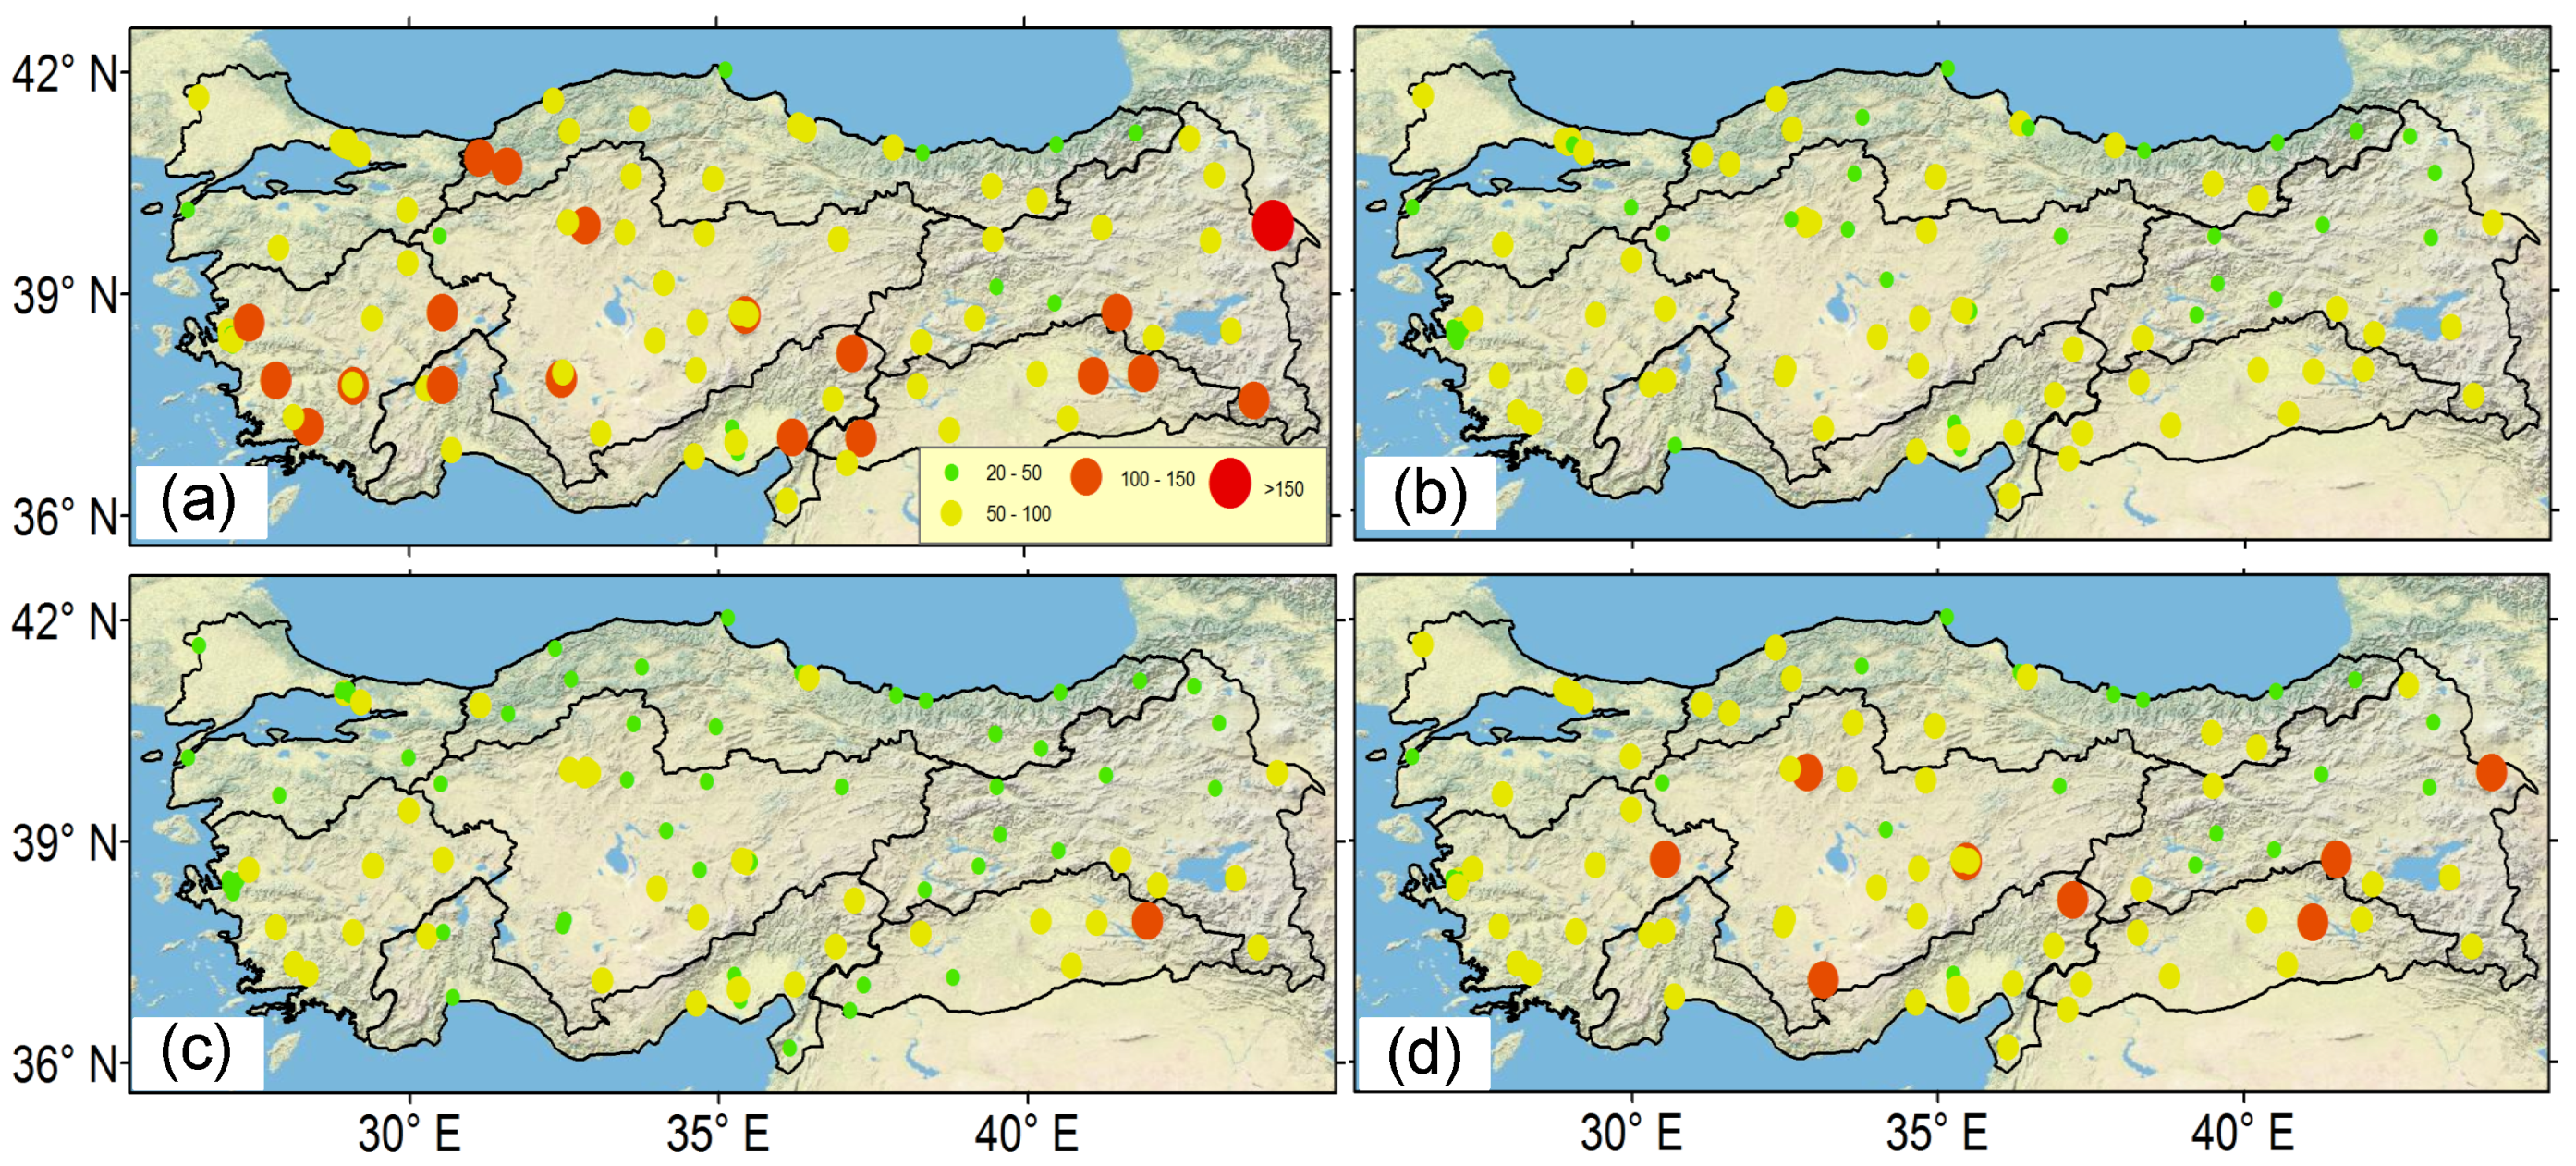
3.1. Seasonal Averages of PM10 Concentrations over Turkey
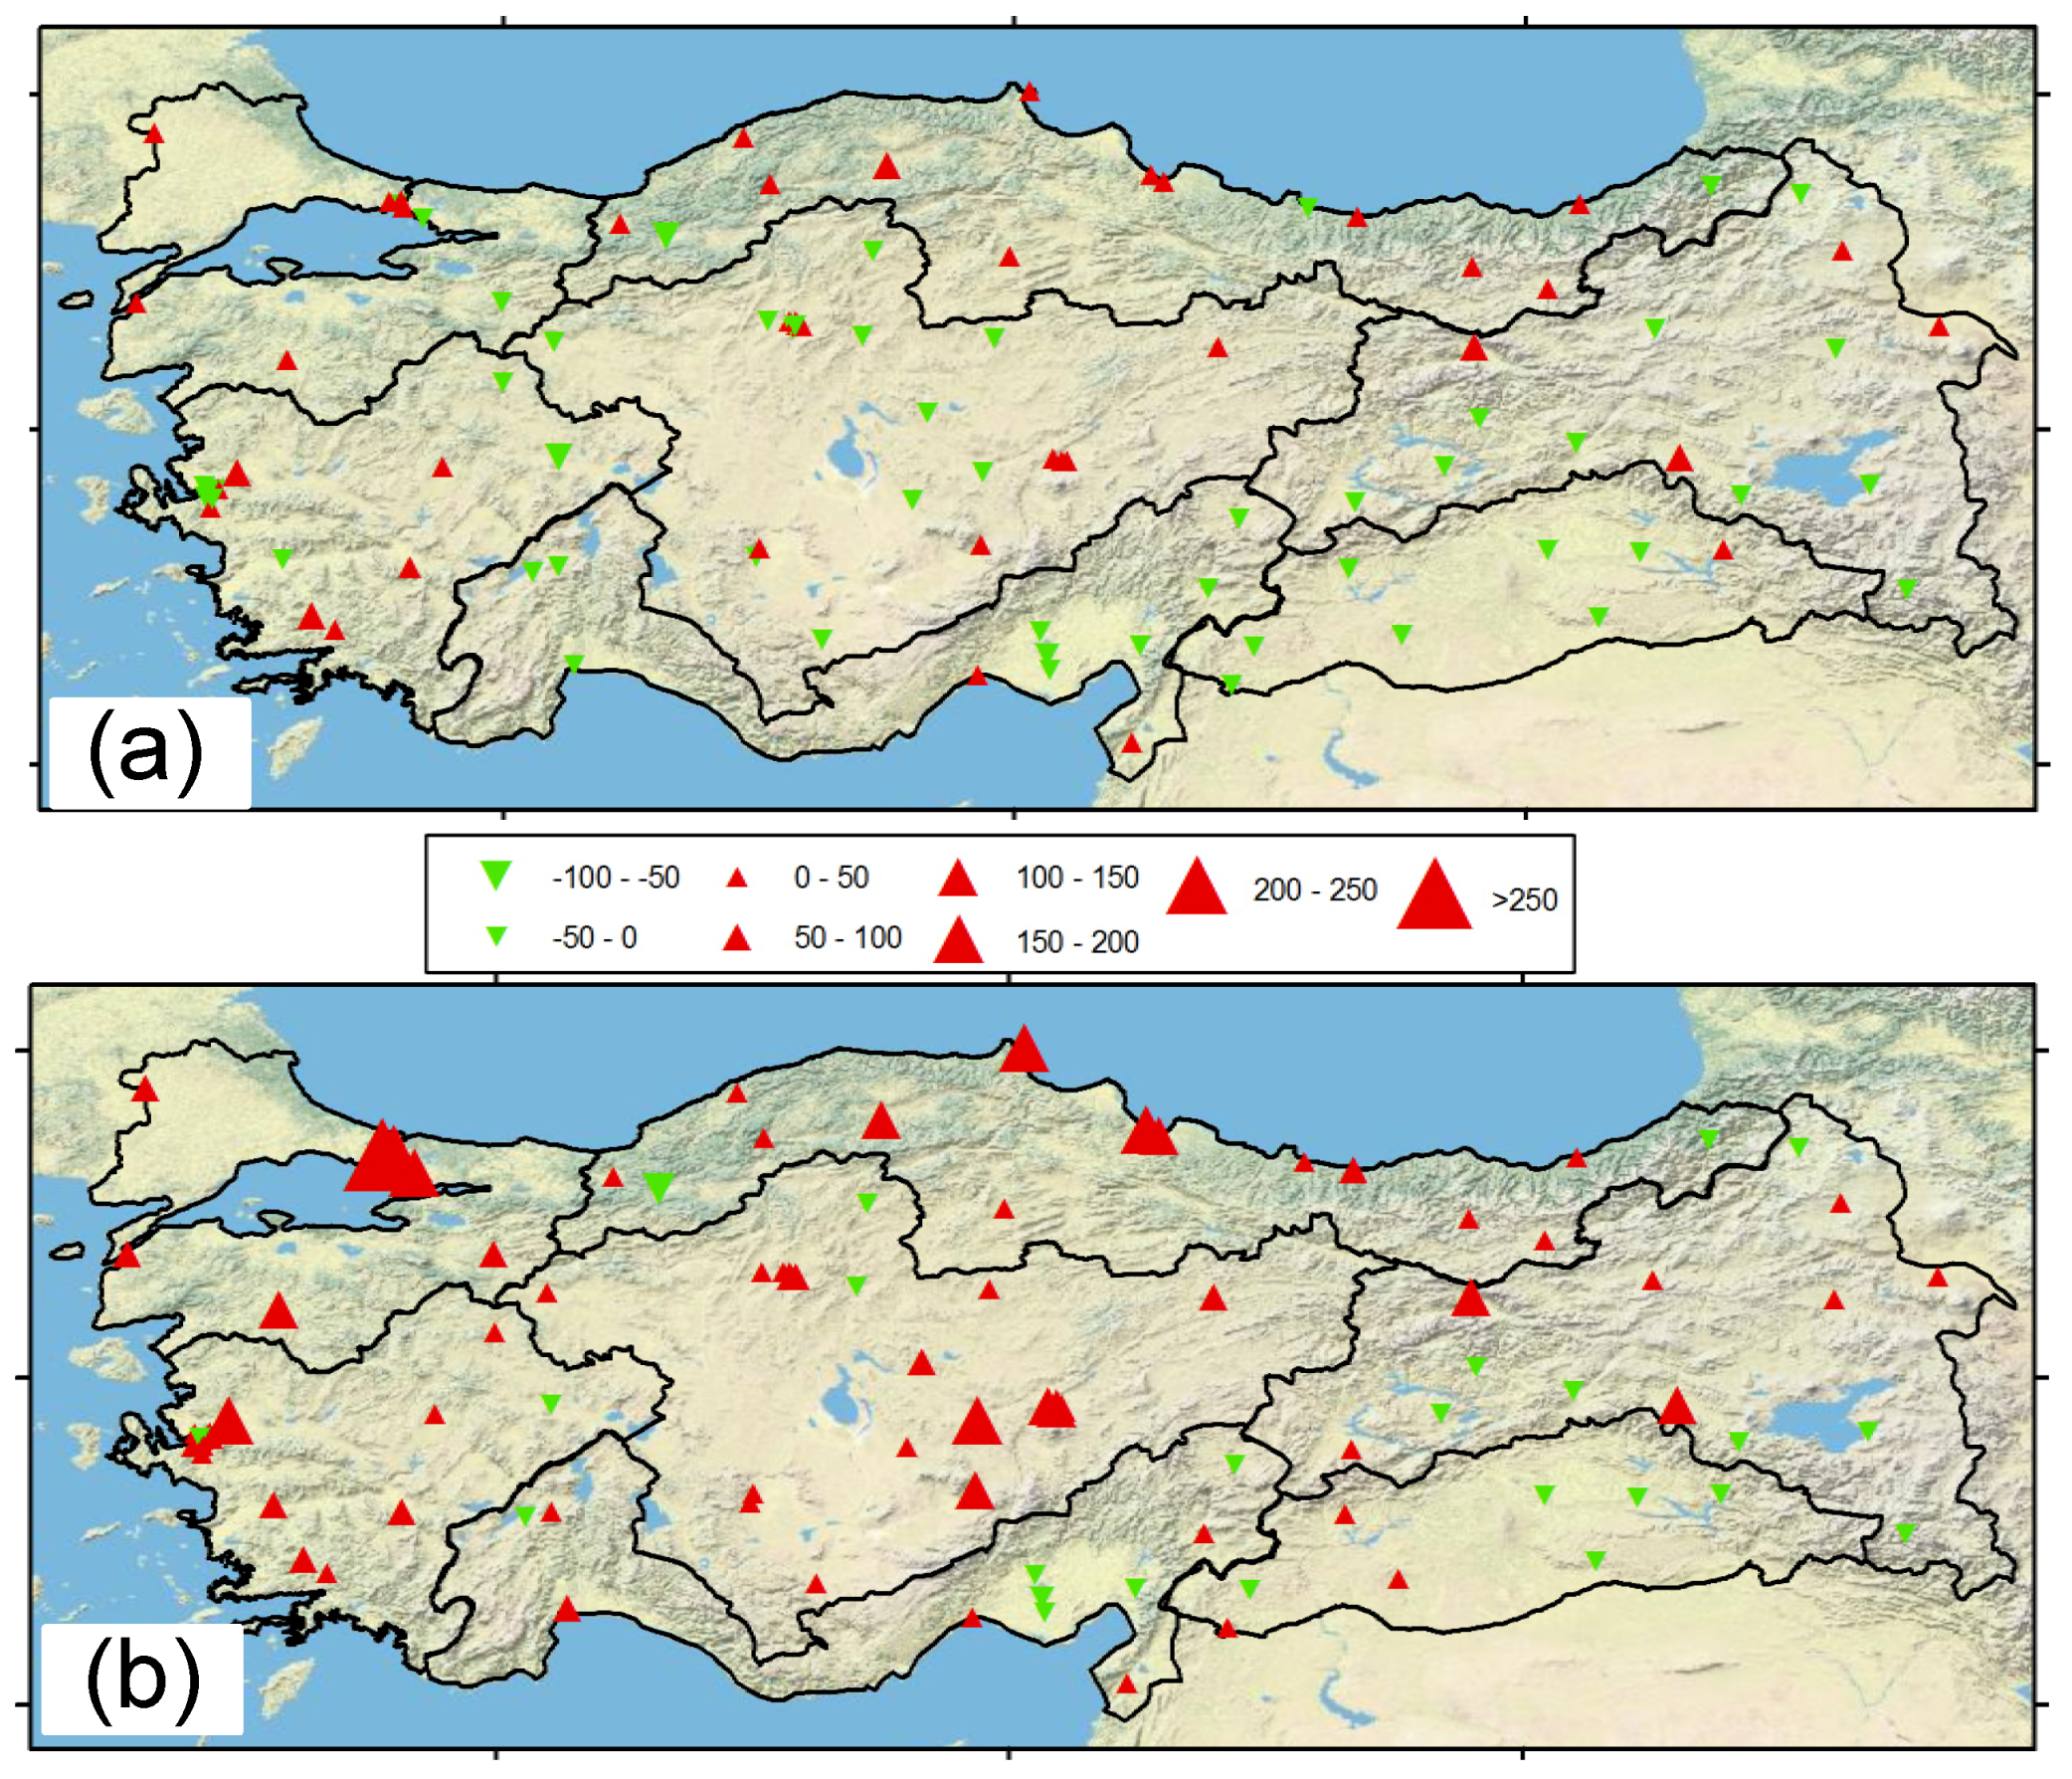
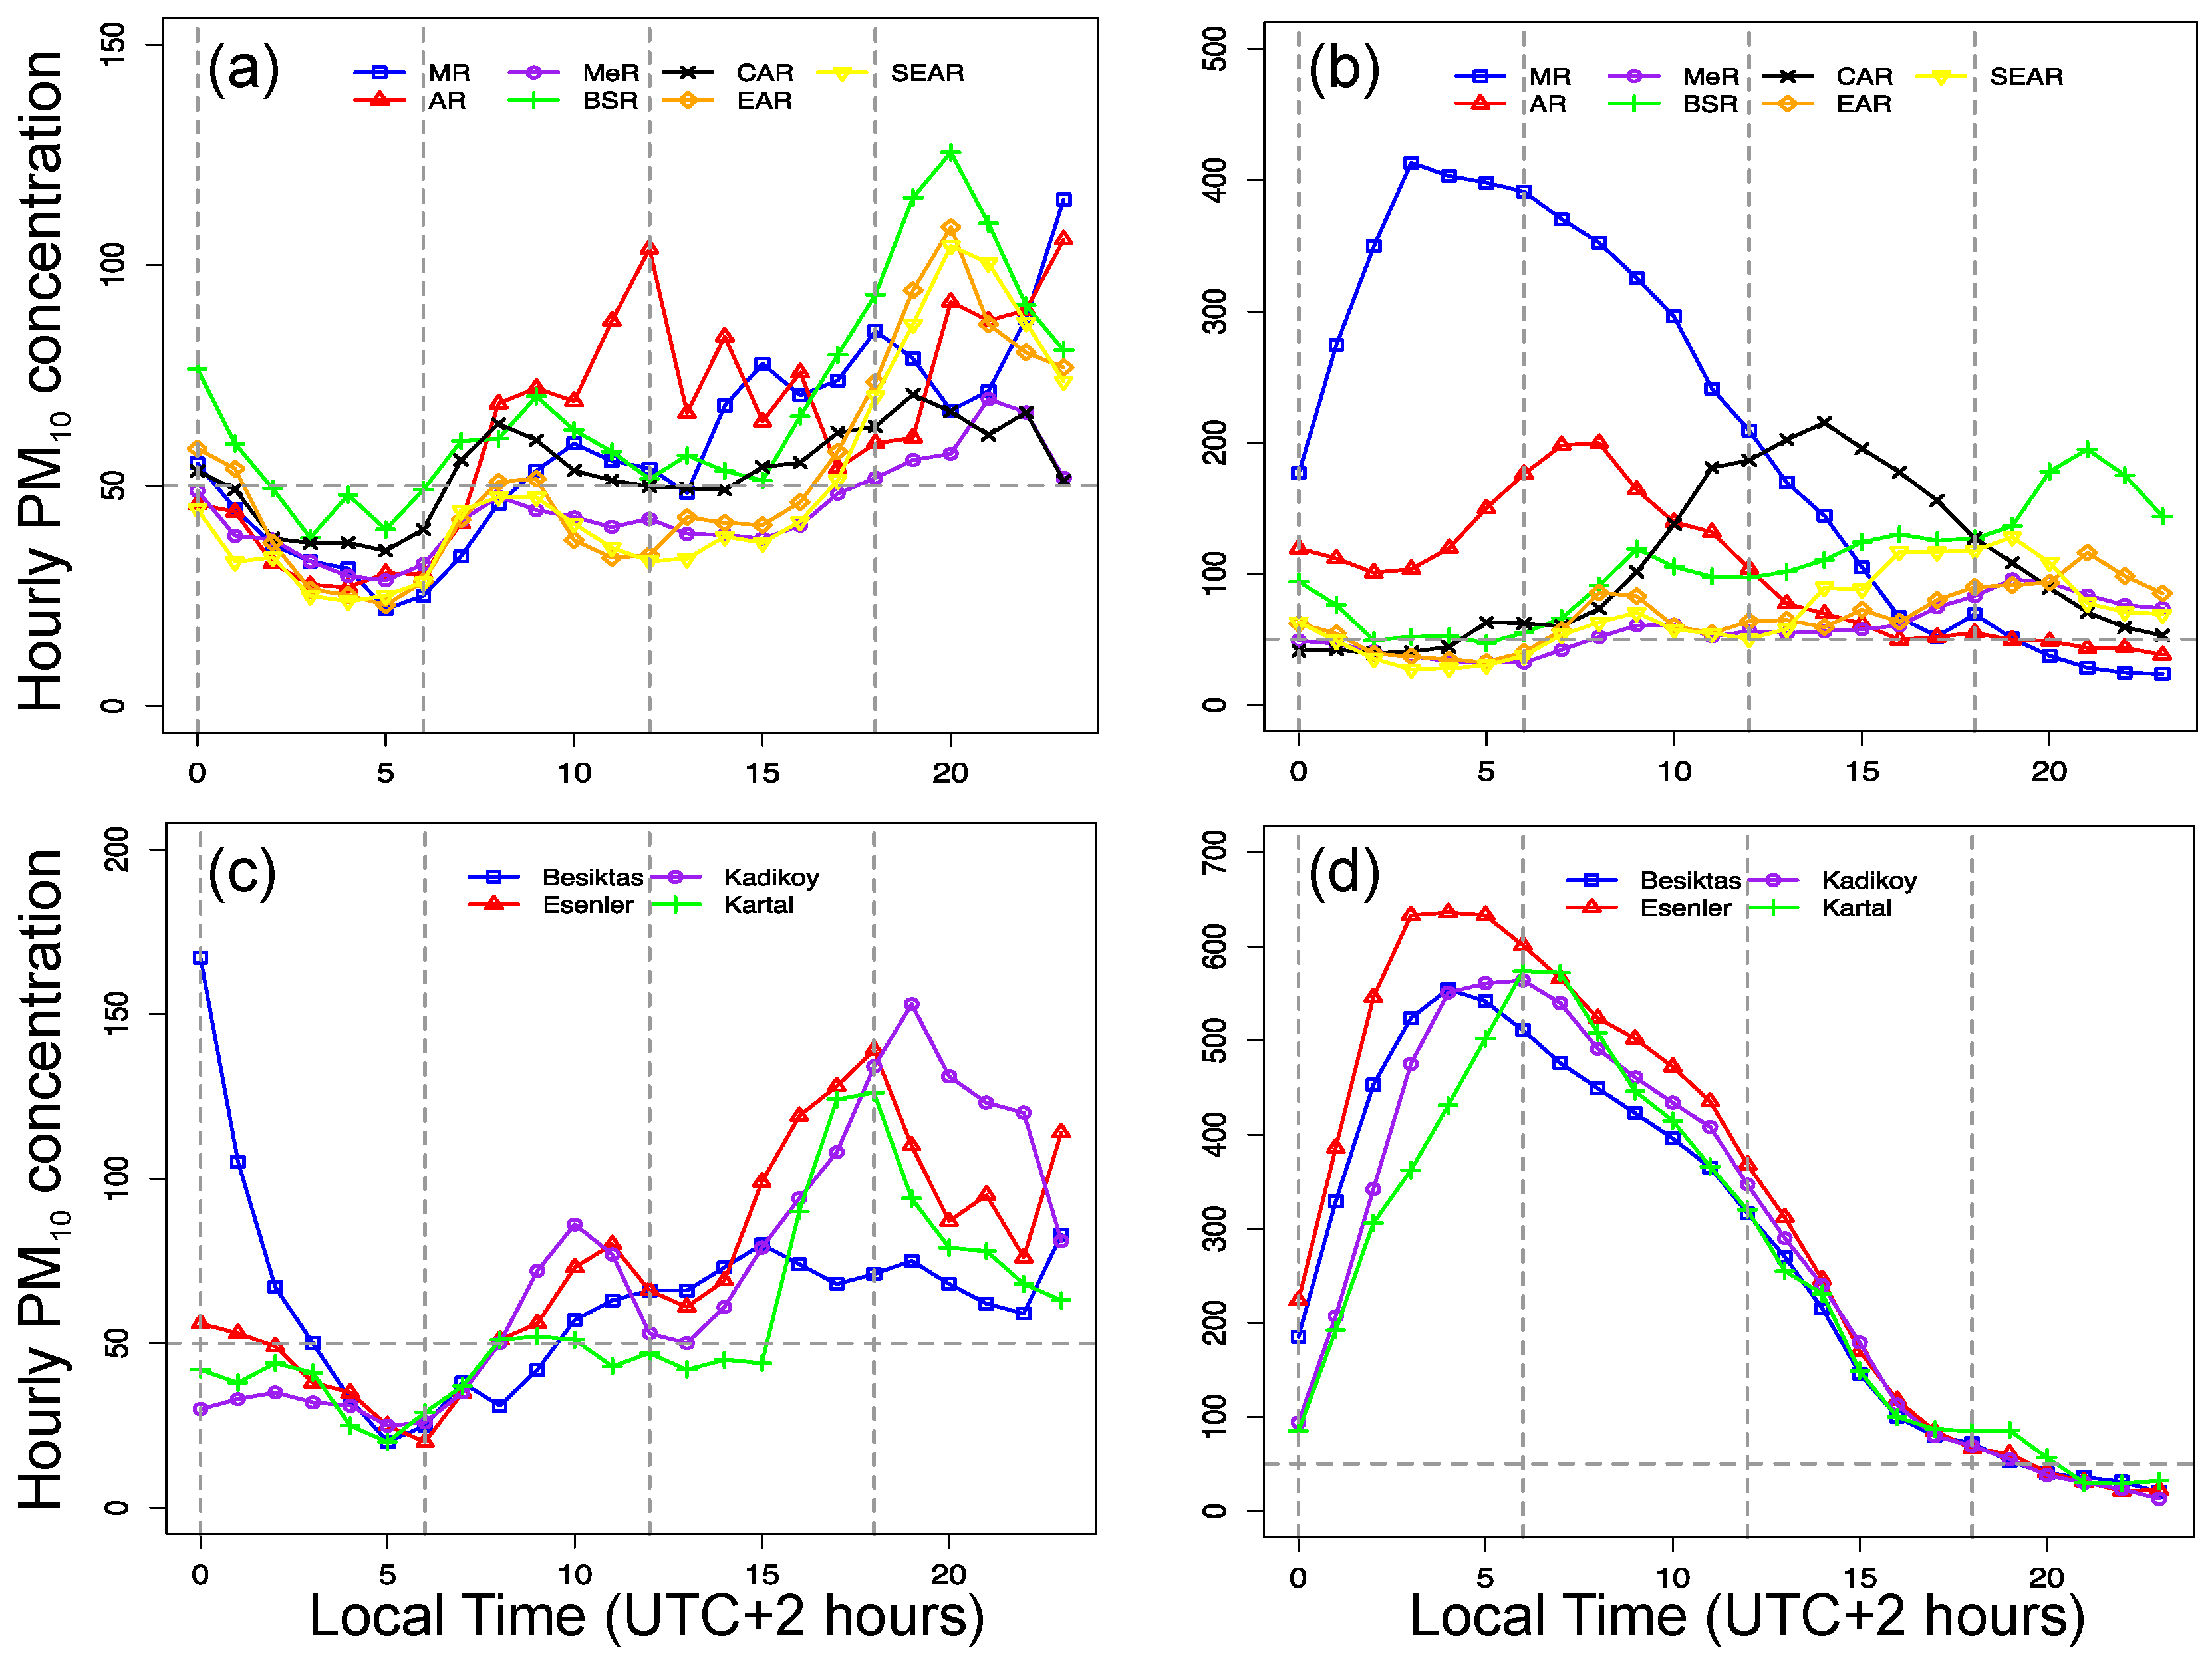
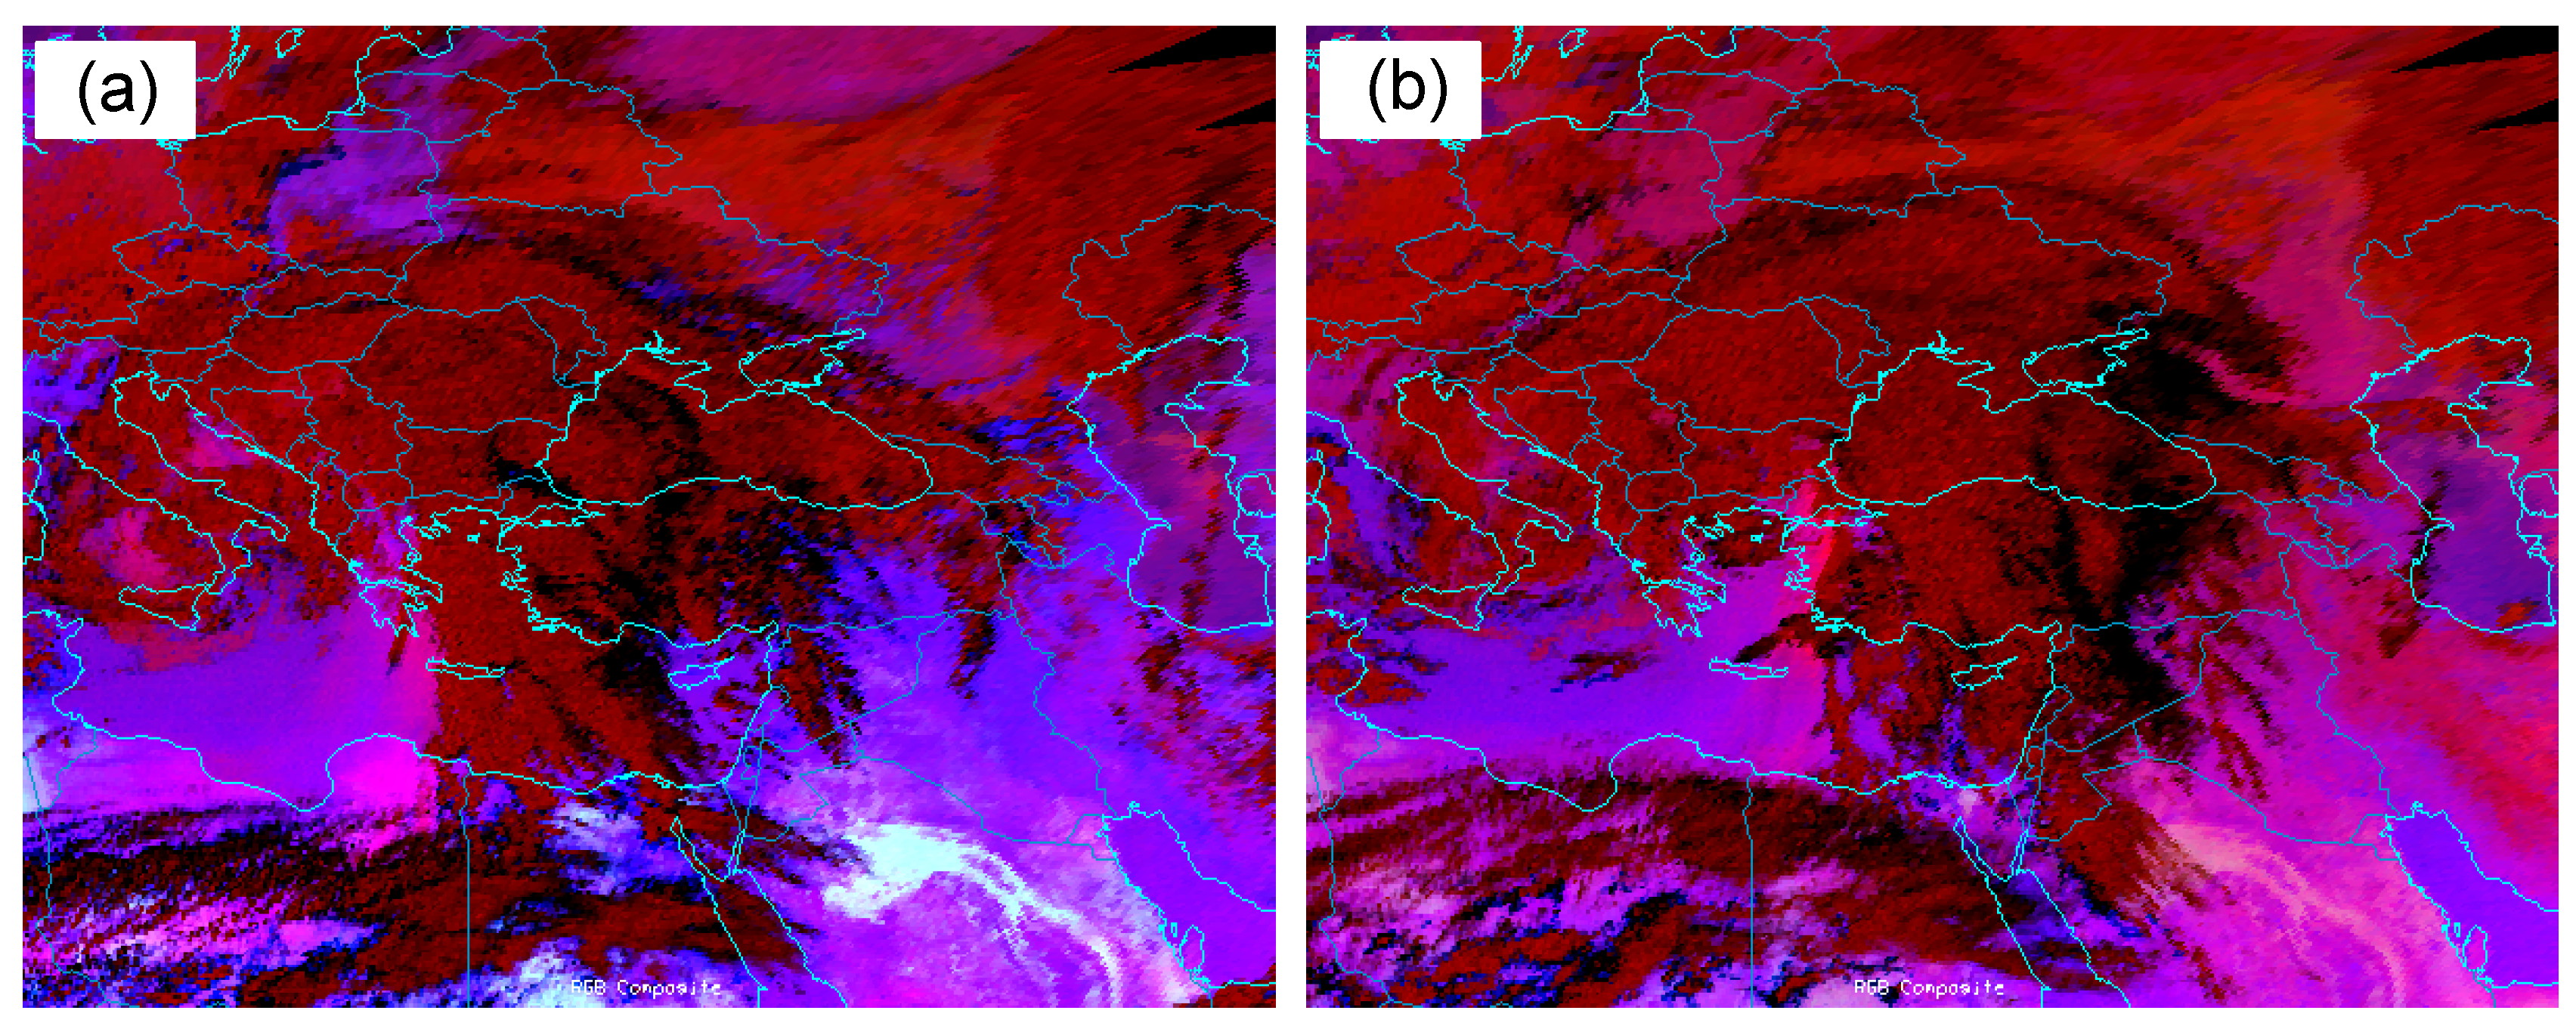
3.2. Spatio-Temporal Variations of Extreme Dust Episodes on 23–24 March 2016
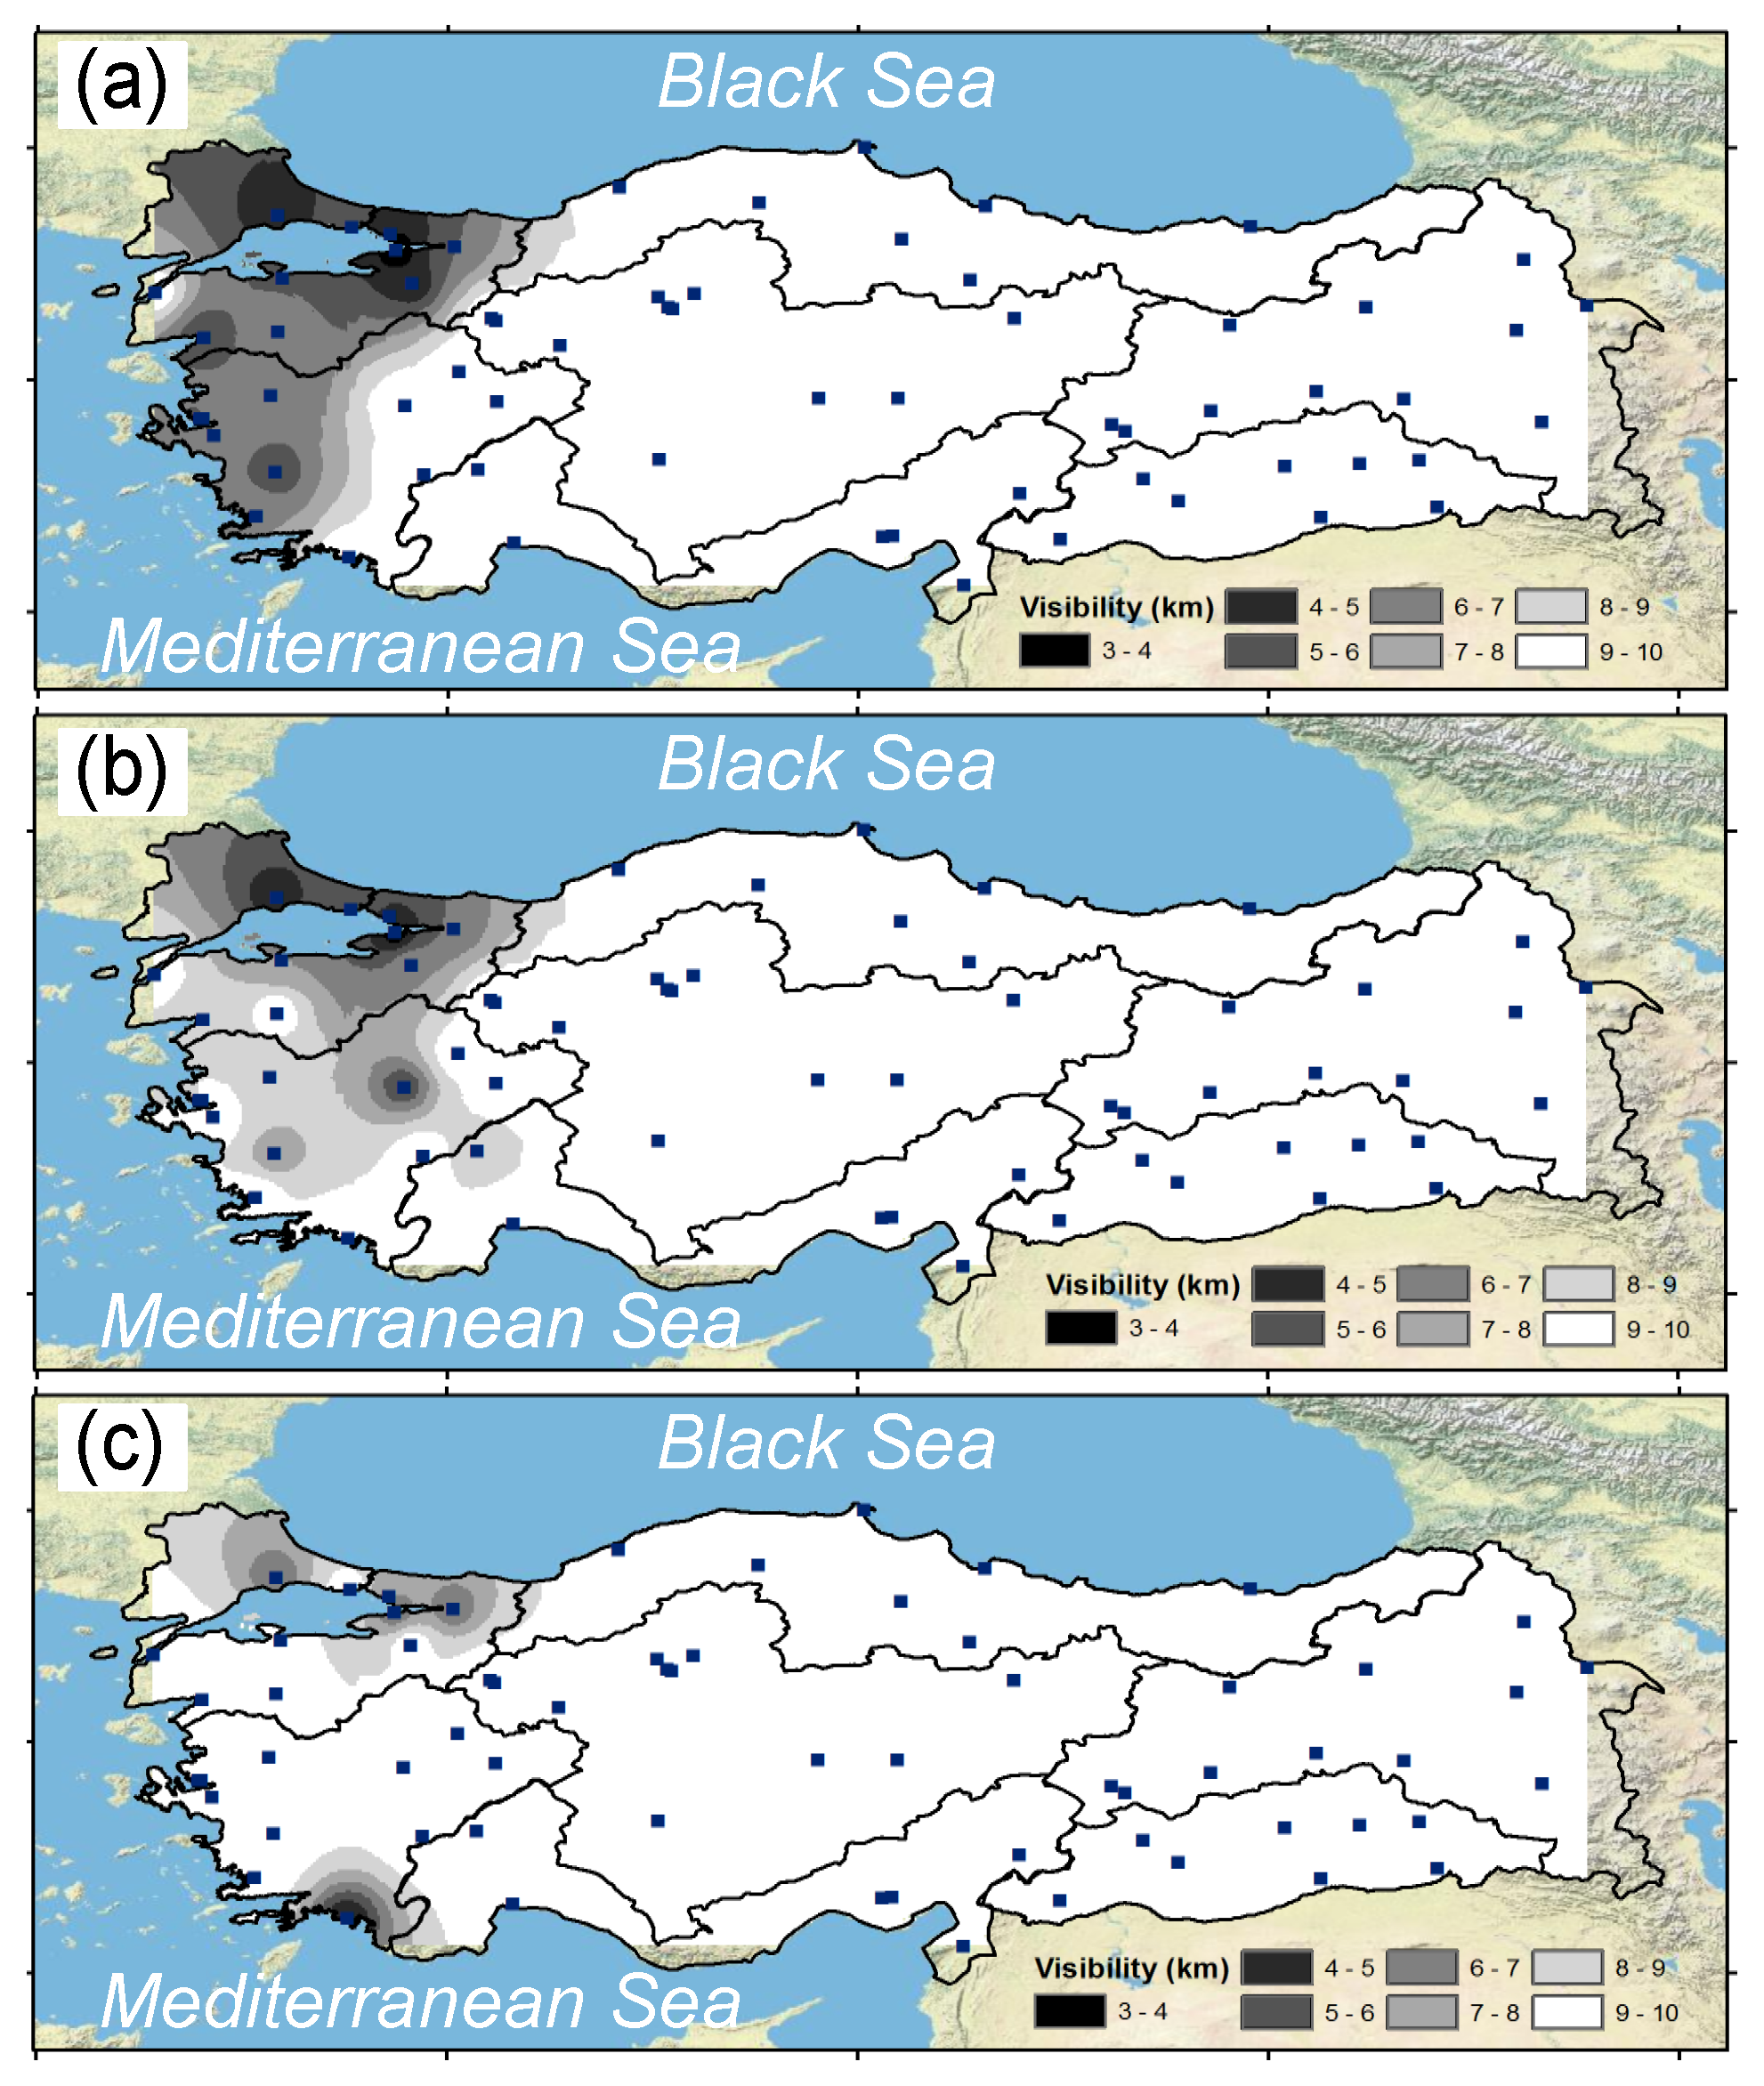
3.3. Association between Visibility and PM10 Concentrations
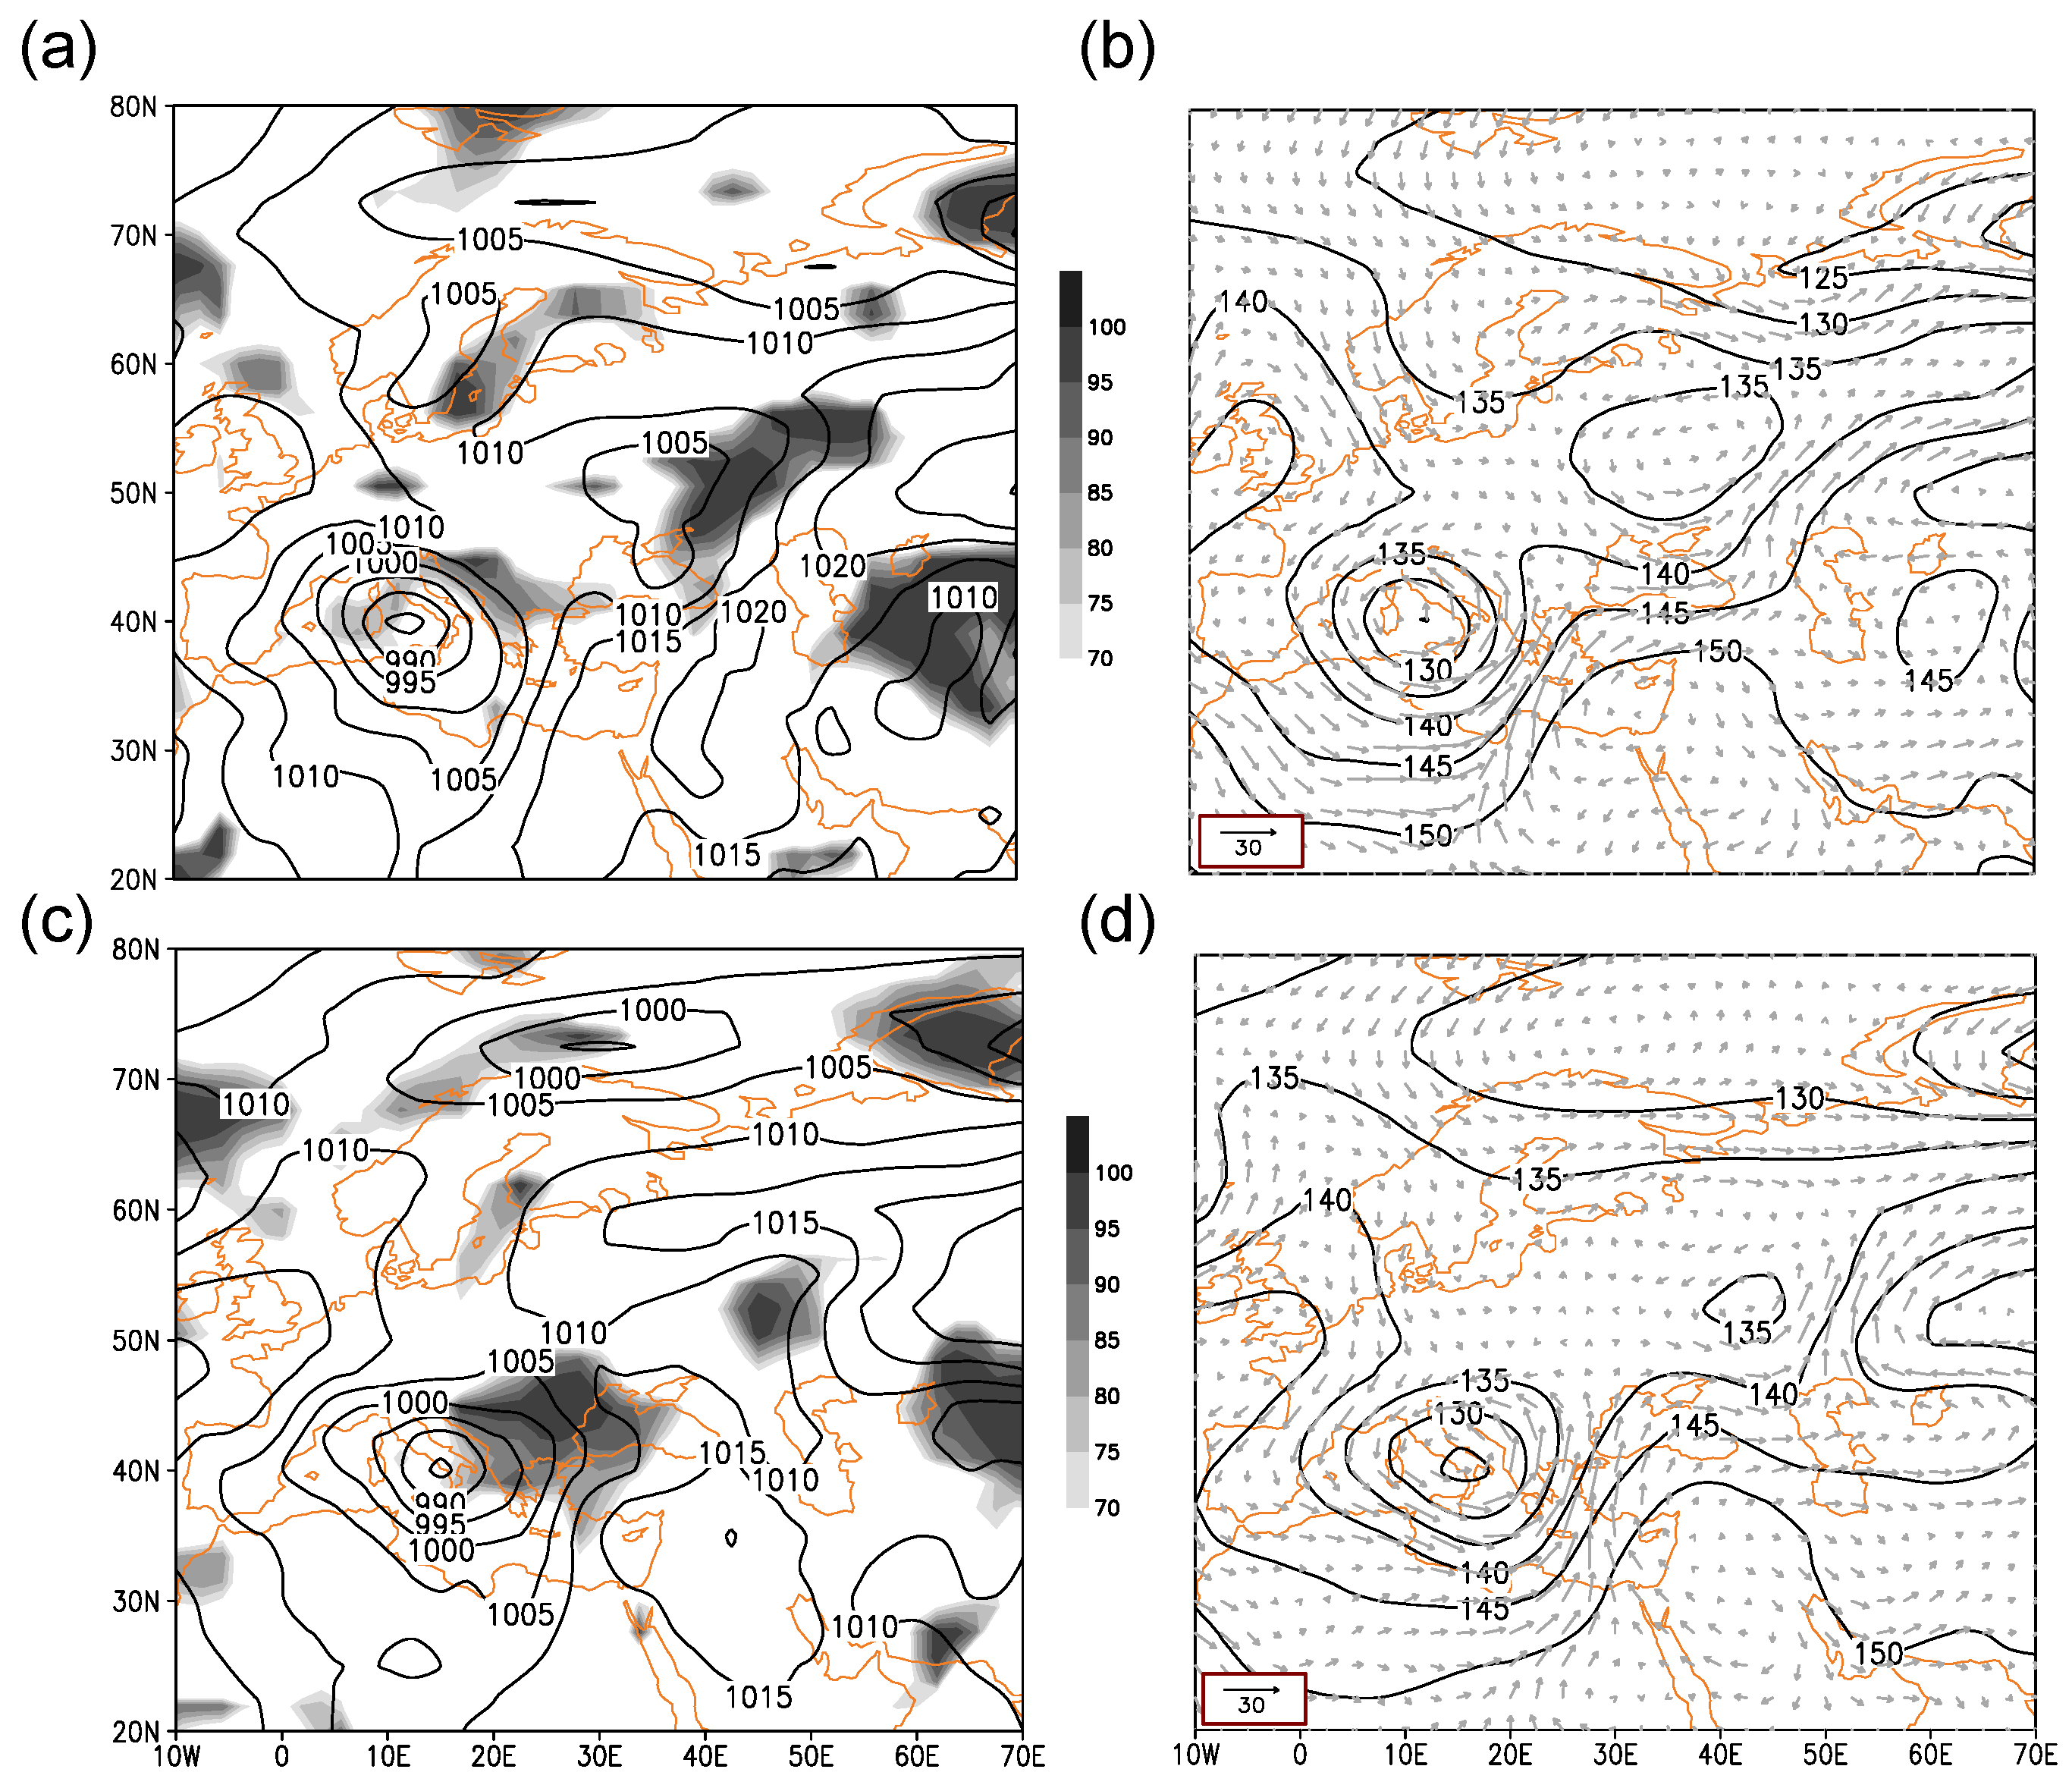
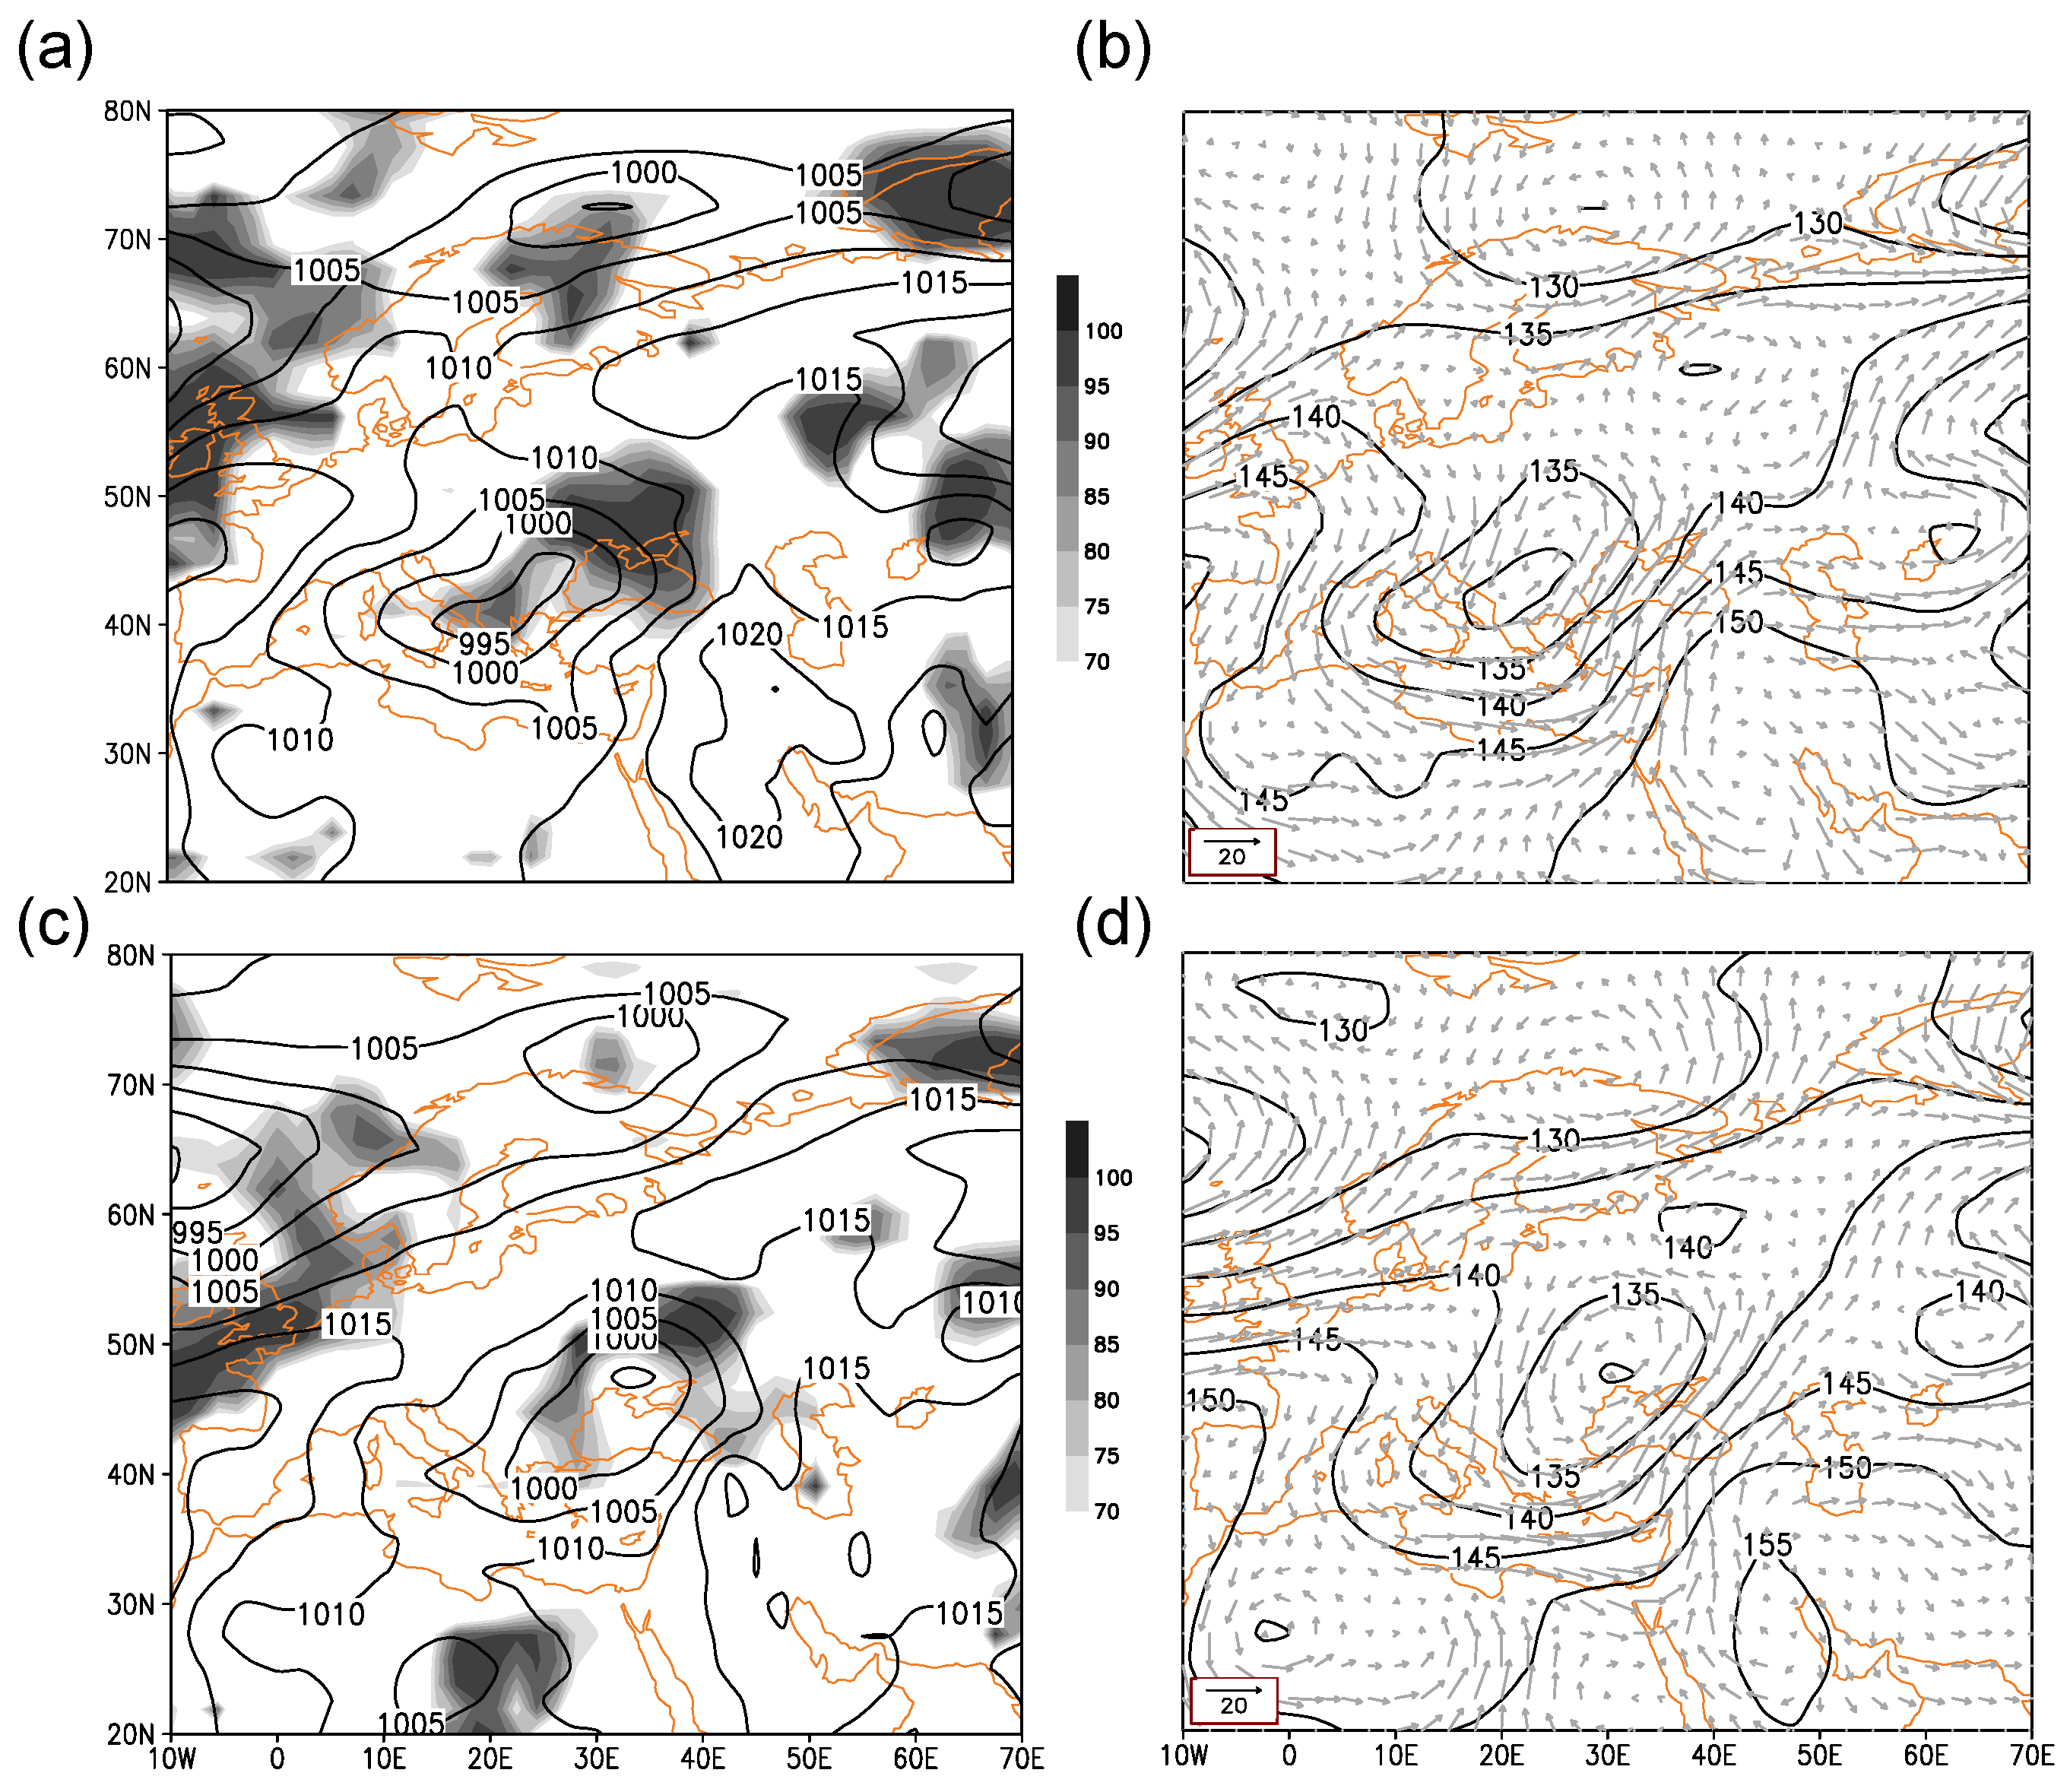
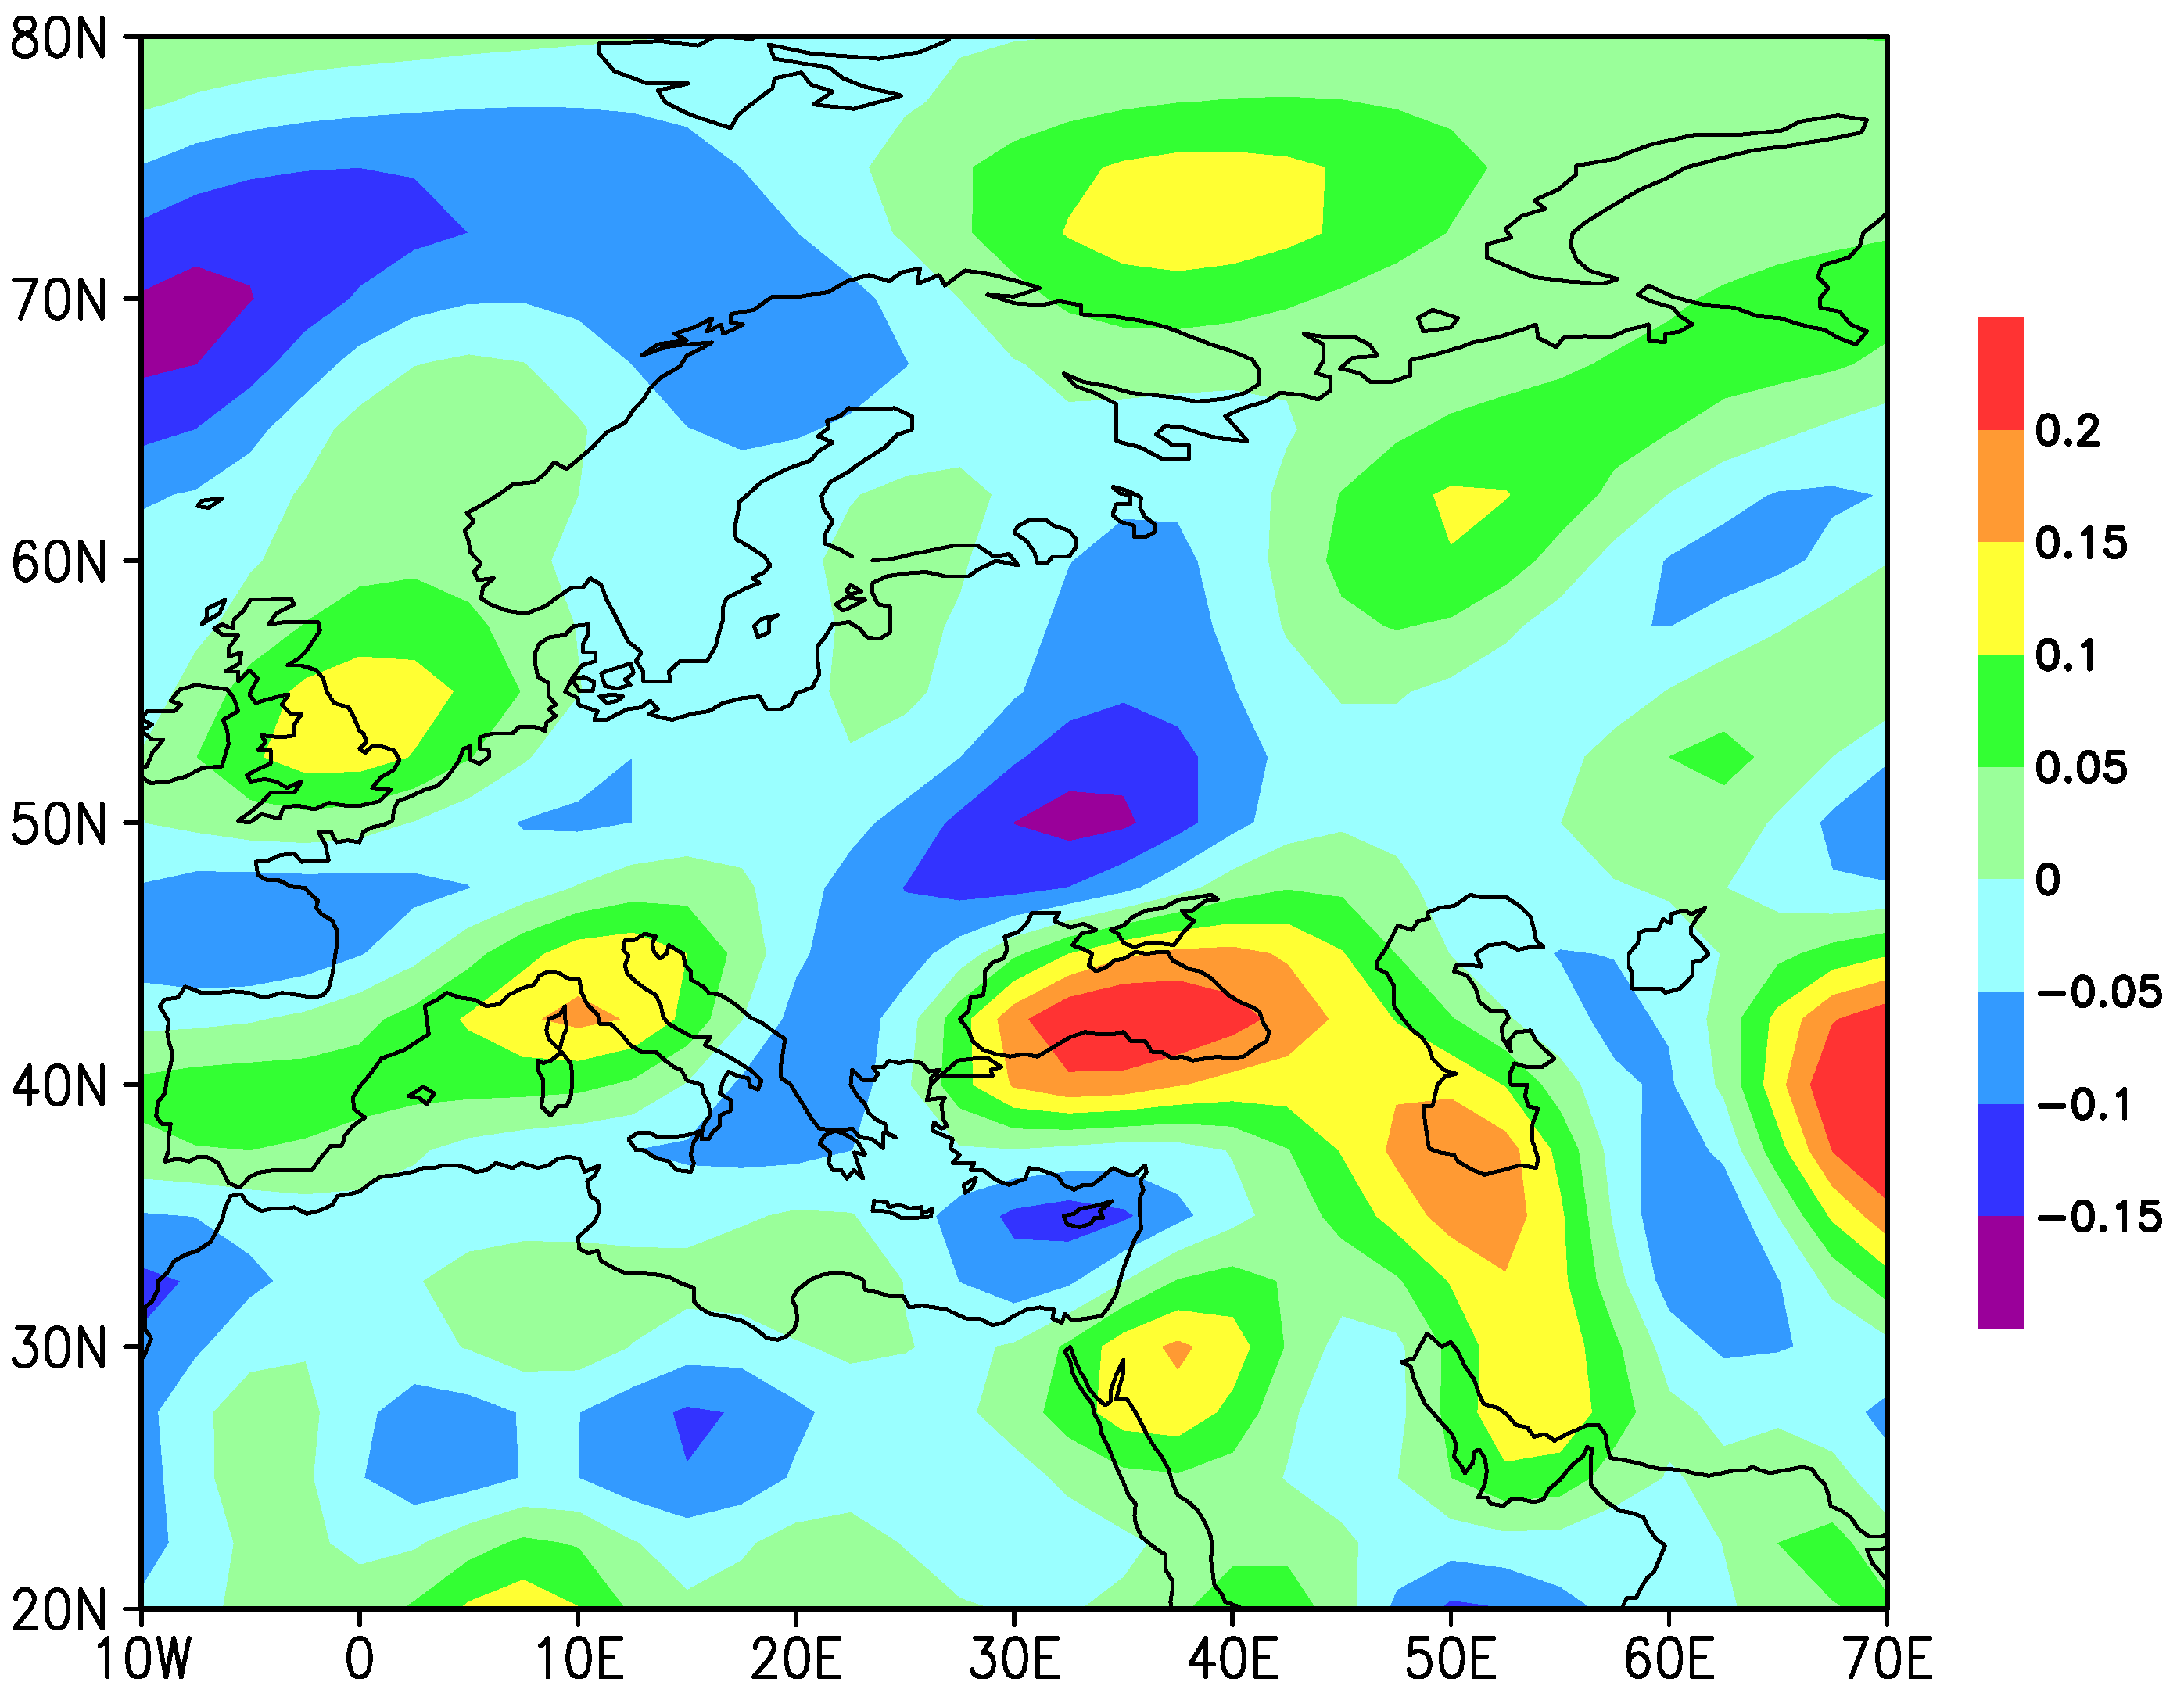
3.4. A Review of the Synoptic Pattern of 23–24 March 2016
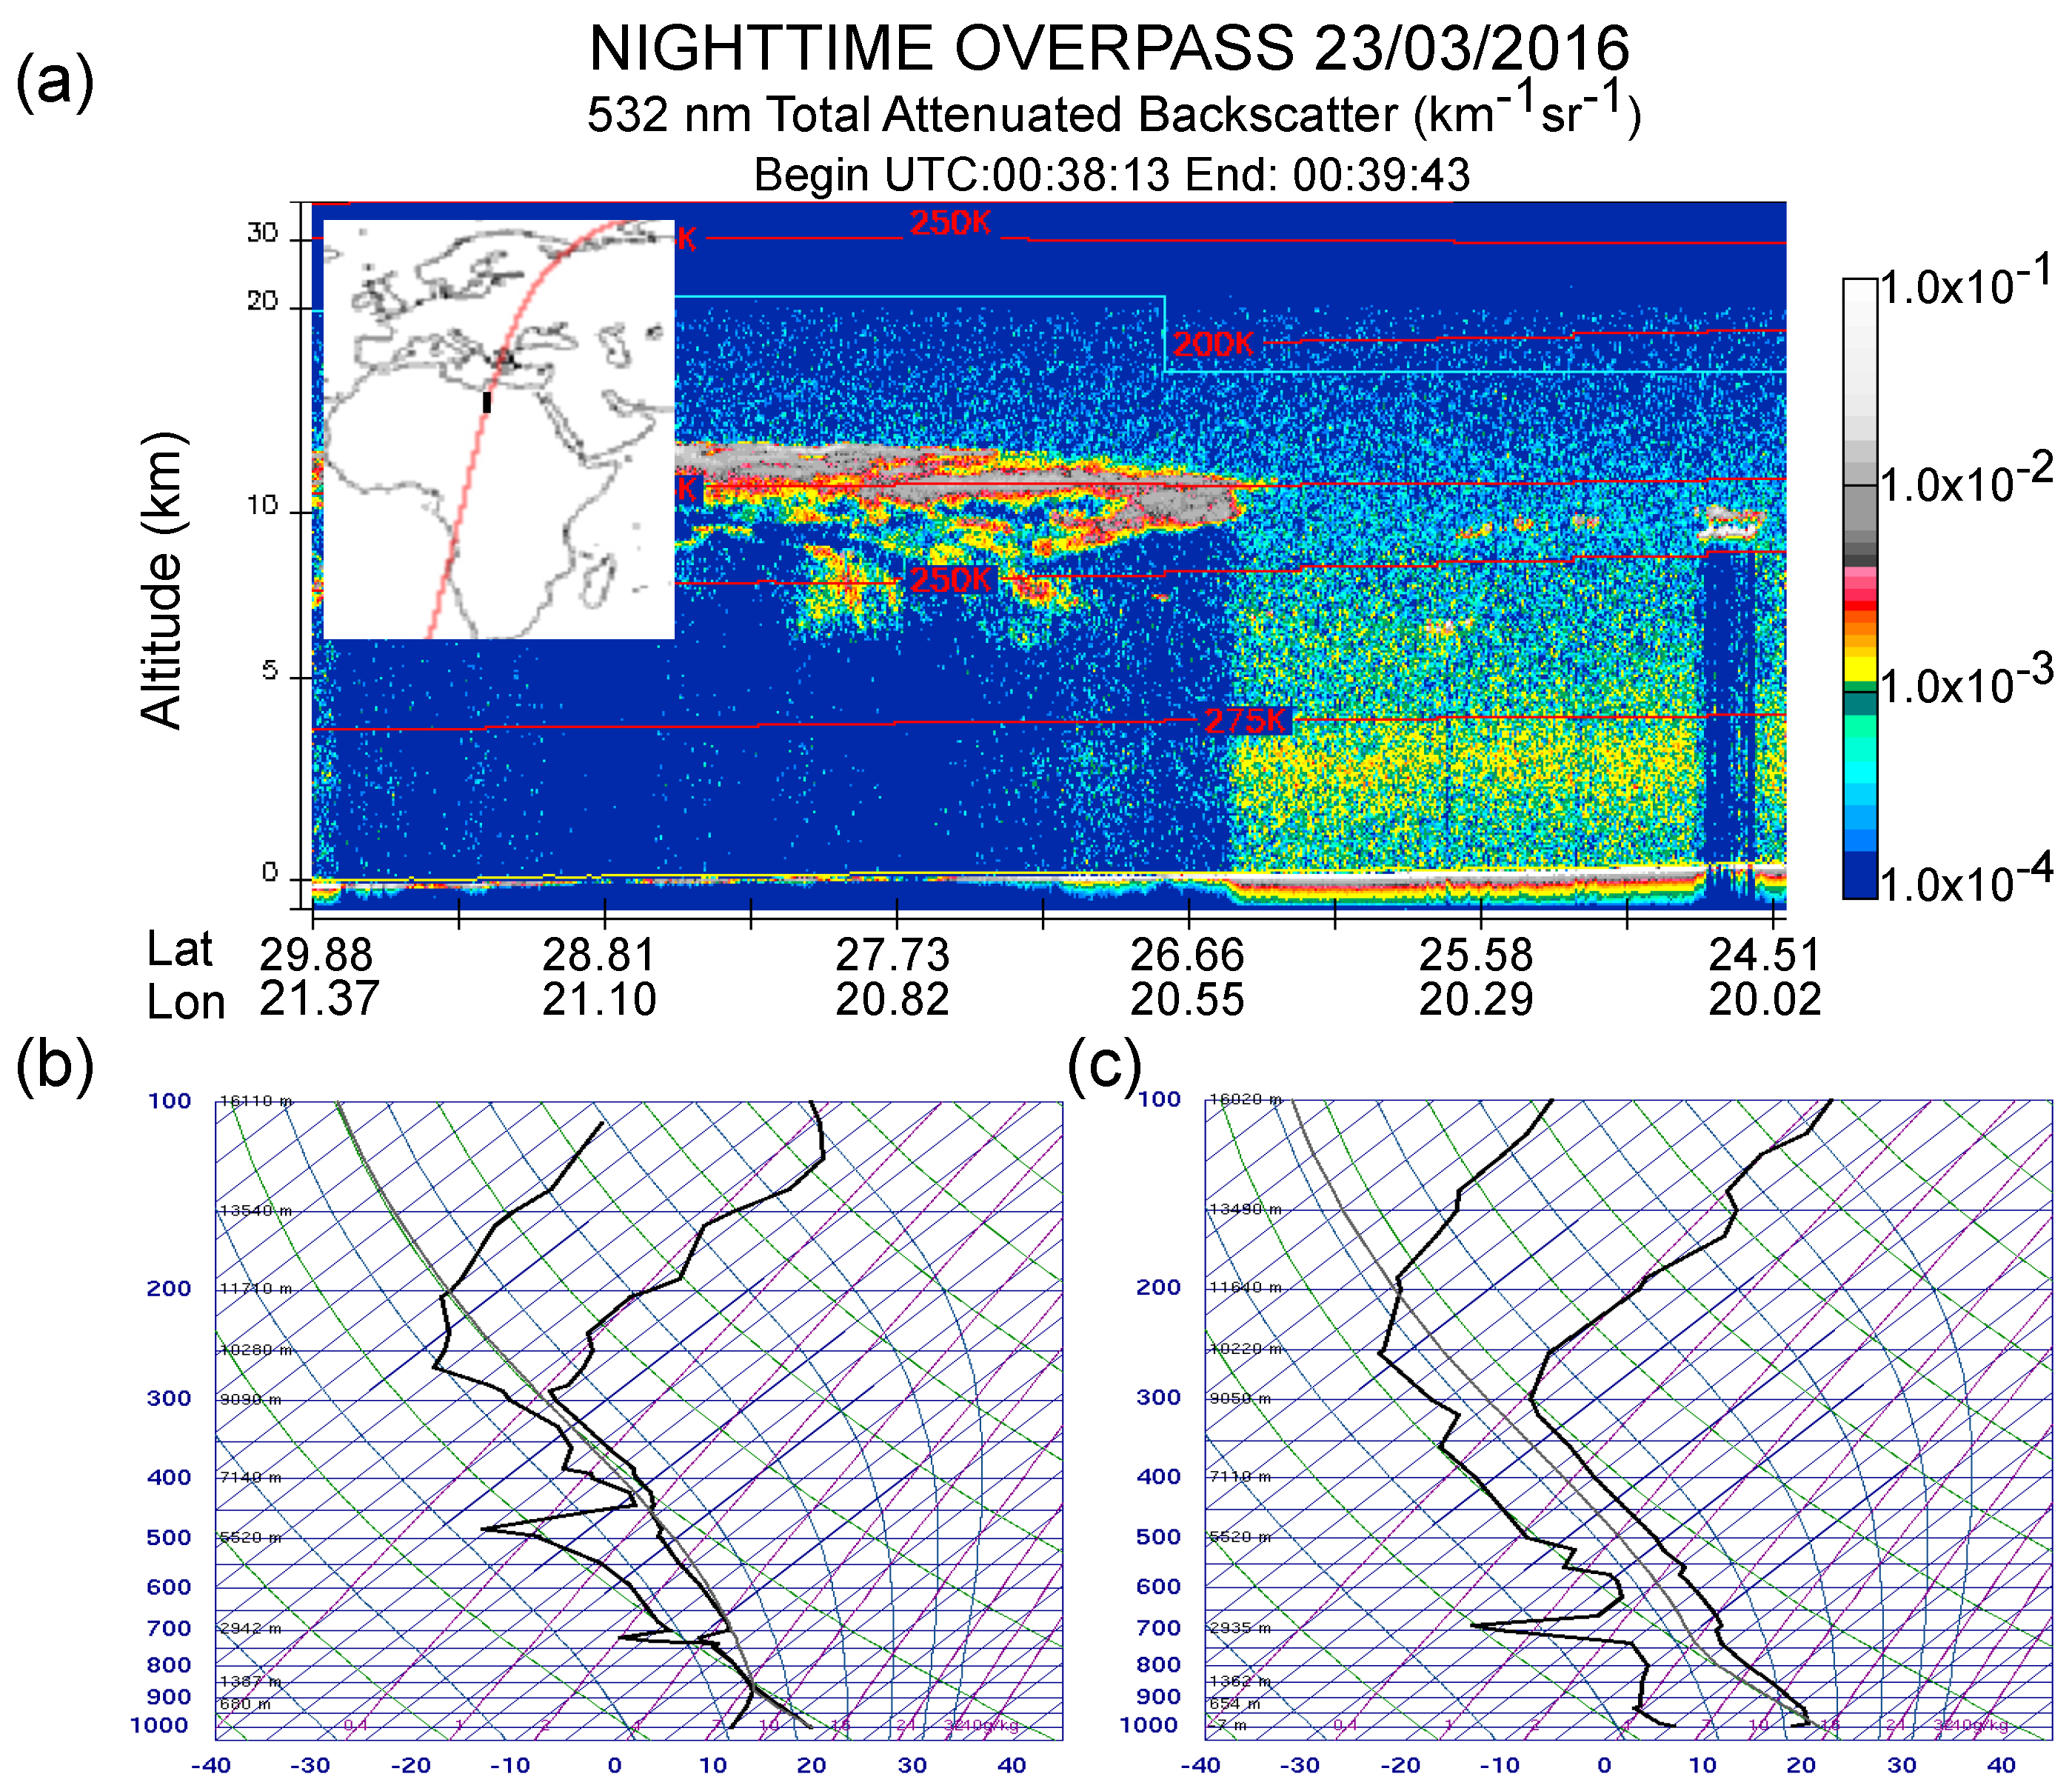
3.5 Vertical Profiles of Saharan Dust
4. Summary and Conclusions
Conflicts of Interest
References
- Goudie, A.S.; Middleton, N.J. Saharan dust storms: Nature and consequences. Earth-Sci. Rev. 2001, 56, 179–204. [Google Scholar] [CrossRef]
- Chiapello, I.; Bergametti, G.; Gomes, L.; Chatenet, B.; Dulac, F.; Pimenta, J.; Santos Suares, E. An Additional Low Layer Transport of Sahelian and Saharan Dust over the North-Eastern Tropical Atlantic. Geophys. Res. Lett. 1995, 22, 3191–3194. [Google Scholar] [CrossRef]
- Kellogg, C.A.; Griffin, D.W.; Garrison, V.H.; Peak, K.K.; Royall, N.; Smith, R.R.; Shinn, E.A. Characterization of aerosolized bacteria and fungi from desert events in Mali, West Africa. Aerobiologia 2004, 20, 99–110. [Google Scholar] [CrossRef]
- Perez, L.; Tobias, A.; Querol, X.; Künzli, N.; Pey, J.; Alastuey, A.; Viana, M.; Valero, N.; Gonzales-Cabre, M.; Sunyer, J. Coarse particles from Saharan dust and daily mortality. Epidemiology 2008, 19, 800–807. [Google Scholar] [CrossRef] [PubMed]
- Kubilay, N.; Cokacar, T.; Oguz, T. Optical properties of mineral dust outbreaks over the northeastern Mediterranean. J. Geophys. Res. 2003, 108, 4666. [Google Scholar] [CrossRef]
- Akpinar-Elci, M.; Martin, F.E.; Behr, J.G.; Diaz, R. Saharan dust, climate variability, and asthma in Grenada, the Caribbean. Int. J. Biometeorol. 2015, 59, 1667–1671. [Google Scholar] [CrossRef] [PubMed]
- Jimenez, E.; Linares, C.; Martinez, D.J. Role of Saharan dust in the relationship between particulate matter and short-term daily mortality among the elderly in Madrip (Spain). Sci. Total Environ. 2010, 408, 5729–5736. [Google Scholar] [CrossRef] [PubMed]
- Mate, T.; Guaita, R.; Pichiule, M.; Linares, C.; Diaz, J. Short-term effect of fine particulate matter (PM2.5) on daily mortality due to diseases of the circulatory system in Madrid (Spain). Sci. Total Environ. 2010, 408, 5750–5757. [Google Scholar] [CrossRef] [PubMed]
- Middleton, N.; Yiallouros, P.; Kleanthous, S.; Kolokotroni, O.; Schwartz, J.; Dockery, D.W.; Demokritou, P.; Koutrakis, P. A 10-year time-series analysis of respiratory and cardiovascular morbidity in Nicosia, Cyprus: The effect of short-term changes in air pollution and dust storms. Environ. Health 2008, 7, 39. [Google Scholar] [CrossRef] [PubMed]
- Samoli, E.; Kougea, E.; Kassomenos, P.; Analitis, A.; Katsouyanni, K. Does the presence of desert dust modify the effect of PM10 on mortality in Athens, Greece? Sci. Total Environ. 2011, 409, 2049–2054. [Google Scholar] [CrossRef] [PubMed]
- Zauli Sajani, S.; Miglio, R.; Bonasoni, P.; Cristofanelli, P.; Marinoni, A.; Sartini, C.; Goldoni, C.A.; de Girolamo, G.; Lauriola, P. Saharan dust and daily mortality in Emilia-Romagna (Italy). Occup. Environ. Med. 2011, 68, 446–451. [Google Scholar] [CrossRef] [PubMed]
- Alpert, P.; Kishcha, P.; Shtivelman, A.; Krichak, S.O.; Joseph, J.H. Vertical distribution of Saharan dust based on 2.5-year model predictions. Atmos. Res. 2004, 70, 109–130. [Google Scholar] [CrossRef]
- Bangert, M.; Nenes, A.; Vogel, B.; Vogel, H.; Barahona, D.; Karydis, V.A.; Kumar, P.; Kottmeier, C.; Blahak, U. Saharan dust event impacts on cloud formation and radiation over Western Europe. Atmos. Chem. Phys. 2012, 12, 4045–4063. [Google Scholar] [CrossRef]
- Cabello, M.; Orza, J.A.G.; Barrero, M.A.; Gordo, E.; Berasaluce, A.; Canton, L.; Duenas, C.; Fernandes, M.C.; Perez, M. Spatial and temporal variation of the impact of an extreme Saharan dust event. J. Geophys. Res. 2012, 117, D11204. [Google Scholar] [CrossRef]
- Moulin, C.; Lambert, C.E.; Dayan, U.; Masson, V.; Ramonet, M.; Bousquet, P.; Legrand, M.; Blakanski, Y.J.; Guella, W.; Marticorena, B.; Bergametti, G.; Dulac, F. Satellite climatology of African dust transport in the Mediterranean atmosphere. J. Geophys. Res. 1998, 103, 13137–13144. [Google Scholar] [CrossRef]
- Tsidulko, M.; Krichak, S.O.; Alpert, P.; Kakaliagou, O.; Kallos, G.; Papadopoulos, A. Numerical study of a very intensive eastern Mediterranean dust storm, 13–16 March 1998. J. Geophys. Res. 2002, 107, 4581. [Google Scholar] [CrossRef]
- Papayannis, A.; Balis, D.; Amiridis, V.; Chourdakis, G.; Tsaknakis, G.; Zerefos, C.; Castanho, A.D.A.; Nickovic, S.; Kazadzis, S.; Grabowski, J. Measurements of Saharan dust aerosols over the Eastern Mediterranean using elastic backscatter-Raman lidar, spectrophotometric and satellite observations in the frame of the EARLINET project. Atmos. Chem. Phys. 2005, 5, 2065–2079. [Google Scholar] [CrossRef]
- Kaskaoutis, D.G.; Kambezidis, H.D.; Nastos, P.T.; Kosmopoulos, P.G. Study on an intense dust storm over Greece. Atmos. Environ. 2008, 42, 6884–6896. [Google Scholar] [CrossRef]
- Griffin, D.W.; Kubilay, N.; Koçak, M.; Gray, M.A.; Borden, T.C.; Shinn, E.A. Airborne desert dust and aeromicrobiology over the Turkish Mediterranean coastline. Atmos. Environ. 2007, 41, 4050–4062. [Google Scholar] [CrossRef]
- Koçak, M.; Mihalopoulos, N.; Kubilay, N. Contributions of natural sources to high PM10 and PM2.5 events in the eastern Mediterranean. Atmos. Environ. 2007, 41, 3806–3818. [Google Scholar] [CrossRef]
- Kabatas, B.; Unal, A.; Pierce, R.B.; Kindap, T.; Pozzoli, L. The contribution of Saharan dust in PM10 concentration levels in Anatolian Peninsula of Turkey. Sci. Total Environ. 2014, 488–489, 413–421. [Google Scholar] [CrossRef] [PubMed]
- Erinç, S. Climatology and Its Methods, 3rd ed.; Istanbul, Gür-ay Pres Inc.: Istanbul, Turkey, 1984. (in Turkish) [Google Scholar]
- Kalnay, E.; Kanamitsu, M.; Kistler, R.; Collins, W.; Deaven, D.; Gandin, L.; Iredell, M.; Saha, S.; White, G.; Wollen, J.; et al. The NCEP/NCAR 40 year reanalysis project. Bull. Am. Meteorol. Soc. 1996, 77, 437–471. [Google Scholar] [CrossRef]
- De la Paz, D.; Vedrenne, M.; Borge, R.; Lumbreras, J.; de Andres, J.M.; Perez, J.; Rodriguez, E.; Karanasiou, A.; Moreno, T.; Boldo, E.; Linares, C. Modelling Saharan dust transport into the Mediterranean basin with CMAQ. Atmos. Res. 2013, 70, 337–350. [Google Scholar] [CrossRef] [Green Version]
- Guerrero-Rascado, J.L.; Olmo, F.J.; Aviles-Rodriguez, I.; Navas-Guzman, F.; Perez-Ramirez, D.; Lyamani, H.; Arboledas, L.A. Extreme Saharan dust event over the southern Iberian Peninsula in September 2007: Active and passive remote sensing from surface and satellite. Atmos. Chem. Phys. 2009, 9, 8453–8469. [Google Scholar] [CrossRef]
- Mona, L.; Amodeo, A.; Pandolfi, M.; Pappalardo, G. Saharan dust intrusions in the Mediterranean area: Three years of Raman lidar measurements. J. Geophys. Res. 2006, 111, D16203. [Google Scholar] [CrossRef]
- Schepanski, K.; Tegen, I.; Laurent, B.; Heinold, B.; Macke, A. A new Saharan dust source activation frequency map derived from MSG-SEVIRI IR-channels. Geophys. Res. Lett. 2007, 34, L18803. [Google Scholar] [CrossRef]
- Hamidi, M.; Kavianpour, M.R.; Shao, Y. Synoptic analysis of dust storms in the Middle East. Asia-Pac. J. Atmos. Sci. 2013, 49, 279–286. [Google Scholar] [CrossRef]
- Vajanapoom, N.; Shy, C.M.; Neas, L.M.; Loomis, D. Estimation of particulate matter from visibility in Bangkok, Thailand. J. Expo. Sci. Environ. Epidemiol. 2001, 11, 97–102. [Google Scholar] [CrossRef]
- Ganor, E.; Stupp, A.; Osetinsky, I.; Alpert, P. Synoptic classification of lower troposphere profiles for dust days. J. Geophys. Res. 2010, 115, D11201. [Google Scholar] [CrossRef]
- Prasad, A.K.; El-Askary, H.; Kafatos, M. Implications of high altitude desert dust transport from Western Sahara to Nile Delta during biomass burning season. Environ. Pollut. 2010, 158, 3385–3391. [Google Scholar] [CrossRef] [PubMed]

| No. | Region | Longitude | Latitude | Station Name | 23 March 2016 | 24 March 2016 | No. | Region | Longitude | Latitude | Station Name | 23 March 2016 | 24 March 2016 |
|---|---|---|---|---|---|---|---|---|---|---|---|---|---|
| 1 | Marmara (MR) | 26.59 | 41.66 | Edirne | 65 | 156 | 50 | Central Anatolia (CAR) | 34.7 | 38.62 | Nevsehir | 49 | 212 |
| 2 | 28.89 | 41.04 | Esenler | 72 | 321 | 51 | 34.01 | 38.37 | Aksaray | 45 | 85 | ||
| 3 | 28.95 | 41.01 | Aksaray | 54 | 85 | 52 | 34.68 | 37.97 | Nigde | 80 | 188 | ||
| 4 | 29.01 | 41.05 | Besiktas | 64 | 274 | 53 | 35.38 | 38.74 | Osb | 69 | 186 | ||
| 5 | 29.03 | 40.99 | Kadikoy | 72 | 275 | 54 | 35.47 | 38.72 | Hurriyet | 95 | 189 | ||
| 6 | 29.21 | 40.89 | Kartal | 57 | 259 | 55 | 35.52 | 38.72 | Melikgazi | 51 | 126 | ||
| 7 | 29.98 | 40.14 | Bilecik | 44 | 116 | 56 | 32.51 | 37.94 | Selcuklu | 52 | 91 | ||
| 8 | 26.41 | 40.14 | Canakkale | 46 | 99 | 57 | 32.48 | 37.86 | Meram | 33 | 88 | ||
| 9 | 27.89 | 39.63 | Balikesir | 68 | 155 | 58 | 33.13 | 37.12 | Karaman | 47 | 121 | ||
| 10 | Aegean (AR) | 29.99 | 39.42 | Kutahya | 64 | 86 | 59 | 37 | 39.74 | Sivas | 86 | 136 | |
| 11 | 30.54 | 38.75 | Afyon | 33 | 58 | 60 | 33.62 | 40.6 | Cankiri | 26 | 28 | ||
| 12 | 29.41 | 38.67 | Usak | 87 | 77 | 61 | Black Sea (BSR) | 31.15 | 40.85 | Duzce | 111 | 117 | |
| 13 | 27.4 | 38.62 | Manisa | 128 | 223 | 62 | 31.6 | 40.73 | Bolu | 30 | 29 | ||
| 14 | 29.09 | 37.78 | Merkezefendi | 92 | 136 | 63 | 32.36 | 41.62 | Bartin | 98 | 88 | ||
| 15 | 29.1 | 37.77 | Bayramyeri | 92 | 120 | 64 | 32.62 | 41.2 | Karabuk | 95 | 80 | ||
| 16 | 27.84 | 37.84 | Aydin | 51 | 141 | 65 | 33.76 | 41.37 | Kastamonu | 94 | 147 | ||
| 17 | 28.13 | 37.34 | Yatagan | 142 | 115 | 66 | 35.15 | 42.03 | Sinop | 50 | 211 | ||
| 18 | 28.36 | 37.22 | Musluhittin | 85 | 114 | 67 | 36.34 | 41.28 | Ilkadim | 81 | 214 | ||
| 19 | 27.07 | 38.5 | Cigli | 30 | 85 | 68 | 36.46 | 41.22 | Tekkekoy | 55 | 158 | ||
| 20 | 27.11 | 38.45 | Karsiyaka | 16 | 34 | 69 | 34.96 | 40.56 | Corum | 76 | 86 | ||
| 21 | 27.17 | 38.46 | Bayrakli | 42 | 95 | 70 | 37.88 | 40.98 | Ordu | 50 | 86 | ||
| 22 | 27.08 | 38.4 | Guzelyali | 41 | 106 | 71 | 38.36 | 40.91 | Giresun | 66 | 100 | ||
| 23 | 27.22 | 38.47 | Bornova | 55 | 111 | 72 | 39.48 | 40.46 | Gumushane | 87 | 89 | ||
| 24 | 27.14 | 38.43 | Alsancak | 25 | 63 | 73 | 40.22 | 40.26 | Bayburt | 83 | 99 | ||
| 25 | 27.15 | 38.38 | Sirinyer | 44 | 83 | 74 | 40.53 | 41.02 | Rize | 40 | 71 | ||
| 26 | 27.14 | 38.31 | Gaziemir | 52 | 64 | 75 | 41.82 | 41.18 | Artvin | 9 | 13 | ||
| 27 | Mediterranean (MeR) | 30.29 | 37.72 | Burdur | 28 | 54 | 76 | Eastern Anatolia (EAR) | 38.34 | 38.35 | Malatya | 39 | 81 |
| 28 | 30.7 | 36.89 | Antalya | 37 | 103 | 77 | 39.21 | 38.67 | Elazig | 33 | 37 | ||
| 29 | 34.64 | 36.81 | Icel | 60 | 66 | 78 | 39.55 | 39.1 | Tunceli | 20 | 25 | ||
| 30 | 35.26 | 37.19 | Catalan | 26 | 33 | 79 | 39.5 | 39.74 | Erzincan | 109 | 145 | ||
| 31 | 35.34 | 37 | Meteoroloji | 48 | 49 | 80 | 40.5 | 38.88 | Bingol | 16 | 27 | ||
| 32 | 35.31 | 37 | Valilik | 51 | 59 | 81 | 41.51 | 38.75 | Mus | 161 | 203 | ||
| 33 | 35.35 | 36.85 | Dogankent | 12 | 15 | 82 | 41.27 | 39.9 | Erzurum | 26 | 39 | ||
| 34 | 36.24 | 37.07 | Osmaniye | 52 | 65 | 83 | 42.11 | 38.41 | Bitlis | 34 | 42 | ||
| 35 | 36.15 | 36.21 | Antakya | 68 | 72 | 84 | 43.74 | 37.57 | Hakkari | 64 | 84 | ||
| 36 | 36.9 | 37.58 | Kahramanmaras | 35 | 61 | 85 | 43.37 | 38.51 | Van | 37 | 43 | ||
| 37 | 37.2 | 38.2 | Elbistan | 53 | 59 | 86 | 43.04 | 39.72 | Agri | 26 | 36 | ||
| 38 | 30.55 | 37.78 | Isparta | 61 | 65 | 87 | 44.05 | 39.93 | Igdir | 81 | 100 | ||
| 39 | Central Anatolia (CAR) | 30.5 | 39.78 | Eskisehir | 24 | 47 | 88 | 43.1 | 40.61 | Kars | 60 | 60 | |
| 40 | 32.59 | 39.97 | Sincan | 44 | 59 | 89 | 42.7 | 41.11 | Ardahan | 22 | 20 | ||
| 41 | 32.8 | 39.97 | Demetevler | 57 | 77 | 90 | Southeastern Anatolia (SEAR) | 37.13 | 36.72 | Kilis | 49 | 56 | |
| 42 | 32.86 | 39.97 | Kecioren | 61 | 71 | 91 | 37.35 | 37.06 | Gaziantep | 43 | 72 | ||
| 43 | 32.88 | 39.94 | Cebeci | 70 | 70 | 92 | 38.28 | 37.76 | Adiyaman | 59 | 102 | ||
| 44 | 32.86 | 39.93 | Sihhiye | 64 | 77 | 93 | 38.79 | 37.16 | Sanliurfa | 25 | 75 | ||
| 45 | 32.84 | 39.9 | Dikmen | 42 | 79 | 94 | 40.22 | 37.92 | Diyarbakir | 44 | 46 | ||
| 46 | 32.93 | 39.93 | Kayas | 109 | 134 | 95 | 40.72 | 37.32 | Mardin | 34 | 62 | ||
| 47 | 33.52 | 39.84 | Kirikkale | 21 | 44 | 96 | 41.13 | 37.9 | Batman | 57 | 65 | ||
| 48 | 34.81 | 39.82 | Yozgat | 42 | 76 | 97 | 41.94 | 37.93 | Siirt | 89 | 75 | ||
| 49 | 34.16 | 39.15 | Kirsehir | 30 | 98 |
© 2017 by the author. Licensee MDPI, Basel, Switzerland. This article is an open access article distributed under the terms and conditions of the Creative Commons Attribution (CC BY) license ( http://creativecommons.org/licenses/by/4.0/).
Share and Cite
Baltaci, H. Spatial and Temporal Variation of the Extreme Saharan Dust Event over Turkey in March 2016. Atmosphere 2017, 8, 41. https://doi.org/10.3390/atmos8020041
Baltaci H. Spatial and Temporal Variation of the Extreme Saharan Dust Event over Turkey in March 2016. Atmosphere. 2017; 8(2):41. https://doi.org/10.3390/atmos8020041
Chicago/Turabian StyleBaltaci, Hakki. 2017. "Spatial and Temporal Variation of the Extreme Saharan Dust Event over Turkey in March 2016" Atmosphere 8, no. 2: 41. https://doi.org/10.3390/atmos8020041