Article

An Integrated Convective Cloud Detection Method Using FY-2 VISSR Data

Institute of Meteorology and Oceanography, PLA University of Science and Technology, Nanjing 211101, China
*
Author to whom correspondence should be addressed.
Atmosphere 2017, 8(2), 42; https://doi.org/10.3390/atmos8020042
Submission received: 26 November 2016 / Revised: 11 February 2017 / Accepted: 15 February 2017 / Published: 20 February 2017

Abstract

:
The characteristics of convective clouds on infrared brightness temperature (BTIR) and brightness temperature difference (BTD) image were analyzed using successive Infrared and Visible Spin-Scan Radiometer (VISSR) data of FY-2, and an integrated detection method of convective clouds using infrared multi-thresholds in combination with tracking techniques was implemented. In this method, BT and BTD thresholds are used to detect severe convection and uncertain clouds, then the tracking technique including overlap ratio, minimum BT change and cross-correlation coefficient is used to detect convection activities in uncertain clouds. The Application test results show that our integrated detection method can effectively detect convective clouds in different life periods, which show a better performance than any single step in it. The statistical results show that the α-type clouds are mostly large-scale systems, and the β- and γ-type clouds have the highest proportion of general type. However, the proportion of weak convective cloud is higher than that of severe ones in γ-type cloud, and an opposite result is found in the β-type.

1. Introduction

Convective clouds are produced by atmosphere during uplift movement under thermal or dynamic effect, causing strong winds, hail, lightning, heavy rainfall and other severe weather. Improving the accuracy of convective cloud detection and early warning is an important component of modern weather forecast business construction [1].
Since the 1960s, meteorological satellites have rapidly become a powerful tool for studying convective cloud [2,3]. The use of satellite data not only broadens convective cloud detection methods, but also monitors areas where conventional data cannot be obtained [4]. The geostationary satellite, which is able to monitor the same area in successive time, has become one of the main ways to detect convective cloud [5,6].
There are mainly three convective cloud detection methods based on the geostationary satellite data. The first one is the single-threshold method, which directly detects clouds by employing the infrared brightness temperature (BTIR) and infrared brightness temperature difference (BTDIR) threshold values [7]. It is the main method for detecting convection activities in the current operational business [8]. For example, in the established auto nowcasting system of NCAR (National Center for Atmospheric Research), BT thresholds of multiple channels are used for detecting and nowcasting of convective cloud [9]. However, it is easy to misinterpret some cirrus clouds as convective cloud, since their cloud top heights are sometimes similar to each other [10,11]. The second method is the artificial intelligence algorithm [12], which achieves the purpose of automatic detection through a large number of samples for training model parameters, such as fuzzy logic theory and neural network [13]. The third method is to track the clouds to confirm if they have the convection characteristics [14,15,16,17,18]. For example, Arnaud et al. [19] realized automatic tracking of low-temperature cloud top by applying the overlap area method; Carvalho et al. [20] used the maximum spatial correlation to track and match the mesoscale convection systems.
In the past, the way to detect convective cloud was mainly based on some single methods. However, the research of Huang et al. [21] showed that the combined use of the BT threshold method and the image processing method can effectively detect convective cloud in a wide area. In this paper, we integrated the threshold method with the tracking techniques, and designed a step-by-step detection process for the convection systems of different life periods. Section 2 analyzes the characteristics of BTIR1, BTDIR1-IR2, BTDIR1-IR3 and BTDIR1-IR4 of FY-2F images, and tries to determine some reasonable thresholds by making a comparison of different thresholds for detecting convective cloud. In addition to the infrared threshold method, parameters such as the overlap ratio, minimum BT change, and the cross-correlation coefficient [22,23] at two successive times are also introduced to our method as the tracking process. Section 3 shows the application test results of every detection step by counting the number of cloud clusters and other statistics.
The Infrared and Visible Spin-Scan Radiometer (VISSR) on FY-2 provides data of four infrared channels (IR1: 10.3–11.3 μm, IR2: 11.5–12.5 μm, IR3: 6.3–7.6 μm, and IR4: 3.5–4.0 μm) and a visible channel (0.55–0.9 μm). In this paper, we adopted geographic Lat/Lon projection of 5 km × 5 km infrared channels data made from the full disc nominal image file in level-1 data and the research scope was determined to be 70° E–140° E, 0° N–50° N.

2. Threshold Determination and Detection Process

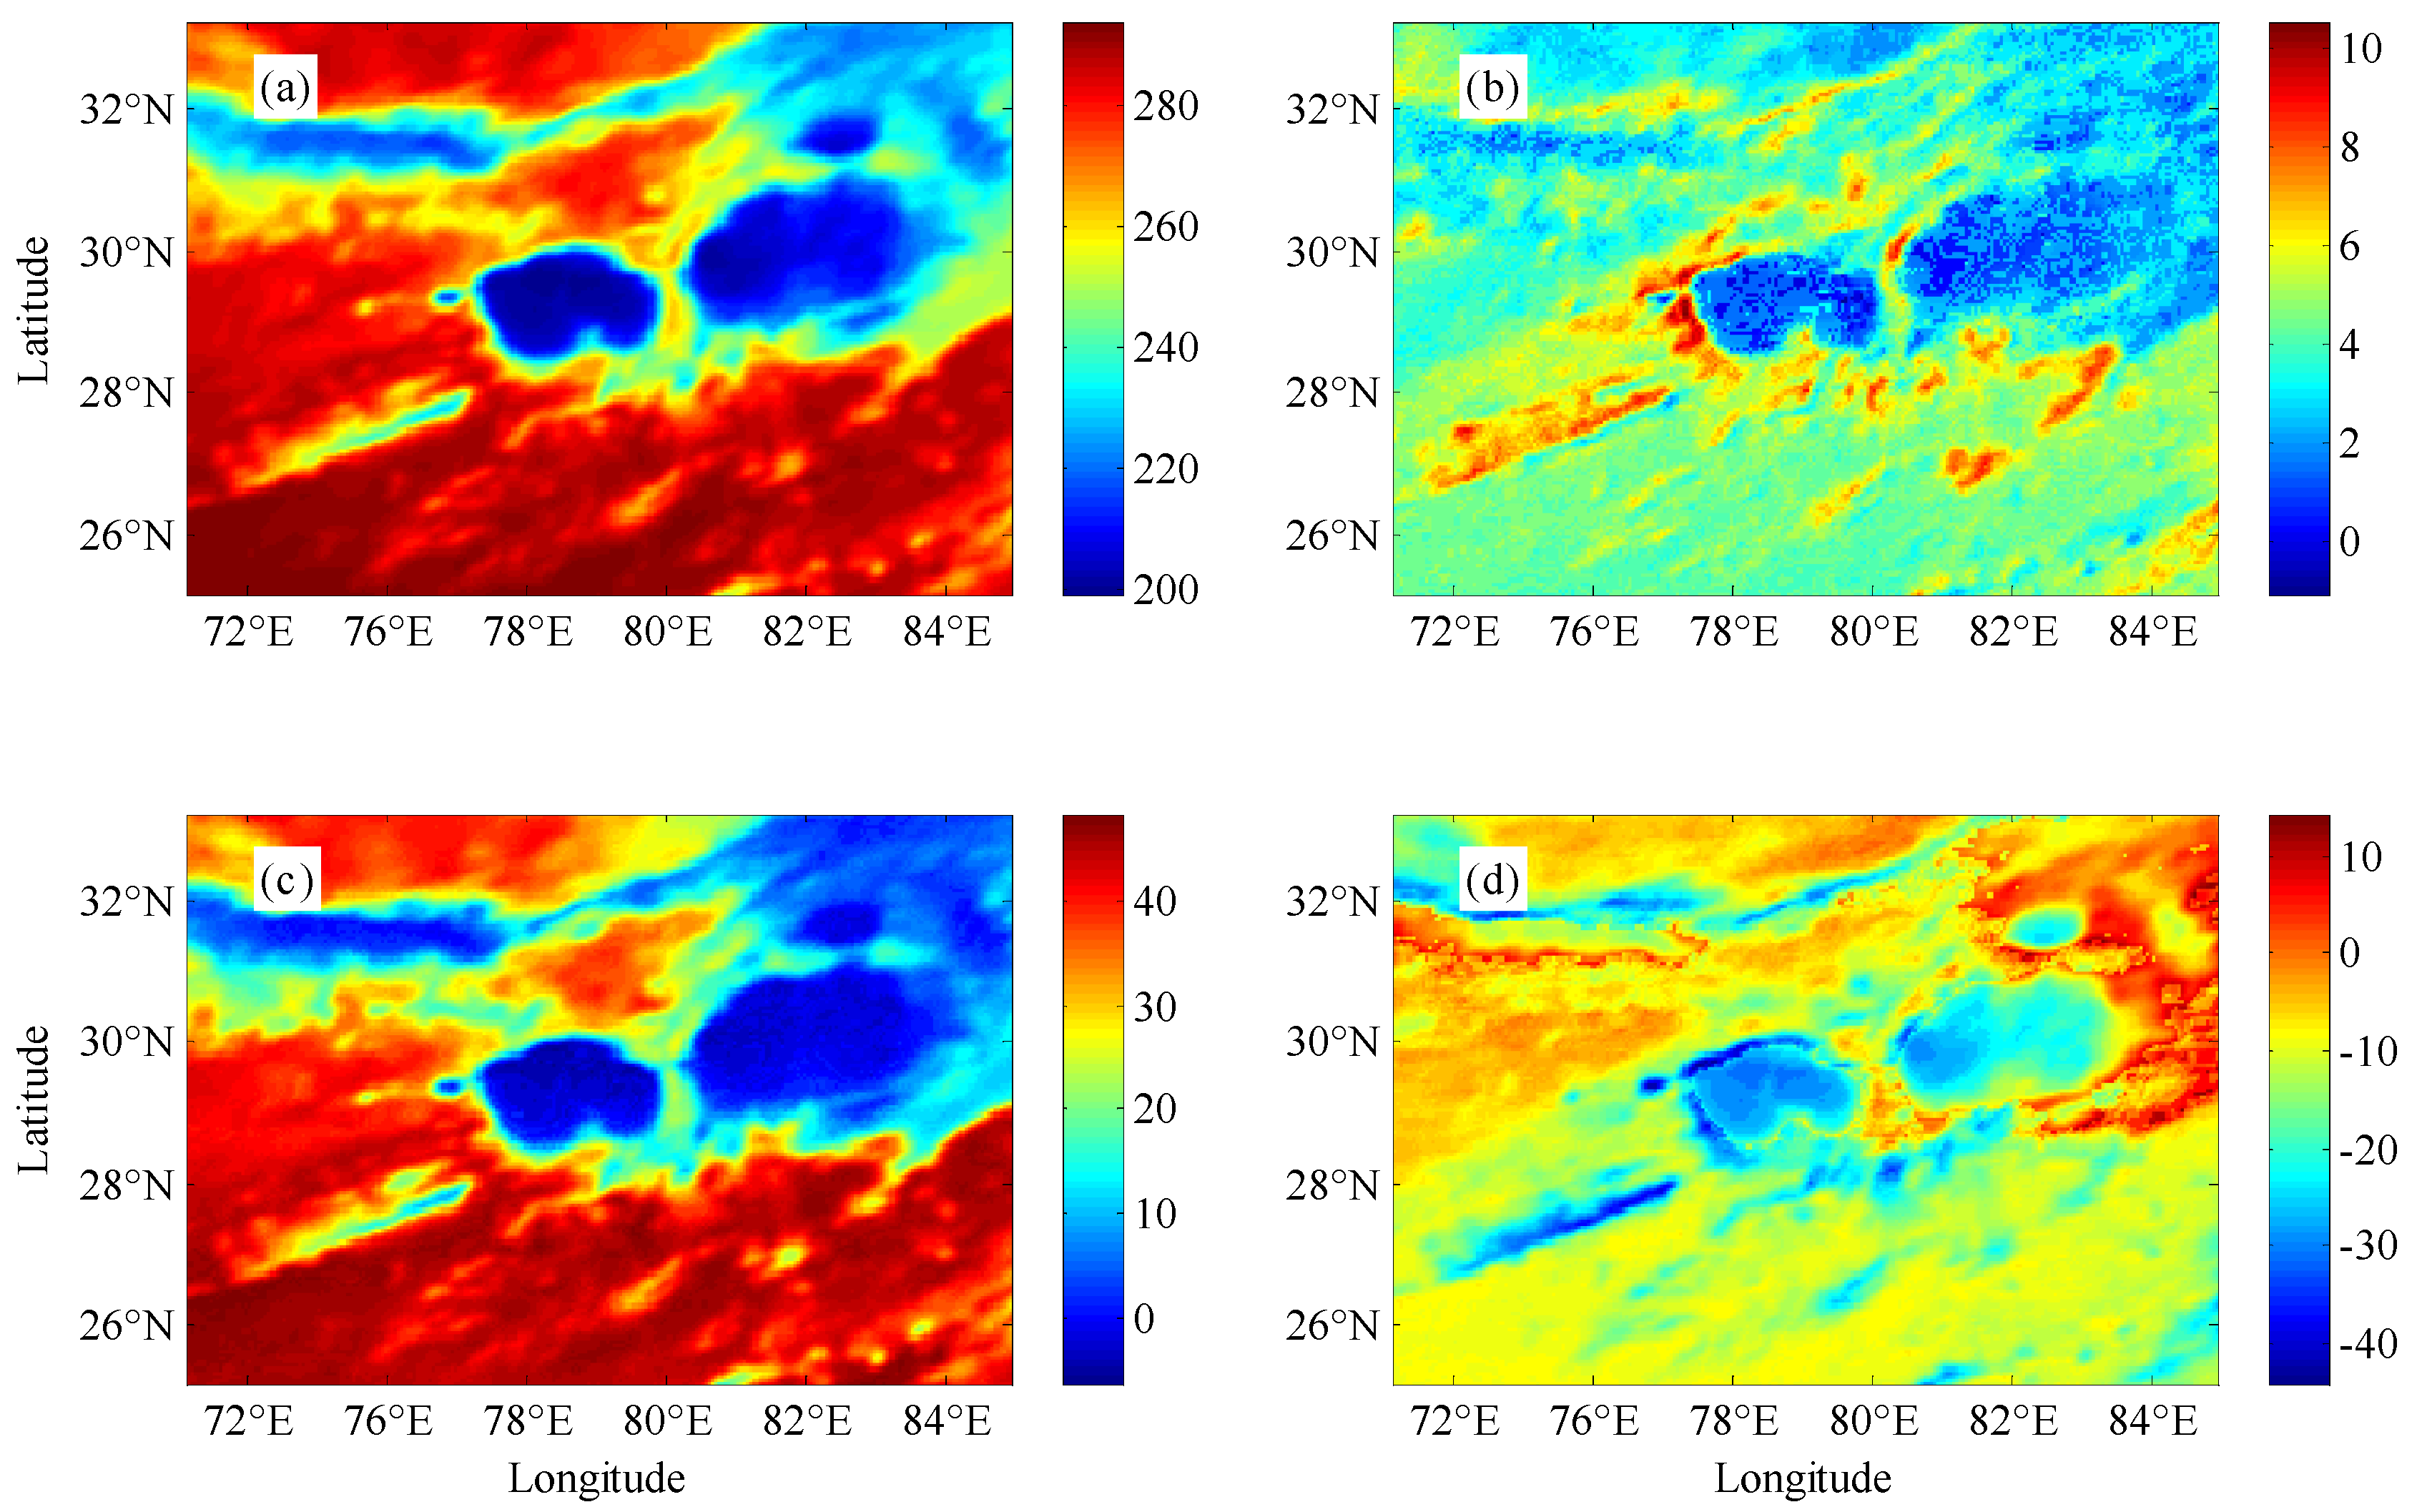
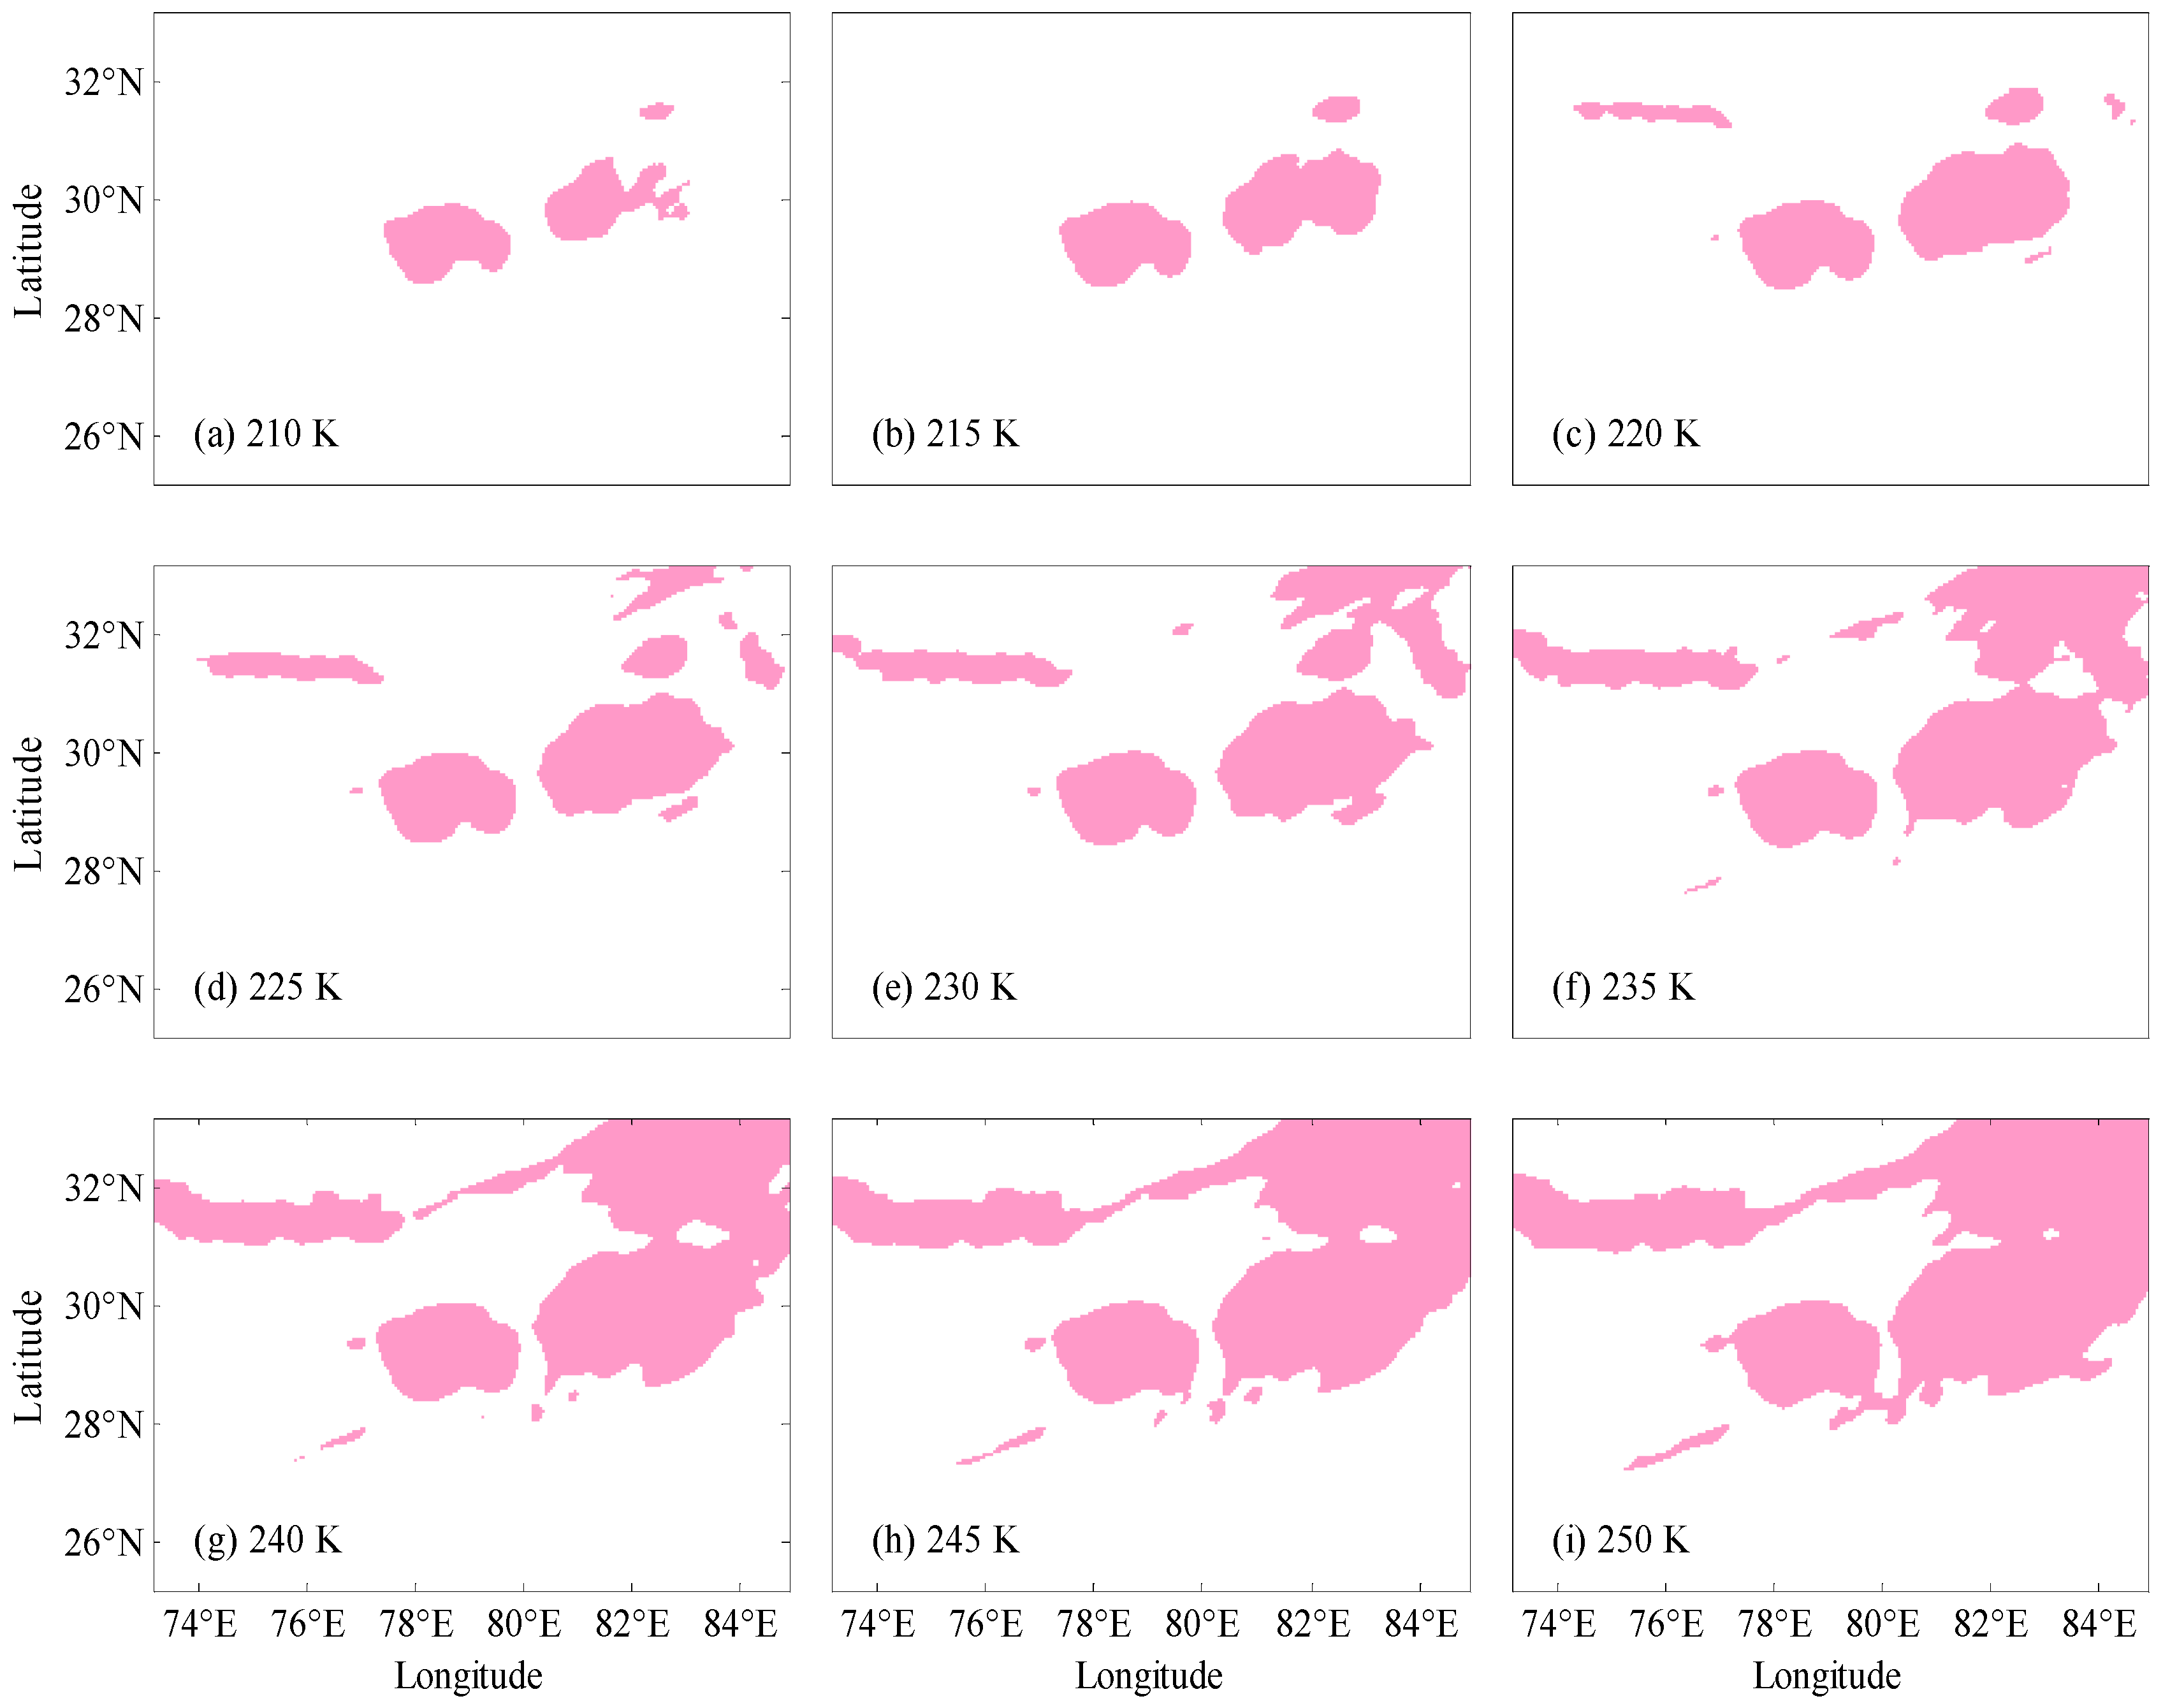
2.1. Threshold Determination

In order to evaluate the performance of BTIR and BTD images for convection detection, we made a comparison case of BTIR1, BTDIR1–IR2, BTDIR1–IR3, and BTDIR1–IR4 images on 16 June 2015, shown in Figure 1, and tried to determine a feasible threshold range. In Figure 1a, the deep blue area indicates the convection area. Also, it could be found that the convection area has a clear boundary with a center, where BT is less than 200 K, which indicates high and strong convection activity. On the BTDIR1–IR2 image, the convective cloud has an irregular texture, and it is easily confused with some cirrus clouds. The convection area of the BTDIR1–IR3 image on Figure 1c is below about 10 K. The margin outline is the same prominence as the BTIR1 image; and on the BTDIR1–IR4 image, the convection area is generally below −20 K. However, its low value zone does not correspond exactly to the position of the convection center, for extremely low value occurs in the non-convection section and the convective boundary. According to the comparison of every image in Figure 1, we found that the convection activities on the BTIR1 image have more distinct characteristics than other images in the large-scale convective systems. So it could play a major role in our detection method. As regards the other images, they have the ability to detect some convection area and eliminate some non-convection area.
Based on the comparison results, we eventually regarded the BTIR1 image as the major method for “Detection”, and the BTD images as the supplement for ”Elimination”, which means that the BTIR1 image is used to detect the main convection area, and other BTDs are used to eliminate some other clouds, respectively. The next problem is to determinate feasible thresholds for each image. Here, we analyzed the detection result with a series of continuous thresholds. Figure 2 shows the detection result when the BTIR1 threshold changes from 210 K to 250 K. The result shows that the central area of convective cloud is widely detected out when the threshold is under 220 K. When the threshold exceeds 220 K, the detection area spreads from the convection center to the surrounding convection area; and when the threshold changes from 240 K to 250 K, the only enlarged area is mostly cirrus clouds and some possible convective cloud. In order to detect the convective cloud system and not involve much cirrus clouds at the same time, we considered using 240 K to detect the possible convective cloud.
The same method for determining the detection threshold is also used for the BTD images in Figure 3, where three BTD’s detection results vary from four thresholds. As can be seen in Figure 3, it is difficult to distinguish convection from cirrus clouds at any threshold in the BTDIR1–IR2 image. So the BTDIR1–IR2 can be used to eliminate the low and middle cloud at a threshold of about 4 K. The BTDIR1–IR3 image has a similar effect to the BTIR1, and it can eliminate most non-convective areas when the threshold value is set at about 10 K. For the BTDIR1–IR4 image, a better threshold of −16 K was selected because when the threshold varies from −16 to −11 K, the main convection area remains mostly unchanged and the only enlarged area is some cirrus clouds.
After determining the four thresholds, we did a step-by-step threshold test to ensure the performance of the BT threshold method seen in Figure 4. First, the BTIR1 is used to detect the main convective cluster, and then the three BTD thresholds are used to eliminate the non-convection area. Figure 4a shows that the integrated BT threshold method is able to detect out the most convective cloud. The detection results are not affected by the un-convection area. Compared with other single thresholds above, we found that the integrated BT threshold method has a better performance in cirrus cloud elimination. However, there are still some dotted “noise” clouds found in Figure 4a. At this moment, four pixels are used as a threshold to remove small area clouds and the result of Figure 4b is obtained. By comparing the two results before and after the removal of broken clouds, it was discovered that broken clouds are effectively eliminated after the removal process.
The geostationary satellite provides users with data of successive time which inspires researchers to find the way to match and track the clouds. If a convective cloud cluster is growing, its minimum BTIR (BTmin) becomes lower fast and the ratio of the overlap area between the two successive images becomes high. In this paper, we employed 8 K/h as the BTmin decreasing rate threshold and set 50% as the overlap ratio threshold to confirm whether the detection area has convection characteristics after BT threshold detection process. Furthermore, there are sometimes several cloud clusters meeting the two criterions. To determine whether there is a possible cloud cluster which is growing, we calculated their cross-correlation coefficient. If there is a coefficient value beyond 0.35, we thought the corresponding cloud cluster belonged to convective cloud, or we would skip to next current cloud cluster to restart our detection process.

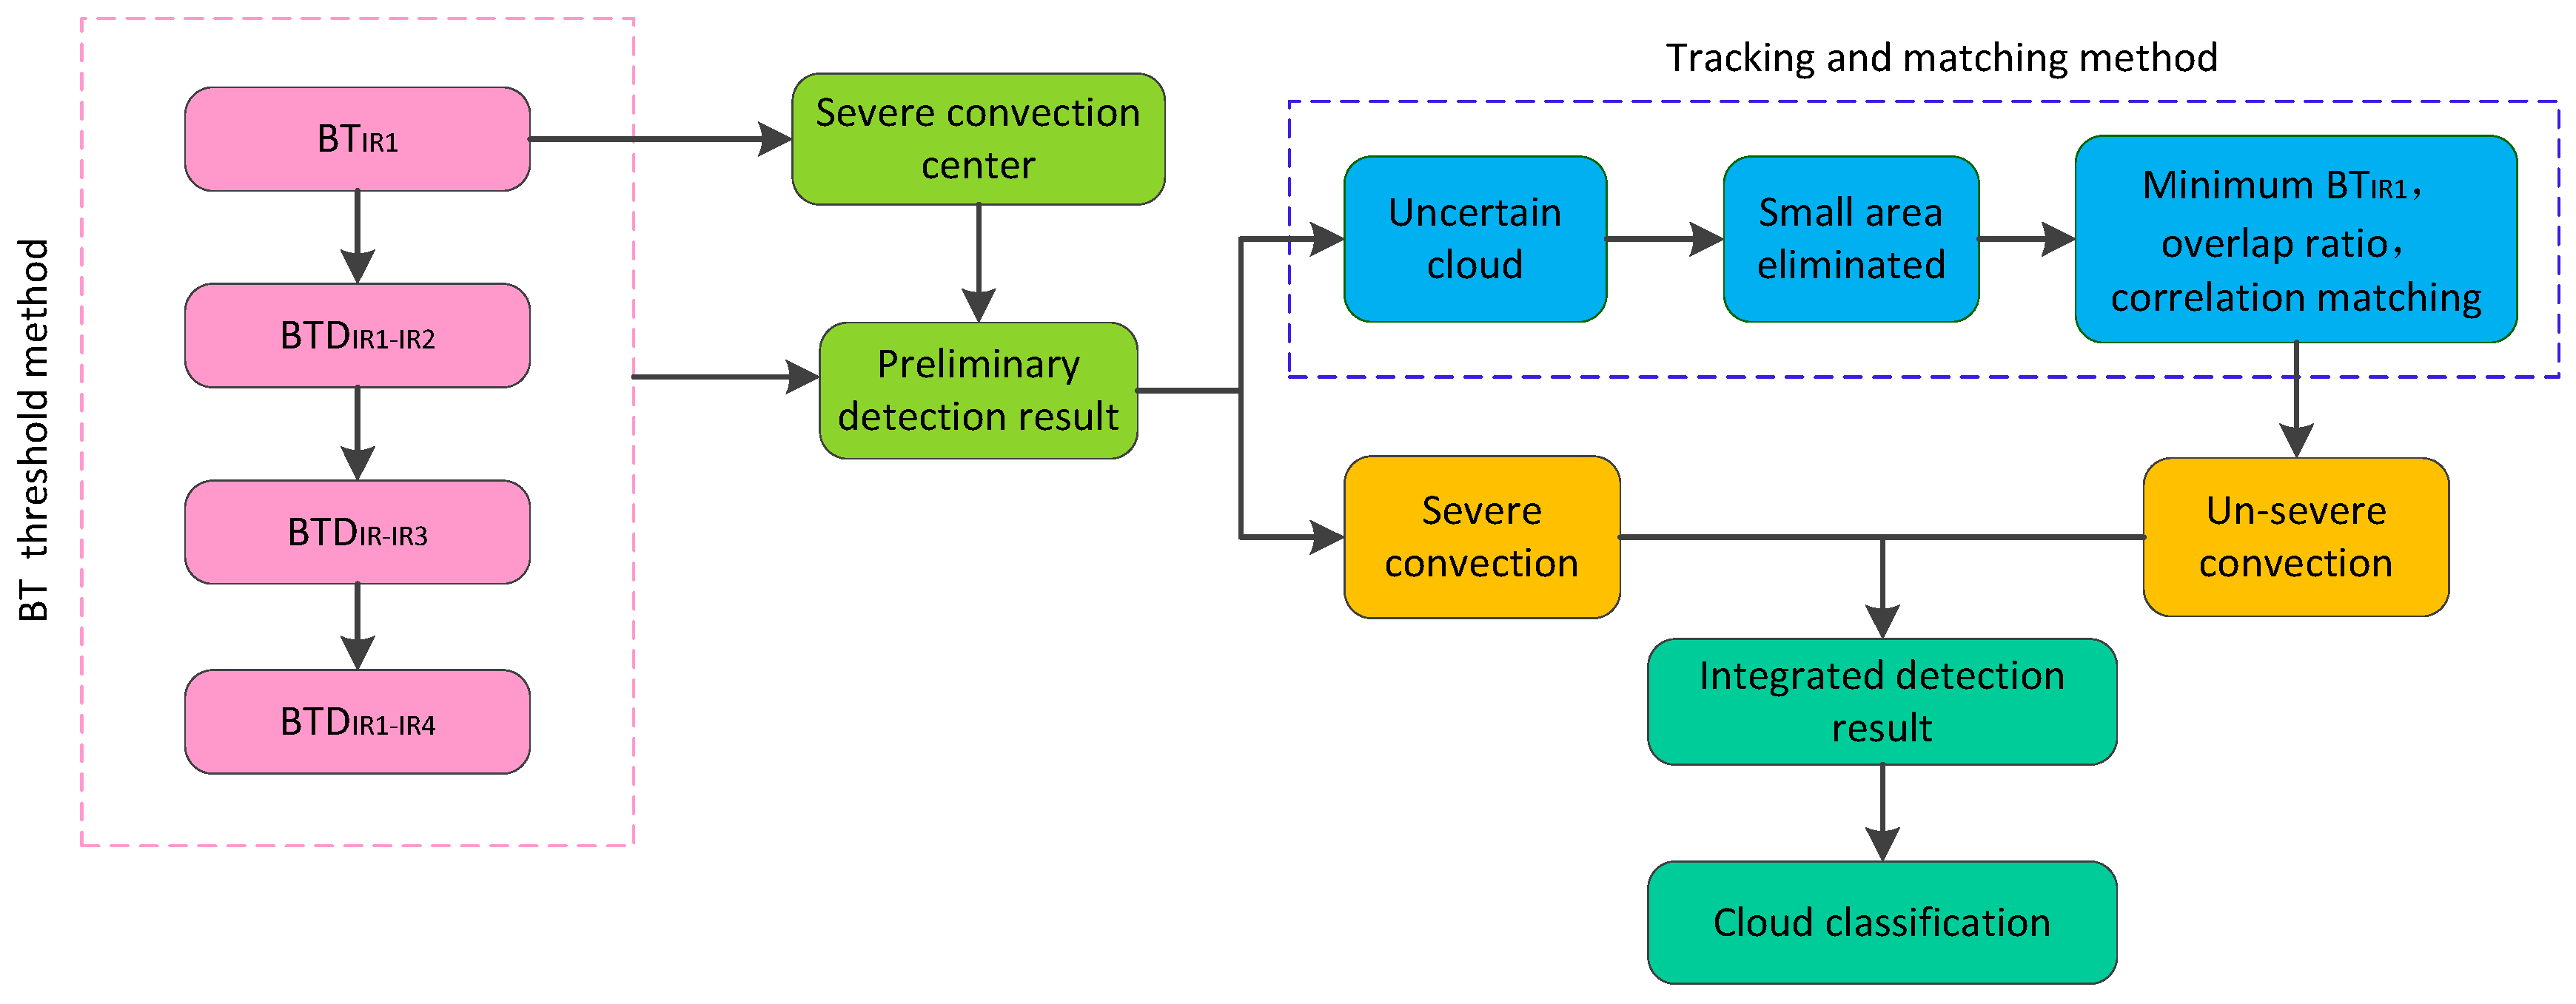
2.2. Detection Process

On the basis of the BT threshold method and the tracking method, a step-by-step detection process for convective cloud is designed as Figure 5:
  • Step 1: detect severe convection center by employing 220 K as the BTIR1 threshold.
  • Step 2: detect preliminary convective cloud by employing 240 K as the BTIR1 threshold.
  • Step 3: eliminate non-convection area by employing 4 K, 10 K and −16 K as the threshold of BTDIR1–IR2, BTDIR1–IR3 and BTDIR1–IR4, respectively.
  • Step 4: matching the convection center with the preliminary convective cloud. The cloud cluster will be retained if it contains a convection center, or it will be labeled as uncertain cloud.
  • Step 5: eliminate the small area of broken cloud by employing four pixels as the threshold.
  • Step 6: use the same steps above to detect convective cloud an hour before.
  • Step 7: tracking and matching the uncertain cloud clusters at the previous time t−1 and the current time t0. Firstly, a grid spacing of m × n and the central position P(i, j) is used to express the space range of the uncertain cloud clusters, where m is the longitude direction length and n is the latitude direction length. We then search the current time cloud cluster in the space range of M × N with the central point P(i, j) at t−1, where M = 4 × m and N = 4 × n . In the searching area at t−1, we save the cloud clusters whose BTmin increases beyond 8 K and the overlap ratio beyond 50%. Finally, we calculate the cross-correlation coefficient between the satisfying cloud clusters at t−1 and the current uncertain cloud cluster at t0. The cross-correlation coefficient r is defined as:
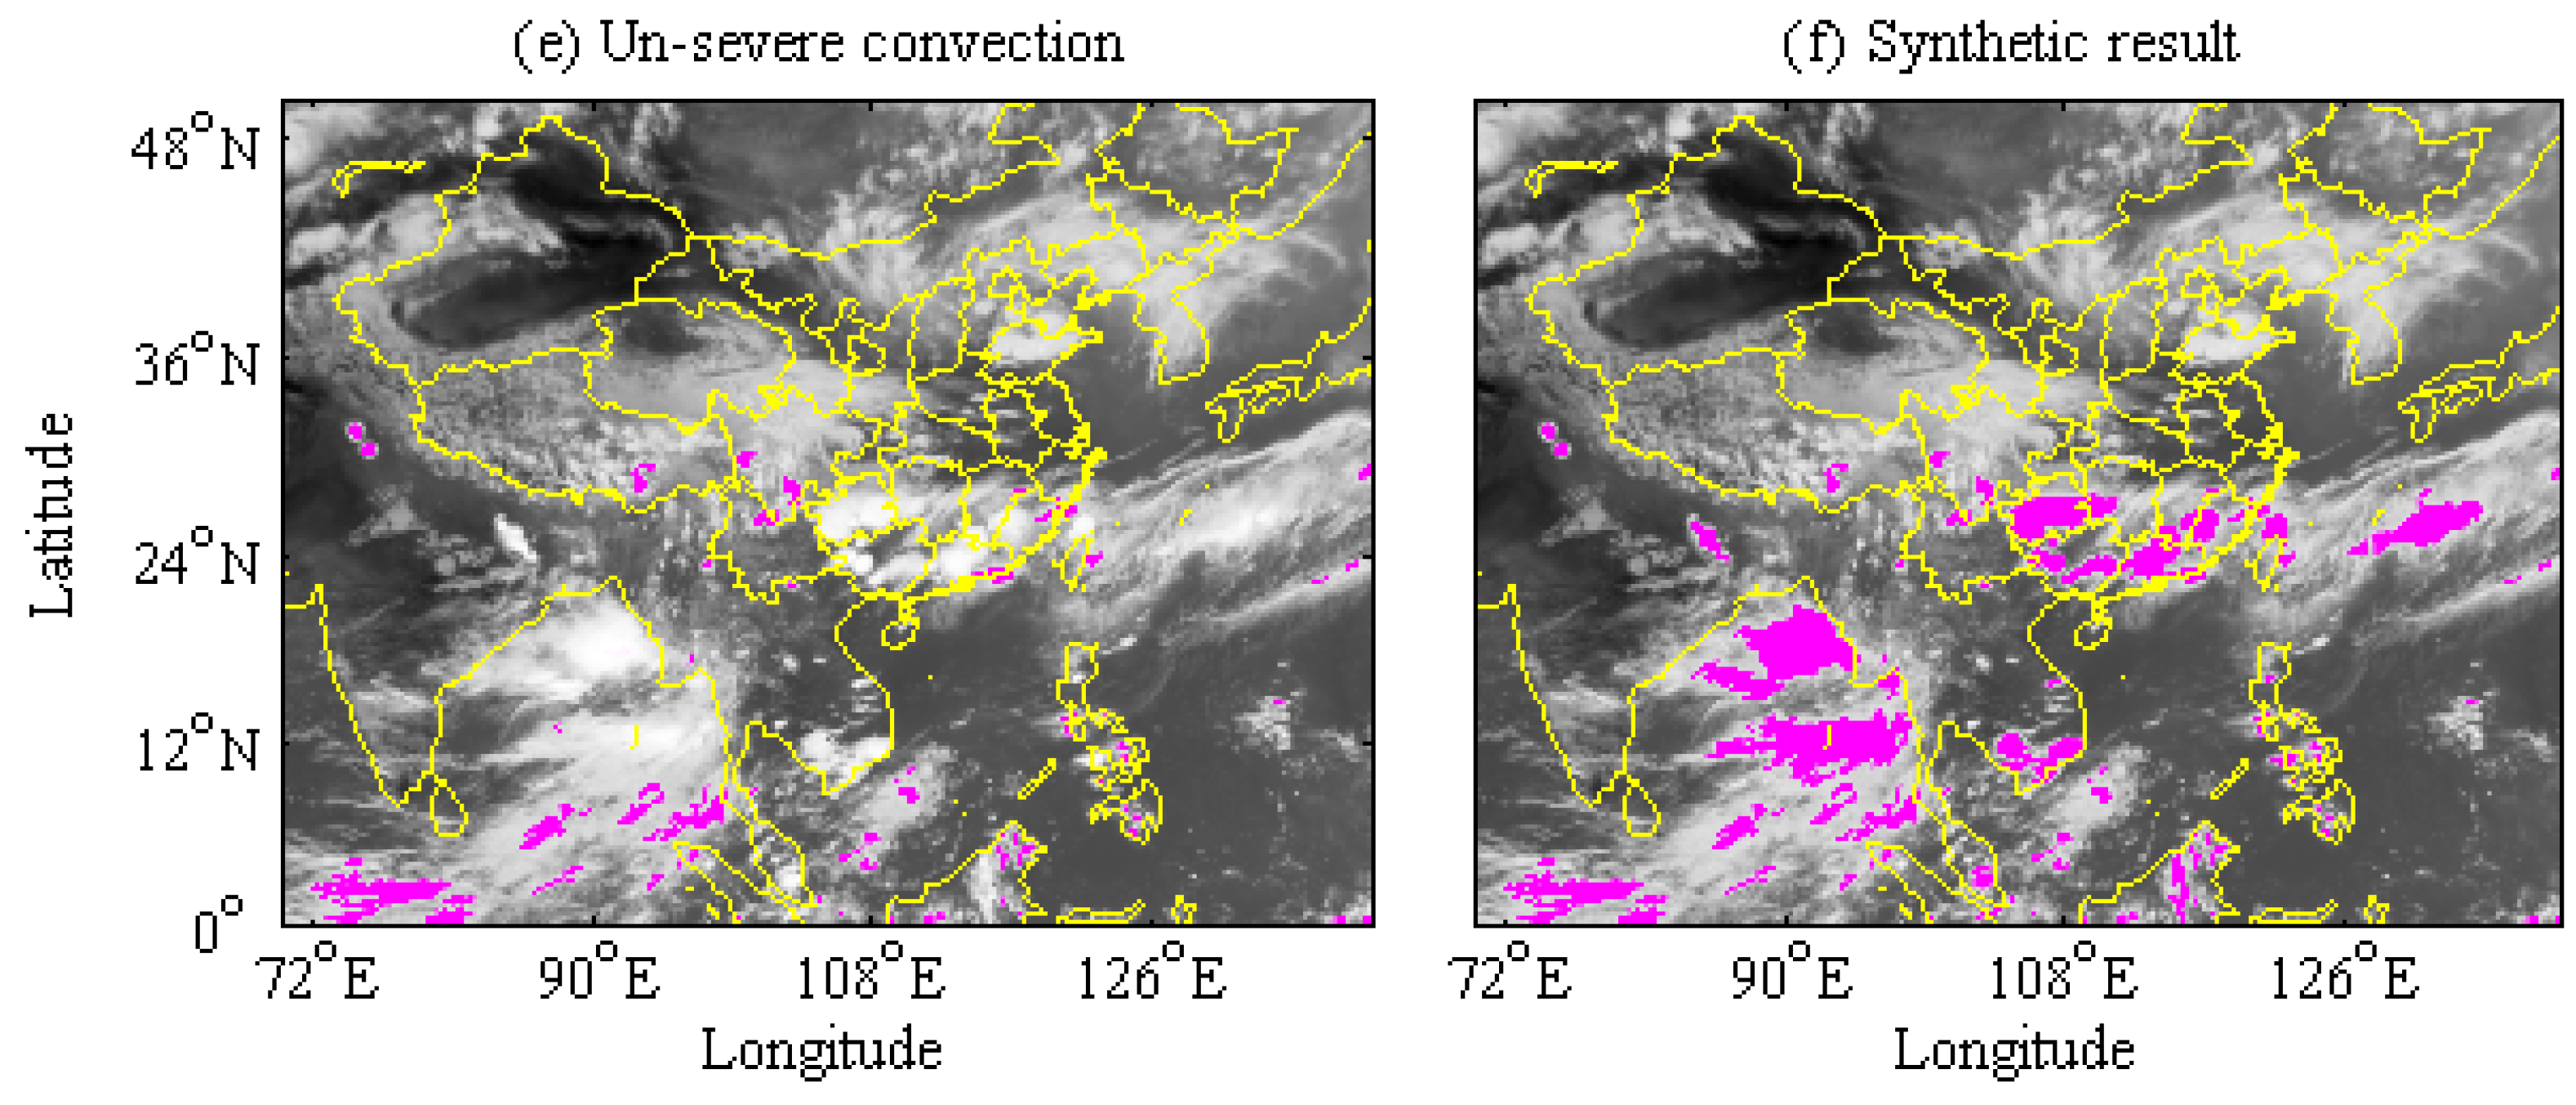
r = i = 1 m j = 1 n ( T 0 ( i , j ) - T 0 ¯ ) ( T - 1 ( i , j ) - T - 1 ¯ ) i = 1 m j = 1 n ( T 0 ( i , j ) - T 0 ¯ ) 2 i = 1 m j = 1 n ( T 1 ( i , j ) - T - 1 ¯ ) 2 ,
where T1 and T0 are the BT matrices of two cloud clusters to be matched at t−1 and t0, respectively. If the highest cross-correlation coefficient we have calculated is beyond 0.35, we save the current cloud cluster as convective cloud, or we will eliminate it.
When the detection process is accomplished, the convective cloud is divided into weak convection (BTmin > 230 K), general convection (210 K < BTmin ≤ 230 K), and severe convection (BTmin ≤ 210 K) by BTmin, and is divided into α(200 km ≤ L < 2000 km), β(20 km ≤ L < 200 km), and γ(0 ≤ L < 20 km) type by L, where L is defined as:
L = m 2 + n 2 ,
We can then obtain nine categories that represent the characteristics of different kinds of cloud clusters as shown in Table 1.

3. Application

In June 2016, southern China suffered from heavy rainfall affected by El Nino, causing some casualties and serious economic losses. Figure 6 shows the FY-2F BTIR1 image at every half hour from 8:30 to 12:30 on 14 June, where two main convection systems are observed in the image. One is the long Meiyu Front cloud belt in the Yangtze River Basin extending from 108° E to 140° E, another is the larger-scale convection system in the Bay of Bengal, which is affected by the South Asian summer monsoon region. At the same time, some isolated convection systems in small scale are also found in the west plateau, Pacific Ocean and other regions. For these large-scale cloud systems, their BTmin always never change much in short time. Different from the large-scale convection systems, most of the isolated convective cloud only last for several hours. Their BTmin changes fast within an hour, and will remain almost unchanged or increased when convective activities begin to disappear. To evaluate the application performance of the integrated detection method, we use the 10:30 image as the case to execute the step-by-step procedures, and track the detected clouds after each step.
Figure 7a shows that the severe convection centers, which distributed almost in the Meiyu Front Rain Belt and the Bay of Bengal, and some severe convection centers are also located in the southern part of the plateau and the Philippines. Figure 7b shows the preliminary convective cloud detected with the BTIR1 and BTD process. Although mainly convective clouds are included in the result, many cirrus clouds are also included; for example, some ”noise” areas where no convection activities emerge in the summer monsoon cloud system of the Bay of Bengal. Figure 7c shows the severe convection after matching the cloud in Figure 7a,b,d, showing the uncertain cloud, which is widely distributed in the image. The uncertain cloud contains not only the convective cloud but some cirrus clouds such as the small-scale convection in the northwestern Pacific Ocean. The result of the tracking process is displayed in Figure 7e based on the former steps, where some dotted cloud “noises” have been eliminated. Figure 7f is the integrated detection result combining Figure 7c,e, where some isolated cloud clusters are also well detected. On the whole, the integrated detection process has a better performance than any single-threshold method, especially for the isolated convective cloud.
In order to evaluate the detection result after each detection step, we counted the number, mean scale and mean BT of the clouds on Figure 7. Table 2 shows that there are 19 severe convective cloud clusters with an average scale of 69.7 km, and 61 un-severe convective cloud clusters with an average scale of 27.4 km. The contrast of their average scale suggests that more small-scale cloud clusters might be detected out by using the integrated detection method in this paper. Due to the fact that several severe convection centers may belong to the same convective cloud, the number of cloud clusters is reduced from 38 to 19 after matching the severe convection centers and preliminary detection results. In the 154 uncertain cloud clusters, there are only 61 un-convective cloud clusters. This means that the tracking process using successive time data has eliminated 96 cloud clusters, indicating that our tracking process is valid to distinguish the cirrus clouds from convective cloud. The severe convection is about 9.8 K lower than un-severe convection in terms of the mean BT, which could be inferred that there is more deep convection in the large-scale cloud system. Compared with Figure 6, we see that in the integrated detection process, the BT threshold method mainly detected the severe convection in large scale, and the tracking process tended to detect more convection which is growing.
According to the scale and the BTmin of the convective cloud, the detection result is classified and statistically analyzed, as shown in Figure 8. In the classification result, the convection activities are mainly distributed in the mid–low latitude. There is more severe convection in the large cloud belt, while the general and weak convection do not have a distinct tendency in the distribution, for we could see them in any area. In the statistical result, it could be discovered that the total number of β-type cloud clusters is the highest, followed by γ-type cloud clusters. In addition, there are only two α-SC clouds which exist in the summer monsoon cloud system of the Bay of Bengal. Among β-type cloud clusters, general convective cloud clusters have the highest number and the weak convective cloud has the lowest number. In the γ-type cloud, a majority of general convective cloud is also found, but the number of severe convection is lower than that of weak convection, probably due to the fact that the γ-type cloud tends to last for a short time and has difficulty attaining a very high cloud top height.

4. Conclusions

An integrated convective cloud detection method based on FY-2 VIRRS infrared data of successive time was put forward in this paper. We employed some reasonable thresholds according to the threshold test and designed a step-by-step detection process. In this method, both the BT threshold detection process and the tracking process are used to detect different kinds of convective cloud, and the application test shows that:
(1)
The integrated method is effective for convection in different scales and life periods, especially the isolated convective cloud. However, in the large-scale cloud system, it is easy to misinterpret some cirrus clouds as convective cloud as well.
(2)
The BT threshold method was capable of detecting convective cloud with a low BTmin more efficiently, and the tracking methods are more capable of detecting convection which is growing. Also, the combined use of overlap ratio, minimum brightness temperature change and cross-correlation coefficient shows a remarkable effect on the elimination process for non-convection area.
(3)
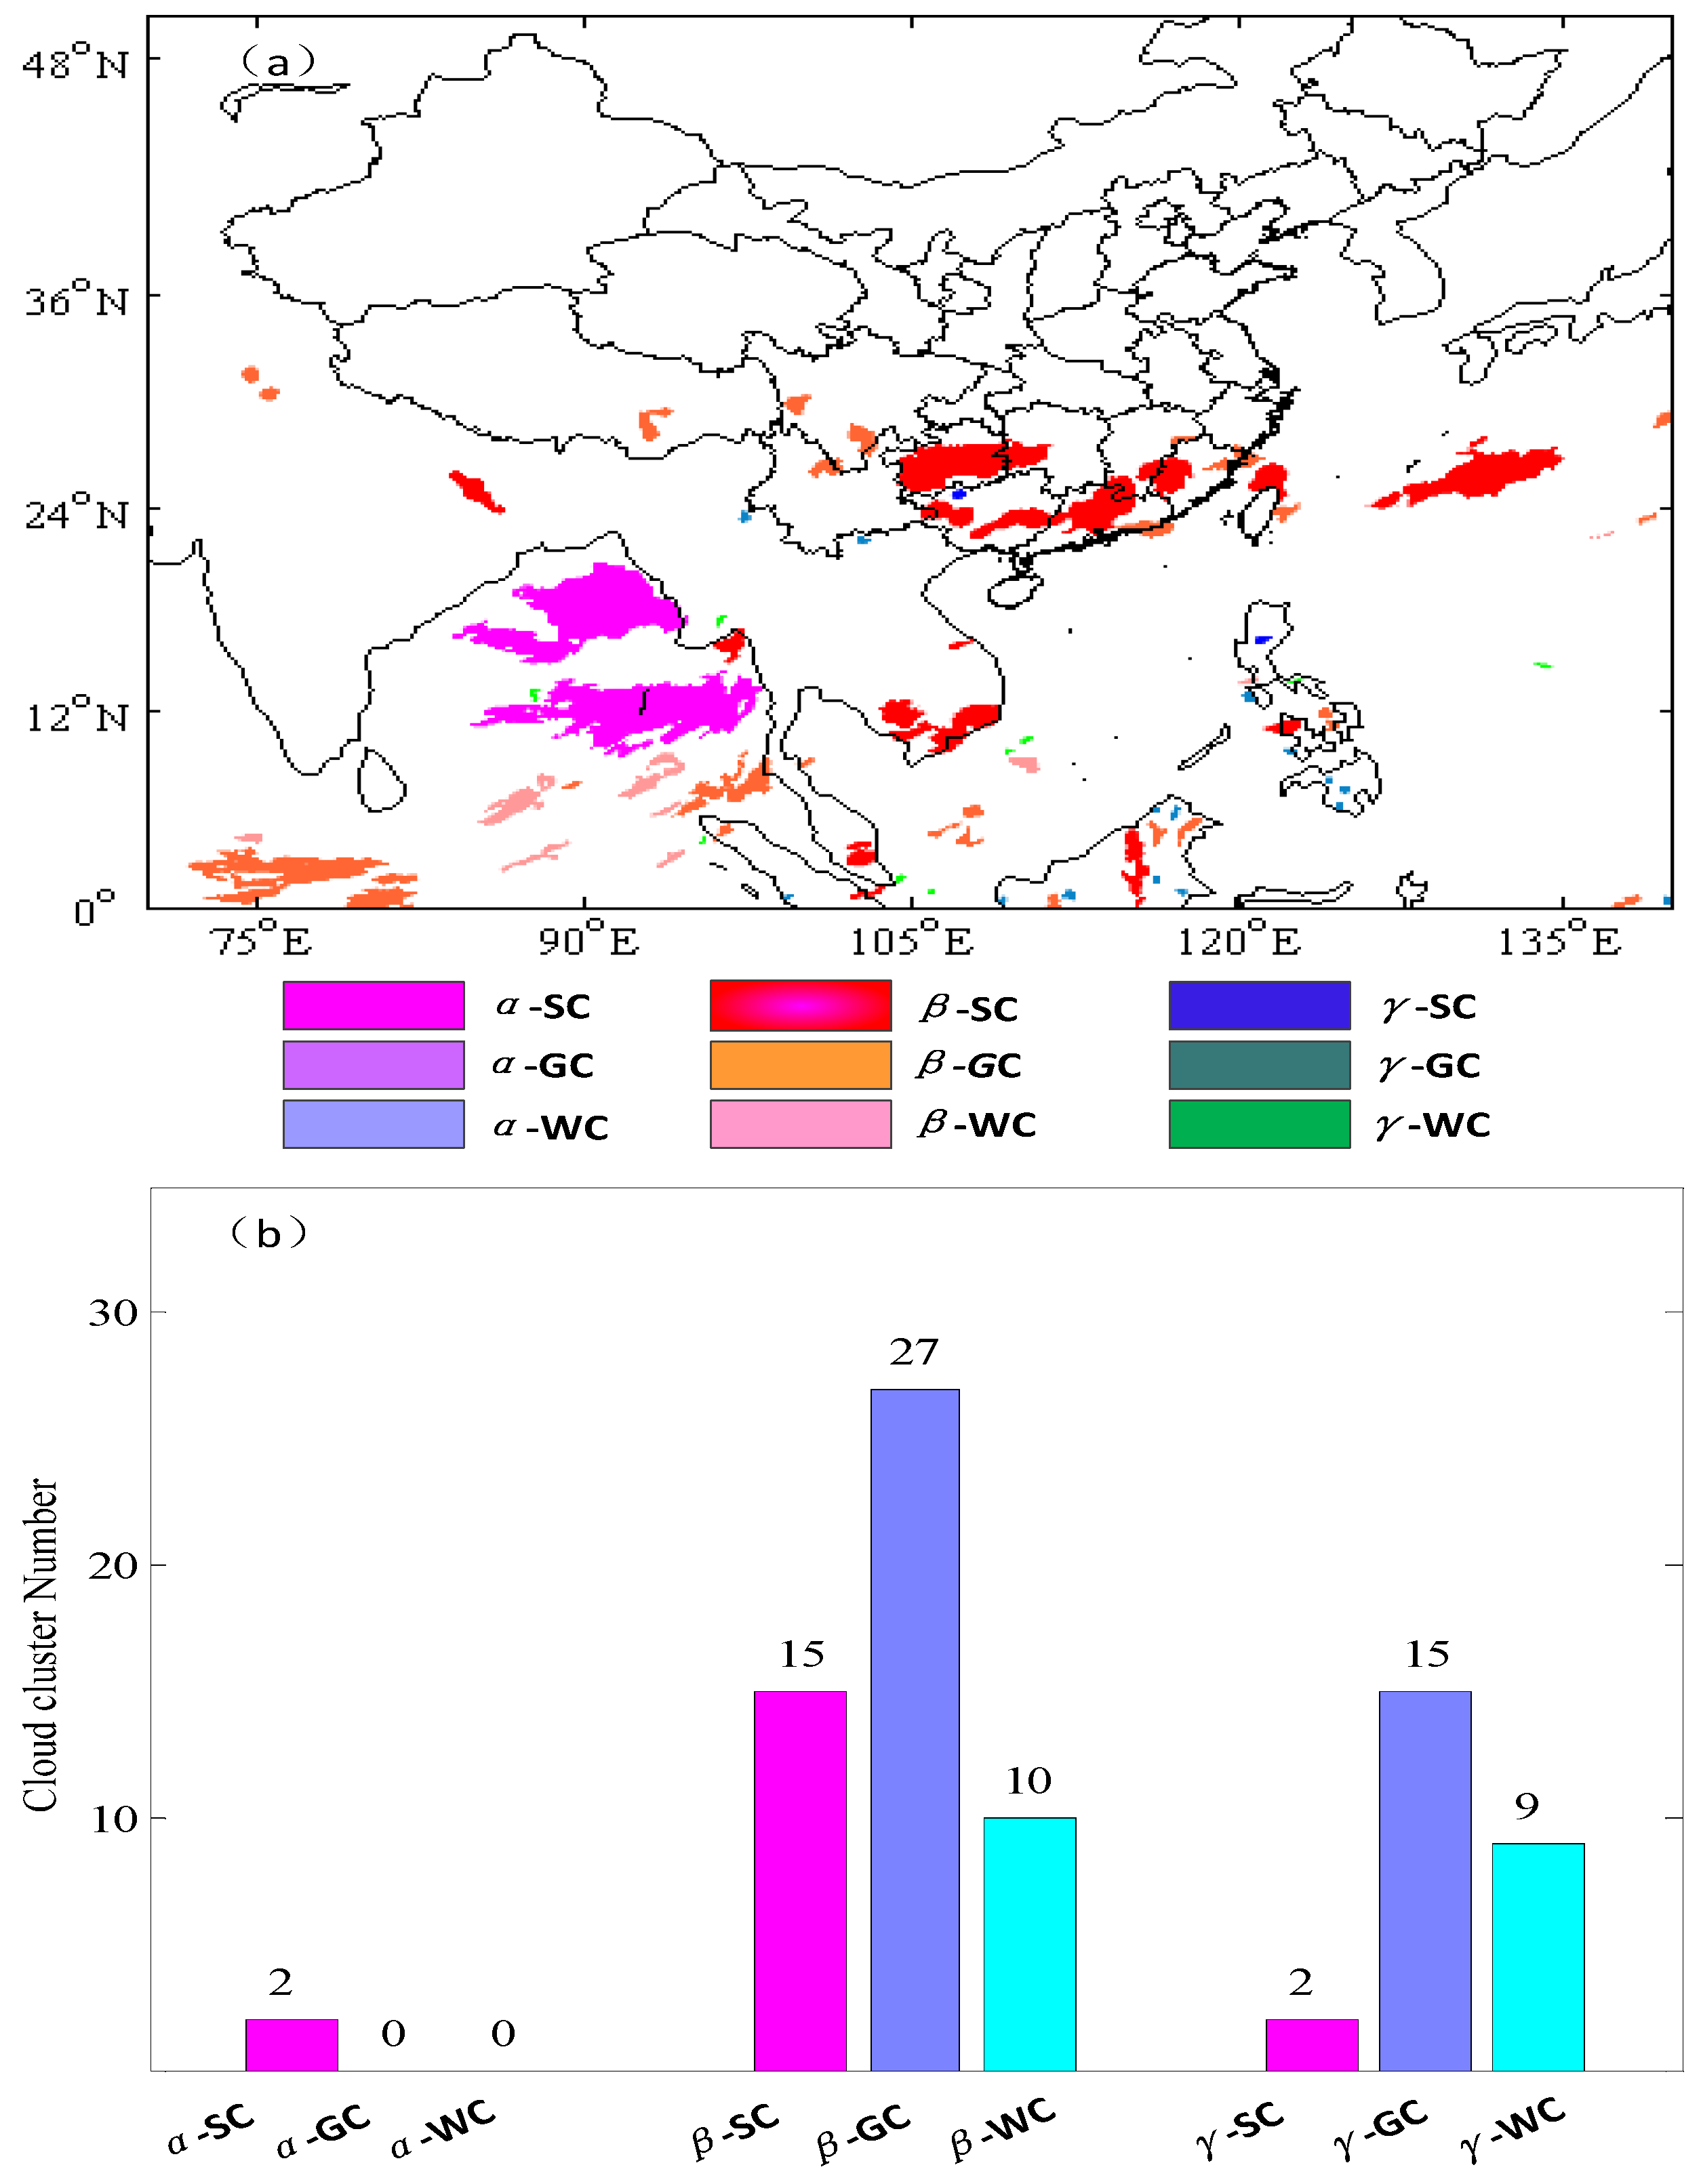
The statistical result shows that the α-type cloud clusters detected by the integrated method are mostly large-scale cloud systems, and the β- and γ-type cloud clusters have the highest proportion of general convective cloud. However, the proportion of weak convection is higher than that of severe ones in γ-type cloud, but it is the opposite in β-type cloud.

Acknowledgments

This research was supported by the National Nature Science Foundation of China (41576171). We are grateful to the editors and anonymous reviewers for their constructive comments on the manuscript.

Author Contributions

Hanqing Shi designed the research and the general outline of the detection method. Kuai Liang performed the experiments and wrote the manuscript. Pinglv Yang and Xiaoran Zhao revised the manuscript.

Conflicts of Interest

The authors declare no conflicts of interest.

References

  1. Fujita, T.; Bradbnry, D.L.; Murino, C. A Study of Mesoscale Cloud Motions Computed from ATS-1 and Terrestrial Photographs; R. Satellite Mesometeorological Research Project Research Paper No. 71; Department of Geophysical Sciences University of Chicago: Chicago, IL, USA, 1968. [Google Scholar]
  2. Baldauf, M.; Seifert, A.; Forstner, J.; Majewski, D.; Raschendorfer, M.; Reinhardt, T. Operational convective-scale numerical weather prediction with the cosmo model: description and sensitivities. Mon. Weather Rev. 2011, 139, 3887–3905. [Google Scholar] [CrossRef]
  3. Long, Q.; Chen, Q.; Gui, K.; Zhang, Y. A case study of a heavy rain over the southeastern Tibetan Plateau. Atmosphere 2016, 7, 118. [Google Scholar] [CrossRef]
  4. Ma, Y.; Wang, X.; Tao, Z.Y. Geographic distribution and life cycle of mesoscale convection system in China and its vicinity. J. Prog. Nat. Sci. 1997, 7, 583–589. [Google Scholar]
  5. Tao, Z.Y.; Wang, H.Q.; Wang, X. A survey of meso-α-scale convection systems over China during 1995. Acta Meteorol. Sin. 1998, 56, 166–177. [Google Scholar]
  6. Zheng, Y.G.; Zhu, P.J.; Chen, M. General investigation and analysis of Meso-α-scale convection systems in the Yellow Sea and surrounding areas from 1993 to 1996. Acta Sci. Nat. Univ. Pekin. 2004, 40, 66–72. (In Chinese) [Google Scholar]
  7. Bai, J.; Wang, H.Q.; Tao, Z.Y. Recognition and tracing of severe convective cloud from IR images of GMS. J. Trop. Meteorol. 1997, 13, 158–167. [Google Scholar]
  8. Csekits, C.; Zwatz, V.M.; Jann, A. Automatic detection of convective cells-a nowcast module at the Austrian meteorological service. In Proceedings of the 2000 EUMETSAT Meteorological Satellite Data Users’ Conference, Bologna, Italy, 29 May–2 June 2000; pp. 715–721.
  9. Mueller, C.; Saxen, T.; Roberts, R.; Wilson, J.; Betancourt, T.; Dettling, S.; Oien, N.; Yee, J. NCAR auto-nowcast system. Weather Forecast. 2003, 18, 545–561. [Google Scholar] [CrossRef]
  10. Doelling, D.R.; Gambheer, A.V.; Stassi, J.C. Deep convective cloud calibration. In Proceedings of the 29th CERES Science Team Meeting, Hampton, VA, USA, 17–18 November 2003; Available online: https://ceres.larc.nasa.gov/documents/STM/2003-10/pdf/Doelling_DeepC.pdf (accessed on 11 July 2016).
  11. Liu, J. Improvement of dynamic threshold value extraction technic in FY-2 cloud detection. J. Infrared Millim. Waves 2010, 29, 288–292. (In Chinese) [Google Scholar]
  12. Li, H.J.; Kong, Y.S. To fetch convective cloud cell with continuous wavelet transaction method. J. PLA Univ. Sci. Technol. 2005, 6, 181–186. (In Chinese) [Google Scholar]
  13. Chen, G.Y.; Ding, X.X.; Zhao, L.Y. An automatical pattern recognition technique of cloud based on fuzzy neural network. Chin. J. Atmos. Sci. 2005, 29, 537–844. (In Chinese) [Google Scholar]
  14. Li, Z.J. Estimation of cloud motion using cross-correlation. Adv. Atmos. Sci. 1998, 15, 277–282. [Google Scholar]
  15. Liu, K.F.; Zhang, R.; Sun, Z.B. A cloud movement short-time forecast based on cross-correlation. J. Image Graph. 2006, 11, 586–591. (In Chinese) [Google Scholar]
  16. Liu, Y.A.; Wei, M. Application of FY-2C data in rainstorm nowcasting. In Proceedings of the First International Conference on Information Science and Engineering, Nanjing, China, 26–28 December 2009; pp. 4766–4769.
  17. Ohsawa, T.; Ueda, H.; Hayashi, T.; Watanabe, A.; Matsumoto, J. Diurnal variations of convective activity and rainfall in tropical Asia. J. Meteorol. Soc. Jpn. Ser. II 2001, 79, 333–352. [Google Scholar] [CrossRef]
  18. Vila, D.A.; Machado, L.A.T.; Laurent, H.; Velasco, I. Forecast and tracking the evolution of cloud clusters (For TraCC) using satellite infrared imagery: Methodology and validation. Weather Forecast. 2008, 23, 233–245. [Google Scholar] [CrossRef]
  19. Arnaud, Y.; Desbois, M.; Maizi, J. Automatic tracking and characterization of African convection systems on Meteosat pictures. J. Appl. Meteorol. 1992, 31, 443–453. [Google Scholar] [CrossRef]
  20. Carvalho, L.M.V.; Jones, C. A satellite method to identify structural properties of mesoscale convection systems based on maximum spatial correlation tracking technique (MASCOTTE). J. Appl. Meteorol. 2001, 40, 1683–1701. [Google Scholar] [CrossRef]
  21. Huang, Y.; Liu, H.J.; Zhai, J.; Feng, Y. FY2E convective cloud detection method based on multi-thresholds. Remote Sens. Technol. Appl. 2014, 29, 915–922. (In Chinese) [Google Scholar]
  22. Shah, S.; Notarpietro, R.; Branca, M. Storm identification, tracking and forecasting using high-resolution images of short-range x-band radar. Atmosphere 2015, 6, 579–606. [Google Scholar] [CrossRef]
  23. Li, P.W.; Wong, W.K.; Chan, K.Y.; Lai, E.S. SWIRLS—An Evolving Nowcasting System; Technical Note, No. 100; Hong Kong Observatory: Hong Kong, China, 2000. [Google Scholar]
Figure 1. A case of convective cloud on brightness temperature (BT) and brightness temperature difference (BTD) images (/K): (a) infrared brightness temperature (BTIR1) image; (b) BTDIR1–IR2 image; (c) BTDIR1–IR3 image; (d) BTDIR1–IR4 image. The deep blue areas indicate the convection activeties.
Atmosphere 08 00042 g001
Figure 2. (ai) Results of convective cloud detection by Infrared BTIR1 thresholds.
Atmosphere 08 00042 g002
Figure 3. Results of convective cloud detection by infrared BTD thresholds.
Atmosphere 08 00042 g003
Figure 4. Integrated detection result of convective cloud: (a) Before the removal of “broken cloud”; (b) After the removal of “broken cloud”.
Atmosphere 08 00042 g004
Figure 5. Convective cloud detection process. The detection process goes from the BT threshold method and ends with cloud classification.
Atmosphere 08 00042 g005
Figure 6. (ai) FY-2F BTIR1 image at every half hour on 14 June 2016, 08:30–12:30. The image at 10:30 is the object to test our detection process in this paper.
Atmosphere 08 00042 g006
Figure 7. (af) Results after each detection step. The pink area on the image is the detection result.
Atmosphere 08 00042 g007aAtmosphere 08 00042 g007b
Figure 8. Classification of convective cloud clusters (a) and its statistical result (b).
Atmosphere 08 00042 g008
Table 1. Classification standard of convective cloud clusters (L: km; BTmin: K).
200 < BTmin ≤ 200020 < BTmin ≤ 2000 < BTmin ≤ 20
L > 240α-weak convection (α-SC)β-weak convection (β-SC)γ-weak convection (γ-SC)
220 < L ≤ 240α-general convection (α-GC)β-weak convection (β-GC)γ-general convection (β-GC)
L ≤ 220 α-severe convection (α-WC)β-severe convection (β-WC)γ-severe convection (γ-WC)
Table 2. Cloud statistical result of each step.
NumberMean Scale (km)Mean BTIR1 (K)
Severe convection centers3820.6204.8
Preliminary detection result17323.9225.2
Severe convection1969.7223.5
Uncertain cloud15418.3232.5
Un-severe convection6127.4232.3
Integrated detection result8037.4225.1

