1. Introduction
Over the past 30 years, China has quickly undergone urbanization and industrialization. Rapid social and economic development led to heavy atmospheric pollution in East China. Air pollution has a great impact on human health, contributing to health conditions such as respiratory and cardiovascular disease [
1]. Anthropogenic pollutants emitted from China may experience long-range transport to the Korean peninsula, Japan, and even into West America, which can cause a regional or global air pollution problem [
2,
3,
4]. Previous studies on air pollution in China focused on three developed economic areas, consisting of North China Plain (around Beijing city), Yangtze River Delta (around Shanghai city), and Pearl River Delta (around Guangzhou city) [
5,
6,
7,
8]. However, only a few studies have investigated air pollution in some developing economic areas, even though their air quality has been worse than in the developed areas in China.
Although the economy in Northeast China area has undergone a slow increase in the past 15 years, air quality has deteriorated similar to the more developed economic areas. There is a sharp contrast in air quality in Northeast China between heating and non-heating periods. For example, the PM2.5 concentration in urban areas climbed up to 1000 μg/m3 during some serious haze-fog events during the heating period in 2015, in contrast to the common <75 μg/m3 during non-heating periods. The first reason was that Northeast China is one of the coldest areas in China, with an average temperature around −15 °C in winter. Therefore, people in urban and rural areas need to consume much more fuel for heating (e.g., coal and biomass burning) in Northeast China than other places in North China. The second reason is that Northeast China has the longest heating period (about six months) in China. Large amounts of emissions from solid fuels for heating as a dominant source cause the formation of the regional severe hazes in Northeast China which could be different from the hazes in the North China Plain. Therefore, it is necessary to understand exactly what kinds of aerosol particles and what sources are existing in Northeast China.
To our knowledge, there is no study working on the regional haze episodes during the heating period in Northeast China, although a few studies have investigated aerosol optical properties and aerosol composition of PM
2.5 in some urban areas in non-heating periods [
9,
10,
11,
12]. In this study, we conducted a field campaign in regional haze episodes and chose a background site in the central area of Northeast China. Aerosol properties at the background site can reflect anthropogenic sources due to their low background around the sampling site. Also, aerosol properties at the background site can indicate the particle aging process during their long-range transports, which can help us understand the formation mechanism of regional haze episodes in Northeast China. A high-resolution transmission electron microscopy (TEM) was used to investigate morphology, composition, and mixing state of individual aerosol particles.
2. Experiments
2.1. Aerosol Sampling
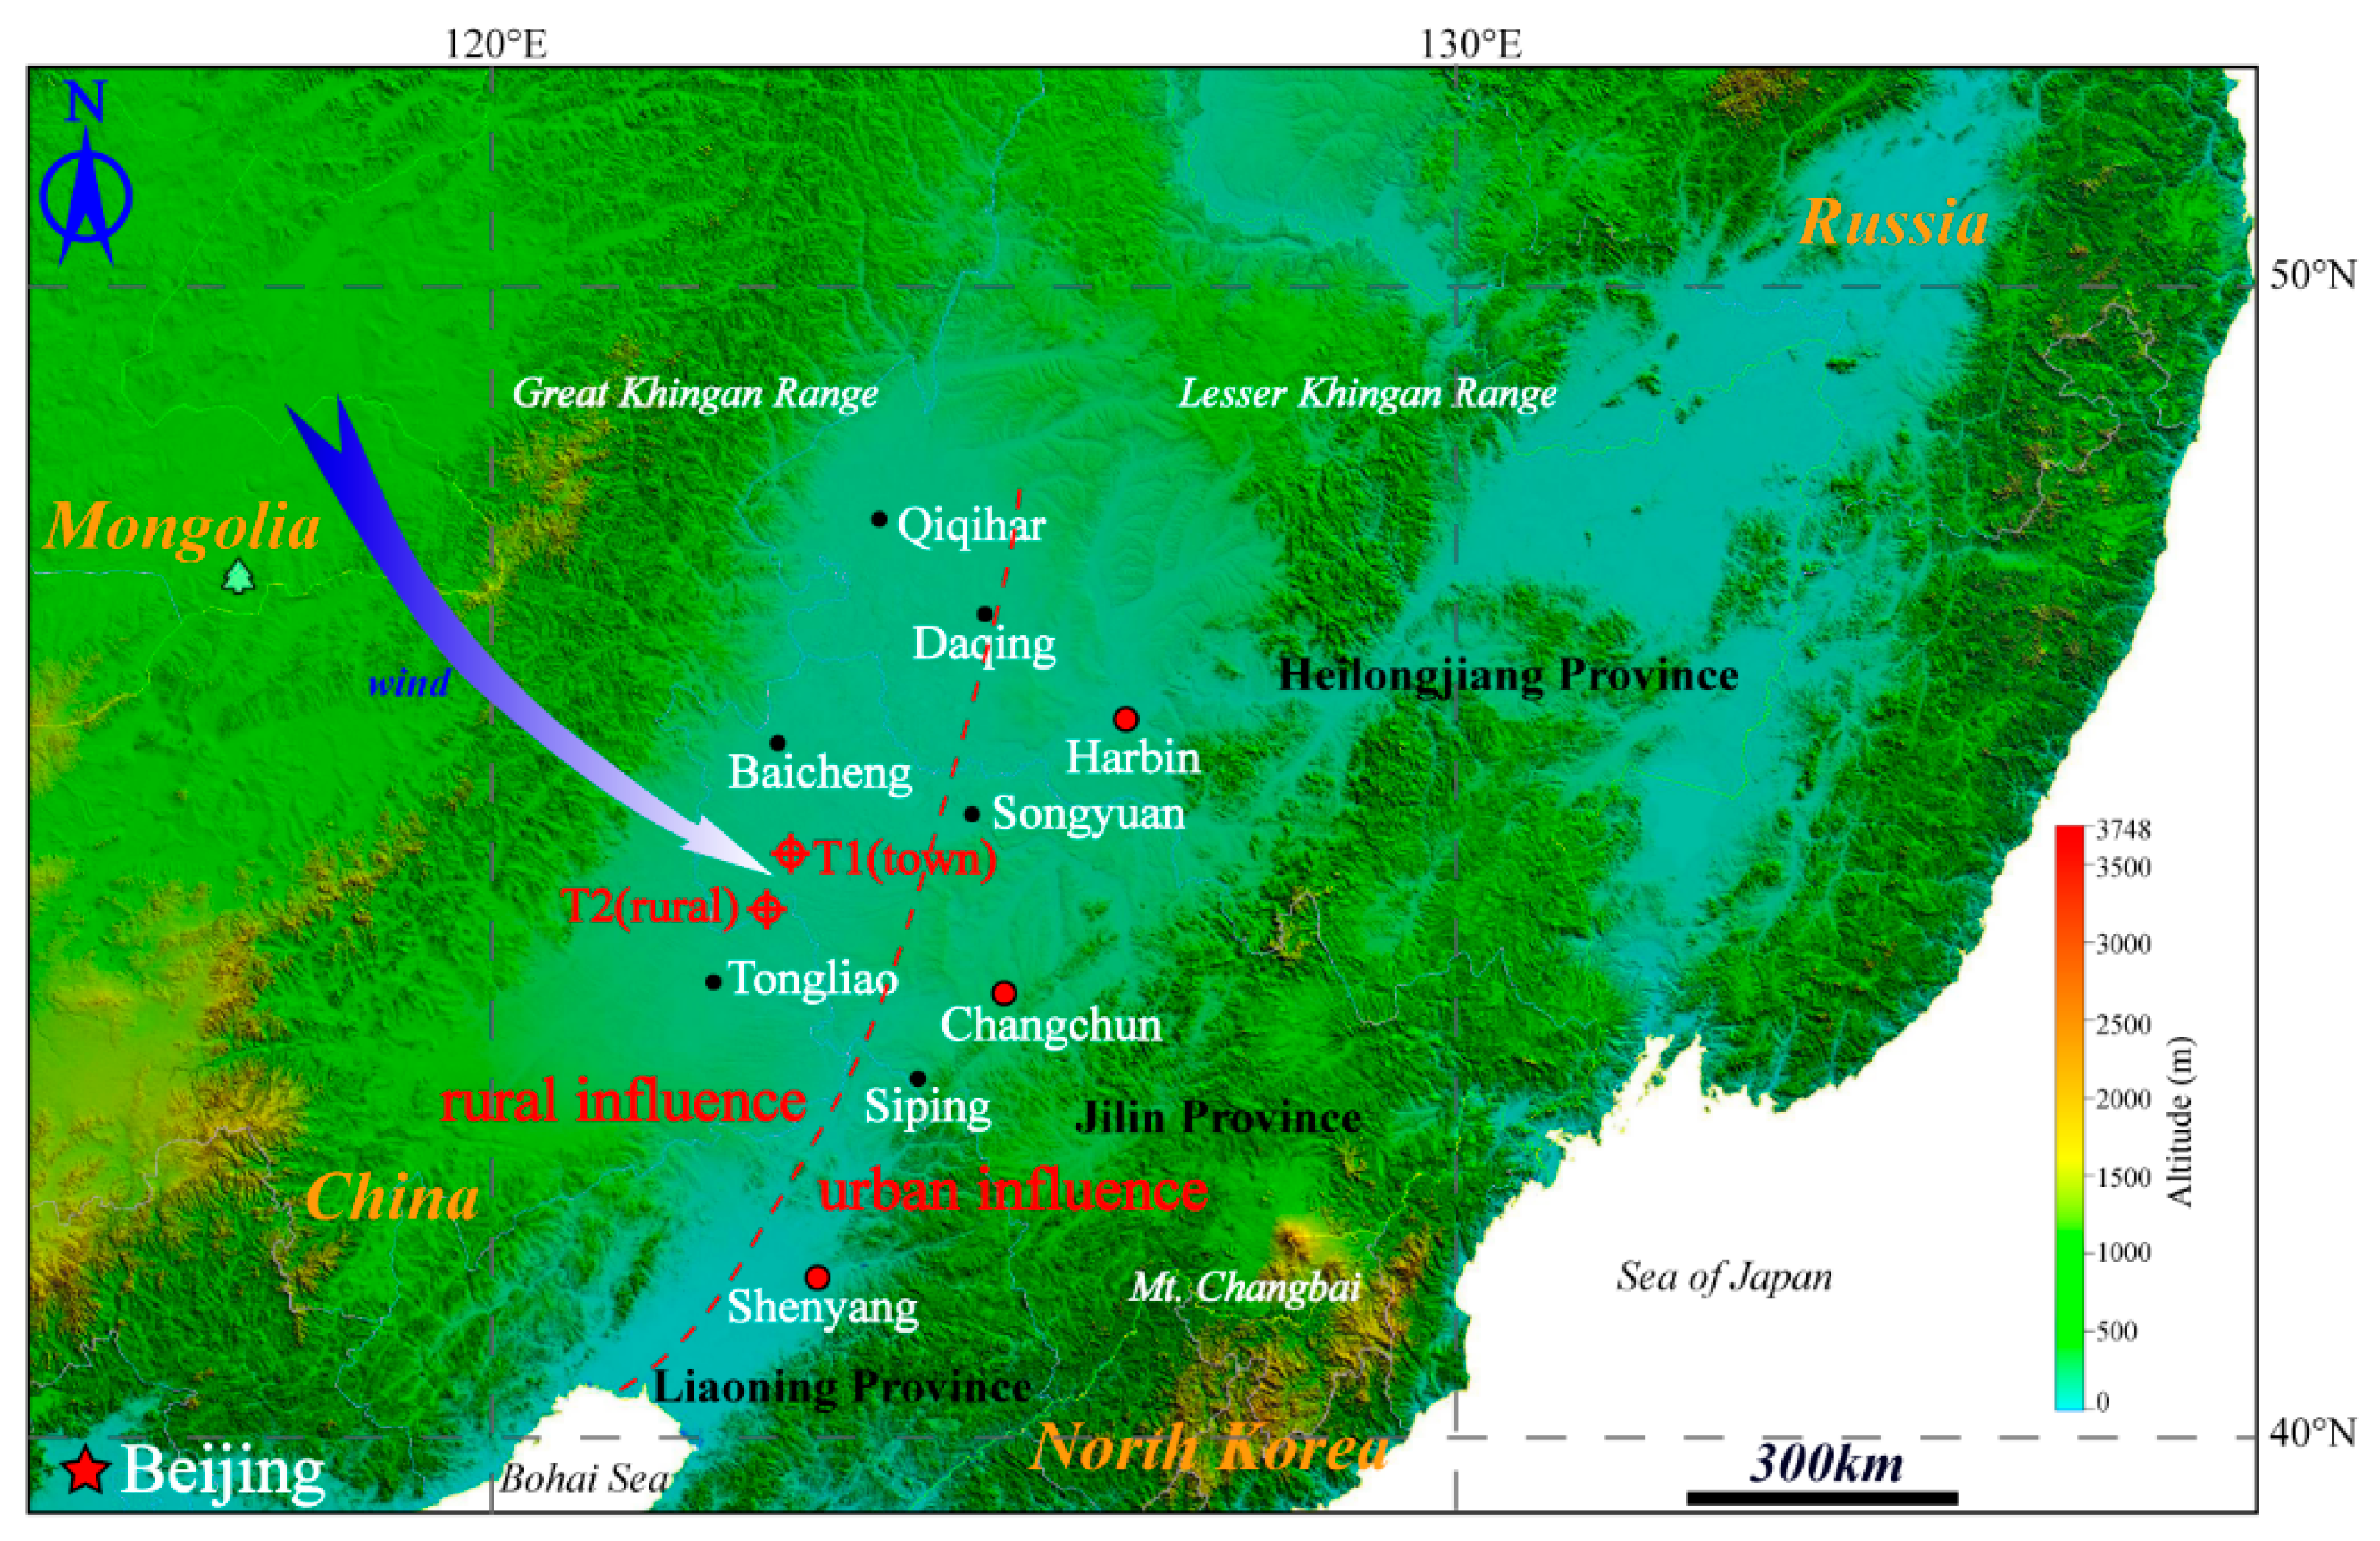
The Northeast China Plain was divided into a western and an eastern part based on the distribution of its population and cities. Major cities, including the capital cities of three provinces (Heilongjiang, Jilin, and Liaoning), are located in the eastern part and only a few small cities and some villages are located in the western part. Therefore, we generally considered the eastern part to be an urban influence area and the western part to be a rural influence area. In this study, aerosol samples were collected from 28 January 2015 to 9 February 2015 in the western part of Northeast China. Two sampling sites were chosen for aerosol collection in Tongyu of Jilin Province (
Figure 1): the suburban county town site (T1, 44.81° N, 123.09° E) and the background rural site (T2, 44.42° N, 122.87° E). T1 was located in a county town area which was mainly influenced by automobile exhaust and solid fuels (e.g., coal and biomass burning) for heating and cooking. T2 was situated in the rural area, 50 km south from the T1 site. Some small villages, but no industries, are situated in the vast rural area. Based on our local investigation, coals were the main fuels for cooking and heating in central Tongyu county, and a mixture of coals, wheat straw, and cornstalks were the main fuels for cooking and heating in rural areas of Tongyu county or in the villages.
The NOAA (National Oceanic and Atmospheric Administration) HYSPLIT (Hybrid Single Particle Lagrangian Integrated Trajectory) trajectory model was used to investigate transport pathways of air masses and their origins. Forty-eight hours backward trajectories arriving at 1000 m above ground level at 16 UTC were calculated for the T1 and T2 sites. During the sampling period, the air masses mainly came from northwestern areas including the northern part of Inner Mongolia, and Greater Khingan forests where some villages and towns are distributed (
Figure 1 and
Figure S1). During our sampling period, a regional haze occurred from 3 to 4 February 2015 (
Figures S2 and S3).
Copper TEM grids coated with carbon film (carbon type-B, 300-mesh copper, Tianld Co., Beijing, China) were used to collect aerosol particles by a single-stage cascade impactor with a 0.5 or 0.3 mm diameter jet nozzle and an air flow of 1.0 L/min. This sampler has a collection efficiency of 100% and a 0.5 μm aerodynamic diameter if the density of the particles is 2 g/cm3. To avoid particles overlapping on the substrate, the sampling duration was controlled from 3 min to 20 min according to the visibility and PM concentration. In other words, the sampling duration on clear days due to the low PM2.5 concentration was longer than on haze days. All samples were placed in sealed, dry plastic capsules and preserved in a desiccator at 25 °C and 20% ± 3% relative humidity (RH) for subsequent analysis. The interval between the sample collections at the T1 and T2 sites could vary across a few hours in a day.
2.2. Electron Microscopic Analyses
Aerosol particle samples were analyzed by JEOL JEM–2100 transmission electron microscopy (TEM, JEOL Ltd., Tokyo, Japan) operated at 200 kV. Elemental composition was determined semi-quantitatively by using an energy-dispersive X-ray spectrometer (EDS) (Oxford Instruments, Oxfordshire, UK) that can detect elements heavier than C (Z ≥ 6). The relative percentages of the elements were estimated based on the EDS spectra acquired through the INCA software (Oxford Instruments, Oxfordshire, UK). The distribution of aerosol particles on TEM grids was not homogeneous: coarser particles occur near the center and finer particles are on the periphery. Therefore, to be more representative, three areas were chosen from the center to periphery of the sampling spot on each grid. iTEM software (Olympus Soft Imaging Solutions GmbH, Münster, Germany) was used to analyze the TEM images and to obtain the projected area, circularity, perimeter, and equivalent circle diameter of particles. A total of 2589 particles (1653 for T1 and 936 for T2) were analyzed at the two sites.
3. Results
3.1. Aerosol Particle Types
A regional light haze was simultaneously observed at the T1 and T2 sites from 3 to 4 February 2015 (
Figures S2 and S3). Individual particle samples were collected from 28 January 2015 to 9 February 2015. Individual particles were divided into four major particle types depending on their different composition and morphology: S-rich, organic matter (OM), soot, and K-rich.
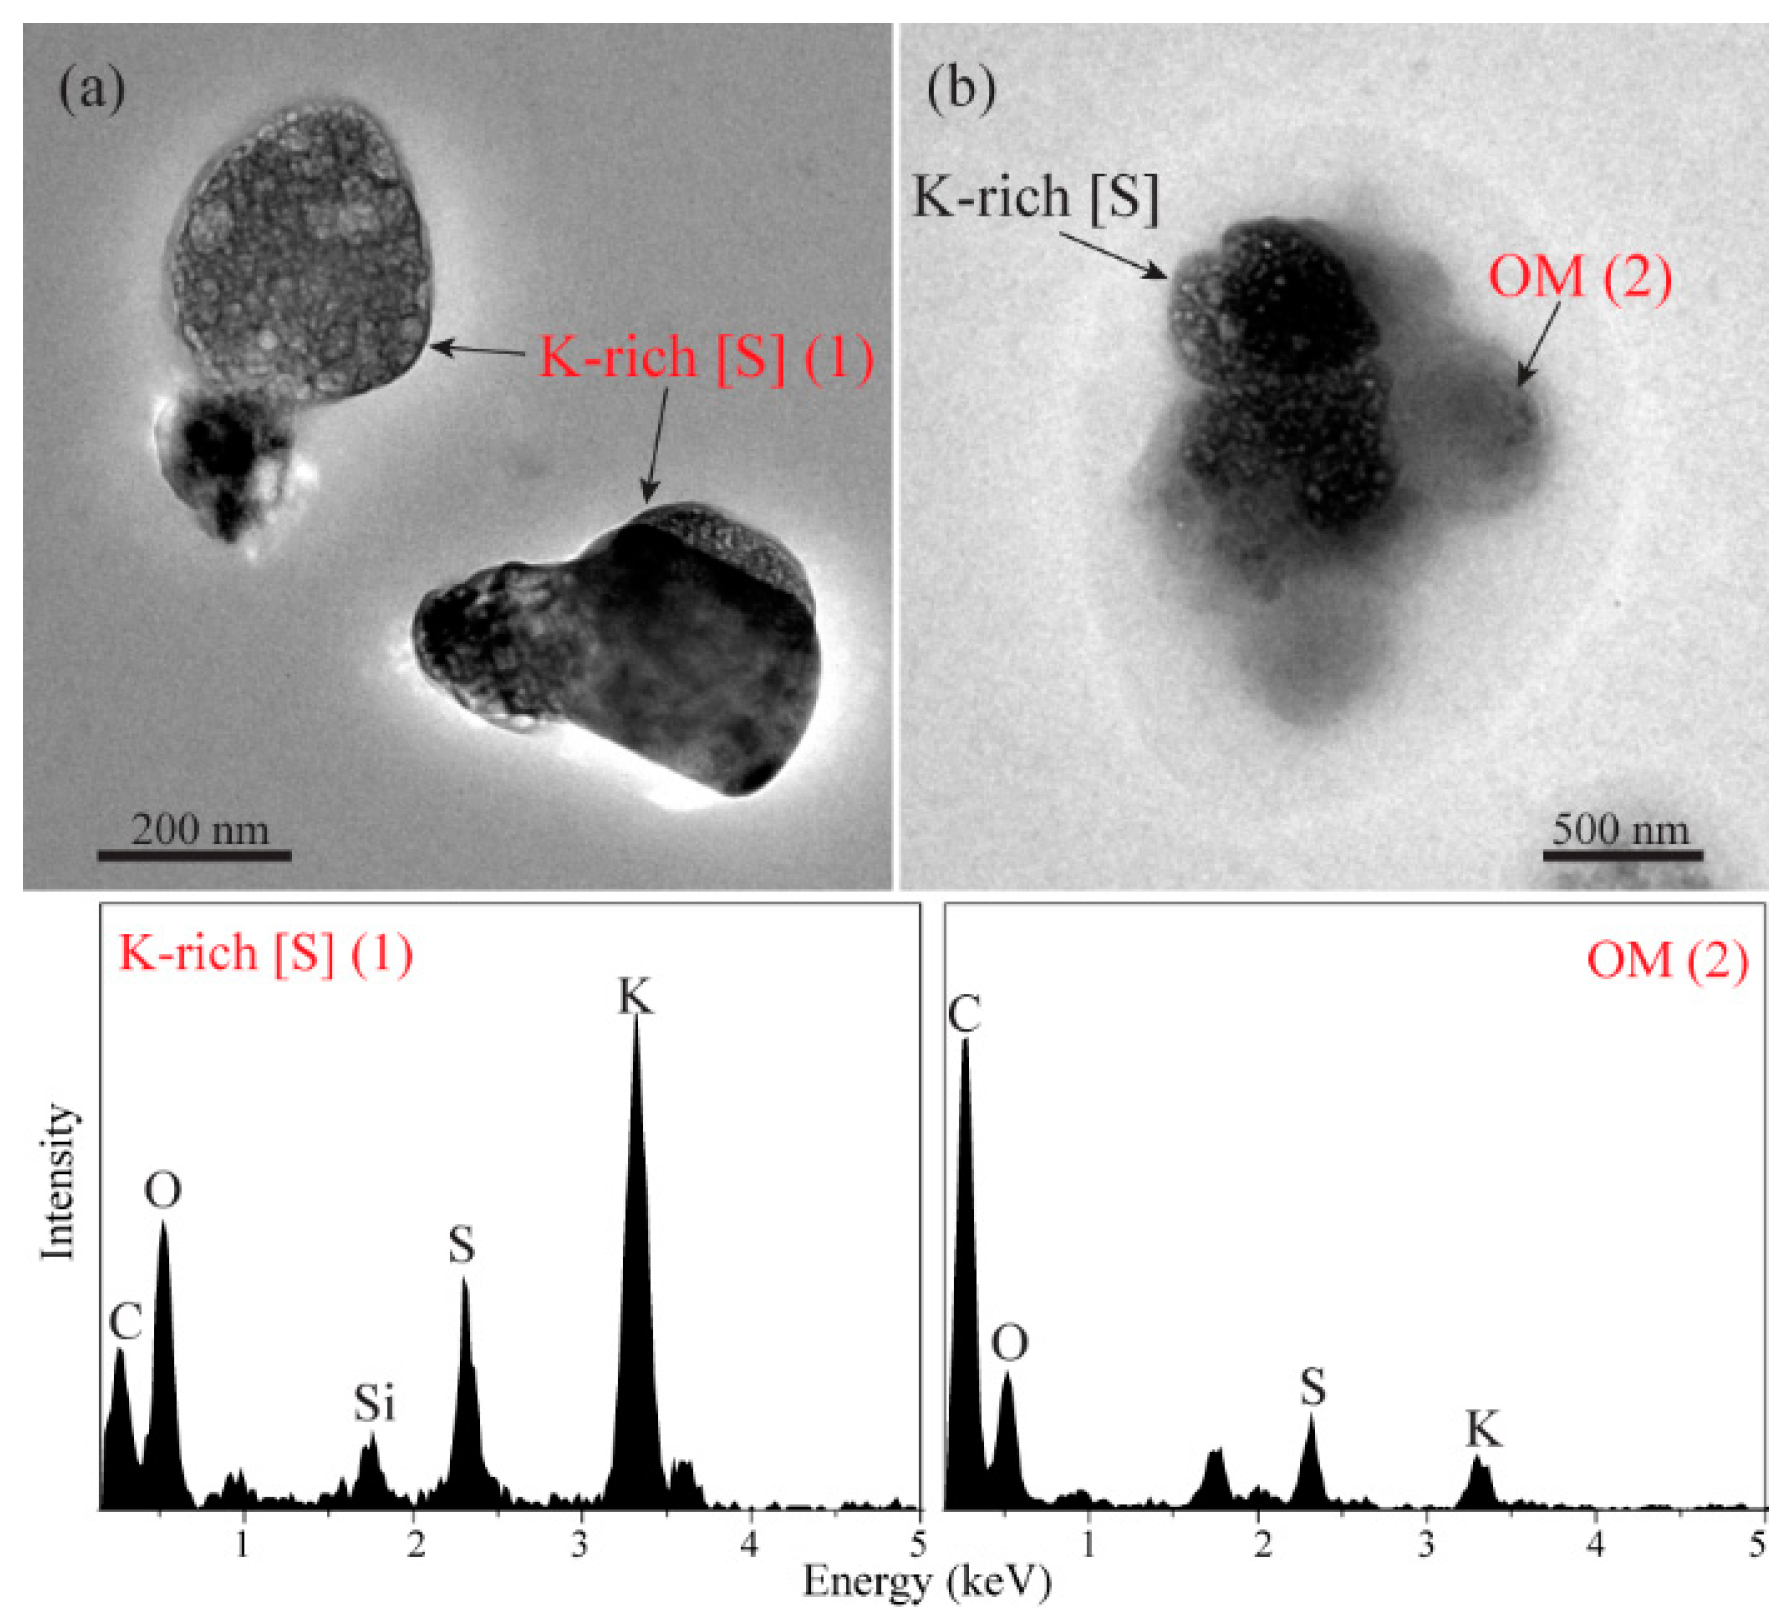
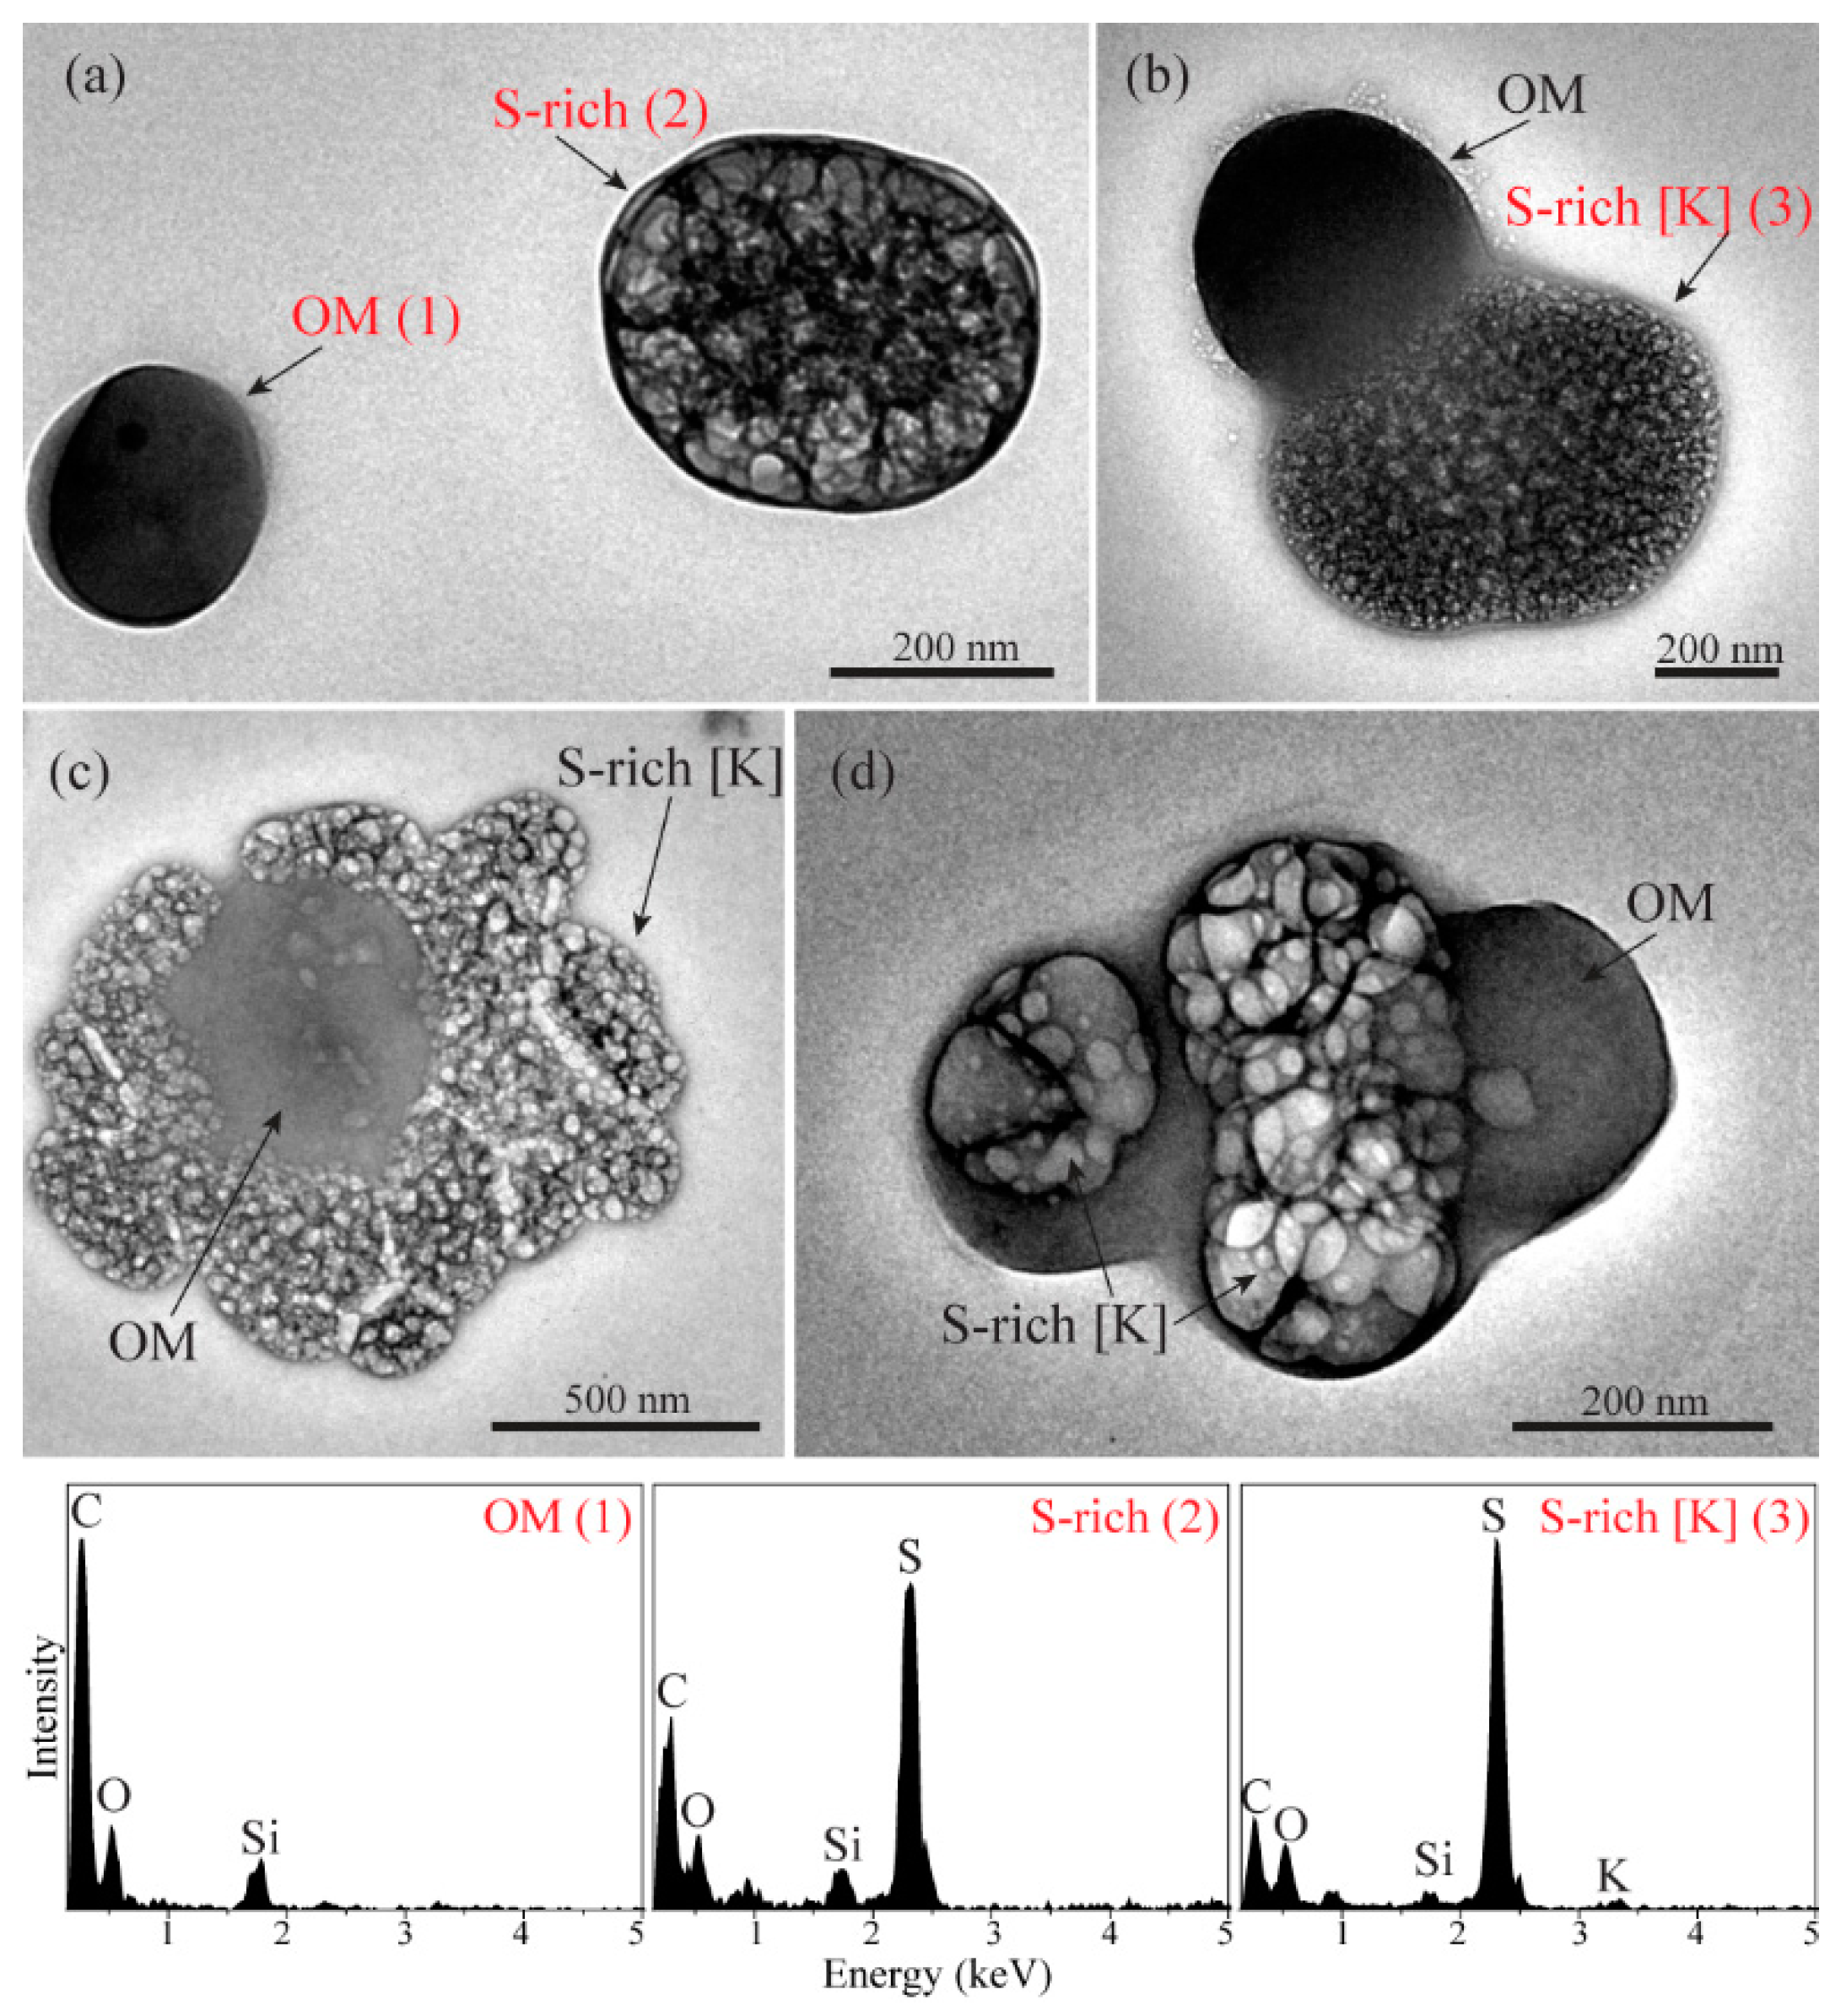
S-rich particles contained sulfur along with nitrogen, oxygen, and minor potassium. S-rich particles normally exhibited a rounded shape on the substrate (
Figure 2). OM particles were composed of abundant carbon and minor amounts of oxygen. S-rich particles were easily sublimated under strong beam exposure, while OM particles were stable in the samples (
Figure 2). The similar phenomenon has been described by Adachi and Buseck [
13] and Fu et al. [
8]. In our study, most of the OM particles were internally mixed with S-rich and K-rich particles (
Figure 2). Based on the classifications of mixing structures of internally mixed particles proposed by Li et al. [
14], we found two types of mixing structures between S-rich and OM particles, such as dumbbell-like particles (
Figure 2b) and core-shell particles (e.g., OM particles coated by S-rich (
Figure 2c) and S-rich particles coated by OM (
Figure 2d)).
K-rich particles displayed irregular shapes and contained potassium (K), oxygen, sulfur, and/or nitrogen. Once K-rich particles are exposed longer times under the strong electron beam, they can be sublimed. Although the morphology of K-rich particles is similar to S-rich particles, their EDS were different. The EDS of K-rich particles usually displayed high O, K, and/or S (
Figure 3a) and S-rich particles displayed high O and S with minor K (
Figure 2). The chemical composition of these K-rich particles suggests that they could be KNO
3 and/or K
2SO
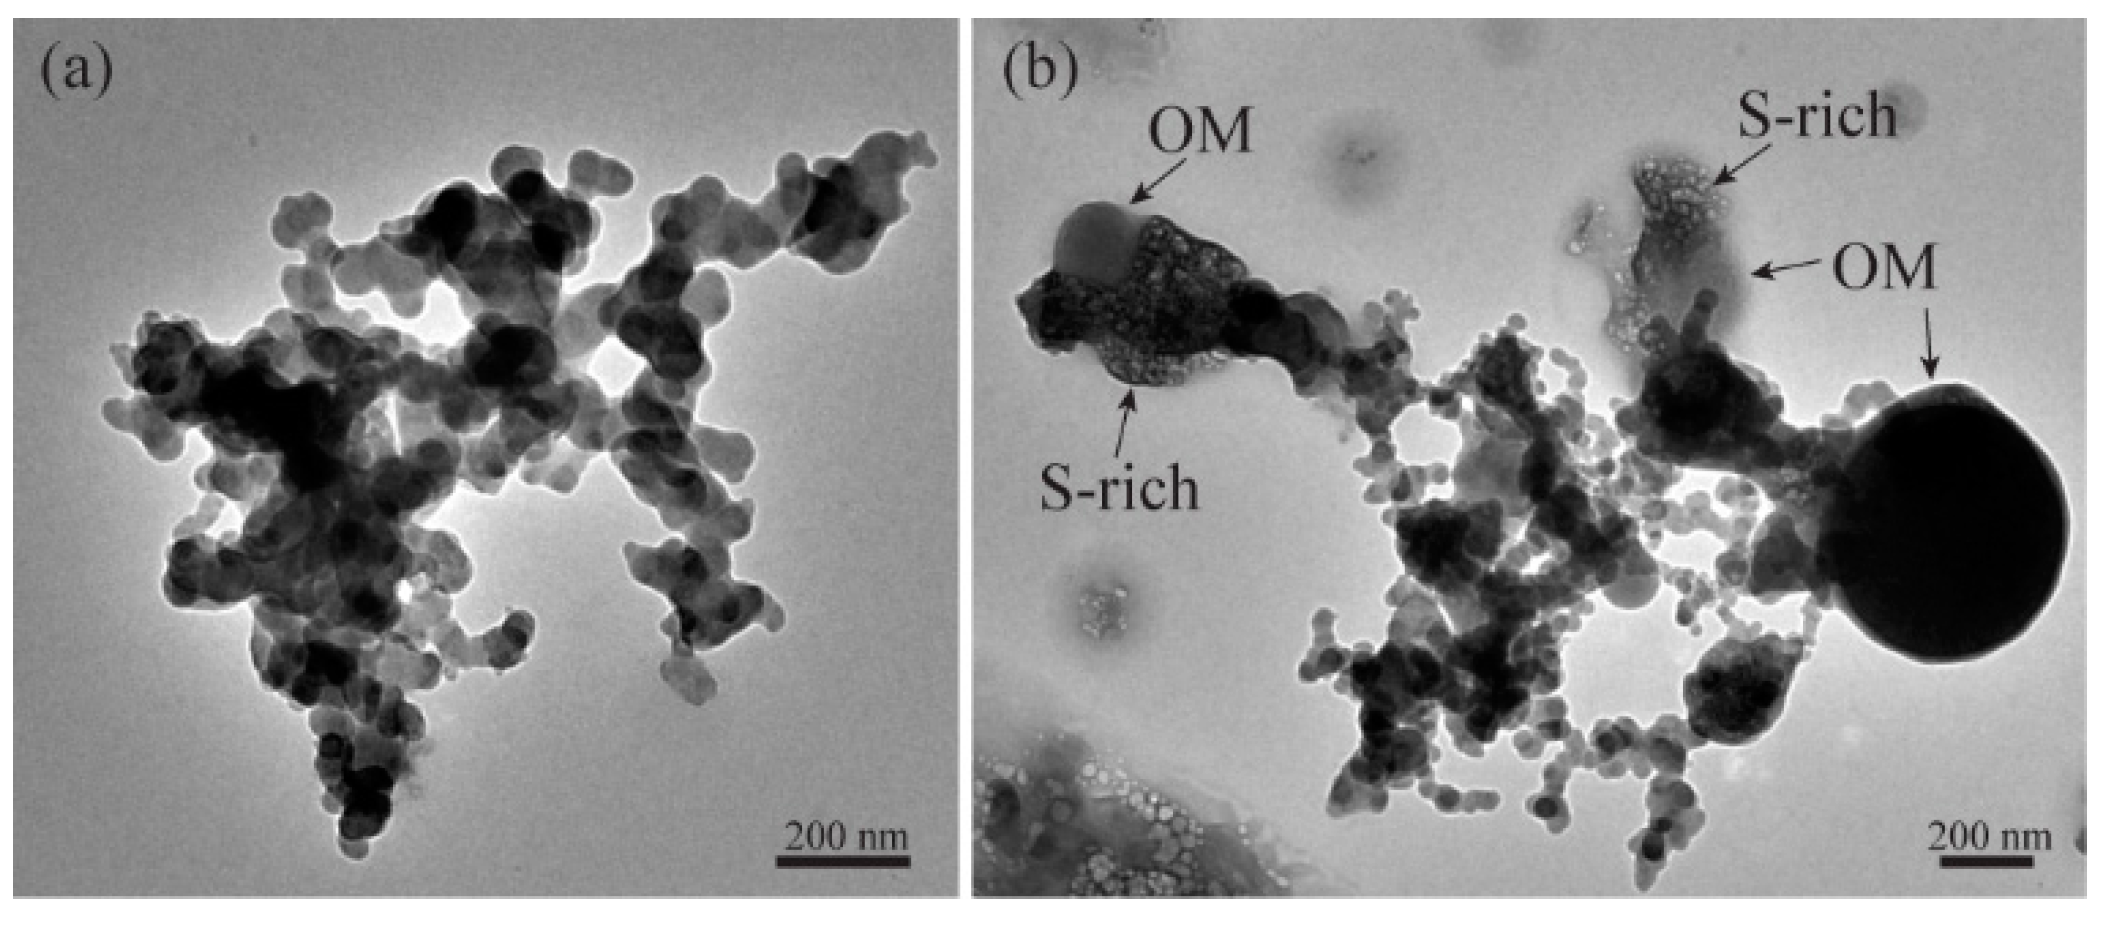
4 with minor amounts of KCl. TEM observations showed that most of the K-rich particles were internally mixed with organic, S-rich, and soot particles (
Figure 3). In general, K-rich particles can be considered as an important tracer of biomass burning [
13,
15].
Soot particles, also known as black carbon (BC) or element carbon (EC), are a type of carbonaceous material with graphitic structures, which mainly come from incomplete combustion of fossil fuels and biomass [
16,
17]. Soot particles exhibit a chain-like aggregation morphology with a diameter of 10 to 100 nm [
18]. Most soot particles observed in our study were internally mixed with S-rich and/or OM particles (
Figure 4).
3.2. Relative Abundance of Different Types of Aerosol Particles
In the samples, most of the individual particles were internal mixture which contains more than two different particle types (
Figure 2,
Figure 3 and
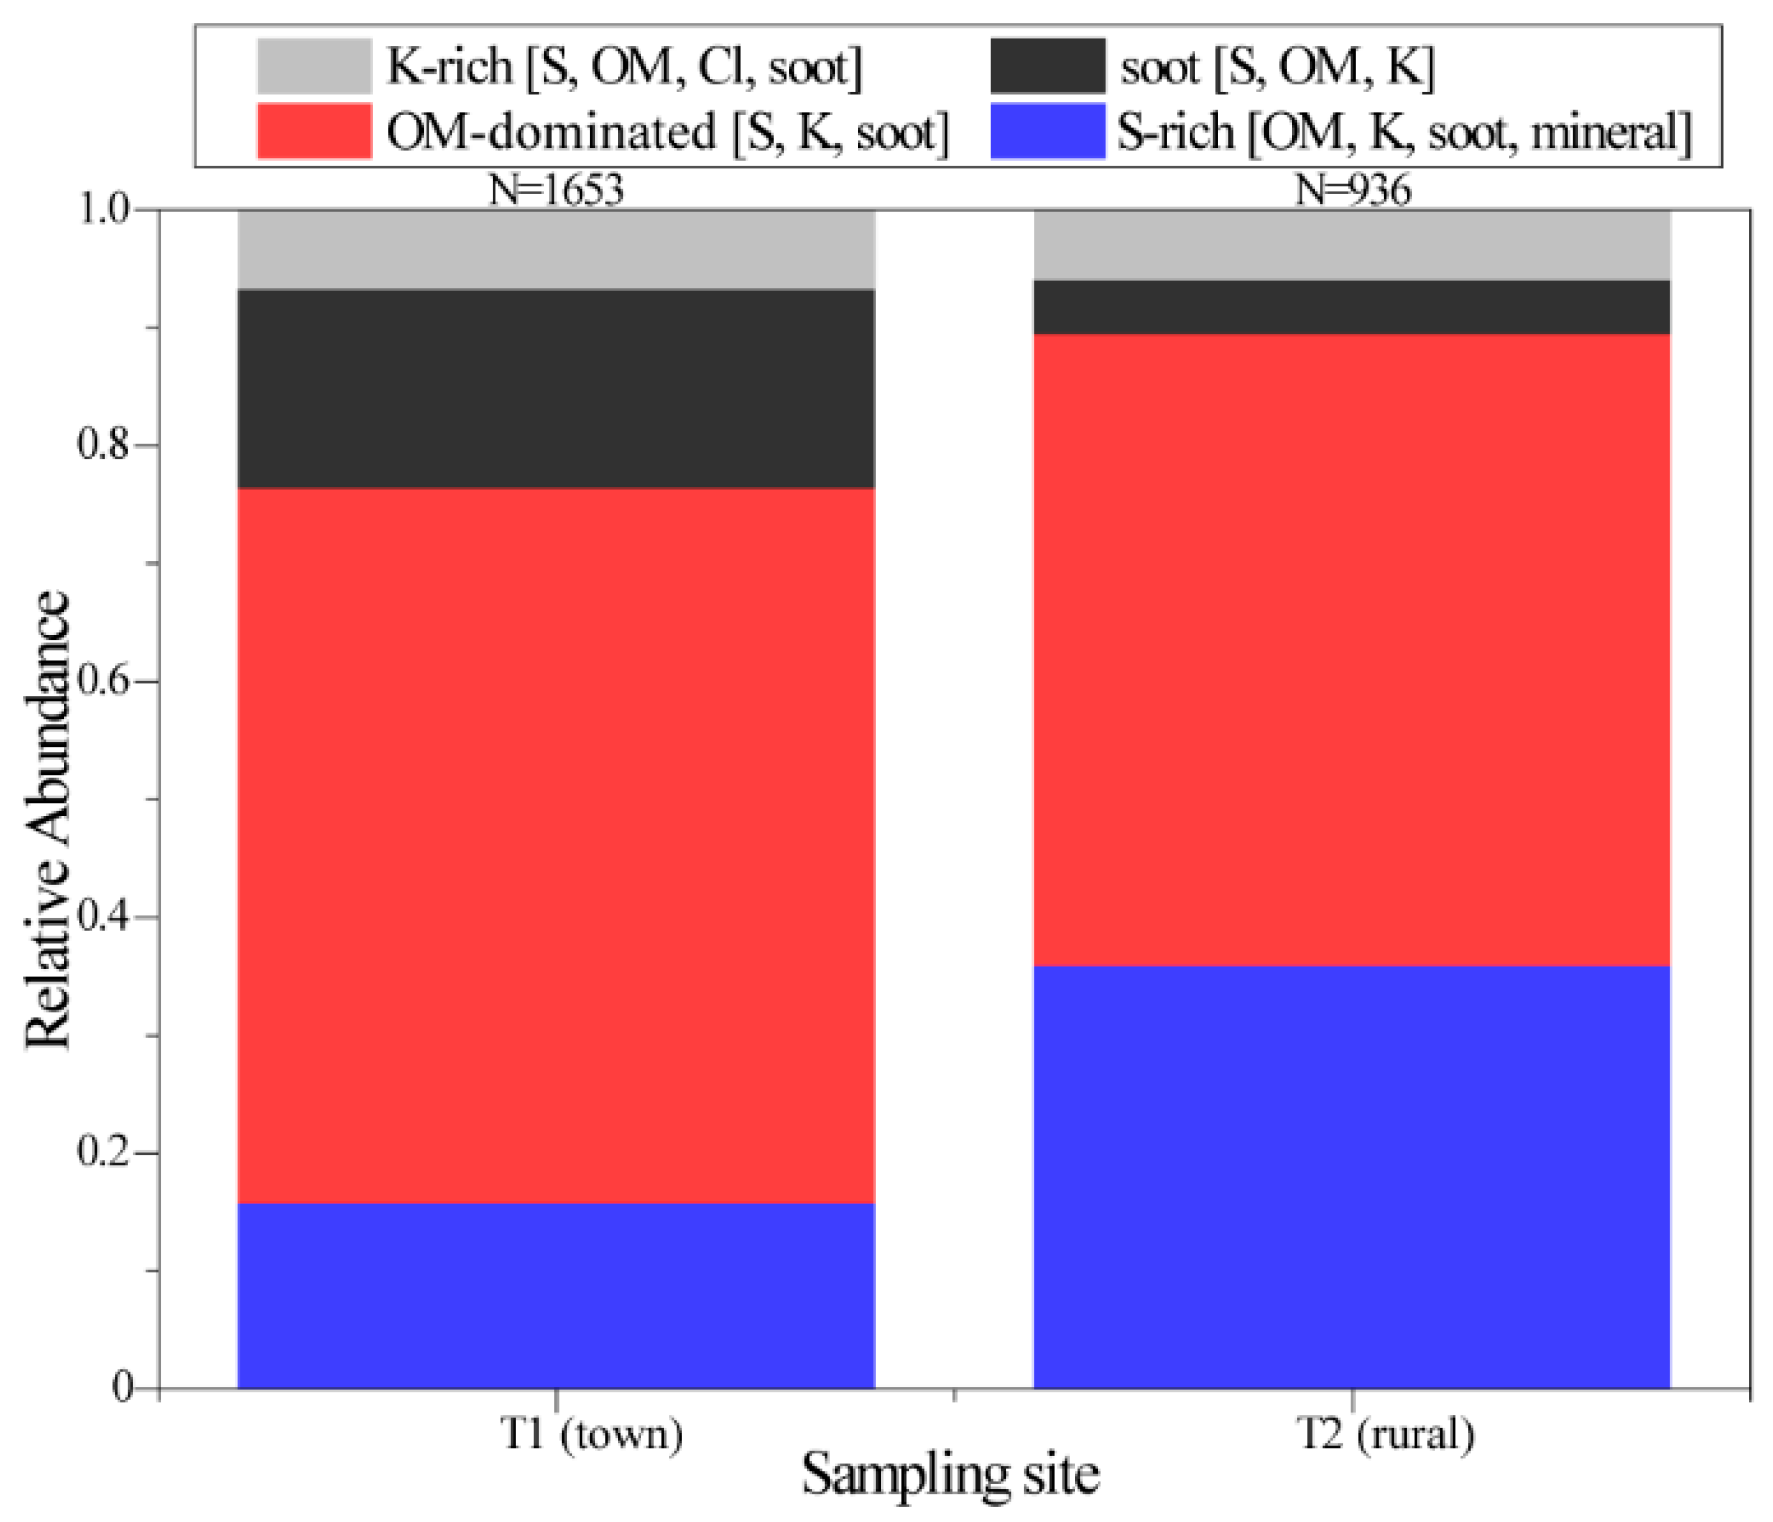
Figure 4). Here we named each particle according to their major aerosol component , as shown in
Figure 5. In this study, 1653 and 936 particles were analyzed at the T1 (town) and T2 (rural) sites, respectively.
Figure 5 shows that the main aerosols are OM-dominated particles, accounting for 60.7% and 53.5% at the T1 and T2 sites, respectively. The percentage of soot particles was four times higher at the T1 site (16.9%) than at the T2 site (4.6%), and 35.9% of S-rich particles occurred at the T2 site, higher than 15.7% at the T1 site. At the two sampling sites, K-rich particles only accounted for about 6.7% and 6.0% of particles, respectively. It should be noted that most of the OM and S-rich particles (
Figure 2) contained minor amounts of K.
Both spherical and irregular OM particles were considered as primary OM particles, they formed in cooling polluted plumes from coal combustion and biomass burning [
19]. In contrast, the formation mechanism of OM coating was different from spherical OM and irregular OM, and they were normally considered secondary OM particles as the oxidized productions of volatile organic compounds (VOCs) [
20,
21]. In OM-dominated particles, we observed a high fraction of spherical OM particles and irregular OM particles (62%) at the T1 site and T2 site, suggesting that OM particles mainly came from primary emissions (e.g., coal combustion and biomass burning).
3.3. Size Distribution of S-rich Particles
S-rich particles represent secondary inorganic particles which mainly contain ammoniated sulfates and ammoniated nitrates [
14]. The relative abundance of secondary particles has been used to suggest transports of air masses and their ageing properties [
22]. We noticed that the relative abundance of S-rich particles was higher at the T2 site than at the T1 site. Therefore, it is reasonable that more S-rich particles occurred at the T2 site compared to the T1 site.
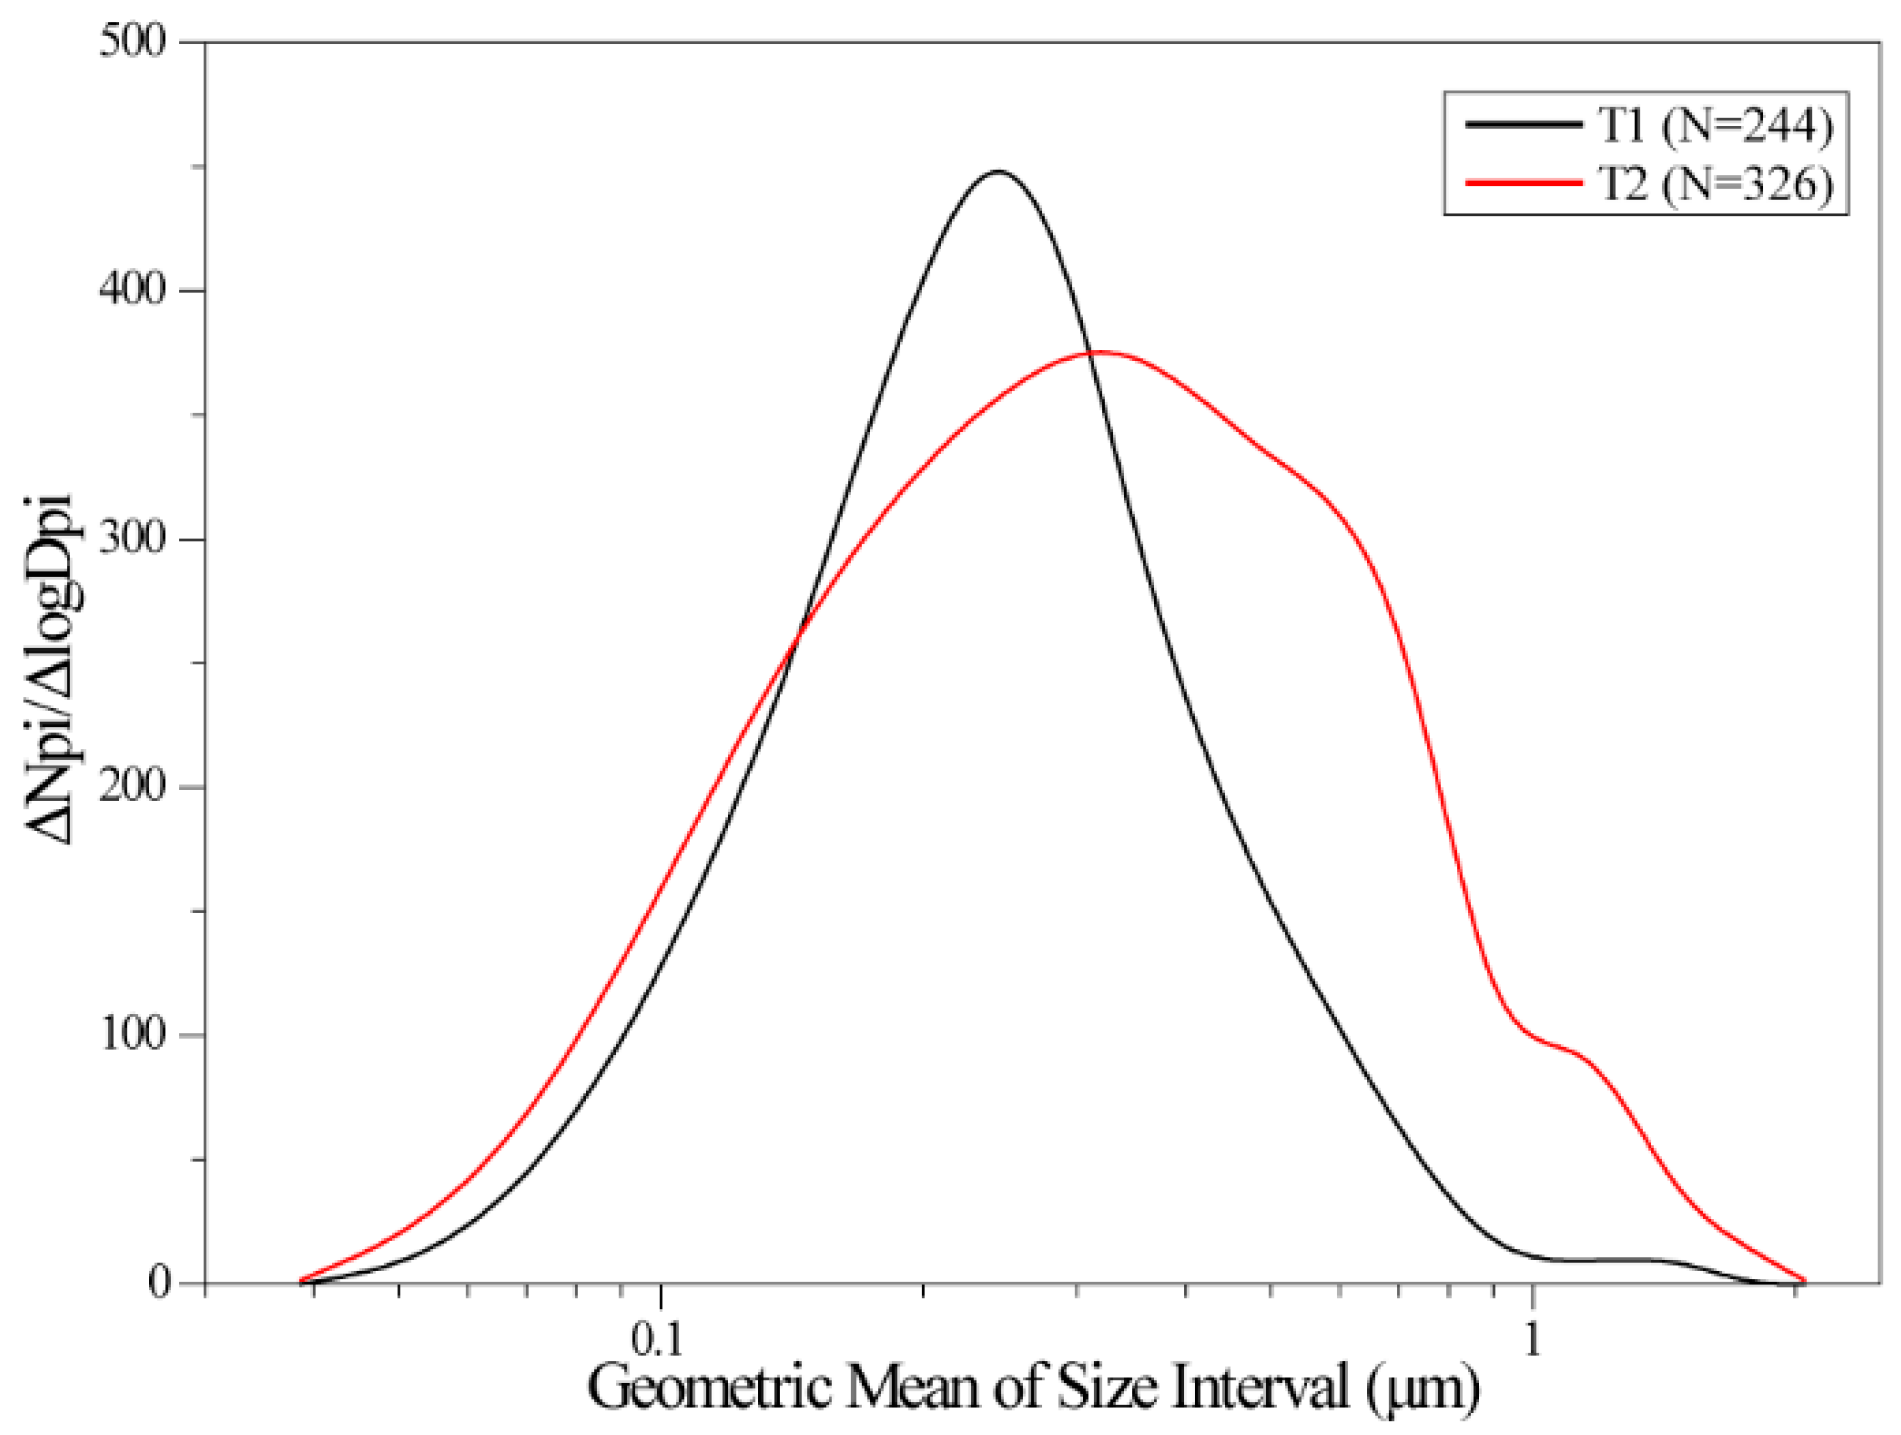
Figure 6 shows that the size distribution of S-rich particles ranged from 0.04 to 1.5 μm with a median diameter of 0.24 μm at the T1 site, and from 0.04 μm to 1.6 μm with a median size of 0.31 μm at the T2 site. The size distribution of aerosol particles displays a broader peak at the T2 site than at the T1 site (
Figure 6). In addition, TEM images show that most of the S-rich particles were internally mixed with OM particles (
Figure 2). As we expected, long-range transport of air masses induced larger median size and broader peak in size distribution of individual particles at the T2 site than at the T1 site because additional secondary inorganic aerosols forming during long-range transports occurred on primary OM particles.
4. Discussion
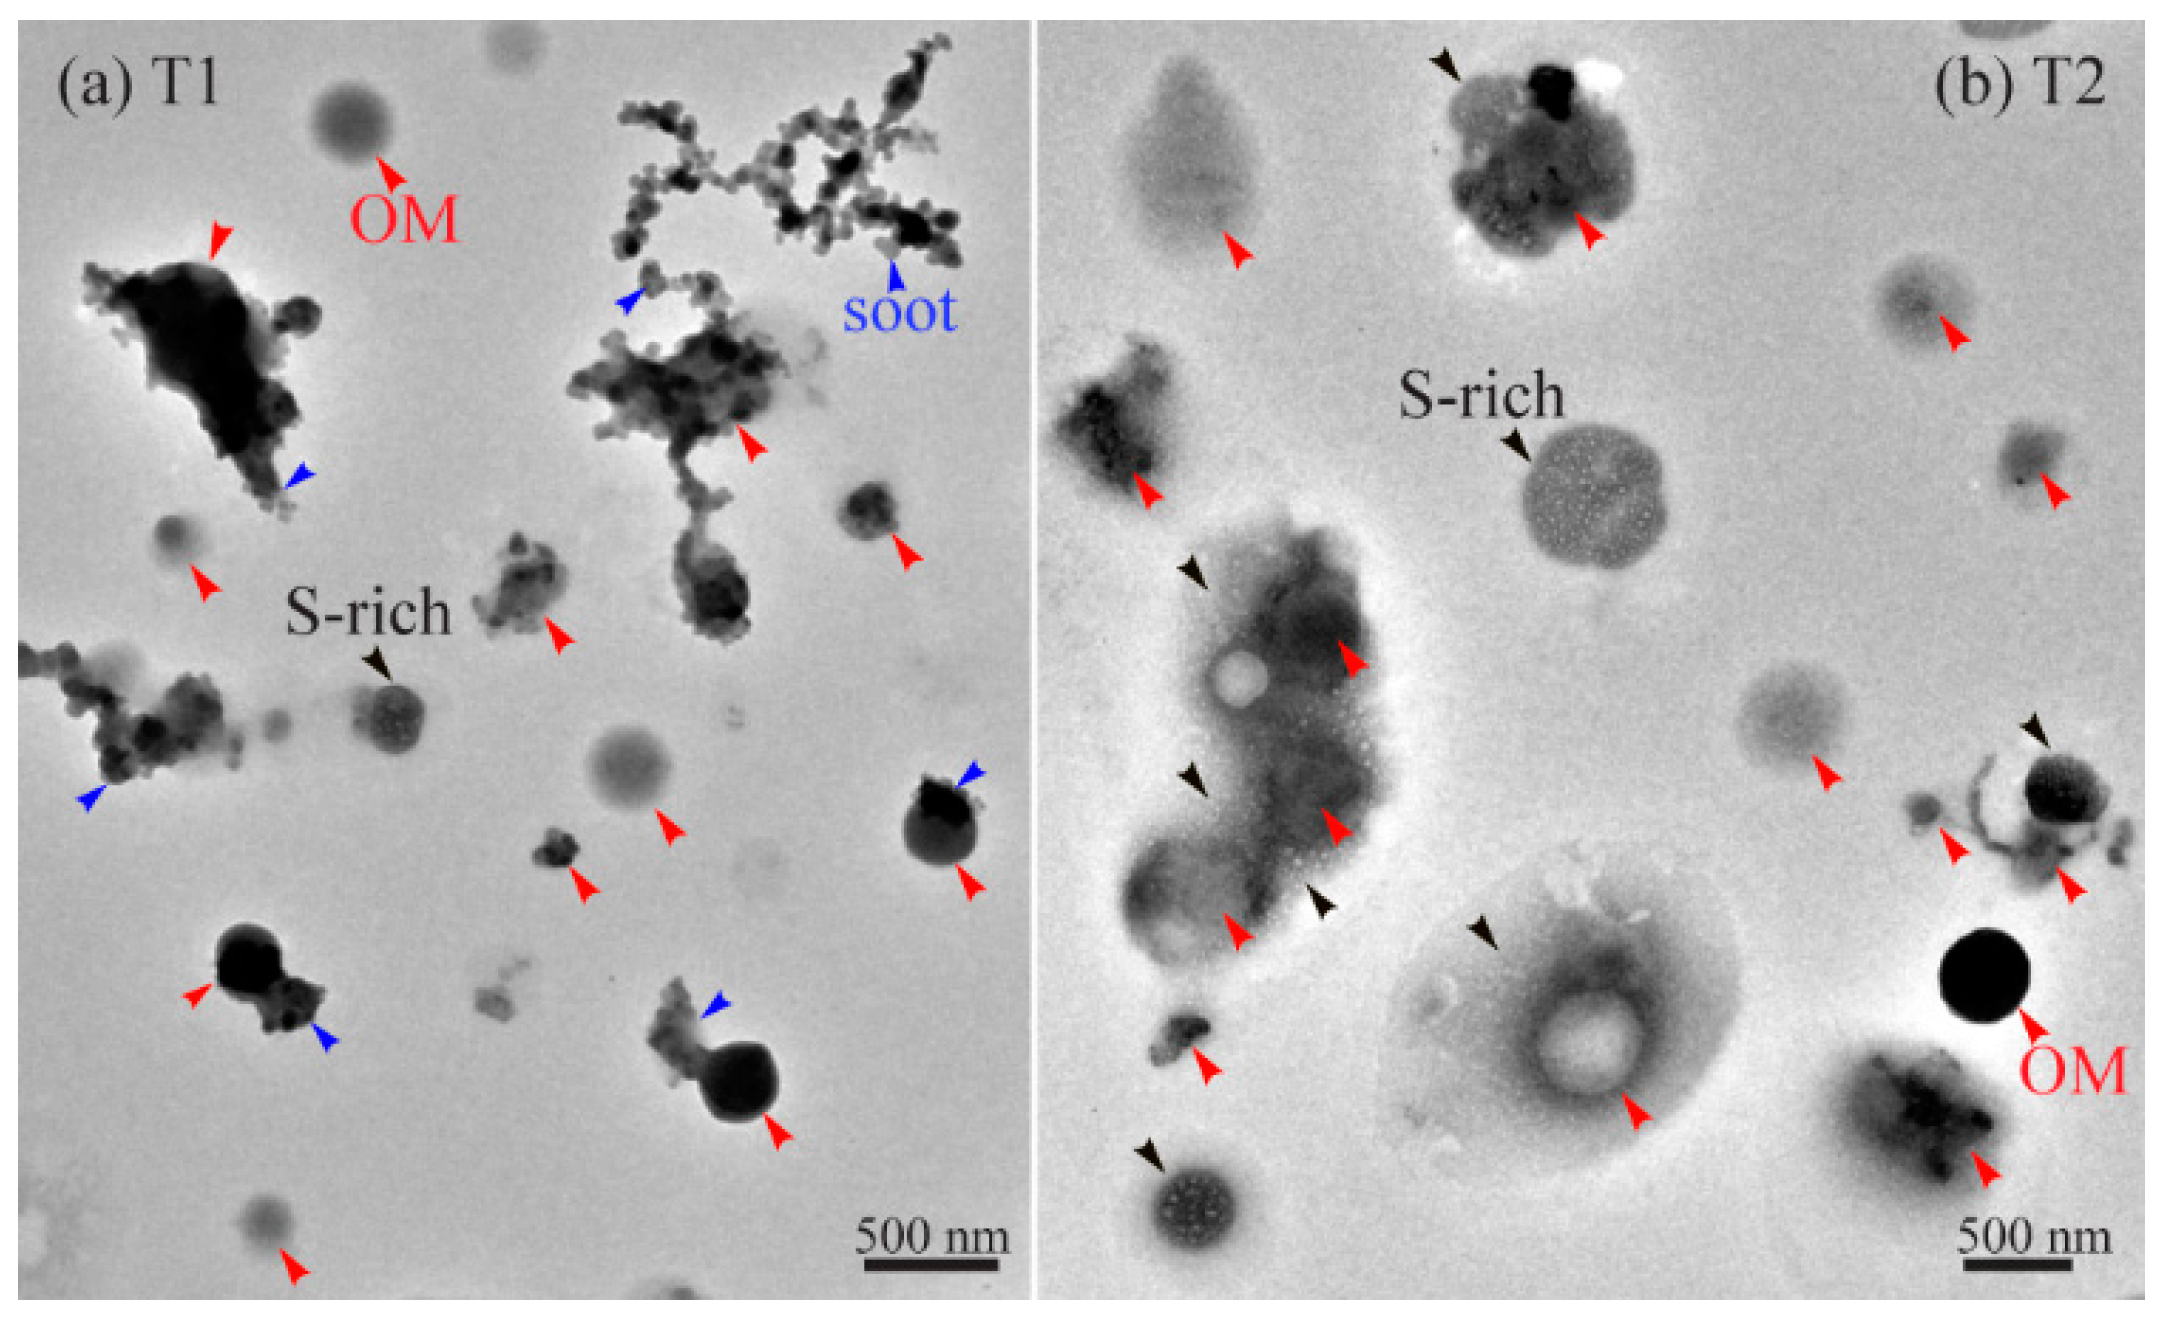
Based on the locations of the two sampling sites, we can know that air quality at the T1 site was influenced by anthropogenic air pollutants from long-range transport and local towns, and at the T2 site from long-range transport. The analyses were consistent with our results from TEM observations. We found more secondary particles (e.g., S-rich) and lesser primary soot particles at the T2 site than at the T1 site (
Figure 5 and
Figure 7). In addition, these S-rich particles were internally mixed with primary OM particles at the T2 site (
Figure 2b–d), thereby suggesting that OM particles become more aged during long-range transport.
Compared with haze particles collected in the North China Plain, our study did not observe fly ash and metal, but more abundance of OM-dominated particles [
23,
24]. As a result, we can exclude regional contribution from emissions of heavy industries and coal-fired power plants in upwind areas. TEM observations suggested that most of the OM-dominated particles were directly emitted from sources. In this study, we considered OM-dominated particles sourced from coal-burning for household heating and cooking at the T1 site [
25]. Abundant OM-dominated particles at the T2 site likely were transported from villages and towns where people mainly used coals from household heating and cooking in the western part of Northeast China in winter [
12]. In addition, the central heating from filter boilers are only supplied in the central part of the town and people in most areas of the town still used stoves for household heating. In rural areas, most of the people living in the villages used coal-burning stoves for household heating and cooking. Coal combustion in low-efficiency stoves for residential heating and cooking was considered to be an important source of air pollution in China [
26]. Based on our investigation, similar phenomena appear to occur in all the small towns and rural villages in western part of Northeast China (
Figure 1). As discussed in the previous report, the direct emissions from coal-burning stoves have several times higher emissions than filter boilers [
27].
We noticed that 6%–7% of K-rich particles which are a tracer of biomass burning occurred at the T1 site and T2 site (
Figure 5). In rural areas of Northeast China, the biomass materials (e.g., maize stalks and wheat straws) are often used for cooking in all seasons and for household heating from winter to spring [
11]. Our results indicate that the regional contribution of biomass burning emissions should be far smaller than the contribution from coal burning emissions. However, the similar abundance of K-rich particles from the T1 and T2 sites indicated that continuous contributions from biomass burning emissions in villages should not be ignored in the whole Northeast China region.
5. Conclusions
Individual fine particles were collected at a suburban county town site (T1) and a background rural site (T2) in Northeast China during wintertime. Four types of individual fine particles such as S-rich, OM-dominated, soot, and K-rich particles were identified based on their morphology and composition. In the ambient air, most particles were internally mixed particles, which refers to particles that are composed of more than two types of particles. In particular, large amounts of visible primary spherical or irregular OM particles occurred at sites and were internally mixed with S-rich, soot, or K-rich particles. The phenomenon was quite different from the previous studies which suggested that secondary particles were dominant in the air in North China.
Our results revealed that OM particles were the most abundant aerosol particles, accounting for 60.7% and 53.5% of the particles at the T1 site and the T2 site, respectively. Abundant OM particles at the two sites suggested that they have similar emission sources at the background and town areas. Our investigations suggested that coal-burning for household heating and cooking in winter is likely the main source. We noticed a similar small fraction of K-rich particles (6%–7%) at the two sites, suggesting that regional contribution of biomass burning should be considered in the western part of Northeast China. Similar to coal-burning, these biomass burnings were used for household heating and cooking in rural areas. In comparing the aerosol particles at the two sampling sites, soot particles decrease from 16.9% at the T1 site to 4.6% at the T2 site and sulfate particles decrease from 35.9% at the T2 site to 15.7% at the T1 site. These results suggested that long-range transport particles experienced more aging processes and produced more secondary particles. We believe that the emissions from coal-burning for household heating and cooking can induce regional haze formation in the western part of Northeast China. In the future, central household heating with filtered boilers should be widely installed in towns in the western part of Northeast China.
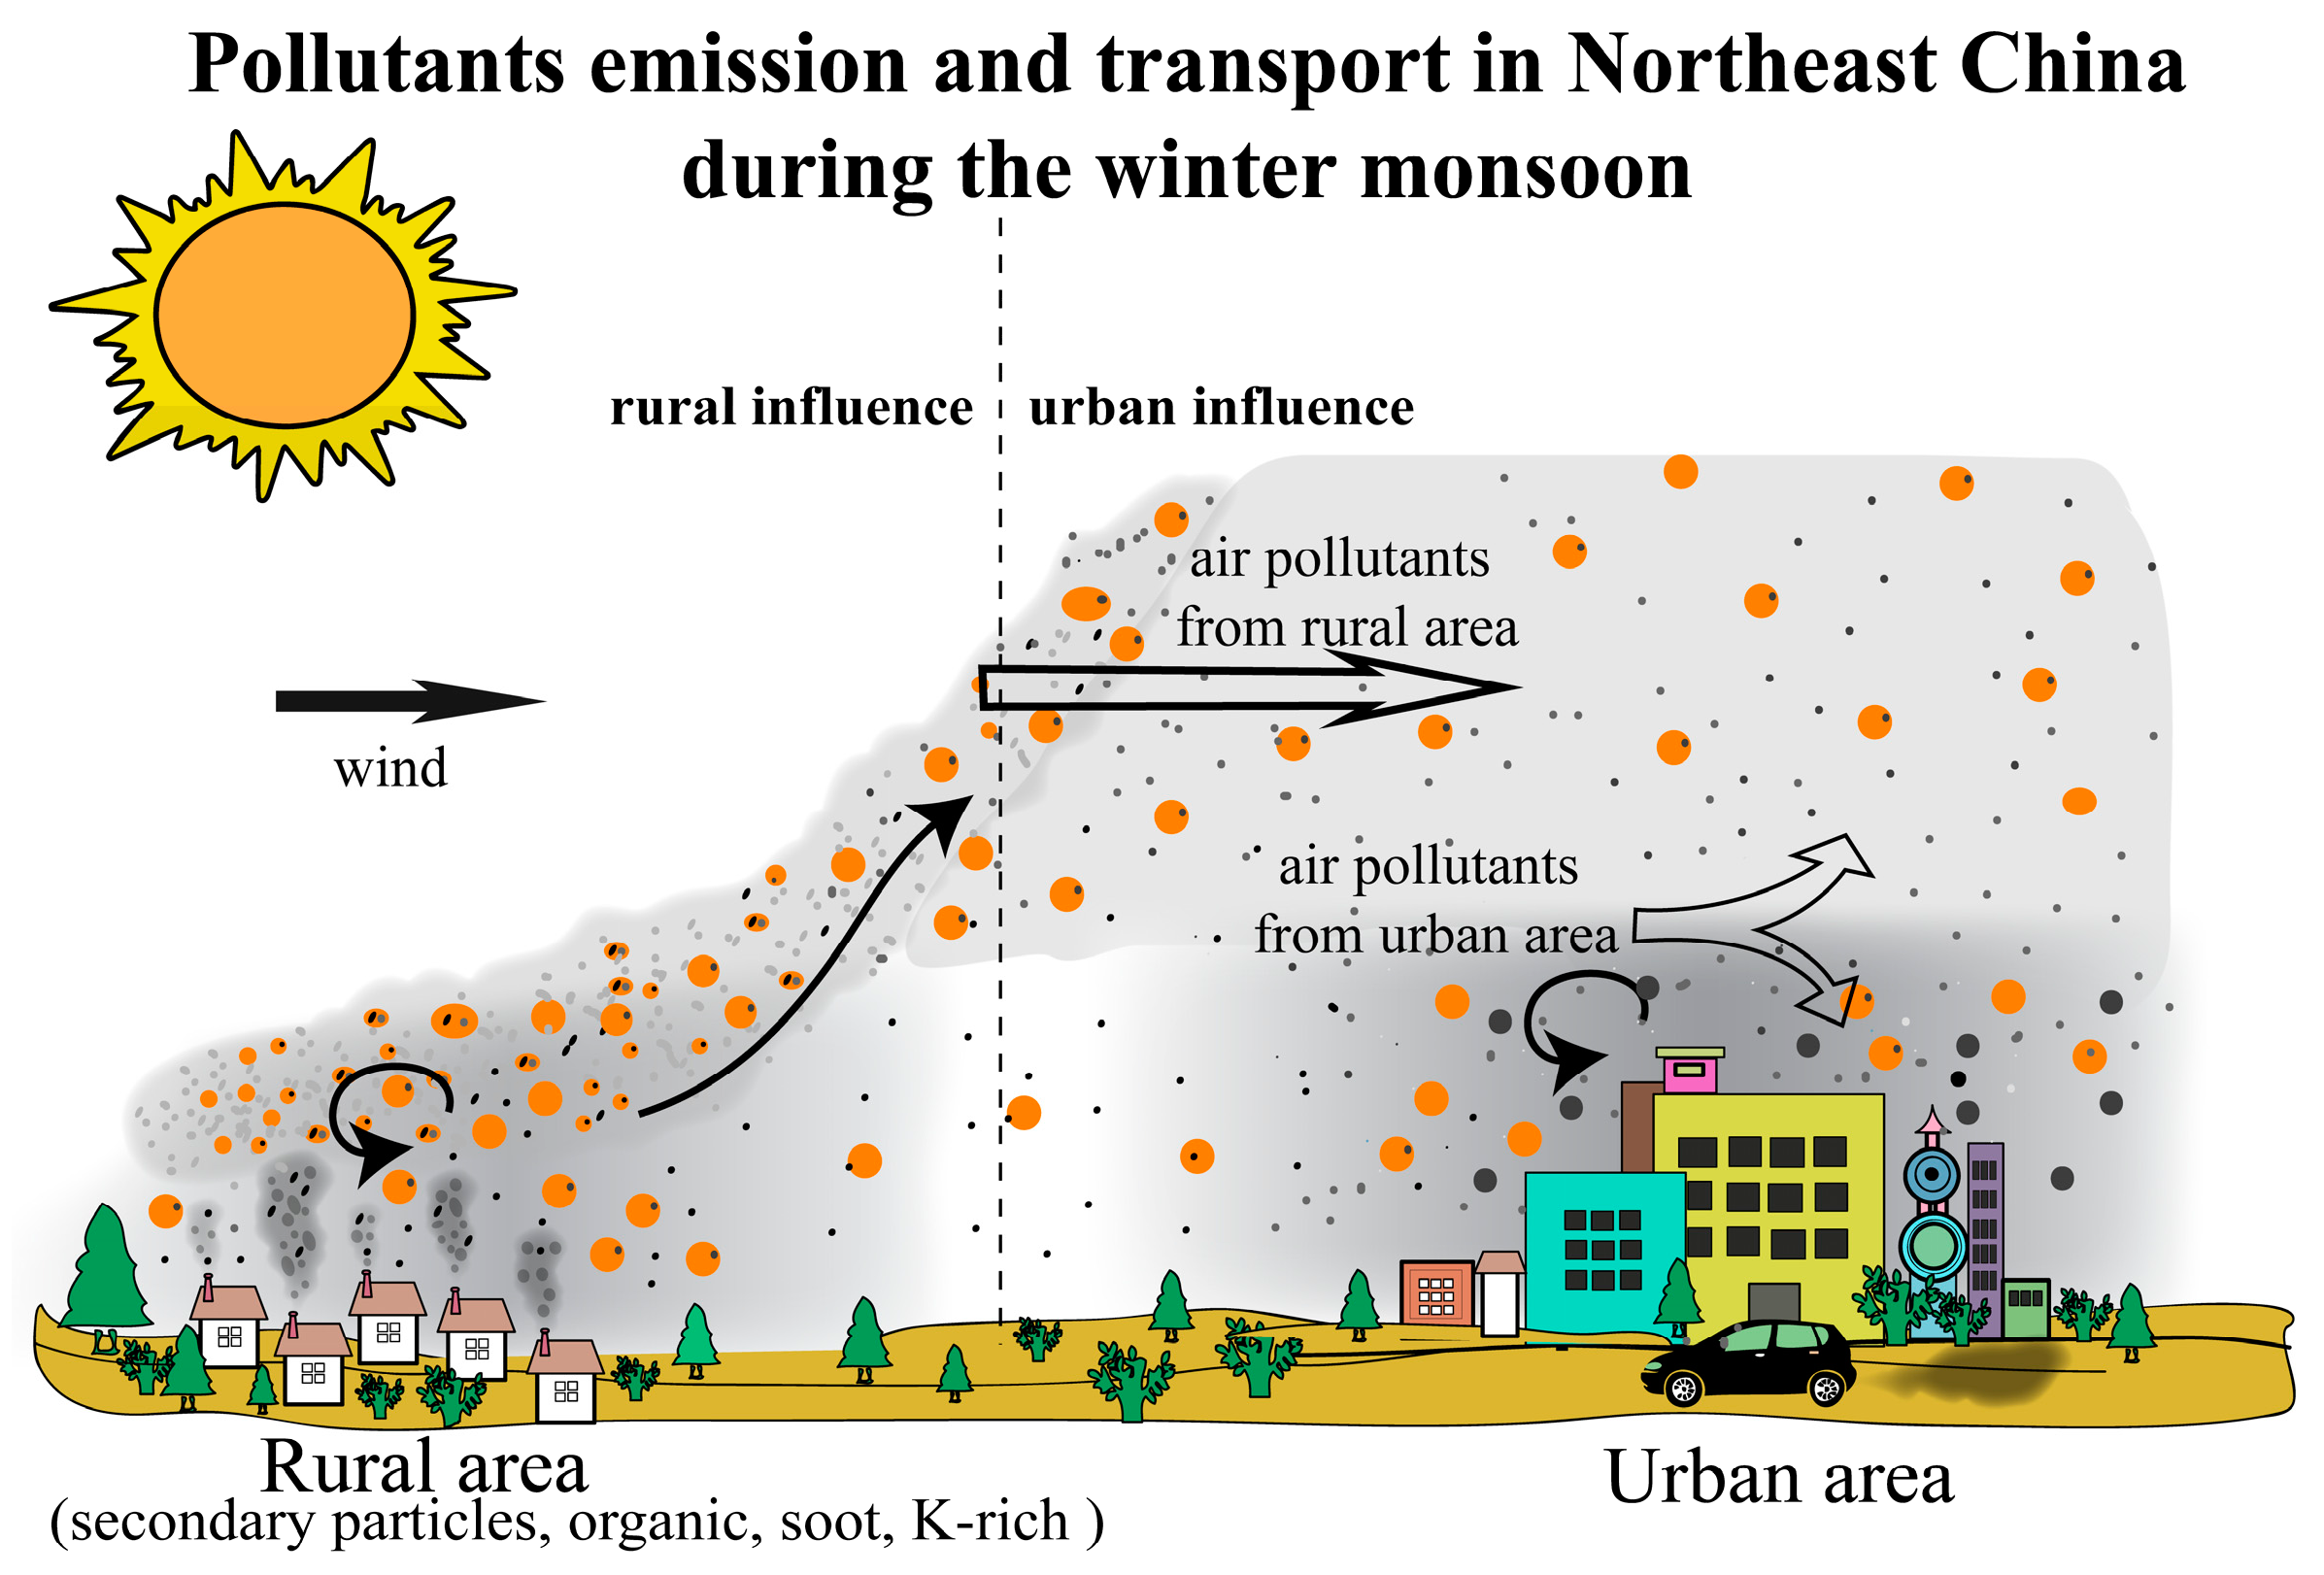
In this study, we focused on sources and the formation of haze particles in a rural influence area of Northeast China (
Figure 1). We further integrated our findings and regional air transports in winter in Northeast China. A conceptual model was proposed that can reflect emission and transport of air pollutants from western to eastern parts in Northeast China following the winter monsoon (
Figure 8). It is interesting that the conceptual model shows that the anthropogenic pollutants emitted from a rural influence area can be transported and further impact the air quality of an urban influence area in Northeast China. The result is different from the traditional perspective that anthropogenic pollutants in urban areas influence the air quality of rural areas. Therefore, further study is needed to work on the extent to which the air quality of the urban influence areas are impacted through the transportation of pollutants from rural influence areas in winter in Northeast China.
Supplementary Materials
The following are available online at
www.mdpi.com/2073-4433/8/3/47/s1. Figure S1: Forty-eight hour air mass backward trajectory for the T1 site and T2 site during our sampling period; Figure S2: China Meteorological Administration haze forecast map at 3 February 2015; Figure S3: Particulate matter (PM) concentration for Baicheng (a) and Tongliao (b), two cities which were close to our sampling sites.
Acknowledgments
This work was funded by grants from the National Natural Science Foundation of China (41575116 and 41622504), Shandong Provincial Science Fund for Distinguished Young Scholars, China (JQ201413), and Programs of Shandong University (2015WLJH37).
Author Contributions
Weijun Li and Liang Xu conceived and designed the experiments; Yong Ren, Xin Wang did the samples collection; Jian Zhang carried out TEM measurements; Lei Liu, Jian Zhang and Yinxiao Zhang carried out data analysis; Liang Xu and Weijun Li wrote the paper.
Conflicts of Interest
The authors declare no conflict of interest.
References
- West, J.J.; Cohen, A.; Dentener, F.; Brunekreef, B.; Zhu, T.; Armstrong, B.; Bell, M.L.; Brauer, M.; Carmichael, G.; Costa, D.L.; et al. What We Breathe Impacts Our Health: Improving Understanding of the Link between Air Pollution and Health. Environ. Sci. Technol. 2016, 50, 4895–4904. [Google Scholar] [CrossRef] [PubMed]
- Geng, H.; Kang, S.; Jung, H.J.; Choël, M.; Kim, H.; Ro, C.U. Characterization of individual submicrometer aerosol particles collected in Incheon, Korea, by quantitative transmission electron microscopy energy-dispersive X-ray spectrometry. J. Geophys. Res. 2010, 115. [Google Scholar] [CrossRef]
- Heald, C.L.; Jacob, D.J.; Park, R.J.; Alexander, B.; Fairlie, T.D.; Yantosca, R.M.; Chu, D.A. Transpacific transport of Asian anthropogenic aerosols and its impact on surface air quality in the United States. J. Geophys. Res. 2006, 111. [Google Scholar] [CrossRef] [Green Version]
- Lin, J.; Pan, D.; Davis, S.J.; Zhang, Q.; He, K.; Wang, C.; Streets, D.G.; Wuebbles, D.J.; Guan, D. China’s international trade and air pollution in the United States. Proc. Natl. Acad. Sci. USA 2014, 111, 1736–1741. [Google Scholar] [CrossRef] [PubMed]
- Huang, R.J.; Zhang, Y.; Bozzetti, C.; Ho, K.F.; Cao, J.J.; Han, Y.; Daellenbach, K.R.; Slowik, J.G.; Platt, S.M.; Canonaco, F.; et al. High secondary aerosol contribution to particulate pollution during haze events in China. Nature 2014, 514, 218–222. [Google Scholar] [CrossRef] [PubMed]
- Guo, S.; Hu, M.; Zamora, M.L.; Peng, J.; Shang, D.; Zheng, J.; Du, Z.; Wu, Z.; Shao, M.; Zeng, L.; et al. Elucidating severe urban haze formation in China. Proc. Natl. Acad. Sci. USA 2014, 111, 17373–17378. [Google Scholar] [CrossRef] [PubMed]
- Zhang, Y.; Hu, M.; Zhong, L.; Wiedensohler, A.; Liu, S.; Andreae, M.; Wang, W.; Fan, S. Regional integrated experiments on air quality over Pearl River Delta 2004 (PRIDE-PRD2004): Overview. Atmos. Environ. 2008, 42, 6157–6173. [Google Scholar] [CrossRef]
- Fu, H.; Zhang, M.; Li, W.; Chen, J.; Wang, L.; Quan, X.; Wang, W. Morphology, composition and mixing state of individual carbonaceous aerosol in urban Shanghai. Atmos. Chem. Phys. 2012, 12, 693–707. [Google Scholar] [CrossRef]
- Zhao, H.; Che, H.; Zhang, X.; Ma, Y.; Wang, Y.; Wang, X.; Liu, C.; Hou, B.; Che, H. Aerosol optical properties over urban and industrial region of Northeast China by using ground-based sun-photometer measurement. Atmos. Environ. 2013, 75, 270–278. [Google Scholar] [CrossRef]
- Wu, Y.; Zhu, J.; Che, H.; Xia, X.; Zhang, R. Column-integrated aerosol optical properties and direct radiative forcing based on sun photometer measurements at a semi-arid rural site in Northeast China. Atmos. Res. 2015, 157, 56–65. [Google Scholar] [CrossRef]
- Shen, Z.; Wang, X.; Zhang, R.; Ho, K.; Cao, J.; Zhang, M. Chemical composition of water-soluble ions and carbonate estimation in spring aerosol at a semi-arid site of Tongyu, China. Aerosol Air Qual. Res. 2011, 11, 360–368. [Google Scholar] [CrossRef]
- Zhang, R.; Tao, J.; Ho, K.; Shen, Z.; Wang, G.; Cao, J.; Liu, S.; Zhang, L.; Lee, S. Characterization of atmospheric organic and elemental carbon of PM2.5 in a typical semi-arid area of Northeastern China. Aerosol Air Qual. Res. 2012, 12. [Google Scholar] [CrossRef]
- Adachi, K.; Buseck, P.R. Internally mixed soot, sulfates, and organic matter in aerosol particles from Mexico City. Atmos. Chem. Phys. 2008, 8, 6469–6481. [Google Scholar] [CrossRef]
- Li, W.; Sun, J.; Xu, L.; Shi, Z.; Riemer, N.; Sun, Y.; Fu, P.; Zhang, J.; Lin, Y.; Wang, X.; et al. A conceptual framework for mixing structures in individual aerosol particles. J. Geophys. Res. 2016, 121, 13784–13798. [Google Scholar] [CrossRef]
- Bi, X.; Zhang, G.; Li, L.; Wang, X.; Li, M.; Sheng, G.; Fu, J.; Zhou, Z. Mixing state of biomass burning particles by single particle aerosol mass spectrometer in the urban area of PRD, China. Atmos. Environ. 2011, 45, 3447–3453. [Google Scholar] [CrossRef]
- Niu, H.; Shao, L.; Zhang, D. Soot particles at an elevated site in eastern China during the passage of a strong cyclone. Sci. Total Environ. 2012, 430, 217–222. [Google Scholar] [CrossRef] [PubMed]
- China, S.; Scarnato, B.; Owen, R.C.; Zhang, B.; Ampadu, M.T.; Kumar, S.; Dzepina, K.; Dziobak, M.P.; Fialho, P.; Perlinger, J.A. Morphology and mixing state of aged soot particles at a remote marine free troposphere site: Implications for optical properties. Geophys. Res. Lett. 2015, 42, 1243–1250. [Google Scholar] [CrossRef]
- Buseck, P.R.; Adachi, K.; Gelencsér, A.; Tompa, É.; Pósfai, M. Ns-Soot: A Material-Based Term for Strongly Light-Absorbing Carbonaceous Particles. Aerosol Sci. Technol. 2014, 48, 777–788. [Google Scholar] [CrossRef]
- Chen, S.; Xu, L.; Zhang, Y.; Chen, B.; Wang, X.; Zhang, X.; Zheng, M.; Chen, J.; Wang, W.; Sun, Y.; et al. Direct observations of organic aerosols in common wintertime hazes in North China: Insights into direct emissions from Chinese residential stoves. Atmos. Chem. Phys. 2017, 17, 1259–1270. [Google Scholar] [CrossRef]
- Adachi, K.; Zaizen, Y.; Kajino, M.; Igarashi, Y. Mixing state of regionally transported soot particles and the coating effect on their size and shape at a mountain site in Japan. J. Geophys. Res. 2014, 119, 5386–5396. [Google Scholar] [CrossRef]
- Moffet, R.C.; Rödel, T.; Kelly, S.T.; Yu, X.-Y.; Carroll, G.; Fast, J.; Zaveri, R.A.; Laskin, A.; Gilles, M.K. Spectro-microscopic measurements of carbonaceous aerosol aging in Central California. Atmos. Chem. Phys. 2013, 13, 10445–10459. [Google Scholar] [CrossRef] [Green Version]
- Niu, H.; Hu, W.; Zhang, D.; Wu, Z.; Guo, S.; Pian, W.; Cheng, W.; Hu, M. Variations of fine particle physiochemical properties during a heavy haze episode in the winter of Beijing. Sci. Total Environ. 2016, 571, 103–109. [Google Scholar] [CrossRef] [PubMed]
- Li, W.; Zhou, S.; Wang, X.; Xu, Z.; Yuan, C.; Yu, Y.; Zhang, Q.; Wang, W. Integrated evaluation of aerosols from regional brown hazes over northern China in winter: Concentrations, sources, transformation, and mixing states. J. Geophys. Res. 2011. [Google Scholar] [CrossRef]
- Li, W.J.; Zhang, D.Z.; Shao, L.Y.; Zhou, S.Z.; Wang, W.X. Individual particle analysis of aerosols collected under haze and non-haze conditions at a high-elevation mountain site in the North China plain. Atmos. Chem. Phys. 2011, 11, 11733–11744. [Google Scholar] [CrossRef] [Green Version]
- Shao, L.; Hou, C.; Geng, C.; Liu, J.; Hu, Y.; Wang, J.; Jones, T.; Zhao, C.; BéruBé, K. The oxidative potential of PM10 from coal, briquettes and wood charcoal burnt in an experimental domestic stove. Atmos. Environ. 2016, 127, 372–381. [Google Scholar] [CrossRef]
- Liu, J.; Mauzerall, D.L.; Chen, Q.; Zhang, Q.; Song, Y.; Peng, W.; Klimont, Z.; Qiu, X.; Zhang, S.; Hu, M.; et al. Air pollutant emissions from Chinese households: A major and underappreciated ambient pollution source. Proc. Natl. Acad. Sci. USA 2016, 113, 7756–7761. [Google Scholar] [CrossRef] [PubMed] [Green Version]
- Zhang, Y.; Schauer, J.J.; Zhang, Y.; Zeng, L.; Wei, Y.; Liu, Y.; Shao, M. Characteristics of Particulate Carbon Emissions from Real-World Chinese Coal Combustion. Environ. Sci. Technol. 2008, 42, 5068–5073. [Google Scholar] [CrossRef] [PubMed]
© 2017 by the authors. Licensee MDPI, Basel, Switzerland. This article is an open access article distributed under the terms and conditions of the Creative Commons Attribution (CC BY) license ( http://creativecommons.org/licenses/by/4.0/).


