
Evaluating the Hydrological Cycle over Land Using the Newly-Corrected Precipitation Climatology from the Global Precipitation Climatology Centre (GPCC)


Abstract
:1. Introduction
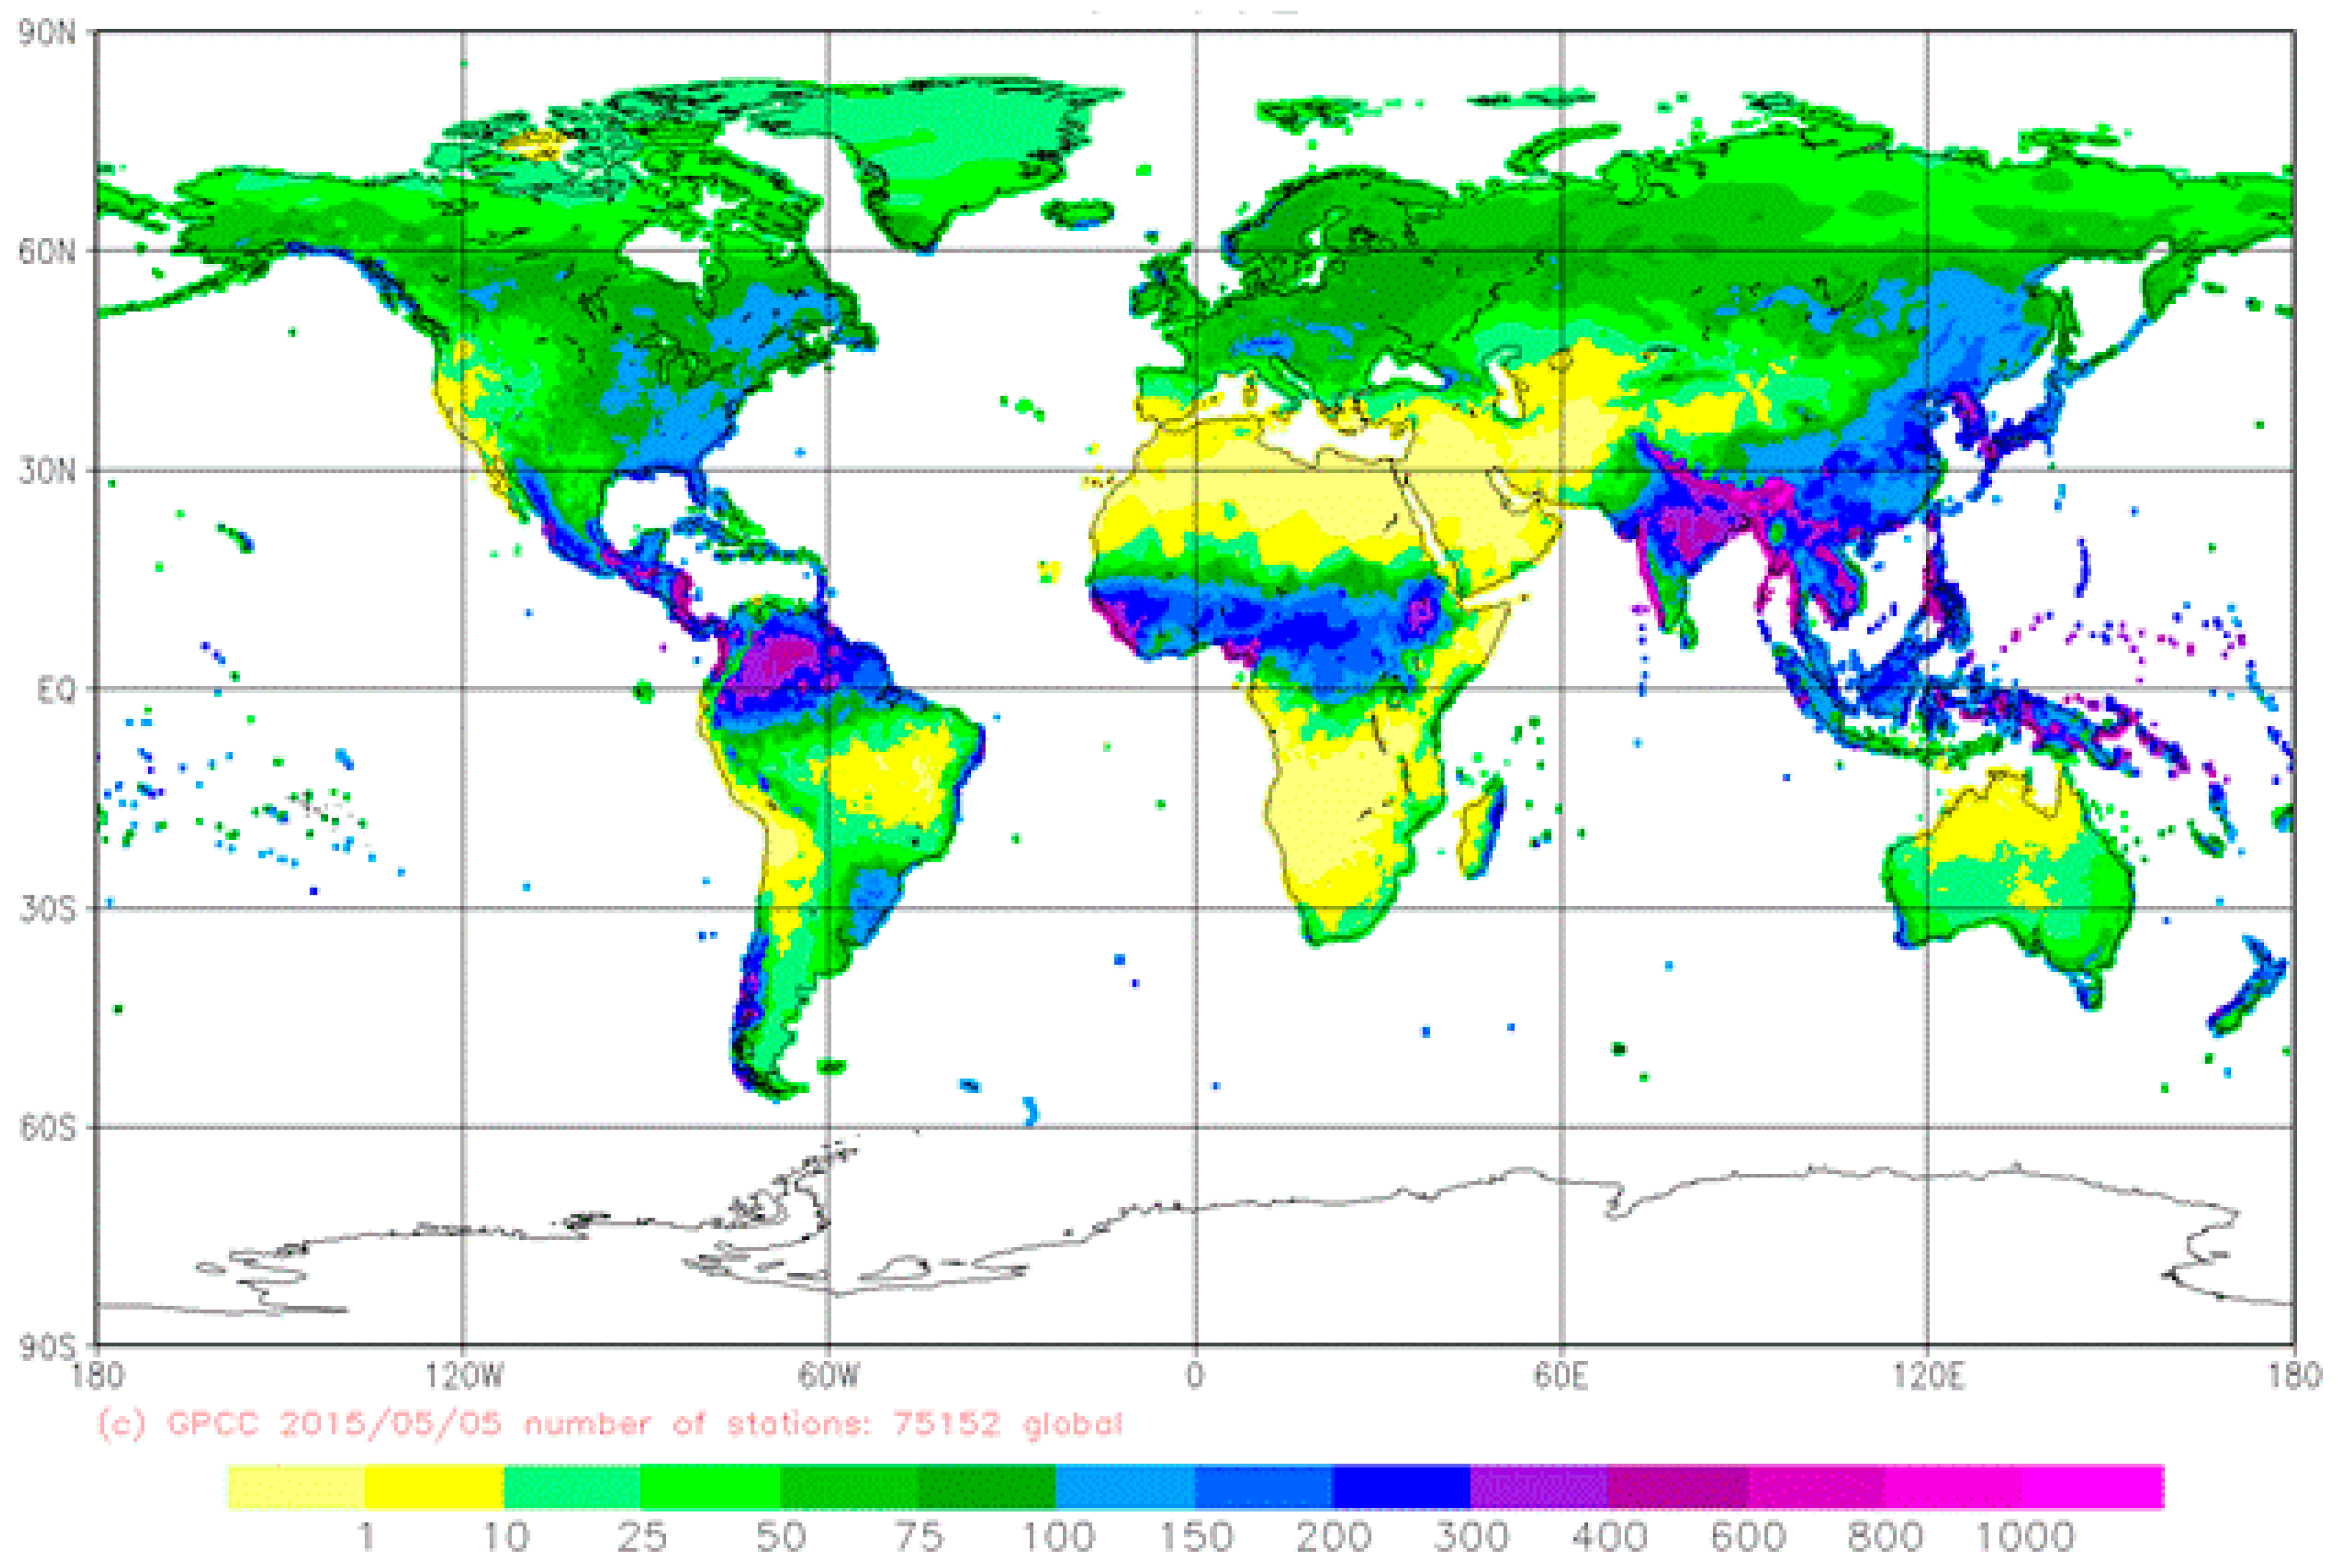
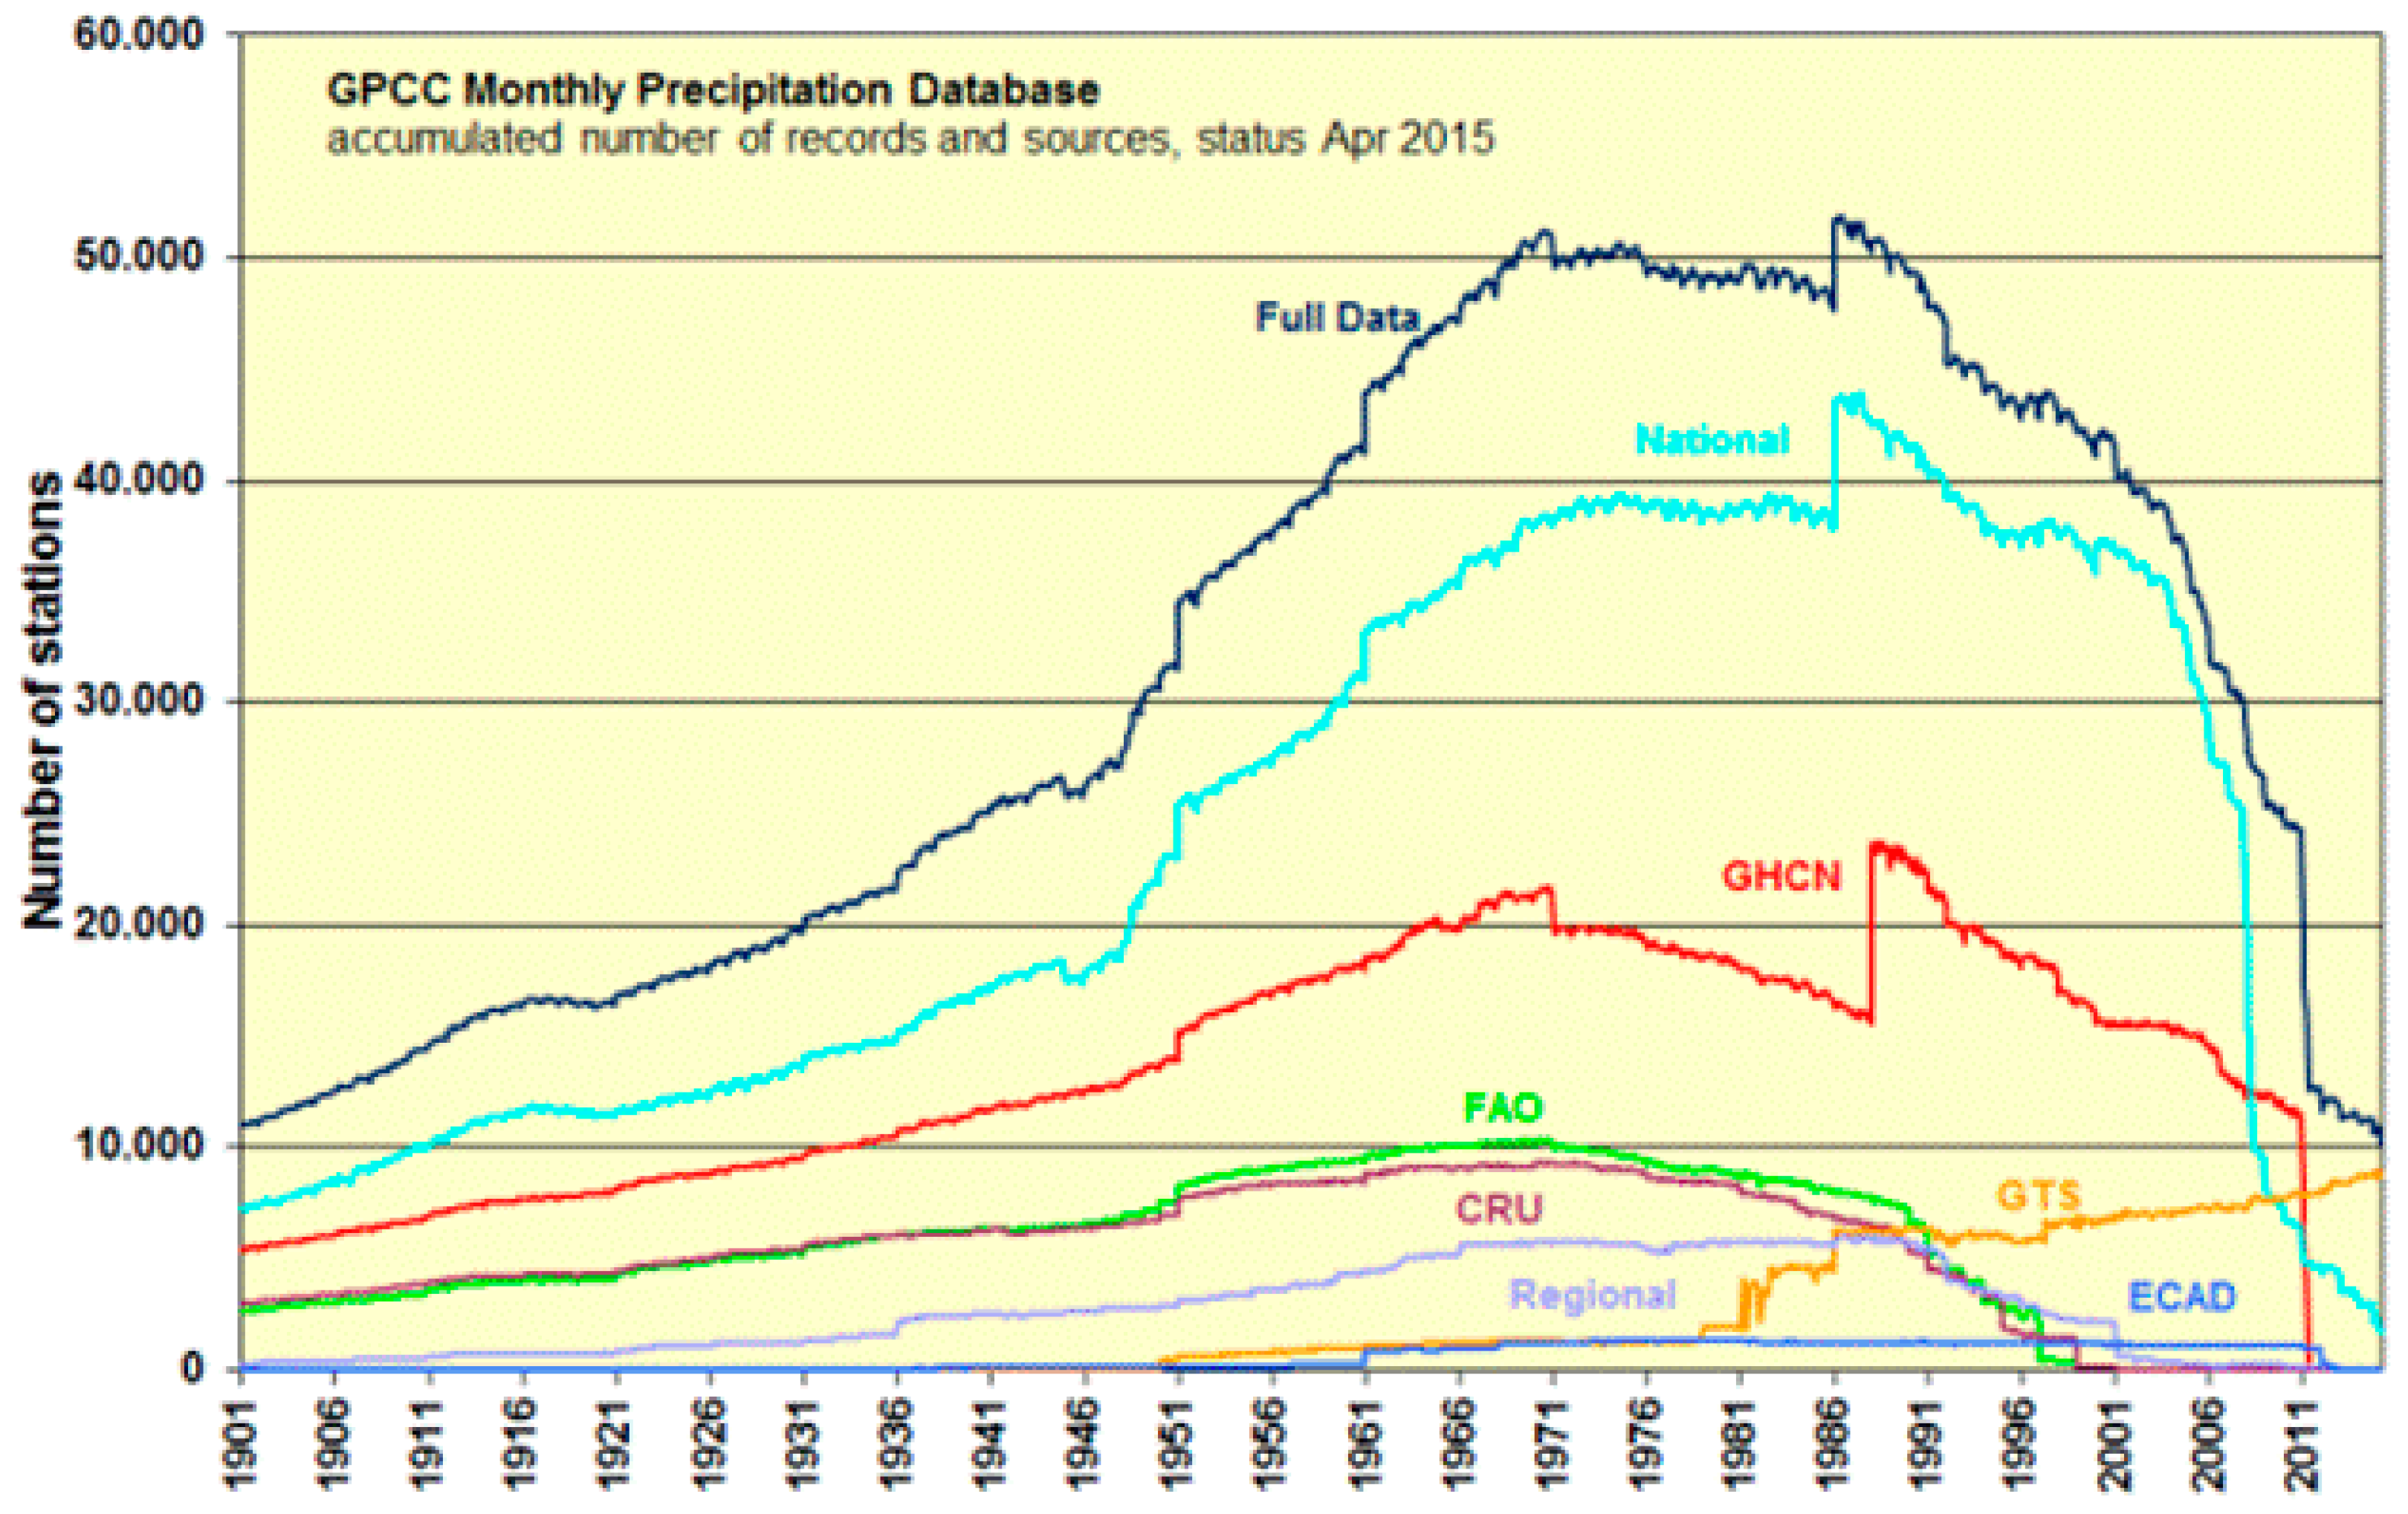
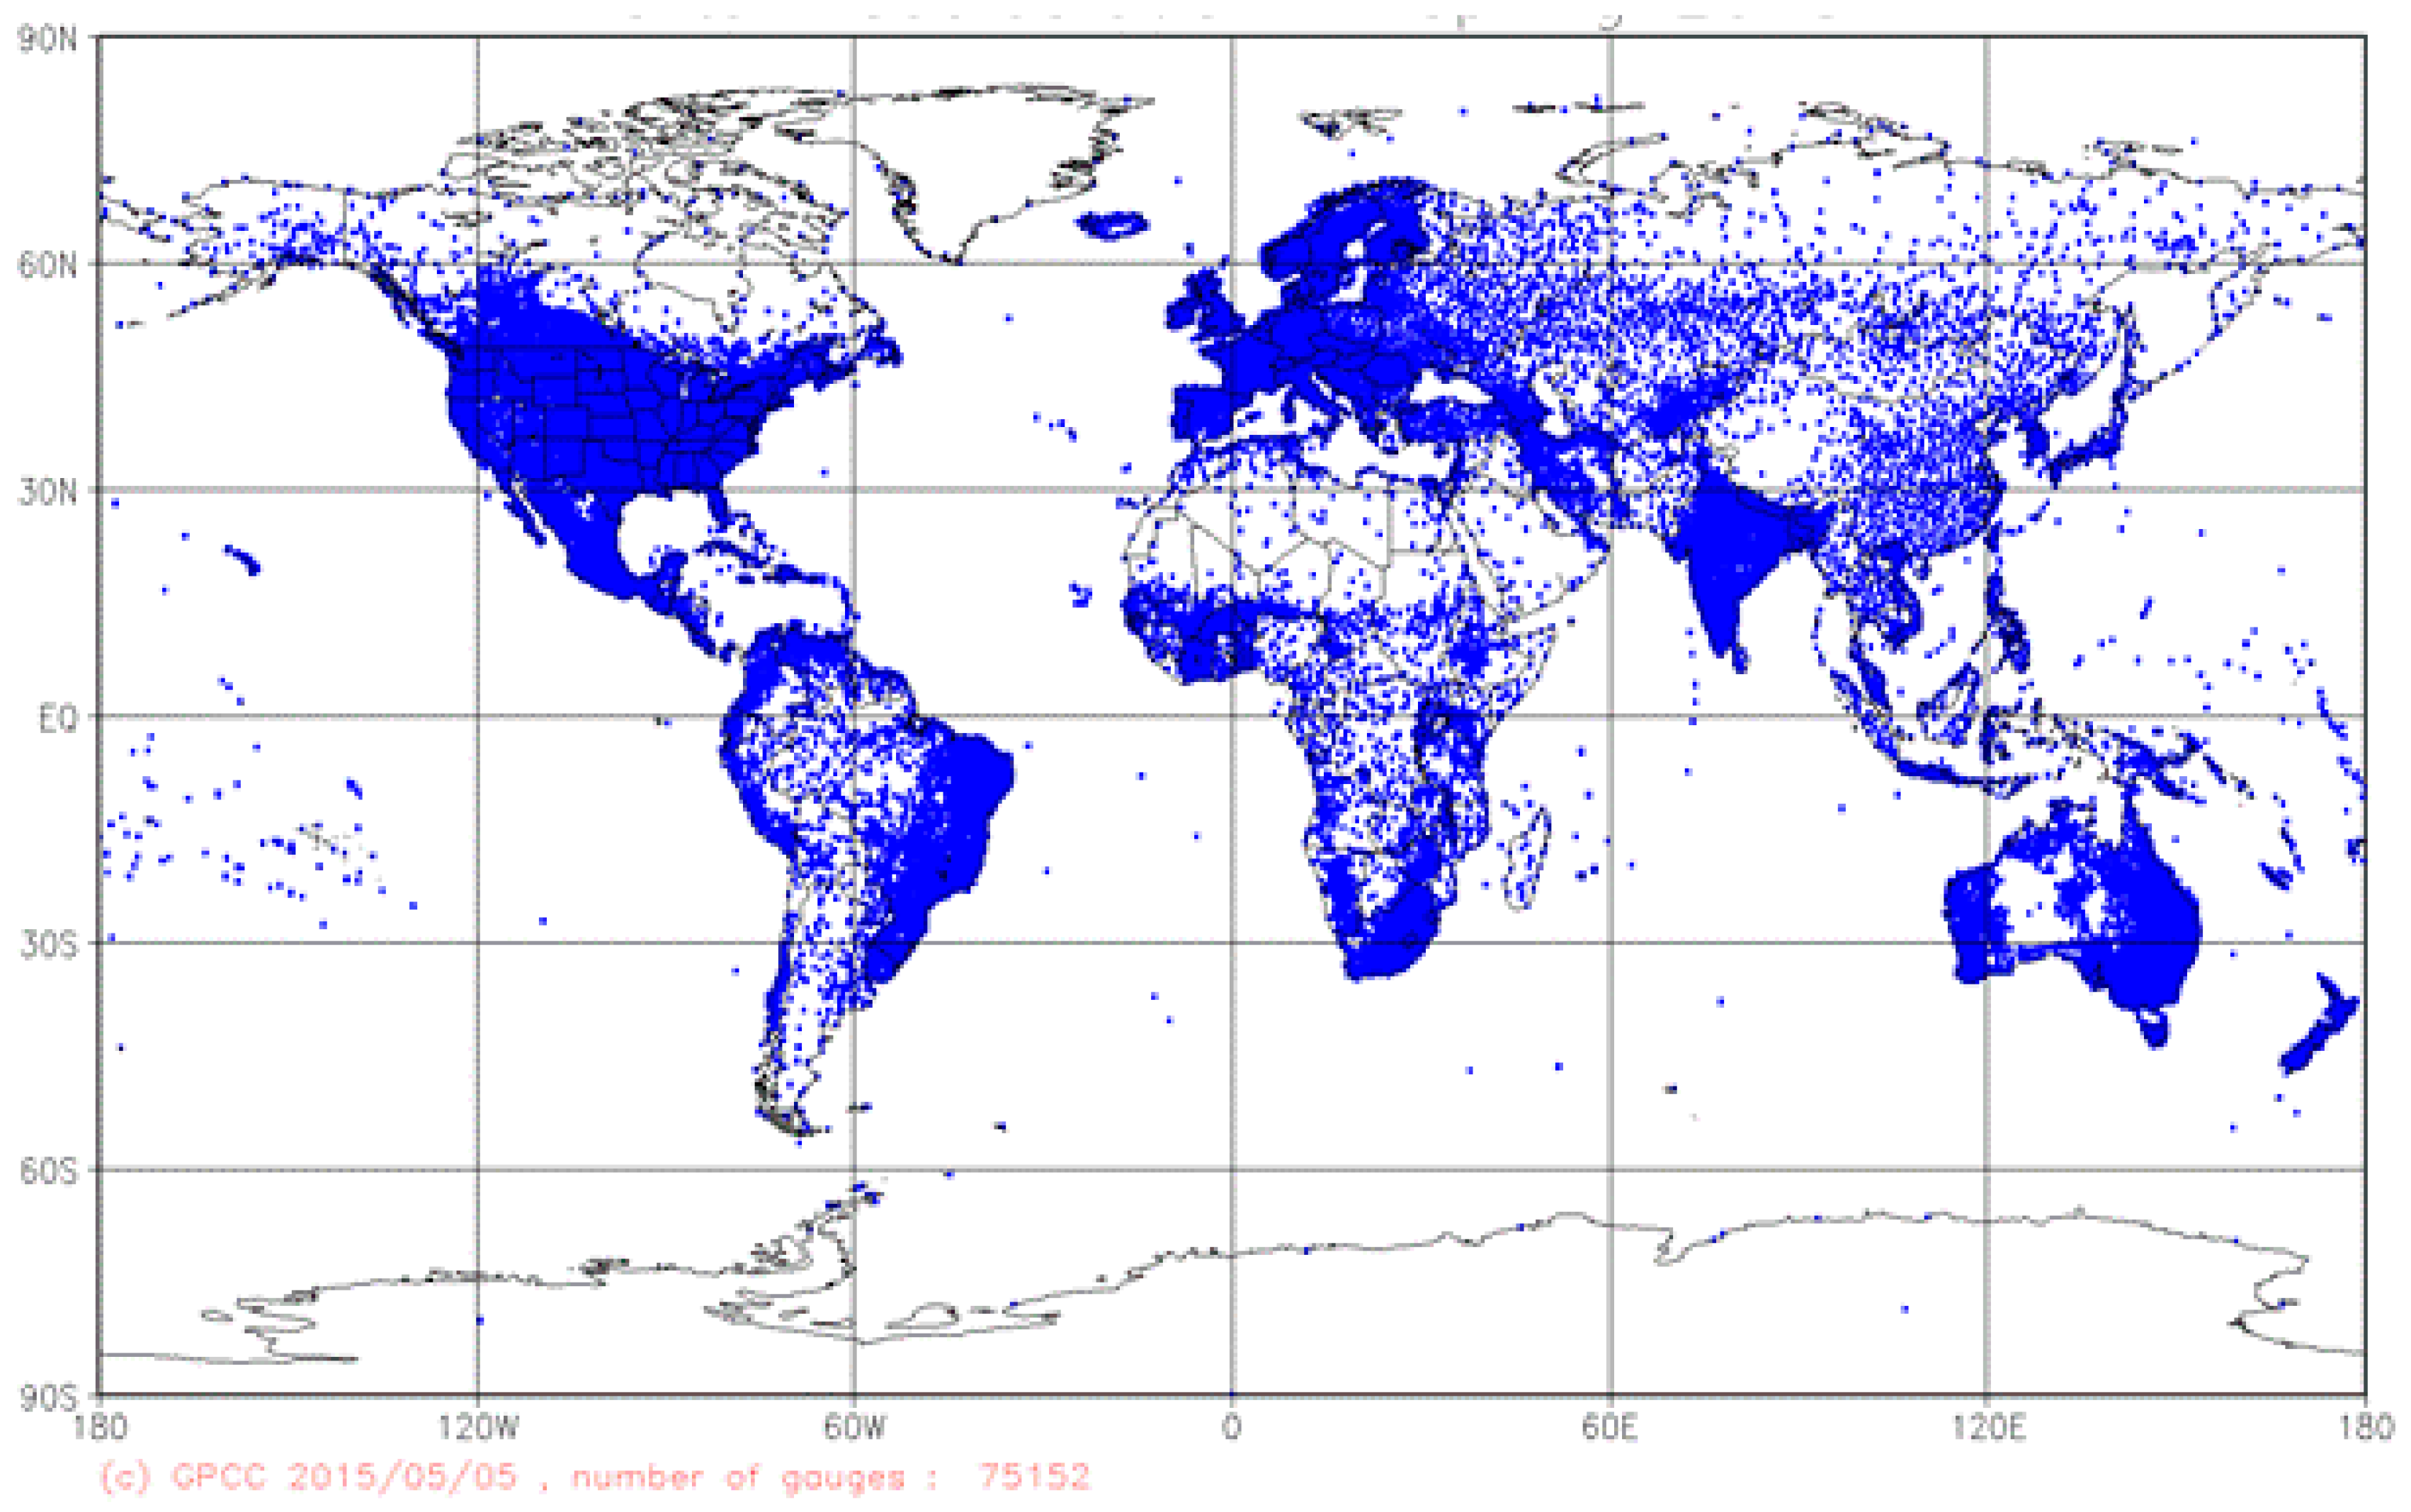
2. GPCC’s Data Base
3. The New 2015 Release of Precipitation Climatology from the GPCC and Comparison to the 2011 Release
3.1. New 2015 Release of GPCC’s Precipitation Climatology
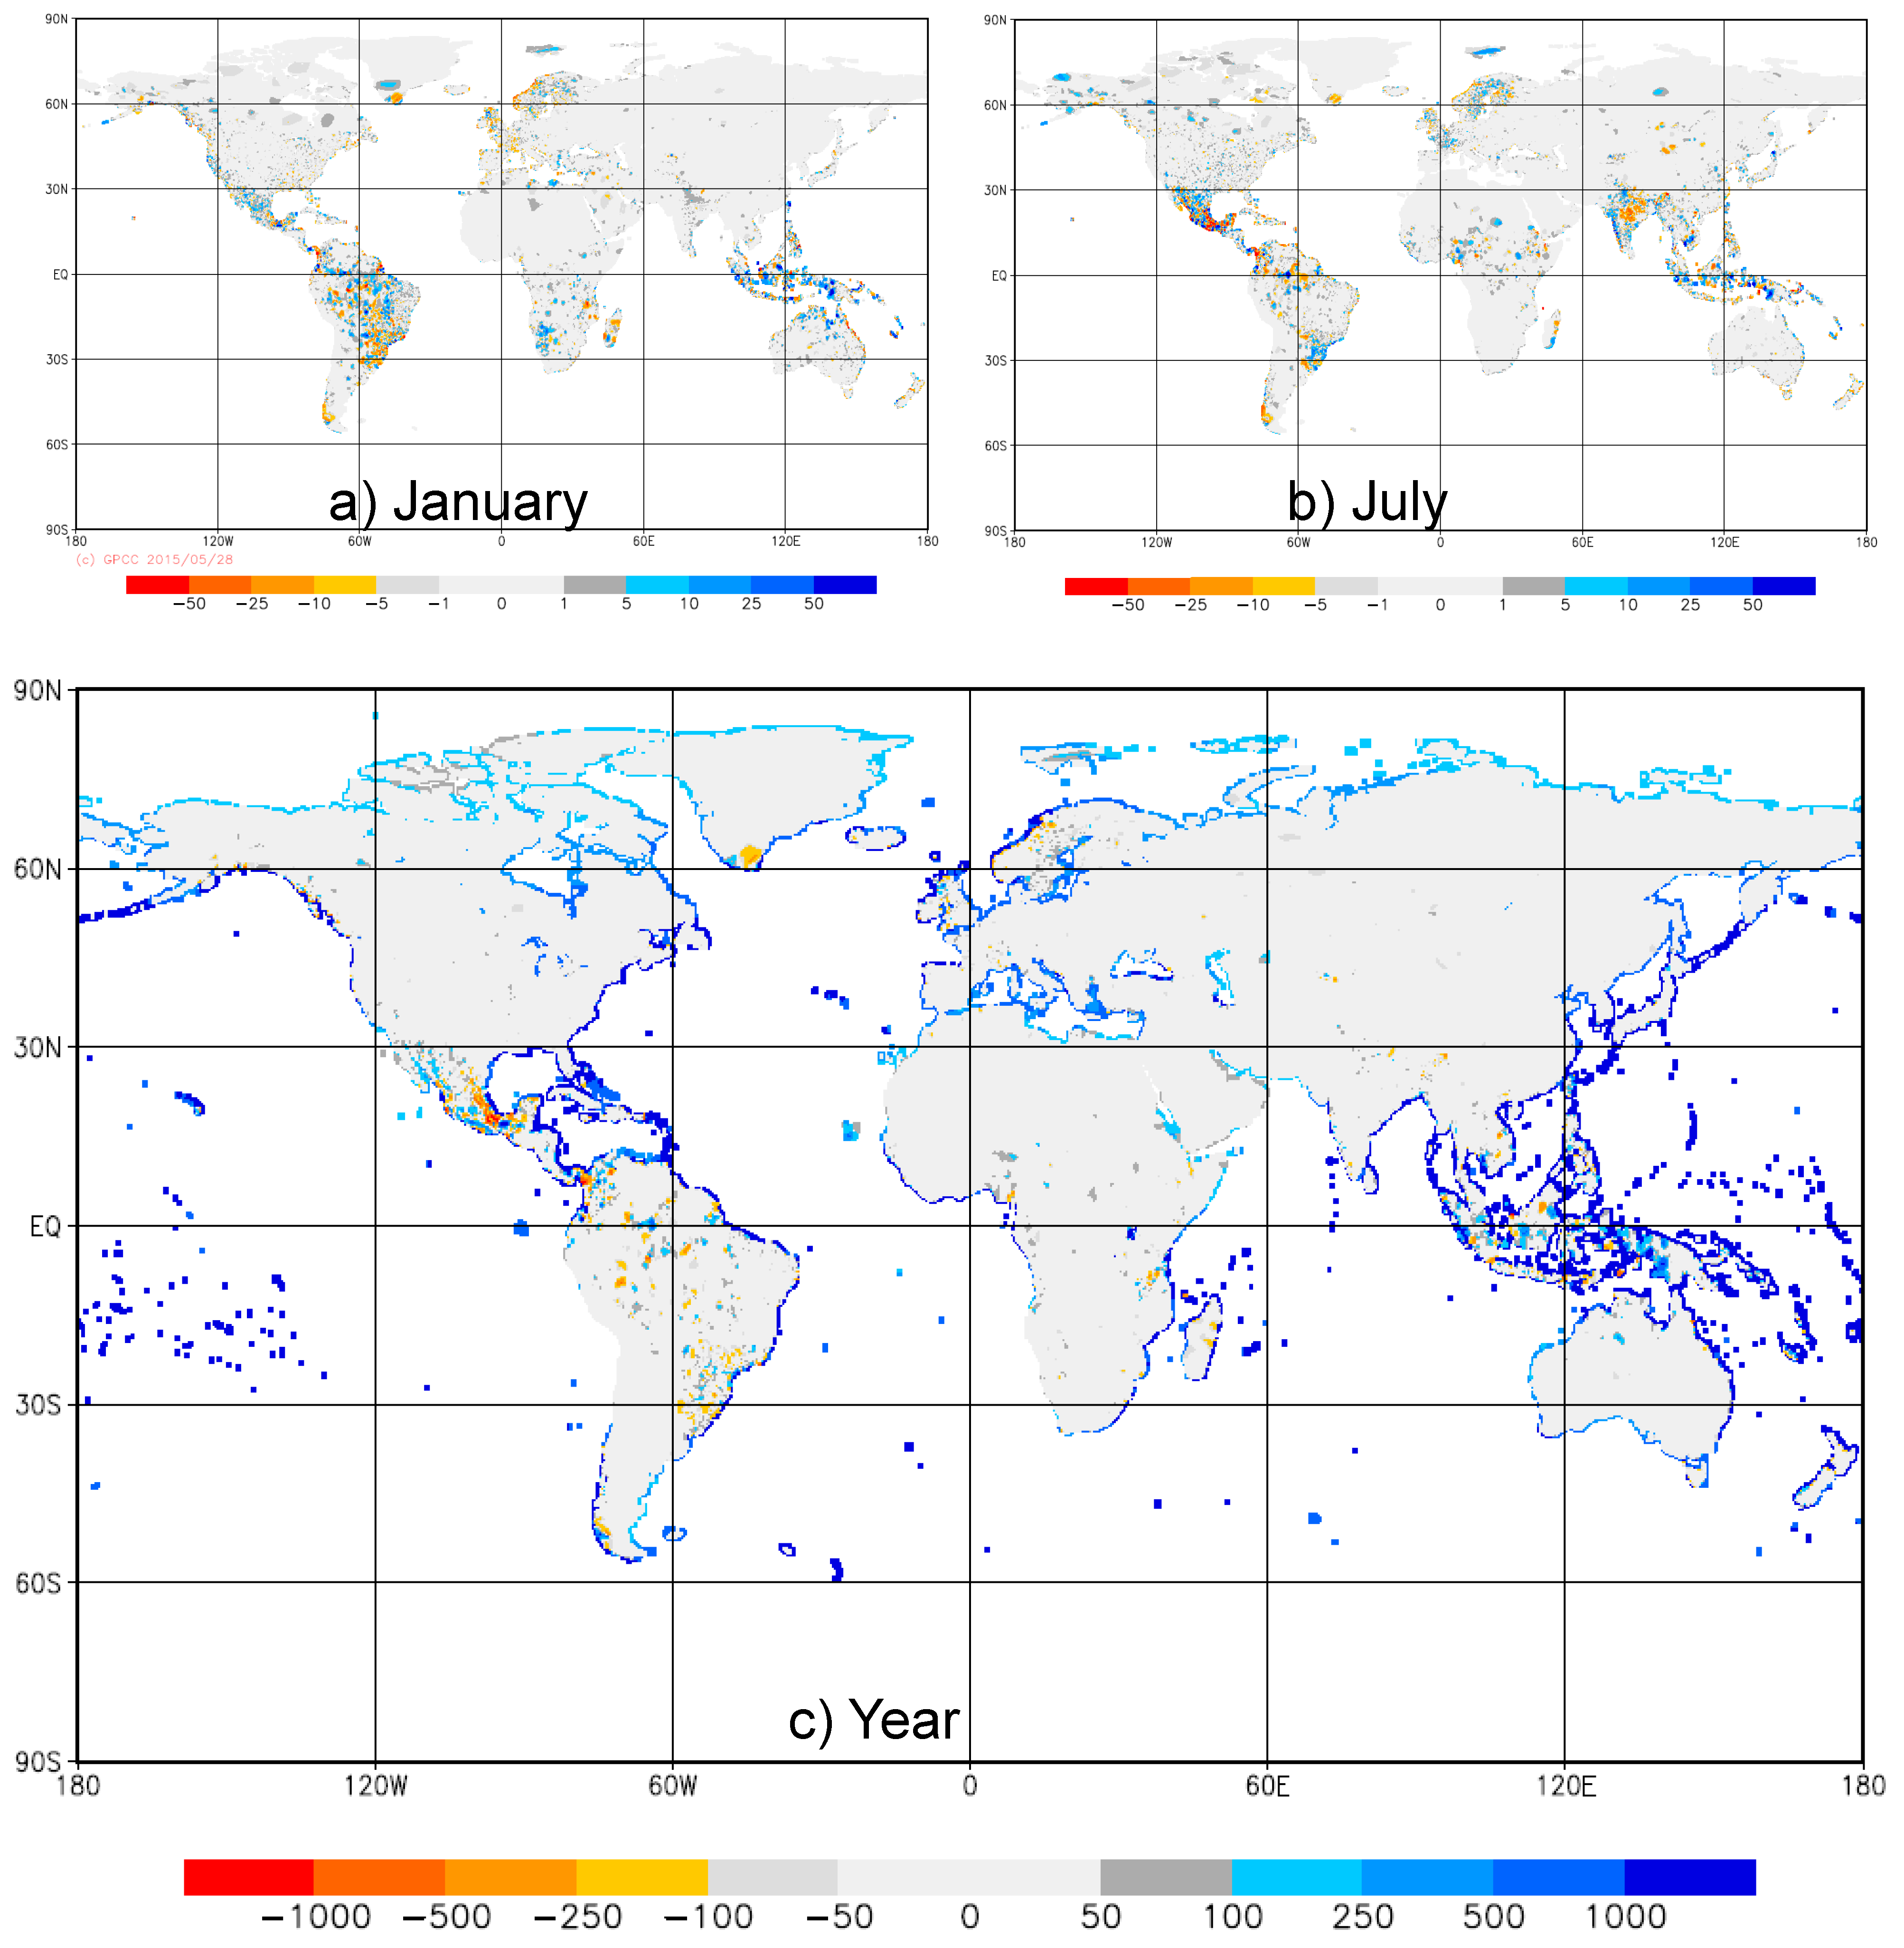
3.2. Comparison of the 2015 Release to the 2011 Release
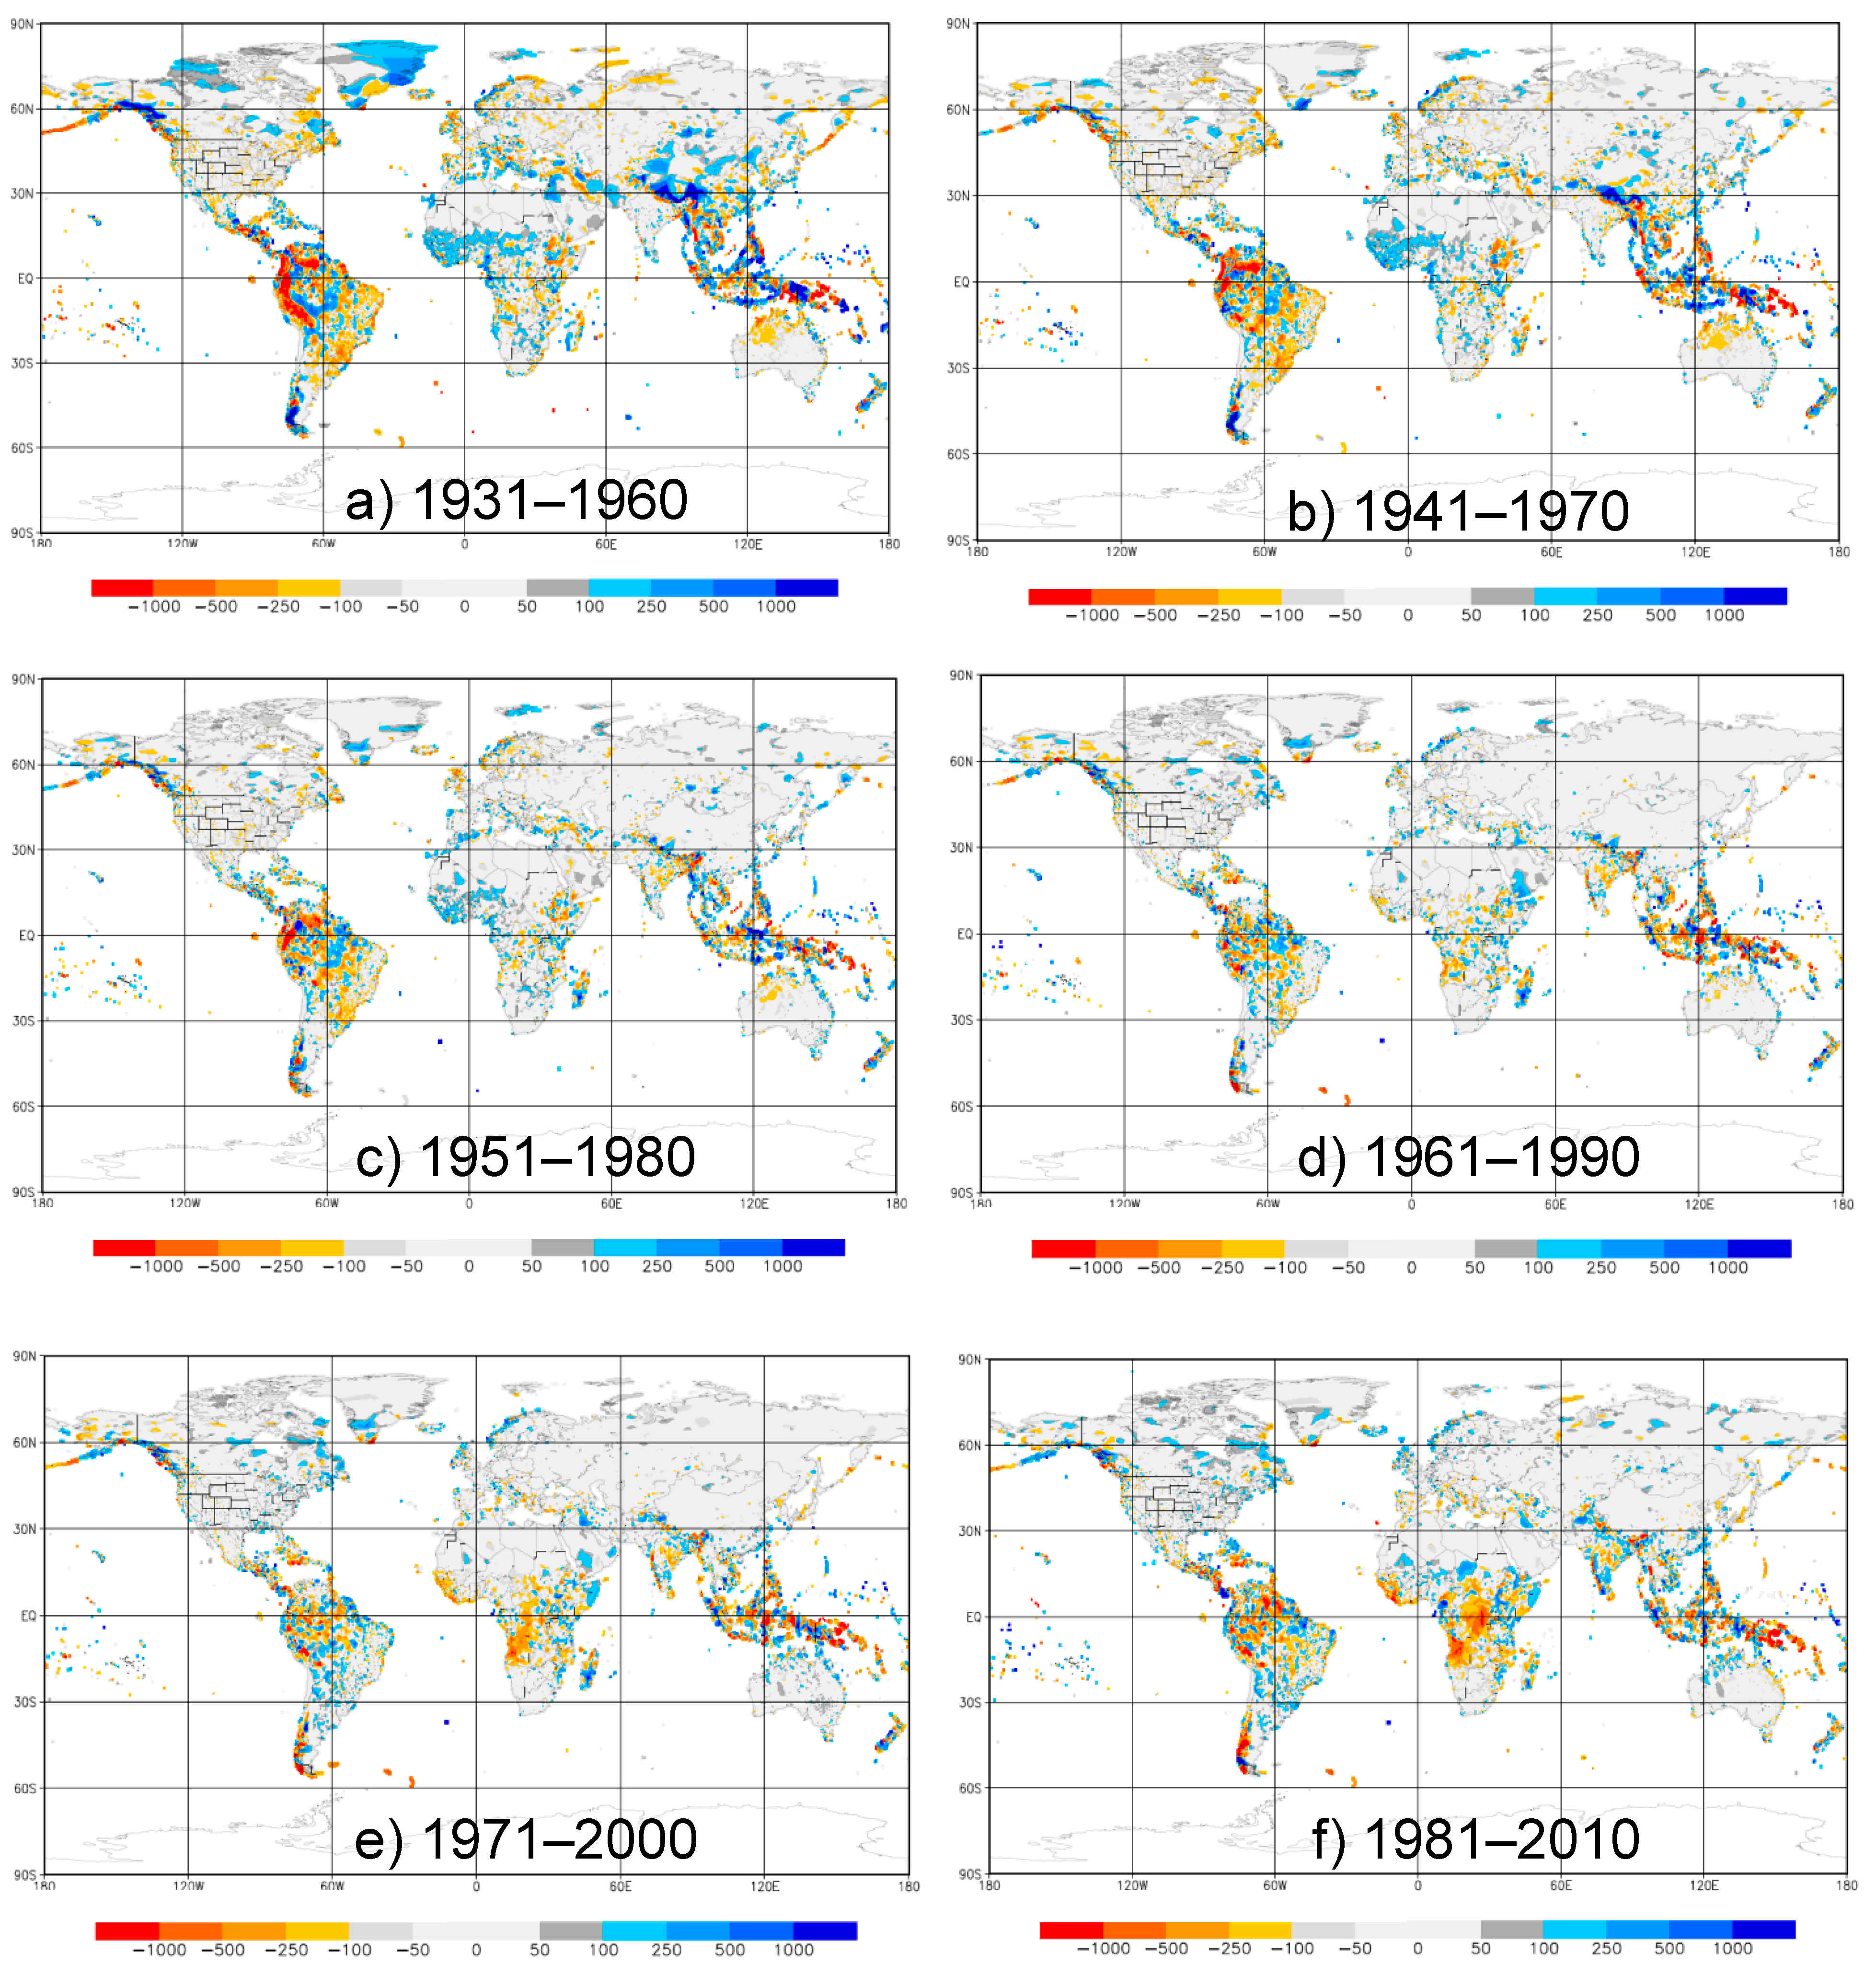
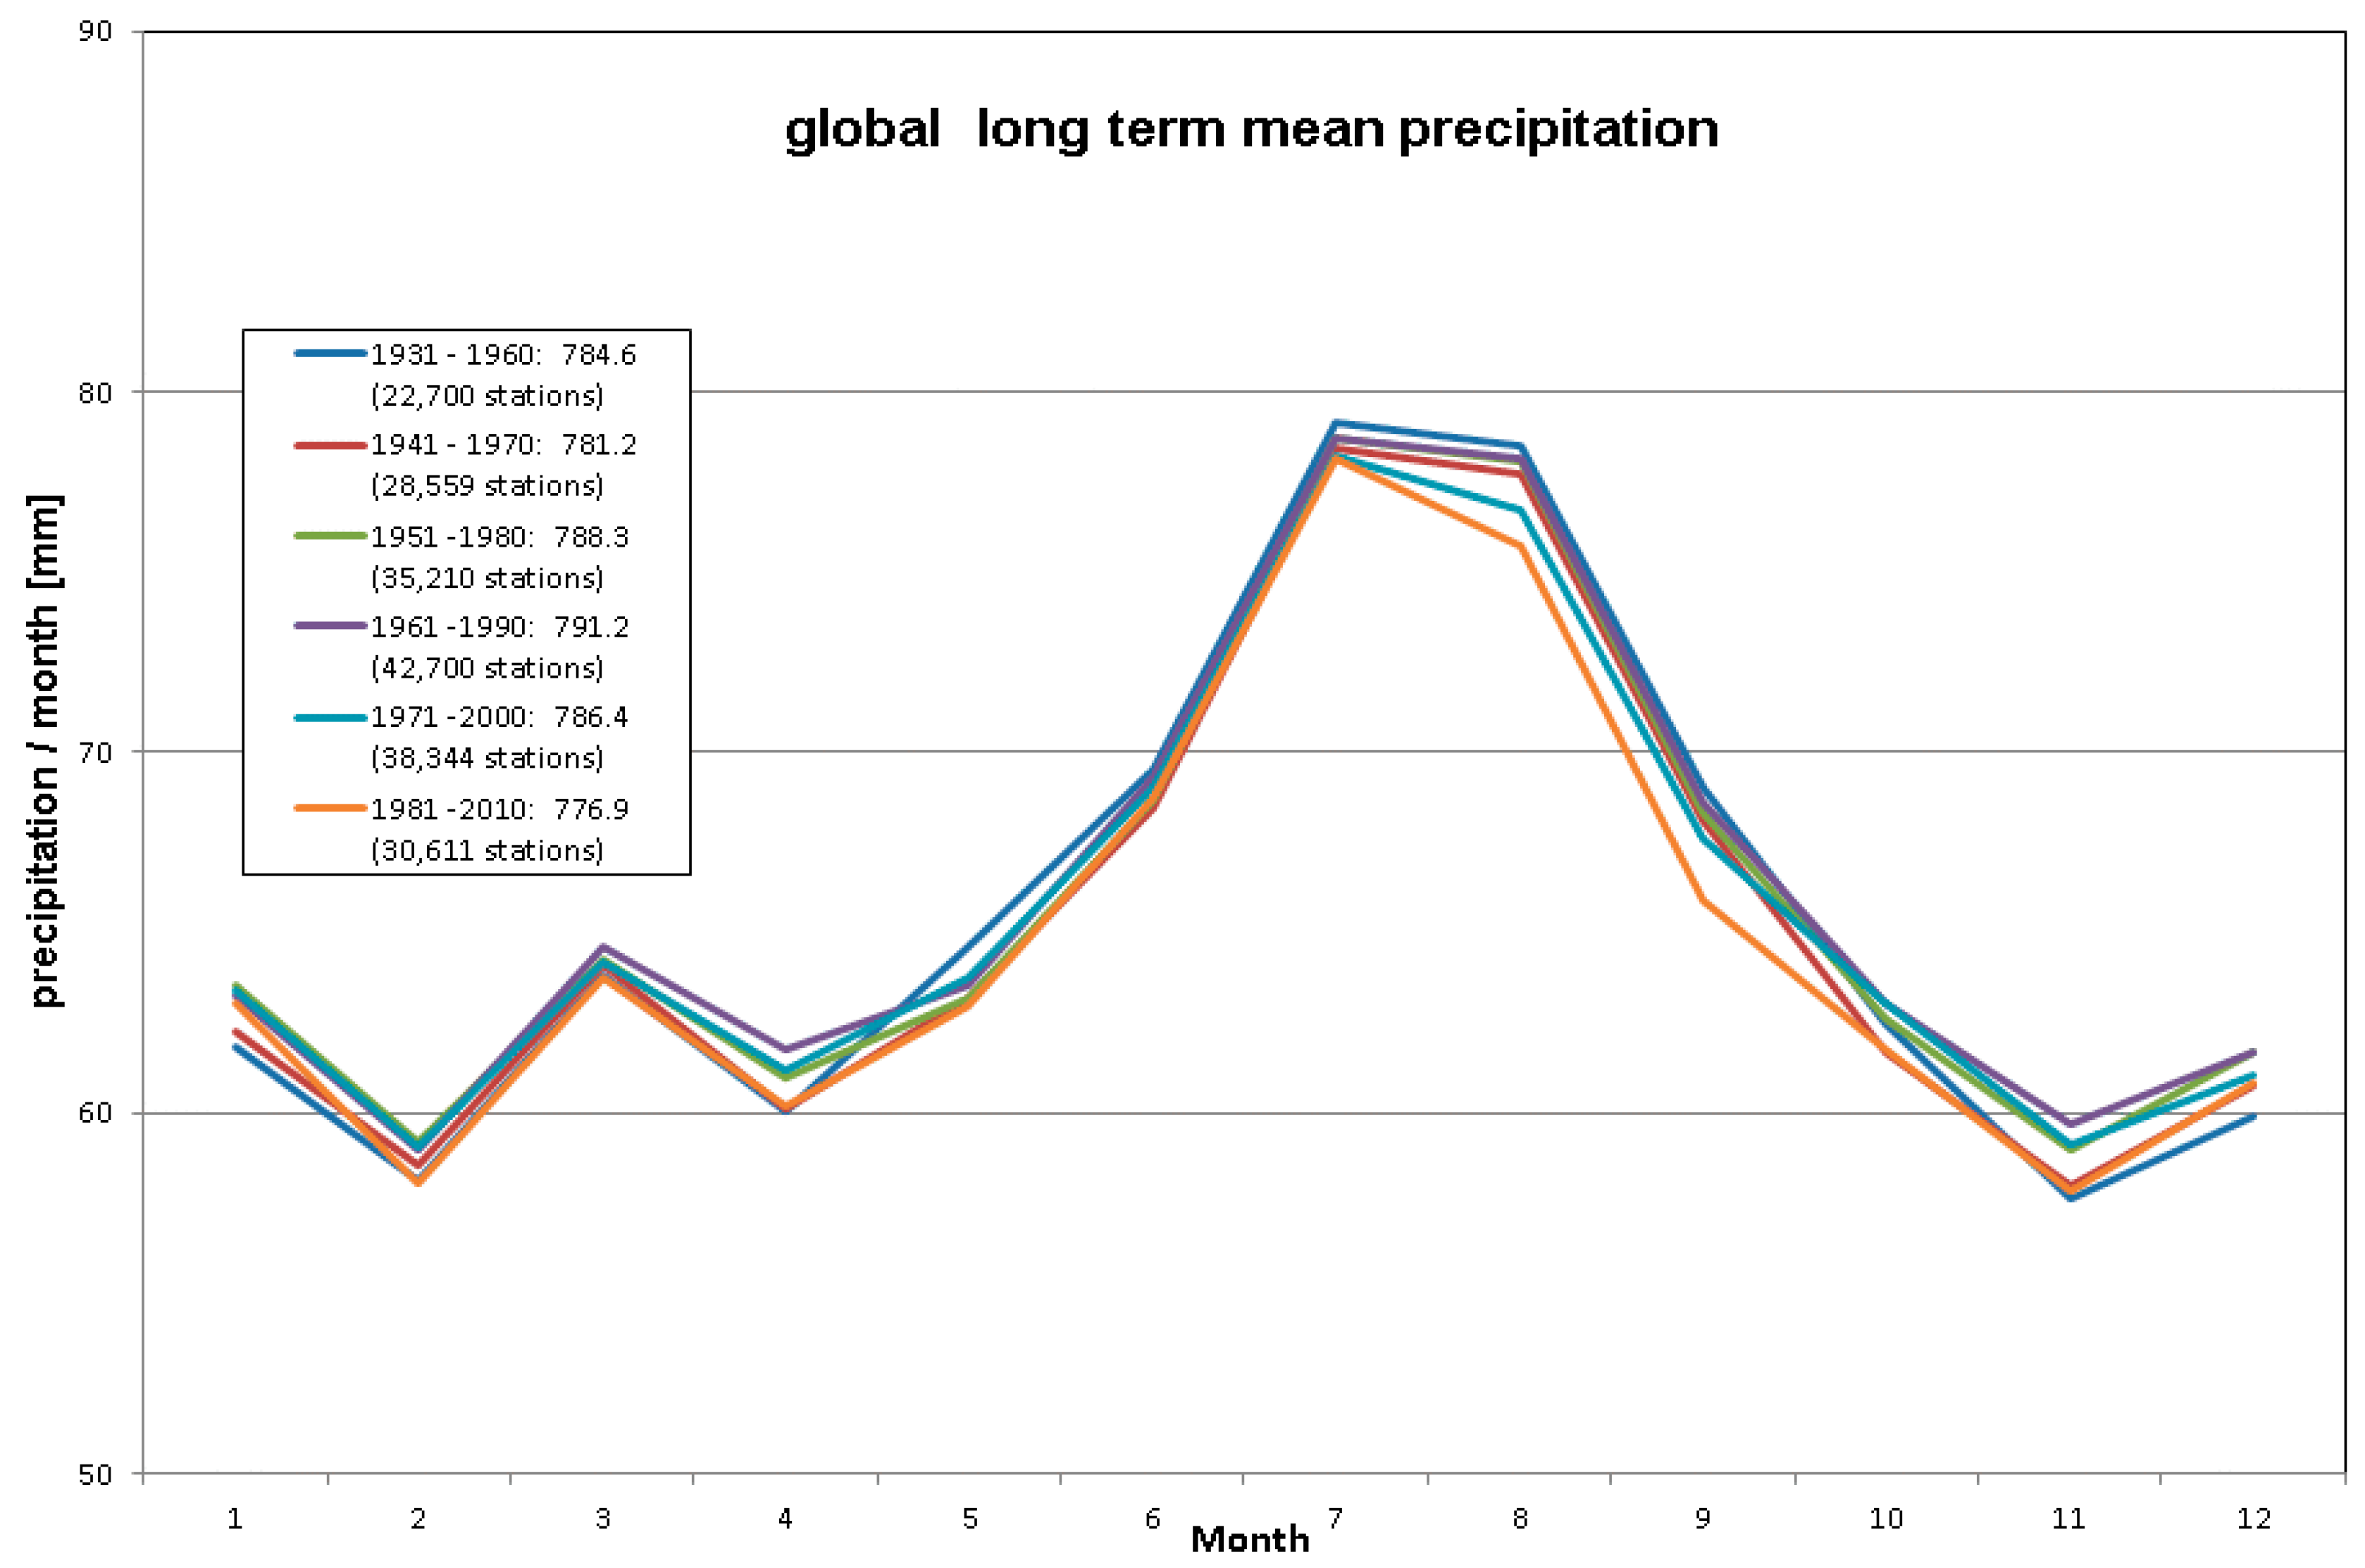
3.3. Variations of Mean Precipitation over Different Reference Periods
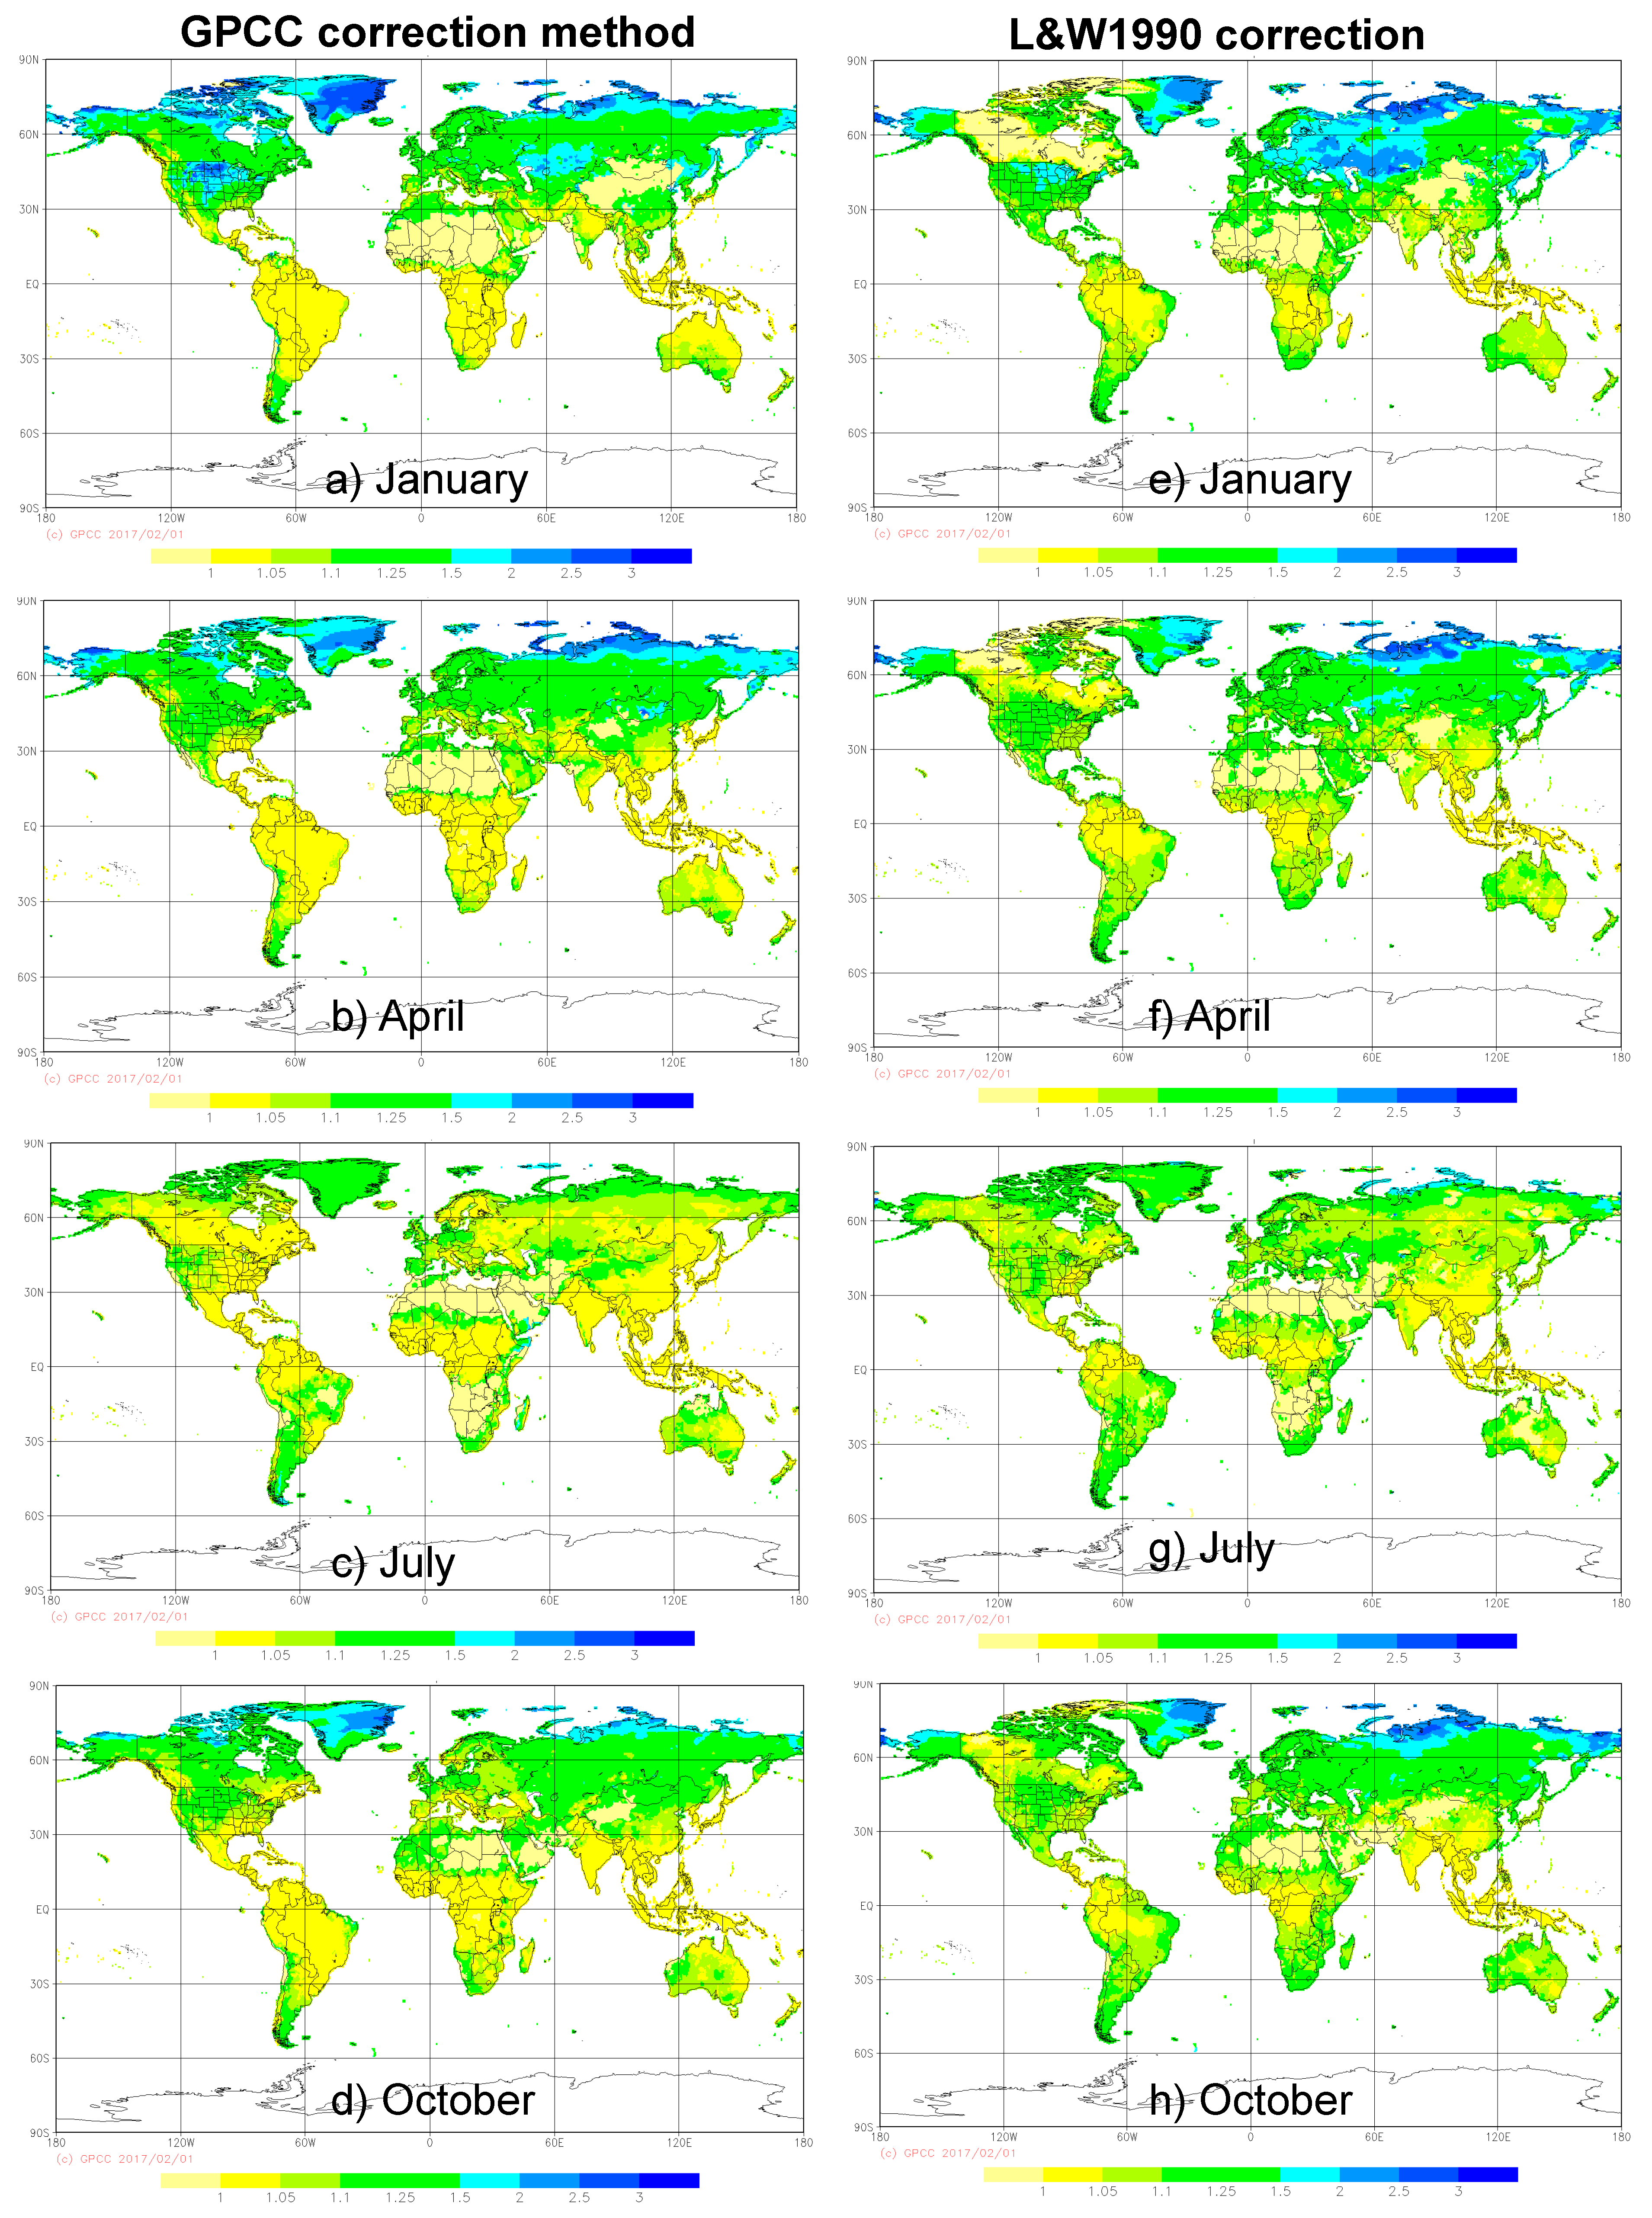
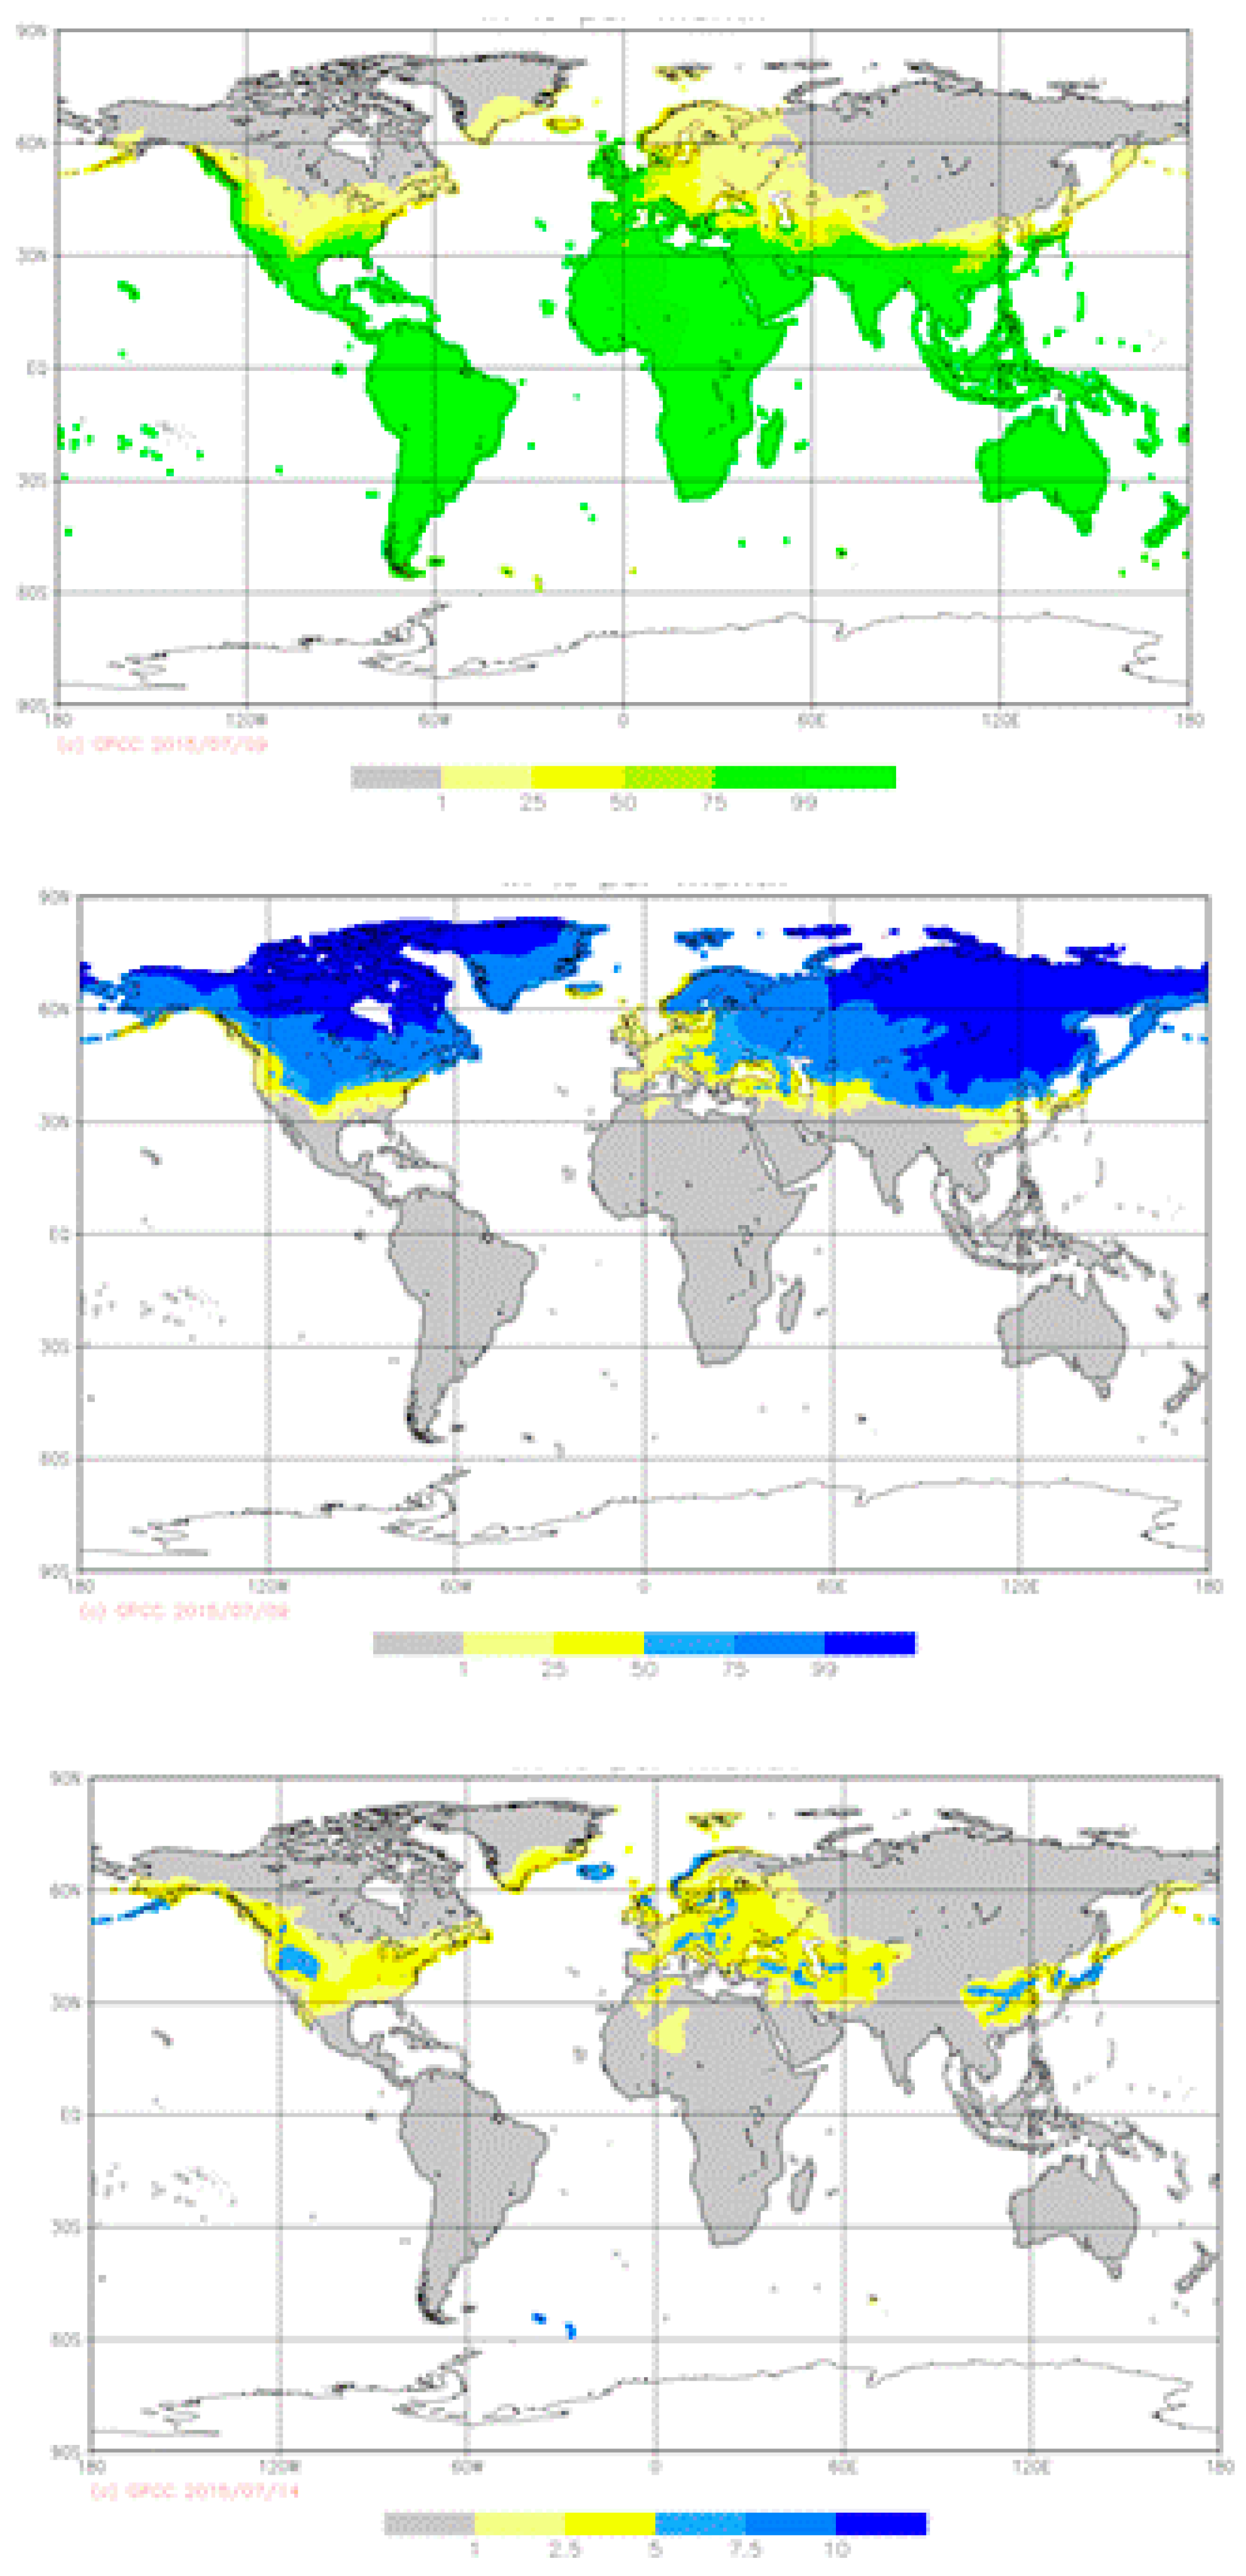
4. Weather-Dependent Correction of the Systematic Gauge-Measuring Error for 1982–2015
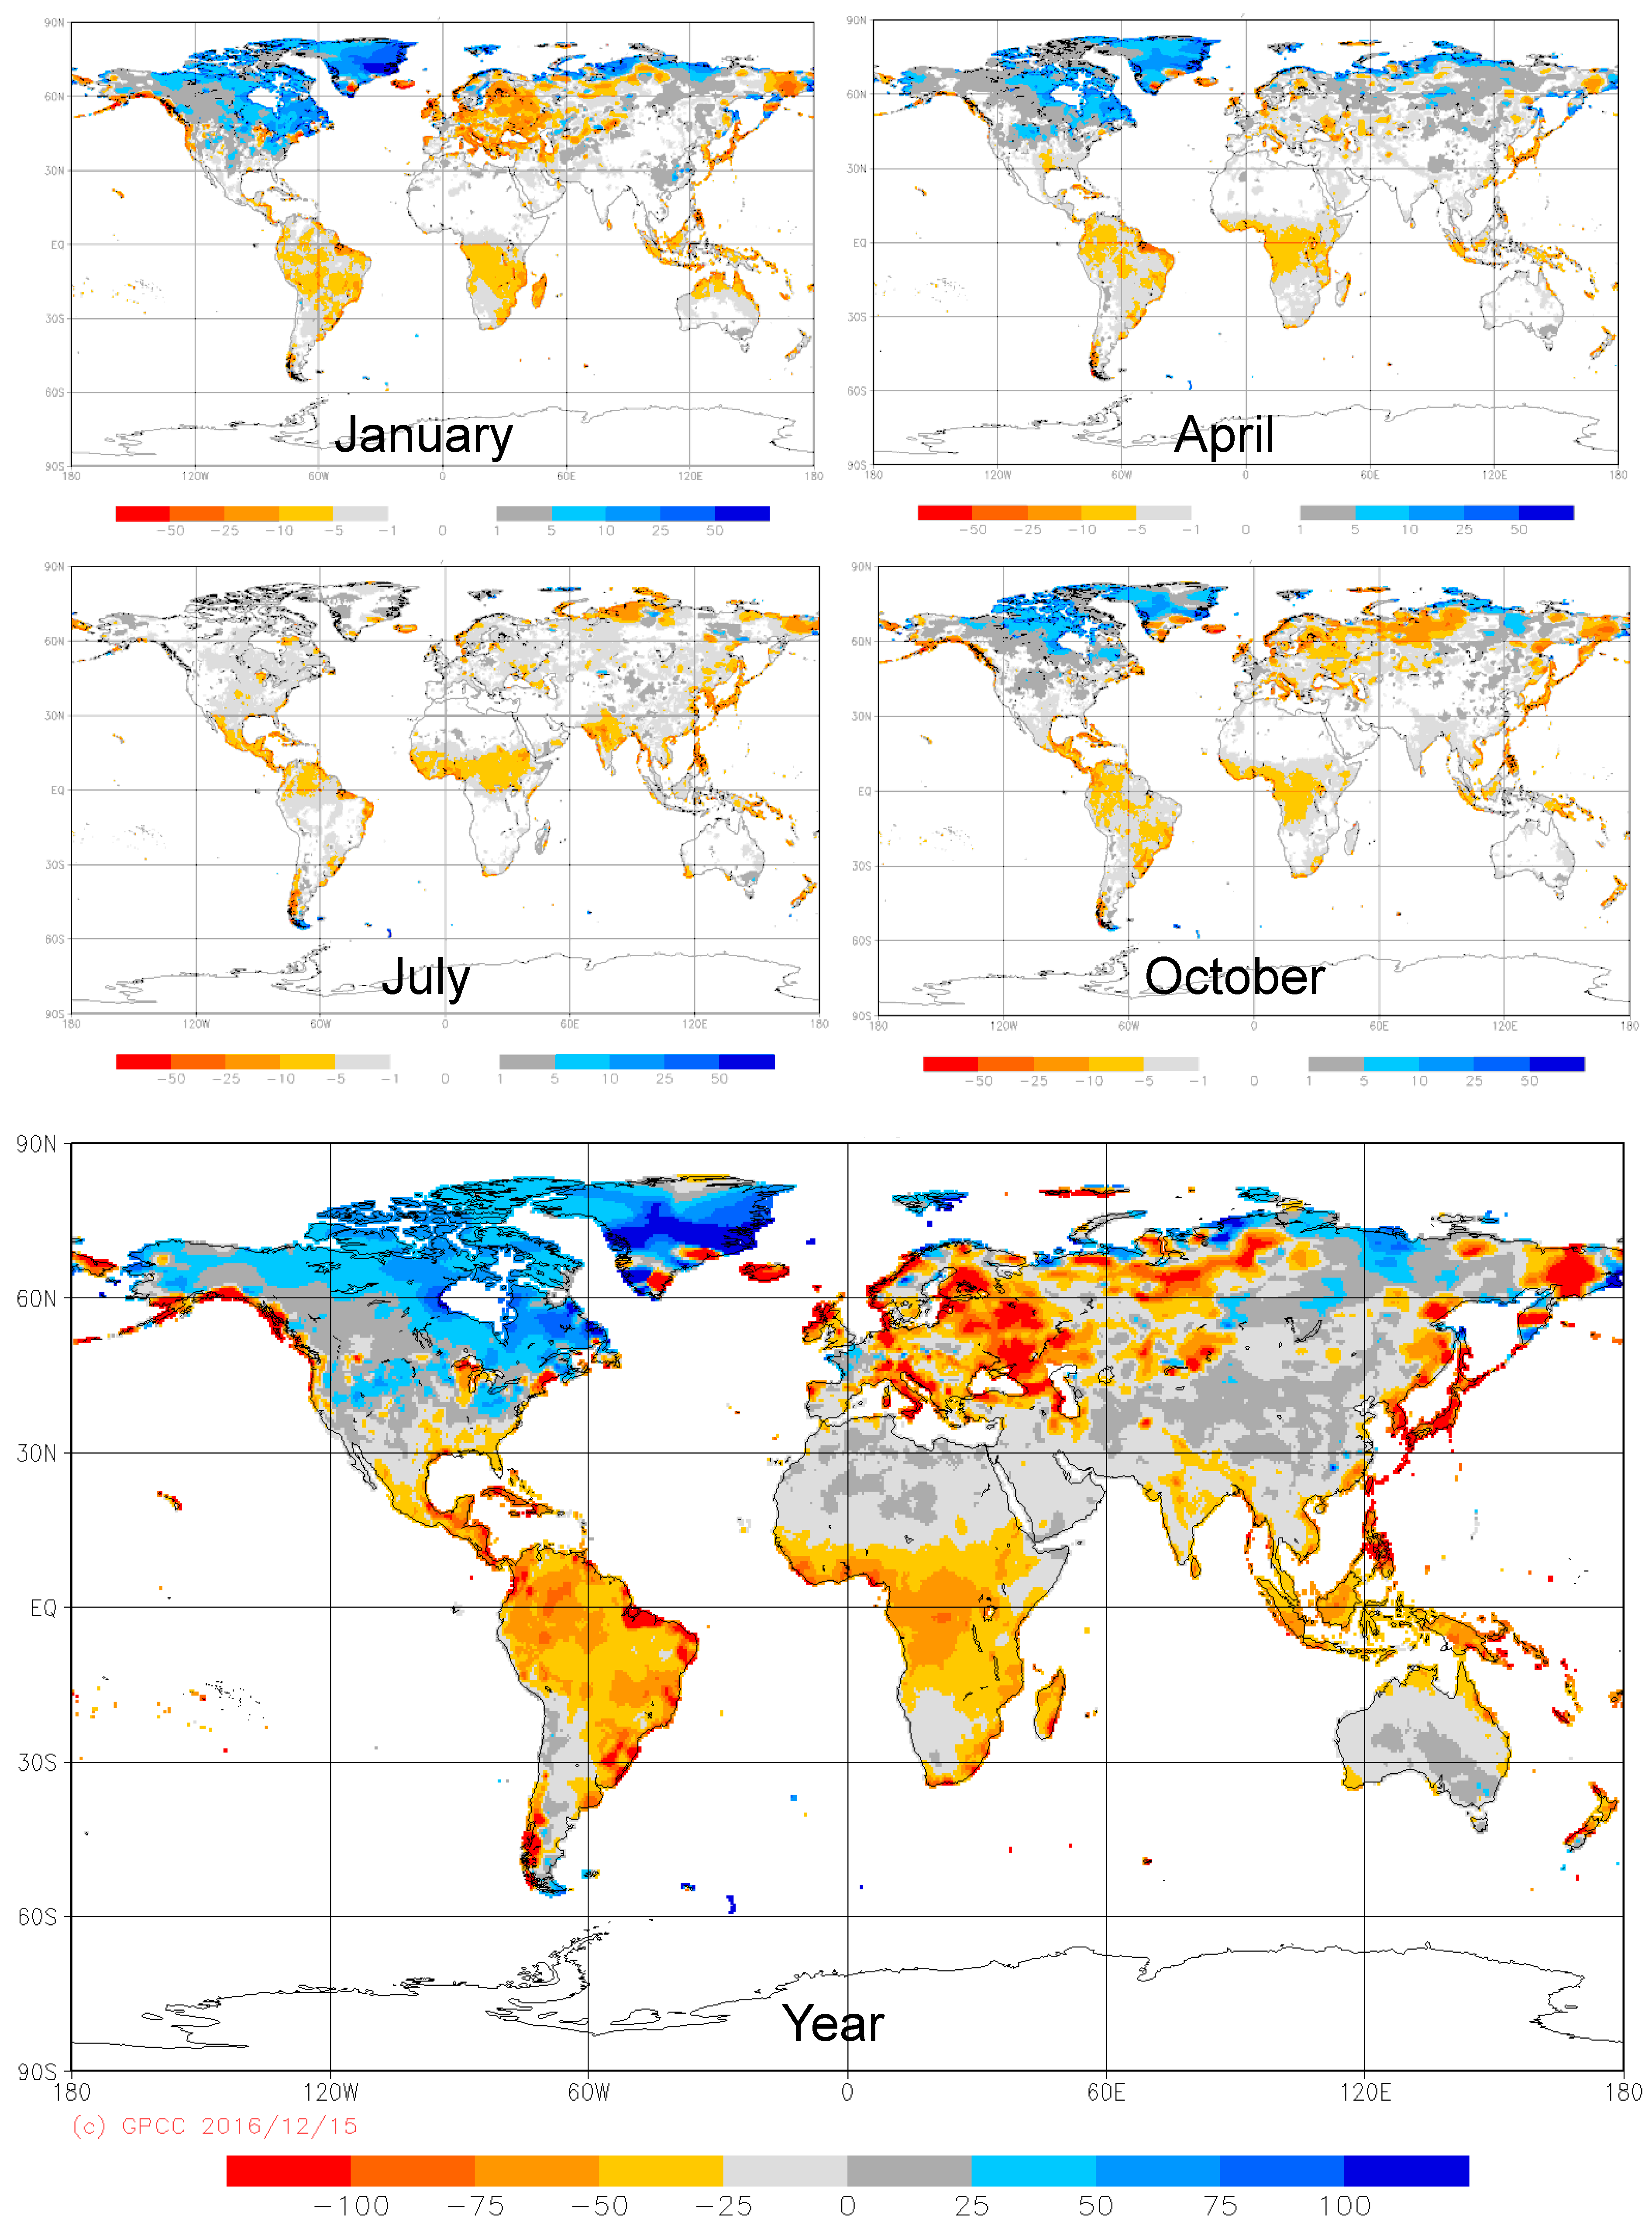
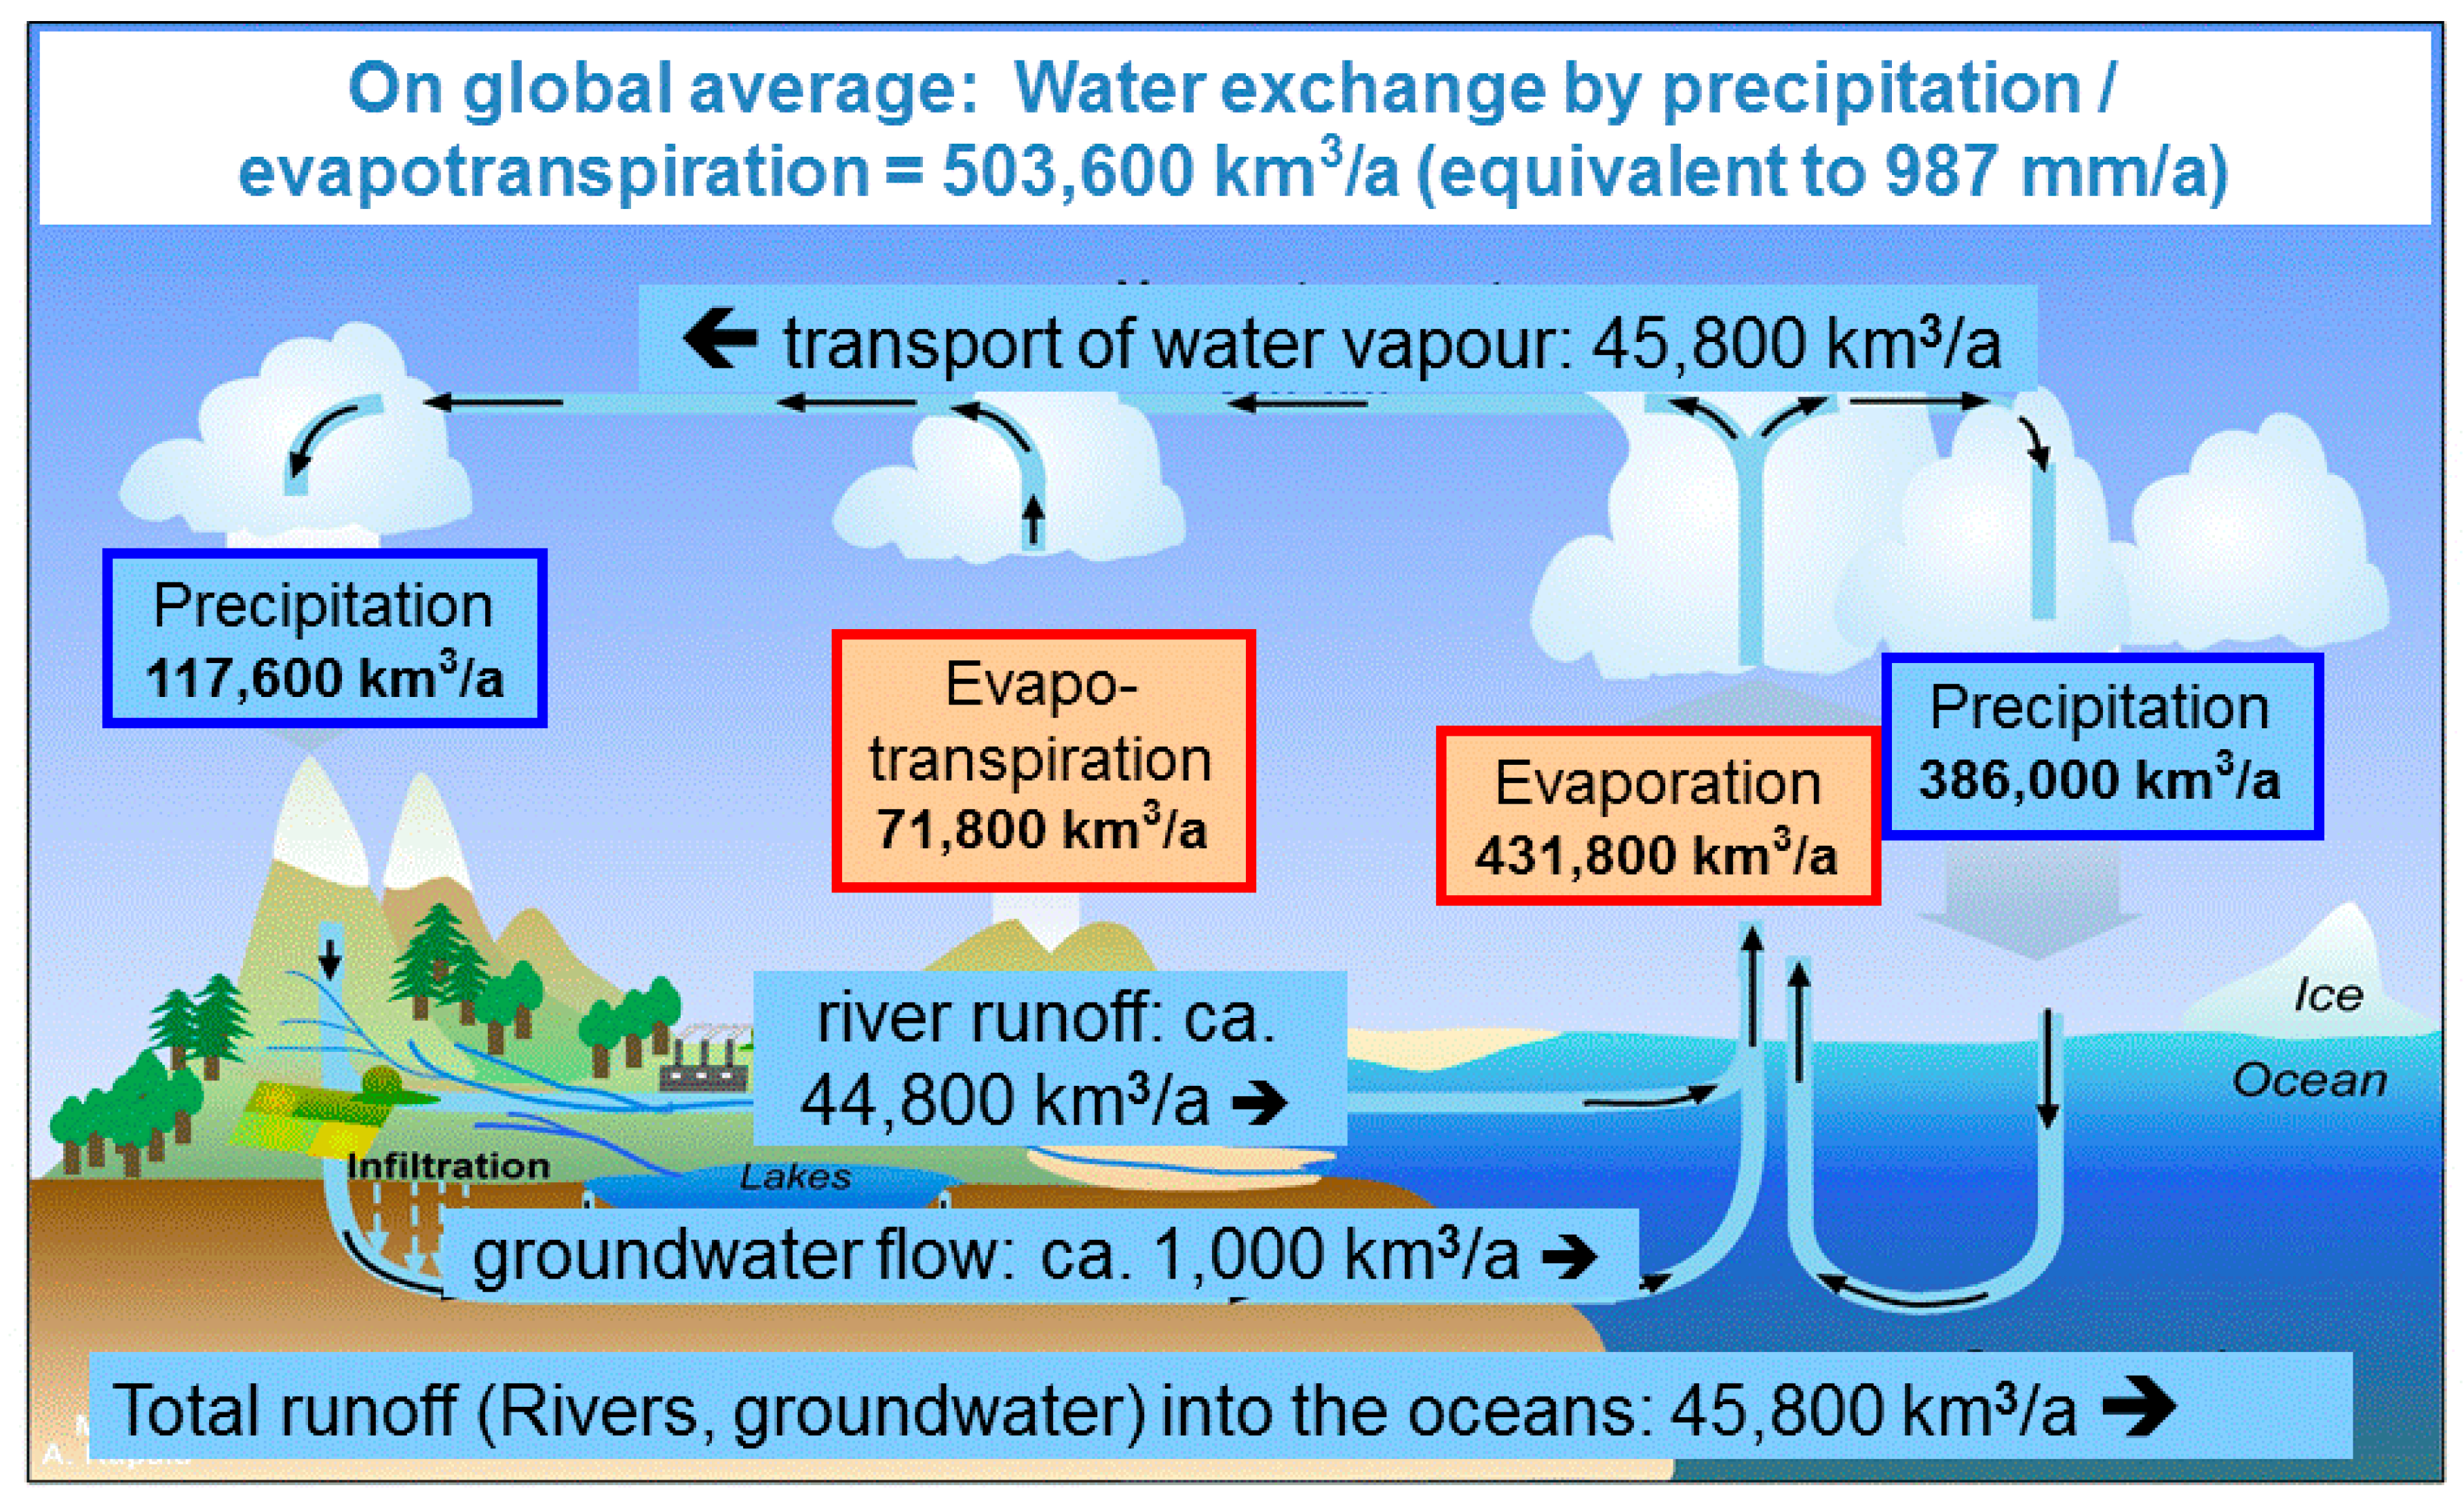
5. The Hydrological Cycle over Land as Evaluated from the GPCC’s New Gauge-Corrected Precipitation Climatology
6. Conclusions
Acknowledgments
Author Contributions
Conflicts of Interest
References
- Meyer-Christoffer, A.; Becker, A.; Finger, P.; Rudolf, B.; Schneider, U.; Ziese, M. GPCC Climatology Version 2011 at 0.25°: Monthly Land-Surface Precipitation Climatology for Every Month and the Total Year from Rain-Gauges Built on GTS-Based and Historic Data; GPCC: Offenbach, Germany, 2011. [Google Scholar]
- Schneider, U.; Becker, A.; Finger, P.; Meyer-Christoffer, A.; Ziese, M.; Rudolf, B. GPCC’s new land surface precipitation climatology based on quality-controlled in situ data and its role in quantifying the global water cycle. Theor. Appl. Climatol. 2014, 115, 15–40. [Google Scholar] [CrossRef]
- Meyer-Christoffer, A.; Becker, A.; Finger, P.; Rudolf, B.; Schneider, U.; Ziese, M. GPCC Climatology Version 2015 at 0.25°: Monthly Land-Surface Precipitation Climatology for Every Month and the Total Year from Rain-Gauges Built on GTS-Based and Historic Data; GPCC: Offenbach, Germany, 2015. [Google Scholar]
- Sevruk, B. Methods of Correction for Systematic Error in Point Precipitation Measurements for Operational Use; WMO: Geneva, Switzerland, 1982. [Google Scholar]
- Sevruk, B. Correction of Monthly Precipitation for Wetting Losses; WMO: Geneva, Switzerland, 1985; pp. 7–12. [Google Scholar]
- Fuchs, T.; Rapp, J.; Rubel, F.; Rudolf, B. Correction of Synoptic Precipitation Observations due to Systematic Measuring Errors with Special Regard to Precipitation Phases. Phys. Chem. Earth B 2001, 26, 689–693. [Google Scholar] [CrossRef]
- Ungersböck, M.; Rubel, F.; Fuchs, T.; Rudolf, B. Bias Correction of Global Daily Rain Gauge Measurements. Phys. Chem. Earth B 2001, 26, 411–414. [Google Scholar] [CrossRef]
- Legates, D.R.; Willmott, C.J. Mean seasonal and spatial variability in gauge-corrected, global precipitation. Int. J. Climatol. 1990, 10, 111–127. [Google Scholar] [CrossRef]
- Rubel, F.; Hantel, M. Correction of Daily Rain Gauge Measurements in the Baltic Sea Drainage Basin. Nordic Hydrol. 1999, 30, 191–208. [Google Scholar]
- Becker, A.; Finger, P.; Meyer-Christoffer, A.; Rudolf, B.; Schamm, K.; Schneider, U.; Ziese, M. A description of the global land-surface precipitation data products of the Global Precipitation Climatology Centre with sample applications including centennial (trend) analysis from 1901–present. Earth Syst. Sci. Data 2013, 5, 921–998. [Google Scholar] [CrossRef]
- Schneider, U.; Ziese, M.; Meyer-Christoffer, A.; Finger, P.; Rustemeier, E.; Becker, A. The new portfolio of global precipitation data products of the Global Precipitation Climatology Centre suitable to assess and quantify the global water cycle and resources. Proc. IAHS Water Resour. Assess. Seas. Predict. 2016, 374, 29–34. [Google Scholar] [CrossRef]
- Trenberth, K.E.; Smith, L.; Qian, T.; Dai, A.; Fasullo, J. Estimates of the global water budget and its annual cycle using observational and model data. J. Hydrometeorol. 2007, 8, 758–769. [Google Scholar] [CrossRef]
- Trenberth, K.E.; Fasullo, J.; Mackaro, J. Atmospheric moisture transports from ocean to land and global energy flows in Reanalyses. J. Clim. 2011, 24, 4907–4924. [Google Scholar] [CrossRef]
- Rodell, M.; Beaudoing, H.K.; L’Ecuyer, T.S.; Olson, W.S.; Famiglietti, J.S.; Houser, P.R.; Adler, R.; Bosilovich, M.G.; Clayson, C.A.; Chambers, D.; et al. The observed state of the water cycle in the early twenty-first century. J. Clim. 2015, 28, 8289–8318. [Google Scholar] [CrossRef]
- Hegerl, G.C.; Black, E.; Allan, R.P.; Ingram, W.J.; Polson, D.; Trenberth, K.E.; Chadwick, R.S.; Arkin, P.A.; Sarojini, B.B.; Becker, B.; et al. Challenges in quantifying changes in the global water cycle. Bull. Am. Meteorol. Soc. 2015, 96, 1097–1115. [Google Scholar] [CrossRef]
- Carroll, M.L.; Townshend, J.R.; Di Miceli, C.M.; Noojipady, P.; Sohlberg, R.A. A new global raster water mask at 250 m resolution. Int. J. Digit. Earth 2009, 2, 291–308. [Google Scholar] [CrossRef]
- ISLSCP II Land and Water Masks with Ancillary Data. Available online: http://dx.doi.org/10.3334/ORNLDAAC/1200 (accessed in January 2015).
- World Meteorological Organization (WMO). Climatological Normals (CLINO) for the Period 1961–1990; WMO: Geneva, Switzerland, 1996. [Google Scholar]
- Nicholson, S.E. An overview of African rainfall fluctuations of the last decade. J. Clim. 1993, 6, 1463–1466. [Google Scholar] [CrossRef]
- Nicholson, S.E. The intensity, location and structure of the tropical rainfall belt over West Africa as a factor in interannual vaiability. Int. J. Climatol. 2008, 28, 1775–1785. [Google Scholar] [CrossRef]
- Sanderson, M.G.; Hemming, D.L.; Betts, R.A. Regional temperature and precipitation changes under high-end (>= 4 °C) global warming. Philos. Trans. R. Soc. A 2010, 369, 85–98. [Google Scholar] [CrossRef] [PubMed]
- Wang, B.; Wu, R.; Fu, X. Pacific-East Asian teleconnection: How does ENSO affect East Asian climate? J. Clim. 2000, 13, 1517–1536. [Google Scholar] [CrossRef]
- Kumar, K.K.; Rajagopalan, B.; Hoerling, M.; Bates, G.; Cane, M. Unraveling the mystery of Indian Monsoon failure during El Nino. Science 2006, 314, 115–119. [Google Scholar] [CrossRef] [PubMed]
- Adler, R.F.; Huffman, G.J.; Chang, A.; Ferraro, R.; Xie, P.; Janowiak, J.; Rudolf, B.; Schneider, U.; Curtis, S.; Bolvin, D.; et al. The Version-2 Global Precipitation Climatology Project (GPCP) monthly precipitation analysis (1979–present). J. Hydrometeorol. 2003, 4, 1147–1167. [Google Scholar] [CrossRef]
- Adler, R.F.; Sapiano, M.; Huffman, G.J.; Bolvin, D.; Wang, J.J.; Gu, G.; Nelkin, E.; Xie, P.; Chiu, L.; Ferraro, R.; et al. New Global Precipitation Climatology Project monthly analysis product corrects satellite data shifts. GEWEX News 2016, 26, 7–9. [Google Scholar]
- Vaughan, D.G.; Bamber, J.L.; Giovinetto, M.; Russell, J.; Cooper, A.P.R. Reassessment of net surface mass balance in Antarctica. J. Clim. 1999, 12, 933–946. [Google Scholar] [CrossRef]
- De Couet, T.; Maurer, T. Surface Freshwater Fluxes into the World Oceans; Federal Institute of Hydrology (BFG): Koblenz, Germany, 2009. [Google Scholar]
- Wilkinson, K.; von Zabern, M.; Scherzer, J. Global Freshwater Fluxes into the World Oceans. Available online: http://www.bafg.de/GRDC/EN/02_srvcs/24_rprtsrs/report_44.pdf?__blob=publicationFile (accessed on 10 January 2017).
- Müller-Schmied, H.; Eisner, S.; Franz, D.; Wattenbach, M.; Portmann, F.T.; Flörke, M.; Döll, P. Sensitivity of simulated global-scale freshwater fluxes and storages to input data, hydrological model structure, human water use calibration. Hydrol. Earth Syst. Sci. 2014, 18, 3511–3538. [Google Scholar] [CrossRef]
- Müller-Schmied, H.; Adam, L.; Eisner, S.; Fink, G.; Flörke, M.; Kim, H.; Oki, T.; Portmann, F.T.; Reinecke, R.; Riedel, C.; et al. Variations of global and continental water balance components as impacted climate forcing uncertainty and human water use. Hydrol. Earth Syst. Sci. 2016, 20, 2877–2898. [Google Scholar] [CrossRef]
- Losev, K.S. Estimation of run-off from Antarctic and Greenland ice sheets. In Proceedings of the Symposium.on the Hydrology of Glaciers, Cambridge, UK, 7–13 September 1969; pp. 253–254.
- Jacobs, S.S.; Helmer, H.H.; Doake, C.S.M.; Jenkins, A.; Frolich, R.M. Melting of ice shelves and the mass balance of Antarctica. J. Glaciol. 1992, 38, 375–387. [Google Scholar] [CrossRef]
- Adam, J.C.; Lettenmaier, D. Adjustment of global gridded precipitation for systematic bias. J. Geophys. Res. 2003, 108, 4257. [Google Scholar] [CrossRef]
- Osborne, J.M.; Lambert, F.H. The missing aerosol response in twentieth-century mid-latitude precipitation observations. Nat. Clim. Chang. 2014, 4, 374–378. [Google Scholar] [CrossRef] [Green Version]
- Allen, M.R.; Ingram, W.J. Constraints on future changes in climate and the hydrologic cycle. Nature 2002, 419, 224–232. [Google Scholar] [CrossRef] [PubMed]
- Kidd, C.; Becker, A.; Huffman, G.J.; Muller, C.L.; Joe, P.; Skofronick-Jackson, G.; Kirschbaum, D. So, How much of the earth’s surface is covered by rain gauges? Bull. Am. Meteorol. Soc. 2017, 98, 69–78. [Google Scholar] [CrossRef]
- Homepage of the Global Precipitation Climatology Centre (GPCC). Available online: http://gpcc.dwd.de (accessed on 10 January 2017).


| January | February | March | April | May | June | July | August | September | October | November | December | Year | |
|---|---|---|---|---|---|---|---|---|---|---|---|---|---|
| GPCC | 64.1 | 59.6 | 65.0 | 61.7 | 63.8 | 69.1 | 78.9 | 77.7 | 68.8 | 63.2 | 59.6 | 62.3 | 800.9 |
| GPCC Corr. | 69.4 | 64.3 | 69.6 | 65.6 | 66.9 | 71.9 | 81.7 | 80.4 | 71.6 | 66.8 | 64.1 | 67.5 | 862.3 |
| Mean Correction Factor | 1.083 | 1.078 | 1.070 | 1.063 | 1.049 | 1.040 | 1.036 | 1.035 | 1.040 | 1.058 | 1.079 | 1.084 | 1.077 |
© 2017 by the authors. Licensee MDPI, Basel, Switzerland. This article is an open access article distributed under the terms and conditions of the Creative Commons Attribution (CC BY) license ( http://creativecommons.org/licenses/by/4.0/).
Share and Cite
Schneider, U.; Finger, P.; Meyer-Christoffer, A.; Rustemeier, E.; Ziese, M.; Becker, A. Evaluating the Hydrological Cycle over Land Using the Newly-Corrected Precipitation Climatology from the Global Precipitation Climatology Centre (GPCC). Atmosphere 2017, 8, 52. https://doi.org/10.3390/atmos8030052
Schneider U, Finger P, Meyer-Christoffer A, Rustemeier E, Ziese M, Becker A. Evaluating the Hydrological Cycle over Land Using the Newly-Corrected Precipitation Climatology from the Global Precipitation Climatology Centre (GPCC). Atmosphere. 2017; 8(3):52. https://doi.org/10.3390/atmos8030052
Chicago/Turabian StyleSchneider, Udo, Peter Finger, Anja Meyer-Christoffer, Elke Rustemeier, Markus Ziese, and Andreas Becker. 2017. "Evaluating the Hydrological Cycle over Land Using the Newly-Corrected Precipitation Climatology from the Global Precipitation Climatology Centre (GPCC)" Atmosphere 8, no. 3: 52. https://doi.org/10.3390/atmos8030052