
Inverse Relations of PM2.5 and O3 in Air Compound Pollution between Cold and Hot Seasons over an Urban Area of East China

 ,
,
Abstract
:1. Introduction
2. Environmental and Meteorological Data
3. Analysis and Discussion
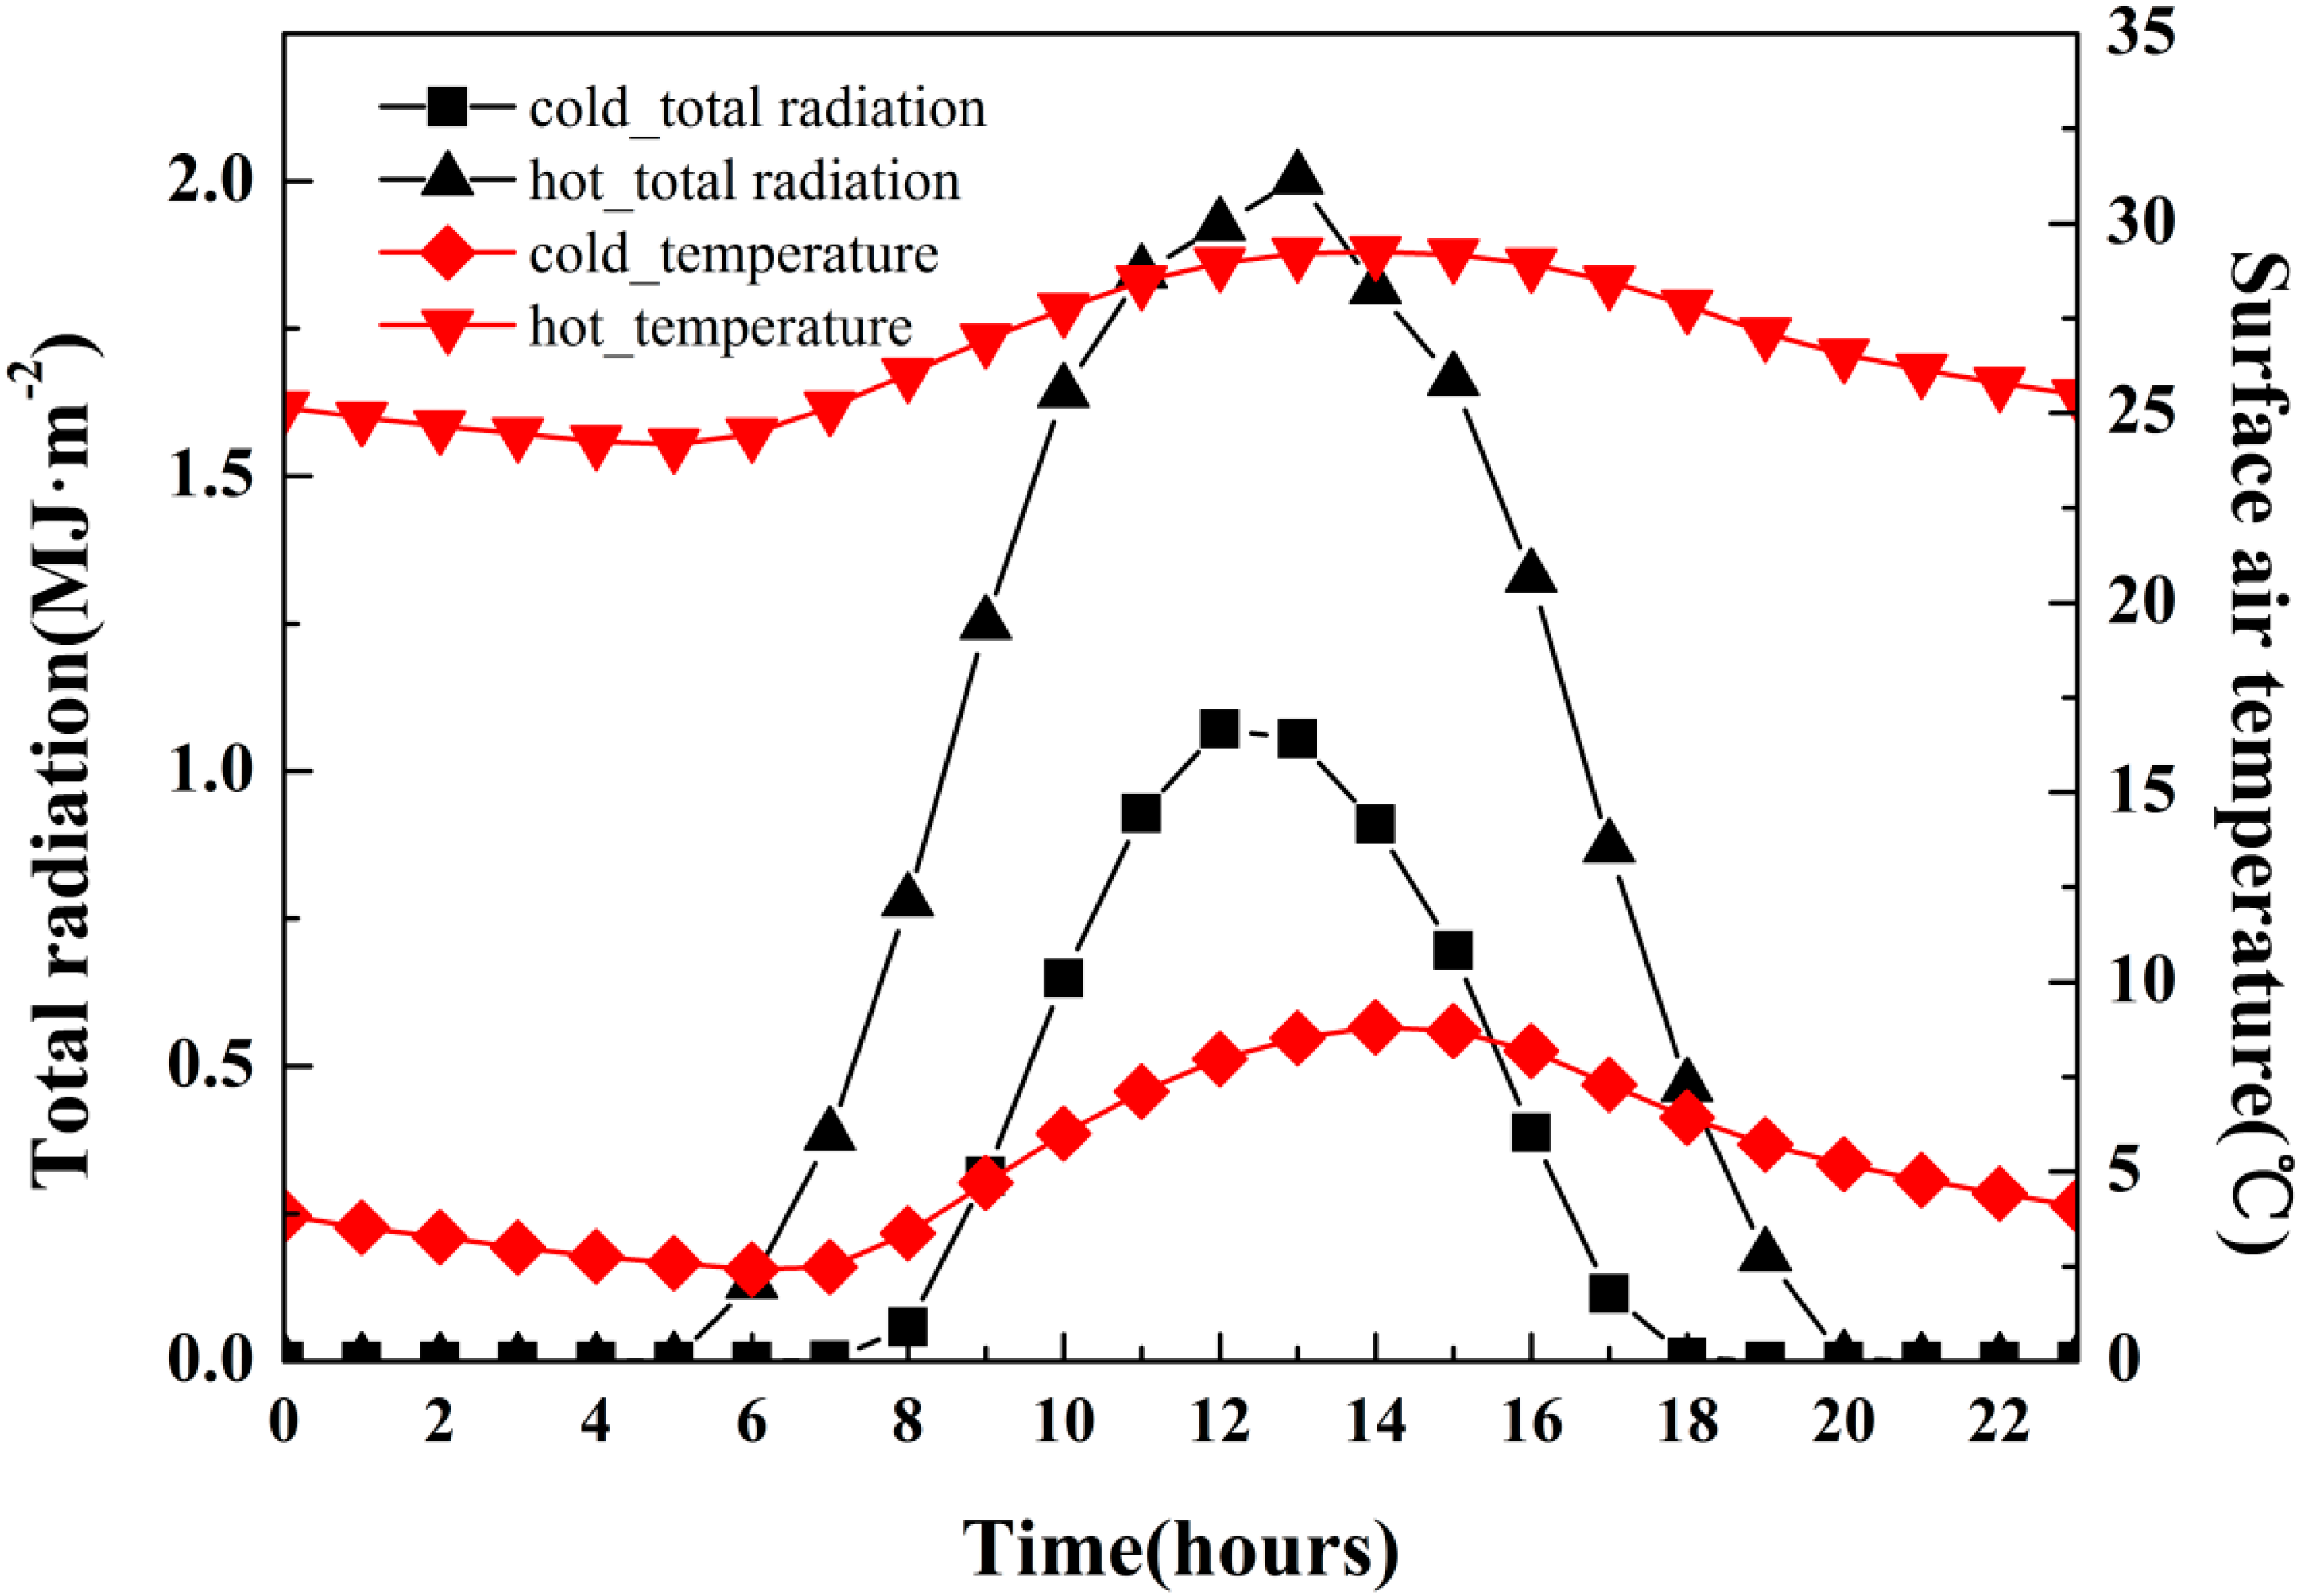
3.1. Seasonal Variations of Atmospheric Environment and Meteorological Conditions
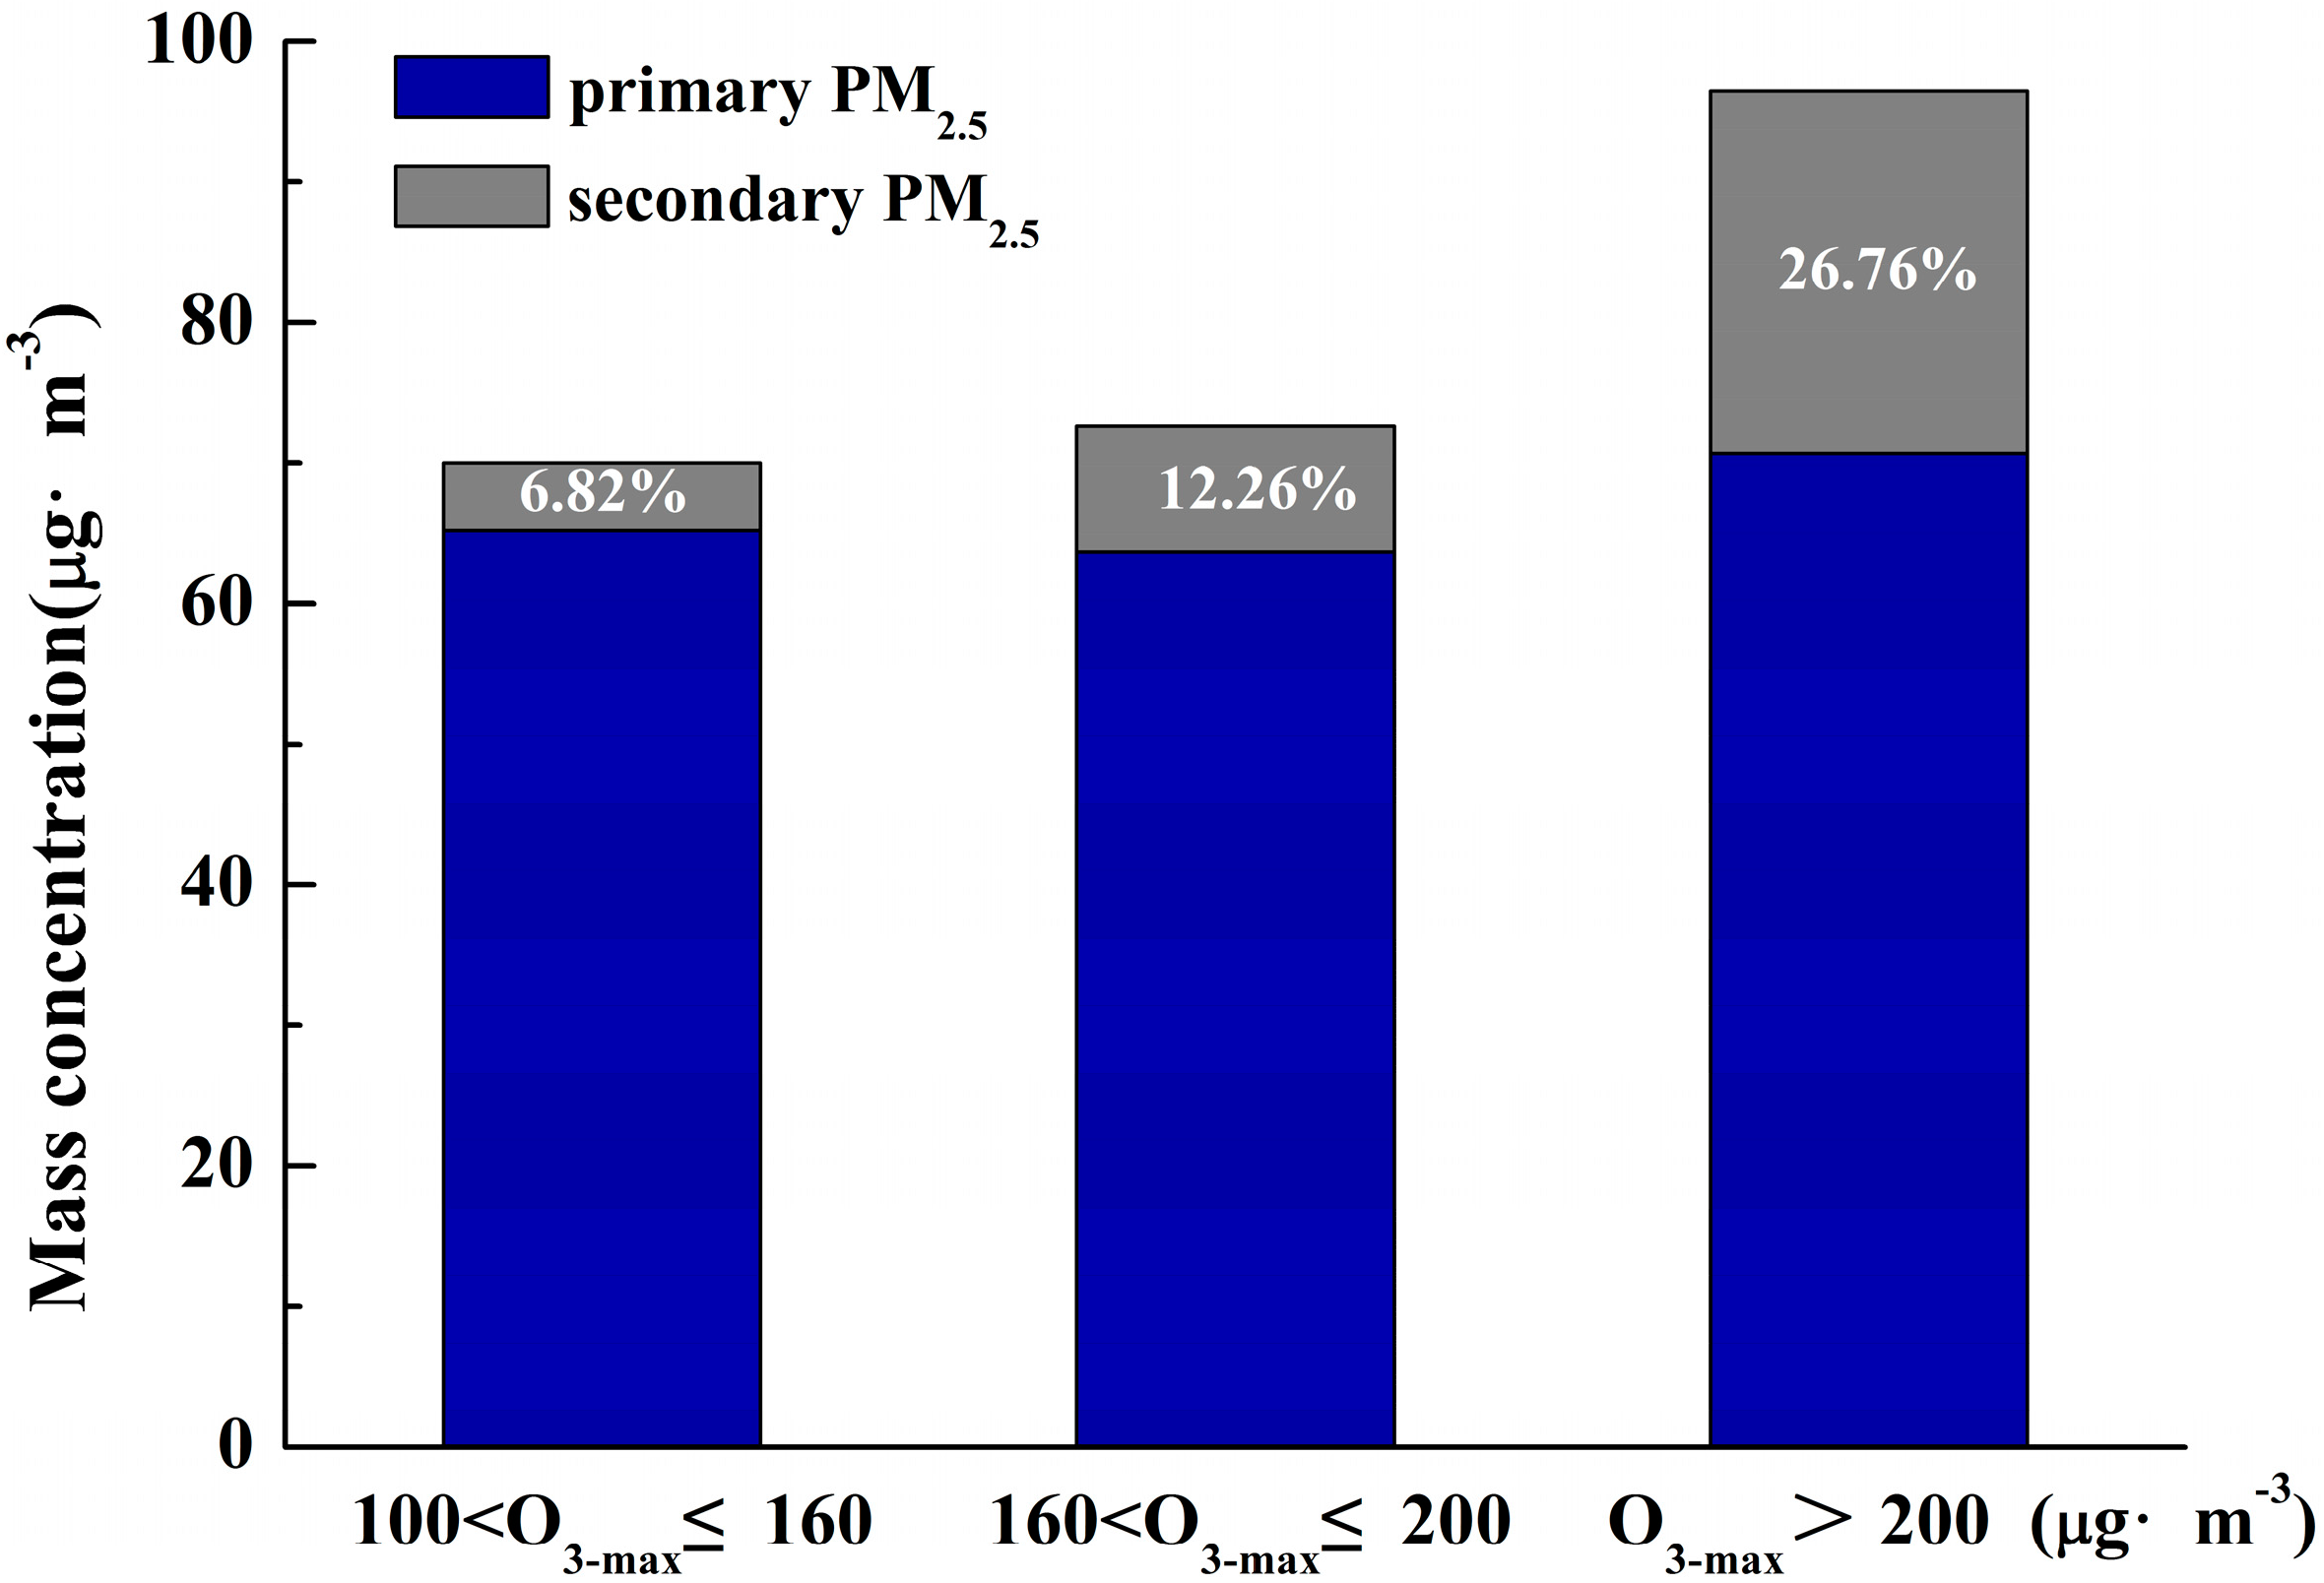
3.2. Strong Atmospheric Oxidation Promoting Secondary Particle Formation
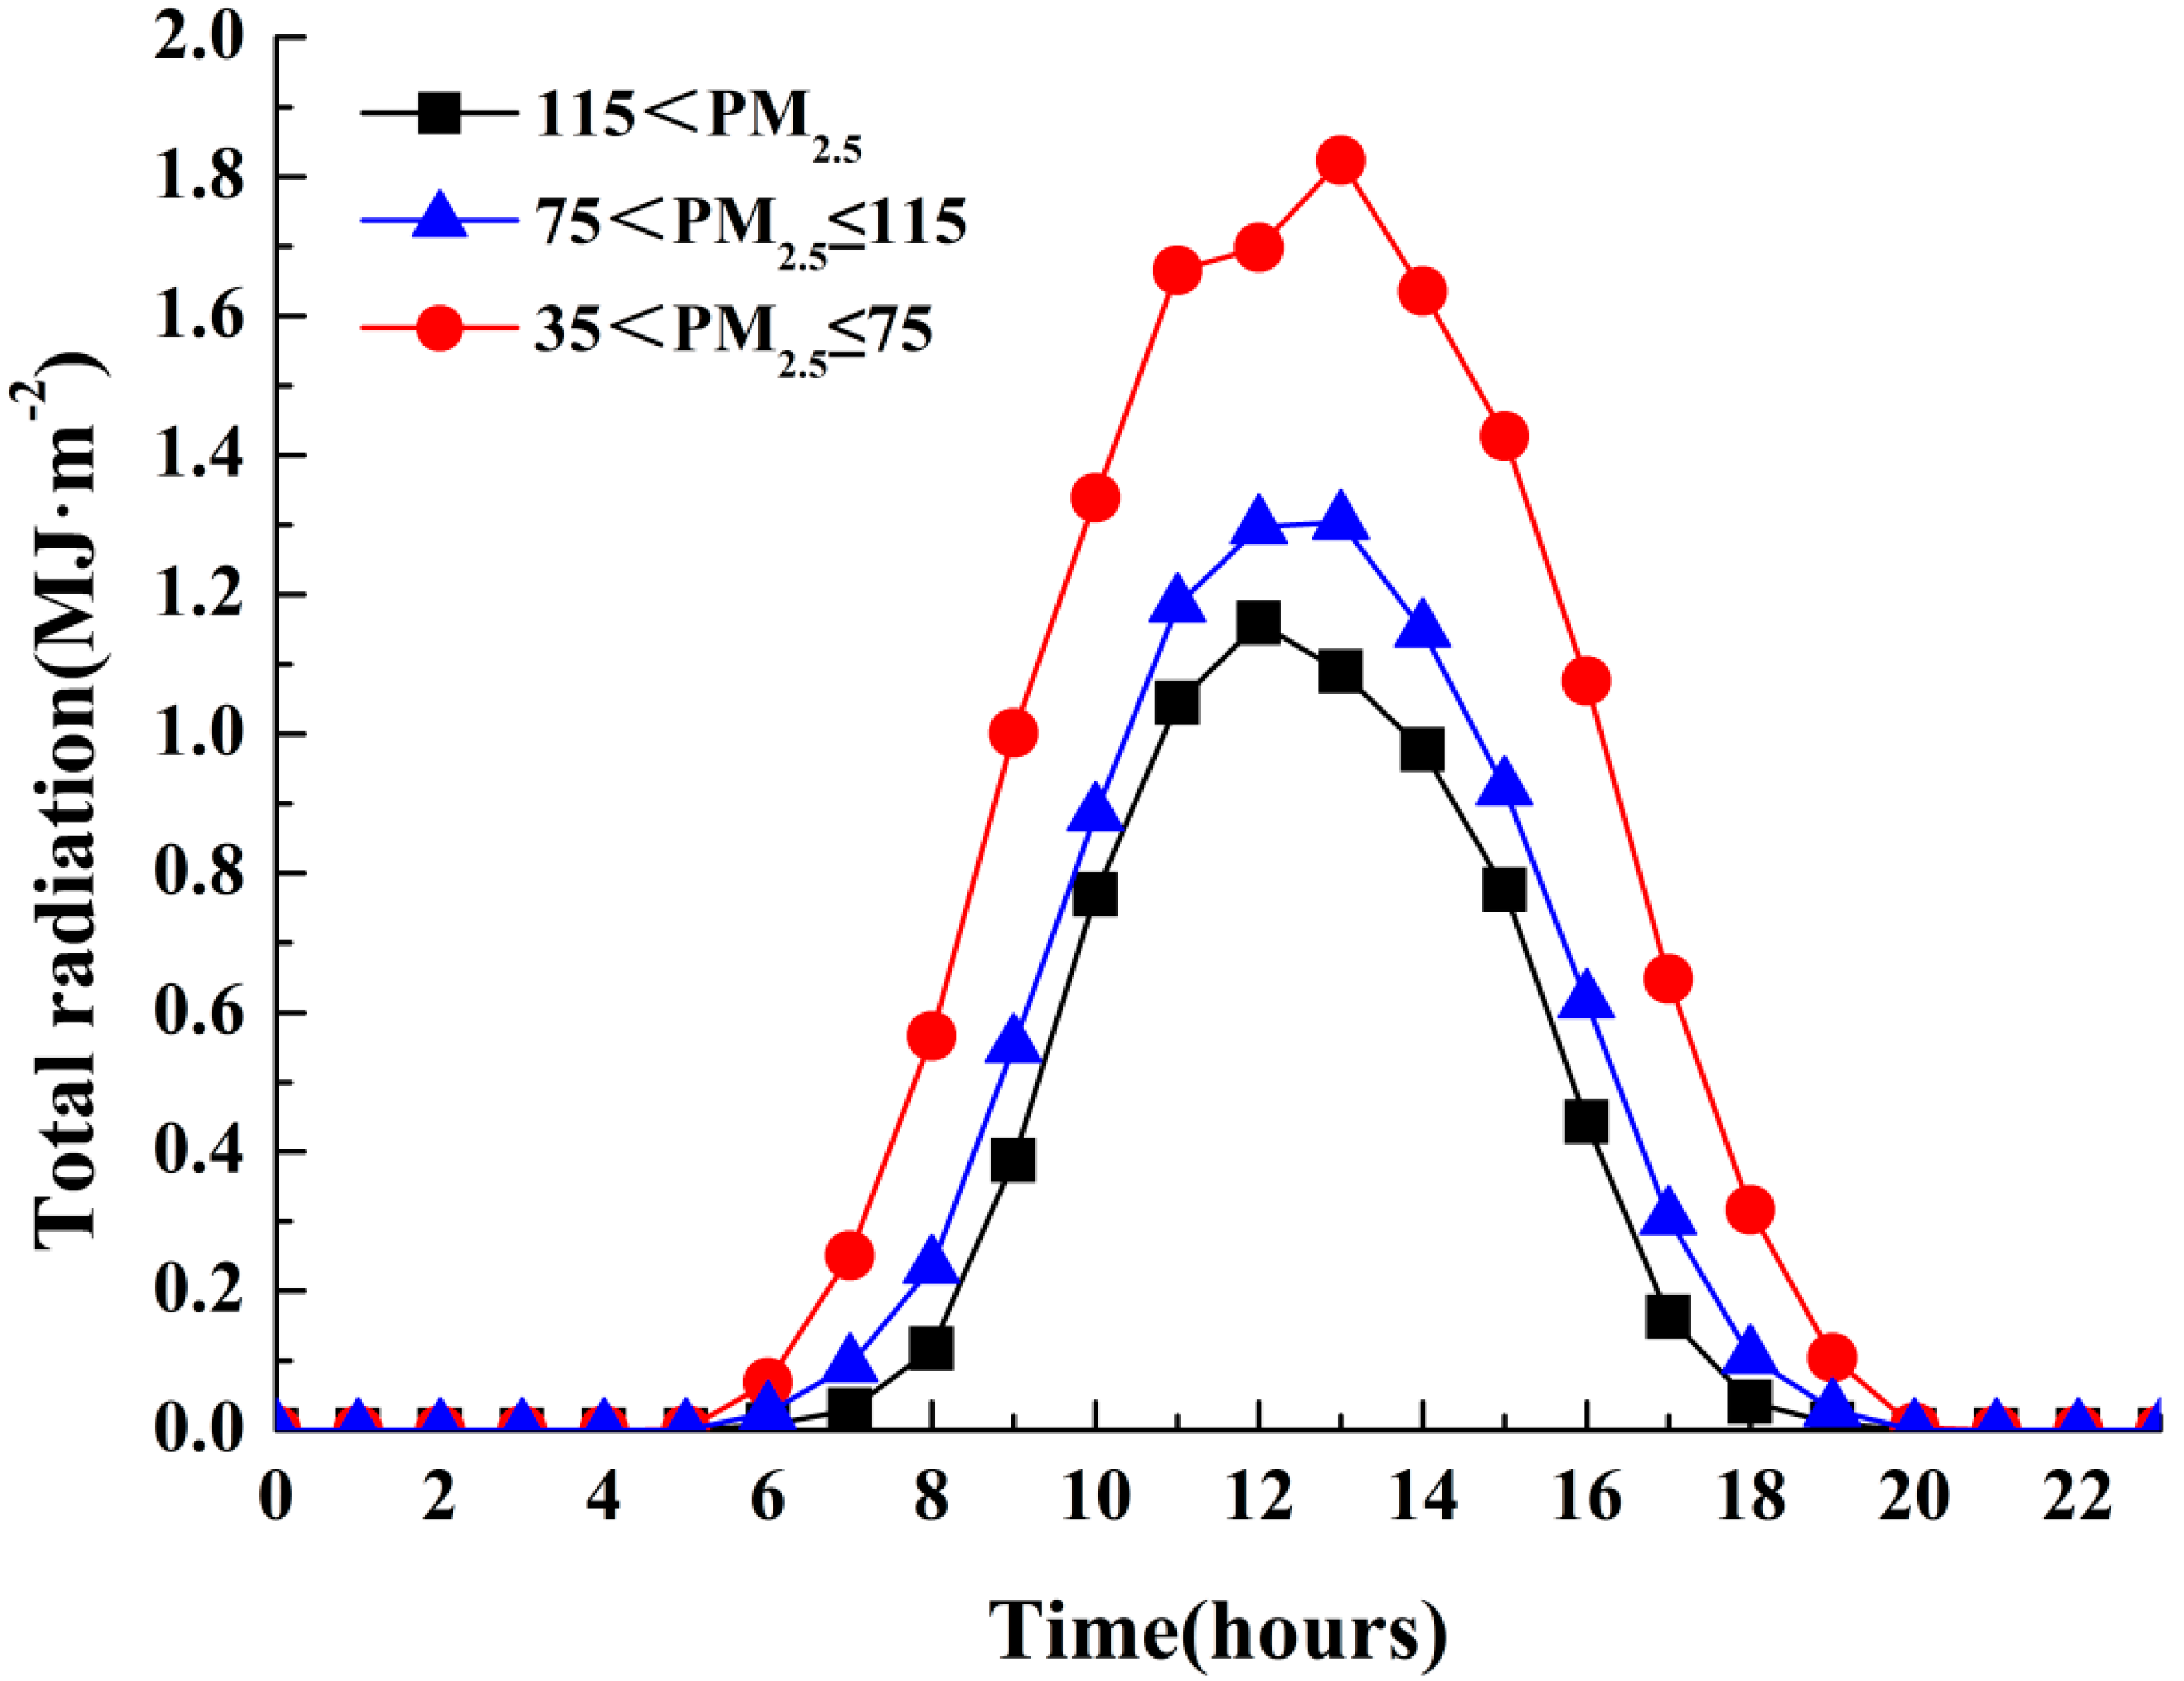
3.3. High PM2.5 Concentrations Suppressing Solar Radiation and O3 Production
4. Conclusions
Acknowledgments
Author Contributions
Conflicts of Interest
References
- Chen, X.; Zhang, L.W.; Huang, J.J.; Song, F.J.; Zhang, L.P.; Qian, Z.M.; Trevathan, E.; Mao, H.J.; Han, B.; Vaughn, M.; et al. Long-term exposure to urban air pollution and lung cancer mortality: A 12-year cohort study in Northern China. Sci. Total Environ. 2016, 571, 855–861. [Google Scholar] [CrossRef] [PubMed]
- Fang, D.; Wang, Q.; Li, H.; Yu, Y.; Yan, L.; Xin, Q. Mortality effects assessment of ambient PM2.5 pollution in the 74 leading cities of China. Sci. Total Environ. 2016, s569–s570, 1545–1552. [Google Scholar] [CrossRef] [PubMed]
- Parrish, D.D.; Zhu, T. Clean air for megacities. Science 2009, 326, 674–675. [Google Scholar] [CrossRef] [PubMed]
- Tie, X.; Cao, J. Aerosol Pollution in China: Present and Future Impact on Environment. Particuology 2009, 7, 426–431. [Google Scholar] [CrossRef]
- Zhang, Y.H.; Hu, M.; Zhong, L.J.; Wiedensohler, A.; Liu, S.C.; Andreae, M.O.; Wang, W.; Fan, S.J. Regional Integrated Experiments on Air Quality over Pearl River Delta 2004 (PRIDE-PRD2004): Overview. Atmos. Environ. 2008, 42, 6157–6173. [Google Scholar] [CrossRef]
- Tie, X.; Wu, D.; Brasseur, G. Lung cancer mortality and exposure to atmospheric aerosol particles in Guangzhou, China. Atmos. Environ. 2009, 43, 2375–2377. [Google Scholar] [CrossRef]
- Wang, Y.Q.; Zhang, X.Y.; Sun, J.Y.; Zhang, X.C.; Che, H.Z.; Li, Y. Spatial and temporal variations of the concentrations of PM10, PM2.5 and PM1 in China. Atmos. Chem. Phys. 2015, 15, 15319–15354. [Google Scholar] [CrossRef]
- Xiao, Z.M.; Zhang, Y.F.; Hong, S.M.; Bi, X.H.; Jiao, L.; Feng, Y.C.; Wang, Y.Q. Estimation of the Main Factors Influencing Haze, Based on a Long-term Monitoring Campaign in Hangzhou, China. Aerosol Air Qual. Res. 2011, 11, 873–882. [Google Scholar] [CrossRef]
- Leng, C.P.; Duan, J.Y.; Xu, C.; Zhang, H.F.; Wang, Y.F.; Wang, Y.Y.; Li, X.; Kong, L.D.; Tao, J.; Zhang, R.J.; et al. Insights into a historic severe haze weather in Shanghai: Synoptic situation, boundary layer and pollutants. Atmos. Chem. Phys. 2015, 15, 32561–32605. [Google Scholar] [CrossRef]
- Ma, Z.Q.; Xu, J.; Quan, W.J.; Zhang, Z.Y.; Lin, W.L. Significant increase of surface ozone at a regional background station in the eastern China. Atmos. Chem. Phys. Discuss. 2015, 15, 31951–31972. [Google Scholar] [CrossRef]
- Ma, J.Z.; Xu, X.B.; Zhao, C.; Yan, P. A Review of Atmospheric Chemistry Research in China: Photochemical Smog, Haze Pollution, and Gas-Aerosol Interactions. Adv. Atmos. Sci. 2012, 29, 1006–1026. [Google Scholar] [CrossRef]
- Meng, Z.; Dabdub, D.; Seinfeld, J.H. Chemical coupling between atmospheric ozone and particulate matter. Science 1997, 277, 116–119. [Google Scholar] [CrossRef]
- Ravishankara, A.R. Heterogeneous and Multiphase Chemistry in the Troposphere. Science 1997, 276, 1058–1065. [Google Scholar] [CrossRef]
- Jacob, D.J. Heterogeneous chemistry and tropospheric ozone. Atmos. Environ. 2000, 34, 2131–2159. [Google Scholar] [CrossRef]
- Li, G.; Zhang, R.; Fan, J.; Tie, X. Impacts of black carbon aerosol on photolysis and ozone. J. Geophys. Res. Atmos. 2005, 110, 3233–3250. [Google Scholar] [CrossRef]
- Li, J.; Wang, Z.; Wang, X.; Yamaji, K.; Takigawa, M.; Kanaya, Y.; Pochanart, P.; Liu, Y.; Irie, H.; Hu, B.; et al. Impacts of aerosols on summertime tropospheric photolysis frequencies and photochemistry over Central Eastern China. Atmos. Environ. 2011, 45, 1817–1829. [Google Scholar] [CrossRef]
- Li, L.; Chen, Z.M.; Zhang, Y.H.; Zhu, T.; Li, J.L.; Ding, J. Kinetics and mechanism of heterogeneous oxidation of sulfur dioxide by ozone on surface of calcium carbonate. Atmos. Chem. Phys. 2006, 6, 125–139. [Google Scholar] [CrossRef]
- Ge, B.; Sun, Y.; Liu, Y.; Dong, H.; Ji, D.; Jiang, Q.; Li, J.; Wang, Z. Nitrogen Dioxide Measurement by Cavity Attenuated Phase Shift Spectroscopy (CAPS) and Implications in Ozone Production Efficiency and Nitrate Formation in Beijing, China. J. Geophys. Res. 2013, 118, 9499–9509. [Google Scholar] [CrossRef]
- Huang, R.J.; Zhang, Y.; Bozzetti, C.; Ho, K.F.; Cao, J.J.; Han, Y.; Daellenbach, K.R.; Slowik, J.G.; Platt, S.M.; Canonaco, F. High secondary aerosol contribution to particulate pollution during haze events in China. Nature 2014, 514, 218–222. [Google Scholar] [CrossRef] [PubMed]
- Haywood, J.; Boucher, O. Estimates of the direct and indirect radiative forcing due to tropospheric aerosols: A review. Rev. Geophys. 2000, 38, 513–543. [Google Scholar] [CrossRef]
- Zhu, S.; Butler, T.; Sander, R.; Ma, J.; Lawrence, M.G. Impact of dust on tropospheric chemistry overpolluted regions: A case study of the Beijing megacity. Atmos. Chem. Phys. 2010, 10, 3855–3873. [Google Scholar] [CrossRef]
- Xu, J.; Zhang, Y.H.; Wang, W. Numerical study on the impacts of heterogeneous reactions on ozone formation in the Beijing urban area. Adv. Atmos. Sci. 2006, 23, 605–614. [Google Scholar] [CrossRef]
- Feng, T.; Bei, N.; Huang, R.J.; Cao, J.; Zhang, Q.; Zhou, W.; Tie, X.; Liu, S.; Zhang, T.; Su, X.; et al. Summertime ozone formation in Xi’an and surrounding areas, China. Atmos. Chem. Phys. Discuss. 2015, 15, 30563–30608. [Google Scholar] [CrossRef]
- Ding, Y. Monsoons over China. Adv. Atmos. Sci. 1994, 11, 252. [Google Scholar]
- Shao, M.; Wang, S.; Russell, A.G. Air pollution complex: Understanding the sources, formation processes and health effects. Front. Environ. Sci. Eng. 2016, 10, 20. [Google Scholar] [CrossRef]
- Xu, X.; Zhao, T.; Liu, F.; Gong, S.L.; Kristovich, D.; Lu, C.; Guo, Y.; Cheng, X.; Wang, Y.; Ding, G. Climate modulation of the Tibetan Plateau on haze in China. Atmos. Chem. Phys. 2015, 15, 28915–28937. [Google Scholar] [CrossRef]
- Jacob, D.J.; Winner, D.A. Effect of Climate Change on Air Quality. Atmos. Environ. 2009, 43, 51–63. [Google Scholar] [CrossRef]
- Ebi, K.; Mcgregor, G. Climate change, tropospheric ozone and particulate matter, and health impacts. Ciênc. Saúde Coletiva 2008, 116, 1449–1455. [Google Scholar] [CrossRef] [PubMed]
- Wang, H.J.; Chen, H.P. Understanding the recent trend of haze pollution in eastern China: Roles of climate change. Atmos. Chem. Phys. 2016, 16, 1–18. [Google Scholar] [CrossRef]
- Clapp, L.J.; Jenkin, M.E. Analysis of the relationship between ambient levels of O3, NO2, and NO as a function of NOx, in the UK. Atmos. Environ. 2001, 35, 6391–6405. [Google Scholar] [CrossRef]
- Stephens, S.; Madronich, S.; Wu, F.; Olson, J.B. Weekly patterns of México City’s surface concentrations of CO, NOx, PM10 and O3 during 1986–2007. Atmos. Chem. Phys. 2008, 8, 5313–5325. [Google Scholar] [CrossRef]
- Cheung, V.T.; Wang, T. Observational study of ozone pollution at a rural site in the Yangtze Delta of China. Atmos. Environ. 2001, 35, 4947–4958. [Google Scholar] [CrossRef]
- Zhang, W.; Capps, S.L.; Hu, Y.; Nenes, A. Development of the high-order decoupled direct method in three dimensions for cparticulate matter: Enabling advanced sensitivity analysis in air quality models. Geosci. Model Dev. Discuss. 2011, 5, 355–368. [Google Scholar] [CrossRef] [Green Version]
- Na, K.; Sawant, A.; Song, C.; Cocker, D. Primary and secondary carbonaceous species in the atmosphere of Western Riverside County, California. Atmos. Environ. 2004, 38, 1345–1355. [Google Scholar] [CrossRef]
- Grosjean, D. Organic acids in Southern California air: Ambient concentrations, mobile source emissions, in situ formation and removal processes. Environ. Sci. Technol. 1989, 23, 1506–1514. [Google Scholar] [CrossRef]
- Rodriguez, S.; Querol, X.; Alastuey, A.; Mantilla, E. Origin of high summer PM10 and TSP concentrations at rural sites in Eastern Spain. Atmos. Environ. 2002, 36, 3101–3112. [Google Scholar] [CrossRef]
- Turpin, B.J.; Huntzicker, J.J. Identification of secondary organic aerosol episodes and quantitation of primary and secondary organic aerosol concentrations during SCAQS. Atmos. Environ. 1995, 29, 3527–3544. [Google Scholar] [CrossRef]
- Chang, S.C.; Lee, C.T. Secondary aerosol formation through photochemical reactions estimated by using air quality monitoring data in Taipei City from 1994 to 2003. Atmos. Environ. 2007, 41, 4002–4017. [Google Scholar] [CrossRef]
- Dawson, J.P.; Bloomer, B.J.; Winner, D.A.; Weaver, C.P. Understanding the Meteorological Drivers of U.S. Particulate Matter Concentrations in a Changing Climate. Bull. Am. Meteorol. Soc. 2014, 95, 521–532. [Google Scholar] [CrossRef]
- John, G.W. Visibility: Science and regulation. J. Air Waste Manag. Assoc. 2002, 52, 628–713. [Google Scholar]
- Tao, J.; Zhang, L.; Ho, K.; Zhang, R.; Lin, Z.; Zhang, Z.; Lin, M.; Cao, J.; Liu, S.; Wang, G. Impact of PM 2.5, chemical compositions on aerosol light scattering in Guangzhou—The largest megacity in South China. Atmos. Res. 2014, 135–136, 48–58. [Google Scholar] [CrossRef]
- Dickerson, R.R.; Kondragunta, S.; Stenchikov, G.; Civerolo, K.L.; Doddridge, B.G.; Holben, B.N. The impact of aerosols on solar ultraviolet radiation and photochemical smog. Science 1997, 278, 827. [Google Scholar] [CrossRef] [PubMed]
- Li, G.; Bei, N.; Tie, X.; Molina, L.T. Aerosol effects on the photochemistry in Mexico City during MCMA-2006/MILAGRO campaign. Atmos. Chem. Phys. 2011, 11, 5169–5182. [Google Scholar] [CrossRef] [Green Version]
- Twomey, S. Pollution and the planetary albedo. Atmos. Environ. 2007, 8, 1251–1256. [Google Scholar] [CrossRef]
- Menon, S.; Unger, N.; Koch, D.; Francis, J.; Garrett, T.; Sednev, I.; Shindell, D.; Streets, D. Aerosol climate effects and air quality impacts from 1980 to 2030. Environ. Res. Lett. 2008, 3, 024004. [Google Scholar] [CrossRef]
- Unger, N.; Menon, S.; Shindell, D.T.; Koch, D.M. Impacts of aerosol indirect effect on past and future changes in tropospheric composition. Atmos. Chem. Phys. Discuss. 2009, 9, 4115–4129. [Google Scholar] [CrossRef]


| Seasons | 35 < PM2.5 ≤ 75 | 75 < PM2.5 ≤ 115 | PM2.5 > 115 |
|---|---|---|---|
| cold | 38.1% | 70.0% | 91.7% |
| hot | 61.9% | 30.0% | 8.3% |
| Seasons | 100 < O3 ≤ 160 | 160 < O3 ≤ 200 | O3 > 200 |
|---|---|---|---|
| cold | 18.4% | 0.0% | 0.0% |
| hot | 81.6% | 100.0% | 100.0% |
| Seasons | Surface Air Temperature (°C) | Total Radiation (MJ·m−2) |
|---|---|---|
| cold | 5.2 ± 4.3 | 0.26 ± 0.53 |
| hot | 25.6 ± 4.2 | 0.66 ± 1.05 |
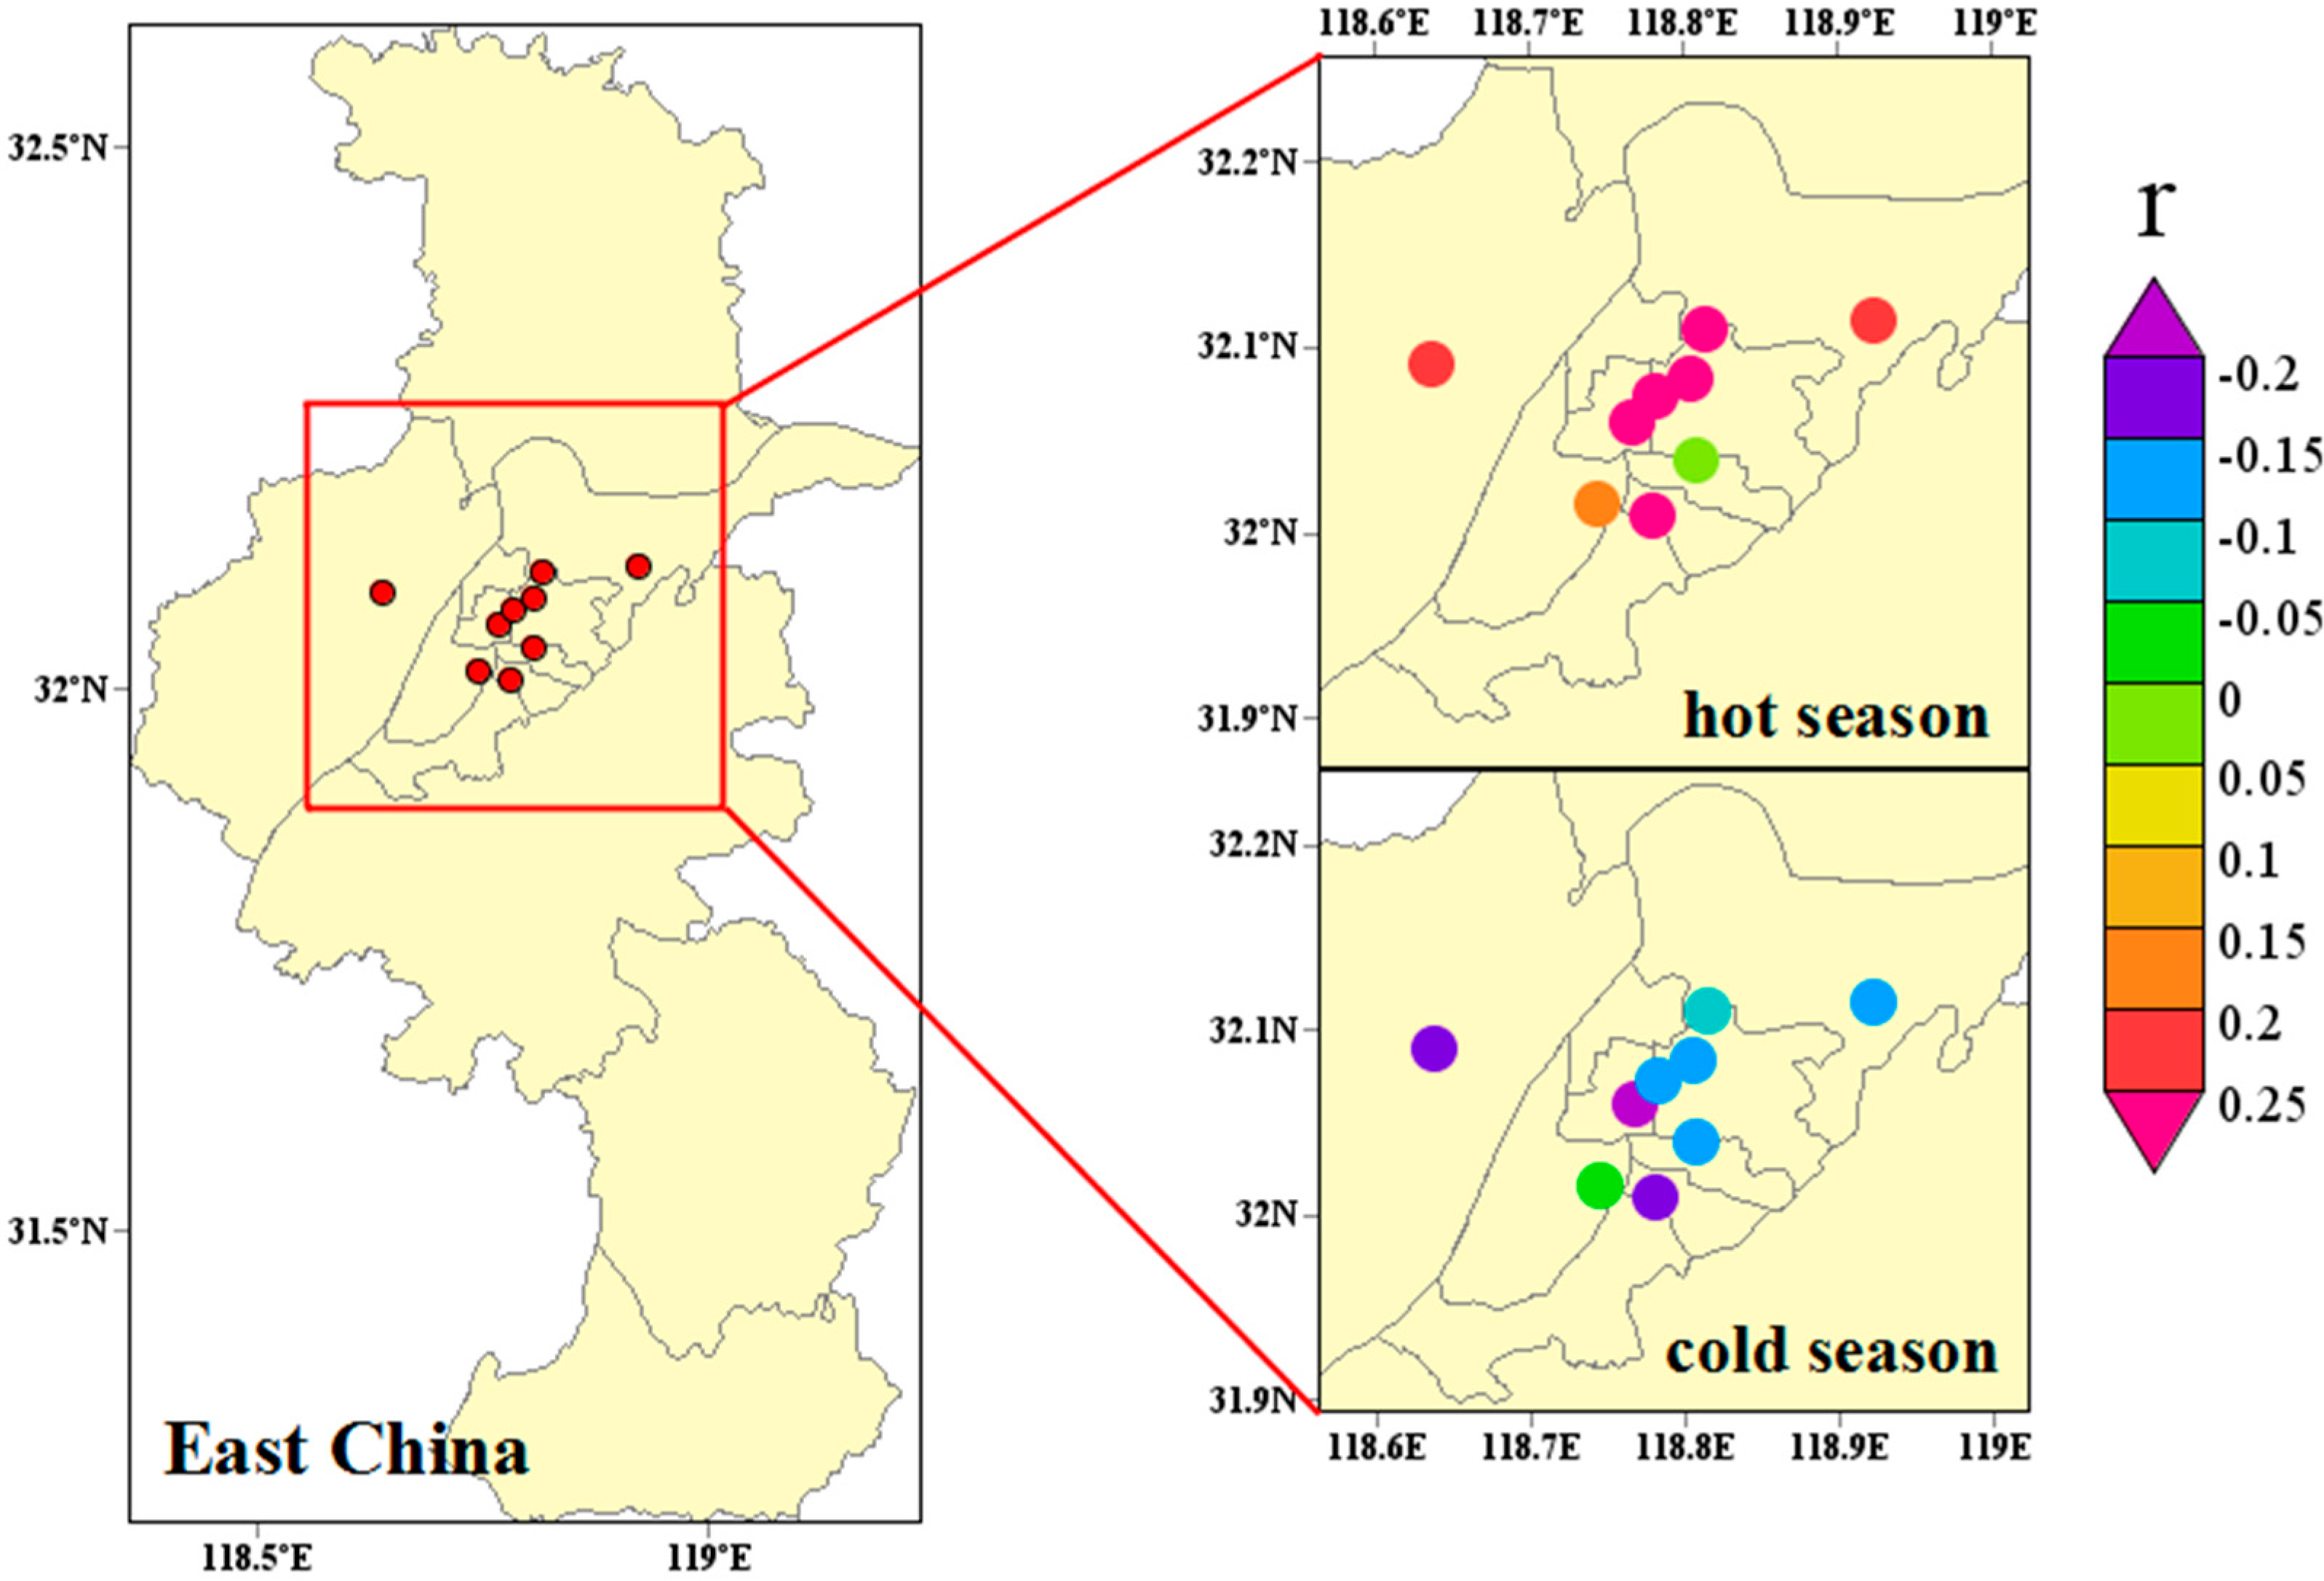
| Seasons | Average OX (μg·m−3) | O3/OX Ratios | Correlation to NO2 | Correlation to O3 |
|---|---|---|---|---|
| cold | 95.4 | 0.36 | 0.68 ** | 0.14 * |
| hot | 105.0 | 0.61 | 0.49 ** | 0.95 ** |
© 2017 by the authors. Licensee MDPI, Basel, Switzerland. This article is an open access article distributed under the terms and conditions of the Creative Commons Attribution (CC BY) license ( http://creativecommons.org/licenses/by/4.0/).
Share and Cite
Jia, M.; Zhao, T.; Cheng, X.; Gong, S.; Zhang, X.; Tang, L.; Liu, D.; Wu, X.; Wang, L.; Chen, Y. Inverse Relations of PM2.5 and O3 in Air Compound Pollution between Cold and Hot Seasons over an Urban Area of East China. Atmosphere 2017, 8, 59. https://doi.org/10.3390/atmos8030059
Jia M, Zhao T, Cheng X, Gong S, Zhang X, Tang L, Liu D, Wu X, Wang L, Chen Y. Inverse Relations of PM2.5 and O3 in Air Compound Pollution between Cold and Hot Seasons over an Urban Area of East China. Atmosphere. 2017; 8(3):59. https://doi.org/10.3390/atmos8030059
Chicago/Turabian StyleJia, Mengwei, Tianliang Zhao, Xinghong Cheng, Sunling Gong, Xiangzhi Zhang, Lili Tang, Duanyang Liu, Xianghua Wu, Liming Wang, and Yusheng Chen. 2017. "Inverse Relations of PM2.5 and O3 in Air Compound Pollution between Cold and Hot Seasons over an Urban Area of East China" Atmosphere 8, no. 3: 59. https://doi.org/10.3390/atmos8030059