

Atmosphere, Volume 8, Issue 4 (April 2017) – 16 articles
Cover Story (view full-size image):
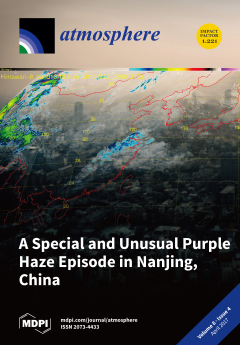
A special and unusual purple (magenta) haze episode was observed in Nanjing, China, at 17:00 on 22 December 2015. Many local and national news outlets reported on this event. One explanation of how a purple (combination of blue and red) light could be created is by green wavelengths being absorbed. Another way involves pollution gases or particles together with small liquid/water droplets, but this still needs further clarification. A third possibility is that the combination of transmitted red light from the sun and scattered blue light could produce a purple/magenta color in the sky. By Duanyang Liu. View this paper.
- Issues are regarded as officially published after their release is announced to the table of contents alert mailing list.
- You may sign up for e-mail alerts to receive table of contents of newly released issues.
- PDF is the official format for papers published in both, html and pdf forms. To view the papers in pdf format, click on the "PDF Full-text" link, and use the free Adobe Reader to open them.
Previous Issue
Next Issue