Article

Characteristics of Carbonaceous Aerosol in a Typical Industrial City—Nanjing in Yangtze River Delta, China: Size Distributions, Seasonal Variations, and Sources

1
Collaborative Innovation Center on Forecast and Evaluation of Meteorological Disasters, Key Laboratory for Aerosol-Cloud-Precipitation of China Meteorological Administration, Nanjing University of Information Science and Technology, Nanjing 210044, China
2
Jiaxing Environmental Monitoring Station, Jiaxing 314000, China
3
Fujian Provincial Meteorological Bureau, Fuzhou 350001, China
*
Author to whom correspondence should be addressed.
Atmosphere 2017, 8(4), 73; https://doi.org/10.3390/atmos8040073
Submission received: 27 February 2017 / Revised: 28 March 2017 / Accepted: 5 April 2017 / Published: 7 April 2017
(This article belongs to the Special Issue Carbonaceous Aerosols in Atmosphere)

Abstract

:
In order to investigate the size distributions and seasonal variations of carbonaceous aerosols (organic carbon (OC) and elemental carbon (EC)), the carbonaceous species were collected in Nanjing, a typical industrial city located in Yangtze River Delta, China, in the summer, autumn, and winter of 2013 and spring of 2014, and then analyzed by using a 9-stage Anderson-type aerosol sampler and DRI Model 2001A Thermal/Optical Carbon Analyzer. OC, EC, secondary organic carbon (SOC), and primary organic carbon (POC) exhibited obvious seasonal variations, with the highest levels in winter (39.1±14.0, 5.7 ± 2.1, 23.6 ± 11.7, and 14.1 ± 5.7 μg·m−3, respectively) and the lowest levels in summer (20.6 ± 6.7, 3.3 ± 2.0, 12.2 ± 3.8 and 8.4 ± 4.1 μg·m−3, respectively), and were mainly centralized in PM1.1 in four seasons. The concentrations of OC in PM1.1 varied in the order of winter > autumn > spring > summer, while EC ranked in the order of autumn > winter > summer > spring. In the PM1.1–2.1 and PM2.1–10, the concentrations of OC and EC decreased in the sequence of winter > spring > autumn > summer. The size spectra of OC, EC, and SOC had bimodal distributions in four seasons, except for EC with four peaks in summer. The size spectra of POC varied greatly with seasons, exhibiting bimodal distribution in winter, trimodal distribution in spring and summer, and four peaks in autumn. The OC/EC ratios were 7.0, 6.3, 7.6, and 6.9 in spring, summer, autumn and winter, respectively, which demonstrated the abundance of secondary organic aerosols in Nanjing. The sources of carbonaceous aerosol varied significantly with seasons, and were dominated by vehicle exhaust, and coal and biomass burning in PM2.1, and dominated by dust, and coal and biomass burning in PM2.1–10.

1. Introduction

Carbonaceous aerosol fractions, accounting for 10%–50% of particle matter (PM) concentrations, play a key role in visibility, human health, Earth’s radiation balance, and cultural heritage [1,2,3,4,5,6,7,8,9,10]. Carbonaceous aerosols are generally divided into organic carbon (OC), elemental carbon (EC), and inorganic carbonate carbon (CC). The OC are normally generated from primary and secondary sources, while EC originate mainly from incomplete fuel combustions of industrial boilers/kilns and residential stoves, iron and steel production, and vehicles [2]. Previous studies also observed that both OC and EC can be formed from emissions of coal, fossil fuels, biomass, and industrial activities [11,12].
At present, the characteristics of carbonaceous aerosols have been extensively studied worldwide, including their mass concentration and sources [2,11,13,14,15,16,17,18,19,20], seasonal and spatial variations [21,22,23,24], size distributions [6,9,10,25,26,27,28], impacts on visibility [5,29], connections with meteorological conditions [30,31,32], and transformation mechanisms [13,14,33]. Andreae et al. [33] and Li et al. [22] revealed that the OC proportion contributed by biomass burning can be calculated by using the mass concentration ratio of OC and K+. Related research studies determined that the OC/EC ratio could be used to determine the sources of the carbonaceous aerosols in the atmosphere [15,34,35,36,37].
With the rapid growth of China’s economy and urbanization, carbonaceous aerosols are proved to be one of the major pollutants in China [38,39]. As one of the three major regions in eastern China (Yangtze River Delta (YRD), Beijing-Tianjin-Hebei, and Pearl River Delta), the YRD has been suffering the highest aerosol concentrations and the longest pollution episodes [11,22,40,41,42]. The organic matter (OM) and black carbon (BC) in PM1 was estimated to be 32.1% and 9.1% in summer, and 30.3% and 16.9% in winter, respectively in the YRD [43]. Cao et al. [1] reported the annual combined concentration of OC and EC was 25.5 μg·m−3 and constituted about 28.5% in PM10 in Hangzhou. Li et al. [22] estimated that the mass fraction of the total carbonaceous aerosol (TCA) in PM2.5 was 23% in Nanjing. Feng et al. [44] calculated that the total amount of OC and EC was in the range of 17.5–20.4 μg·m−3 and that TCA contributed to about 30% of PM2.5 in Shanghai. In 2010, emissions of three major PM2.5 species in the YRD, namely OC, EC, and sulfate, were136.9 kt, 75.0 kt, and 76.2 kt, respectively [45]. Hou et al. [46] demonstrated that concentrations of OC and EC on haze days were 1.5–3.9 times higher than those on clean days in Shanghai. However, these studies were mainly focused upon the characteristics of carbonaceous aerosols in PM2.5 or PM10 with few concerns about their size distributions in different seasons. An understanding of the size distribution characteristics of EC and OC is essential when studying the aerosol sources, light extinction, and their effects on regional and global climate and human health [12,25,28]. In this study, the size distributions of carbonaceous aerosols (OC and EC) were collected over different seasons in Nanjing, a typical industrial city located in Yangtze River Delta, China, and further analyzed by using a 9-stage Anderson-type aerosol sampler and DRI Model 2001A Thermal/Optical Carbon Analyzer. We also calculated the concentrations of secondary organic carbon (SOC) and primary organic carbon (POC). This paper reports the concentration levels and the seasonal variations of these measured species. Furthermore, we discuss the different size segments of carbonaceous aerosol sources in four seasons. It is important to analyze the size distribution of OC, EC, OC/EC, ratios and SOC for better understanding the sources, formation mechanisms, and control strategy of carbonaceous aerosols in atypical polluted city.

2. Instruments and Experiments

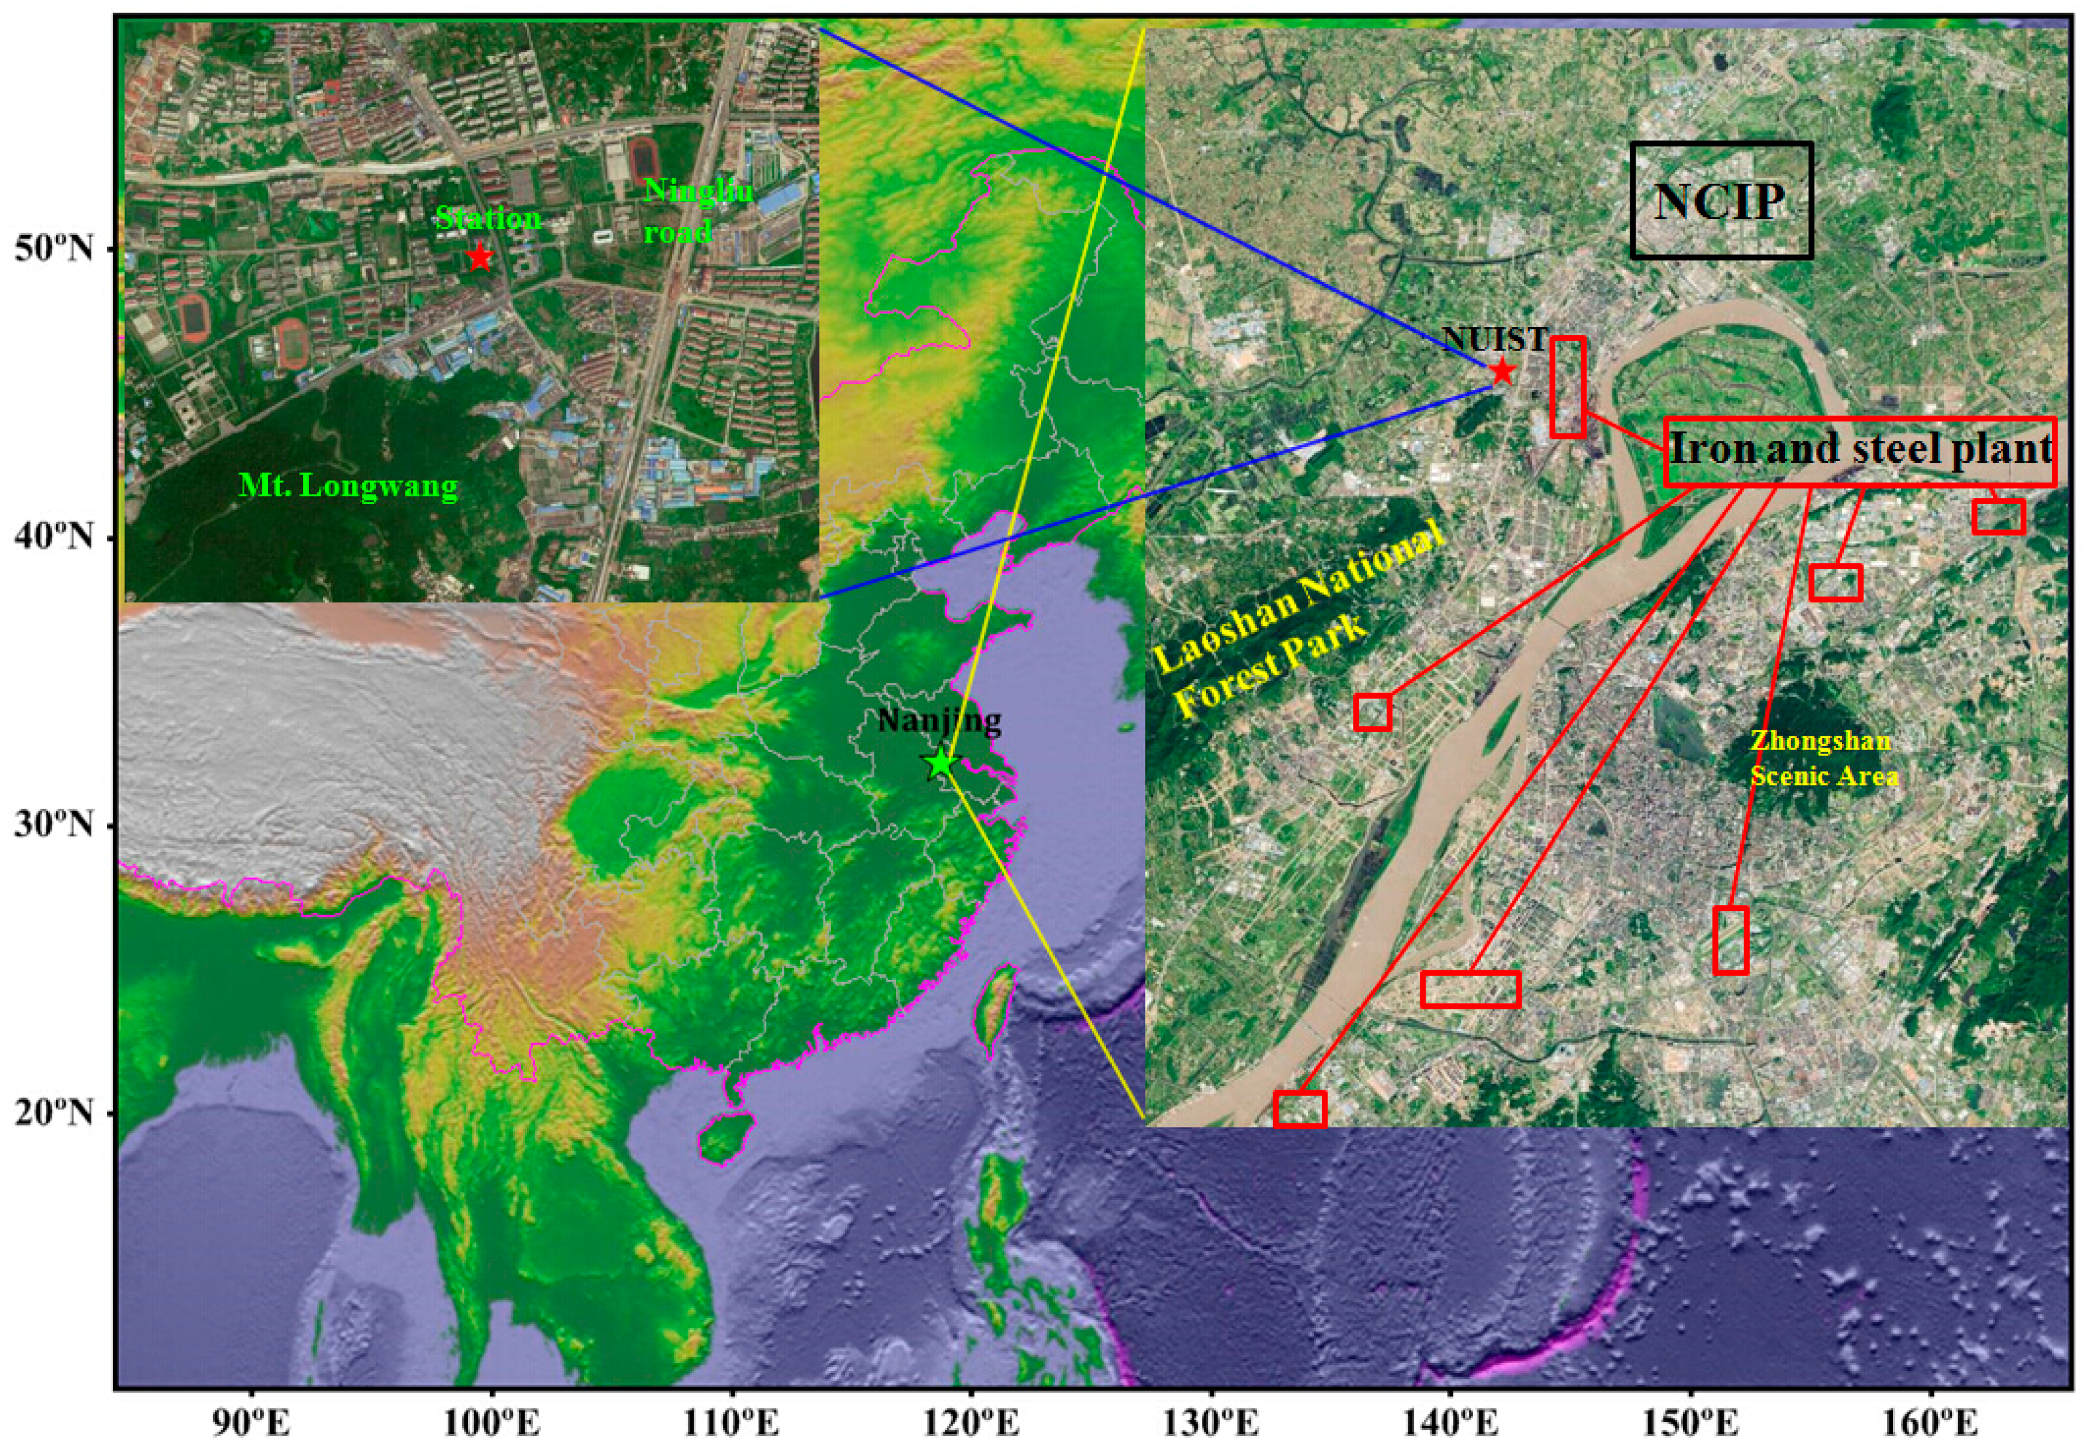
2.1. Observation Stations and Experiment Descriptions

The observation site was located on the meteorology building (32.21° N, 118.72° E) of the Nanjing University of Information Science & Technology campus, which is 40 m above the ground. The information of the station and its surroundings is shown in Figure 1. The Nanjing Chemical Industry Park (NCIP) is located approximately 3 km from the measurement site. In addition, there are some iron and steel plants and cogeneration power plants in the range of 1 km from the site. This region represents a combination of traffic, urban, industry, and croplands sources of pollutions.
The measurements were carried out during 17 April to 22 May 2014 (spring), 1 June to 17 July 2013 (summer), 15 October to 13 November 2013 (autumn), and 30 December 2013 to 23 January 2014 (winter) (Table 1). The main meteorological factor changes were recorded by an automatic weather station. The size-segregated aerosol particles were continuously collected for 23 h. After excluding the invalid data, 135 samples were obtained during the observation period, there were 36, 44, 30, and 25 samples in spring, summer, autumn, and winter, respectively. Every sample contained data about OC and EC particles in nine size segments in PM10. The YRD region has a subtropical monsoon climate, which generally consists of a southeast wind, high temperature, and abundant precipitation in summer. The average temperature and relative humidity (RH) in summer were 26.4 ± 4.5 °C and 67.3% ± 16.2%, respectively (Table 1). Table 1 also shows that the RH in each of the four seasons was higher than 50%, and that the wind speeds were high in spring and summer, and low in autumn and winter.

2.2. Instrumentation

The sampling observations were carried out by a 9-stage Anderson-type aerosol sampler (Anderson 2000 Inc., Peachtree City, GA, USA) with size ranges of <0.43, 0.43–0.65, 0.65–1.1, 1.1–2.1, 2.1–3.3, 3.3–4.7, 4.7–5.8, 5.8–9.0, and 9.0–10.0 μm for carbonaceous aerosols. The flow rate required by the Anderson-type aerosol sampler is 28.3 L/min. The sampler was operated with 81 mm quartz fiber filters (Whatman, Clifton, UK), and the filters were baked at 800 °C for 4 h before sampling in order to minimize the potential background effect of organic carbon.
The OC and EC collected by quartz filter were then analyzed with a DRI Model 2001A Thermal/Optical Carbon Analyzer (Desert Research Institute, Reno, NV, USA), using the IMPROVE_A (Interagency Monitoring of Protected Visual Environments) protocol [47] to measure the carbon fractions. The filter was heated stepwise to 140 °C, 280 °C, 480 °C, and 580 °C in a pure helium environment to determine OC1, OC2, OC3, and OC4, respectively. Consequently, the filter was heated to 580 °C, 740 °C, and 840 °C in 2% O2/98% He to determine EC1, EC2, and EC3, respectively. One sample was selected at random from every 10 samples to carry out a duplicate sample analysis. The errors in the measurement presented here were less than 10% for total carbon (TC). Field blanks were used to determine any possible background contamination; the OC and EC concentrations in the field blanks were less than 1% of the sample levels.
For calibration and quality control, measurement with pre-fired filter blank, standard sucrose solution, and replicate analysis were performed. Field blank samples were collected in each season and their concentration levels of OC and EC were 0.5–0.7 and 0–0.03 μg·cm−2, less than 3% and 1% of the samples, respectively. The samples were corrected by each of the field blank samples. The detect limit for OC and EC was 0.45 μg·cm−2 and 0.06 μg·cm−2, respectively. More information about the instruments (e.g., precision and calibration) and the methods of data quality control were reported by Cao et al. [11], Chow et al. [4,47], Han et al. [48], and Li et al. [22,26].

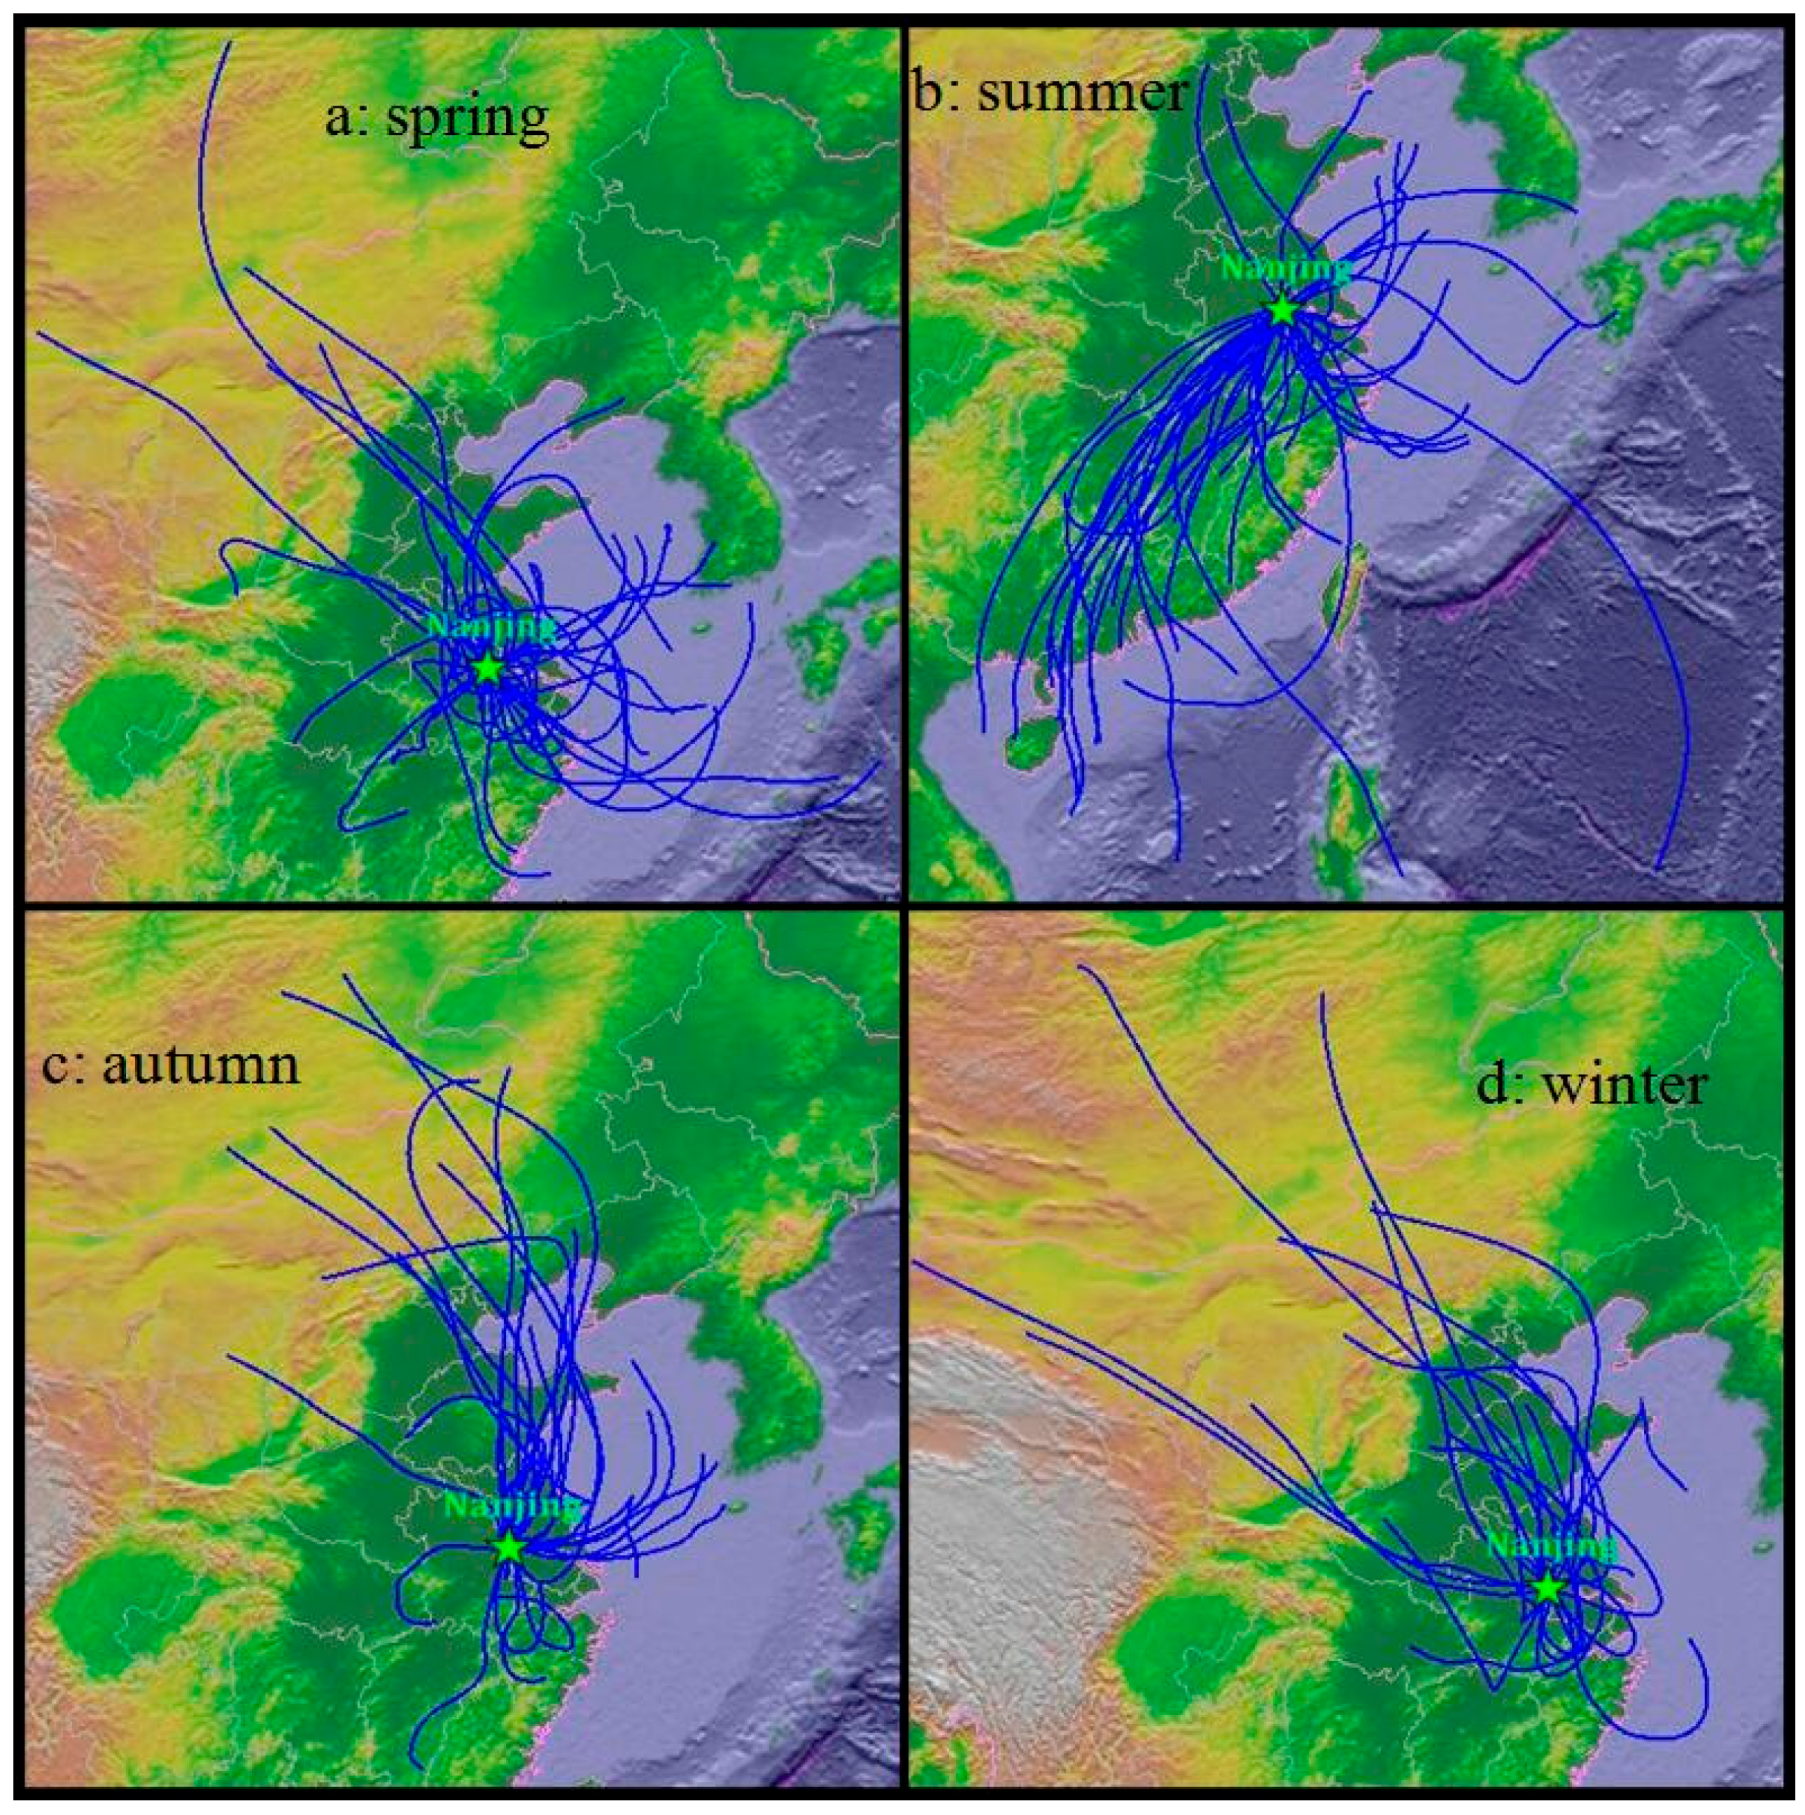
2.3. Air Mass Backward Trajectories

Air mass backward trajectories for 24 h of each day were simulated using the Hybrid Single-Particle Lagrangian Integrated Trajectory (HYSPLIT) model, which was developed by the National Oceanic and Atmospheric Administration (NOAA) Air Resources Laboratory (ARL). The backward trajectories were calculated at 12:00 (LST, local time) and at the height of 500 m above the observation sites. The National Weather Service’s National Centers for Environmental Prediction (NCEP) Global Data Assimilation System (GDAS) archive was used for meteorological input data. The GDAS data has a horizontal resolution of 1.0° × 1.0°.

3. Results and Discussion

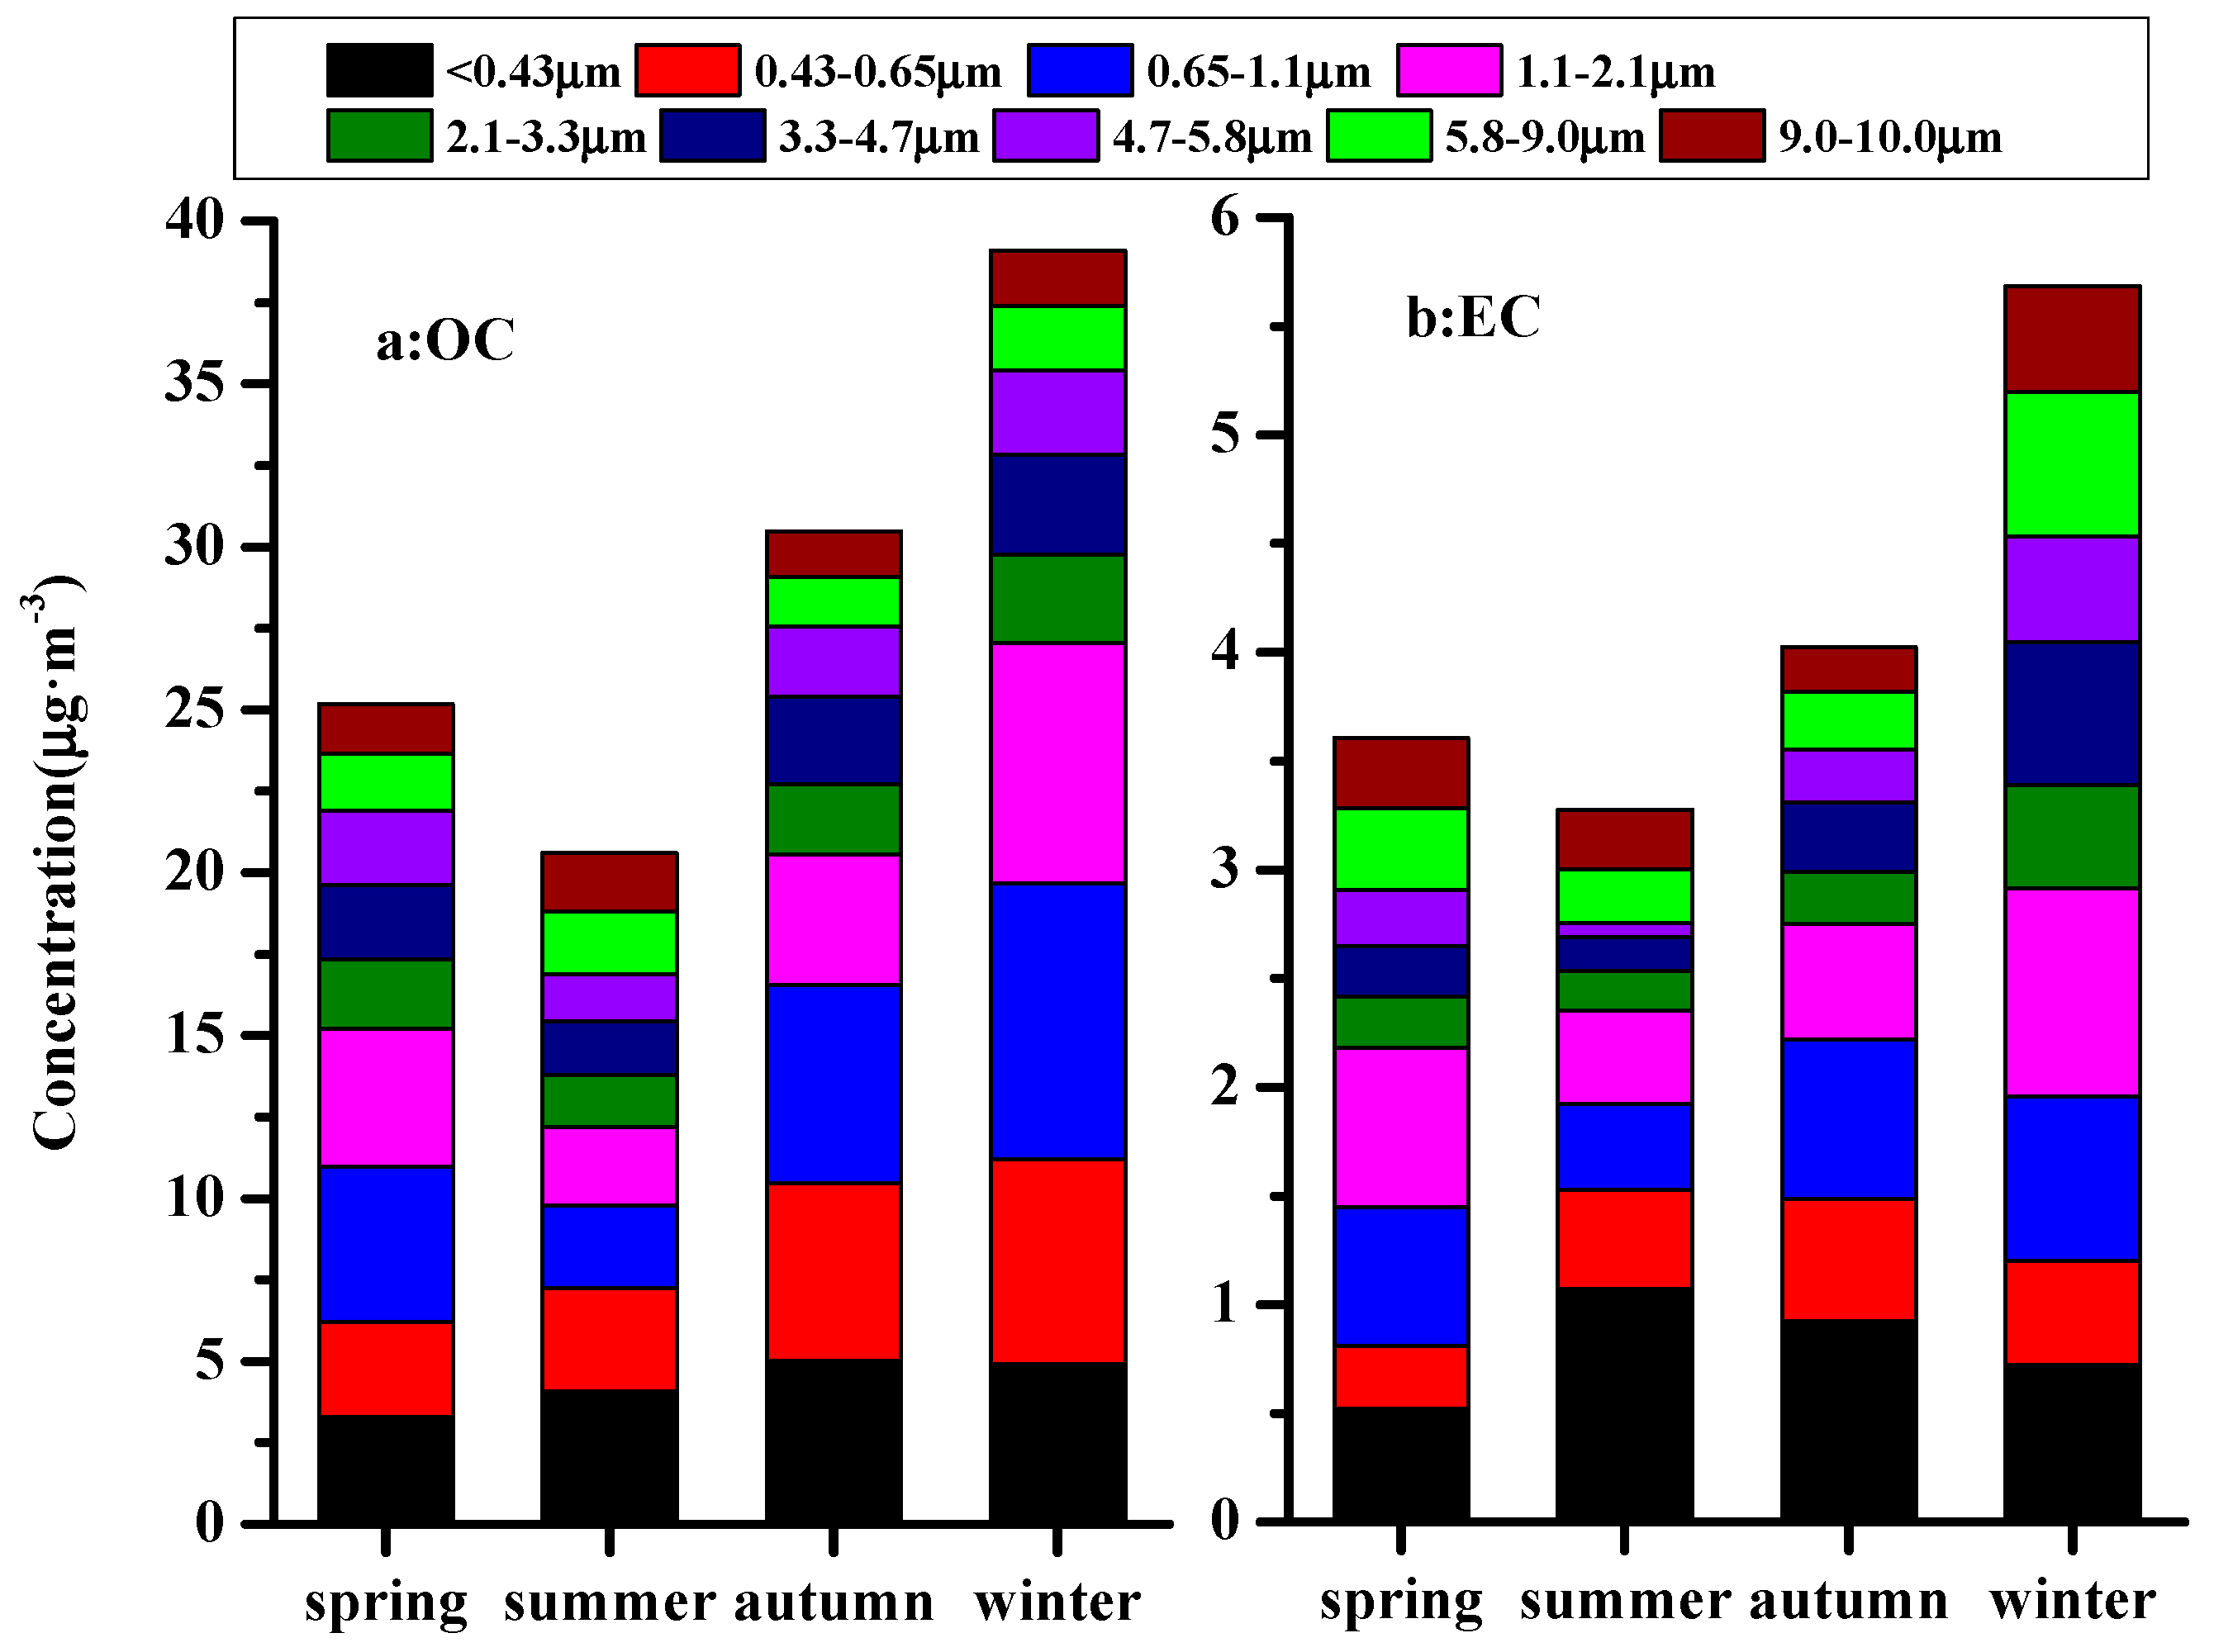
3.1. Seasonal Variations of the Carbonaceous Aerosol

Figure 2a exhibits that the seasonal variations of OC ranked in the order of winter (39.1 μg·m−3) > autumn (30.5 μg·m−3) > spring (25.2 μg·m−3) >summer (20.6 μg·m−3) in Nanjing, which was similar to that of EC, which had the average concentrations of 5.7, 4.0, 3.6, and 3.3 μg·m−3 in winter, autumn, spring, and summer, respectively (see Figure 2b). This phenomenon might be attributed to the monsoon effects, where the air masses in summer were clean due to winds predominantly occurring from the southeastern ocean area or southwestern mountain area (Figure 3). In winter, the air masses were mainly from the inland area and carried pollutants transported by the dominant northwest wind (Figure 3d). The East Asian monsoon arrived in spring and autumn (see Figure 3), resulting in jumbled air masses mostly from ocean and inland, which corresponded to centered pollutant concentrations.
The concentrations of OC and EC across the four seasons were mainly centralized in fine particles (Figure 2), with 59.1%–69.2% and 51.2%–71.9%, of the respective total mass concentrations in PM2.1, and 43.6%–54.3% and 34.5%–58.7%, respectively, in PM1.1. The clear enrichment of carbonaceous composition in smaller particle size, particularly for EC, indicates the important roles of certain combustion sources of anthropogenic origin (e.g., diesel vehicles and biomass burning), from which OC and EC were confirmed to be concentrated in fine particles [22,49].
The maximum values of OC were within the range of 0.65–1.1 μm in spring, autumn, and winter, accounting for 18.9%, 19.9%, and 21.6% of the total concentration, respectively. In summer, the maximum value of OC was within the range of 0–0.43μm, accounting for 19.8% of the total concentration. The maximum value of EC was within the range of 1.1–2.1 μm in spring and winter and 0–0.43 μm in summer and autumn, accounting for 20.3%, 16.8%, 32.7%, and 23.0% of the total concentration, respectively.
Table 2 shows that the seasonal variations of OC and EC were quite different in PM1.1, while they were comparable in PM1.1–2.1 and PM2.1–10. The concentrations of OC and EC in PM1.1 varied in the order of winter > autumn > spring >summer, and autumn > winter > summer > spring, respectively. In the PM1.1–2.1 and PM2.1–10, the concentrations of OC and EC varied identically in the order of winter >spring > autumn > summer.
The concentrations of OC in PM1.1–2.1 were almost identical in spring and autumn, as a result of frequent biomass burning processes in the two seasons. It was observed that the biomass burning mainly affected aerosol chemical composition at 1.1–2.1 μm [50,51]. The concentrations of OC in PM1.1–2.1 was 7.4 μg·m−3 in winter and was 3.1 times higher than summer. This phenomenon was mainly because of a stable boundary layer and few precipitation events in winter, additionally, haze events occurred frequently as well.
The proportions of EC in PM1.1 varied in the order of summer (58.7%) > autumn (55.2%) > spring (40.2%) > winter (34.5%), and spring (20.3%) > winter (16.8%) > autumn (12.5%) = summer (12.5%) in PM1.1–2.1. EC particles are mainly from primary source emissions; in summer and autumn, the air masses were clean due to winds predominantly occurring from the southeast ocean area and because there were sufficient numbers of precipitation events, thereby leading to a low level of coarse EC particles. In winter, the air masses were mainly from heavy pollution districts of Shanxi, Henan, An’hui Province, and Jing-jin-ji and brought coarse EC particles as a result of the dominant northwest winds. The concentration of EC in PM2.1–10 in winter was 3.0 times higher than summer, mainly because of a stable boundary layer and more coal emissions in winter.

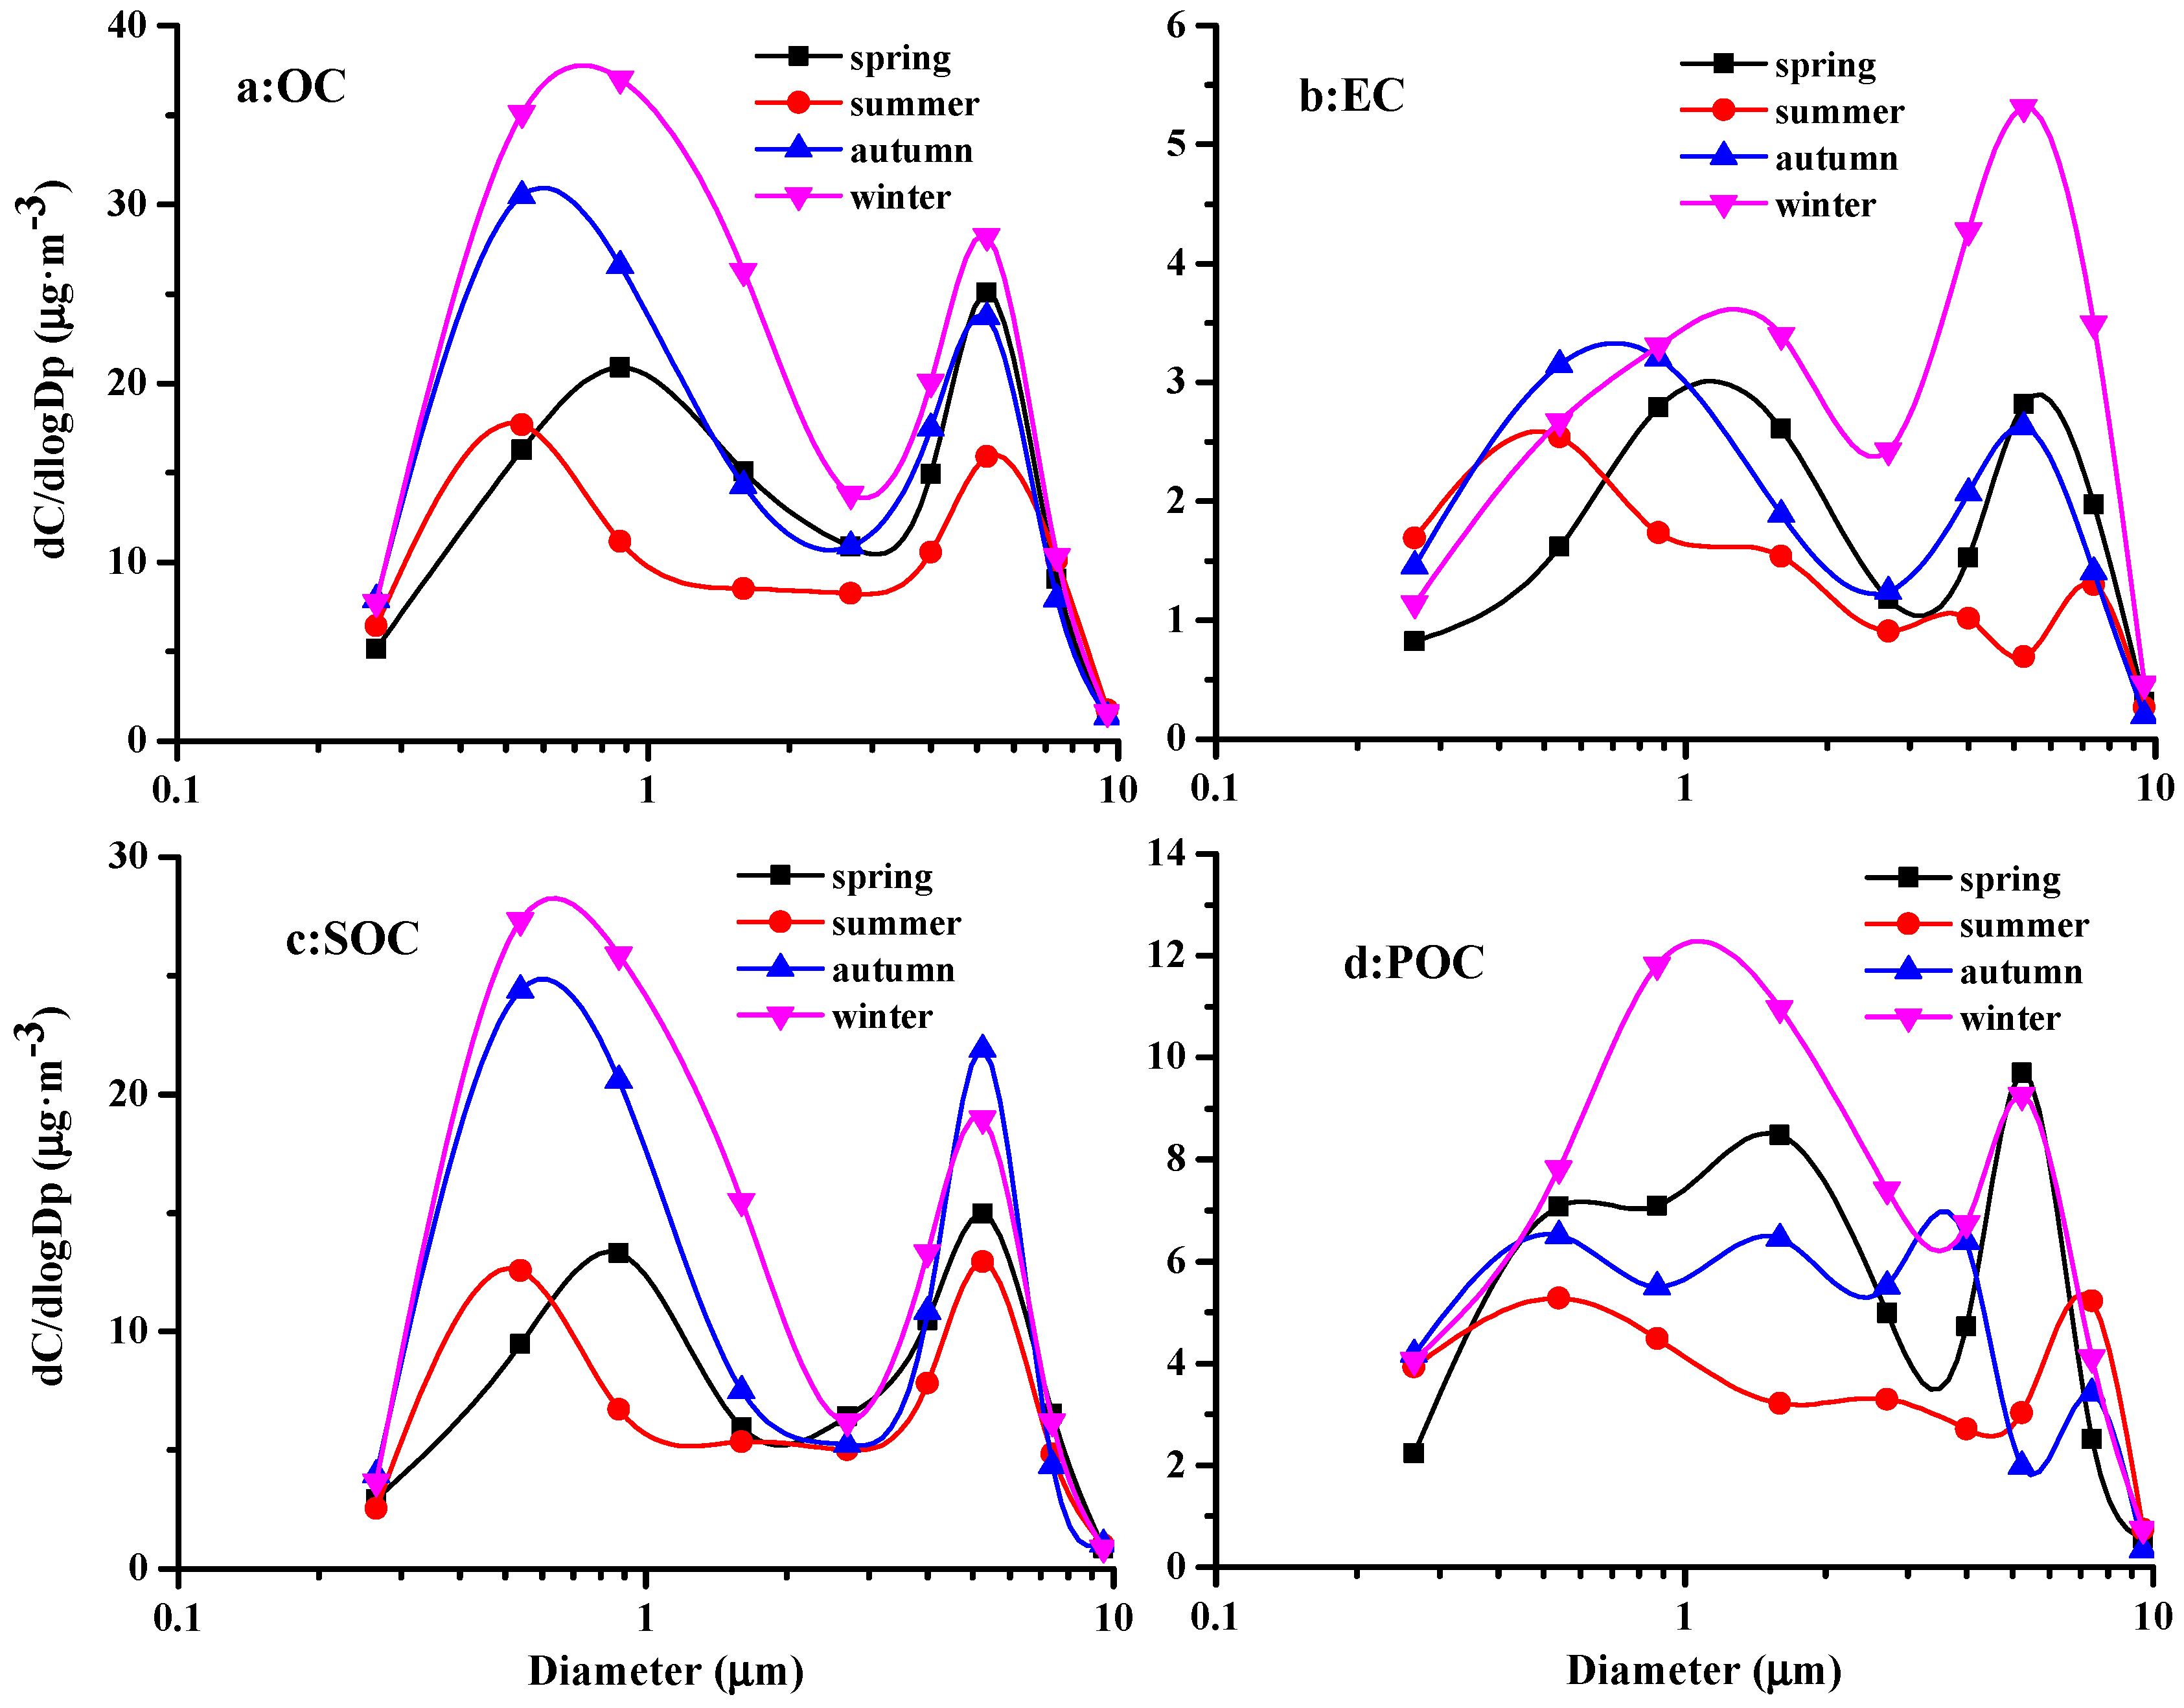
3.2. Size Distributions of OC and EC

Figure 4a shows that the size spectra of OC had bimodal distributions in the four seasons. The highest peak appears in the size range of 0.43–0.65 μm, except for spring, and the second peak is located at 4.7–5.8 μm. It should be pointed out that the highest peak in spring was observed to shift to a larger size (i.e., 0.65–1.1 μm).
The peak at 0.43–0.65 μm for OC was normally formed by the condensation and coagulation growth process of fine particles (gas-to-particle) [6,8,52]. The larger peak at 4.7–5.8 μm appeared to be related to the dust particles, which provide surfaces for the uptake of gas species and serve as carriers for carbonaceous constituents [53]. In addition, biogenic aerosols, such as algae, pollen, vegetation debris, viruses, and microorganisms may be responsible for the second peak as well [28].
EC also presents bimodal distributions with the first peak at 1.1–2.1 μm, 0.65–1.1 μm, and 1.1–2.1 μm in spring, autumn, and winter (see Figure 4b). The second peak is consistently found at 4.7–5.8 μm. Fine EC particles mainly come from vehicle exhaust, industrial emissions, and coal and biomass combustion [2,20,54]. The EC peak at 4.7–5.8 μm may be related to the re-suspension of EC-containing soil/dust particles [25]. However, the size spectra of EC had four peaks in summer (Figure 4b), which were observed at 0.5, 1.6, 4.0, and 7.4 μm, respectively. The reason is not clear, and may be associated with subway construction at Ningliu road during the observation period.

3.3. The Characteristics of SOC and POC

The roles of secondary organic aerosol (SOC) in haze, visibility, climate, and heath have been recognized for decades, but few research studies have been carried out [11,26,31,55]. As shown in Table 3, most ratios of the minimum value of OC/EC concentrations in the four seasons are above 2.0, indicating that the SOC particles were considered to be formed in the observation period. For the control of particulate pollution, it is very crucial to quantify the contributions of the primary and secondary organic carbon to carbonaceous aerosol. Although there is no simple direct analytical technique to attain the evaluation of SOC formation in ambient aerosols, several indirect methodologies have been applied [11,13,18,19,56]. According to Castro et al. [13], the production of SOC can be calculated from the following equation:
S O C = O C E C × ( O C / E C ) min
where SOC is the secondary OC, and ( O C / E C ) min is the minimum ratio observed. We calculated the SOC concentration in nine size segments in each of the four seasons based on the values of ( O C / E C ) min (as shown in Table 3).
The concentrations of SOC in PM1.1 and PM2.1–10 varied identically in the order of winter > autumn > spring > summer, and varied in the order of winter > autumn > summer > spring in PM1.1–2.1 (Table 2). The proportions of SOC in PM1.1, PM1.1–2.1, and PM2.1–10 relative to the total concentration were 44.1%–57.1%, 10.4%–17.7%, and 28.9%–43.6%, respectively. The formation mechanism of SOC is not clear at present, although it is generally considered to be from gas phase reactions followed by gas-to-particle conversion of products (i.e., through nucleation, condensation, and/or sorption), perhaps followed by aerosol phase reactions [13,55].
The concentrations of POC in PM1.1 were ranked in the order of winter > autumn > summer > spring, and in the order of winter > spring > autumn> summer in both PM1.1–2.1 and PM2.1–10 (Table 2). POC in PM1.1 was the highest in winter (6.4 μg·m−3) and were the same in the rest of the three seasons (4.1–4.9 μg·m−3). POC in PM1.1–2.1 varied greatly with the seasons, and had the highest level in winter (3.0 μg·m−3) and lowest level in summer (0.9 μg·m−3). The concentrations of POC in PM2.1–10 were almost identical across all of the seasons, with the slight exception in that the concentration in winter (4.7 μg·m−3) was slightly higher than in the other three seasons (3.0–3.5 μg·m−3). POC particles are mainly from direct emissions of combustion processes, and mostly centralized in fine particles. POC in coarse particles are observed to be mainly from the emission of plant spores and pollen, vegetation debris, tire rubber, and soil organic matter from wind erosion, as well as some non-combustion industrial activities [31,57].
The size spectra of SOC had bimodal distributions in the four seasons, as shown in Figure 4c, which were similar to OC, while the size spectra of POC changed greatly with seasons. POC had bimodal distribution in winter, peaking at 0.65–1.1 μm and 4.7–5.8 μm, and had trimodal size distribution in spring and summer, peaking at 0.43–0.65 μm, 1.1–2.1 μm, and 4.7–5.8 μm in spring, and at 0.43–0.65 μm, 2.1–3.3 μm, and 5.8–9.0 μm in summer. In autumn, the spectra of POC had four peaks at 0.43–0.65 μm, 1.1–2.1 μm, 3.3–4.7 μm, and 5.8–9.0 μm.

3.4. Source Analysis of OC and EC

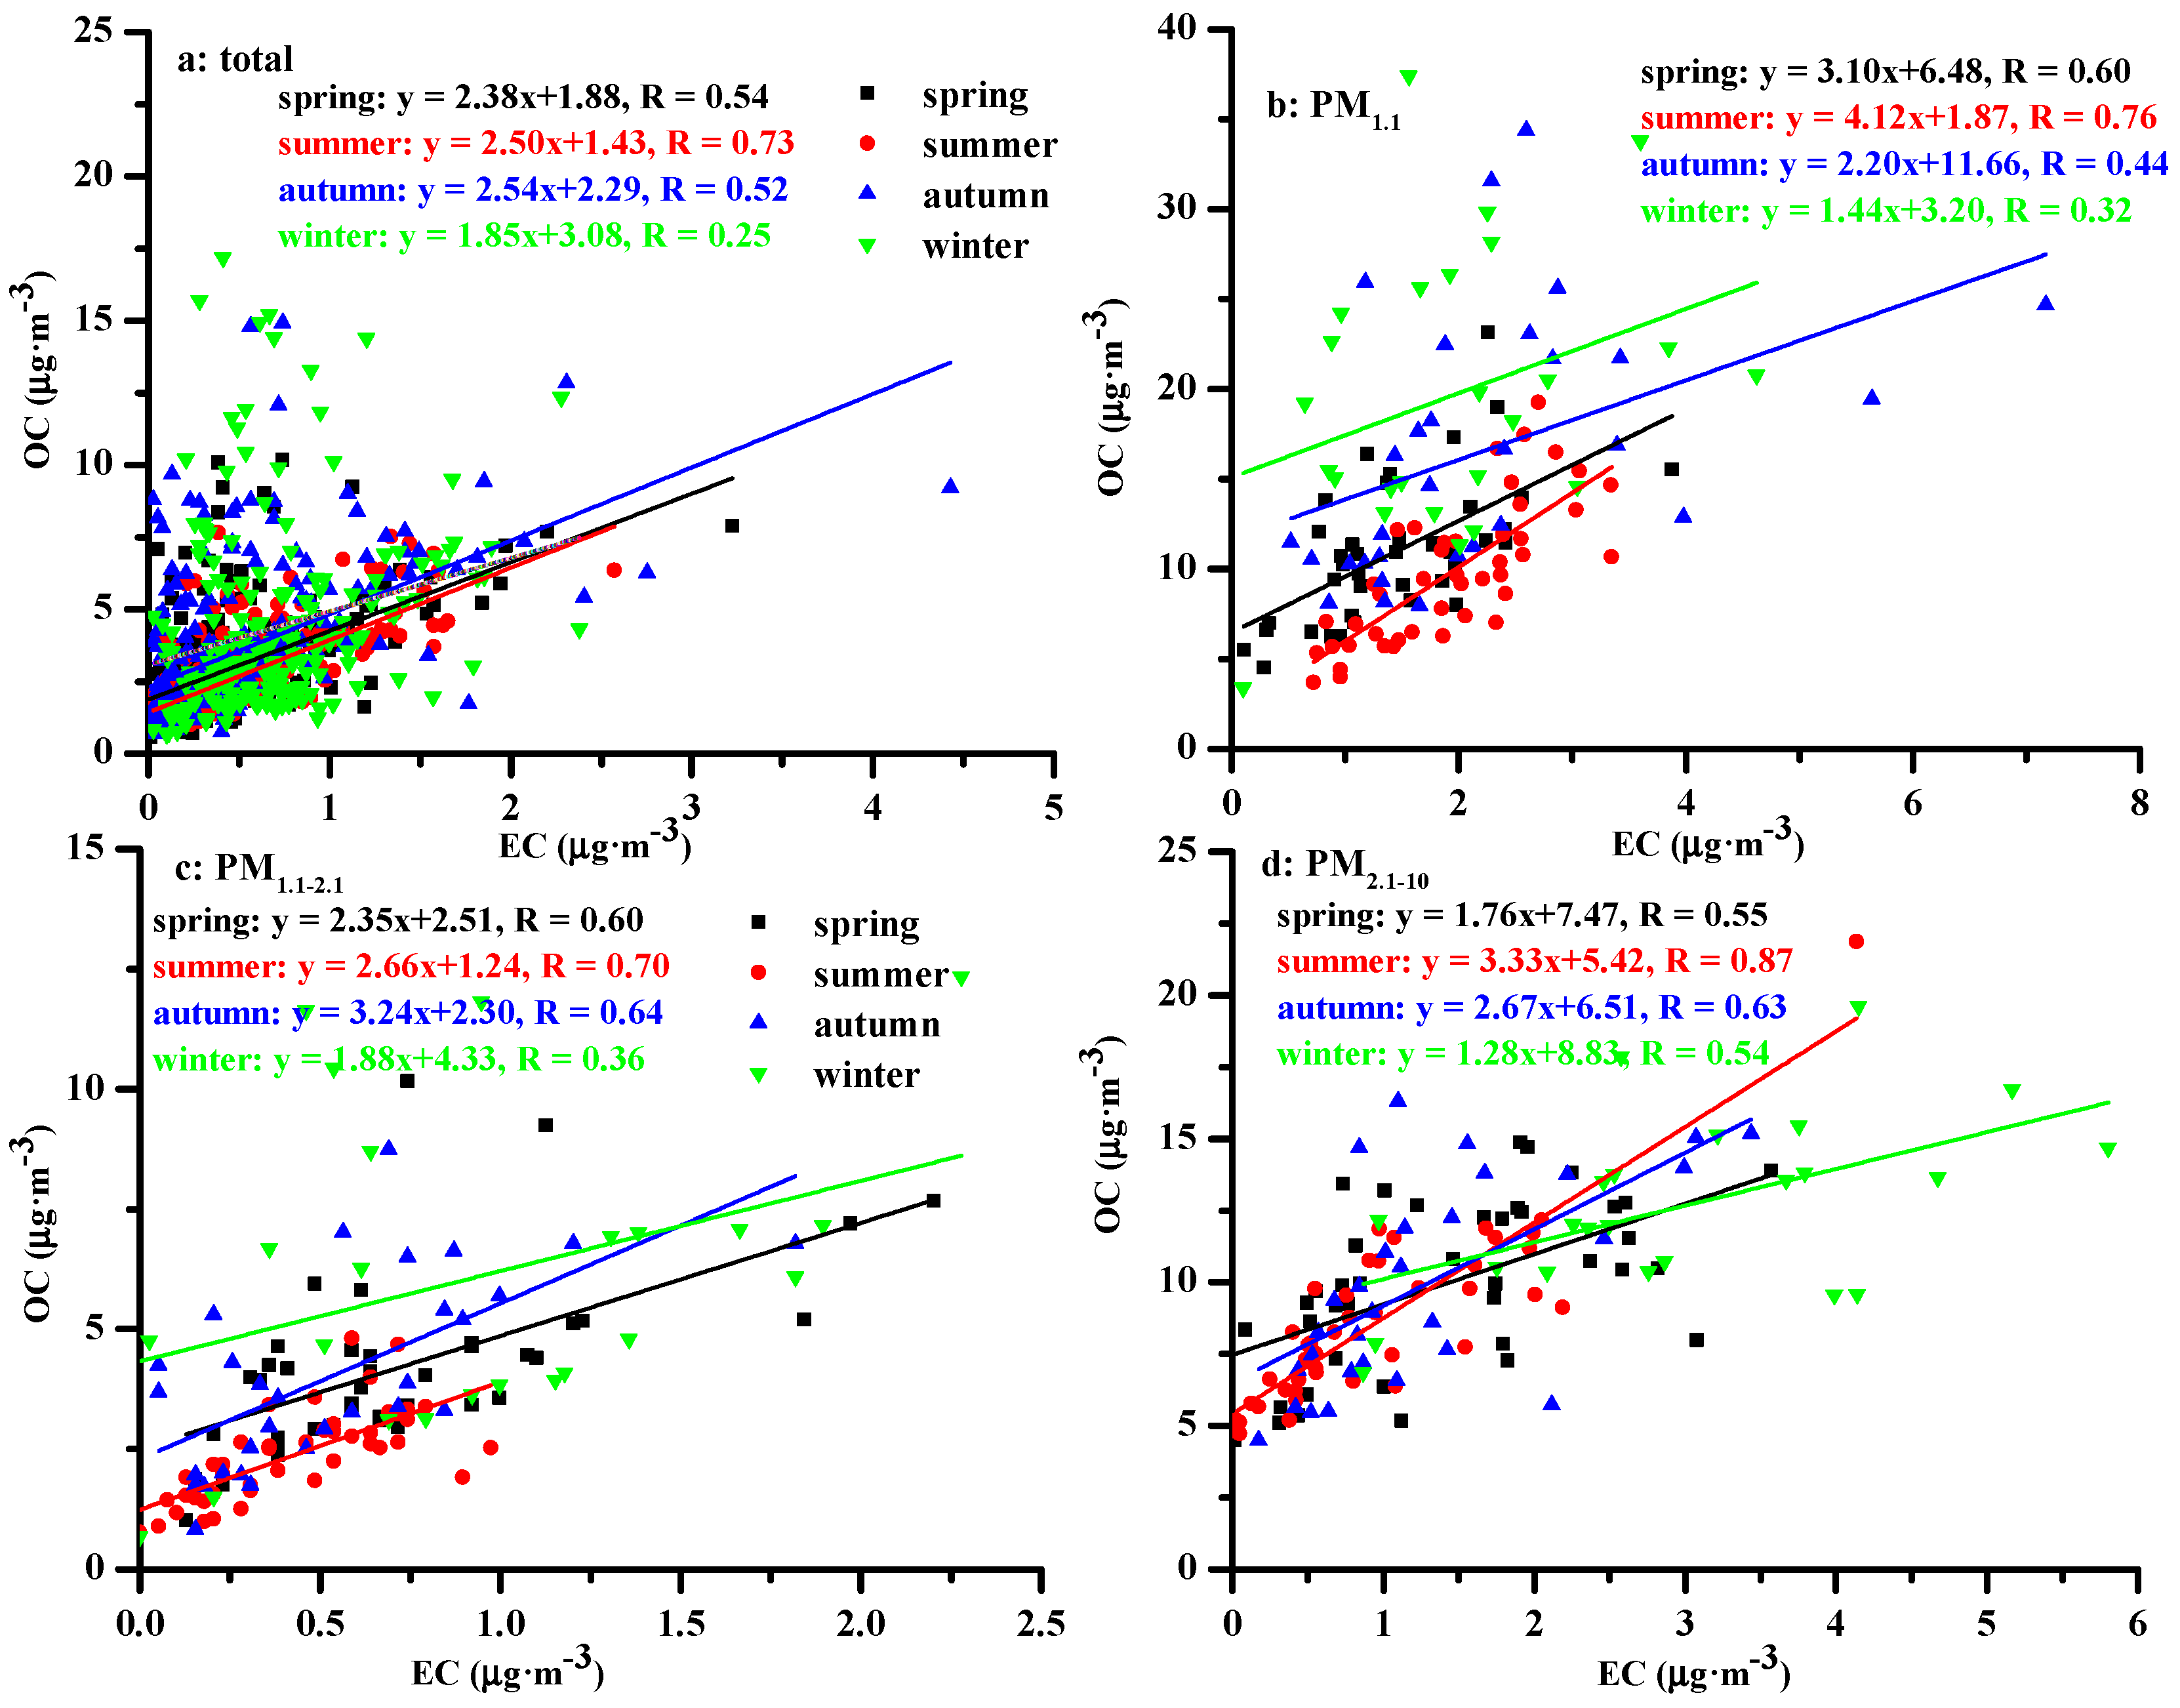
3.4.1. Relationships between OC and EC

The relationships between OC and EC can provide valuable information for the source origins of carbonaceous aerosols [9,27]. A strong correlation indicates common source origins and transport processes. Figure 5a shows that the correlation coefficients of OC with EC were the highest in summer (0.73), followed by spring (0.54) and autumn (0.52), and the lowest in winter (0.25). The strong correlations between OC and EC in spring, summer, and autumn samples suggests that they were derived largely from similar sources, which were different to those in winter. Meanwhile, the correlation coefficients between OC and EC varied greatly with seasons in PM1.1, PM1.1–2.1, and PM2.1–10. In PM1.1, the correlations were observed to be large in spring (0.60) and summer (0.76), and low in autumn (0.44) and winter (0.32) according to Figure 5b. In PM1.1–2.1, the correlation coefficients were high in spring (0.60), summer (0.70), and autumn (0.64), and low in winter (0.36) (Figure 5c). In PM2.1–10, the correlation coefficients were high in all seasons (0.54–0.87). It can be seen that source emissions of OC and EC in fine particles had large seasonal variations, whereas they had common sources for coarse particles.

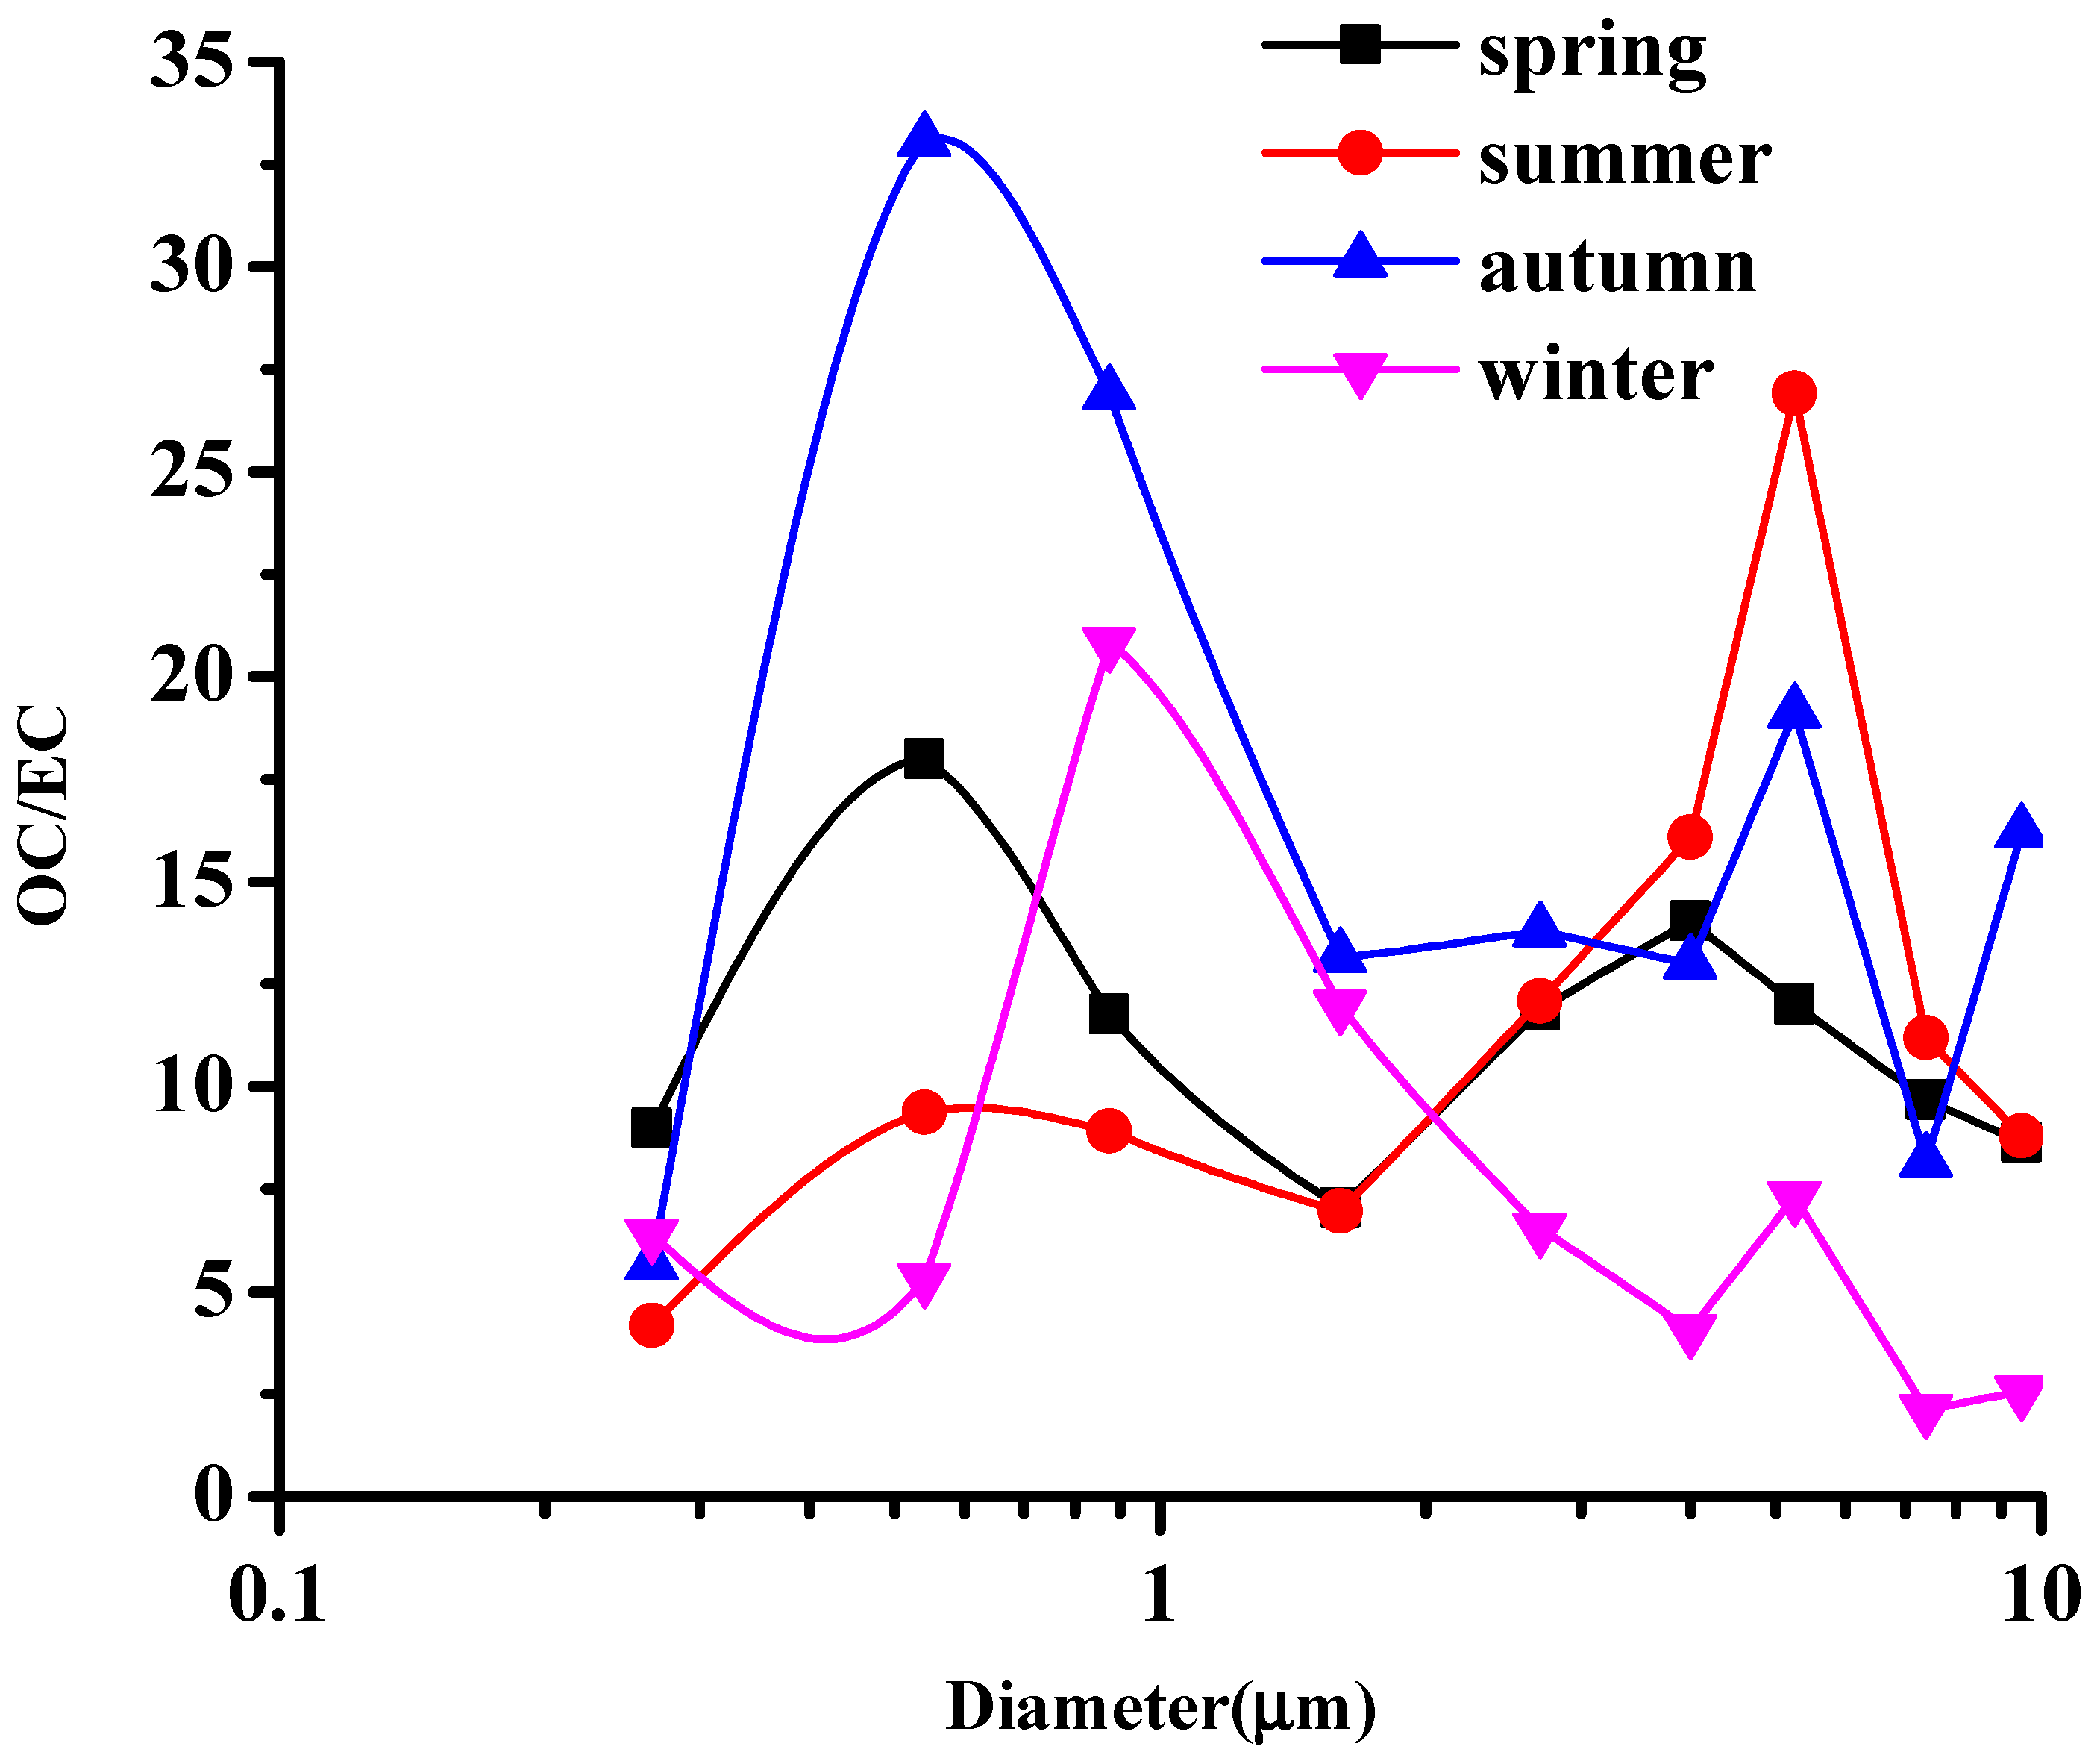
3.4.2. Implications of the OC/EC Ratios

The ratio of OC/EC is an important diagnostic index that has been used to reflect the type and source strength of carbonaceous aerosols [10]. The ratios can be mainly affected by emission sources, secondary organic aerosol (SOA) formation, and different removal rates by deposition [58]. OC/EC ratios exceeding 2.0 have been used to indicate the presence of secondary organic aerosols [2,9]; 1.0–4.2 indicate diesel and gasoline vehicle exhaust emissions [35,36], 2.4–14.5 indicates biomass burning emissions [59], 2.5–10.5 indicates coal combustion emissions [15], and OC/EC ratios of 32.9–81.6 indicate cooking emissions [34]. Watson et al. [60] reported the OC/EC ratio of 13.1 for dust emissions.
Figure 6 reveals that the ratio of OC/EC exceeded 2 in all of the seasons, which demonstrated the abundance of SOC in Nanjing. The spectra of OC/EC had bimodal distributions in spring and summer. The two peaks were located at 0.43–1.1 μm and 2.1–5.8 μm in spring, with values of 18.0 and 14.0, respectively. Therefore, the carbonaceous species in fine particles may originate from coal and biomass burning, and from coal and biomass burning and dust emissions in coarse particles. Additionally, long-range transport from the northern area was another important source of carbonaceous aerosols in Nanjing. The values of OC/EC in <2.1 μm were 4.2–9.4 in summer, suggesting that their sources were from vehicle exhaust, and coal and biomass burning emissions. The value of OC/EC in the coarse particles varied greatly insizes in summer, with the highest peak value of 26.9 at 4.7–5.8 μm, and the lowest value of 8.8 at 9–10 μm, suggesting that the sources were from dust, and coal and biomass burning.
The spectra of OC/EC had trimodal distributions in autumn and winter (Figure 6). The peak at 0.43–1.1 μm had the highest value of 26.9–33.1 in autumn, suggesting cooking emission sources. The value of OC/EC in <0.43 μm was 5.7 for vehicle exhaust emissions; 13.0–13.8 at 1.1–4.7 μm for dust and coal and biomass burning. The peak values at 4.7–5.8 μm and 9.0–10 μm were 19.1 and 16.2, mainly from biomass burning. In winter, the values of OC/EC were 5.3–6.4 in <0.65 μm, indicating vehicle exhaust and coal combustion; 12.0–20.8 at 0.65–2.1 μm, indicating coal and biomass burning, and 2.1–7.3 at 2.1–10 μm, indicating vehicle exhaust and coal combustion.

4. Conclusions

In order to investigate the size distributions and seasonal variations of carbonaceous aerosols (OC and EC), the carbonaceous species were observed for Nanjing, a typical industrial city located in Yangtze River Delta, China. OC, EC, SOC, and POC exhibited obvious seasonal variations, with the highest levels in winter (39.1 ± 14.0, 5.7 ± 2.1, 23.6 ± 11.7, and 14.1 ± 5.7 μg·m−3) and the lowest levels in summer (20.6 ± 6.7, 3.3 ± 2.0, 12.2 ± 3.8, and 8.4 ± 4.1 μg·m−3). The OC, EC, SOC, and POC across the four seasons were mainly centralized in PM1.1, with the proportions in the range of 34.5%–58.7%. OC concentrations at 0.65–1.1 μm were the highest in spring, autumn, and winter, and the lowest at 0–0.43 μm in summer. The EC maximum values were located at 1.1–2.1 μm in spring and winter, and at 0–0.43 μm in summer and autumn, respectively. The concentrations of OC and EC in PM1.1 varied in the order of winter > autumn > spring > summer, and autumn > winter > summer > spring, respectively. In the PM1.1–2.1 and PM2.1–10, the concentrations of OC and EC ranked uniformly in the order of winter > spring > autumn > summer.
The size spectra of OC, EC, and SOC had bimodal distributions acrossthe four seasons, except for EC, with four peaks in summer. However, the size distributions of OC, EC, and SOC in fine particles are a little complex in the four seasons. The size spectra of POC varied greatly with seasons, exhibiting bimodal distribution in winter, trimodal distribution in spring and summer, and four peaks in autumn.
The correlation coefficients between OC and EC were the highest in summer (0.73), followed by spring (0.54) and autumn (0.52), and the lowest in winter (0.25), indicating their common emission sources in spring, summer, and autumn. The correlation coefficients of OC with EC varied greatly with seasons in PM1.1, PM1.1–2.1 and PM2.1–10. Strong correlations between OC and EC were observed in spring (0.60) and summer (0.76) in PM1.1, in spring (0.60), summer (0.70), and autumn (0.64) in PM1.1–2.1, and in all seasons (0.54–0.87) in PM2.1–10. The ratio of OC/EC was 7.0, 6.3, 7.6, and 6.9 in spring, summer, autumn, and winter, respectively, which demonstrated the abundance of secondary organic aerosols in Nanjing. The sources of carbonaceous aerosols exhibited significant seasonal variations, which were dominated by vehicle exhaust, and coal and biomass burning in PM2.1, and by dust, and coal and biomass burning in PM2.1–10.

Acknowledgments

This work was supported by grants from the Chinese Academy of Sciences Strategic Priority Research Program (Grant No. XDB05020206), the National Key Research and Development Program of China (2016YFA0602003), the Startup Foundation for Introducing Talent of NUIST (2016r040), and the Open fund by the Key Laboratory for Aerosol-Cloud-Precipitation of CMA-NUIST (KDW1601).

Author Contributions

H.W., J.A. and B.Z. conceived and designed the experiments; Q.D. and Y.S. performed the experiments; L.S. and Q.D. analyzed the data; H.W. contributed reagents/materials/analysis tools; H.W. wrote the paper.

Conflicts of Interest

The authors declare no conflict of interest.

References

  1. Cao, J.J.; Shen, Z.; Chow, J.C.; Qi, G.; Watson, J.G. Seasonal variations and sources of mass and chemical composition for PM 10 aerosol in Hangzhou, China. Particuology 2009, 7, 161–168. [Google Scholar] [CrossRef]
  2. Cao, J.J.; Wu, F.; Chow, J.C.; Lee, S.C.; Li, Y.; Chen, S.W.; An, Z.S.; Fung, K.K.; Watson, J.G.; Zhu, C.S.; et al. Characterization and source apportionment of atmospheric organic and elemental carbon during fall and winter of 2003 in Xi'an, China. Atmos. Chem. Phys. 2005, 5, 3127–3137. [Google Scholar] [CrossRef]
  3. Cao, J.J.; Zhu, C.S.; Ho, K.F.; Han, Y.M.; Shen, Z.X.; Zhan, C.L.; Zhang, J.Q. Light attenuation cross-section of black carbon in an urban atmosphere in northern China. Particuology 2015, 18, 89–95. [Google Scholar] [CrossRef]
  4. Chow, J.C.; Watson, J.G. PM2.5 carbonate concentrations at regionally representative Interagency Monitoring of Protected Visual Environment sites. J. Geophys. Res. 2002. [Google Scholar] [CrossRef]
  5. Chow, J.C.; Watson, J.G.; Doraiswamy, P.; Chen, L.W.A.; Sodeman, D.A.; Lowenthal, D.H.; Park, K.; Arnott, W.P.; Motallebi, N. Aerosol light absorption, black carbon, and elemental carbon at the Fresno Supersite, California. Atmos. Res. 2009, 93, 874–887. [Google Scholar] [CrossRef]
  6. Jaffrezo, J.L.; Aymoz, G.; Cozic, J. Size distribution of EC and OC in the aerosol of Alpine valleys during summer and winter. Atmos. Chem. Phys. 2005, 5, 2915–2925. [Google Scholar] [CrossRef]
  7. Ramanathan, V.; Carmichael, G. Global and regional climate changes due to black carbon. Nat. Geosci. 2008, 1, 221–227. [Google Scholar] [CrossRef]
  8. Seinfeld, J.H.; Pandis, S.N. Atmospheric Chemistry and Physics: From Air Pollution to Climate Change; John Wiley & Sons: Hoboken, NJ, USA, 2012. [Google Scholar]
  9. Turpin, B.J.; Huntzicker, J.J. Identification of secondary organic aerosol episodes and quantization of primary and secondary organic aerosol concentrations during SCAQS. Atmos. Environ. 1995, 29, 3527–3544. [Google Scholar] [CrossRef]
  10. Turpin, B.J.; Lim, H.J. Species contributions to PM2.5 mass concentrations: Revisiting common assumptions for estimating organic mass. Aerosol Sci. Technol. 2001, 35, 602–610. [Google Scholar] [CrossRef]
  11. Cao, J.J.; Lee, S.C.; Ho, K.F.; Zhang, X.Y.; Zou, S.C.; Fung, K.; Chow, J.C.; Watson, J.G. Characteristics of carbonaceous aerosol in Pearl River Delta Region, China during 2001 winter period. Atmos. Environ. 2003, 37, 1451–1460. [Google Scholar] [CrossRef]
  12. Park, S.S.; Cho, S.Y. Tracking sources and behaviors of water-soluble organic carbon in fine particulate matter measured at an urban site in Korea. Atmos. Environ. 2011, 45, 60–72. [Google Scholar] [CrossRef]
  13. Castro, L.M.; Pio, C.A.; Harrison, R.M.; Smith, D.J.T. Carbonaceous aerosol in urban and rural European atmospheres: Estimation of secondary organic carbon concentrations. Atmos. Environ. 1999, 33, 2771–2781. [Google Scholar] [CrossRef]
  14. Ho, K.F.; Lee, S.C.; Cao, J.J.; Li, Y.S.; Chow, J.C.; Watson, J.G.; Fung, K. Variability of Organic and Elemental Carbon, Water Soluble Organic Carbon, and Isotopes in Hong Kong. Atmos. Chem. Phys. 2006, 6, 4569–4576. [Google Scholar] [CrossRef]
  15. Chen, Y.; Zhi, G.; Feng, Y.; Fu, J.; Feng, J.; Sheng, G.; Simoneit, B.R. Measurement of Emission Factors for Primary Carbonaceous Particles from Residential Raw-Coal Combustion in China. Geophys. Res. Lett. 2006. [Google Scholar] [CrossRef]
  16. Chow, J.C.; Watson, J.G.; Edgerton, S.A.; Vega, E. Chemical composition of PM2.5 and PM10 in Mexico City during winter 1997. Sci. Total Environ. 2002, 287, 177–201. [Google Scholar] [CrossRef]
  17. Duan, F.; He, K.; Ma, Y.; Jia, Y.; Yang, F.; Li, Y.; Tanaka, S.; Okuta, T. Characteristics of carbonaceous aerosols in Beijing, China. Chemosphere 2005, 60, 355–364. [Google Scholar] [CrossRef] [PubMed]
  18. Pandis, S.N.; Wexler, A.S.; Seinfeld, J.H. Secondary organic aerosol formation and transport-II. Predicting the ambient secondary organic aerosol size distribution. Atmos. Environ. 1993, 27, 2403–2416. [Google Scholar] [CrossRef]
  19. Turpin, B.J.; Huntzicker, J.J. Secondary formation of organic aerosol in the Los Angeles Basin: a descriptive analysis of organic and elemental carbon concentrations. Atmos. Environ. 1991, 25, 207–215. [Google Scholar] [CrossRef]
  20. Wang, G.; Cheng, S.; Li, J.; Lang, J.; Wen, W.; Yang, X.; Tian, L. Source apportionment and seasonal variation of PM2.5 carbonaceous aerosol in the Beijing-Tianjin-Hebei Region of China. Environ. Monit. Assess. 2015, 187, 1–13. [Google Scholar] [CrossRef]
  21. Cong, Z.; Kang, S.; Kawamura, K.; Liu, B.; Wan, X.; Wang, Z.; Gao, S.; Fu, P. Carbonaceous aerosols on the south edge of the Tibetan Plateau: Concentrations, seasonality and sources. Atmos. Chem. Phys. 2015, 15, 1573–1584. [Google Scholar] [CrossRef]
  22. Li, B.; Zhang, J.; Zhao, Y.; Yuan, S.; Zhao, Q.; Shen, G.; Wu, H. Seasonal variation of urban carbonaceous aerosols in a typical city Nanjing in Yangtze River Delta, China. Atmos. Environ. 2015, 106, 223–231. [Google Scholar] [CrossRef]
  23. Philip, S.; Martin, R.V.; Pierce, J.R.; Jimenez, J.L.; Zhang, Q.; Canagaratna, M.R.; Spracklen, D.V.; Nowlan, C.R.; Lamsal, L.N.; Cooper, M.J.; et al. Spatially and seasonally resolved estimate of the ratio of organic matter to organic carbon. Atmos. Environ. 2014, 87, 34–40. [Google Scholar] [CrossRef]
  24. Zhang, F.; Zhao, J.; Chen, J.; Xu, Y.; Xu, L. Pollution characteristics of organic and elemental carbon in PM2.5 in Xiamen, China. J. Environ. Sci. 2011, 23, 1342–1349. [Google Scholar] [CrossRef]
  25. Lan, Z.J.; Chen, D.L.; Li, X.; Huang, X.F.; He, L.Y.; Deng, Y.G.; Feng, N.; Hu, M. Modal characteristics of carbonaceous aerosol size distribution in an urban atmosphere of South China. Atmos. Res. 2011, 100, 51–60. [Google Scholar] [CrossRef]
  26. Li, P.H.; Han, B.; Huo, J.; Lu, B.; Ding, X.; Chen, L.; Kong, S.; Bai, Z.; Wang, B. Characterization, meteorological influences and source identification of carbonaceous aerosols during the autumn-winter period in Tianjin, China. Aerosol Air Qual. Res. 2012, 12, 283–294. [Google Scholar] [CrossRef]
  27. Turpin, B.J.; Cary, R.A.; Huntzicker, J.J. An in situ, time-resolved analyzer for aerosol organic and elemental carbon. Aerosol Sci. Technol. 1990, 12, 161–171. [Google Scholar] [CrossRef]
  28. Wan, X.; Kang, S.; Wang, Y.; Xin, J.; Liu, B.; Guo, Y.; Wen, T.; Zhang, G.; Cong, Z. Size distribution of carbonaceous aerosols at a high-altitude site on the central Tibetan Plateau (Nam Co Station, 4730ma.s.l.). Atmos. Res. 2015, 153, 155–164. [Google Scholar] [CrossRef]
  29. Andreae, M.O.; Schmid, O.; Yang, H.; Chand, D.; Yu, J.Z.; Zeng, L.M.; Zhang, Y.H. Optical properties and chemical composition of the atmospheric aerosol in urban Guangzhou, China. Atmos. Environ. 2008, 42, 6335–6350. [Google Scholar] [CrossRef]
  30. Cao, J.J.; Zhu, C.S.; Chow, J.C.; Watson, J.G.; Han, Y.M.; Wang, G.H.; Shen, Z.X.; An, Z.S. Black carbon relationships with emissions and meteorology in Xi’an, China. Atmos. Res. 2009, 94, 194–202. [Google Scholar] [CrossRef]
  31. Chow, J.C. Measurement methods to determine compliance with ambient air quality standards for suspended particles. J. Air Waste Manag. 1995, 45, 320–382. [Google Scholar] [CrossRef]
  32. Ni, H.; Han, Y.; Cao, J.; Chen, L.W.A.; Tian, J.; Wang, X.; Chow, J.C.; Watson, J.G.; Wang, Q.; Wang, P.; et al. Emission characteristics of carbonaceous particles and trace gases from open burning of crop residues in China. Atmos. Environ. 2015, 123, 399–406. [Google Scholar] [CrossRef]
  33. Andreae, M.O.; Merlet, P. Emission of trace gases and aerosols from biomass burning. Global Biogeochem. Cycles 2001, 15, 955–966. [Google Scholar] [CrossRef]
  34. He, L.Y.; Hu, M.; Huang, X.F.; Yu, B.D.; Zhang, Y.H.; Liu, D.Q. Measurement of Emissions of Fine Particulate Organic Matter from Chinese Cooking. Atmos. Environ. 2004, 38, 6557–6564. [Google Scholar] [CrossRef]
  35. Schauer, J.J.; Kleeman, M.J.; Cass, G.R.; Simoneit, B.R. Measurement of Emissions from Air Pollution Sources: 2. C1 through C30 Organic Compounds from Medium Duty Diesel Trucks. Environ. Sci. Technol. 1999, 33, 1578–1587. [Google Scholar] [CrossRef]
  36. Schauer, J.J.; Kleeman, M.J.; Cass, G.R.; Simoneit, B.R. Measurement of Emissions from Air Pollution Sources: 5.C1-C32 organic Compounds from Gasoline-Powered Motor Vehicles. Environ. Sci. Technol. 2002, 36, 1169–1180. [Google Scholar] [CrossRef] [PubMed]
  37. Zhang, Y.; Shao, M.; Zhang, Y.; Zeng, L.; He, L.; Zhu, B.; Wei, Y.; Zhu, X. Source profiles of particulate organic matters emitted from cereal straw burnings. J. Environ. Sci. 2007, 19, 167–175. [Google Scholar] [CrossRef]
  38. Lu, Z.; Zhang, Q.; Streets, D.G. Sulfur dioxide and primary carbonaceous aerosol emissions in China and India, 1996–2010. Atmos. Chem. Phys. 2011, 11, 9839–9864. [Google Scholar] [CrossRef]
  39. Zhang, X.Y.; Wang, Y.Q.; Niu, T.; Zhang, X.C.; Gong, S.L.; Zhang, Y.M.; Sun, J.Y. Atmospheric aerosol compositions in China: spatial/temporal variability, chemical signature, regional haze distribution and comparisons with global aerosols. Atmos. Chem. Phys. 2012, 12, 779–799. [Google Scholar] [CrossRef]
  40. Duan, J.C.; Tan, J.H.; Cheng, D.X.; Bi, X.H.; Deng, W.J.; Sheng, G.Y.; Fu, J.M.; Wong, M.H. Sources and characteristics of carbonaceous aerosol in two largest cities in Pearl River Delta Region, China. Atmos. Environ. 2007, 41, 2895–2903. [Google Scholar] [CrossRef]
  41. Wang, G.; Zhou, B.; Cheng, C.; Cao, J.; Li, J.; Meng, J.; Tao, J.; Zhang, R.; Fu, P. Impact of Gobi desert dust on aerosol chemistry of Xi'an, inland China during spring 2009: differences in composition and size distribution between the urban ground surface and the mountain atmosphere. Atmos. Chem. Phys. 2013, 13, 819–835. [Google Scholar] [CrossRef]
  42. Wang, H.; An, J.; Shen, L.; Zhu, B.; Pan, C.; Liu, Z.; Liu, X.; Duan, Q.; Liu, X.; Wang, Y. Mechanism for the formation and microphysical characteristics of submicron aerosol during heavy haze pollution episode in the Yangtze River Delta, China. Sci. Total Environ. 2014, 490, 501–508. [Google Scholar] [CrossRef] [PubMed]
  43. Huang, X.F.; Xue, L.; Tian, X.D.; Shao, W.W.; Sun, T.L.; Gong, Z.H.; Ju, W.W.; Jiang, B.; Hu, M.; He, L.Y. Highly time-resolved carbonaceous aerosol characterization in Yangtze River Delta of China: Composition, mixing state and secondary formation. Atmos. Environ. 2013, 64, 200–207. [Google Scholar] [CrossRef]
  44. Feng, Y.L.; Chen, Y.J.; Guo, H.; Zhi, G.R.; Xiong, S.C.; Li, J.; Sheng, G.Y.; Fu, J.M. Characteristics of organic and elemental carbon in PM2.5 samples in Shanghai, China. Atmos. Res. 2009, 92, 434–442. [Google Scholar] [CrossRef]
  45. Fu, X.; Wang, S.; Zhao, B.; Xing, J.; Cheng, Z.; Liu, H.; Hao, J. Emission inventory of primary pollutants and chemical speciation in 2010 for the Yangtze River Delta region, China. Atmos. Environ. 2013, 70, 39–50. [Google Scholar] [CrossRef]
  46. Hou, B.; Zhuang, G.; Zhang, R.; Liu, T.; Guo, Z.; Chen, Y. The implication of carbonaceous aerosol to the formation of haze: Revealed from the characteristics and sources of OC/EC over a mega-city in China. J. Hazard. Mater. 2011, 190, 529–536. [Google Scholar] [CrossRef] [PubMed]
  47. Chow, J.C.; Watson, J.G.; Crow, D.; Lowenthal, D.H.; Merrifield, T. Comparison of IMPROVE and NIOSH carbon measurements. Aerosol Sci. Technol. 2001, 34, 23–34. [Google Scholar] [CrossRef]
  48. Han, Y.M.; Cao, J.J.; An, Z.S.; Chow, J.C.; Watson, J.G.; Jin, Z.; Fung, K.; Liu, S. Evaluation of the thermal/optical reflectance method for quantification of elemental carbon in sediments. Chemosphere 2007, 69, 526–533. [Google Scholar] [CrossRef] [PubMed]
  49. Li, X.; Wang, S.; Duan, L.; Hao, J.; Li, C.; Chen, Y.; Yang, L. Particulate and trace gas emissions from open burning of wheat straw and corn stover in China. Environ. Sci. Technol. 2007, 41, 6052–6058. [Google Scholar] [CrossRef] [PubMed]
  50. Pósfai, M.; Simonics, R.; Li, J.; Hobbs, P.V.; Buseck, P.R. Individual aerosol particles from biomass burning in southern Africa: 1. Compositions and size distributions of carbonaceous particles. J. Geophys. Res. 2003. [Google Scholar] [CrossRef]
  51. Wang, H.; Zhu, B.; Shen, L.; Kang, H. Size distributions of aerosol and water-soluble ions in Nanjing during a crop residual burning event. J. Environ. Sci. 2012, 24, 1457–1465. [Google Scholar] [CrossRef]
  52. Miguel, A.H.; Eiguren-Fernandez, A.; Jaques, P.A.; Jaques, P.A.; Froines, J.R.; Grant, B.L.; Mayo, P.R.; Sioutas, C. Seasonal variation of the particle size distribution of polycyclic aromatic hydrocarbons and of major aerosol species in Claremont, California. Atmos. Environ. 2004, 38, 3241–3251. [Google Scholar] [CrossRef]
  53. Seinfeld, J.H.; Carmichael, G.R.; Arimoto, R.; Conant, W.C. ACE-ASIA-Regional climatic and atmospheric chemical effects of Asian dust and pollution. Bull. Am. Meteorol. Soc. 2004, 85, 367–380. [Google Scholar] [CrossRef]
  54. Kupiainen, K.; Klimont, Z. Primary emissions of fine carbonaceous particles in Europe. Atmos. Environ. 2007, 41, 2156–2170. [Google Scholar] [CrossRef]
  55. Gentner, D.R.; Isaacman, G.; Worton, D.R.; Chan, A.W.H.; Dallmann, T.R.; Davis, L.; Liu, S.; Day, D.A.; Russell, L.M.; Wilson, K.R.; et al. Elucidating secondary organic aerosol from diesel and gasoline vehicles through detailed characterization of organic carbon emissions. Proc. Natl. Acad. Sci. USA 2012, 109, 18318–18323. [Google Scholar] [CrossRef] [PubMed]
  56. Huang, H.; Ho, K.F.; Lee, S.C.; Tsang, P.K.; Ho, S.; Zou, C.W.; Zou, S.C.; Cao, J.J.; Xu, H.M. Characteristics of carbonaceous aerosol in PM2.5: Pearl Delta River region, China. Atmos. Res. 2012, 104, 227–236. [Google Scholar] [CrossRef]
  57. Schauer, J.J.; Rogge, W.F.; Hildemann, L.M.; Mazurek, M.A.; Cass, G.R.; Simoneit, B.R. Source apportionment of airborne particulate matter using organic compounds as tracers. Atmos. Environ. 1996, 30, 3837–3855. [Google Scholar] [CrossRef]
  58. Cachier, H.; Liousse, C.; Pertuisot, M.H.; Gaudichet, A.; Echalar, F.; Lacaux, J.P. African fire particulate emissions and atmospheric influence. Biomass Burning Global Change 1996, 1, 428–440. [Google Scholar]
  59. Ram, K.; Sarin, M.M. Spatio-temporal variability in atmospheric abundances of EC, OC and WSOC over Northern India. J. Aerosol Sci. 2010, 41, 88–98. [Google Scholar] [CrossRef]
  60. Watson, J.G.; Chow, J.C.; Lu, Z.; Fujita, E.M.; Lowenthal, D.H.; Lawson, D.R.; Ashbaugh, L.L. Chemical mass balance source apportionment of PM10 during the Southern California Air Quality Study. Aerosol Sci. Technol. 1994, 21, 1–36. [Google Scholar] [CrossRef]
Figure 1. Location of sampling site in Nanjing.
Atmosphere 08 00073 g001
Figure 2. Size distributions of (a): organic carbon (OC) and (b): elemental carbon (EC) mass concentration in four seasons.
Atmosphere 08 00073 g002
Figure 3. Daily backward air-mass trajectories reaching the Nanjing site ending at 500 m a.s.l. and 12:00 LT in four seasons (a: spring, b: summer, c: autumn and d: winter).
Atmosphere 08 00073 g003
Figure 4. Spectral distributions of OC, EC, SOC, and POC mass concentration in four seasons (a: OC, b: EC, c: SOC and d: POC).
Atmosphere 08 00073 g004
Figure 5. The relationships between OC and EC in each of the four seasons at Nanjing (a: total, b: PM1.1, c: PM1.1-2.1 and d: PM2.1-10).
Atmosphere 08 00073 g005
Figure 6. Spectral distributions of OC/EC in four seasons.
Atmosphere 08 00073 g006
Table 1. Observation period and major meteorological elements in Nanjing.
SeasonObservation PeriodTemperature (°C)RH (%)Wind Speed (m·s−1)
Spring2014.4.17–5.2219.2±4.361.5 ± 22.12.2 ± 1.2
Summer2013.6.1–7.1726.4 ± 4.567.3 ± 16.22.5 ± 1.1
Autumn2013.10.15–11.1315.0 ± 3.763.4 ± 18.11.8 ± 1.1
Winter2013.12.30–2014.1.235.0 ± 3.753.2 ± 21.81.9 ± 1.0
RH: relative humidity.
Table 2. Concentrations of OC, EC, secondary organic carbon (SOC), and primary organic carbon (POC) in PM1.1, PM1.1–2.1, and PM2.1–10.
SizeComponentSpringSummerAutumnWinter
PM1.1OC (μg·m−3)11.0 ± 3.99.8 ± 3.916.6 ± 7.219.7 ± 7.7
EC (μg·m−3)1.5 ± 0.81.9 ± 0.72.2 ± 1.42.0 ± 1.1
SOC (μg·m−3)6.3 ± 3.15.3 ± 2.811.2 ± 6.312.6 ± 7.4
POC (μg·m−3)4.1 ± 2.04.4 ± 1.84.9 ± 2.46.4 ± 3.5
PM1.1–2.1OC (μg·m−3)4.2 ± 1.92.4 ± 1.04.0 ± 2.07.4 ± 5.4
EC (μg·m−3)0.7 ± 0.50.4 ± 0.30.5 ± 0.41.0 ± 0.6
SOC (μg·m−3)1.4 ± 1.51.5 ± 0.72.0 ± 1.54.2 ± 5.2
POC (μg·m−3)2.0 ± 1.40.9 ± 0.51.8 ± 1.23.0 ± 2.0
PM2.1–10OC (μg·m−3)10.0 ± 2.98.4 ± 3.19.9 ± 3.512.1 ± 3.7
EC (μg·m−3)1.4 ± 0.90.9 ± 0.81.3 ± 0.82.8 ± 1.5
SOC (μg·m−3)6.2 ± 2.45.2 ± 1.56.4 ± 2.56.8 ± 2.6
POC (μg·m−3)3.5 ± 2.23.0 ± 2.73.2 ± 1.94.7 ± 2.4
Table 3. The minimum value of OC/EC concentrations in each of the four seasons.
Diameter (μm)0–0.430.43–0.650.65–1.11.1–2.12.1–3.33.3–4.74.7–5.85.8–9.09.0–10
Spring2.834.533.034.004.293.093.731.351.99
Summer2.352.122.652.143.732.884.704.142.88
Autumn2.812.202.083.734.723.390.972.671.82
Winter3.703.323.693.353.231.701.891.251.69

