
PM2.5 Characteristics in Qingdao and across Coastal Cities in China
by
Ruidong Wu
1, 
Xuehua Zhou
1,*,
Linpeng Wang
1,
Zhe Wang
2,
Yang Zhou
3,
Jingzhu Zhang
1 and
Wenxing Wang
1,4 1
Environment Research Institute, Shandong University, Ji’nan 250100, China
2
Department of Civil and Environmental Engineering, The Hong Kong Polytechnic University, Hung Hom, Kowloon, Hong Kong 999077, China
3
College of Oceanic and Atmospheric Sciences, Ocean University of China, Qingdao 266000, China
4
Chinese Research Academy of Environmental Sciences, Beijing 100012, China
*
Author to whom correspondence should be addressed.
Atmosphere 2017, 8(4), 77; https://doi.org/10.3390/atmos8040077
Submission received: 14 February 2017
/
Revised: 9 April 2017
/
Accepted: 11 April 2017
/
Published: 13 April 2017
(This article belongs to the Section Air Quality)
Abstract
:A year-long study was performed to comprehensively investigate the mass concentration, water-soluble ions, organic and elemental carbons, and elemental components of atmospheric fine particles from March 2006 to February 2007 in Qingdao. The results showed that PM2.5 concentration was over twice the National Ambient Air Quality Standards of 35 μg/m3 (GB3095-2012), with the highest value in winter (110 μg/m3) and the lowest in summer (42.8 μg/m3). Non-sea salt-SO42− (nss-SO42−), NO3−, and NH4+ were the dominant water-soluble ions in PM2.5, and showed the highest concentrations in autumn, winter and autumn, respectively, and all had the lowest concentrations in summer. Organic carbon (OC) and elemental carbon (EC) had the lowest levels in summer and the highest values in winter and autumn, respectively. The lower acetic/formic acid (A/F) ratio in summer suggested a predominant secondary formation of water-soluble organic acids. Cl-depletion mainly occurred in summer, along with the largest sea salt proportion in particles in a year when winds came from the southeastern sea. The enrichment factors (EFs) of elements followed an increasing order: Si, Al, Ti, Mg, Ca, Fe, Na, Sr, K, Mn, Ba, V, Cr, Ni, Co, Sc, Cu, As, Cl, Zn, Pb, S, Br, Cd, and Se. The higher EFs from 10.1 to 10,487 for Sr, K, Mn, Ba, V, Cr, Ni, Co, Sc, Cu, Cl, Zn, Pb, S, Br, Cd, and Se suggested the significant influence of anthropogenic sources in the area. Mass closure showed that (NH4)2SO4, organic matter, and NH4NO3 were the main components, and contributed 31.0%, 25.2%, and 14.0% of PM2.5 mass in Qingdao, respectively. Source apportionment results showed that secondary sulfate, nitrate, and coal combustion were the main sources. Based on this study and previous publications, the PM2.5 characteristics—including seasonality in mass and chemical species concentrations and Cl-depletion in summer—were obtained across coastal cities in China.
1. Introduction
Atmospheric fine particles are a complicated mixture with an important influence on atmospheric processes, climate change, and human health [1,2,3]. Currently, particle pollution is an urgent environmental issue in China due to its crucial role in the frequent air pollution episodes (e.g., haze). In the past three decades, numerous field studies have been performed to investigate particle characteristics, with a focus on specific analysis in specific locations [4,5,6,7,8] and/or a picture of the entire country [1,9,10] in terms of their concentration, chemical speciation, formation, and source. The results showed that fine particle pollution was mainly distributed in four regions in China: Beijing–Tianjin–Hebei (North China Plain) [4], the Yangtze River Delta [8], the Pearl River Delta [11,12,13], and the Sichuan Basin [6]. Of these regions, particles in coastal cities (which usually suffer from sea and inland sources and their mixture) have distinct characteristics compared with those in inland cities, and are studied relatively scarcely [8,14]. To date, a holistic understanding of fine particles pollution characteristics in coastal cities in China is still unknown.
Qingdao is a coastal city located in the southern tip of the Shandong Peninsula (35.58° N and 119.5° E) with an area of 1102 km2 (Figure 1). It faces the Yellow Sea in the south and is an important exit point of the dust storms to the Pacific (Korea and Japan) when the inland wind brings dust through the city in spring. Due to its important location, significant progress has been made in the particle characteristics of the city [15], including seasonal variation and the possible origin of the water-soluble ions [5], sea salt contribution to fine particles [5], concentration, seasonal variation, the size distribution of airborne microbes in bio-aerosols [16], and so forth. However, long-term and systematic atmospheric fine particle studies remain incomplete.
In this study, a year-long project was conducted from March 2006 to February 2007 that obtained PM2.5 mass and chemical composition in Qingdao, which included inorganic and organic water-soluble ions, organic and elemental carbons, and elemental components. The seasonal variations of the mass and chemical composition in PM2.5 were investigated, and Cl-depletion in Qingdao was discussed. The enrichment factors (EFs) of elements in PM2.5 were calculated to explore their origins, and PM2.5 mass was reconstructed. Source apportionment was performed to identify sources and evaluate their contributions to PM2.5 mass. Based on this study and previous publications, a profile of PM2.5 characteristics across coastal cities in China was obtained.
2. Methodology
2.1. Sampling and Chemical Analysis
2.1.1. Study Location
The sampling site is located at a conventional continuous monitoring station of the environmental monitoring station on the rooftop of the Debao Garden Hotel in the Shinan District of Qingdao. It is close to the Olympic sailing competition venue in Fushan Bay with no tall buildings nearby, and is representative of the mixed residential and coastal area in Qingdao.
2.1.2. Sampling
A TH-16A intelligent particulate sampler (Wuhan Tianhong Instruments Co., Ltd, Wuhan, China) with four channels was used to collect samples in the measurement. Two frontal channels were used to collect PM10 and two back channels were used for the collection of PM2.5. Two airstreams flying at the rate of 16.7 L/min in the two back channels were connected to a Teflon filter (1 μm pore size and 47 mm diameter, Pall Gelman, Inc., New York, NY, USA) for the PM2.5 mass, water-soluble ions, and elemental analysis, and a quartz filter (1 μm pore size and 47 mm diameter, Pall Gelman, Inc., New York, NY, USA) for determining the organic and elemental carbons in PM2.5, respectively.
The samples were collected every six days, and a total of 52 samples were obtained from the Teflon and quartz filters, respectively. Each sample was collected for 23.5 h from 8:00 a.m. to 7:30 a.m. The quartz filters were heated to 600 °C to eliminate all organic species prior to sampling. The Teflon filters were heated at 60 °C and equilibrated in a clean chamber with temperature and RH (relative humidity) automatically controlled at 20 ± 1 °C and 50 ± 5% for 24 h, respectively, prior to being weighed on an analytical balance (Sartorius, ME5-F, detection limit 0.001 mg, Sartorius AG, Goettingen, Germany) before and after sampling to obtain PM2.5 mass. After collection, the samples were sealed in clean plastic bags, transported to the laboratory, and stored in a freezer at −18 °C before analysis.
2.1.3. Water-Soluble Ions
Nine inorganic ions (F−, Cl−, NO3−, SO42− and NH4+, Na+, K+, Mg2+, Ca2+) and three organic acids (formic, oxalic, and acetic acids) were analyzed using ion chromatography (IC) (Dionex 2500, Thermo Fisher Scientific Inc. Sunnyvale, CA, USA). A separation column (Dionex Ionpac AS11, Thermo Fisher Scientific Inc.), a guard column (Dionex Ionpac AG11, Thermo Fisher Scientific Inc.), and a self-regenerating suppressor (ASRS-ULTR AP4-mm, Thermo Fisher Scientific Inc.) were used for anion analysis; a separation column (Dionex Ionpac CS14, Thermo Fisher Scientific Inc.), a guard column (Dionex Ionpac CG14, Thermo Fisher Scientific Inc.), and a self-regenerating suppressor (CSRS ULTRA 4-mm, Thermo Fisher Scientific Inc.) were used for cation analysis. The details of this procedure have been described by Yang et al. [9]. In the analysis, the relative standard deviation of each ion was less than 5% in reproducibility tests, and the relative error of each ion was within the range required by the corresponding standard quality control sample.
2.1.4. Organic Carbon (OC) and Elemental Carbon (EC)
Carbon contents were determined by a CHN (carbon, hydrogen, and nitrogen) elemental analyzer (MT-5 Yanaco New Science Corporation, Kyoto, Japan) in a two-step thermal procedure. Prior to analysis, carbonates were removed from the particles by adding diluted HCl. During the analysis, the carrier gas was the mixture of helium with a flow rate of 180 mL/min and oxygen with a flow rate of 15 mL/min. When the combustion furnace temperature is set at 450 °C, the OC content in PM2.5 sample with a size 3.14 cm2 put in a combustion boat can be determined directly. When the combustion furnace temperature is at 950 °C, the TC (total carbon) concentration in PM2.5 can be determined directly. The detailed procedure has been described in previous publications [17,18]. The concentration of EC was calculated by TC minus OC (EC = TC − OC). In the method, the relative standard deviations of OC and EC were 0.25% and 0.5%, respectively, and the detection limit was 5 μgC. The total carbon data had good agreement with those from the two-stage thermal method of Cachier et al. [19]. OC and EC values were different from those from Cachier et al. [19], as the OC/EC split is laboratory operational [17]. Other comparisons among different OC/EC analysis methods also pointed out this problem [20,21,22]. Internal consistency of the data set remains the best guide for OC/EC measurements at present.
2.1.5. Inorganic Elements
The Teflon filters were analyzed for 25 elements (Al, Na, Cl, Mg, Si, S, K, Ca, Sc, Ti, V, Cr, Mn, Fe, Co, Ni, Cu, Zn, As, Se, Br, Sr, Cd, Ba, and Pb) using an X-ray fluorescence spectrometer (WDXRF, RIGAKU RIX 3000, Rigaku Corporation, Tokyo, Japan). The relative standard deviation of each element was within 10%, and the relative errors between measured value and standard value of the quality control sample was less than 10%.
2.2. Data Analysis Methods
2.2.1. Enrichment Factor
The enrichment factors—defined as EF = (Ci/Cn) environment/(Ci/Cn) background—can be used to evaluate the contribution of anthropogenic and crustal sources, where Ci is the concentration of element i and Cn is the concentration of the reference element. Al is used as the reference element here. In this study, the concentrations of elements in background refer to their concentrations in topsoil in China [23]. When EF is close to 1, the element i is mainly derived from the crustal source, when EF is greater than 10, it indicates that the element i primarily originates from anthropogenic source, and when EF is between 1 and 10, the anthropogenic source is small while natural source is still the main factor for the element i.
2.2.2. Chemical Mass Closure
In this study, PM2.5 mass was reconstructed as the sum of SO42−, NO3−, NH4+, organic mass (OM), EC, mineral dust, sea salt, and unidentified components. OM was calculated by multiplying OC by a factor of 1.6 [24]. The soil dust matters are the sum of the oxides of the main crustal elements (Al2O3, SiO2, CaO, FeO, Fe2O3, K2O, and TiO2). These compounds account for 86% of average sediment. Thus, mineral dust was estimated through the following formula in Reference [25], [Mineral] = 2.20 Al + 2.49 Si + 1.63 Ca + 2.42 Fe + 1.94 Ti. The mass of sea salt was calculated as 2.54 times soluble Na [14].
2.2.3. Positive Matrix Factorization (PMF) Model
Source apportionment analysis was performed using positive matrix factorization (PMF) model version 5.0 of the Environmental Protection Agency (EPA), Washington, USA [26,27]. Twenty-nine chemical components were used for the PMF model, including OC, EC, NH4+, NO3−, SO42−, Na+, K+, Mg2+, Ca2+, Cl−, Al, Si, Sc, Ti, V, Cr, Mn, Fe, Co, Ni, Cu, Zn, As, Se, Br, Sr, Cd, Ba, and Pb. Based on the signal-to-noise (S/N) ratio in the PMF guidelines, EC and Ni were categorized as “weak”, while V, Cr, and Cd were categorized as “bad”, which would be ignored. In this study, five, six, seven, and even eight different sources in the PMF analysis were tested to determine the appropriate number of source factors. These tried numbers of factors were tested by using bootstrap and displacement. Then, PMF was run several times with the Fpeak values in the range ±2 to determine the Q/Qexp. For each species, the Q/Qexp for a species is the sum of the squares of the scaled residuals for that species divided by the overall Qexpected divided by the number of strong species. For each sample, the Q/Qexp is the sum of the square of the scaled residuals over all species, divided by the number of species. In the seven-factor model, a value of Fpeak = −0.1 provided the Q/Qexp minimum and the most physically reasonable source profiles.
2.3. The PM2.5 Characteristics across Coastal Cities in China
To obtain the characteristics of atmospheric fine particles in the coastal cities in China, we investigated earlier measurements taken during 1997–2010, which had seasonal variations for SO42−, NO3−, NH4+, OC, and EC in 10 cities (Figure 1). A brief introduction of the locations, sampling dates, and analyses for these studies are listed in Table S1, and the concentrations of SO42−, NO3−, NH4+, OC, and EC in these cities are compiled in Tables S2 and S3.
3. Results and Discussions
3.1. PM2.5 Concentrations in Qingdao
The concentrations of PM2.5 in Qingdao ranged from 8.49 to 285 μg/m3 with an average of 79.0 μg/m3 in the observation. This is over twice the National Ambient Air Quality Standards of 35 μg/m3 (GB3095-2012). The mass concentration of PM2.5 had an apparent seasonal variation in Qingdao with the highest value in winter (110 μg/m3) and the lowest in summer (42.8 μg/m3). In winter, winds blowing from inland contain pollutants emitted from anthropogenic activities in the northwest (Figure 2), while the summer monsoon shifts to southeasterly winds that carry clean air to the site. In addition, the atmospheric dilution rate per unit length—which means wind speed multiplies the mixing height and can be used to evaluate the diffusion capability of the atmosphere [28]—was lower in autumn and winter in Qingdao (Figure 2). The lower diffusion capability and the increase in particulate matter emission as a result of heating in winter jointly led to high particle loading. In summer, aside from clean air from the sea, high precipitation (Figure 2) also played a significant role in lower particle concentration.
3.2. Chemical Species
3.2.1. Water-Soluble Ions
Sulfate, Nitrate, and Ammonium
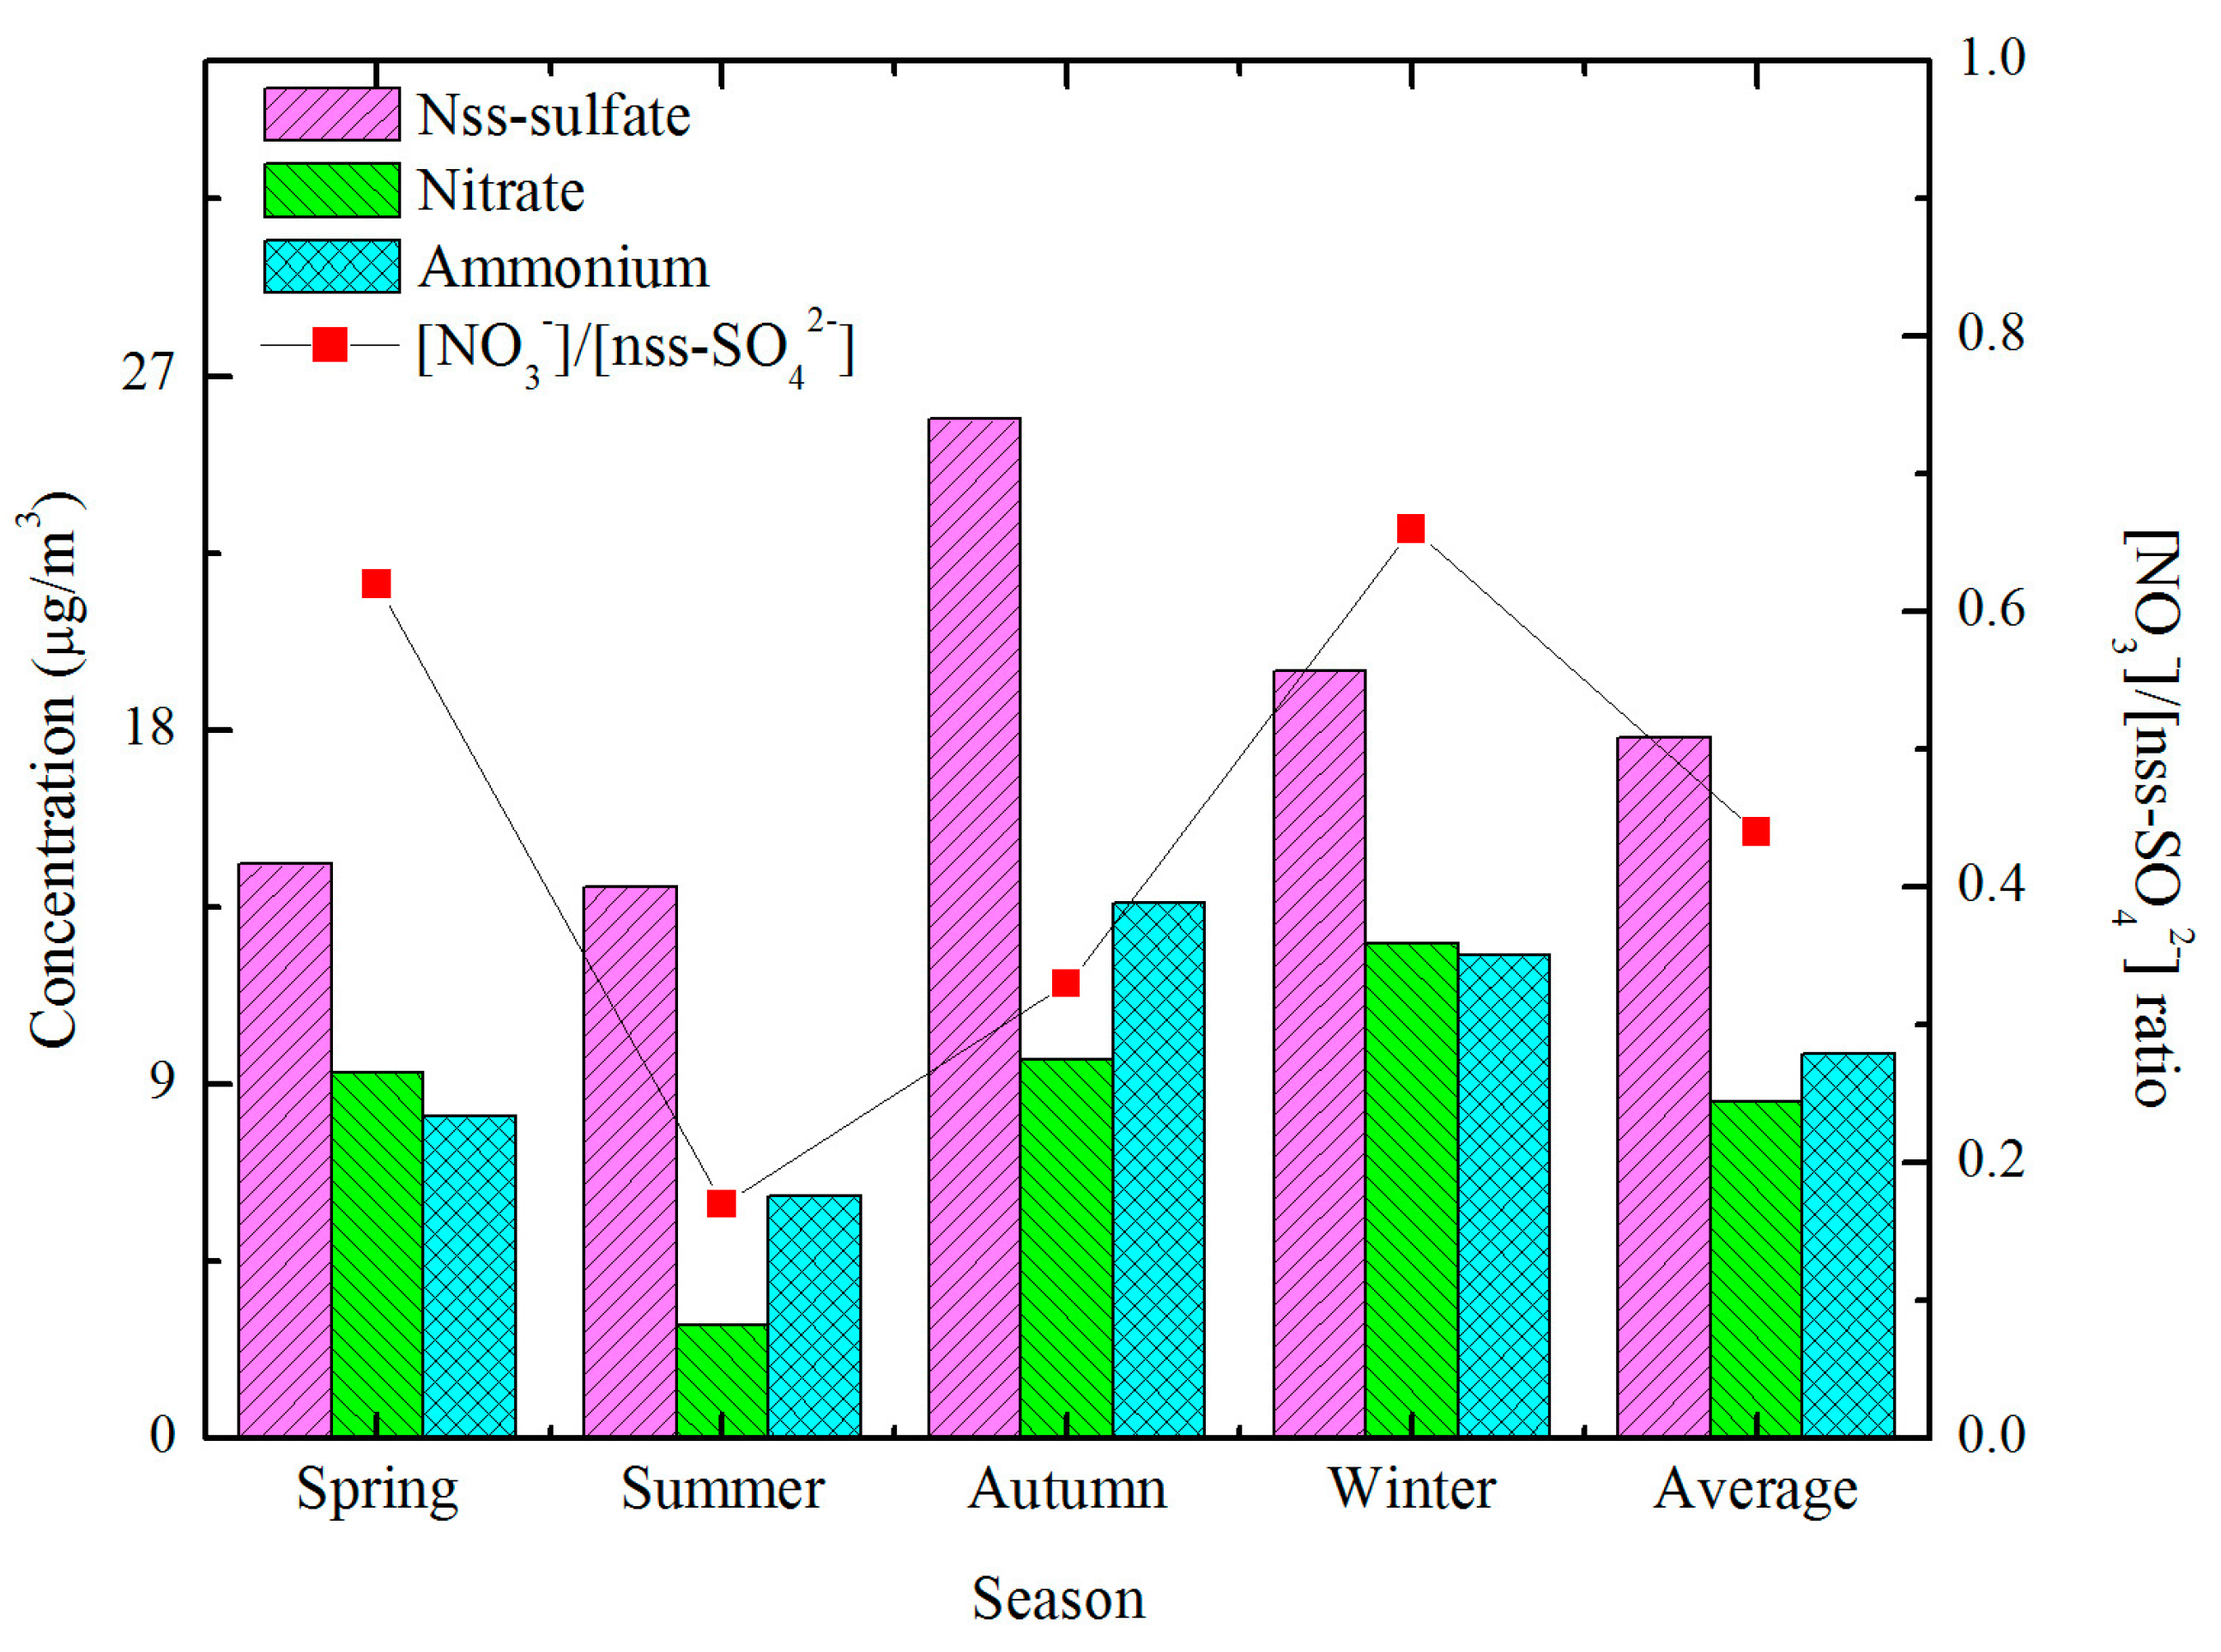
The concentrations of the major chemical components in PM2.5 are provided in Table 1. The sum of Non-sea salt-SO42− (nss-SO42−), NO3−, and NH4+ contributed 45.7% to PM2.5 mass, indicating that nss-SO42−, NO3−, and NH4+ were the dominant ions in PM2.5 in Qingdao. Other inorganic water-soluble ions, including Cl−, Na+, K+, Mg2+, and Ca2+, occupied 5.58% of PM2.5 mass. Nss-SO42−, NO3−, and NH4+ showed obvious seasonal variations in Qingdao (Figure 3). The value of nss-SO42− concentration was the highest in autumn (24.2 μg/m3) and lowest in summer (13.7 μg/m3). Summer (which has the highest temperature and RH of the four seasons; see Figure 2) has conditions which are favorable for sulfate formation by gaseous or aqueous phase reactions, and sulfate concentration was the lowest—most likely due to the dominant summer monsoon in the southeast which brings clean air mass from the sea to the site and causes pronounced precipitation (Figure 2). In autumn, wind direction is dominant in the south and northwest (Figure 2), which passes through areas influenced by anthropogenic activities and brings polluted air mass to the sampling site. Furthermore, due to the active photochemical reaction of SO2 through gaseous and aqueous phases determined by the higher temperature and RH, as well as the accumulation caused by the lowest diffusion capability of the atmosphere (Figure 2), nss-SO42− showed the highest level in autumn. The concentration of sulfate in winter followed autumn. The concentration of SO2 in winter was the highest of the four seasons due to the heating supply of the northern city [5]; however, the lower temperature and RH do not favor the photochemical transformation of SO2 to sulfate, which probably resulted in lower sulfate concentrations in winter than in autumn. NH4+ exhibited a seasonal pattern similar to that of nss-SO42− (Figure 3); that is, high concentrations in autumn and winter, and low in spring and summer.
The maximum and minimum concentrations of NO3− appeared in winter and summer, respectively (Figure 3). Aside from the conversion of NO2 to HNO3 and the partition of NO3− between the gaseous and particulate phases (which has a strong dependence on temperature and RH [29]), the concentration of ammonia is a key factor in determining nitrate concentration in the atmosphere. The seasonal variation of RH was not pronounced in Qingdao in one year, as shown in Figure 2. The average temperature decreased from 26.7 °C in summer to 2.6 °C in winter (Figure 2), which resulted in a favorable partition of NO3− from its gaseous phase to a particulate phase in winter. In summer, the decomposition of NH4NO3 into HNO3 and NH3 in high temperatures (which are easily volatilized) and high precipitation jointly led to the lowest NO3− concentration at the site.
The mass ratio of [NO3−]/[nss-SO42−] has been used as an indicator of the relative importance of mobile/stationary sources of nitrogen and sulfur in the atmosphere [30]. In China, the estimated NOx to SOx ratios from gasoline burning, diesel burning, and coal combustion are 13:1, 8:1, and 1:2 [29,31,32], respectively. The value of the [NO3−]/[nss-SO42−] ratios are low, with a range of 0.3–0.5 in the country as a result of the wide use of sulfur-containing coal [29,33]. High [NO3−]/[SO4−2] mass ratios (two and five) have been reported in downtown Los Angeles and in Rubidoux partly due because there is no coal use in Southern California, USA [34]. In this study, the annual average [NO3−]/[nss-SO42−] mass ratio was 0.48, which was less than 1 and indicated that stationary source emissions were more important than vehicle emissions in Qingdao. The [NO3−]/[nss-SO42−] mass ratio varied between 0.1 and 1.2 in one year. The highest average ratio was in winter (0.66), and the lowest was in summer (0.17), which may be attributed to the easy decomposition of particulate NO3− in relatively high summer temperatures.
Formic, Acetic, and Oxalic Acids
The total formic, acetic, and oxalic acids accounted for 0.47% of PM2.5 mass. Acetic acid and formic acid in summer were the lowest in four seasons, which may be attributed to the dominant southeast monsoon wind from the sea and the large precipitation in summer (Figure 2).
Acetic acid is mainly produced from primary emissions, while formic acid comes from secondary transformations [35,36,37,38]. The ratio of acetic to formic acid (A/F) is used to evaluate the relative importance of primary and secondary emissions. When A/F is more than 1, it means that primary sources are predominant; conversely, secondary sources are dominant [38]. In this study, the A/F ratio was high in one year (1.68), indicating that primary emissions were the dominant source of carboxylic acids in Qingdao. The A/F ratio had an obvious seasonal variation with winter (2.85) > autumn (1.23) > spring (0.63) > summer (0.59), suggesting more secondary carboxylic acid formation in summer.
Cl− and Cl-Depletion
Cl− is an important species in aerosols in coastal cities due to both sea sources and anthropogenic activities. As shown in Table 1, Cl− showed the highest concentration in winter and the lowest in summer in Qingdao, which may be attributed to dominant influences from anthropogenic sources under northwestern winds in winter and from sea sources under southeastern winds in summer. Furthermore, Cl-depletion probably had a significant contribution to the lower Cl− concentration in summer.
NaCl in the sea salt droplet may react with SO2 and NOx in the atmosphere, which may produce H2SO4 and HNO3 in the NaCl droplet. The formation of H2SO4 and HNO3 increases the acidity in the NaCl droplet, and can result in the evaporation of HCl, thus making the ratio of Cl to Na less than that in sea salt, leading to Cl-depletion. Cl-depletion may be evaluated by Clexcess/Clreference. The Clexcess and Clreference were calculated by the following Equations:
Clexcess = Clsample − Clreference
Clreference = Nasample/(Na/Cl)sea = Nasample/0.556
Table 2 shows the degree of Cl-depletion in four seasons in Qingdao based on the assumption that all Na+ in PM2.5 comes from sea salt. In this table, the negative value means that there is probably a Cl-depletion as the Na+ sample was impossible to absolutely ascertain its sea salt origin, and the positive Clexcess/Clreference declared that Cl− comes from anthropogenic sources aside from sea salt. In Qingdao, the annual average chloride was enriched. However, there was a negative Clexcess/Clreference in summer, meaning that Cl-depletion occurred only when the south wind was dominated by a high sea salt proportion in aerosols (see Section 3.2.4 Mass Closure) under higher temperatures (Figure 2), which is most likely favorable for Cl-depletion reactions [39]. The positive Clexcess/Clreference in spring, autumn, and winter suggested that Cl enrichment influenced by anthropogenic emissions was greater than Cl-depletion—especially in winter, when the northwest wind goes through the inland to the site. In the three seasons, Cl mainly came from coal combustion (see Section 3.2.5 Source Apportionment).
3.2.2. Carbonaceous Species
Figure 4 shows the time series of OC and EC concentrations during the measurement in Qingdao. The average mass concentrations of OC and EC were 12.4 μg/m3 and 2.02 μg/m3, respectively. The lowest concentrations of OC and EC were both observed in summer, while the maximum concentrations were in winter for OC and in autumn for EC. Aside from the clean air mass influenced by southeastern wind in the summer, another reason for the lower concentration of EC in summer is probably due to higher precipitation, as shown in Figure 2. The concentrations of OC and EC had good relationships in one year and four seasons (Figure 5), implying the inner correlation of OC and EC and their common sources in Qingdao [9,40]. Among them, the correlation in summer was weaker compared to the other three seasons, meaning more diverse sources or more secondary organic carbon (SOC) formation due to the active photochemical reactions.
It has been suggested that if the ratio of OC/EC > 2.0, SOC will be formed [41]. The ratios of OC/EC in Qingdao were in the range of 1.84–12.0 with an average of 6.14, indicating that SOC was formed. The concentration of SOC was estimated through the following equation: OCsec = (OC)tot − (EC) × OC/EC)pri. The minimum of OC/EC is usually used as the value of (OC/EC)pri (1.84 in this paper) [42]. In this study, SOC accounted for 70.0% of OC, implying that SOC was the predominant organic component in PM2.5. The concentration of SOC and its fraction in PM2.5 in summer were both the lowest (Figure 4), most likely due to frequent precipitation with dominating southeast winds which remove SOC out of particles in summer, although the relatively weak correlation between OC and EC and lower A/F ratio suggested more SOC formation in the season. The SOC concentration in winter was the highest, and was related to the combination of poor conditions for diffusion and scarce rainfall (Figure 2), as well as the increased emissions of the SOC precursors, including volatile organic compounds and semi-volatile organic compounds, which increased along with the added emissions under extra coal consumption for heating in the city and transport by the dominant northwest wind through the inland area [9].
3.2.3. Elemental Components
Elemental Concentrations
In Qingdao, elemental concentrations showed large variations from below the detection limit to 12.3 μg/m3. Different elements had different seasonal patterns (Table 1). However, the concentrations of most measured elements decreased during summer, which was due to monsoon from the sea and the washout effect of rainfall (Figure 2) [14]. For Al, Mg, Si, Ca, Ti, and Fe, related to crustal sources, the concentrations were higher in spring, presenting similar variations to Ji’nan [9] (the capital city of Shandong Province) and the megacity of Beijing in the North China Plain [43]. The higher value in spring was ascribed to the winds blowing from inland and the dust storms which were universal in Northern China in spring. Additionally, construction activity may be a significant Ca source, as the ratios of Ca/Si and Ca/Al are higher [4]. In Qingdao, there were no clear seasonal variations for the ratios of Ca/Si and Ca/Al. Therefore, it is uncertain whether construction activity had a significant impact on the concentration of Ca in the city. The concentrations of non-crustal elements, including Mn, Cu, Zn, Pb, Cl, Br, As, and Se were higher in winter than in other seasons (Table 1). Among them, the high concentrations of Mn, Cu, Zn, and Pb may be related to the highest PM2.5 concentrations under the lower diffusion capability and less precipitation in winter. The concentrations of Cl, Br, As and Se, used as an indicator of coal burning, showed higher values in winter due to the extra coal consumption for heating. The ratio of Br to Pb—which is used to reflect the influence of automobile exhaust—was higher in Qingdao (44.7%) than that of the urban sampling site of Ji’nan (26.6%), which is most likely due to more vehicles in Qingdao (the possession of civil vehicles in Qingdao vs. Ji’nan: 126 million vs. 98 million) [9]. The concentrations of metal elements, including Sc, V, Cr, Ni, Co, Sr, and Cd showed no obvious seasonal variations, probably related to industrial or traffic emissions. Notably, compared to the mass concentrations of Ni (0.01 μg/m3) and V (<0.01 μg/m3) in Ji’nan [9], the higher values in Qingdao may be due to fuel oil combustion related to local shipping exhaust [44], as the cargo handling capacity of Qingdao port was 22.4 million tons in 2006, ranking 5th in the main ports in China.
The EFs of Elements
Figure 6 shows the EFs of elements annually, broken down by season. The EF values of Si, Ti, Mg, Ca, Fe, and Na were lower than 10, indicating that they were mainly from crustal sources. In contrast, the EF values were larger than 10 for Sr, K, Mn, Ba, V, Cr, Ni, Co, Sc, Cu, Cl, Zn, Pb, S, Br, Cd, and Se, meaning that these elements mostly originated from non-crustal sources and were related to anthropogenic activities [43,45]. In addition, Mg, Na, Sr, Ba, V, Cr, Ni, Co, Sc, S, and Cd had higher EFs in summer compared to those in the other three seasons. Mg and Na were probably related to sea sources due to the southeast monsoon, while Sr, Ba, V, Cr, Ni, Co, Sc, and Cd were likely influenced by ship exhaust emissions. S was associated with the secondary formation of sulfate. The EFs of As, Cl, and Br showed the highest values in winter as a result of extra coal burning for heating.
3.2.4. Mass Closure
PM2.5 contains major chemical species including: sulfate and nitrate salt, organic matter, elemental carbon, soil dust, sea salt and unidentified components. In Qingdao, the mole ratio of (2 × [nss-SO42−]) with [NH4+] (0.55) was less than 1.0 (Figure 7), indicating that nss-SO42− was completely neutralized by NH4+, which meant that SO42− was mainly in the form of (NH4)2SO4 in the particles. There was a strong correlation between NO3− and NH4+ (Figure 7), implying the presence of NH4NO3. Moreover, in Figure 7, it performed a good correlation between (2 × [nss-SO42−] + [NO3−]) and [NH4+] (R2 = 0.97) with a slope less than 1, signifying that SO42−, NO3−, and NH4+ in Qingdao mainly existed as (NH4)2SO4 and NH4NO3.
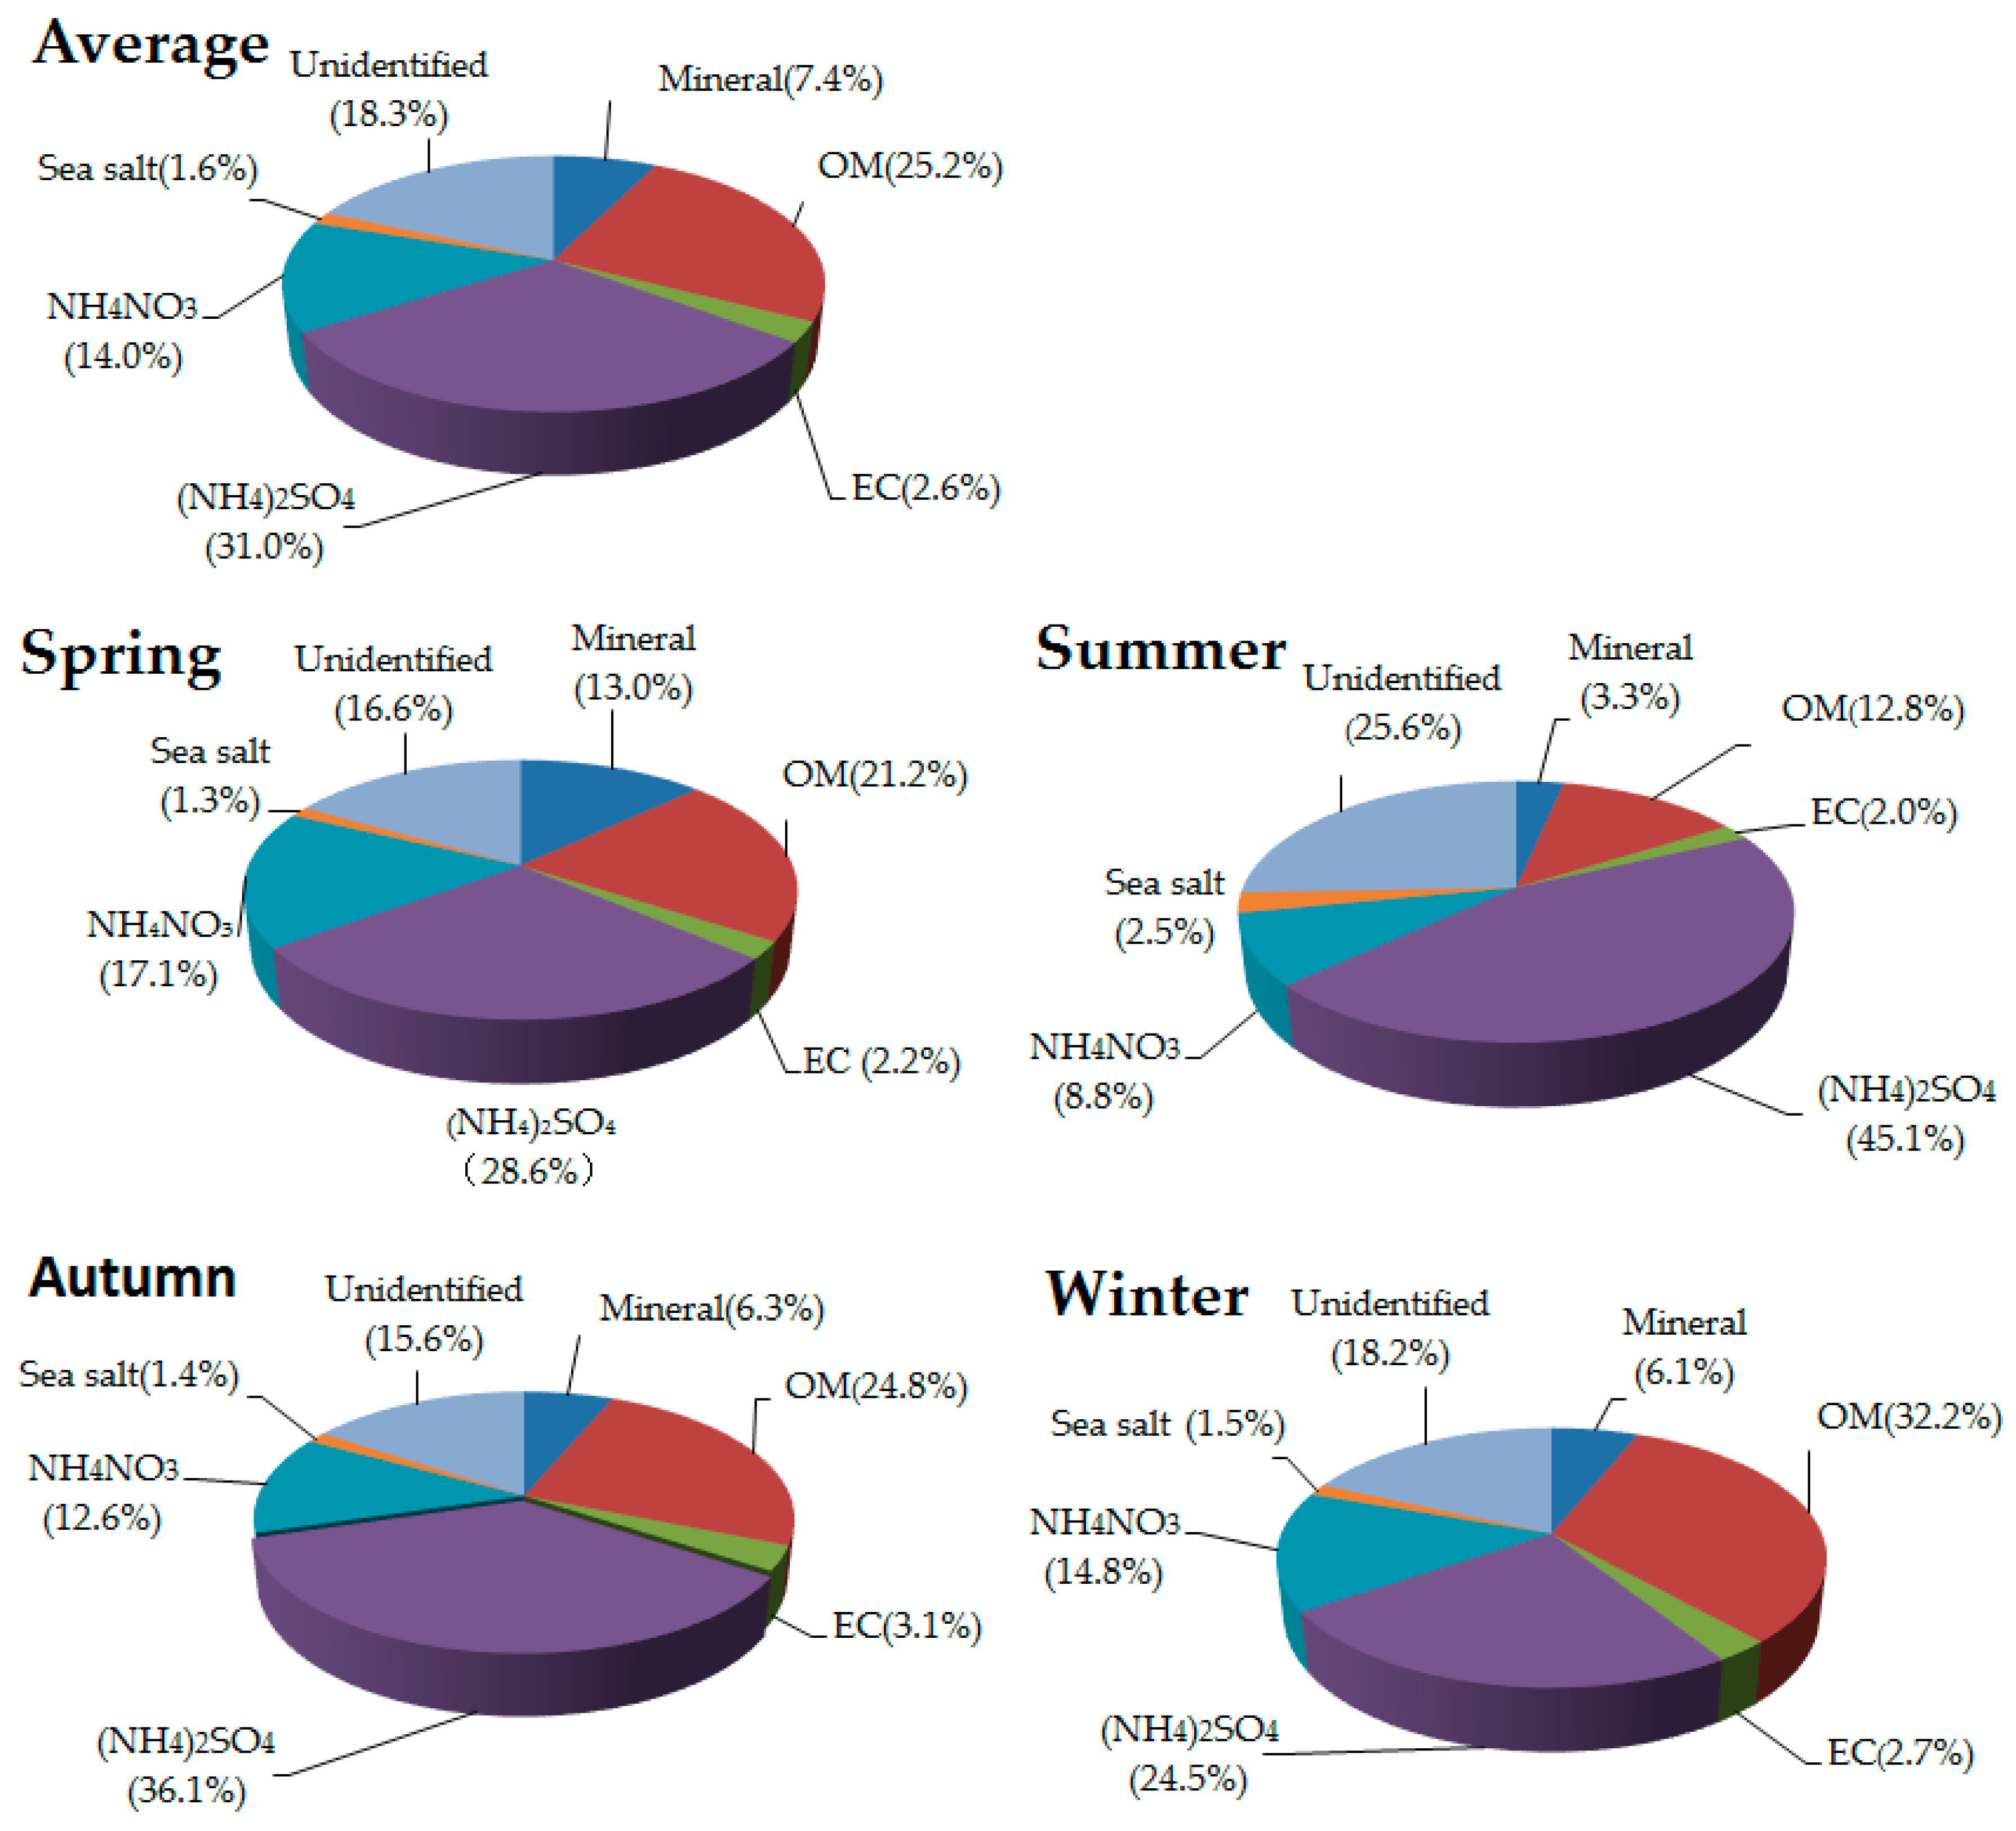
Figure 8 shows the mass reconstruction of the main constituents in PM2.5. Of all species, (NH4)2SO4 was the main component of PM2.5 in Qingdao, accounting for 31.0% of the total mass, followed by organic matter (25.2%) and NH4NO3 (14.0%). The percentage of unidentified components was 18.3%, and may be related to the aerosol-bound water, trace heavy metal elements as metal oxides, systematic errors in chemical quantification, and the decomposition of semi-volatile compounds [8,43,46]. In addition, there were strong seasonal variations in compositions of PM2.5 in Qingdao. The contribution of (NH4)2SO4 showed a peak in summer, as the high temperature and RH favors the conversion of SO2 to sulfate. Moreover, sea salt also had the highest contribution to PM2.5 mass in summer due to the main influence from sea sources via the southeast wind in four seasons. The unidentified materials had the largest proportion in summer, which may be associated with the high water content when hygroscopic species (e.g., (NH4)2SO4) occupied a great fraction of PM2.5 under high RH. The contribution of organic matter was maximum in winter, which was related to increased emissions of primary organic mass and the formation of secondary organic mass under high precursor emissions during extra coal consumption for heating. The highest fraction of dust materials presented in spring due to the frequent dust storms brought from inland by the northwest wind.
3.2.5. Source Apportionment
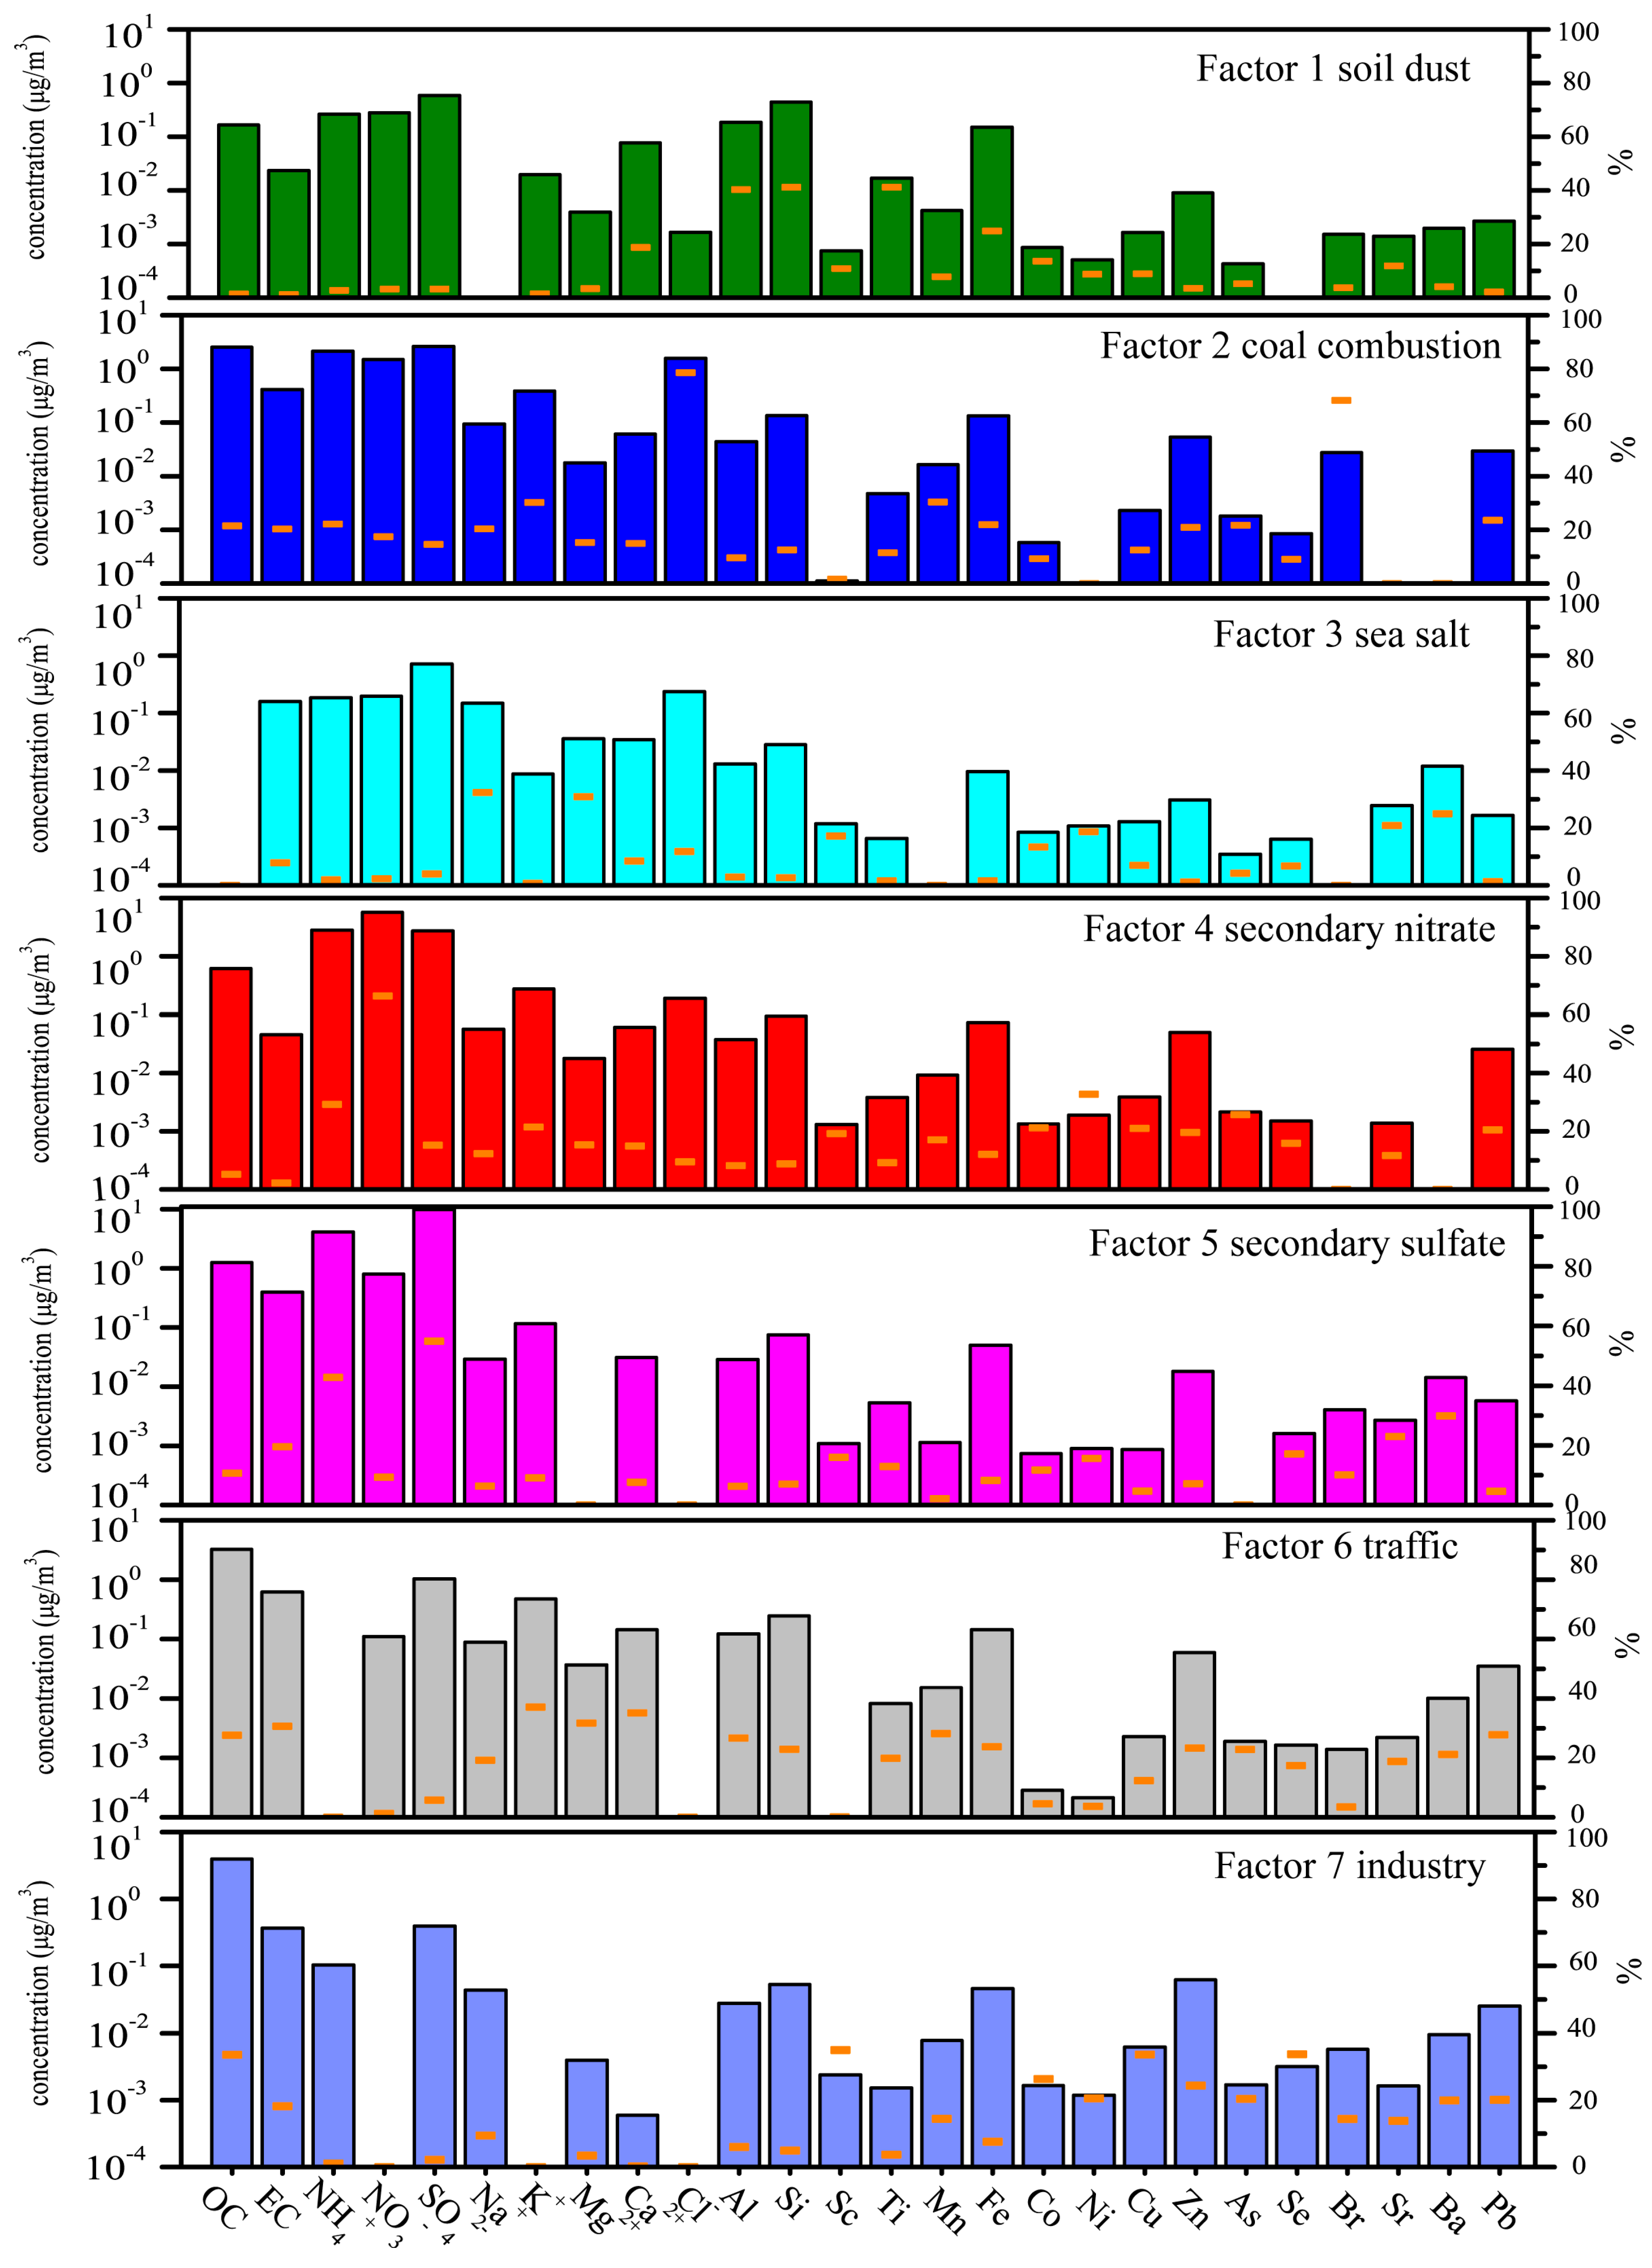
Based on the result of PMF modeling combined with local condition, seven factors were determined at this site. These seven factors were (i) soil dust; (ii) coal combustion; (iii) sea salt; (iv) secondary nitrate; (v) secondary sulfate; (vi) traffic; (vii) industry (Figure 9 and Figure 10).
Factor 1 was soil dust, which contained 41.2%, 41.2%, 40.3% of Ti, Si, Al, respectively. The time series of the factor contribution peaked in spring, which might be owing to the frequent occurrence of dust storms in spring. These elements are often found in geological materials, considered as crustal elements [47]. This factor contributed 7.1% to PM2.5 mass.
Factor 2 was characterized by the high loadings of Cl− (78.6%) and Br (68.3%), and identified as coal combustion. The time series of the source contribution peaked in winter, which indicated that the anthropogenic activities were frequent in winter. High contribution of Cl− was probably associated with coal combustion, and the elements Cl and Br are considered as the tracers of coal burning [48]. This factor contributed 18.1% to PM2.5 mass.
Factor 3 was sea salt, represented by the high loadings of Na+ (32.3%) and Mg2+ (30.9%). The peak of this factor for contribution appeared in summer in the time series plot, which was coincident with the wind direction in summer—prevailing southeasterly winds from the Yellow Sea. Na+ and Mg2+ were also the typical ions of sea salt. Sea salt occupied 5.7% of PM2.5 mass in Qingdao.
Factor 4 was identified as secondary nitrate, with high loadings of NO3− (66.4%) and NH4+ (29.3%). Nitrate originates from precursor NOx through reaction with hydroxyl radicals. During the heating period, NOx was emitted from both mobile and stationary sources, while during the non-heating period, the contributions of mobile sources accounted for the major parts [49]. Secondary nitrate occupied 25.2% PM2.5 mass.
Factor 5 was classified as secondary sulfate, with the high contributions of SO42− (55.0%) and NH4+ (42.8%). The peak of the sources appeared in summer and winter in the time series plot. Secondary sulfate formation was under the photochemical reaction, which was frequent in summer due to the high temperature and sufficient light. In addition, the amounts of SO2 from coal combustion were relatively higher in winter, which made the conversion of sulfate faster. This factor contributed the largest proportion of PM2.5 mass (25.7%).
Factor 6 was traffic source, characterized by high Ca2+ (35.2%), EC (30.7%), Mn (28.2%), Fe (23.7%), and Zn (23.3%). Ca originates from the combustion of lubricating oil additives. Zn is the additive in motor oil and is also used in tire manufacturing and brake linings [50]. This factor accounted for 10.0% of PM2.5 mass.
Factor 7 was industry source, including 33.8%, 33.6%, 33.6%, 26.3%, and 20.5% of Se, Cu, OC, Co, and Ni, respectively. As a typical element of oil combustion, Ni is generally associated with oil-fired power plants [50]. Abundant Cu was also emitted from metal smelting, such as copper smelters [51]. Industry emission contributed 8.2% to PM2.5 mass.
Therefore, the main contribution of soil dust in Qingdao was during the spring. In winter, coal combustion, secondary nitrate and secondary sulfate were the main sources. Sea salt and secondary sulfate had pronounced contributions to PM2.5 mass in summer. The contributions of traffic and industrial sources were almost evenly distributed in the four seasons. Notably, OC seemed to be almost equally split across six of the seven factors, except for sea salt source. This may be attributed to primary emissions in soil dust, coal combustion, traffic, and industrial sources, and secondary formation in secondary nitrate and sulfate sources.
3.3. The PM2.5 Characteristics across Coastal Cities in China
3.3.1. Seasonality of Species in PM2.5 across Coastal Cities
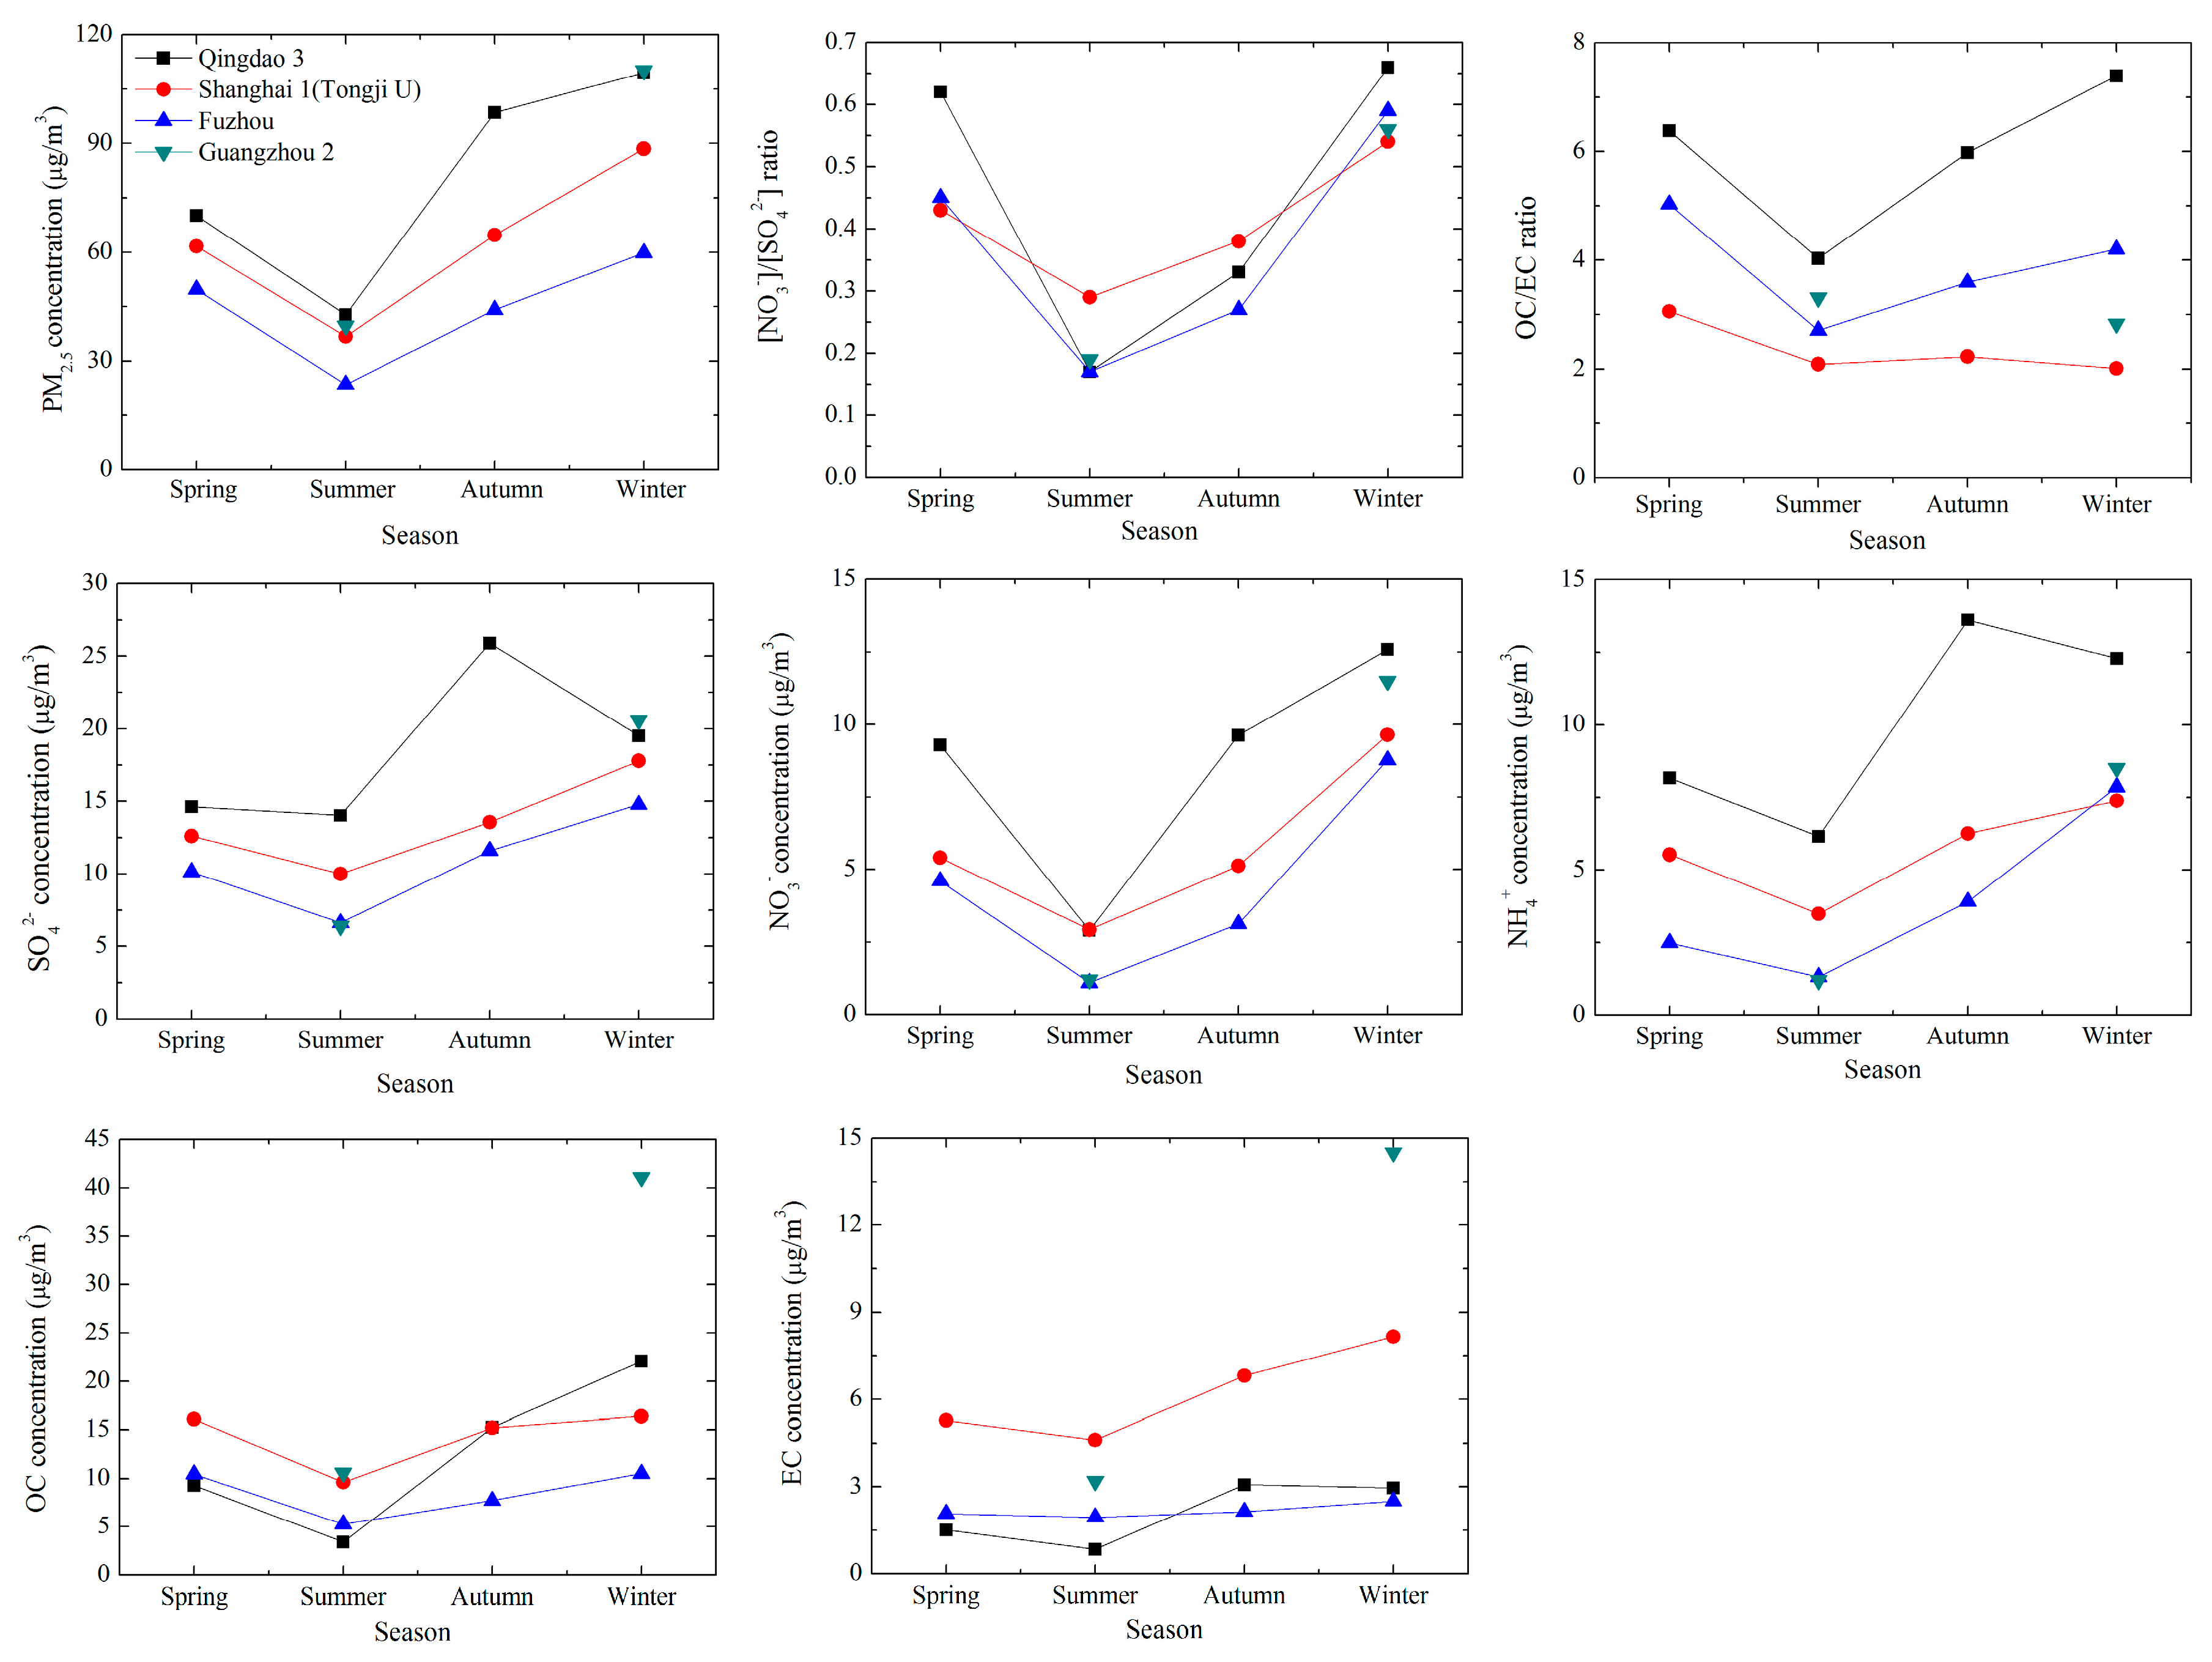
Atmospheric fine particles in coastal cities are not only influenced by marine aerosols, but also by anthropogenic particles originating from human activities such as industrial processing, fuel burning, and vehicular and shipping exhaust. Figure 11 shows the seasonal variations of PM2.5, SO42−, NO3−, NH4+, OC, EC, [NO3−]/[SO42−], and OC/EC ratios in four typical cities: Qingdao, Shanghai, Fuzhou, and Guangzhou, located in the North China Plain, Yangtze River Delta, the conjunction of Yangtze River Delta and Pearl River Delta, and Pearl River Delta, respectively, from north to south along the coastline of China (Figure 1). From the figure, it can be found that PM2.5, SO42−, NO3−, NH4+, OC, and EC showed the maximum concentrations in winter or autumn and the minimum levels in summer. This is due to the temperate continental monsoon climate in the coastal areas of China. Summer monsoons bring air from the seas in the south and east, which result in plentiful rainfall and decreased concentrations of PM2.5 and its chemical species. Winter monsoons blow from Siberia and the Mongolian Plateau, and then through north and west China mainly influenced by anthropogenic activities, which brings polluted air to these coastal areas, thus resulting in the higher species concentrations. The [NO3−]/[SO42−] ratios had their minima in summer and maxima in winter, which was related to the favorable formation of SO42− when temperature and RH are high allowing easy decomposition of NO3− under high temperatures in summer, and that NO3− remains stable in the particulate phase under lower temperatures in winter. OC/EC ratios did not show consistent seasonal patterns in the four cities, and the highest ratios were in summer, winter, or spring.
To further explore the characteristics of PM2.5 in summer and winter, proportions of species in PM2.5 were evaluated based on 10 coastal cities in Table S1. The results showed that in summer, the contribution of species to PM2.5 mass followed the order: SO42− > OC > EC > NO3− ≈ NH4+, while in winter it was OC > SO42− > NO3− > NH4+ > EC. In the two seasons, SO42− had a slightly greater contribution in summer (20.6%) than in winter (17.0%), while the contributions from NO3− and NH4+ were much higher in winter (10.6% and 8.1%) than those in summer (5.6% and 5.5%). The high contribution of NH4+ in winter was probably related to high NO3− contribution. Both OC and EC showed comparable proportions in the two seasons (19.6% and 18.1% for OC in winter and summer, and 6.6% and 6.9% for EC in winter and summer). This provided an insight into PM2.5 characteristics in coastal cities in China. They are useful for the formulation of policy to reduce particle pollution in summer and winter—especially in winter, an important role of NO3− in high particle loadings.
3.3.2. Cl-Depletion
Cl-depletion is a unique characteristic in the urban aerosol of coastal cities. As mentioned above, Qingdao showed obvious Cl-depletion in summer (not across the whole year), similar to Shanghai [52], Hangzhou [53], Xiamen [54], and Guangzhou [55], while Cl-depletion in Hong Kong can be found across all four seasons [56]. In these coastal cities, when air mass was mainly affected by sea sources, Cl-depletion was evident; however, when air mass was from anthropogenic sources or a mixture of anthropogenic and sea sources, Cl was often enriched and Cl-depletion did not show based on the species concentration in the aerosol. Notably, Yao et al. [57] reported that Cl-depletion was more severe during the day than that at night in Xiamen, and suggested that more active chemical reactions occurred during the day.
4. Conclusions
The daily PM2.5 mass concentrations ranged from 8.49 to 285 μg/m3, with an average of 79.0 μg/m3 across a one-year field measurement survey in Qingdao, suggesting severe fine particle pollution. PM2.5 mass, nss-SO42−, NO3−, NH4+, OC, and EC showed obvious seasonal variations, with the highest concentrations in winter for PM2.5 mass, NO3−, and OC, and in autumn for nss-SO42−, NH4+, and EC, and all had the lowest concentrations in summer. SOC accounted for 70.0% of OC, and was the predominant organic component in PM2.5. The enrichment factor analysis showed that Si, Ti, Mg, Ca, Fe, and Na were lower than 10, thus indicating that they were mainly from crustal sources. The EFs of Sr, K, Mn, Ba, V, Cr, Ni, Co, Sc, Cu, Cl, Zn, Pb, S, Br, Cd, and Se were larger than 10, meaning that they mostly originated from anthropogenic activities. Mg, Na, Sr, Ba, V, Cr, Ni, Co, Sc, S, and Cd had higher EFs in summer compared to the other three seasons due to the influence of sea sources for Mg and Na, ship exhaust emissions for Sr, Ba, V, Cr, Ni, Co, Sc, and Cd, and secondary formation for S. The EFs of As, Cl, and Br had the highest values in winter, resulting from extra coal burning for heating. The mass reconstruction showed that (NH4)2SO4 organic matter and NH4NO3 were the main components, and had percentages of 31.0%, 25.2%, and 14.0% in PM2.5 mass, respectively. Source apportionment results indicated that secondary sulfate and nitrate and coal combustion were the main contributions to PM2.5 mass. Based on the study in Qingdao and previous literature, PM2.5 mass and chemical species showed seasonal variations with high concentrations in winter or autumn and low concentrations in summer in the coastal cities in China. Compared to that in summer, the fraction increase of NO3− in PM2.5 played a significant role on elevating the particle level in winter in these cities. Cl-depletion mainly happened in summer.
Supplementary Materials
The following are available online at www.mdpi.com/2073-4433/8/4/77/s1, Table S1: Brief introduction of PM2.5 sampling and analyses in coastal cities from Northern to Southern China, Table S2: The concentrations of SO42−, NO3− and NH4+ in coastal 10 cities in China during 1997–2010, Table S3: The concentrations of OC and EC in coastal 10 cities in China during 1997–2010.
Acknowledgments
The authors gratefully acknowledge the support of The National Key Research and Development Program of China (2016YFC0200500), the Shandong Province Natural Science Foundation (ZR2010DQ022), the Independent Innovation Foundation of Shandong University (2012TS041), the China Postdoctoral Science Foundation funded project (20060400982) and the Shandong Postdoctoral Science Innovation Foundation (200601003).
Author Contributions
Xuehua Zhou and Wenxing Wang conceived and designed the experiments; Zhe Wang and Yang Zhou performed the experiments; Ruidong Wu, Xuehua Zhou, Linpeng Wang and Jingzhu Zhang analyzed the data; Xuehua Zhou contributed reagents/materials/analysis tools; Ruidong Wu wrote the paper.
Conflicts of Interest
The authors declare no conflict of interest.
References
- Zhang, X.Y.; Wang, Y.Q.; Niu, T.; Zhang, X.C.; Gong, S.L.; Zhang, Y.M.; Sun, J.Y. Atmospheric aerosol compositions in China: Spatial/temporal variability, chemical signature, regional haze distribution and comparisons with global aerosols. Atmos. Chem. Phys. 2012, 12, 779–799. [Google Scholar] [CrossRef]
- Tiwari, S.; Srivastava, A.K.; Singh, A.K.; Singh, S. Identification of aerosol types over Indo-Gangetic Basin: Implications to optical properties and associated radiative forcing. Environ. Sci. Pollut. Res. 2015, 22, 12246–12260. [Google Scholar] [CrossRef] [PubMed]
- Lipfert, F.W. An assessment of air pollution exposure information for health studies. Atmosphere 2015, 6, 1736–1752. [Google Scholar] [CrossRef]
- He, K.; Yang, F.; Ma, Y.; Zhang, Q.; Yao, X.; Chan, C.K.; Cadle, S.; Chan, T.; Mulawa, P. The characteristics of PM2.5 in Beijing, China. Atmos. Environ. 2001, 35, 4959–4970. [Google Scholar] [CrossRef]
- Hu, M.; He, L.Y.; Zhang, Y.H.; Wang, M.; Kim, Y.P.; Moon, K.C. Seasonal variation of ionic species in fine particles at Qingdao, China. Atmos. Environ. 2002, 36, 5853–5859. [Google Scholar] [CrossRef]
- Li, X.D.; Yang, Z.; Fu, P.; Yu, J.; Lang, Y.C.; Liu, D.; Ono, K.; Kawamura, K. High abundances of dicarboxylic acids, oxocarboxylic acids, and α-dicarbonyls in fine aerosols (PM2.5) in Chengdu, China during wintertime haze pollution. Environ. Sci. Pollut. Res. 2015, 22, 12902–12918. [Google Scholar] [CrossRef] [PubMed]
- Wang, W.; Wang, S.; Xu, J.; Zhou, R.; Shi, C.; Zhou, B. Gas-phase ammonia and PM2.5 ammonium in a busy traffic area of Nanjing, China. Environ. Sci. Pollut. Res. 2016, 23, 1691–1702. [Google Scholar] [CrossRef] [PubMed]
- Ye, B.; Ji, X.; Yang, H.; Yao, X.; Chan, C.K.; Cadle, S.H.; Chan, T.; Mulawa, P.A. Concentration and chemical composition of PM2.5 in Shanghai for a 1-year period. Atmos. Environ. 2003, 37, 499–510. [Google Scholar] [CrossRef]
- Yang, L.; Zhou, X.; Wang, Z.; Zhou, Y.; Cheng, S.; Xu, P.; Gao, X.; Nie, W.; Wang, X.; Wang, W. Airborne fine particulate pollution in Jinan, China: Concentrations, chemical compositions and influence on visibility impairment. Atmos. Environ. 2012, 55, 506–514. [Google Scholar] [CrossRef]
- Zhou, X.; Cao, Z.; Ma, Y.; Wang, L.; Wu, R.; Wang, W. Concentrations, correlations and chemical species of PM2.5/PM10 based on published data in China: Potential implications for the revised particulate standard. Chemosphere 2016, 144, 518–526. [Google Scholar] [CrossRef] [PubMed]
- Lai, S.C.; Zou, S.C.; Cao, J.J.; Lee, S.C.; Ho, K.F. Characterizing ionic species in PM2.5 and PM10 in four pearl river delta cities, south China. J. Environ. Sci. 2007, 19, 939–947. [Google Scholar] [CrossRef]
- Nie, W.; Wang, T.; Wang, W.; Wei, X.; Liu, Q. Atmospheric concentrations of particulate sulfate and nitrate in Hong Kong during 1995–2008: Impact of local emission and super-regional transport. Atmos. Environ. 2013, 76, 43–51. [Google Scholar] [CrossRef]
- Dewan, N.; Wang, Y.Q.; Zhang, Y.X.; Zhang, Y.; He, L.Y.; Huang, X.F.; Majestic, B.J. Effect of pollution controls on atmospheric PM2.5 composition during universiade in Shenzhen, China. Atmosphere 2016, 7, 57. [Google Scholar] [CrossRef]
- Ho, K.F.; Lee, S.C.; Cao, J.J.; Chow, J.C.; Watson, J.G.; Chan, C.K. Seasonal variations and mass closure analysis of particulate matter in Hong Kong. Sci. Total Environ. 2006, 355, 276–287. [Google Scholar] [CrossRef] [PubMed]
- Guo, Z.G.; Feng, J.L.; Fang, M.; Chen, H.Y.; Lau, K.H. The elemental and organic characteristics of PM2.5 in Asian dust episodes in Qingdao, China, 2002. Atmos. Environ. 2004, 38, 909–919. [Google Scholar] [CrossRef]
- Dong, L.; Qi, J.; Shao, C.; Zhong, X.; Gao, D.; Cao, W.; Gao, J.; Bai, R.; Long, G.; Chu, C. Concentration and size distribution of total airborne microbes in hazy and foggy weather. Sci. Total Environ. 2016, 541, 1011–1018. [Google Scholar] [CrossRef] [PubMed]
- Duan, F.; Liu, X.; Yu, T.; Cachier, H. Identification and estimate of biomass burning contribution to the urban aerosol organic carbon concentrations in Beijing. Atmos. Environ. 2004, 38, 1275–1282. [Google Scholar] [CrossRef]
- Chi, X.; Di, Y.; Dong, S.; Liu, X. Determination of organic carbon and elemental carbon in atmospheric aerosol samples. Environ. Monit. China 1999, 15, 11–13. [Google Scholar]
- Cachier, H.B.; Bremond, M.P.; Buat-Ménard, P. Determination of atmospheric soot carbon with a simple thermal method. Tellus B 1989, 41B, 379–390. [Google Scholar] [CrossRef]
- Schmid, H.L.; Laskus, L.; Abraham, H.J.; Baltensperger, U.; Lavanchy, V. Results of the “carbon conference” international aerosol carbon round robin test stage I. Atmos. Environ. 2001, 35, 2111–2121. [Google Scholar] [CrossRef]
- Chow, J.C.; Watson, J.G.; Crow, D.; Lowenthal, D.H.; Merrifield, T. Comparison of improve and niosh carbon measurements. Aerosol Sci. Technol. 2001, 34, 23–34. [Google Scholar] [CrossRef]
- Sciare, J.; Cachier, H.; Oikonomou, K.; Ausset, P.; Sarda-Estève, R.; Mihalopoulos, N. Characterization of carbonaceous aerosols during the minos campaign in Crete, July–August 2001 a multi-analytical approach. Atmos. Chem. Phys. 2003, 3, 1743–1757. [Google Scholar] [CrossRef]
- China National Environmental Monitoring Centre. Background Contents on Elements of Soils in China; China Environmental Science Press: Beijing, China, 1990. [Google Scholar]
- Turpin, B.J.; Lim, H.J. Species contributions to PM2.5 mass concentrations: Revisiting common assumptions for estimating organic mass. Aerosol Sci. Technol. 2001, 35, 602–610. [Google Scholar] [CrossRef]
- Malm, W.C.; Sisler, J.F.; Huffman, D.; Eldred, R.A.; Cahill, T.A. Spatial and seasonal trends in particle concentration and optical extinction in the United States. J. Geophys. Res. 1994, 99, 1347–1370. [Google Scholar] [CrossRef]
- Norris, G.; Duvall, R.; Brown, S.; Bai, S. EPA Positive Matrix Factorization (PMF) 5.0 Fundamentals & User Guide; US Environmental Protection Agency, Office of Research and Development: Washington, DC, USA, 2014.
- Norris, G.; Duvall, R.; Wade, K.; Brown, S.; Prouty, J. EPA Positive Matrix Factorization (PMF) 3.0 Fundamentals & User Guide; US Environmental Protection Agency, Office of Research and Development: Washington, DC, USA, 2008.
- Chu, S.-H.; Paisie, J.W.; Jang, B.W.L. Pm data analysis—A comparison of two urban areas: Fresno and Atlanta. Atmos. Environ. 2004, 38, 3155–3164. [Google Scholar] [CrossRef]
- Yao, X.; Chan, C.K.; Fang, M.; Cadle, S.; Chan, T.; Mulawa, P.; He, K.; Ye, B. The water-soluble ionic composition of PM2.5 in Shanghai and Beijing, China. Atmos. Environ. 2002, 36, 4223–4234. [Google Scholar] [CrossRef]
- Arimoto, R.; Duce, R.A.; Savoie, D.L.; Prospero, J.M.; Talbot, R.; Cullen, J.D.; Tomza, U.; Lewis, N.F.; Ray, B.J. Relationships among aerosol constituents from Asia and the North Pacific during Pem-West A. J. Geophys. Res. 1996, 101, 2011–2023. [Google Scholar] [CrossRef]
- Kato, N. Analysis of structure of energy consumption and dynamics of emission of atmospheric species related to the global environmental change (SOx, NOx, and CO2) in Asia. Atmos. Environ. 1996, 30, 757–785. [Google Scholar] [CrossRef]
- Wang, Y.; Zhuang, G.; Tang, A.; Yuan, H.; Sun, Y.; Chen, S.; Zheng, A. The iron chemistry and the source of PM2.5 aerosol in Beijing. Atmos. Environ. 2005, 39, 3771–3784. [Google Scholar] [CrossRef]
- Huebert, B.J.; Wang, M.-X.; Lu, W.-X. Atmospheric nitrate, sulfate, ammonium and calcium concentrations in China. Tellus B 1988, 40B, 260–269. [Google Scholar] [CrossRef]
- Kim, B.M.; Teffera, S.; Zeldin, M.D. Characterization of PM2.5 and PM10 in the south coast air basin of southern California: Part 1—spatial variations. J. Air Waste Manag. Assoc. 2000, 50, 2034–2044. [Google Scholar] [CrossRef] [PubMed]
- Kawamura, K.; Steinburg, S.; Kaplan, I.R. Concentrations of monocarboxylic and dicarboxylic acids and aldehydes in southern California wet precipitations: Comparison of urban and nonurban samples and compositional changes during scavenging. Atmos. Environ. 1996, 30, 1035–1052. [Google Scholar] [CrossRef]
- Kawamura, K.; Steinburg, S.; Kaplan, I.R. Determination of organic acids (C1–C10) in the atmosphere, motor exhausts, and engine oils. Environ. Sci. Technol. 1985, 19, 1082–1086. [Google Scholar] [CrossRef] [PubMed]
- Kawamura, K.; Steinburg, S.; Kaplan, I.R. Homologous series of C1–C10 monocarboxylic acids and C1–C6 carbonyls in Los Angeles air and motor vehicle exhausts. Atmos. Environ. 2000, 34, 4175–4191. [Google Scholar] [CrossRef]
- Kawamura, K.; Steinburg, S.; Lai, N.; Kaplan, I.R. Wet deposition of low molecular weight mono- and di-carboxylic acids, aldehydes and inorganic species in Los Angeles. Atmos. Environ. 2001, 35, 3917–3926. [Google Scholar] [CrossRef]
- Hsu, S.C.; Liu, S.C.; Kao, S.J.; Jeng, W.L.; Huang, Y.T.; Tseng, C.M.; Tsai, F.; Tu, J.Y.; Yang, Y. Water-soluble species in the marine aerosol from the northern south China sea: High chloride depletion related to air pollution. J. Geophys. Res. 2007, 112. [Google Scholar] [CrossRef]
- Turpin, B.J.; Huntzicker, J.J. Secondary formation of organic aerosol in the Los Angeles basin: A descriptive analysis of organic and elemental carbon concentrations. Atmos. Environ. Part A Gen. Top. 1991, 25, 207–215. [Google Scholar] [CrossRef]
- Turpin, B.J.; Cary, R.A.; Huntzicker, J.J. An in situ, time-resolved analyzer for aerosol organic and elemental carbon. Aerosol Sci. Technol. 1990, 12, 161–171. [Google Scholar] [CrossRef]
- Cao, J.J.; Lee, S.C.; Ho, K.F.; Zou, S.C.; Fung, K.; Li, Y.; Watson, J.G.; Chow, J.C. Spatial and seasonal variations of atmospheric organic carbon and elemental carbon in Pearl River delta region, China. Atmos. Environ. 2004, 38, 4447–4456. [Google Scholar] [CrossRef]
- Duan, F.K.; He, K.B.; Ma, Y.L.; Yang, F.M.; Yu, X.C.; Cadle, S.H.; Chan, T.; Mulawa, P.A. Concentration and chemical characteristics of PM2.5 in Beijing, China: 2001–2002. Sci. Total Environ. 2006, 355, 264–275. [Google Scholar] [CrossRef] [PubMed]
- Hagler, G.S.W.; Bergin, M.H.; Salmon, L.G.; Yu, J.Z.; Wan, E.C.H.; Zheng, M.; Zeng, L.M.; Kiang, C.S.; Zhang, Y.H.; Schauer, J.J. Local and regional anthropogenic influence on PM2.5 elements in Hong Kong. Atmos. Environ. 2007, 41, 5994–6004. [Google Scholar] [CrossRef]
- Torfs, K.; Van Grieken, R. Chemical relations between atmospheric aerosols, deposition and stone decay layers on historic buildings at the mediterranean coast. Atmos. Environ. 1997, 31, 2179–2192. [Google Scholar] [CrossRef]
- Sillanpää, M.; Hillamo, R.; Saarikoski, S.; Frey, A.; Pennanen, A.; Makkonen, U.; Spolnik, Z.; Van Grieken, R.; Braniš, M.; Brunekreef, B.; et al. Chemical composition and mass closure of particulate matter at six urban sites in Europe. Atmos. Environ. 2006, 40 (Suppl. 2), 212–223. [Google Scholar] [CrossRef]
- Han, F.K.; Kota, S.H.; Wang, Y.; Zhang, H. Source apportionment of PM2.5 in Baton Rouge, Louisiana during 2009–2014. Sci. Total Environ. 2017, 586, 115–126. [Google Scholar] [CrossRef] [PubMed]
- Lee, B.; Zhu, L.; Tang, J.; Zhang, F.; Zhang, Y. Seasonal variations in elemental composition of aerosols in Xiamen, China. Geochem. J. 2009, 43, 423–440. [Google Scholar] [CrossRef]
- Zíková, N.W.; Wang, Y.; Yang, F.; Li, X.; Tian, M.; Hopke, P.K. On the source contribution to beijing PM2.5 concentrations. Atmos. Environ. 2016, 134, 84–95. [Google Scholar] [CrossRef]
- Lee, J.H.; Hopke, P.K.; Turner, J.R. Source identification of airborne PM2.5, at the St. Louis-midwest supersite. J. Geophys. Res. Atmos. 2006, 111, 234–244. [Google Scholar] [CrossRef]
- Yao, L.; Yang, L.; Yuan, Q.; Yan, C.; Dong, C.; Meng, C.; Sui, X.; Yang, F.; Lu, Y.; Wang, W. Sources apportionment of PM2.5 in a background site in the north China plain. Sci. Total Environ. 2016, 541, 590. [Google Scholar] [CrossRef] [PubMed]
- Wang, Y.; Zhuang, G.; Zhang, X.; Huang, K.; Xu, C.; Tang, A.; Chen, J.; An, Z. The ion chemistry, seasonal cycle, and sources of PM2.5 and TSP aerosol in Shanghai. Atmos. Environ. 2006, 40, 2935–2952. [Google Scholar] [CrossRef]
- Liu, G.; Zhang, X.; Teng, W.; Yang, H. Isotopic composition of organic carbon and elemental carbon in PM2.5 in Hangzhou, China. Chin. Sci. Bull. 2007, 52, 2435–2437. [Google Scholar] [CrossRef]
- Yao, X.; Wang, W.; Cui, P. Chloride depletion in coastal aerosol at Xiamen. China Environ. Sci. 1998, 18, 34–38. [Google Scholar]
- Tao, J.; Zhang, R.J.; Dong, L.; Zhang, T.; Zhu, L.H.; Han, J.L.; Xu, Z.C. Characterization of water-soluble inorganic ions in PM2.5 and PM1.0 in summer in Guangzhou. Huan Jing Ke Xue 2010, 31, 1417–1424. [Google Scholar] [PubMed]
- Louie, P.K.K.; Watson, J.G.; Chow, J.C.; Chen, A.; Sin, D.W.M.; Lau, A.K.H. Seasonal characteristics and regional transport of PM2.5 in Hong Kong. Atmos. Environ. 2005, 39, 1695–1710. [Google Scholar]
- Yao, X.; Huang, M.; Gao, H.; Hao, J. Sea-salt chloride cycles buffers rainwater acidified by transported pollutants. Sci. Atmos. Sin. 1998, 19, 22–27. [Google Scholar]
Figure 1.
The sampling site in Qingdao and the locations of coastal cities in previous publications (Table S1) in China. Red, green, and blue solid circles stand for Qingdao, the two inland cities of Beijing and Ji’nan in the North China Plain, and the coastal cities in China, respectively.
Figure 1.
The sampling site in Qingdao and the locations of coastal cities in previous publications (Table S1) in China. Red, green, and blue solid circles stand for Qingdao, the two inland cities of Beijing and Ji’nan in the North China Plain, and the coastal cities in China, respectively.
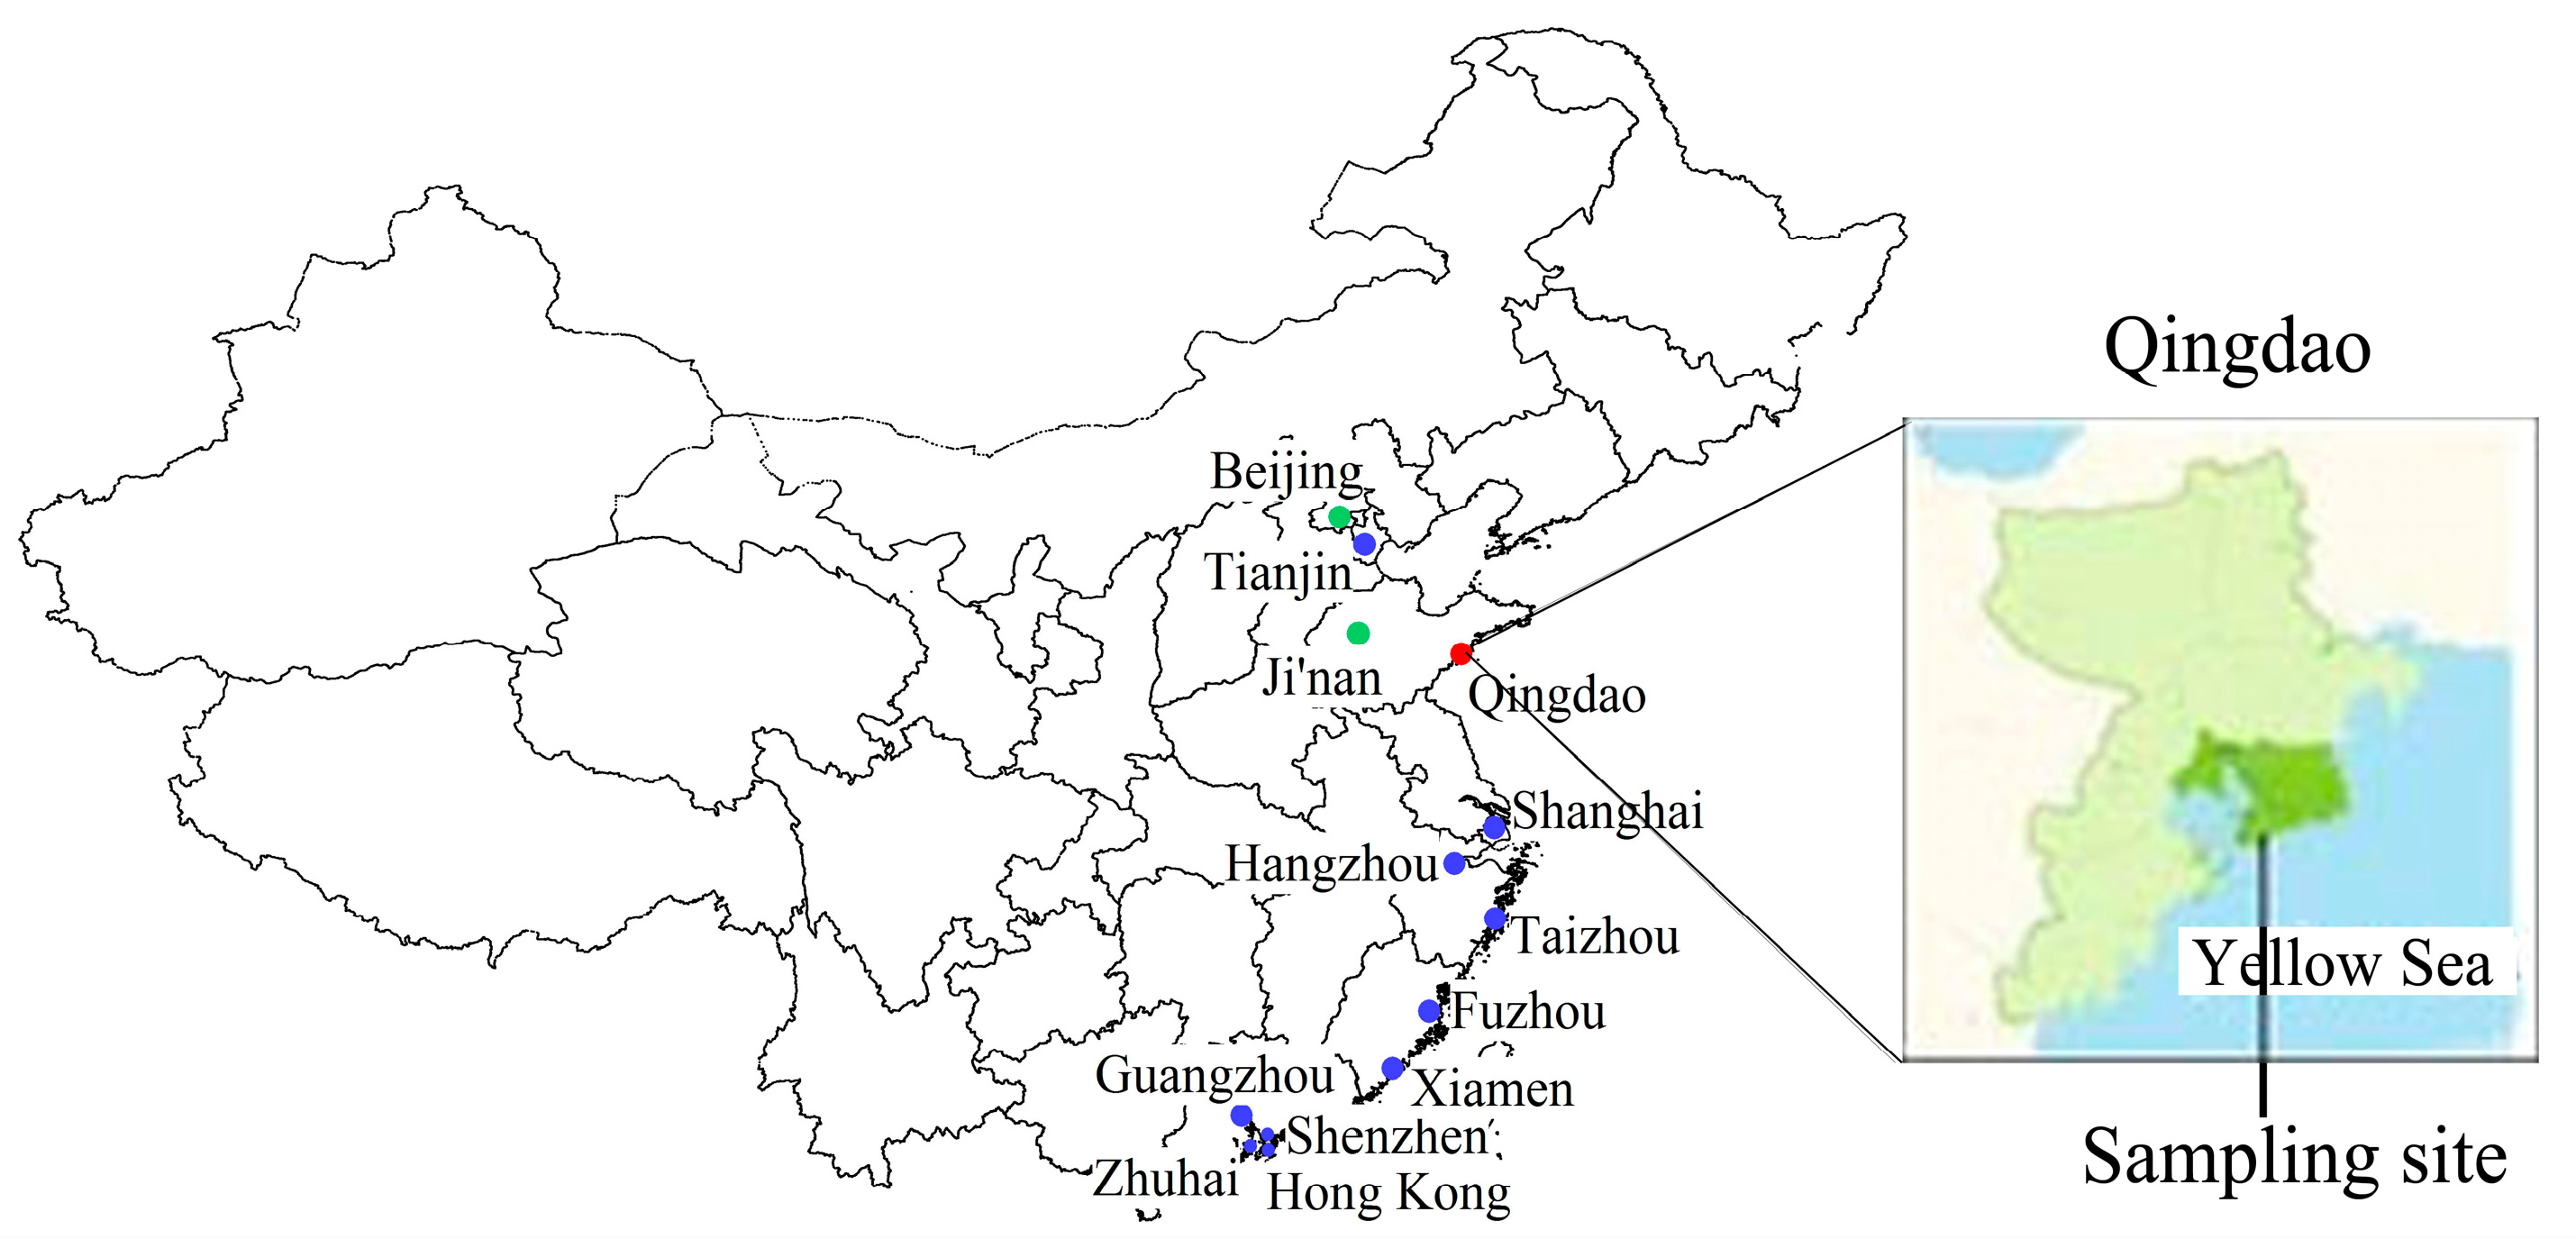
Figure 2.
Meteorological conditions during the sampling period in Qingdao. RH: relative humidity; WD: wind direction; WS: wind speed.
Figure 2.
Meteorological conditions during the sampling period in Qingdao. RH: relative humidity; WD: wind direction; WS: wind speed.

Figure 3.
Seasonal variations of nss-sulfate, nitrate, and ammonium concentrations in Qingdao.

Figure 4.
Seasonal variations of OC, EC and secondary organic carbon (SOC) concentrations, OC/EC mass ratios, and SOC contributions to PM2.5 mass in Qingdao (some data in the fall and winter are missing due to sampler damage).
Figure 4.
Seasonal variations of OC, EC and secondary organic carbon (SOC) concentrations, OC/EC mass ratios, and SOC contributions to PM2.5 mass in Qingdao (some data in the fall and winter are missing due to sampler damage).
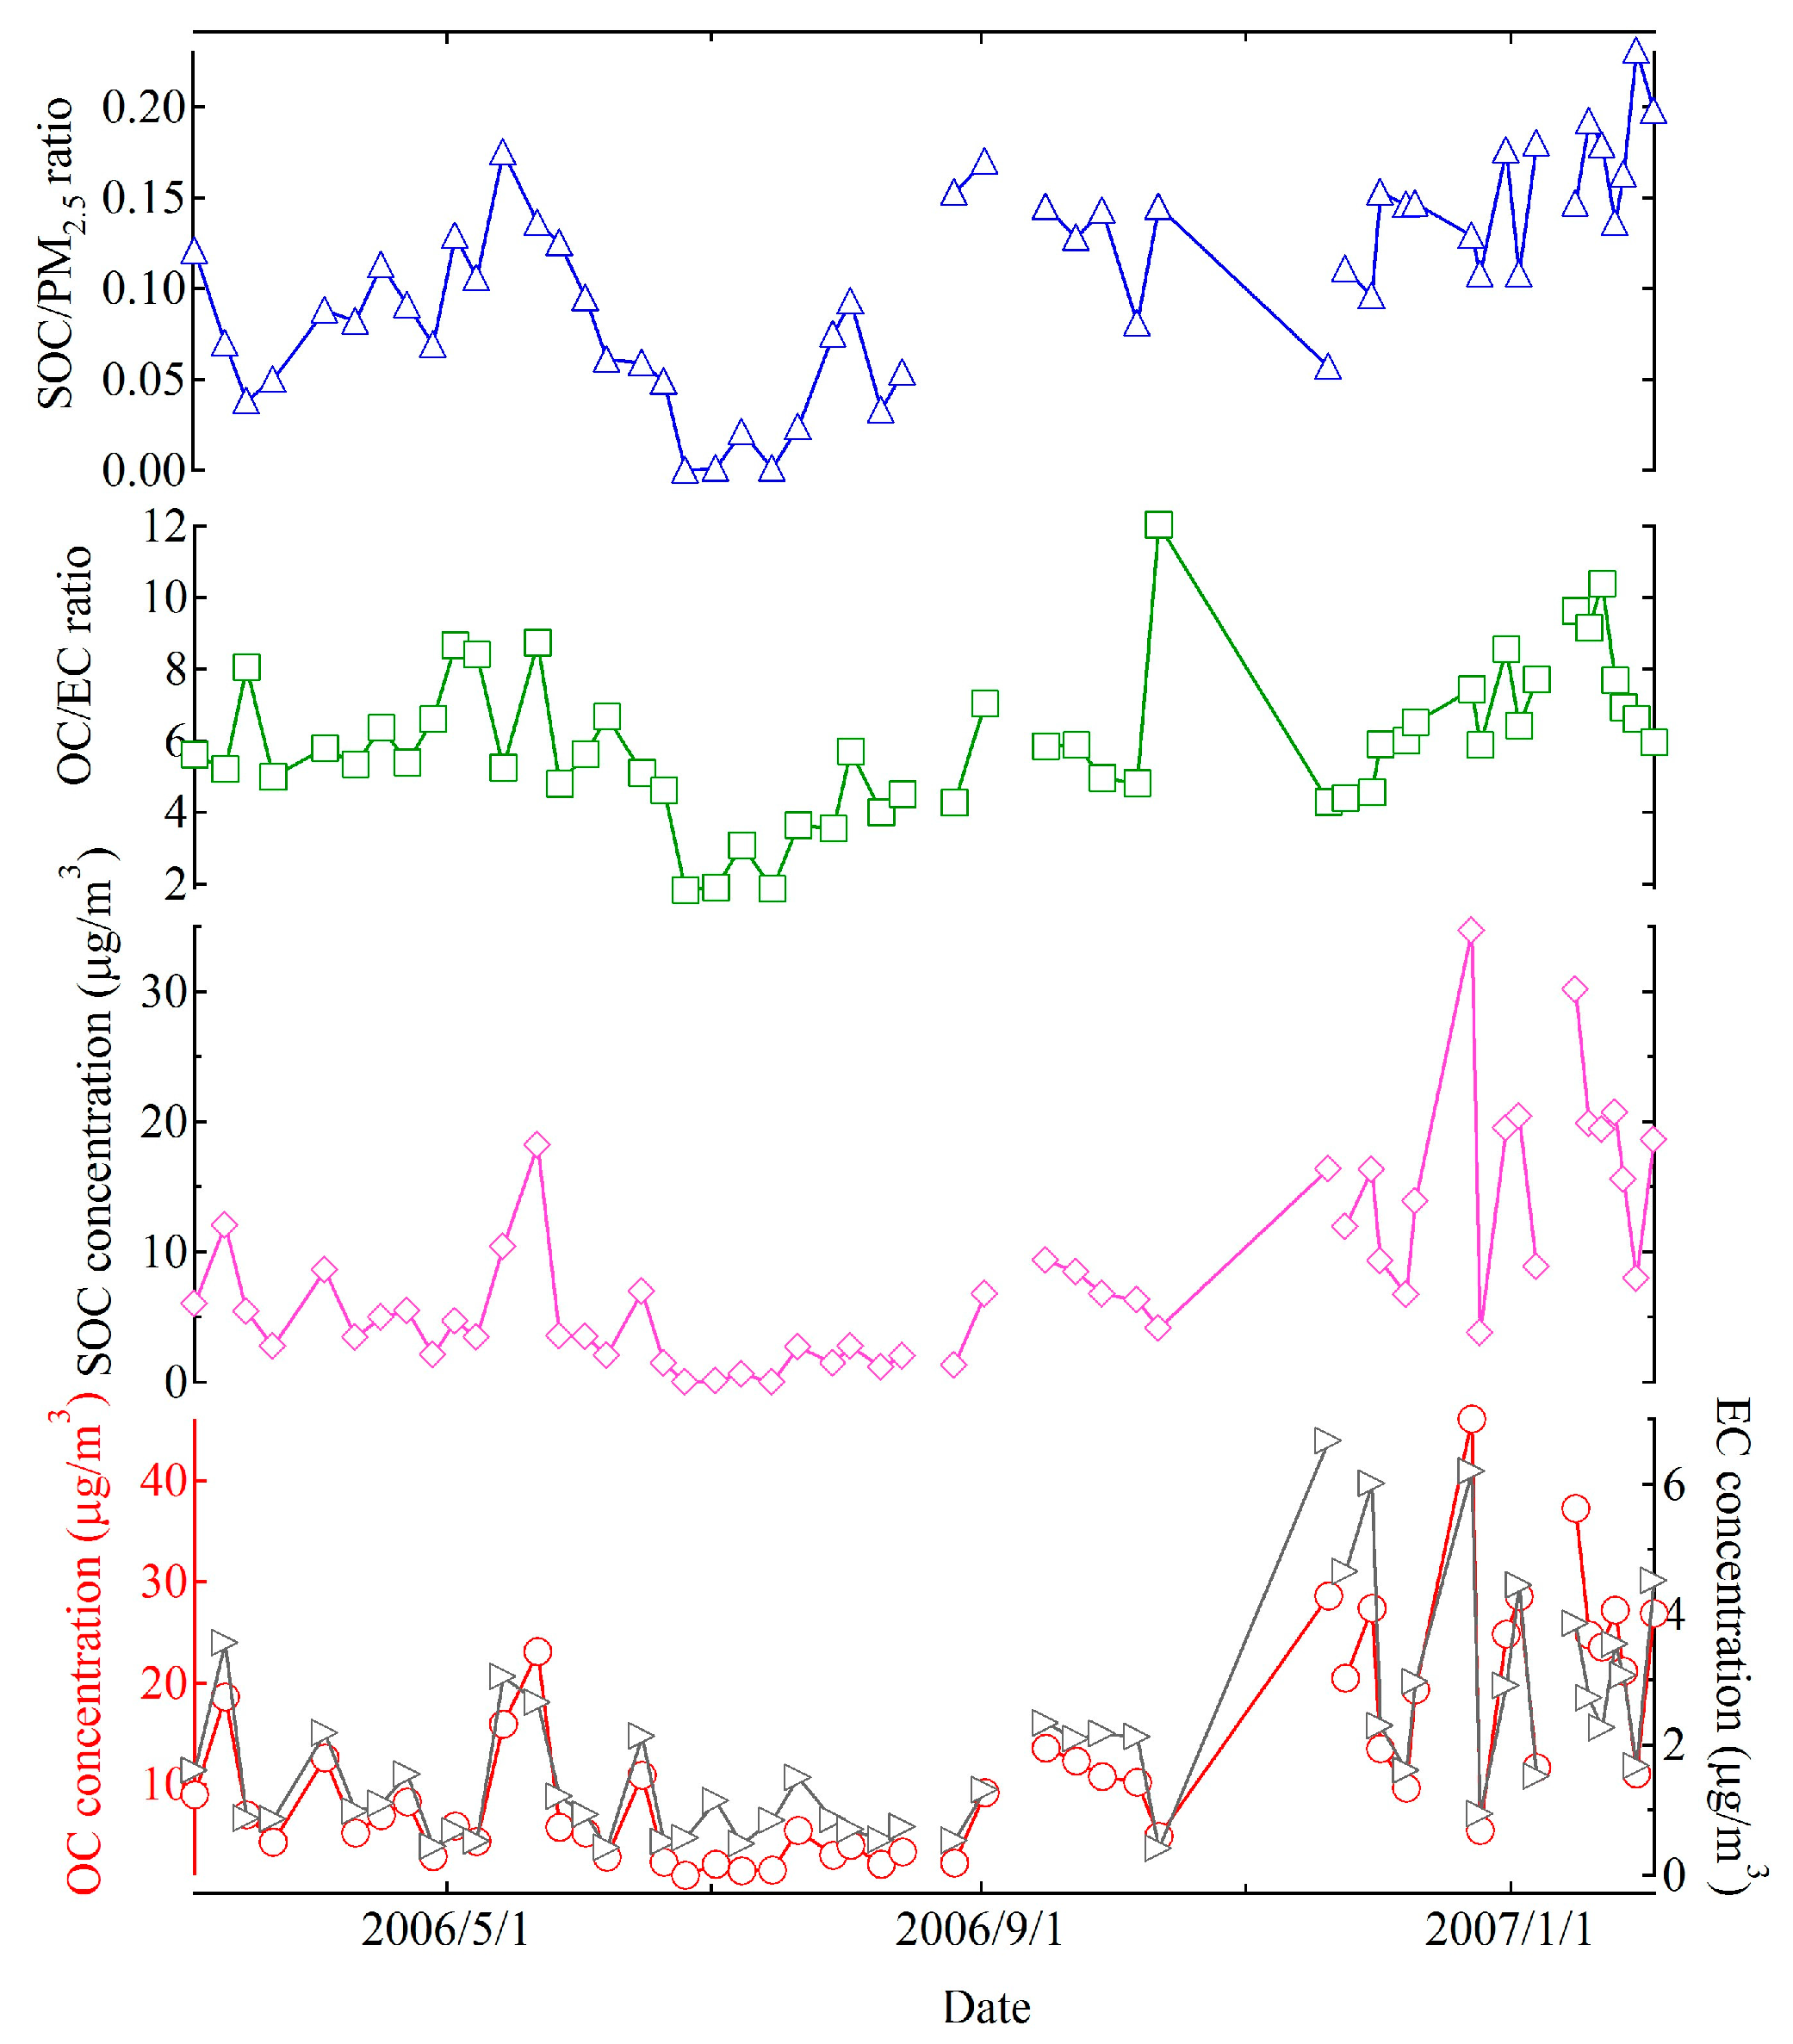
Figure 5.
The correlations between OC and EC in PM2.5.

Figure 6.
Seasonal variations of enrichment factors of the elements in PM2.5 in Qingdao.
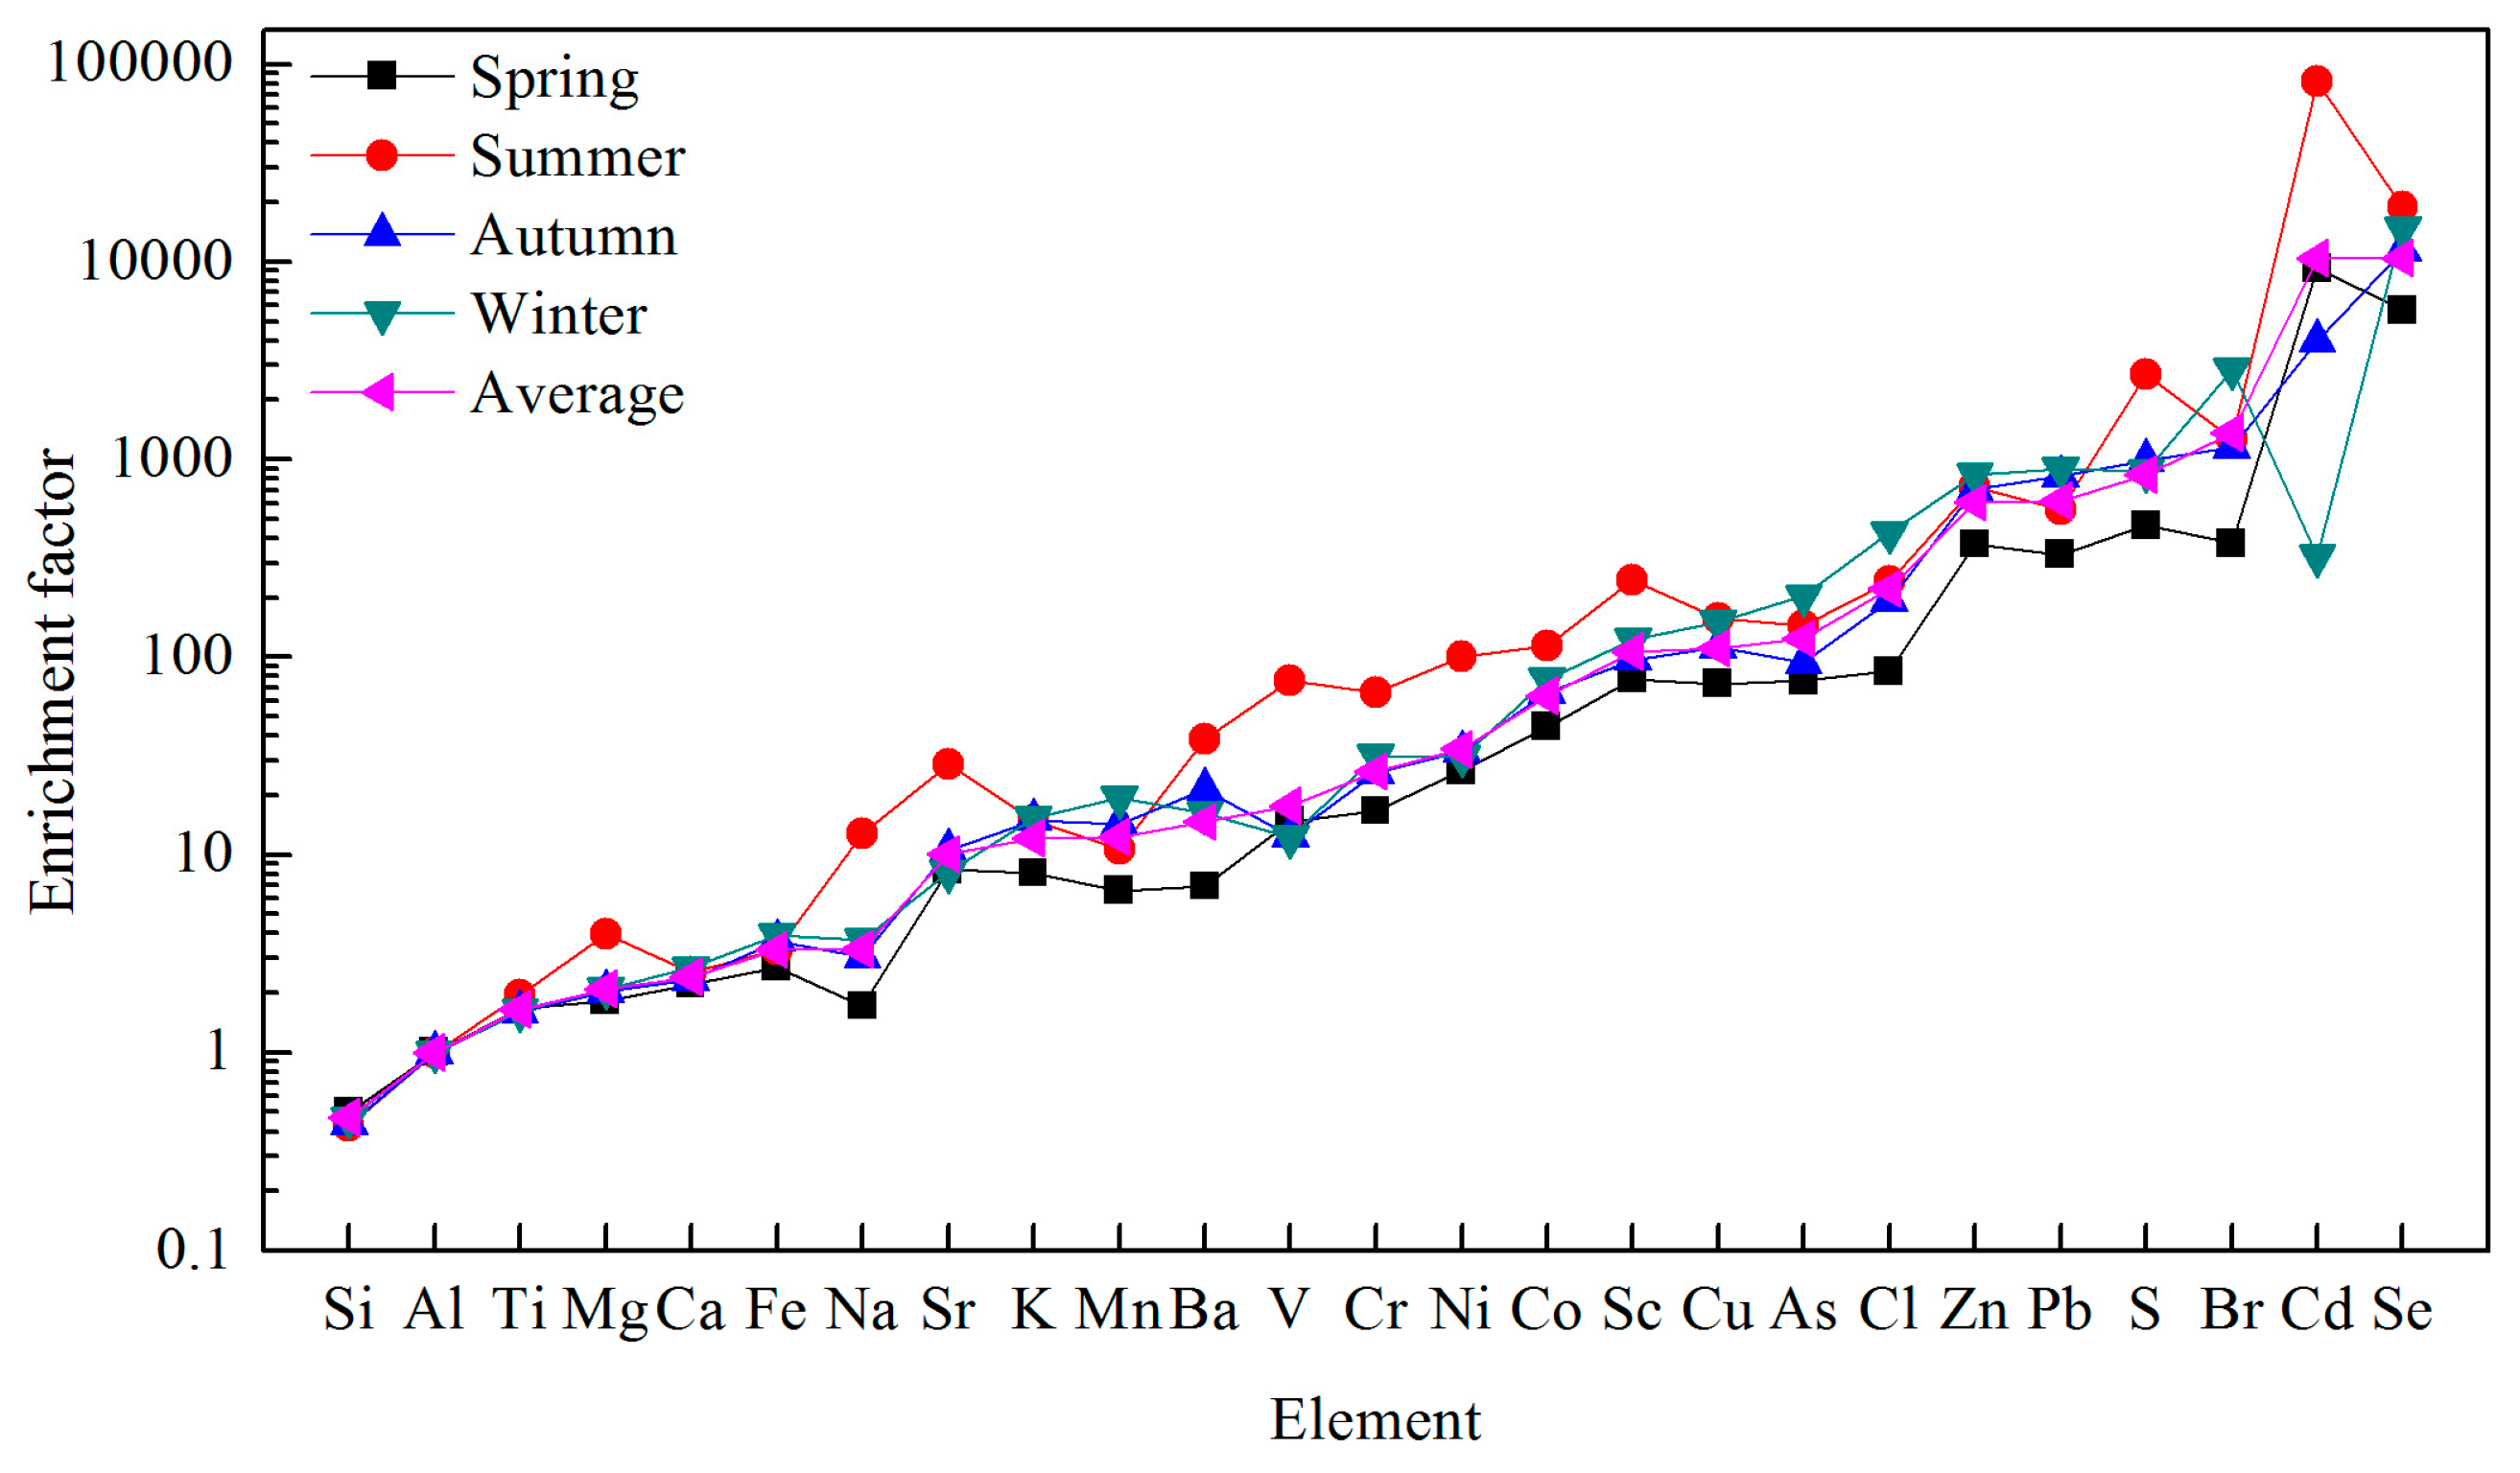
Figure 7.
The correlations of nss-SO42−, NO3−, and NH4+ in Qingdao.
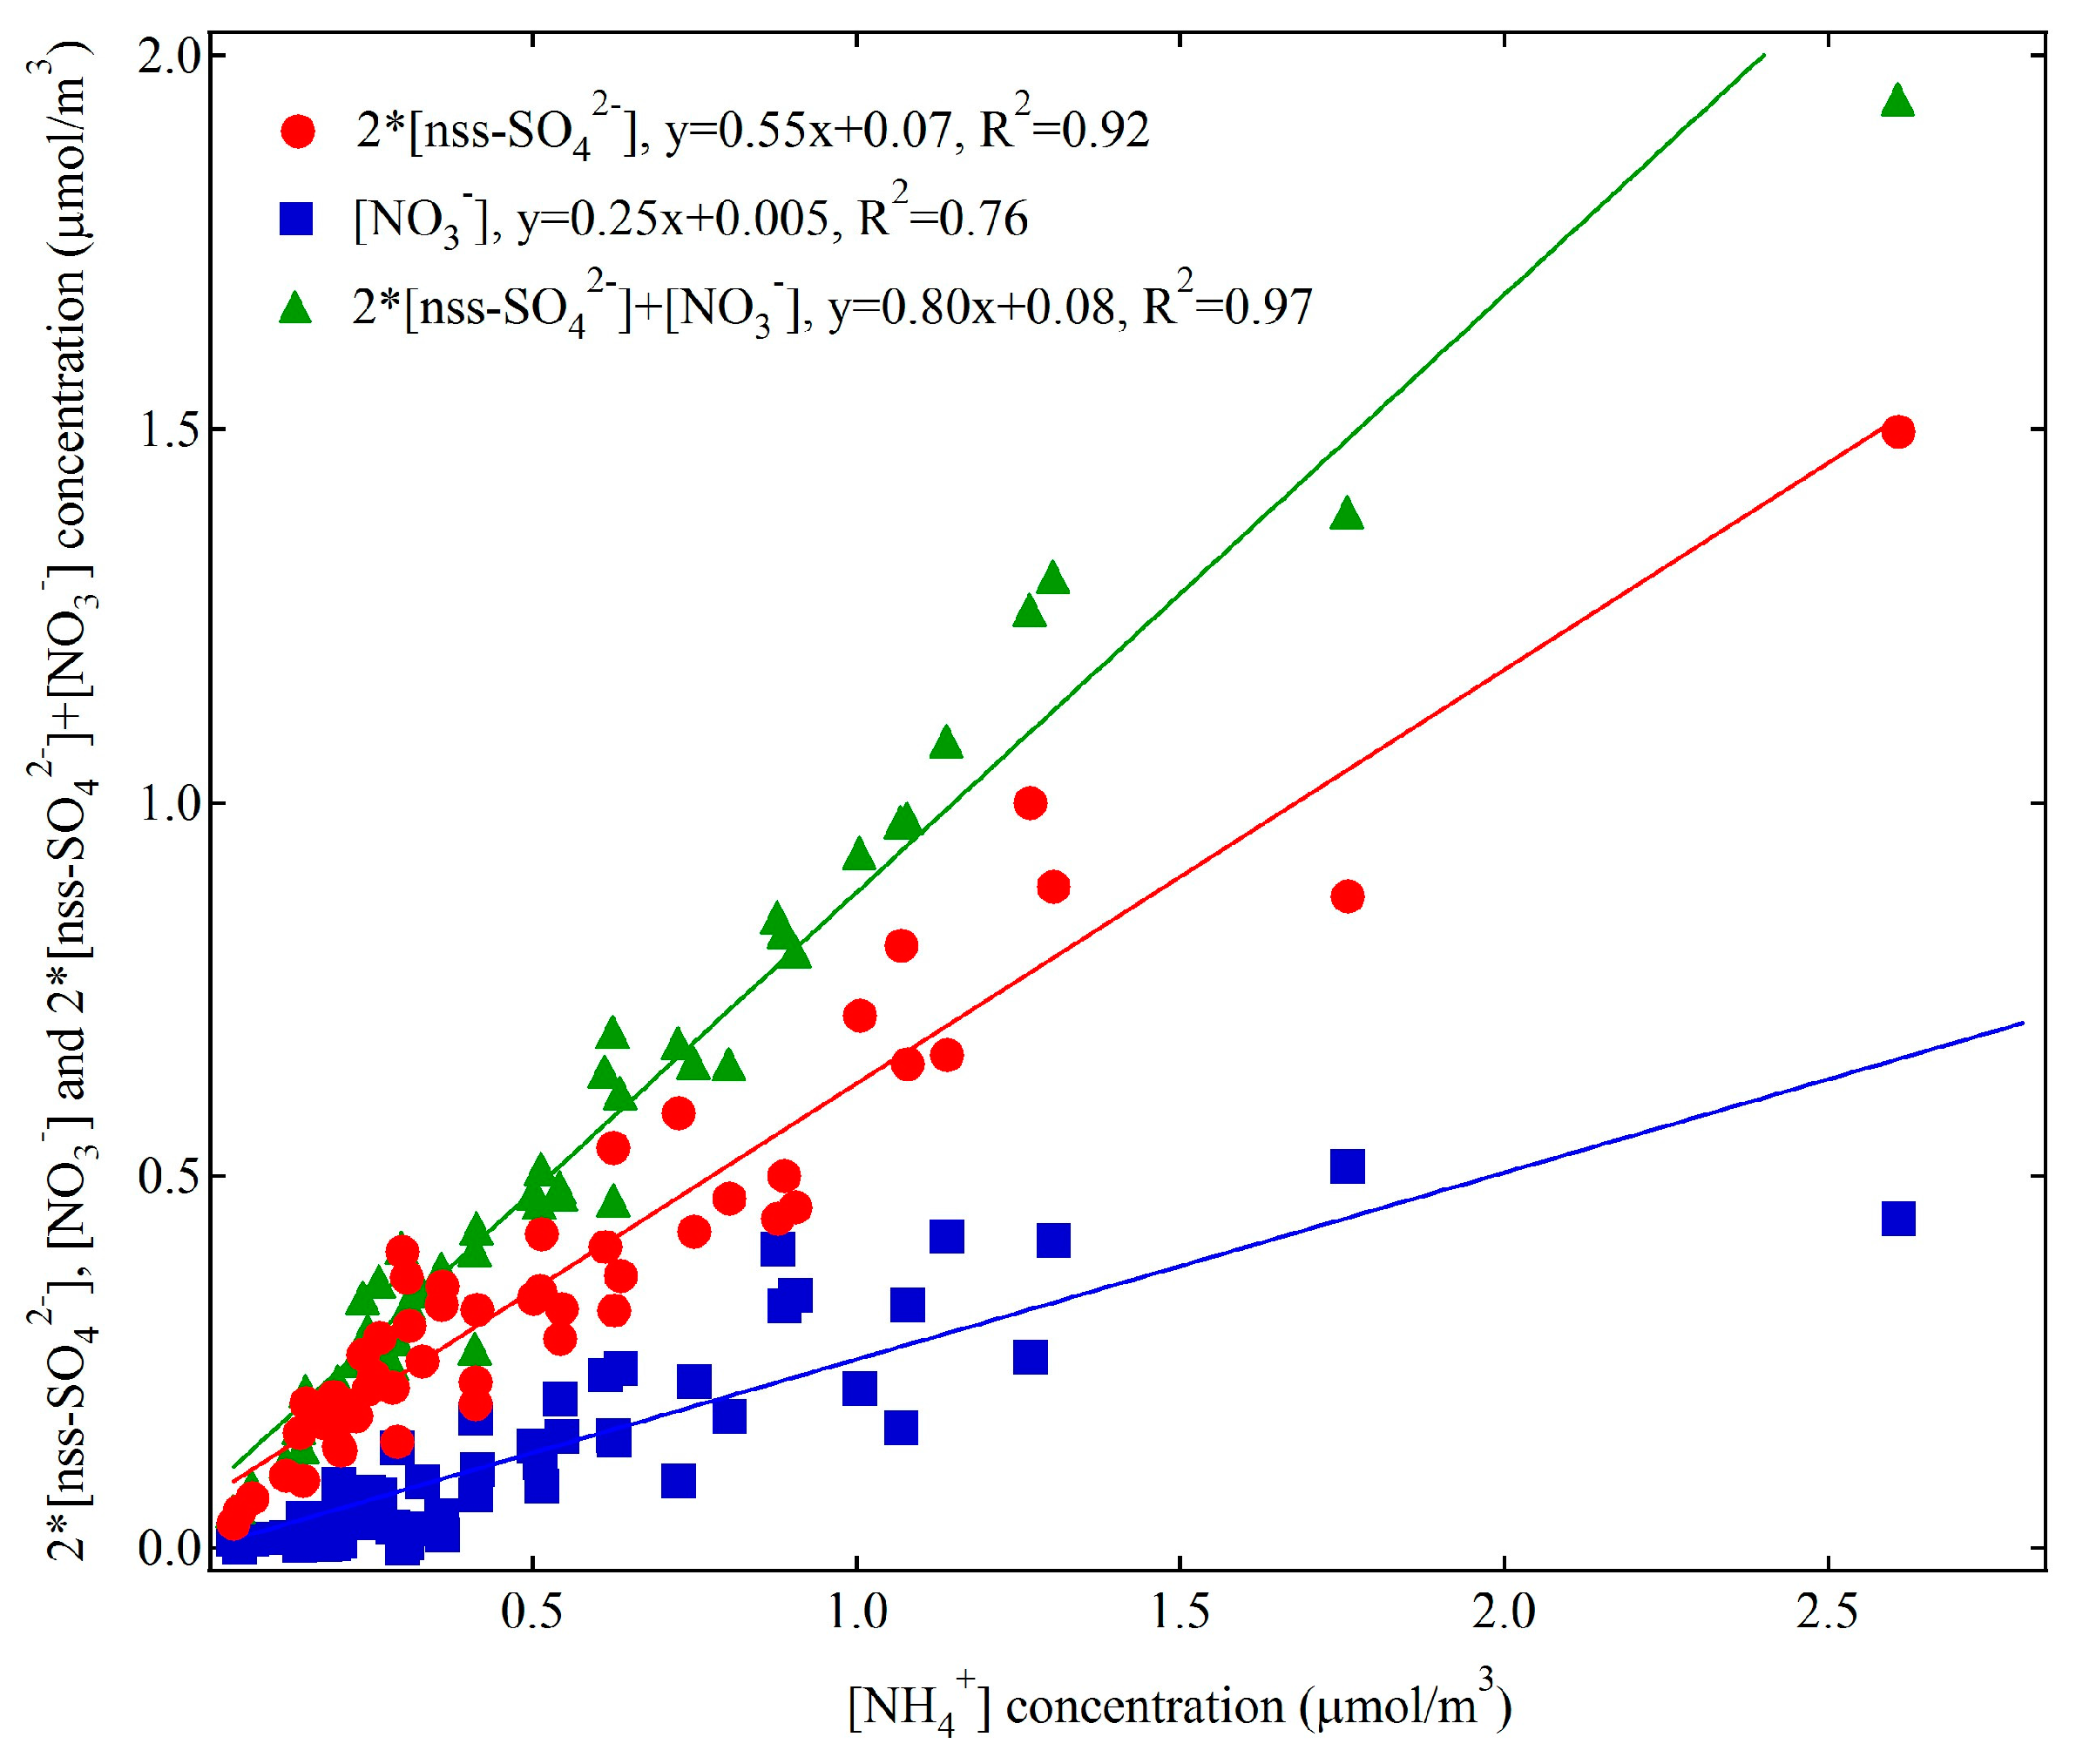
Figure 8.
The average and seasonal contributions of chemical species to PM2.5 mass in Qingdao. OM: organic mass.
Figure 8.
The average and seasonal contributions of chemical species to PM2.5 mass in Qingdao. OM: organic mass.

Figure 9.
The source profiles of chemical components in PM2.5 by positive matrix factorization (PMF) analysis (point represents percentage and rectangle represents concentration of chemical component).
Figure 9.
The source profiles of chemical components in PM2.5 by positive matrix factorization (PMF) analysis (point represents percentage and rectangle represents concentration of chemical component).

Figure 10.
The source contributions to PM2.5 mass calculated by PMF.
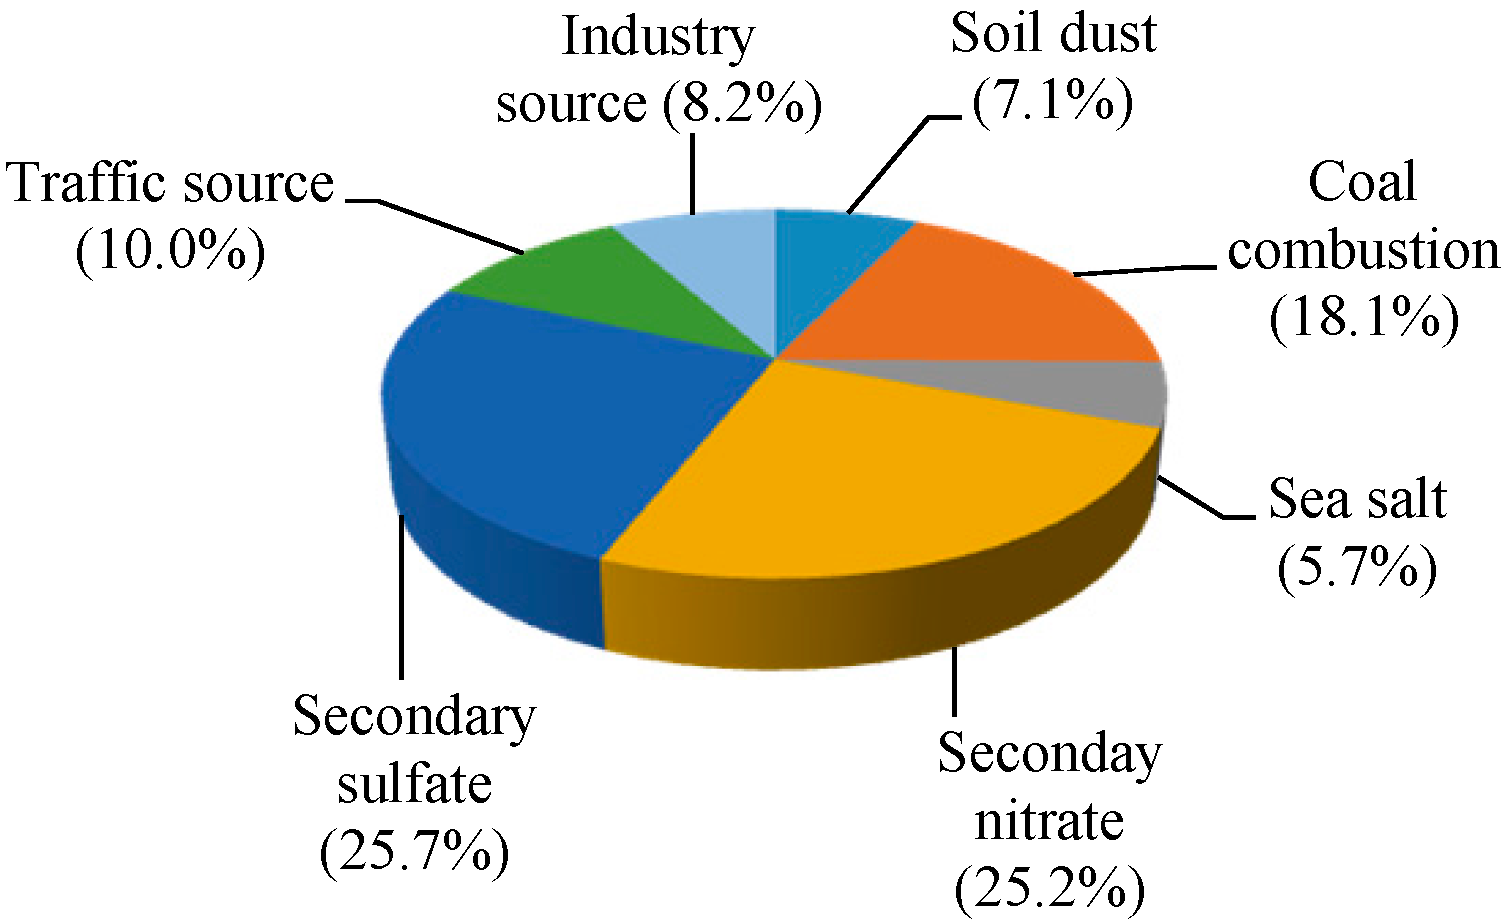
Figure 11.
The seasonal variations of PM2.5, SO42−, NO3−, NH4+, OC, EC, and [NO3−]/[SO42−] and OC/EC ratios in four coastal cities. All data come from Tables S2 and S3.
Figure 11.
The seasonal variations of PM2.5, SO42−, NO3−, NH4+, OC, EC, and [NO3−]/[SO42−] and OC/EC ratios in four coastal cities. All data come from Tables S2 and S3.


Table 1.
Seasonal average concentrations of chemical species in PM2.5 during the sampling period in Qingdao (unit: μg/m3). EC: elemental carbon; Nss-sulfate: non-sea salt sulfate; OC: organic carbon.
Table 1.
Seasonal average concentrations of chemical species in PM2.5 during the sampling period in Qingdao (unit: μg/m3). EC: elemental carbon; Nss-sulfate: non-sea salt sulfate; OC: organic carbon.
| PM2.5 and Species | Spring | Summer | Autumn | Winter | Average |
|---|---|---|---|---|---|
| PM2.5 | 70.1 | 42.8 | 98.6 | 110 | 79.0 |
| Acetic acid | 0.031 | 0.014 | 0.060 | 0.192 | 0.076 |
| Formic acid | 0.050 | 0.024 | 0.049 | 0.067 | 0.045 |
| Oxalic acid | 0.303 | 0.242 | 0.308 | 0.222 | 0.265 |
| Nitrate | 9.29 | 2.90 | 9.62 | 12.6 | 8.58 |
| Nss-sulfate | 14.6 | 14.0 | 25.9 | 19.5 | 17.8 |
| Chloride | 1.12 | 0.592 | 2.27 | 4.02 | 2.01 |
| Sodium | 0.361 | 0.423 | 0.544 | 0.632 | 0.488 |
| Ammonium | 8.17 | 6.16 | 13.6 | 12.3 | 9.76 |
| Potassium | 1.17 | 0.423 | 2.15 | 1.90 | 1.35 |
| Magnesium | 0.103 | 0.076 | 0.210 | 0.167 | 0.133 |
| Calcium | 0.511 | 0.153 | 0.533 | 0.532 | 0.425 |
| OC | 9.29 | 3.42 | 15.3 | 22.1 | 12.4 |
| EC | 1.52 | 0.848 | 3.08 | 2.96 | 2.02 |
| Al | 0.749 | 0.117 | 0.505 | 0.510 | 0.468 |
| Na | 0.299 | 0.347 | 0.356 | 0.441 | 0.363 |
| Cl | 0.956 | 0.427 | 1.48 | 3.28 | 1.57 |
| Mg | 0.164 | 0.056 | 0.124 | 0.130 | 0.118 |
| Si | 1.86 | 0.250 | 1.10 | 1.19 | 1.10 |
| S | 4.45 | 4.07 | 6.42 | 5.69 | 5.05 |
| K | 1.76 | 0.507 | 2.20 | 2.29 | 1.65 |
| Ca | 0.420 | 0.075 | 0.298 | 0.344 | 0.284 |
| Sc | 0.008 | 0.004 | 0.007 | 0.009 | 0.007 |
| Ti | 0.066 | 0.012 | 0.043 | 0.044 | 0.041 |
| V | 0.013 | 0.011 | 0.008 | 0.008 | 0.010 |
| Cr | 0.012 | 0.008 | 0.013 | 0.016 | 0.012 |
| Mn | 0.048 | 0.012 | 0.070 | 0.096 | 0.056 |
| Fe | 0.827 | 0.159 | 0.760 | 0.817 | 0.632 |
| Co | 0.007 | 0.003 | 0.007 | 0.008 | 0.006 |
| Ni | 0.008 | 0.005 | 0.007 | 0.006 | 0.006 |
| Cu | 0.020 | 0.007 | 0.020 | 0.028 | 0.019 |
| Zn | 0.268 | 0.081 | 0.342 | 0.409 | 0.271 |
| As | 0.008 | 0.002 | 0.007 | 0.015 | 0.008 |
| Se | 0.008 | 0.004 | 0.011 | 0.015 | 0.010 |
| Br | 0.022 | 0.012 | 0.047 | 0.117 | 0.051 |
| Sr | 0.016 | 0.009 | 0.014 | 0.011 | 0.012 |
| Cd | 0.009 | 0.012 | 0.003 | 0.000 | 0.006 |
| Ba | 0.039 | 0.034 | 0.082 | 0.062 | 0.052 |
| Pb | 0.109 | 0.029 | 0.185 | 0.204 | 0.128 |
Table 2.
Chloride depletion and enrichment in aerosols in Qingdao.
| Item | Spring | Summer | Autumn | Winter | Average |
|---|---|---|---|---|---|
| Clexcess/Clreference | 0.69 | −0.29 | 0.53 | 2.24 | 0.85 |
© 2017 by the authors. Licensee MDPI, Basel, Switzerland. This article is an open access article distributed under the terms and conditions of the Creative Commons Attribution (CC BY) license (http://creativecommons.org/licenses/by/4.0/).
Share and Cite
MDPI and ACS Style
Wu, R.; Zhou, X.; Wang, L.; Wang, Z.; Zhou, Y.; Zhang, J.; Wang, W. PM2.5 Characteristics in Qingdao and across Coastal Cities in China. Atmosphere 2017, 8, 77. https://doi.org/10.3390/atmos8040077
AMA Style
Wu R, Zhou X, Wang L, Wang Z, Zhou Y, Zhang J, Wang W. PM2.5 Characteristics in Qingdao and across Coastal Cities in China. Atmosphere. 2017; 8(4):77. https://doi.org/10.3390/atmos8040077
Chicago/Turabian StyleWu, Ruidong, Xuehua Zhou, Linpeng Wang, Zhe Wang, Yang Zhou, Jingzhu Zhang, and Wenxing Wang. 2017. "PM2.5 Characteristics in Qingdao and across Coastal Cities in China" Atmosphere 8, no. 4: 77. https://doi.org/10.3390/atmos8040077
Note that from the first issue of 2016, this journal uses article numbers instead of page numbers. See further details here.