
Recent Trends of Extreme Precipitation and Their Teleconnection with Atmospheric Circulation in the Beijing-Tianjin Sand Source Region, China, 1960–2014

 ,
,
Abstract
:1. Introduction
2. Data and Methods
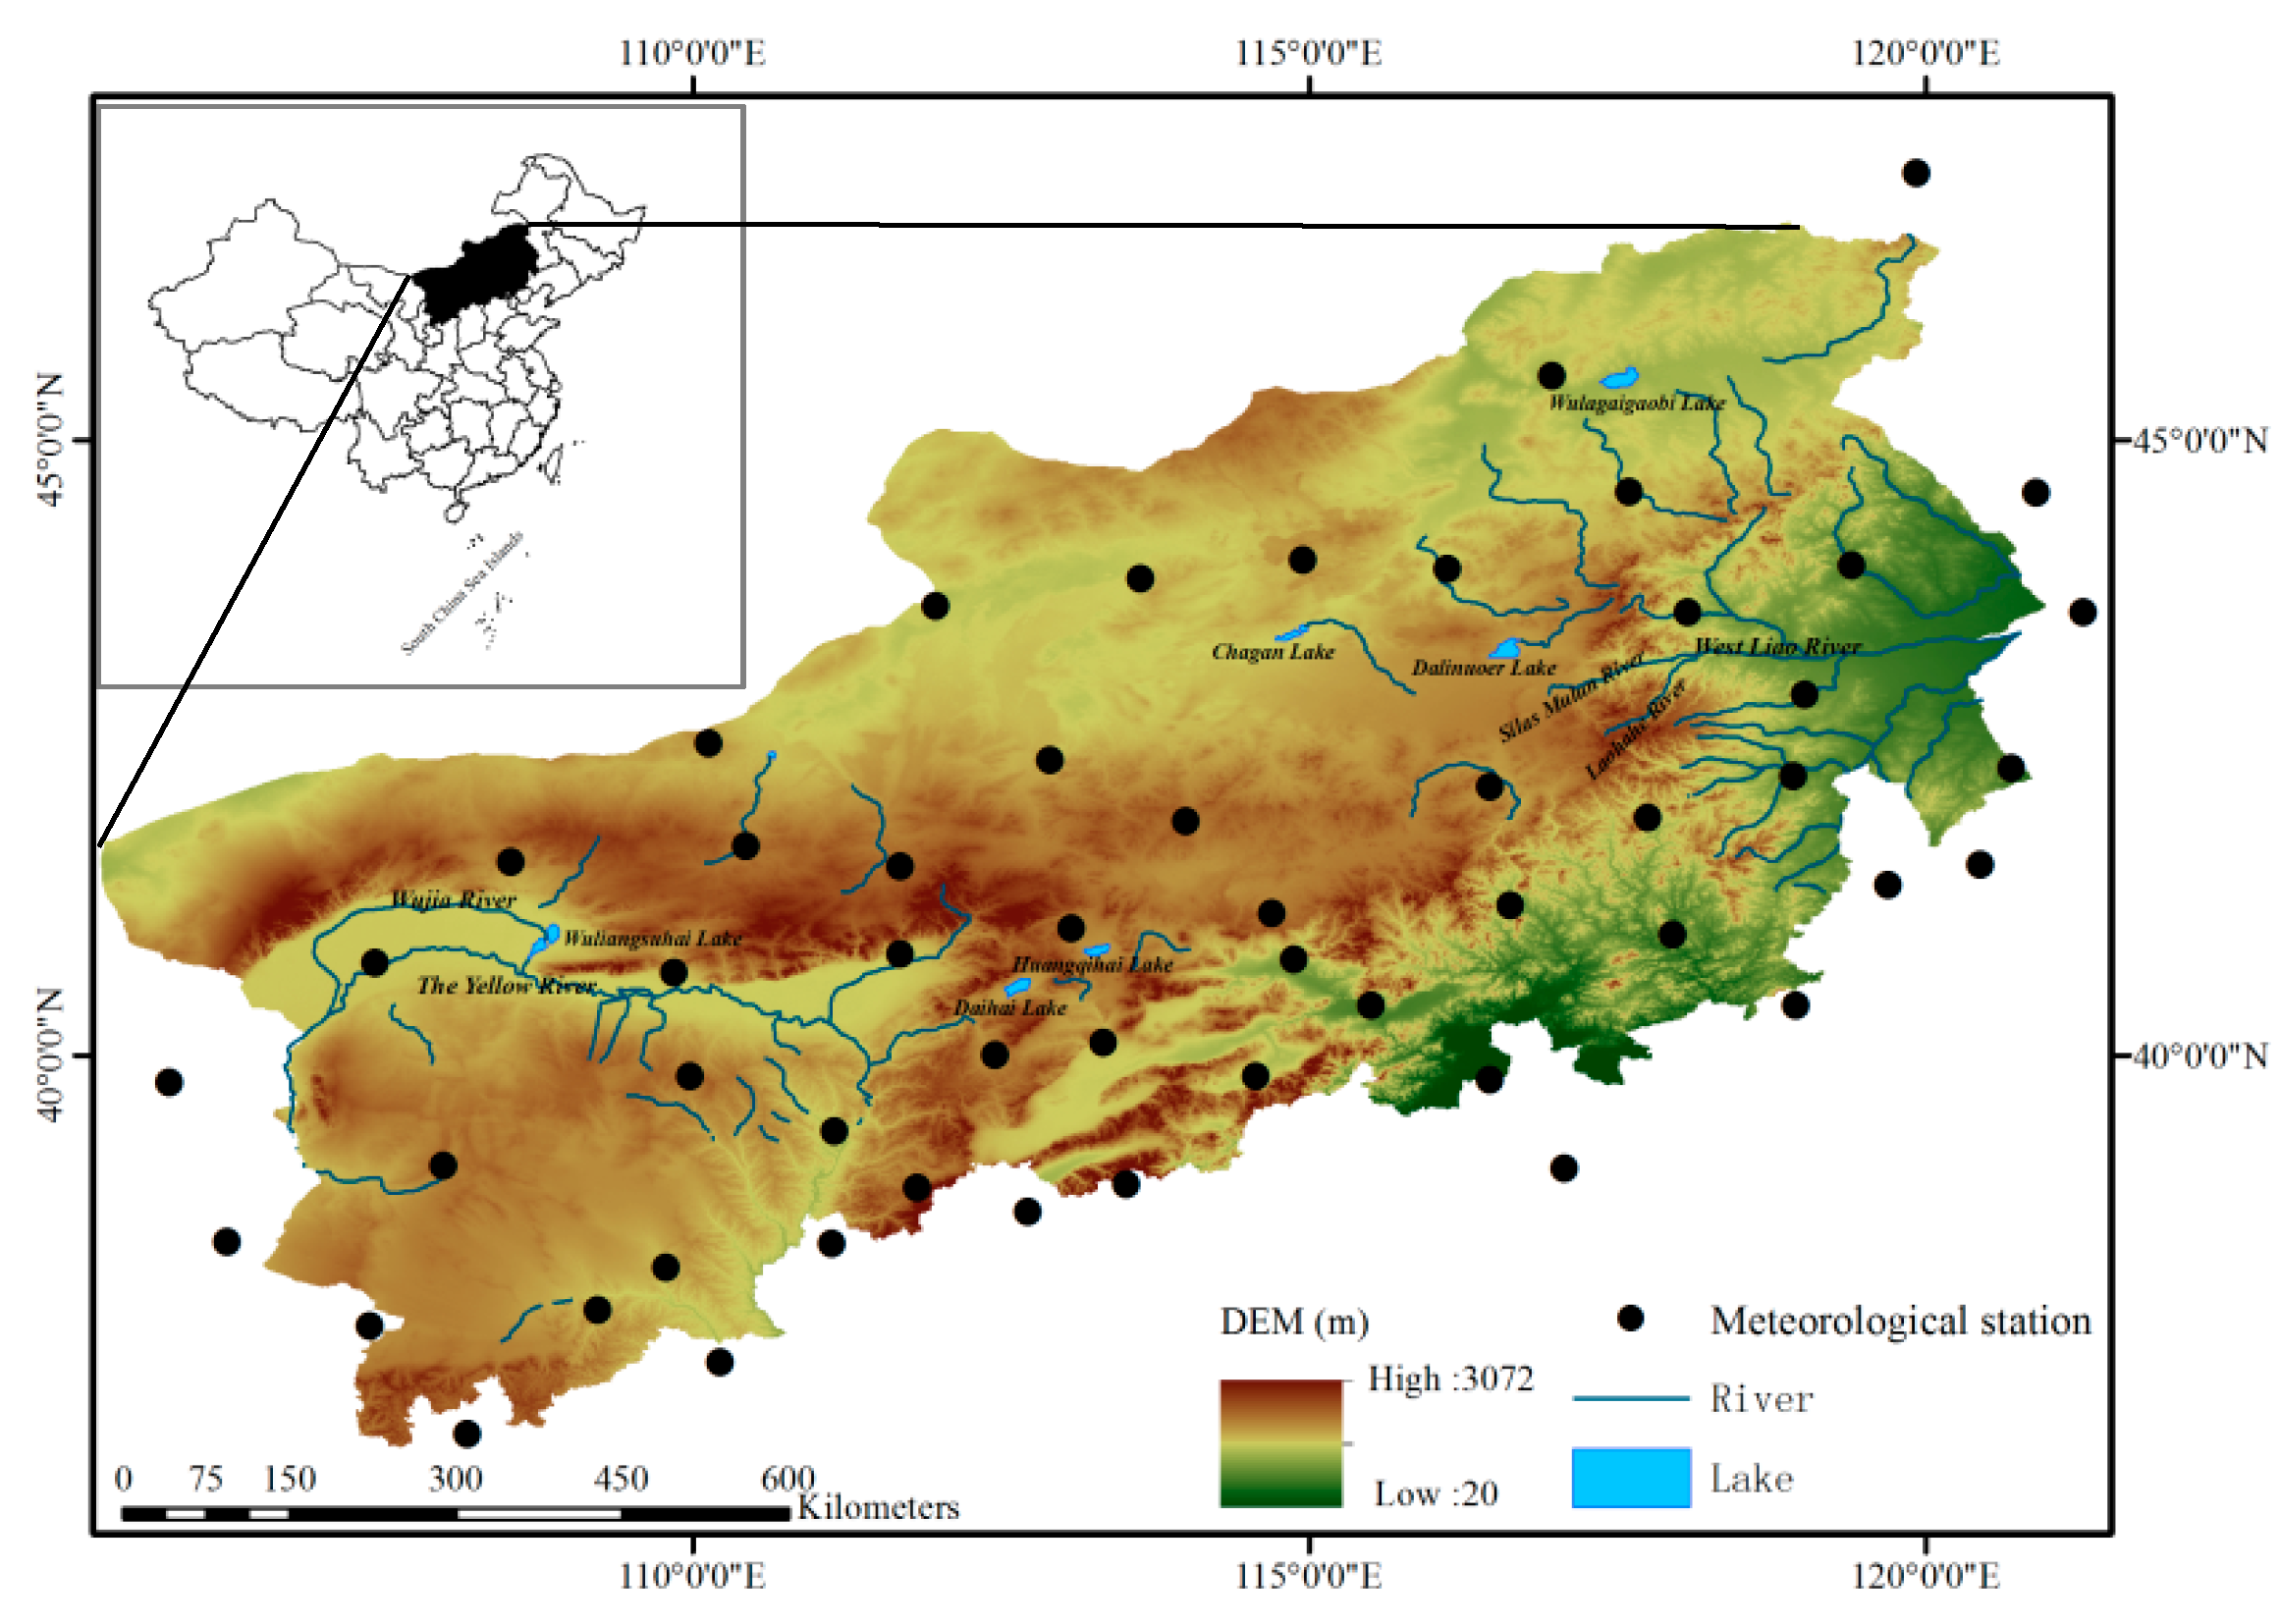
2.1. Study Area
2.2. Data and Process
2.2.1. Data Source
2.2.2. Quality Control and Homogeneity Test
2.2.3. Indices Calculation
2.3. Interpolation and Trend Analysis of Indices
2.4. Relationship Between Extreme Precipitation and Atmospheric Circulations
3. Results
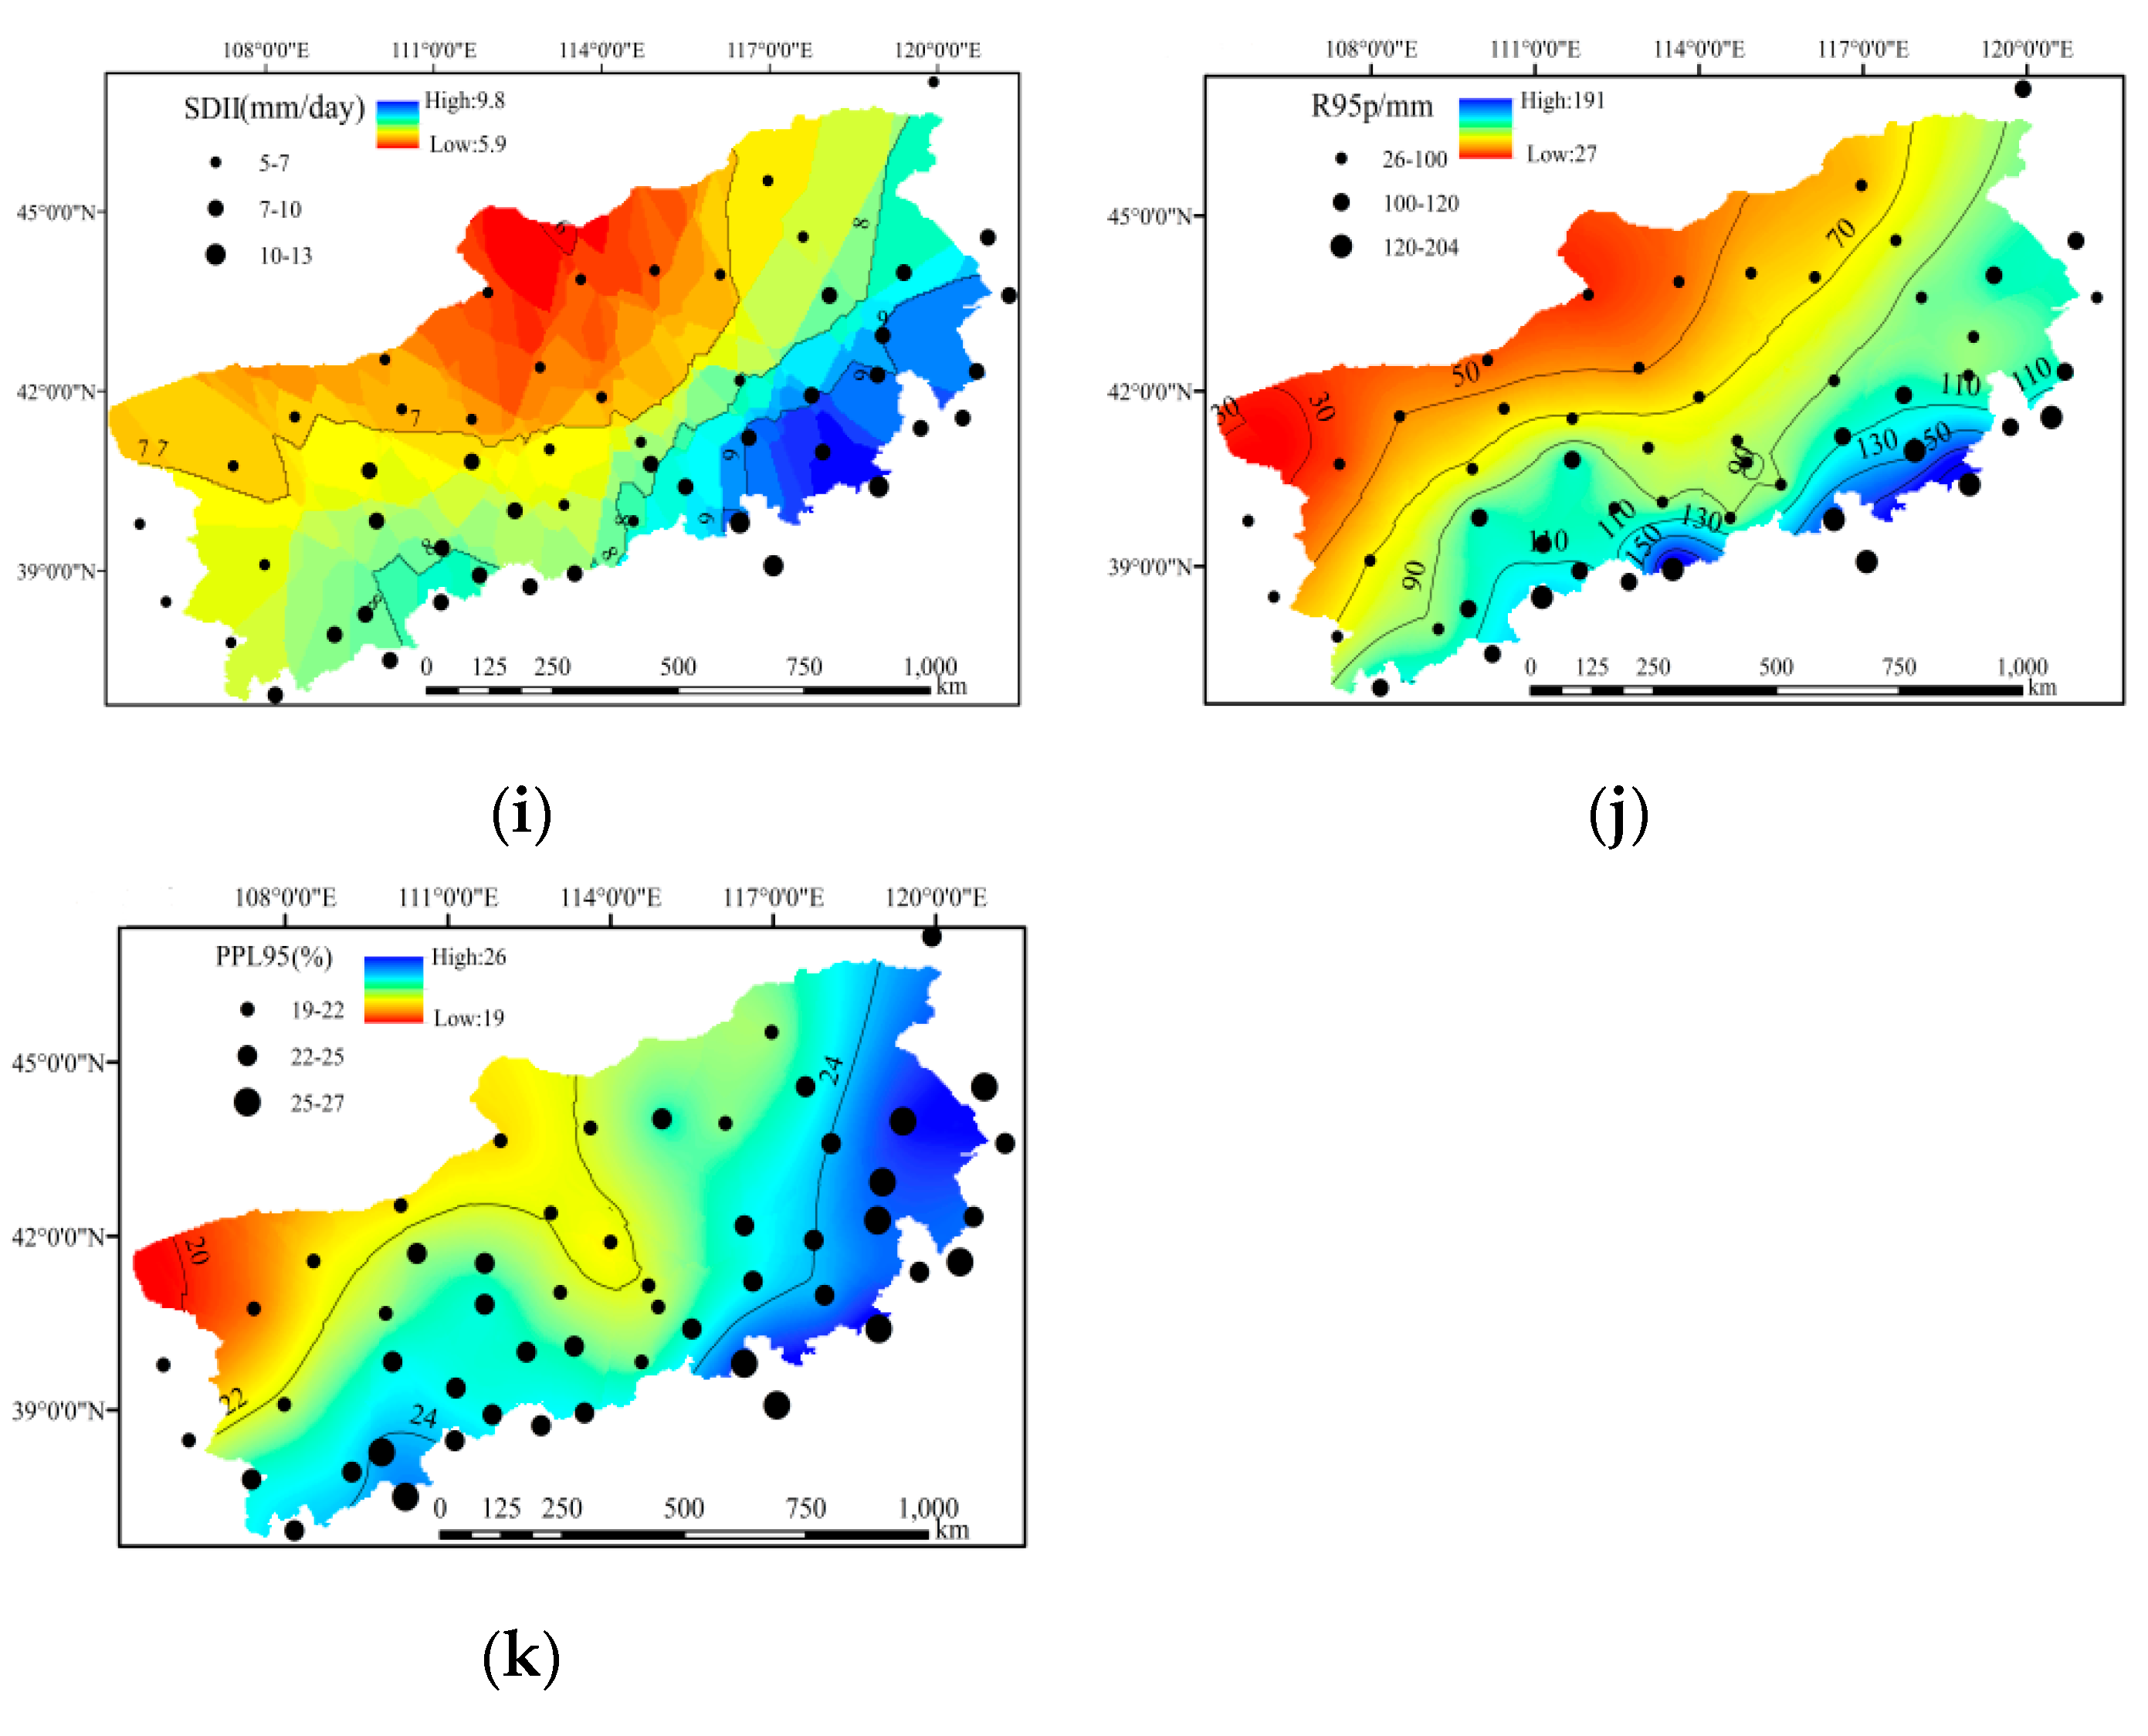
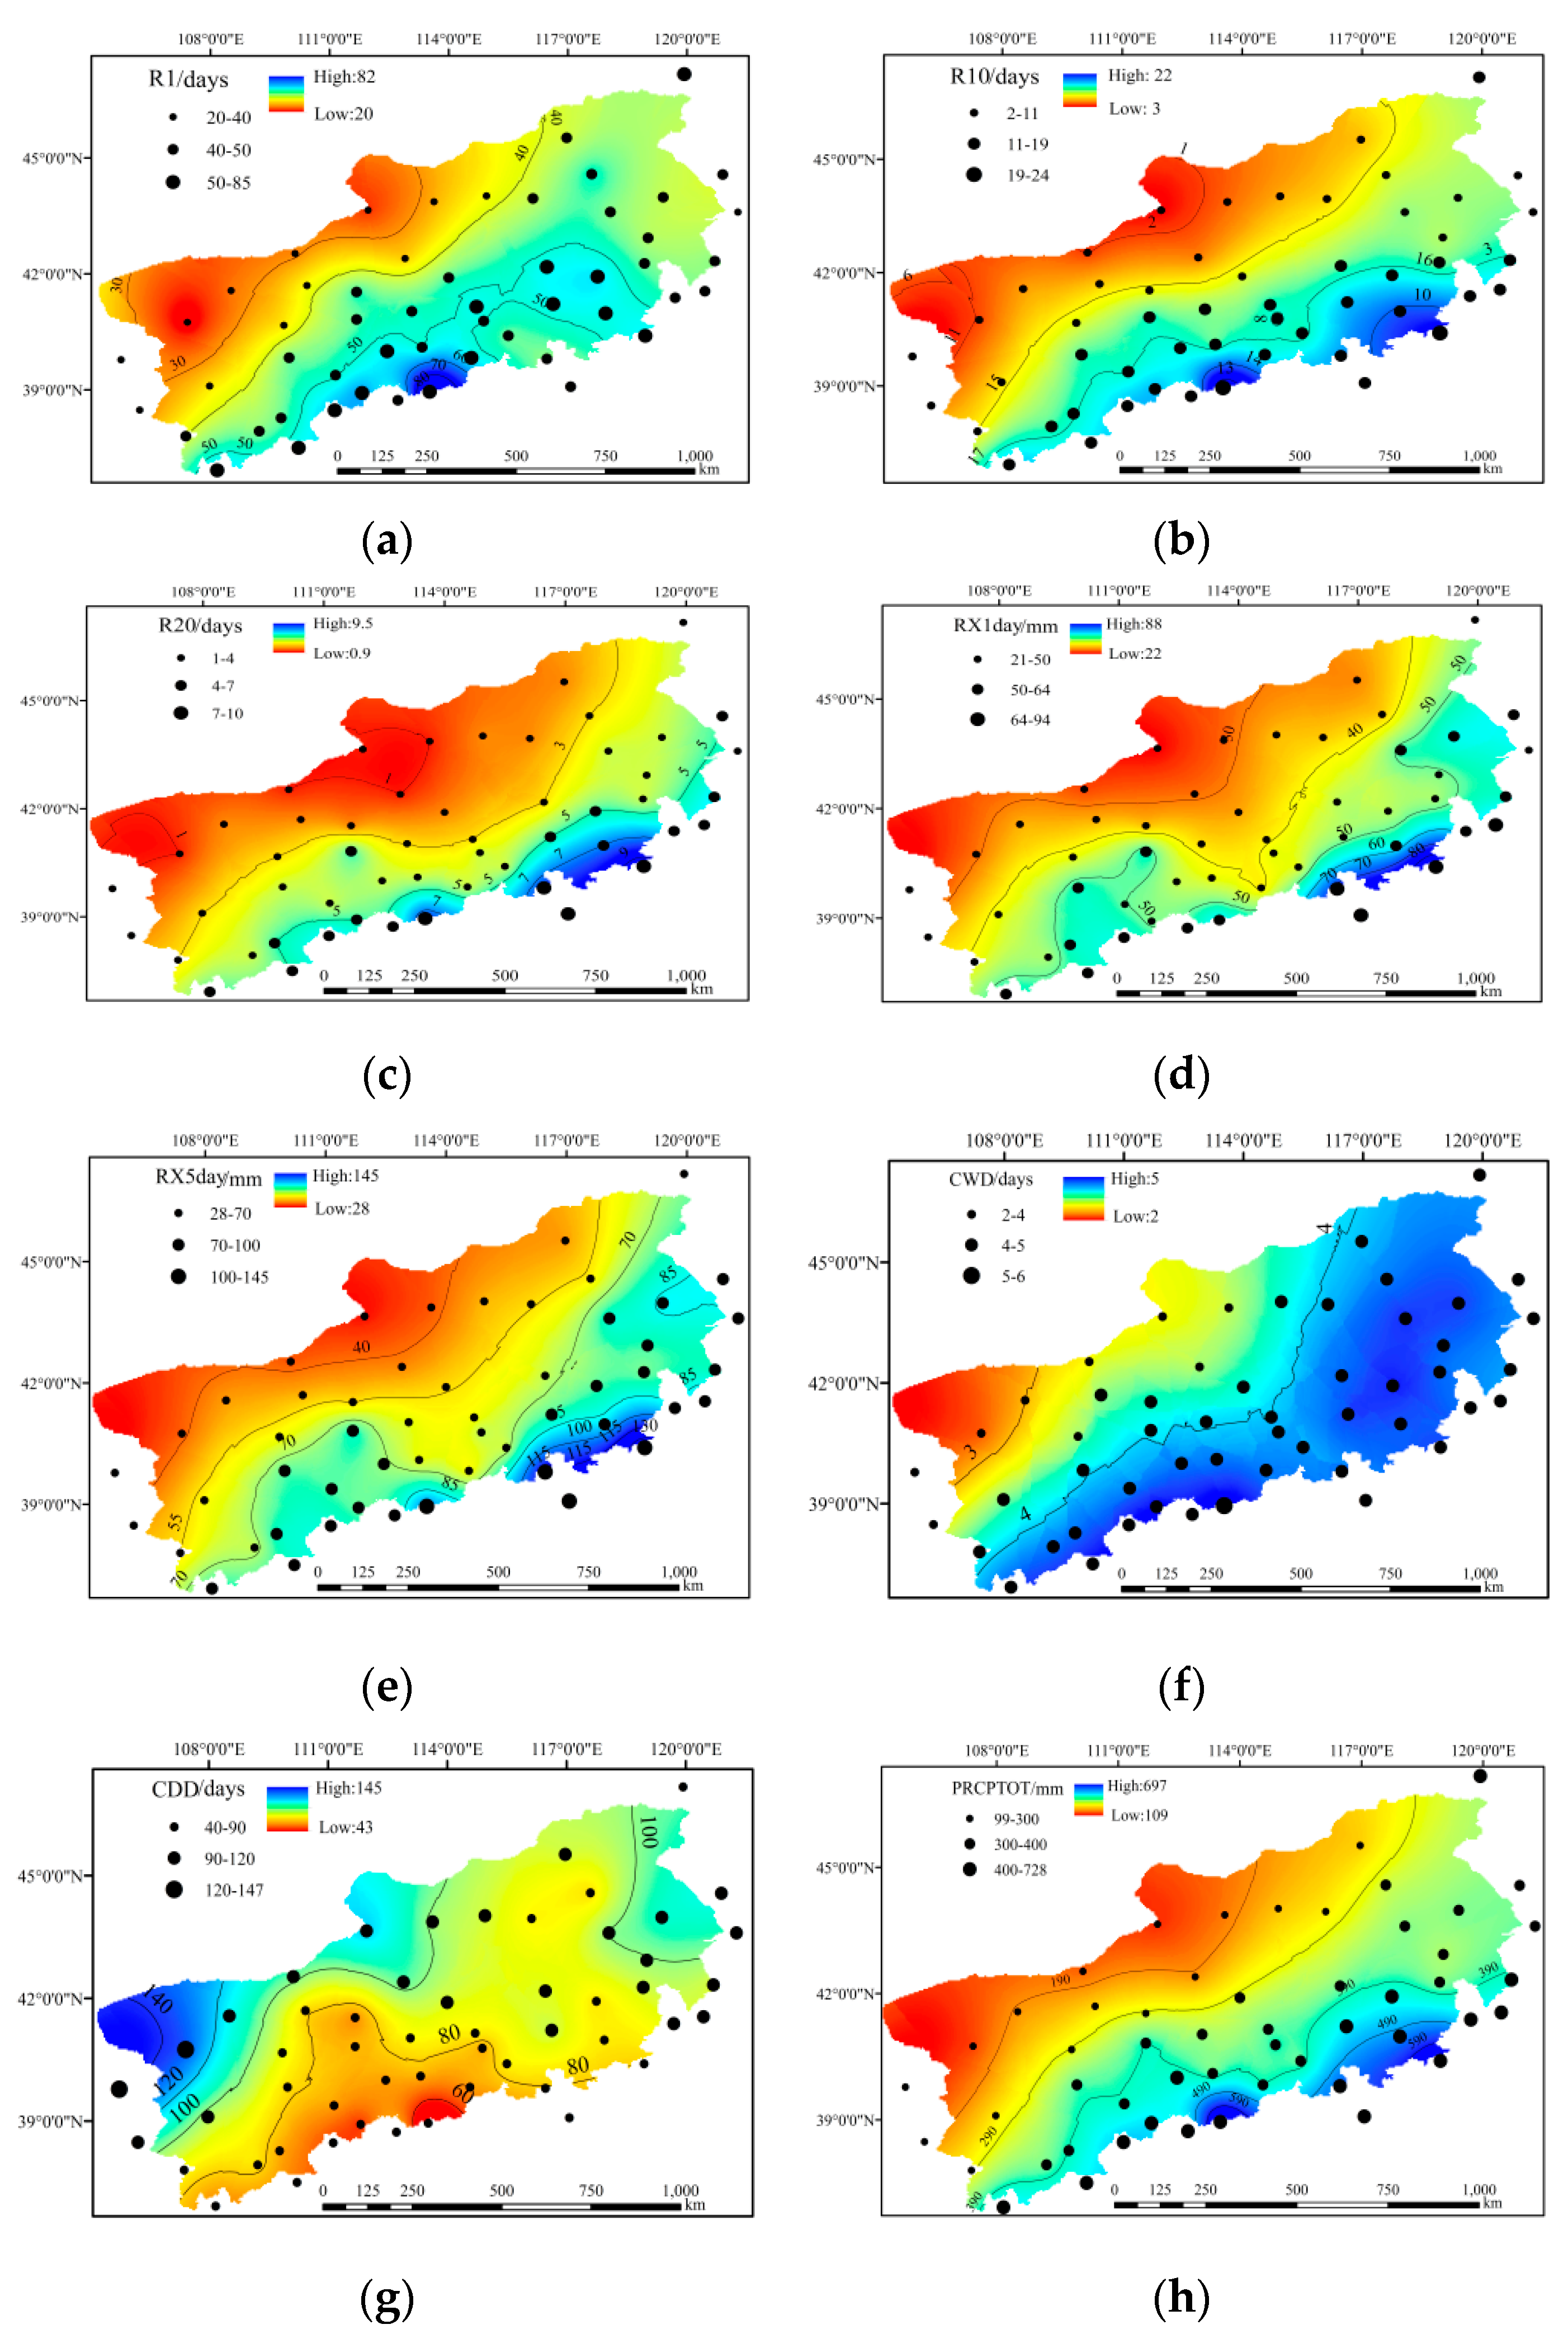
3.1. Spatial Distribution of Precipitation Extremes
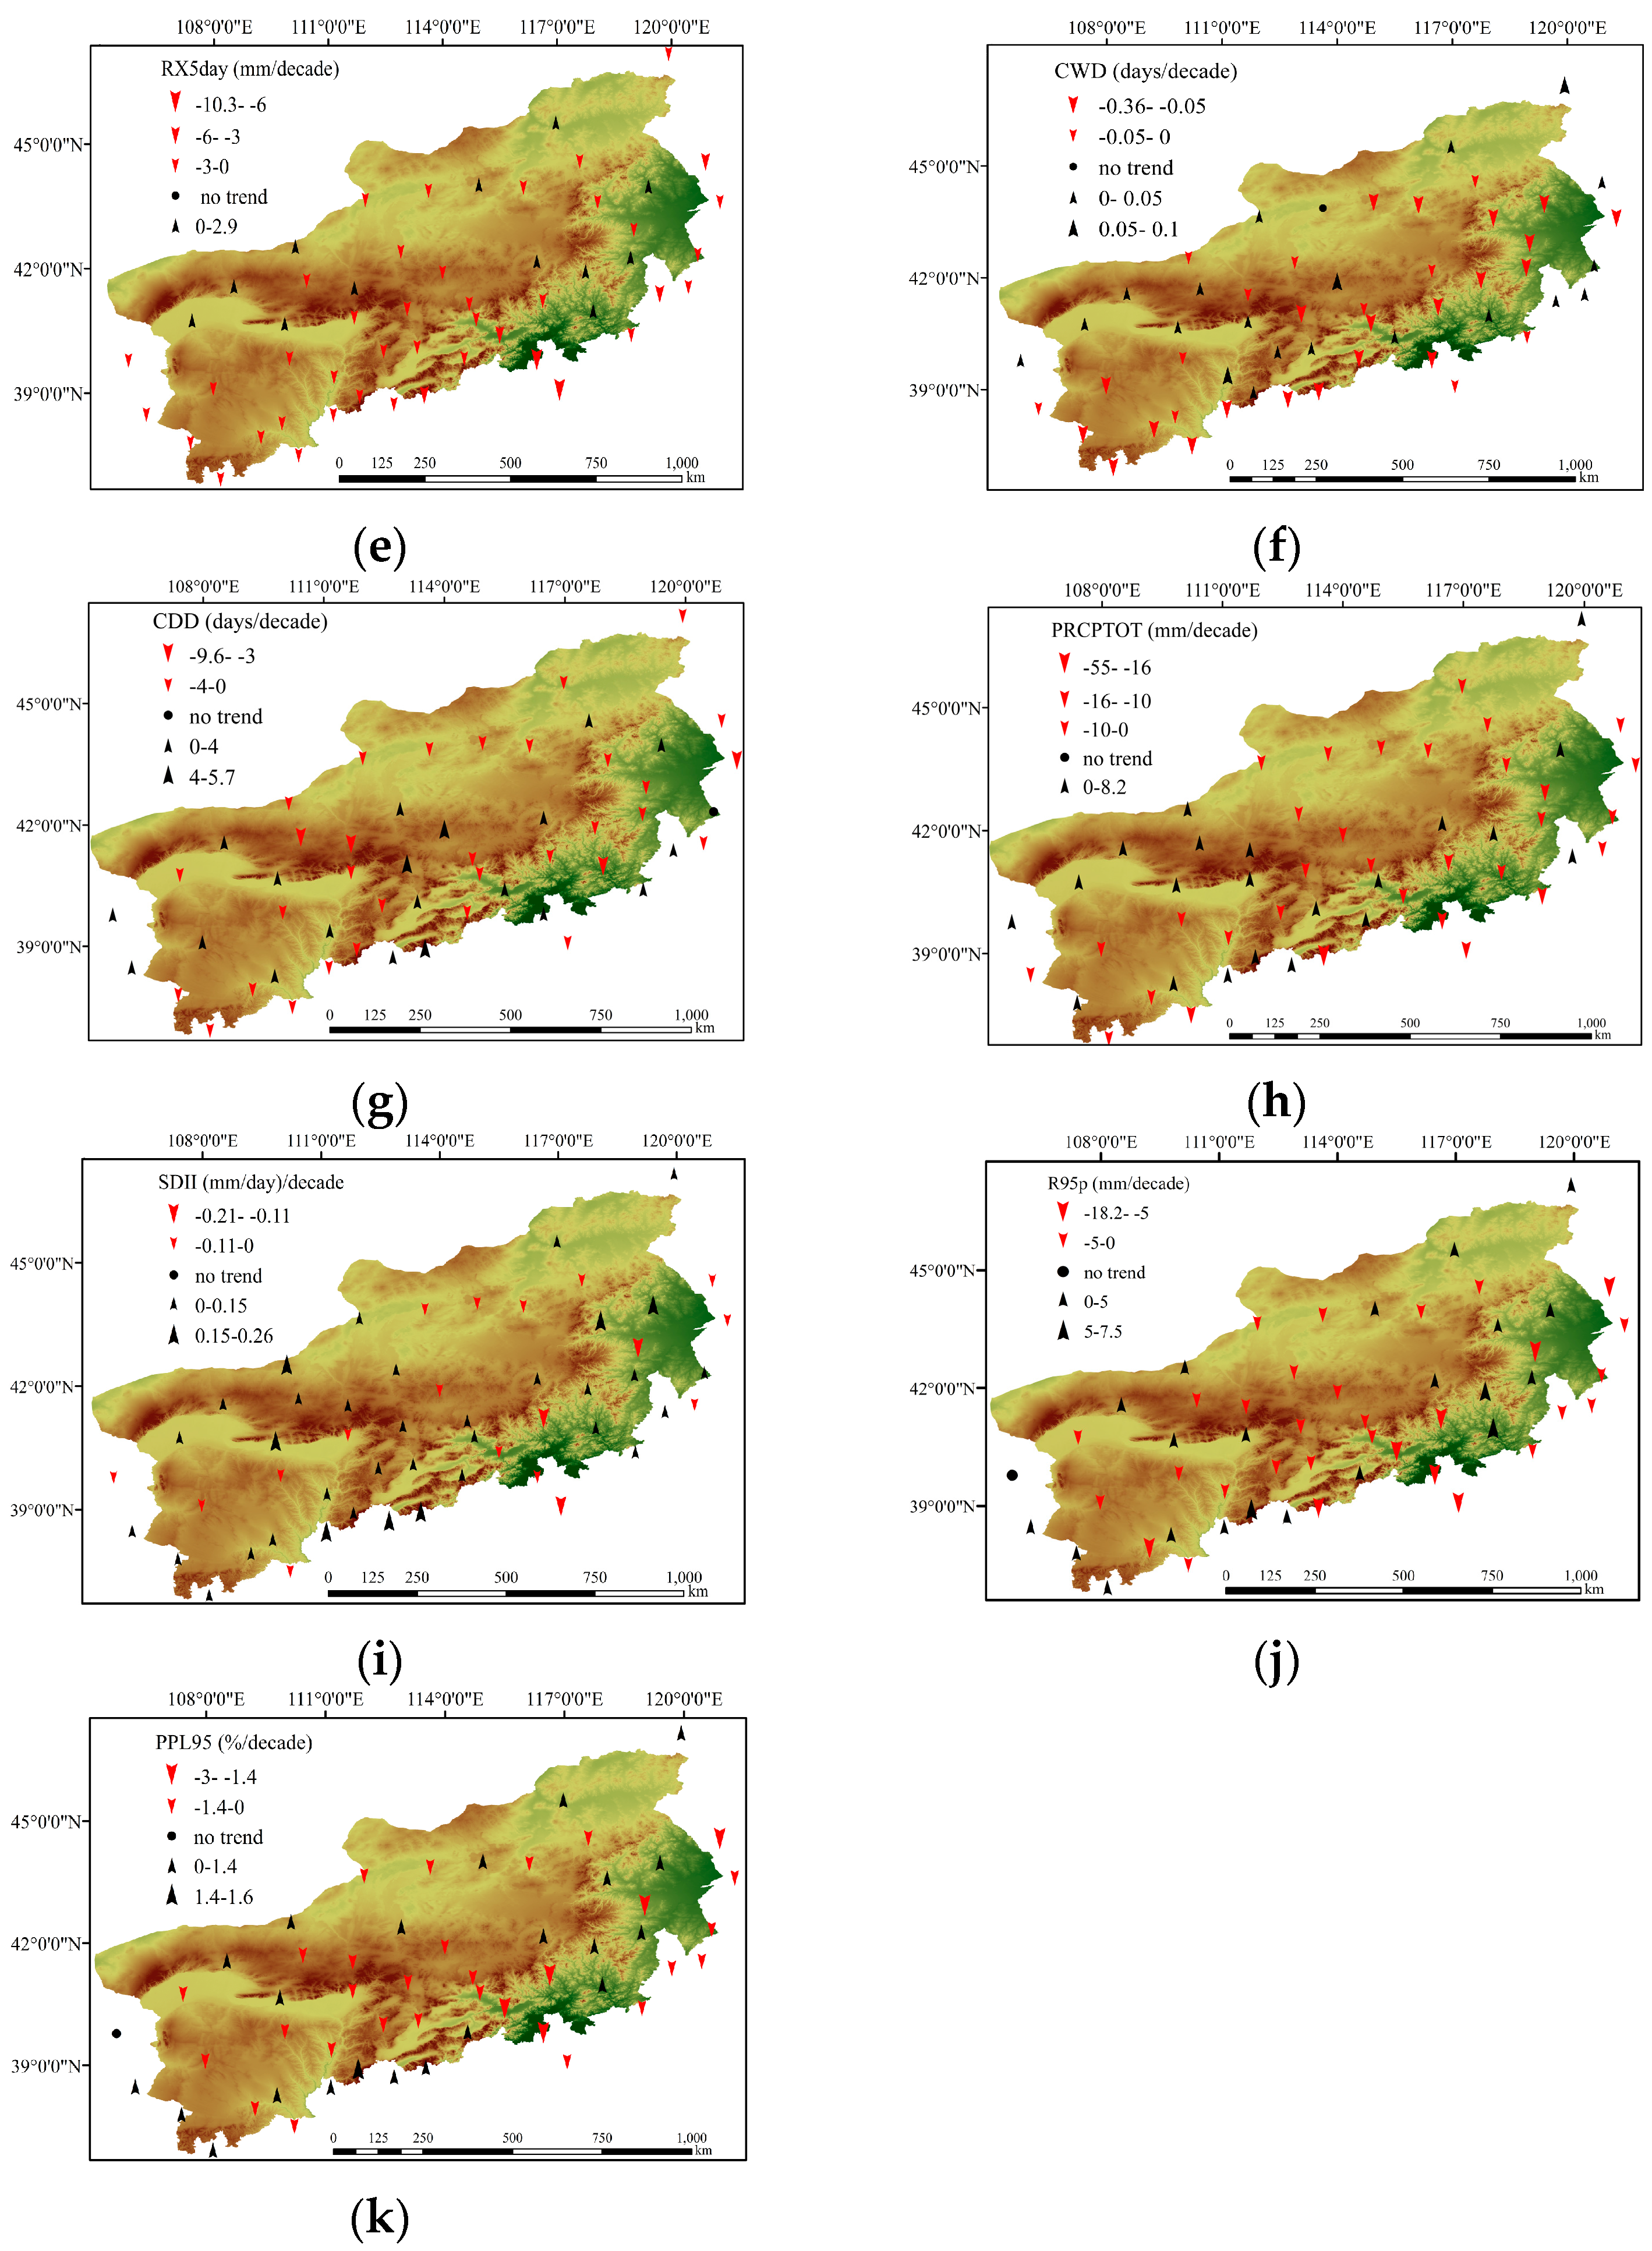
3.2. Spatiotemporal Trends of Precipitation Extremes
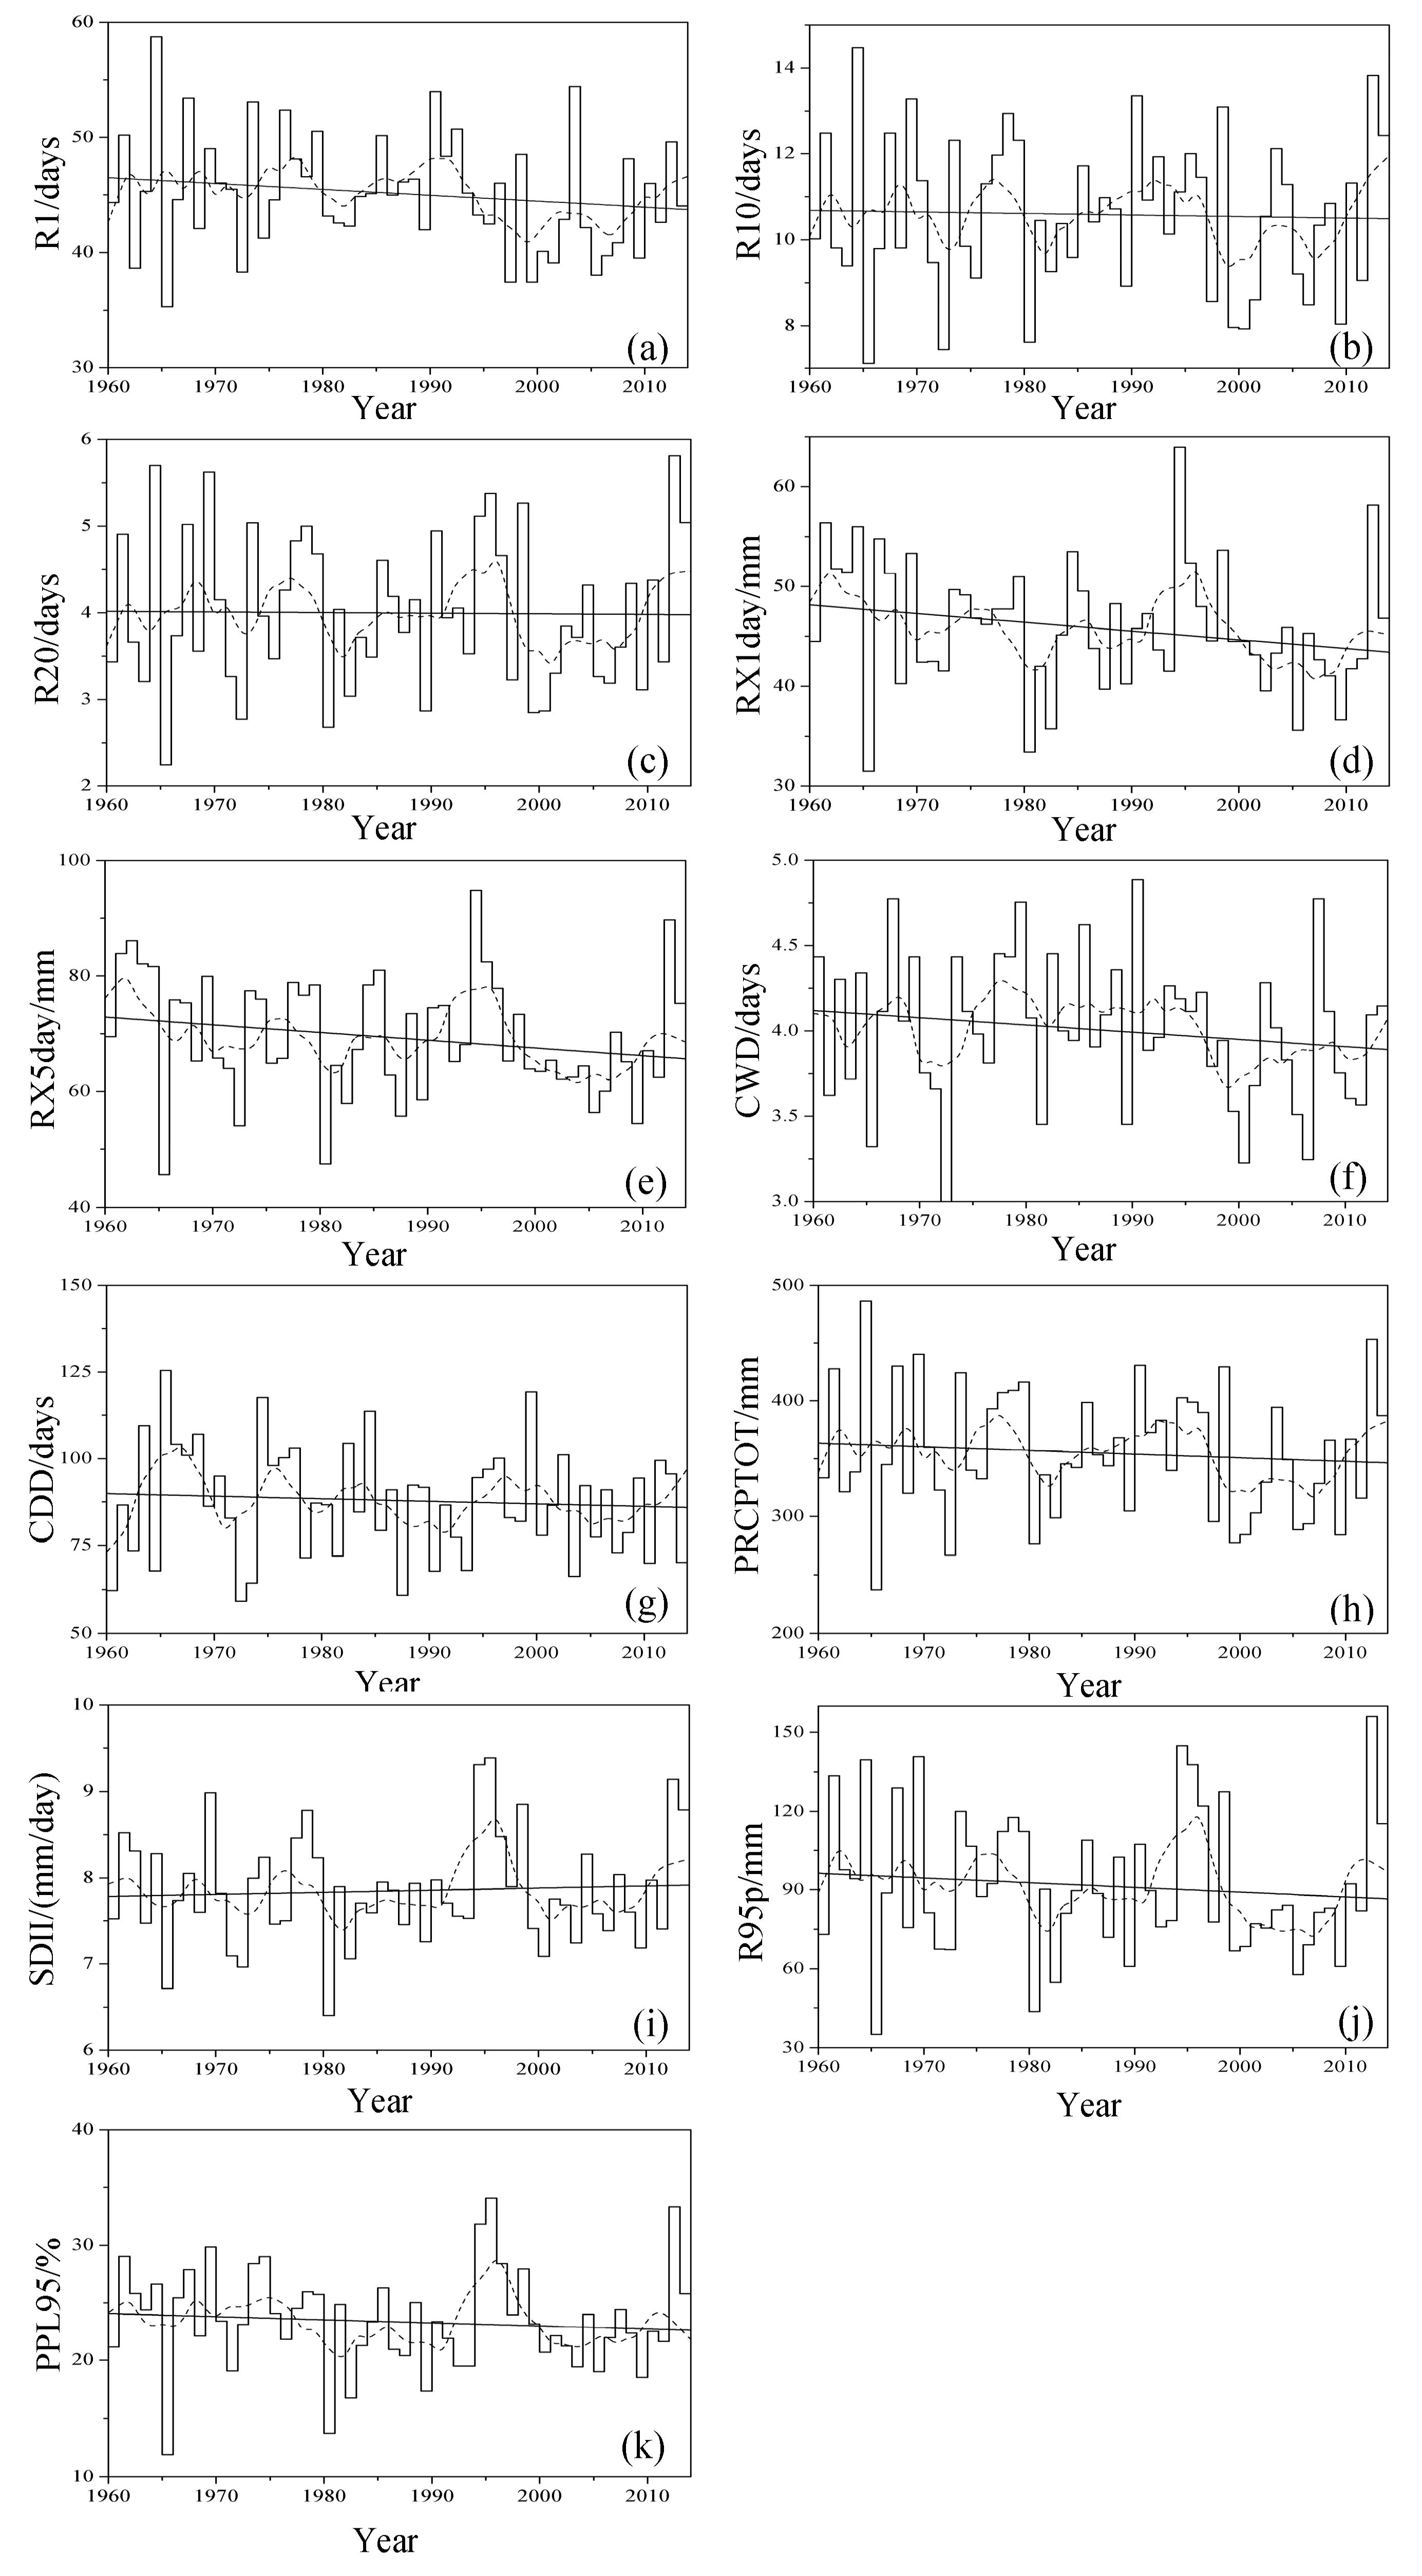
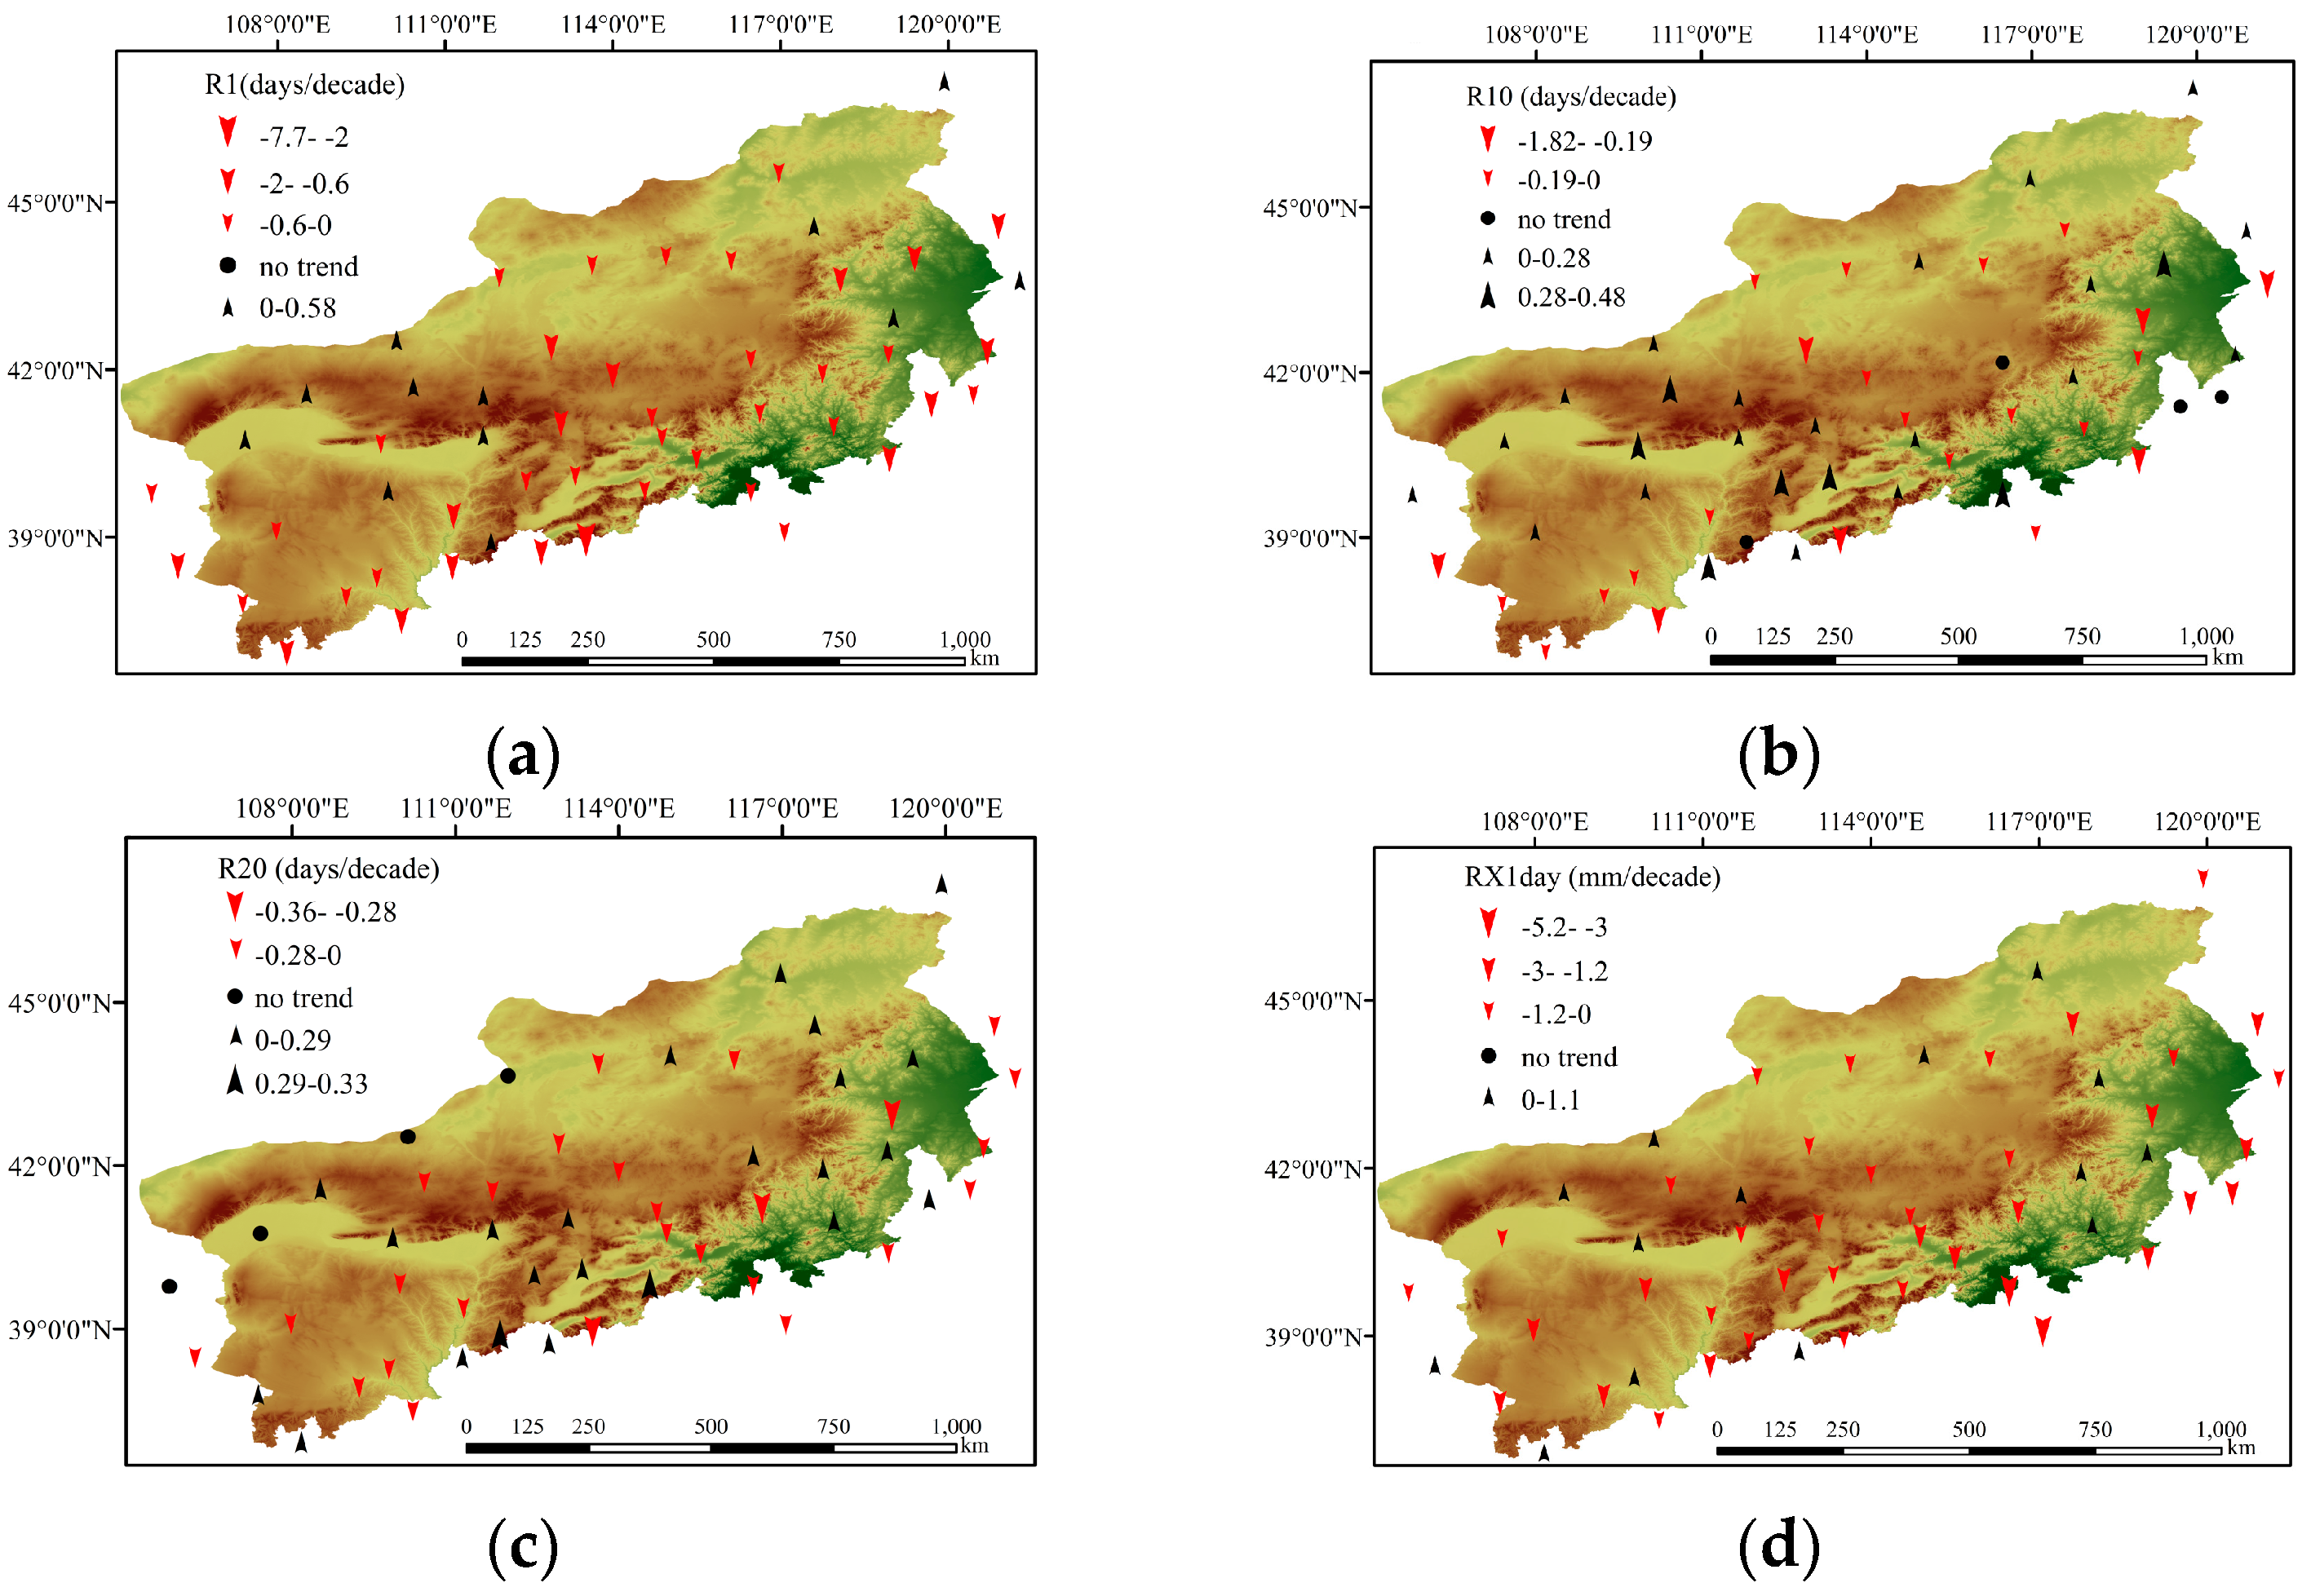
3.2.1. Frequency Indices
3.2.2. Intensity Indices
3.2.3. Duration Indices
3.2.4. Other Indices
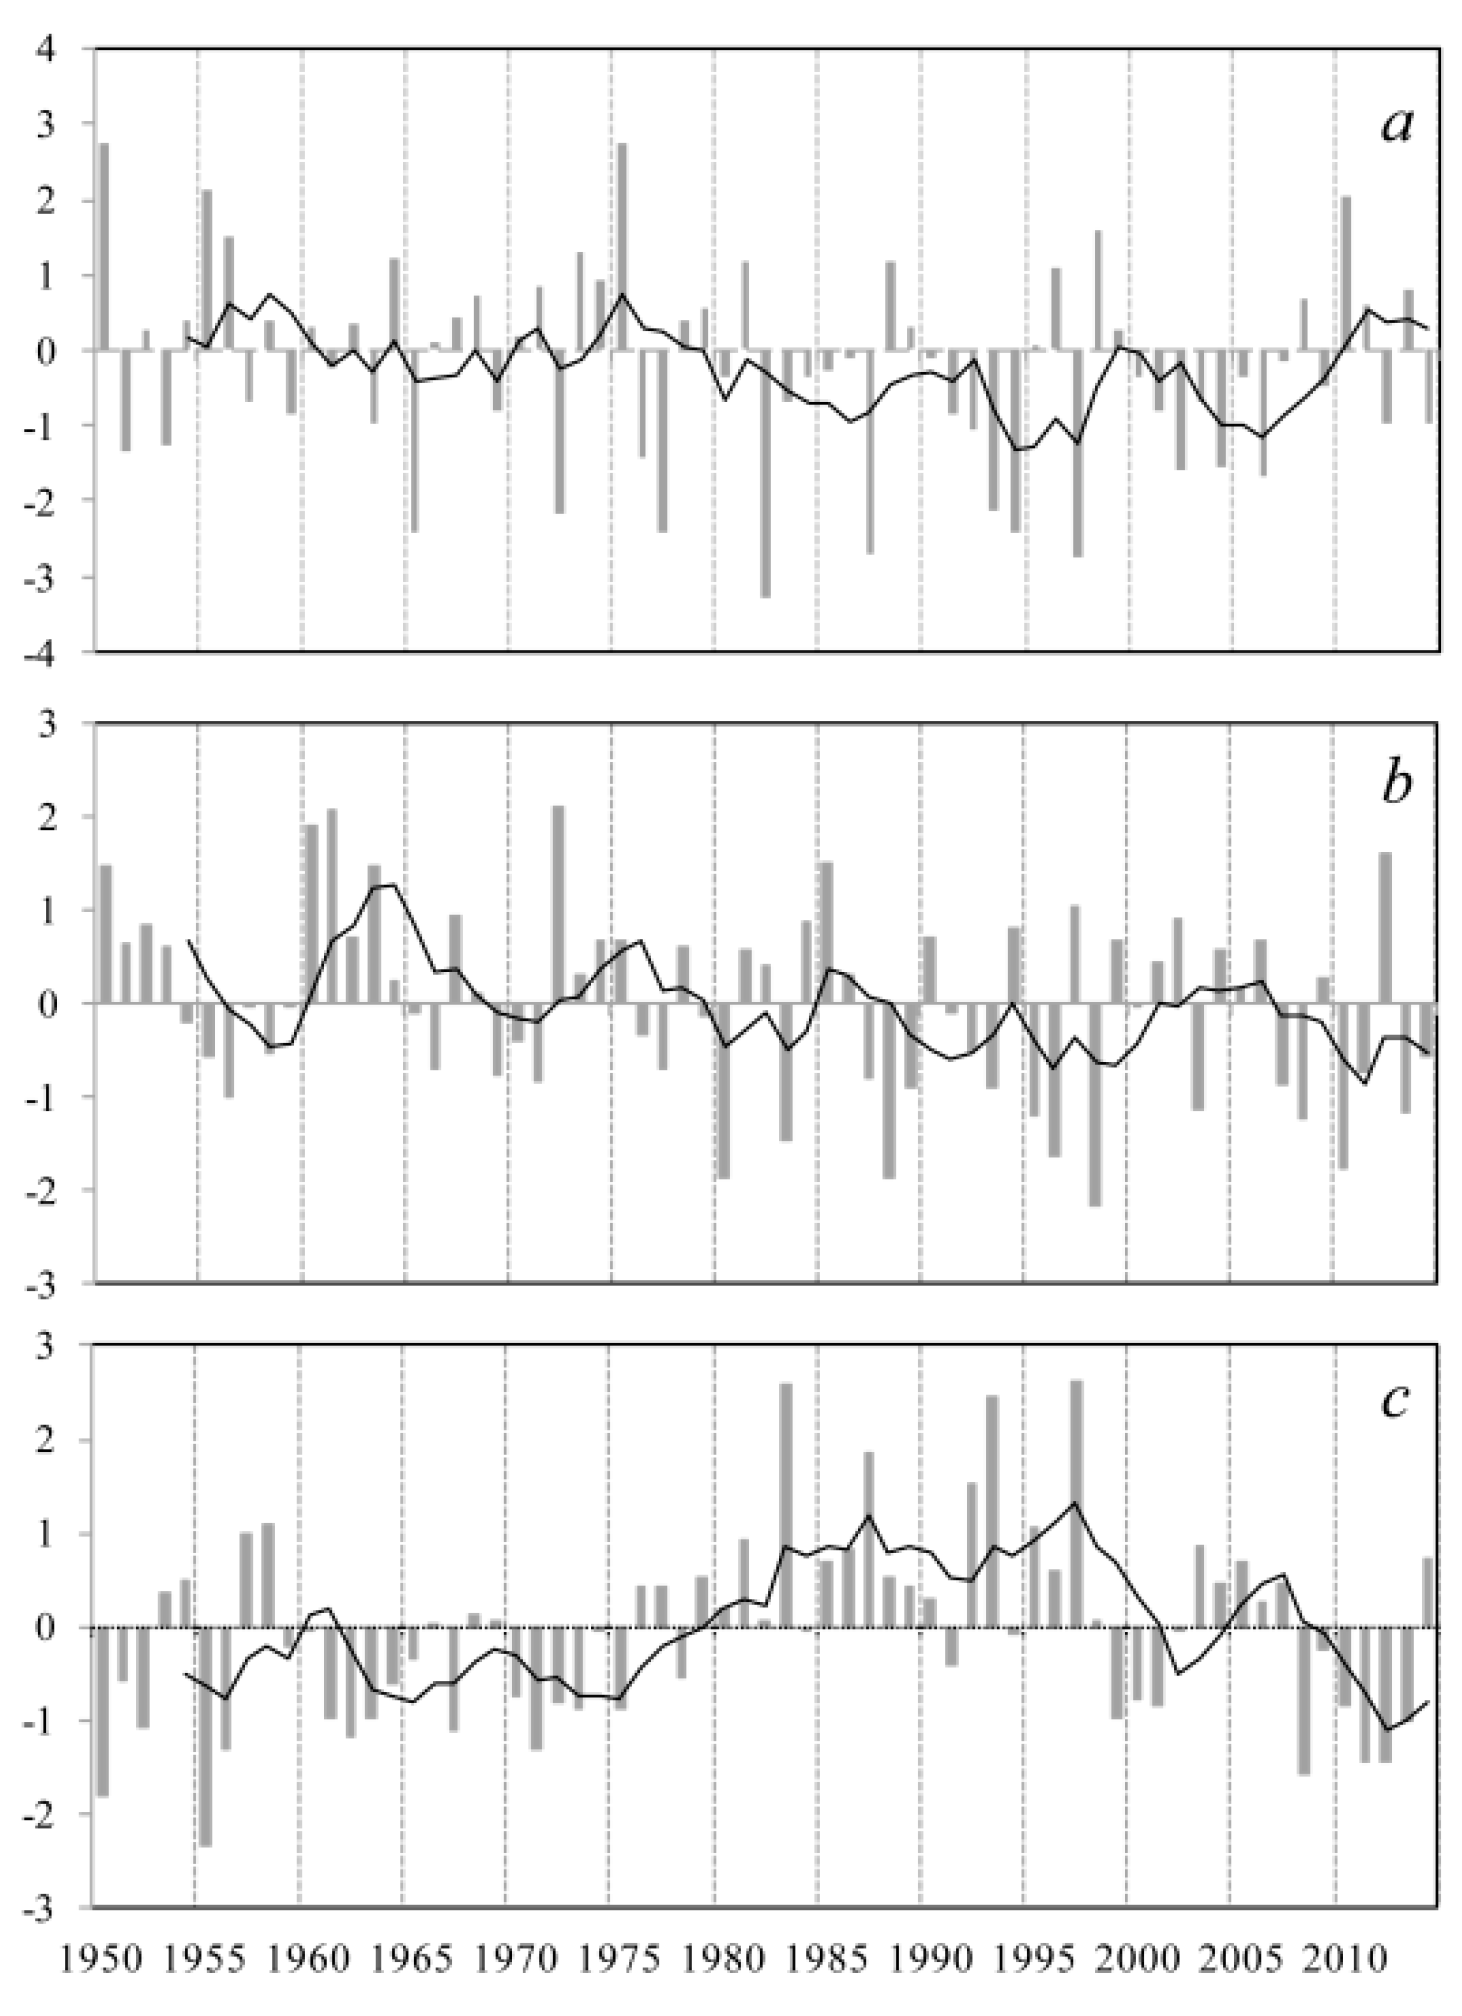
3.3. Teleconnections with Large-Scale Climate Variables
4. Discussion
4.1. Extreme Precipitation Trends
4.2. Possible Mechanism of Extreme Precipitation Changes
4.3. Potential Impacts on Environmental Change
5. Conclusions
Acknowledgments
Author Contributions
Conflicts of Interest
References
- IPCC Climate Change. The Physical Science Basis. In Contribution of Working Group I to the Fifth Assessment Report of the Intergovernmental Panel on Climate Change; Cambridge University Press: Cambridge, UK, 2013. [Google Scholar]
- Alexander, L.V.; Zhang, X.; Peterson, T.C.; Caesar, J.; Gleason, B.; Klein Tank, A.M.G.; Haylock, M.; Collins, D.; Trewin, B.; Rahimzadeh, F.; et al. Global observed changes in daily climate extremes of temperature and precipitation. J. Geophys. Res. 2006, 111, D05109. [Google Scholar]
- IPCC Climate Change. The Physical Science Basis. In Contribution of Working Group I to the Fourth Assessment Report of the Intergovernmental Panel on Climate Change; Cambridge University Press: Cambridge, UK, 2007. [Google Scholar]
- Parmesan, C.; Root, T.L.; Willig, M.R. Impacts of extreme weather and climate on terrestrial biota. Bull. Am. Meteorol. Soc. 2000, 81, 443–450. [Google Scholar] [CrossRef]
- Peterson, T.C.; Manton, M.J. Monitoring changes in climate extremes: A tale of international collaboration. Bull. Am. Meteorol. Soc. 2008, 89, 1266–1271. [Google Scholar] [CrossRef]
- Tierney, J.E.; Smerdon, J.E.; Anchukaitis, K.J.; Seager, R. Multidecadal variability in East African hydroclimate controlled by the Indian Ocean. Nature 2013, 493, 389–392. [Google Scholar] [CrossRef] [PubMed]
- Lupikasza, E. Spatial and temporal variability of extreme precipitation in Poland in the period 1951–2006. Int. J. Climatol. 2010, 30, 991–1007. [Google Scholar] [CrossRef]
- Donat, M.G.; Peterson, T.C.; Brunet, M.; King, A.D.; Almazroui, M.; Kolli, R.K.; Boucherf, D.; Al-Mulla, A.Y.; Nour, A.Y.; Aly, A.A.; et al. Changes in extreme temperature and precipitation in the Arab region: Long-term trends and variability related to ENSO and NAO. Int. J. Climatol. 2014, 34, 581–592. [Google Scholar] [CrossRef]
- Klein Tank, A.M.G.; Peterson, T.C.; Quadir, D.A.; Dorji, S.; Zou, X.; Tang, H.; Santhosh, K.; Joshi, U.R.; Jaswal, A.K.; Kolli, R.K.; et al. Changes in daily temperature and precipitation extremes in central and south Asia. J. Geophys. Res. 2006, 111, D16105. [Google Scholar] [CrossRef]
- You, Q.L.; Kang, S.C.; Aguilar, E.; Yan, Y.P. Changes in daily climate extremes in the eastern and central Tibetan Plateau during 1961–2005. J. Geophys. Res. 2008, 113, D7. [Google Scholar] [CrossRef]
- Guo, P.W.; Zhang, X.K.; Zhang, S.Y.; Wang, C.L.; Zhang, X. Decadal variability of extreme precipitation days over Northwest China from 1963 to 2012. J. Meteorol. Res. 2014, 28, 1099–1113. [Google Scholar] [CrossRef]
- Wang, H.J.; Chen, Y.N.; Chen, Z.S. Spatial distribution and temporal trends of mean precipitation and extremes in the arid region, northwest of China, during 1960–2010. Hydrol. Process. 2013, 27, 1807–1818. [Google Scholar] [CrossRef]
- Fu, G.B.; Yu, J.J.; Yu, X.B.; Ouyang, R.L.; Zhang, Y.C.; Wang, P.; Liu, W.B.; Min, L.L. Temporal variation of extreme rainfall events in China, 1961–2009. J. Hydrol. 2013, 487, 48–59. [Google Scholar] [CrossRef]
- Xu, X.; Du, Y.G.; Tang, J.P.; Wang, Y. Variations of temperature and precipitation extremes in recent two decades over China. Atmos. Res. 2011, 101, 143–154. [Google Scholar] [CrossRef]
- Zhang, H.; Zhai, P.M. Temporal and spatial characteristics of extreme hourly precipitation over eastern China in the warm season. Adv. Atmos. Sci. 2011, 28, 1177–1183. [Google Scholar] [CrossRef]
- Zhang, K.X.; Pan, S.M.; Cao, L.G.; Wang, Y.; Zhao, Y.F.; Zhang, W. Spatial distribution and temporal trends in precipitation extremes over the Hengduan Mountains region, China, from 1961 to 2012. Quat. Int. 2014, 349, 346–356. [Google Scholar] [CrossRef]
- Li, Y.G.; He, D.M.; Hu, J.M.; Cao, J. Variability of extreme precipitation over Yunnan Province, China 1960–2012. Int. J. Climatol. 2015, 35, 245–258. [Google Scholar] [CrossRef]
- Lupikasza, E.B.; Hansel, S.; Matschullat, J. Regional and seasonal variability of extreme precipitation trends in southern Poland and central-eastern Germany 1951–2006. Int. J. Climatol. 2011, 31, 2249–2271. [Google Scholar] [CrossRef]
- Jung, I.W.; Bae, D.H.; Kim, G. Recent trends of mean and extreme precipitation in Korea. Int. J. Climatol. 2011, 31, 359–370. [Google Scholar] [CrossRef]
- Vincent, L.A.; Aguilar, E.; Saindou, M.; Hassane, A.F.; Jumaux, G.; Roy, D.; Booneeady, P.; Virasami, R.; Randriamarolaza, L.Y.A.; Faniriantsoa, F.R. Observed trends in indices of daily and extreme temperature and precipitation for the countries of the western Indian Ocean, 1961–2008. J. Geophys. Res. 2011, 116, D10108. [Google Scholar] [CrossRef]
- Maeda, E.E.; Utsumi, N.; Oki, T. Decreasing precipitation extremes at higher temperatures in tropical regions. Nat. Hazards 2012, 64, 935–941. [Google Scholar] [CrossRef]
- Hussain, M.S.; Lee, S. The regional and the seasonal variability of extreme precipitation trends in Pakistan. Asia-Pac. J. Atmos. Sci. 2013, 49, 421–441. [Google Scholar] [CrossRef]
- AlSarmi, S.H.; Washington, R. Changes in climate extremes in the Arabian Peninsula: Analysis of daily data. Int. J. Climatol. 2014, 34, 1329–1345. [Google Scholar] [CrossRef]
- Zhang, X.Y.; Cong, Z.T. Trends of precipitation intensity and frequency in hydrological regions of China from 1956 to 2005. Glob. Planet. Chang. 2014, 117, 40–51. [Google Scholar] [CrossRef]
- Shao, Y.H.; Wu, J.M.; Ye, J.Y.; Liu, Y.H. Frequency analysis and its spatiotemporal characteristics of precipitation extreme events in China during 1951–2010. Theor. Appl. Climatol. 2015, 121, 775–787. [Google Scholar] [CrossRef]
- Wu, J.J.; Zhao, L.; Zheng, Y.T.; Lu, A.F. Regional differences in the relationship between climatic factors, vegetation, land surface conditions, and dust weather in China’s Beijing-Tianjin Sand Source Region. Nat. Hazards 2012, 62, 31–44. [Google Scholar] [CrossRef]
- Yin, R.S.; Yin, G.P. China’s primary programs of terrestrial ecosystem restoration: Initiation, implementation, and challenges. Environ. Manag. 2010, 45, 429–441. [Google Scholar] [CrossRef] [PubMed]
- Wu, Z.T.; Wu, J.J.; Liu, J.H.; He, B.; Lei, T.J.; Wang, Q.F. Increasing terrestrial vegetation activity of ecological restoration program in the Beijing–Tianjin Sand Source Region of China. Ecol. Eng. 2013, 52, 37–50. [Google Scholar] [CrossRef]
- Shan, N.; Shi, Z.J.; Yang, X.H.; Gao, J.X.; Cai, D.W. Spatiotemporal trends of reference evapotranspiration and its driving factors in the Beijing-Tianjin Sand Source Control Project Region, China. Agric. For. Meteorol. 2015, 200, 322–333. [Google Scholar] [CrossRef]
- Frich, P.; Alexander, L.V.; Della-Marta, P.; Gleason, B.; Haylock, M.; Klein Tank, A.; Peterson, T. Observed coherent changes in climatic extremes during second half of the twentieth century. Clim. Res. 2002, 19, 193–212. [Google Scholar] [CrossRef]
- Booth Evan, L.J.; Byearne, J.M.; Johnson, D.L. Climatic changes in western North America, 1950–2005. Int. J. Climatol. 2012, 32, 2283–2300. [Google Scholar] [CrossRef]
- Wang, S.J.; Zhang, M.J.; Wang, B.L.; Sun, M.P.; Li, X.F. Recent changes in daily extremes of temperature and precipitation over the western Tibetan Plateau, 1973–2011. Quat. Int. 2013, 313, 110–117. [Google Scholar] [CrossRef]
- Wang, X.L. Accounting for autocorrelation in detecting mean shifts in climate data series using the penalized maximal t or F test. J. Appl. Meteorol. Clim. 2008, 47, 2423–2444. [Google Scholar] [CrossRef]
- Kioutsioukis, I.; Melas, D.; Zerefos, C. Statistical assessment of changes in climate extremes over Greece (1955–2002). Int. J. Climatol. 2010, 30, 1723–1737. [Google Scholar] [CrossRef]
- Im, E.S.; Jung, I.W.; Bae, D.H. The temporal and spatial structures of recent and future trends in extreme indices over Korea from a regional climate projection. Int. J. Climatol. 2011, 31, 72–86. [Google Scholar] [CrossRef]
- Keggenhoff, I.; Elizbarashvili, M.; Amiri-Farahani, A.; King, L. Trends in daily temperature and precipitation extremes over Georgia, 1971–2010. Weather Clim. Extremes 2014, 4, 75–85. [Google Scholar] [CrossRef]
- Goovaerts, P. Ordinary cokriging revisited. Math. Geol. 1998, 30, 21–42. [Google Scholar] [CrossRef]
- Paparrizos, S.; Maris, F.; Matzarakis, A. Mapping of drought for Sperchios River basin in central Greece. Hydrol. Sci. J. 2016, 61, 881–891. [Google Scholar] [CrossRef]
- Nistor, M.M. Spatial distribution of climate indices in the Emilia-Romagna region. Meteorol. Appl. 2016, 23, 304–313. [Google Scholar] [CrossRef]
- Mann, H.B. Nonparametric tests against trend. Econometrica 1945, 13, 245–259. [Google Scholar] [CrossRef]
- Kendall, M.G. Rank Correlation Methods, 4th ed.; Charles Griffin: London, UK, 1975. [Google Scholar]
- Shi, Z.J.; Shan, N.; Xu, L.H.; Yang, X.H.; Gao, J.X.; Guo, H.; Zhang, X.; Song, A.Y.; Dong, L.S. Spatiotemporal variation of temperature, precipitation and wind trends in a desertification prone region of China from 1960 to 2013. Int. J. Climatol. 2016. [Google Scholar] [CrossRef]
- Shi, Z.J.; Xu, L.H.; Yang, X.H.; Guo, H.; Dong, L.S.; Song, A.Y.; Zhang, X.; Shan, N. Trends in reference evapotranspiration and its attribution over the past 50 years in the Loess Plateau, China: Implications for ecological projects and agricultural production. Stoch. Environ. Res. Risk Assess. 2017, 31, 257–273. [Google Scholar] [CrossRef]
- Xu, L.H.; Shi, Z.J.; Wang, Y.H.; Zhang, S.L.; Chu, X.Z.; Yu, P.T.; Xiong, W.; Zuo, H.J.; Wang, Y.N. Spatiotemporal variation and driving forces of reference evapotranspiration in Jing River Basin, northwest China. Hydrol. Process. 2015, 29, 4846–4862. [Google Scholar] [CrossRef]
- Xu, L.H.; Shi, Z.J.; Wang, Y.H.; Chu, X.Z.; Yu, P.T.; Xiong, W.; Zuo, H.J.; Zhang, S.L. Agricultural irrigation-induced climatic effects: A case study in the middle and southern Loess Plateau area, China. Int. J. Climatol. 2016. [Google Scholar] [CrossRef]
- Sen, P.K. Estimates of the regression coefficient based on Kendall’s tau. J. Am. Stat. Assoc. 1968, 63, 1379–1389. [Google Scholar] [CrossRef]
- Yue, S.; Pilon, P.; Phinney, B.; Cavadias, G. The influence of autocorrelation on the ability to detect trend in hydrological series. Hydrol. Process. 2002, 33, 2328–2340. [Google Scholar] [CrossRef]
- Dinpashoh, Y.; Jhajharia, D.; Fakheri-Fard, A.; Singh, V.P.; Kahya, E. Trends in reference crop evapotranspiration over Iran. J. Hydrol. 2011, 399, 422–433. [Google Scholar] [CrossRef]
- Jhajharia, D.; Dinpashoh, Y.; Kahya, E.; Singh, V.P.; Fakheri-Fard, A. Trends in reference evapotranspiration in the humid region of northeast India. Hydrol. Process. 2012, 26, 421–435. [Google Scholar] [CrossRef]
- Trenberth, K.E.; Jones, P.D.; Ambenje, P.; Bojariu, R.; Easterling, D.; Klein Tank, A.; Parker, D.; Rahimzadeh, F.; Renwick, J.A.; Rusticucci, M.; et al. Observations: Surface and Atmospheric Climate Change. In Climate Change 2007: The Physical Science Basis; Cambridge University Press: Cambridge, UK, 2007. [Google Scholar]
- Lu, R. Interannual variation of North China rainfall in rainy season and SSTs in the equatorial eastern Pacific. Chin. Sci. Bull. 2005, 50, 2069–2073. [Google Scholar] [CrossRef]
- Wu, R.G.; Wang, B. A contrast of the East Asian summer Monsoon-ENSO relationship between 1962–77 and 1978–93. J. Clim. 2002, 15, 3266–3279. [Google Scholar] [CrossRef]
- Li, J.P.; Zeng, Q.C. A new monsoon index and the geographical distribution of the global monsoons. Adv. Atmos. Sci. 2003, 20, 299–302. [Google Scholar]
- Li, J.P.; Zeng, Q.C. A unified monsoon index. Geophys. Res. 2002, 29, 1274. [Google Scholar] [CrossRef]
- Mantua, N.J.; Hare, S.R.; Zhang, Y.; Wallace, J.M.; Francis, R.C. A Pacific interdecadal climate oscillation with impacts on salmon production. Bull. Am. Meteorol. Soc. 1997, 78, 1069–1079. [Google Scholar] [CrossRef]
- Suppiah, R. Trends in the southern oscillation phenomenon and Australian rainfall and changes in their relationship. Int. J. Climatol. 2004, 24, 269–290. [Google Scholar] [CrossRef]
- Chen, Y.R.; Chu, P.S. Trends in precipitation extremes and return levels in the Hawaiian Islands under a changing climate. Int. J. Climatol. 2014, 34, 3913–3925. [Google Scholar] [CrossRef]
- Najafi, M.R.; Moazami, S. Trends in total precipitation and magnitude-frequency of extreme precipitation in Iran, 1969–2009. Int. J. Climatol. 2016, 36, 1863–1872. [Google Scholar] [CrossRef]
- Zhang, J.S.; Shen, X.J.; Wang, B.L. Changes in precipitation extremes in Southeastern Tibet, China. Quat. Int. 2015, 380, 49–59. [Google Scholar] [CrossRef]
- Zou, X.K.; Ren, F.M. Changes in regional heavy rainfall events in China during 1961–2012. Adv. Atmos. Sci. 2015, 32, 704–714. [Google Scholar] [CrossRef]
- Wang, W.G.; Shao, Q.X.; Yang, T.; Peng, S.Z.; Yu, Z.B.; Taylor, J.; Xing, W.Q.; Zhao, C.P.; Sun, F.C. Changes in daily temperature and precipitation extremes in the Yellow River Basin, China. Stoch. Environ. Res. Risk Assess. 2013, 27, 401–421. [Google Scholar] [CrossRef]
- Manton, M.J.; Della-Marta, P.M.; Haylock, M.R.; Hennessy, K.J.; Nicholls, N.; Chambers, L.E.; Collins, D.A.; Daw, G.; Finet, A.; Gunawan, D.; et al. Trends in extreme daily rainfall and temperature in southeast Asia and the south Pacific: 1961–1998. Int. J. Climatol. 2001, 21, 269–284. [Google Scholar] [CrossRef]
- Zhang, Q.; Singh, V.P.; Li, J.F.; Jiang, F.Q.; Bai, Y.G. Spatio-temporal variations of precipitation extremes in Xinjiang, China. J. Hydrol. 2012, 434, 7–18. [Google Scholar] [CrossRef]
- Simmonds, I.; Bi, D.H.; Yan, B.L. Relationships between summer rainfall over China and ocean temperatures in the tropical western Pacific. J. Meteorol. Soc. Jpn. 1996, 74, 273–279. [Google Scholar] [CrossRef]
- Luo, D.H.; Xiao, Y.Q.; Yao, Y.; Dai, A.G.; Simmonds, I.; Franzke, C.L.E. Impact of Ural blocking on winter warm Arctic-Cold Eurasian anomalies. Part I: Blocking-induced amplification. J. Clim. 2016, 29, 3925–3947. [Google Scholar] [CrossRef]
- Luo, D.H.; Xiao, Y.Q.; Diao, Y.N.; Dai, A.G.; Franzke, C.L.E.; Simmonds, I. Impact of Ural blocking on winter warm Arctic-Cold Eurasian anomalies. Part II: The link to the North Atlantic Oscillation. J. Clim. 2016, 29, 3949–3971. [Google Scholar] [CrossRef]
- Luo, D.H.; Yao, Y.; Dai, A.G.; Simmonds, I.; Zhong, L.H. Increased quasi-stationarity and persistence of winter ural blocking and eurasian extreme cold events in response to arctic warming. Part II: A theoretical explanation. J. Clim. 2017. [Google Scholar] [CrossRef]
- Yao, Y.; Luo, D.H.; Dai, A.G.; Simmonds, I. Increased Quasi-stationarity and persistence of winter Ural blocking and Eurasian extreme cold events in response to Arctic warming. Part I: Insights from observational analyses. J. Clim. 2017. [Google Scholar] [CrossRef]
- Zhang, J.N. Possible effects of Arctic sea ice anomalies on summer climate in China; Chinese Academy of Meteorological Sciences Press: Beijing, China, 2011. [Google Scholar]
- Simmonds, I.; Bi, D.H.; Hope, P. Atmospheric water vapor flux and its association with rainfall over China in summer. J. Clim. 1999, 12, 1353–1367. [Google Scholar] [CrossRef]
- Shan, N. Vegetation Index (NDVI) Responses to Climate Change in Beijing-Tianjin Sand Source Region; China Forest Science Research Institute: Beijing, China, 2013. [Google Scholar]
- Wu, Z.; Wu, J.; He, B.; Liu, J.; Wang, Q.; Zhang, H.; Liu, Y. Drought offset ecological program-induced increase in vegetation activity in the Beijing-Tianjin Sand Source Region, China. Environ. Sci. Technol. 2014, 48, 12108–12117. [Google Scholar] [CrossRef] [PubMed]
- Yan, E.P.; Lin, H.; Dang, Y.F.; Xia, Z.Z. The spatiotemporal changes of vegetation cover in Beijing-Tianjin sandstorm source control region during 2000–2012. Acta Ecol. Sin. 2014, 34, 5007–5020. [Google Scholar]
- Yang, Y.L.; Sun, Y.L.; Wang, Z.L.; Kang, J. Persistence in vegetation cover changes in Beijing-Tianjin Sandstorm Source Control Region. Acta Ecol. Sin. 2016, 36, 47–53. [Google Scholar]
- Li, X.S.; Wang, H.Y.; Zhou, S.F.; Sun, B.; Gao, Z.H. Did ecological engineering projects have a significant effect on large-scale vegetation restoration in Beijing-Tianjin Sand Source Region, China? A remote sensing approach. Chin. Geogr. Sci. 2016, 26, 216–228. [Google Scholar] [CrossRef]
- Fan, B.H.; Guo, L.; Li, N.; Chen, J.; Lin, H.; Zhang, X.Y.; Shen, M.G.; Rao, Y.H.; Wang, C.; Ma, L. Earlier vegetation green-up has reduced spring dust storms. Sci. Rep. 2014, 4, 6749. [Google Scholar] [CrossRef] [PubMed]
- Zhang, H.Z.; Tian, M.Z.; Guo, J.; Yang, J. The dynamic monitoring of Dalinur Lake in Inner Mongolia during 1999–2010 based on RS and GIS. J. Arid Land Resour. Environ. 2012, 26, 41–46. [Google Scholar]
- Tao, S.L.; Fang, J.Y.; Zhao, X.; Zhao, S.Q.; Shen, H.H.; Hu, H.F.; Tang, Z.Y.; Wang, Z.H.; Guo, Q.H. Rapid loss of lakes on the Mongolian Plateau. PNAS 2014, 112, 2281–2286. [Google Scholar] [CrossRef] [PubMed]
- Liu, H.; Yin, Y.; Piao, S.; Zhao, F.; Engels, M.; Ciais, P. Disappearing Lakes in Semiarid Northern China: Drivers and Environmental Impact. Environ. Sci. Technol. 2013, 47, 12107–12114. [Google Scholar] [CrossRef] [PubMed]
- Sun, Z.D.; Jiang, J.H.; Huang, Q. Analysis of climate and hydrological change in Daihai Basin in the late 50 years. Water. Resour. Prot. 2005, 21, 1–8. [Google Scholar]
- Yu, L.L.; Qin, Y.C.; Liu, J.S. Analysis of water resources characteristics of Huangqihai river basin. Inner Mongolia Water Resour. 2013, 2, 36–38. [Google Scholar]
- Du, H.; Xia, J.; Zeng, S.D.; She, D.X.; Liu, J.J. Variations and statistical probability characteristic analysis of extreme precipitation events under climate change in Haihe River Basin, China. Hydrol. Process. 2012, 28, 913–925. [Google Scholar] [CrossRef]
- Chen, Y.; Chen, X.Y.; Ren, G.Y. Variation of extreme precipitation over Large River Basins in China. Adv. Clim. Chang. Res. 2011, 2, 108–114. [Google Scholar] [CrossRef]


| Type | Index | Descriptive Name | Definition | Units |
|---|---|---|---|---|
| Frequency indices | R1 | Number of precipitation days | Annual count of days when daily precipitation ≥ 1 mm | days |
| R10 | Number of heavy precipitation days | Annual count of days when daily precipitation ≥ 10 mm | days | |
| R20 | Number of very heavy precipitation days | Annual count of days when daily precipitation ≥ 20 mm | days | |
| Intensity indices * | RX1day | Max 1-day precipitation amount | Monthly maximum 1-day precipitation | mm |
| RX5day | Max 5-day precipitation amount | Monthly maximum consecutive 5-day precipitation | mm | |
| Duration indices | CWD | Consecutive wet days | Maximum number of consecutive days with daily precipitation ≥ 1 mm | days |
| CDD | Consecutive dry days | Maximum number of consecutive days with daily precipitation < 1 mm | days | |
| Other indices | R95p | Very wet day precipitation | Annual total PRCP when RR > 95th percentile | mm |
| PPL95 | Contribution rate of R95p | Percentage of very wet day precipitation to total precipitation | % | |
| PRCPTOT | Annual total wet-day precipitation | Annual total PRCP in wet days (RR ≥ 1 mm) | mm | |
| SDII | Simple daily intensity index | Annual total precipitation divided by the number of wet days (defined as PRCP ≥ 1 mm) in the year | mm/day |
| Index | Trend Magnitude | Decreasing (%) | Increasing (%) | No Trend(%) | Units |
|---|---|---|---|---|---|
| R1 | −0.57 (−7.69~0.59) | 41 (77.4%, 11.3%) | 12 (22.6%, 0.0%) | 0 (0.0%) | days/decade |
| R10 | −0.04 (−1.82~0.48) | 23 (43.4%, 3.7%) | 26 (49.1%, 0.0%) | 4 (7.5%) | days/decade |
| R20 | −0.01 (−0.36~0.33) | 26 (49.1%, 3.7%) | 23 (43.4%, 3.7%) | 4 (7.5%) | days/decade |
| RX1day | −1.41 * (−5.20~1.10) | 40 (75.5%, 7.5%) | 13 (24.5%, 0.0%) | 0 (0.0%) | mm/decade |
| RX5day | −2.05 * (−10.30~2.90) | 39 (73.6%, 9.4%) | 14 (26.4%, 1.9%) | 0 (0.0%) | mm/decade |
| CWD | −0.06 (−0.36~0.10) | 32 (60.4%, 7.5%) | 20 (37.7%, 0.0%) | 1 (1.9%) | days/decade |
| CDD | −0.81 (−9.62~5.68) | 32 (60.4%, 5.7%) | 20 (37.7%, 3.7%) | 1 (1.9%) | days/decade |
| PRCPTOT | −3.74 (−54.53~8.16) | 34 (64.2%, 1.9%) | 19 (35.8%, 0.0%) | 0 (0.0%) | mm/decade |
| SDII | 0.02 (−0.21~0.26) | 20 (37.7%, 0.0%) | 33 (62.3%, 1.8%) | 0 (0.0%) | (mm/day)/decade |
| R95p | −2.89 (−18.20~7.30) | 31 (58.5%, 7.5%) | 21 (39.6%, 0.0%) | 1 (1.9%) | mm/decade |
| PPL95 | −0.57 (−2.90~1.60) | 30 (56.6%, 3.7%) | 22 (41.5%, 0.0%) | 1 (1.9%) | %/decade |
© 2017 by the authors. Licensee MDPI, Basel, Switzerland. This article is an open access article distributed under the terms and conditions of the Creative Commons Attribution (CC BY) license (http://creativecommons.org/licenses/by/4.0/).
Share and Cite
Wei, W.; Shi, Z.; Yang, X.; Wei, Z.; Liu, Y.; Zhang, Z.; Ge, G.; Zhang, X.; Guo, H.; Zhang, K.; et al. Recent Trends of Extreme Precipitation and Their Teleconnection with Atmospheric Circulation in the Beijing-Tianjin Sand Source Region, China, 1960–2014. Atmosphere 2017, 8, 83. https://doi.org/10.3390/atmos8050083
Wei W, Shi Z, Yang X, Wei Z, Liu Y, Zhang Z, Ge G, Zhang X, Guo H, Zhang K, et al. Recent Trends of Extreme Precipitation and Their Teleconnection with Atmospheric Circulation in the Beijing-Tianjin Sand Source Region, China, 1960–2014. Atmosphere. 2017; 8(5):83. https://doi.org/10.3390/atmos8050083
Chicago/Turabian StyleWei, Wei, Zhongjie Shi, Xiaohui Yang, Zheng Wei, Yanshu Liu, Zhiyong Zhang, Genbatu Ge, Xiao Zhang, Hao Guo, Kebin Zhang, and et al. 2017. "Recent Trends of Extreme Precipitation and Their Teleconnection with Atmospheric Circulation in the Beijing-Tianjin Sand Source Region, China, 1960–2014" Atmosphere 8, no. 5: 83. https://doi.org/10.3390/atmos8050083