Article

The Temporal and Spatial Distributions of the Near-Surface CO2 Concentrations in Central Asia and Analysis of Their Controlling Factors

1
State Key Laboratory of Desert and Oasis Ecology, Xinjiang Institute of Ecology and Geography, Chinese Academy of Sciences, Urumqi 830011, China
2
University of Chinese Academy of Sciences, Beijing 100039, China
3
Department of Geography, Ghent University, Ghent 9000, Belgium
4
Sino-Belgian Joint Laboratory of Geo-information, Xinjiang Institute of Ecology and Geography, Chinese Academy of Sciences, Urumqi 830011, China
5
Sino-Belgian Joint Laboratory of Geo-information, Ghent University, Ghent 9000, Belgium
*
Author to whom correspondence should be addressed.
Atmosphere 2017, 8(5), 85; https://doi.org/10.3390/atmos8050085
Submission received: 19 February 2017 / Revised: 2 May 2017 / Accepted: 9 May 2017 / Published: 12 May 2017

Abstract

:
As the main anthropogenic greenhouse gas that contributes most to global warming, CO2 plays an important role in climate changes in Central Asia. Due to the lack of studies of near-surface CO2 in this region, we first confirmed the applicability of the near-surface Greenhouse Gases Observing Satellite (GOSAT) CO2 data in Central Asia using atmospheric CO2 concentration data from nine ground-based station observations. We then analyzed the temporal and spatial distributions of the near-surface CO2 concentrations in Central Asia and their controlling factors using statistical analysis methods. The results show that the near-surface CO2 concentrations are high in the western part of this region and low in the east. From June 2009 to May 2013, the near-surface CO2 concentrations increased gradually, with the highest value being in spring and the lowest in autumn. The temporal distribution of CO2 concentrations is mainly affected by photosynthesis, respiration, and heating. The combined effect of terrestrial ecosystems and CO2 diffusion by wind is responsible for the higher near-surface CO2 concentration in the northern, western, and southwestern areas of the five Central Asian countries compared to the central, eastern, and southern areas, and energy consumption and wind are the major factors that affect the heterogeneity of the spatial distribution of the CO2 concentrations in Xinjiang.

1. Introduction

The temporal and spatial dynamics of atmospheric CO2 have important environmental effects. As a kind of major greenhouse gas, CO2 is mainly produced by human activities. The increase of CO2 concentrations has had significant effects on global climate change [1]. On the other hand, as a carbon source for plant photosynthesis, the increase of CO2 concentrations has stimulated an increase in global vegetation productivity [2,3]. Because high CO2 concentrations are beneficial for decreasing stomatal conductance and transpiration water consumption, the variation of near-surface CO2 concentrations is closely related to the water use efficiency and productivity of the vegetation in arid regions [4,5,6,7]. Simulation studies of Central Asia have shown that the CO2 fertilization effect was the main controlling factor for the carbon dynamics in this region in 1981–2007 [8]. Therefore, determining the temporal and spatial patterns of near-surface CO2 is important for simulating the water use efficiency dynamics of the vegetation in arid regions under the background of climate change and for predicting the productivity and ecological stability of desert vegetation under future CO2 emissions scenarios.
However, the current understanding of the temporal and spatial characteristics of CO2 is insufficient because ground CO2 observation stations are scarce, measurement methods are not consistent [9,10,11,12], the CO2 source-sink mechanisms and atmospheric transportation processes are complex and difficult to simulate, and researchers lack reliable near-surface CO2 spatial data over long time periods [13]. Because of the lack of spatial data, ecological studies of large regions and at the global scale can only rely on the annual global mean CO2 background values that are observed on a few islands, but these data ignore the temporal and spatial heterogeneity of the near-surface CO2 concentrations, which causes large uncertainties in study results. With the development of CO2 satellite remote sensing techniques, researchers can now conduct long-term, stable, and high-frequency observations (six hours) of the global CO2 distribution [14]. CO2 remote sensing platforms can be divided into two types based on the different atmospheric CO2 spectra [15]. The first type includes sensors that use thermal infrared radiation spectra for observations, such as the Atmospheric Infrared Sounder (AIRS) sensor on the Aqua satellite [16,17,18] and the Infrared Atmospheric Sounding Interferometer (IASI) hyperspectral infrared detector on the Meteorological Operational (Metop)-A satellite [19]. The other type includes sensors that use the near-infrared segment of solar reflectance spectra for observations, such as the SCanning Imaging Absorption SpectroMeter for Atmospheric CHartographY (SCIAMACHY) sensor on the ENVIronmental SATellite (ENVISAT) [20,21] and the Thermal And Near-infrared Sensor for carbon Observation (TANSO), which includes two types of sensors, namely, the Fourier Transform Spectrometer (FTS) and Cloud and Aerosol Imager (CAI), on the Greenhouse gases Observing SATellite (GOSAT) [22,23]. As the first satellite dedicated to greenhouse gas observations, its primary task is to survey CO2 and CH4 concentrations [22]. The spectral wave bands used to observe CO2 concentrations are 1.6 μm and 2.06 μm. The observation principle is that CO2 has unique absorption properties in these bands. GOSAT has provided relatively long time-series information for CO2 pattern studies that has been used to detect the distribution of CO2 carbon sources [24,25]. With continuous improvement and the perfection of algorithms, the accuracy of GOSAT XCO2 increased from 9 ppmv in Version 1 [26] to less than 2 ppmv in Version 2 [27]. By adding GOSAT data to the ground-based monitoring data (GLOBALVIEW-CO2), uncertainties in CO2 flux estimates can be reduced by as much as 40%. In the regions not covered by the ground-based monitoring network, uncertainties of CO2 fluxes were reduced by 20–30% [28]. Despite many trials, no study has successfully used GOSAT remote sensing data to quantitatively explain the mechanisms that control the CO2 distributions [29,30]. This is mainly because the ground carbon sources and sinks of the regions focused on by previous studies, such as European and American metropolitan areas and the developed regions in eastern China, are highly spatially heterogeneous. In each 2.5° × 2.5° pixel of GOSAT L4B product, strong carbon sources and sinks densely overlap, and the different controlling factors cannot be separated. In addition, the climate systems of these regions are generally complex, and the prevailing wind directions are uncertain. Thus, it is difficult to analyze the effects of carbon sources in the surrounding areas on the CO2 distributions in the study regions.
Because of this problem, we used Central Asia as the study area. Its advantages are as follows: (1) Because desert vegetation is sensitive to CO2, explaining the CO2 distribution in this region has significance for ecological applications; (2) The carbon sources in this region are mainly concentrated in the urban agglomeration on the northern slope of Tianshan Mountains, and the other regions lack significant carbon sources except for a few medium and small towns. The carbon sinks in this area are mainly located in large areas of forests, grasslands, and large farms. Different carbon sources and sinks are often separated by deserts with extremely low net carbon fluxes. The simple and coarse surface source/sink pattern is beneficial to analyses that use coarse resolution GOSAT data; (3) This region is located far from the complex effect of marine carbon sinks, and the climate is under the stable control of westerly circulation for the entire year. The four-season prevailing winds patterns in the sub-regions are stable, and the inputs from carbon sources outside the region (e.g., the European industrial region) are clear. All of these factors simplify the analysis of the carbon source and sink mechanism; (4) Finally, because this area is the core region of the continental Silk Road Economic Belt, monitoring the temporal and spatial patterns of CO2 is important for managing carbon sources and sinks and achieving low-carbon construction of the Belt and Road. Therefore, this study utilized the near-surface CO2 data product from the GOSAT satellite, analyzed the distribution of CO2 concentrations in Central Asia from 2009 to 2013 and their annual and seasonal variations, and combined regional societal and economic, ecosystem productivity, meteorological, and atmospheric circulation data to analyze the temporal and spatial characteristics of CO2 and the mechanisms that control the sources and sinks.

2. Materials and Methods
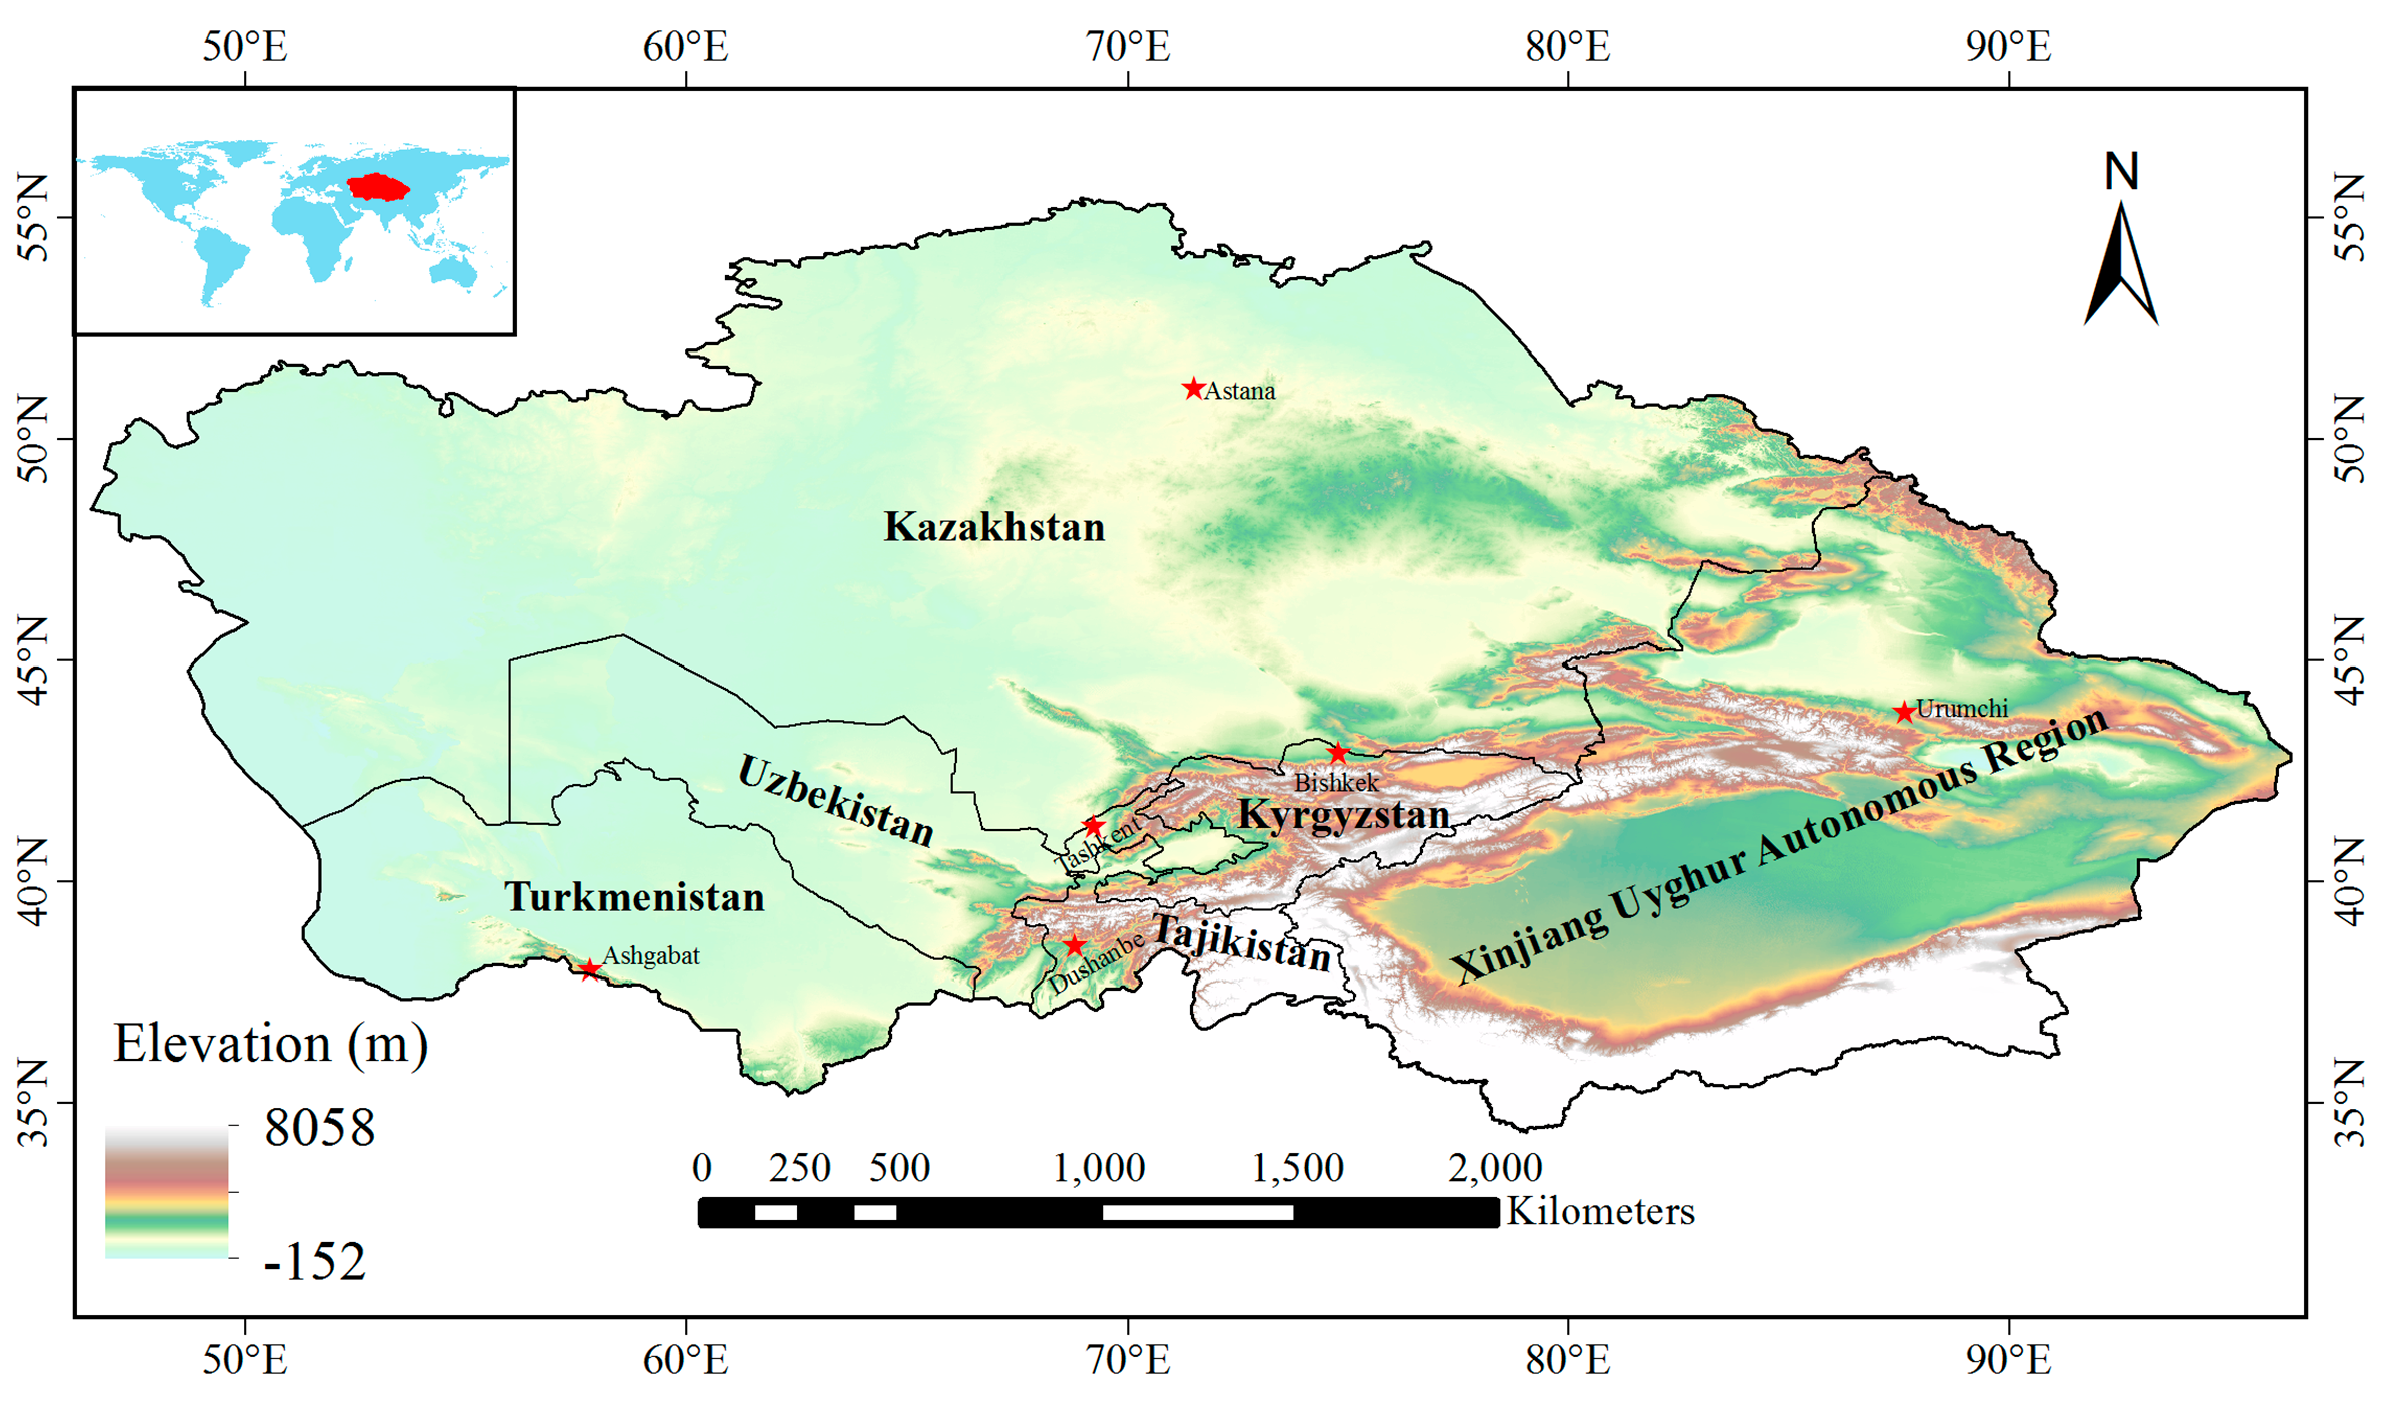
2.1. Research Area

The study region includes the five Central Asian countries (Kazakhstan, Kyrgyzstan, Tajikistan, Turkmenistan, Uzbekistan) and Xinjiang Uygur Autonomous Region, China, which are located in the hinterland of Eurasia (Figure 1). It is located between 34.17° N and 55.73° N and between 46.33° E and 96.47° E, covers an area of approximately 563.8 × 10⁴ km2, and represents one-third of the global arid regions [31]. It is one of the most representative arid regions in the middle latitudes of the northern hemisphere. The topography of the five Central Asian countries is mainly composed of hills and plains. The western and central regions are mainly broad plains, the northern regions are mainly hills, and the eastern regions are composed of the Tianshan Mountains and Pamir Plateau. The topography is significantly higher in the east than in the west. Xinjiang is composed of alternating mountains and basins, which form a topographic pattern of three mountain ranges that divide two basins from north to south. Xinjiang is divided by the Tianshan Mountains into northern Xinjiang and southern Xinjiang, which have significantly different natural conditions. This region has strong geographic heterogeneity, complex climate conditions, and water-stressed vegetation communities, and it is relatively sensitive to global climate change [32].

2.2. Date and Methodology

We used multiple data sets, mainly including the GOSAT L4B CO2 data product, the World Data Center for Greenhouse Gases (WDCGG) atmospheric CO2 concentration data product from ground-based station observations, the Moderate Resolution Imaging Spectroradiometer (MODIS) annual net primary production (NPP) data, energy consumption data from the World Bank, the China Statistical Yearbook, Digital Elevation Model (DEM) data, and ERA-Interim wind velocity data.
Four levels of data products (Levels 1–4) derived from GOSAT observations have been released since the GOSAT was successfully launched on 23 January 2009 [33]. Spectra and radiances are provided by the Level 1 product. The column abundances of CO2 and CH4 retrieved from Level 1 spectral observation data are provided by the FTS SWIR Level 2 data. Monthly global distributions of CO2 and CH4, which are calculated from the Level 2 data using the Kriging interpolation method, are provided by the FTS SWIR Level 3 product. The Level 4 data product provides monthly CO2 fluxes inferred from both the GOSAT Level 2 retrievals and ground-based CO2 monitoring data (GLOBALVIEW-CO2) using a global atmospheric tracer transport model and a Bayesian inverse modeling scheme [34]. Details of the CO2 inversion algorithm used by this satellite are found in the literature [23,35]. The data product consists of two datasets, the Level 4A (L4A) regional CO2 flux data and the Level 4B (L4B) three-dimensional CO2 distributions, the simulations of which are based on the L4A flux estimates. The CO2 concentration data in this paper are derived from the GOSAT v02.04 near-surface CO2 L4B product (975 hPa level). The horizontal resolution of the concentration distribution data is 2.5 degrees, and the data are available at 17 vertical levels that extend from near the surface to the top of the atmosphere. The data run from June 2009 to October 2013, and the time resolution is 6 h.
Before using the GOSAT data to study the temporal and spatial distributions of the near-surface CO2 concentration in Central Asia, we need to verify the reliability of the near-surface CO2 concentrations inverted from the GOSAT data. This study used ground-based station observations to verify the accuracy of the GOSAT data. The ground-based station observations in this study are from the WDCGG. Because the study region lacks station data, we selected the data from nine stations closest to the study region as the verification data (Table 1). Data from the stations are not used to generate the GOSAT L4B v02.04 product.
To discuss the relationship between the near-surface CO2 concentrations in Central Asia and energy consumption, we summarized the energy consumption data from the World Bank and China Statistical Yearbook [36]. To determine the effect of the vegetation carbon sink in this region on the near-surface CO2 concentrations, we used the MODIS annual mean NPP product (MOD17A3, 1 km × 1 km) to analyze its effect on the spatial distribution of the near-surface CO2 concentrations. The wind velocity and the direction of the prevailing winds are the most important meteorological factors that affect the near-surface CO2 concentrations [37] and have important effects on the spatial distribution of near-surface CO2. The near-surface wind vector data (975 hPa) used in this study are from re-analyzed ERA-Interim data. The horizontal data resolution is 0.75° × 0.75°, and the time resolution is 6 h.
The correlation analysis method was used to analyze the effects of the anthropogenic and natural factors on the spatial distribution of near-surface CO2 concentrations:
R xy = i = 1 n ( X i X ¯ ) ( Y i Y ¯ ) i = 1 n ( X i X ¯ ) 2 i = 1 n ( Y i Y ¯ ) 2
where X and Y are two essential factors, Xi and Yi are their sample values, and X ¯ and Y ¯ are the means of X and Y, respectively.

3. Results

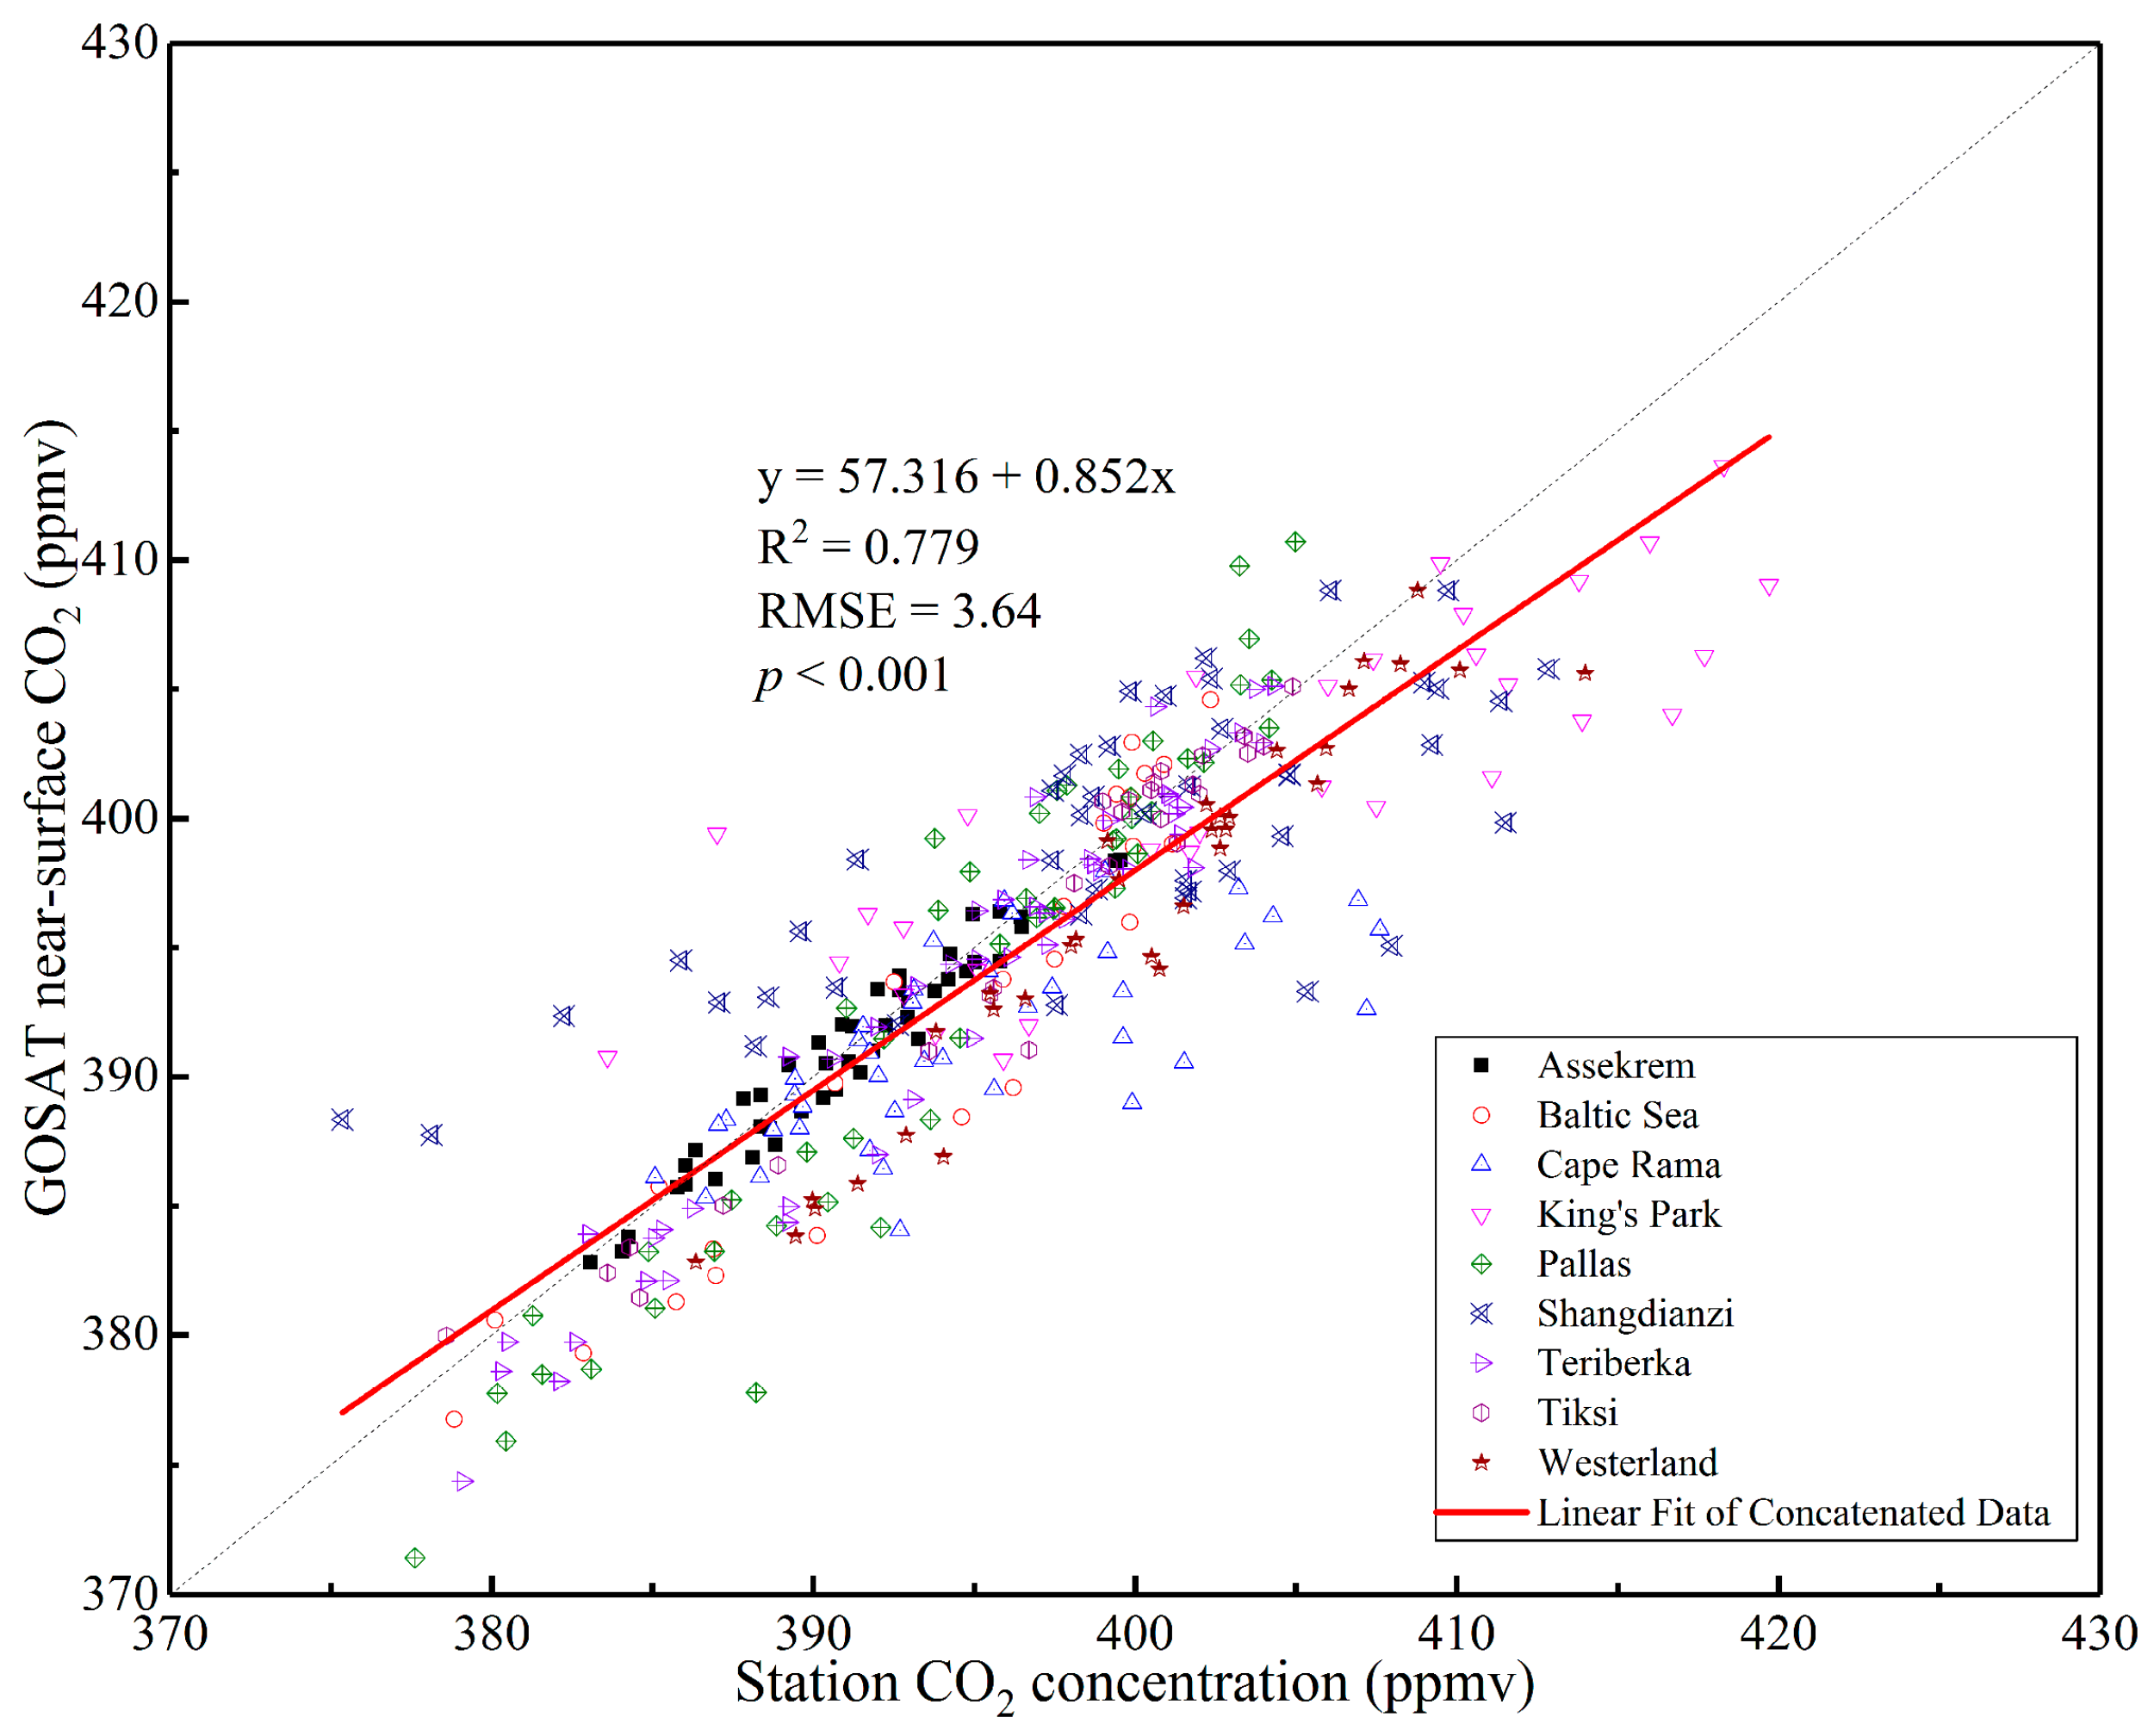
3.1. Ground-Based Validation of the GOSAT CO2 Product

The data from nine ground-based station observations were used to verify the GOSAT near-surface CO2 concentrations. The results show a high degree of correlation between the ground observations over four years and the GOSAT inversion results (R2 = 0.779, RMSE = 3.64, p < 0.001) (Figure 2).
All of the correlation coefficients between the observations at the nine WDCGG sites and the GOSAT inversion results are greater than 0.7 (Table 1). The monthly mean deviations are all less than 2 ppmv (1 ppmv = 1 μL/L), whereas the mean seasonal CO2 variation is approximately 5 ppmv [17]. Therefore, the GOSAT inversion results can be used to capture the seasonal CO2 variations. The mean annual growth rate of the CO2 concentration at each station based on data from the ground-based station observations is 2.737 ppmv/a, whereas the corresponding satellite inversion results show that the annual growth rate is 2.509 ppmv/a (Table 1). The difference is less than 0.3 ppmv/a, which indicates that the GOSAT inversion data can capture the annual variation tendency of near-surface CO2 concentrations. Rayner et al. demonstrated that a CO2 concentration accuracy that is better than 1% (less than 4 ppmv) can decrease the uncertainty of estimates of regional CO2 sources and sinks [38]. In summary, the GOSAT L4B near-surface CO2 concentration data are highly accurate and stable and can be used to analyze the temporal and spatial distributions of the near-surface CO2 concentrations in Central Asia.

3.2. The Temporal and Spatial Distributions of the Near-Surface CO2 Concentrations in Central Asia

The distribution of the multi-year mean near-surface CO2 concentrations in Central Asia shows significant spatial heterogeneity. The regions with high values are primarily located in the northern and western regions of Kazakhstan and the southwestern region of Turkmenistan. The regions with low values are primarily located in southern and eastern Central Asia, particularly in the Altai Mountains, Tianshan Mountains, Pamir Plateau, and Kunlun Mountains (Figure 3).
Of the six countries/regions, Kazakhstan has the highest annual mean CO2 concentration (391.663 ppmv), and Tajikistan has the lowest annual mean concentration (389.903 ppmv). Kazakhstan has the highest annual mean growth over the four years (2.296 ppmv/a), which is 13.5% higher than that of Xinjiang, which has the lowest growth rate (Table 2).
The near-surface CO2 concentrations in Central Asia have significant seasonal and monthly cycles (Figure 4). The near-surface CO2 concentrations in the six regions during each season are higher than those of the corresponding seasons in the previous year (Figure 4b). The CO2 concentrations of all of the months in Central Asia are higher than those of the same months in the previous year (Figure 4a), which reflects the continuous increase in atmospheric CO2 in this area.
The multi-year mean monthly concentrations (Figure 4c) show that Kazakhstan reaches its maximum concentration in March, whereas the other countries reach their maximums in April. Tajikistan and Kyrgyzstan reach their minimums concentration in July, whereas the other five regions reach their minimums in August. The near-surface CO2 concentrations in all six regions reach their minimums in the summer (Figure 4d). Kazakhstan, Turkmenistan, and Xinjiang reach their maximums in the spring, whereas the other three regions reach their maximums in the winter. The largest variation between adjacent seasons is the variation from spring to summer, and the smallest variation is between winter and spring. Table 2 shows that the mean variation between adjacent seasons in Central Asia is 5.794 ppmv. Kazakhstan has the largest variation between adjacent seasons; its mean variation is 1.31 times that of Turkmenistan, which has the smallest variation.

4. Discussion

4.1. Factors Affecting the Temporal Distribution of CO2 Concentrations in Central Asia

The near-surface CO2 concentrations in Central Asia are highest in the spring (April) and lowest in the summer (August). The CO2 concentrations increase in the fall, continue to increase in the winter, and reach a peak in the spring. The CO2 concentrations have this seasonal variation because in the winter and spring, the populations of Central Asia use heating systems that consume large amounts of fossil energy, including natural gas, coal, and oil, and thus produce large amounts of CO2 that are discharged into the atmosphere. On the other hand, plants are in the dormant and recovery stage in the spring and winter. Plant respiration is strong, but photosynthesis is weak, and the CO2 absorption capability of plants is poor. The concentrated emissions and weak consumption of CO2 cause the significant increase of atmospheric CO2 concentration during this period, which causes the increase in CO2 concentrations in the atmosphere. In addition, the temperature in the winter is lower, which hinders the decomposition of plant litter. Soil microorganism activity is also inhibited. The temperature starts to increase in the late spring. Soil microorganism activity increases, so CO2 is decomposed and released from biological materials. The CO2 in the soil is also released. Therefore, the maximum near-surface CO2 concentrations observed by satellites occur in April. The near-surface CO2 concentrations decrease from April to August. The largest decrease during this period (7.286 ppmv) occurs in May and June. The minimum near-surface CO2 concentration (382.254 ppmv) occurs in August. The main reason is that the lighting, temperature, and precipitation factors from April to August are beneficial to vegetation growth. Photosynthesis increases, and vegetation with good growth and high coverage can absorb large amounts of CO2, so the near-surface CO2 concentrations decrease during this period.
The results show that the maximum intra-annual seasonal variation of CO2 in Central Asia is 11.588 ppmv, which is much greater than the global intra-annual seasonal variation over the same time period. Thus, neglecting the seasonal and spatial CO2 heterogeneities can severely affect the accuracy of ecosystem model predictions of vegetation productivity and carbon dynamics in arid regions.

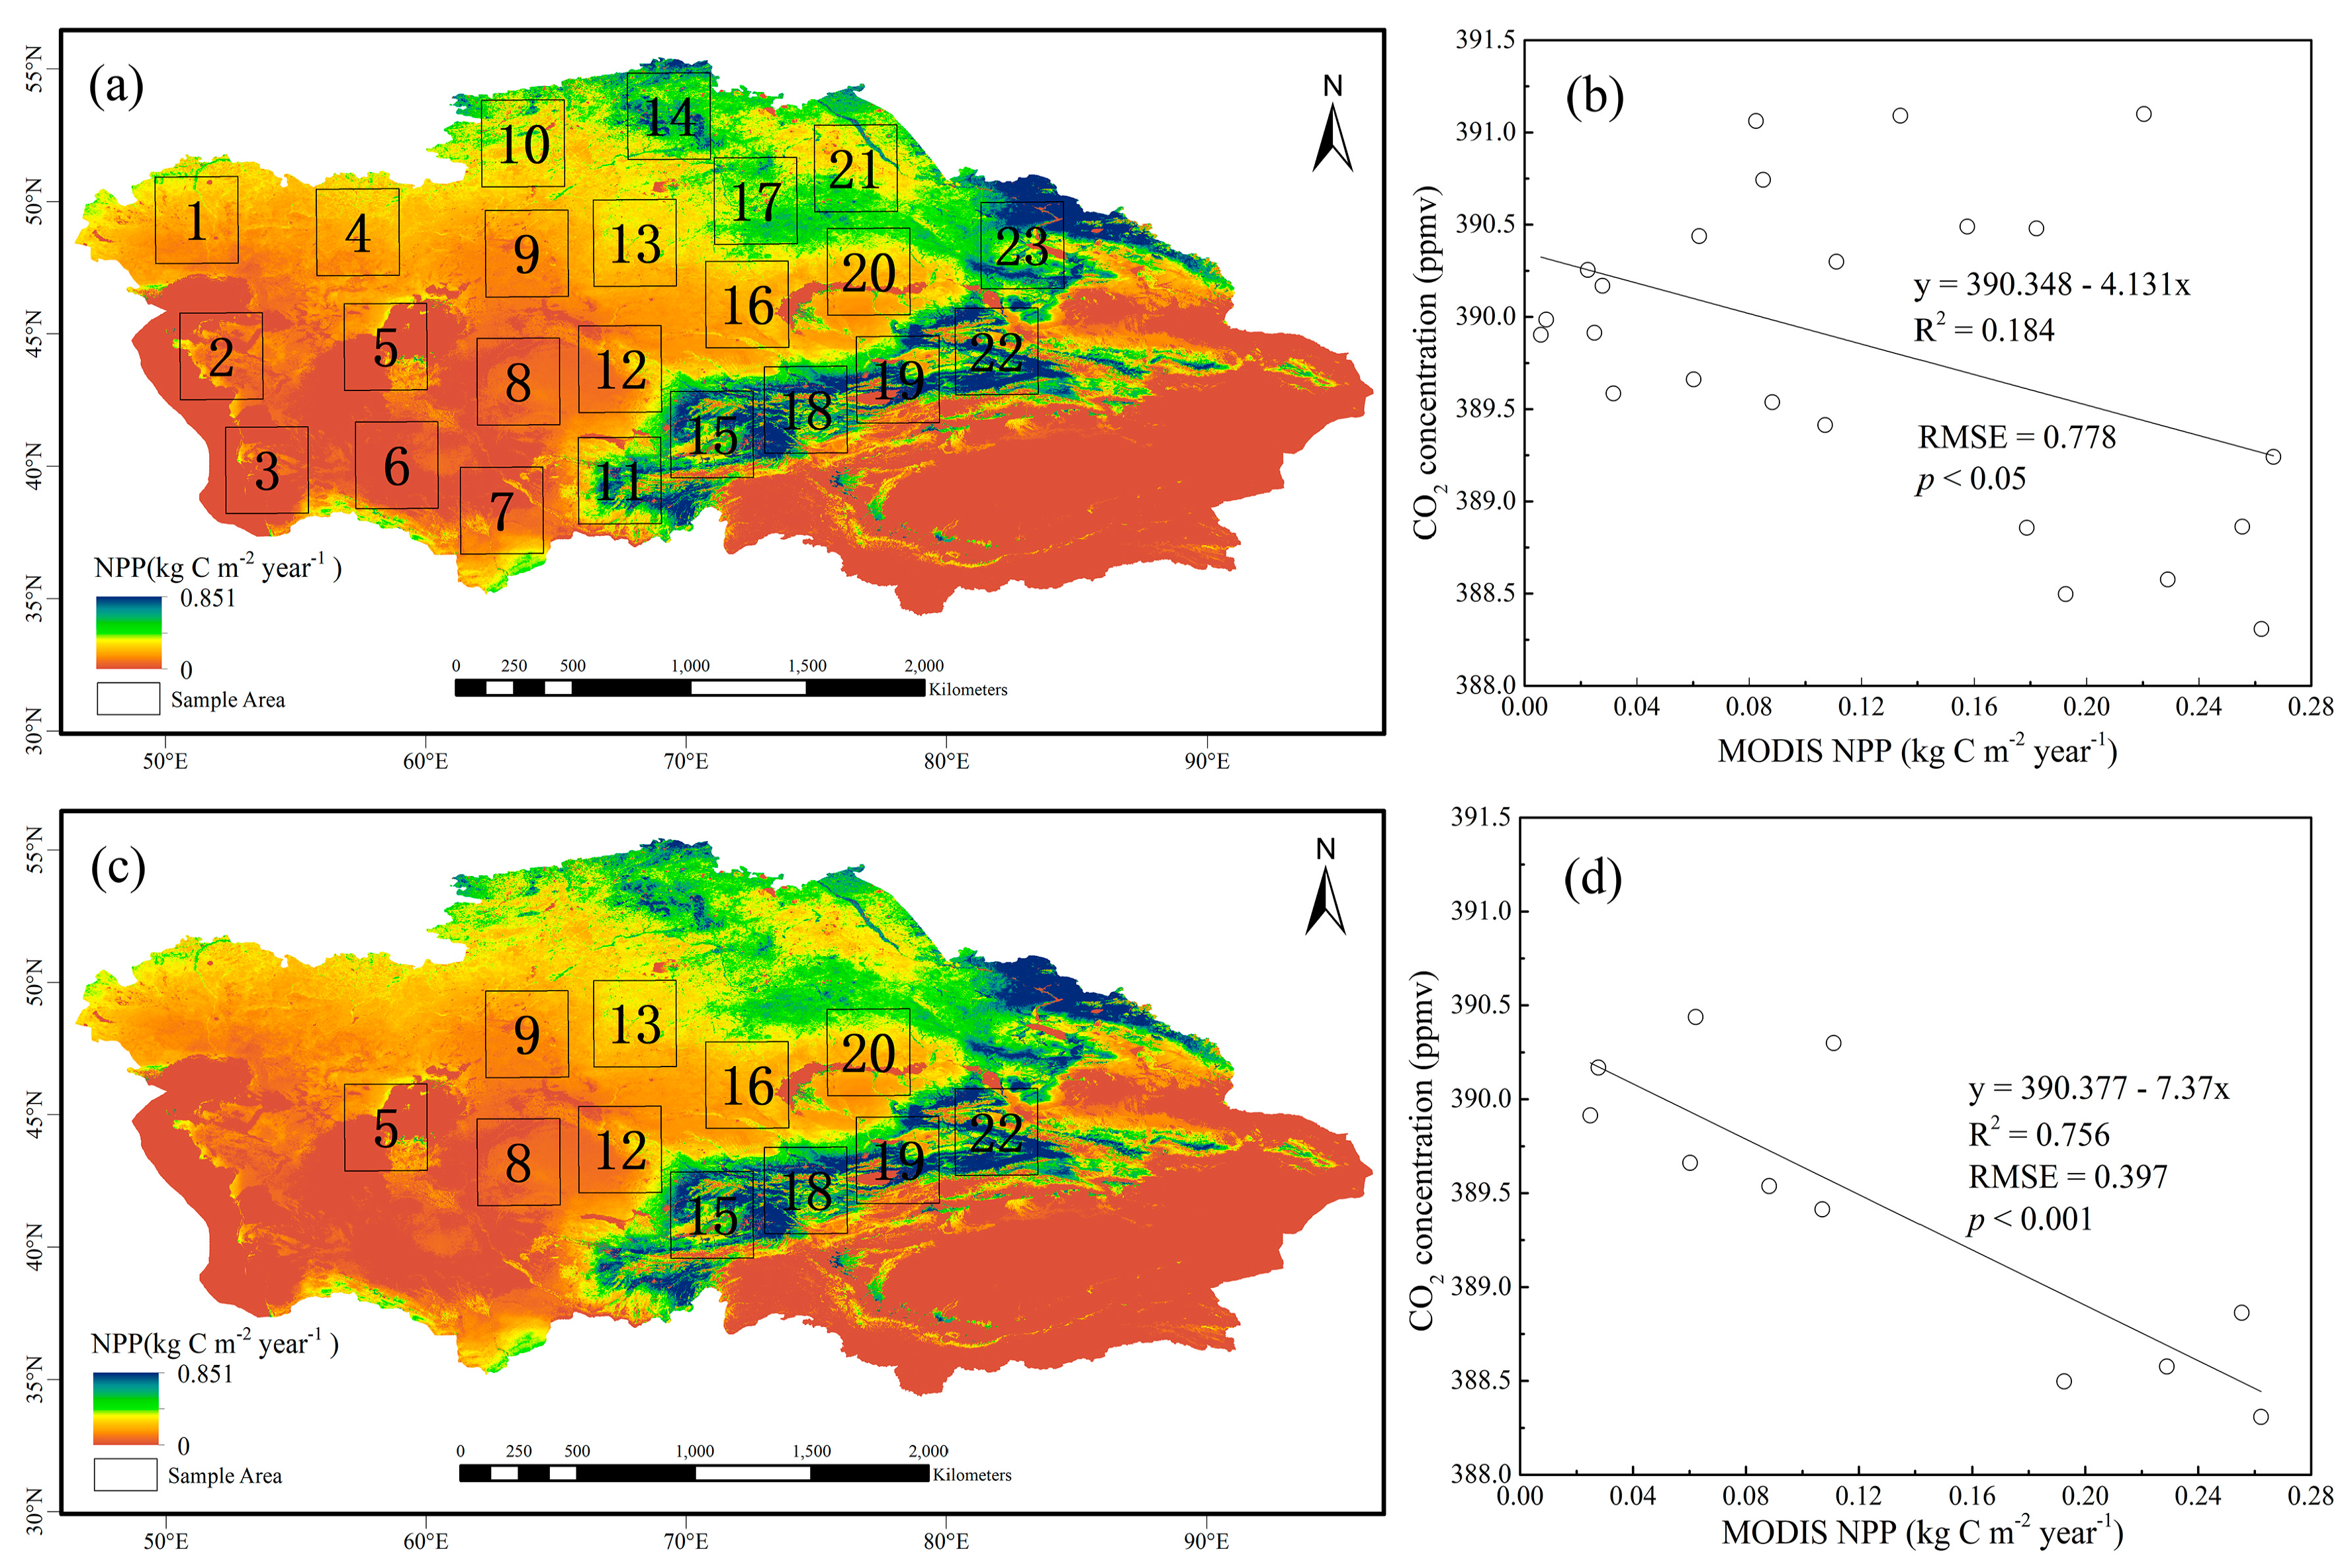
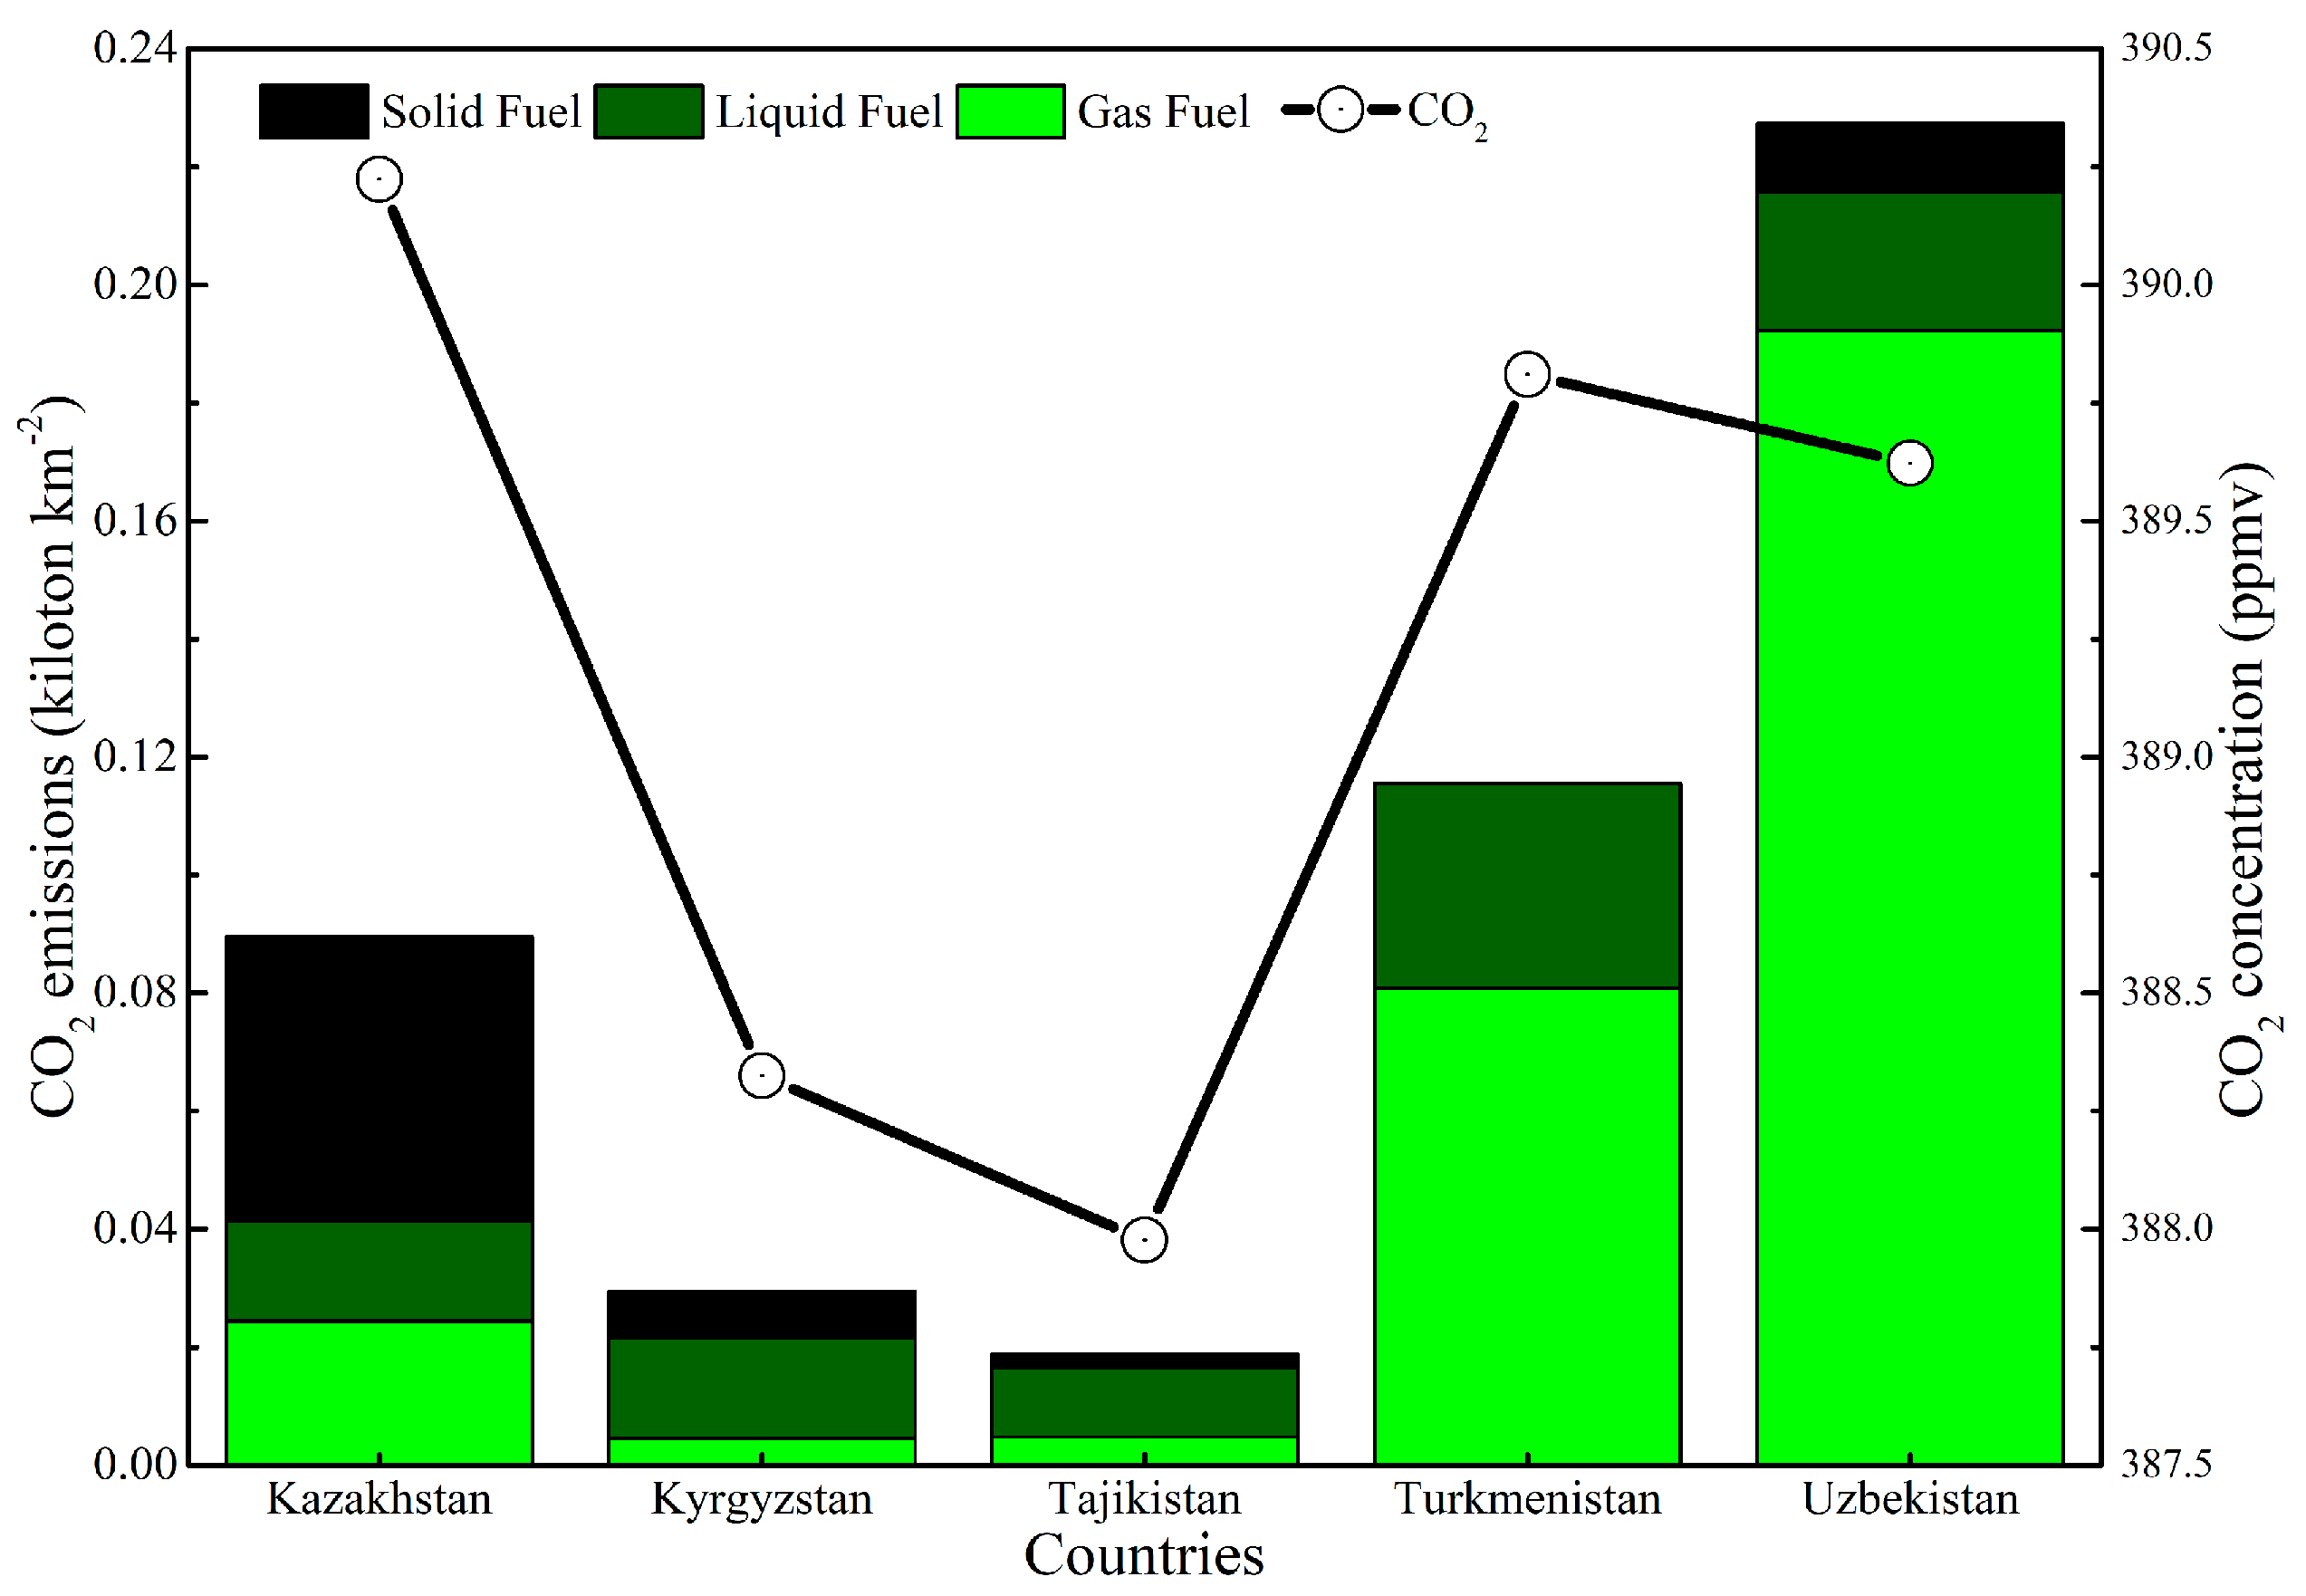
4.2. Factors Affecting the Spatial Distribution of CO2 Concentrations in Central Asia

Figure 5 shows the distribution of the direction and velocity of the prevailing winds in Central Asia in 2010 (January 2010~December 2010), and the distribution of the near-surface CO2 concentrations is represented by contours. Northern Central Asia is affected by southeasterly winds, its western region is affected by westerly winds, and its southern regions that border Afghanistan are affected by southerly winds. The five Central Asian countries are characterized by lower topography in the west and higher topography in the east, especially in the Tianshan Mountains and Pamir Plateau (Figure 1). Because of the unique geographic location, all of the surrounding countries and regions, except for Afghanistan, northern Pakistan, southern India, and western Xinjiang, China, have high CO2 emissions. Due to the synergistic effect of these three factors, the CO2 concentrations in the northern, western, and southwestern areas of the five Central Asian countries are high, and the concentrations in the central, eastern, southern, and southeastern areas are low.
To determine the effect of wind on the five Central Asian countries, we delimited a rectangular region of interest (Figure 5). The region has a small population, and the vegetation coverage is approximately constant. Therefore, in the absence of CO2 diffusion, the CO2 concentrations in this region should be approximately constant. However, the CO2 contours clearly show that due to the wind, the CO2 concentrations are higher in the west and lower in the east. The distance between the CO2 contours represents the effect of CO2 being carried by the wind to this region from the west. From west to east, the distance between the CO2 contours first increases gradually toward the center of Central Asia and then decreases gradually. This indicates that the diffusion of CO2 by the wind gradually decreases from west to east. East of the center of the study area, the continental ecosystem plays a controlling role in the CO2 concentrations. We can explain the factors that control the CO2 in this region by selecting several study areas and extracting the NPP and the corresponding mean CO2 concentrations in these areas.
We first uniformly select 23 sampling areas in the five Central Asian countries and nearby regions using equal rectangular boxes and summarize the average NPP and near-surface mean CO2 concentrations in these sampling areas (Figure 6). The NPP and CO2 concentration are negatively correlated, but the correlation is very weak (R2 = 0.184, p < 0.05) (Figure 6a,b). When we eliminate the sampling areas near boundaries that are strongly affected by wind and only use the sampling areas in the central and eastern regions, the NPP and CO2 concentrations show a strong negative correlation (R2 = 0.756, p < 0.001) (Figure 6c,d).
In summary, the CO2 concentrations of the five Central Asian countries are generally not statistically correlated with the continental ecosystem because they are affected by the topography, wind velocity, and wind direction. However, due to the decreasing effect of wind on CO2 diffusion from the west, the continental ecosystem plays a controlling role in the spatial distribution of the near-surface CO2 concentrations in the central and eastern regions.
Figure 7 shows the relationship between the CO2 emissions due to energy consumption in the five Central Asian countries and the near-surface CO2 concentrations. The CO2 concentrations and the energy consumptions are not statistically correlated at the national scale. This conclusion is contrary to that of the study on China by Hou [39]. The reason may be that the near-surface CO2 in Central Asia is affected by CO2 diffusion from surrounding regions. This result indicates that the distribution of the near-surface CO2 concentrations in the five Central Asian countries is mainly affected by the CO2 emitted by surrounding countries. The CO2 produced by energy consumption in this region has an insignificant effect on the distribution of the CO2 concentrations in this region.
Because of the gradually weakening effect of diffusion of CO2 from the west by wind and blocking by the Tianshan Mountains and Pamir Plateau, the Xinjiang region is not affected by the diffusion of CO2 from the west. Due to the unique topography, in which three mountain ranges separate two basins, the CO2 concentrations in Xinjiang are not affected by the diffusion of CO2 from outside regions. The CO2 distribution map for 2010 shows that the CO2 concentrations in northern Xinjiang are significantly higher than those in southern Xinjiang, and these regions are separated by the Tianshan Mountains (Figure 8a). An analysis of the CO2 emissions due to energy consumption in different cities in Xinjiang and the NPP data from Xinjiang demonstrates that the spatial heterogeneity of the CO2 distribution in Xinjiang is mainly caused by energy consumption and the diffusion of CO2 (Figure 8b). The energy consumption in the Altai and Tacheng regions in northern Xinjiang is low; however, due to the effect of the northwesterly wind, the CO2 concentrations are very high. The NPP has an insignificant effect in Xinjiang.

5. Conclusions

This study used the GOSAT near-surface product and relevant auxiliary data to study the spatial and temporal distributions of near-surface CO2 concentrations in Central Asia and their controlling factors. The main conclusions are summarized below:
(1)
The near-surface CO2 product inverted from the GOSAT data is strongly correlated with data from the nine stations that surround Central Asia. The correlation coefficients are all higher than 0.7, and the mean monthly deviation is less than 2 ppmv. The GOSAT results are highly accurate and stable and can be used to capture the seasonal and annual variations of near-surface CO2.
(2)
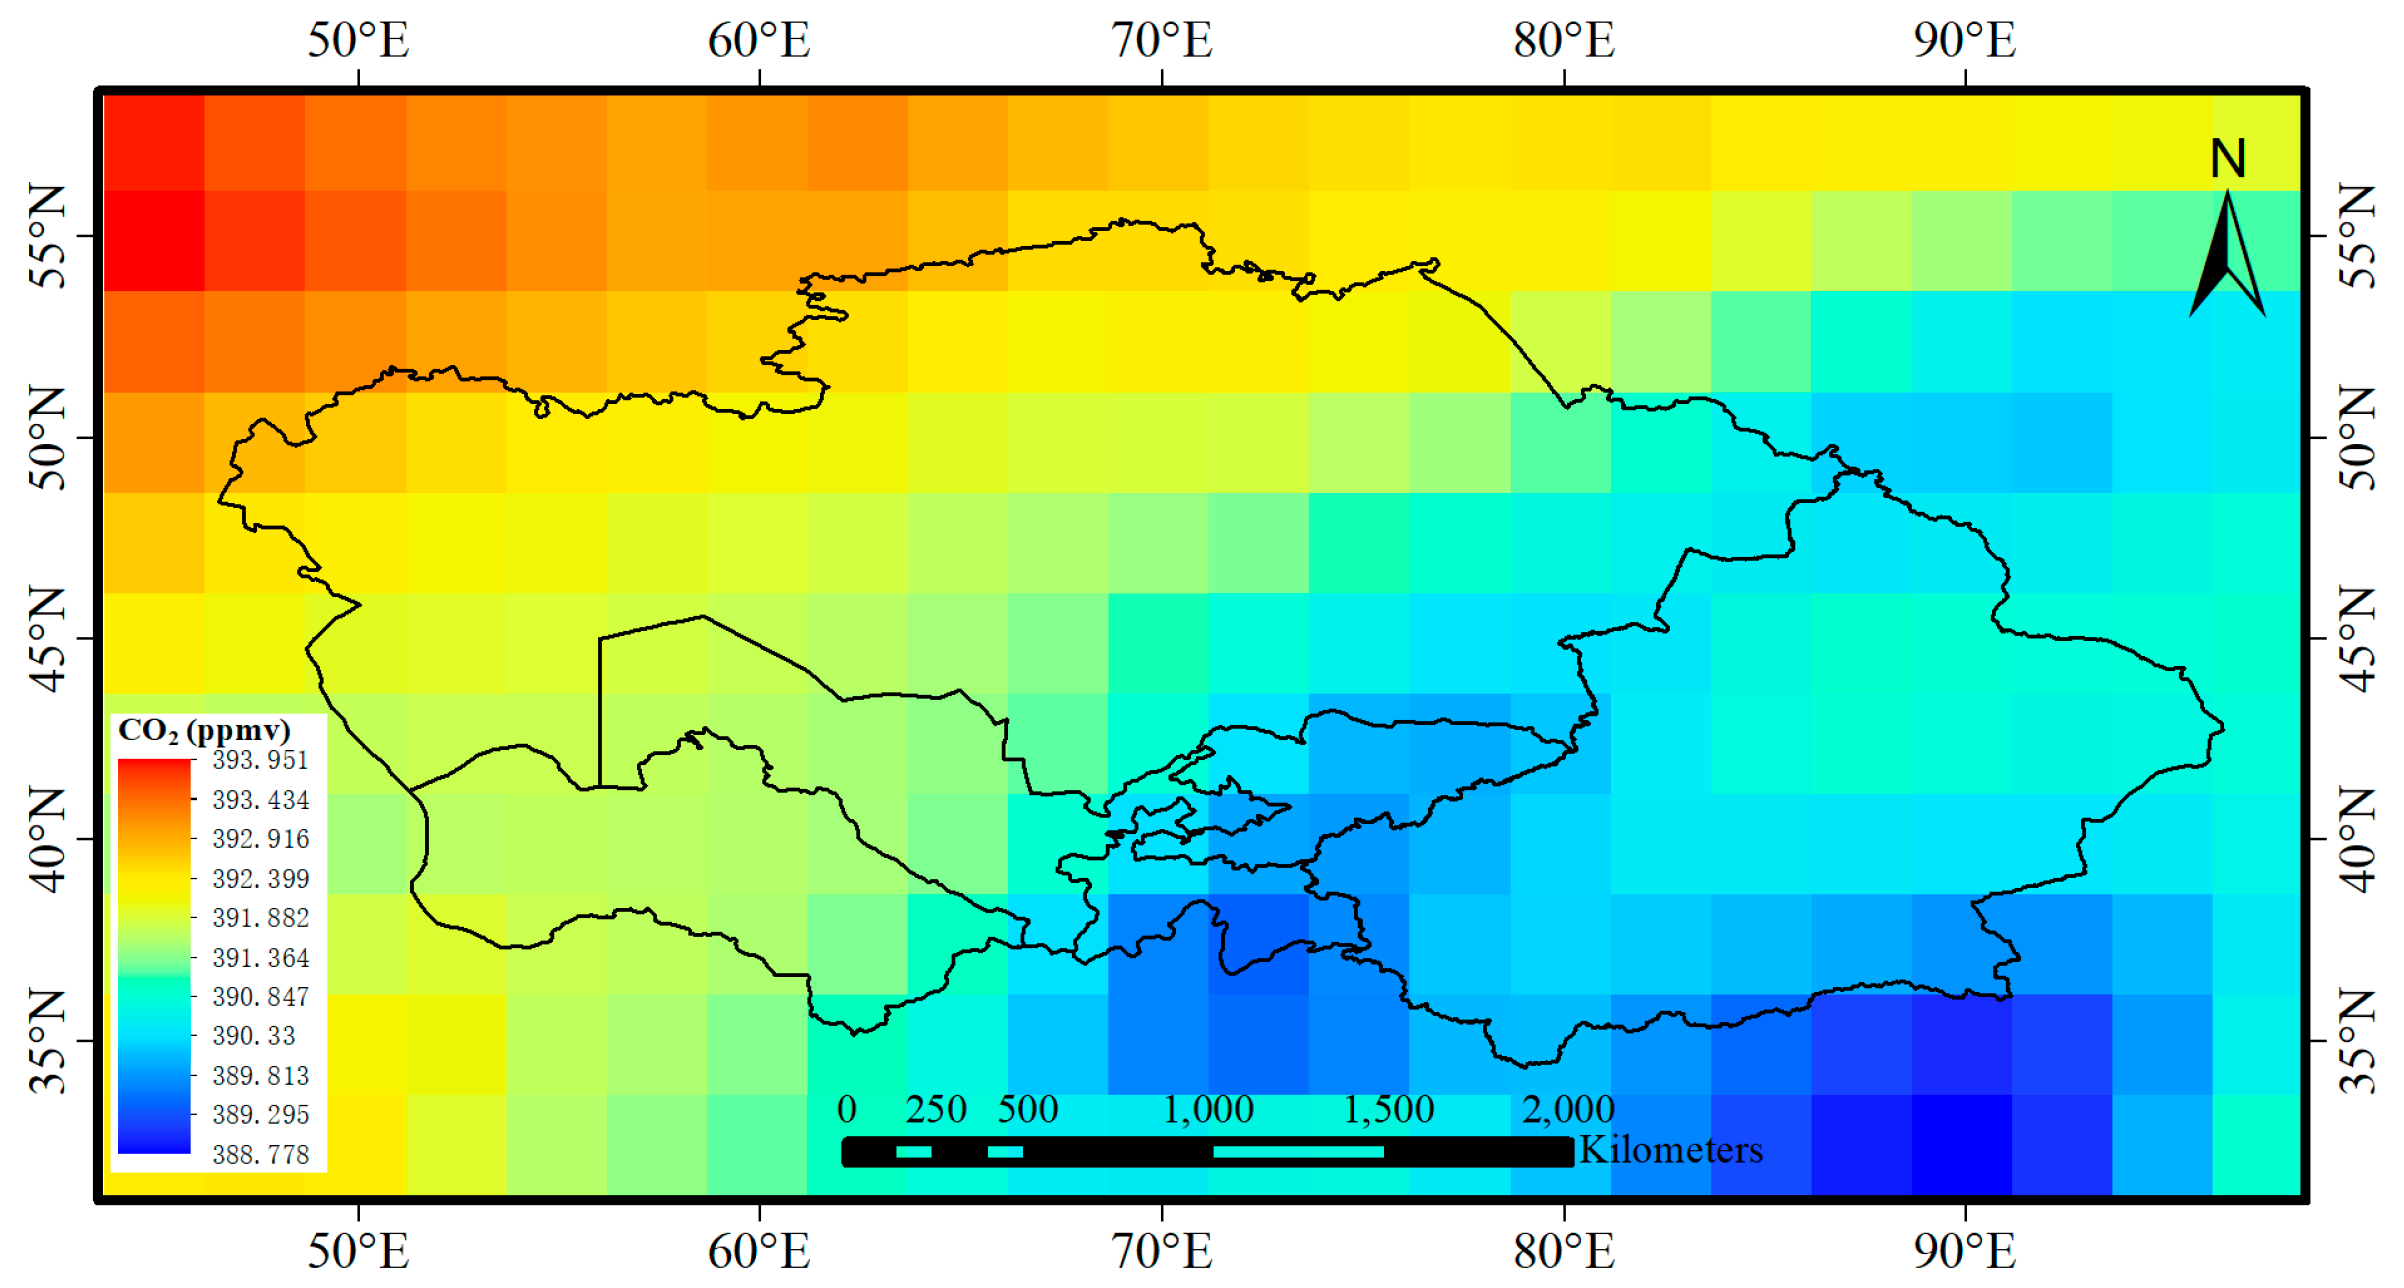
The near-surface CO2 concentrations in Central Asia are regionally heterogeneous. CO2 concentrations in the western arid region are higher than those in the east. The near-surface CO2 concentrations are lower in high altitude areas, namely, in the Altai Mountains, Tianshan Mountains, Pamir Plateau, and Kunlun Mountains.
(3)
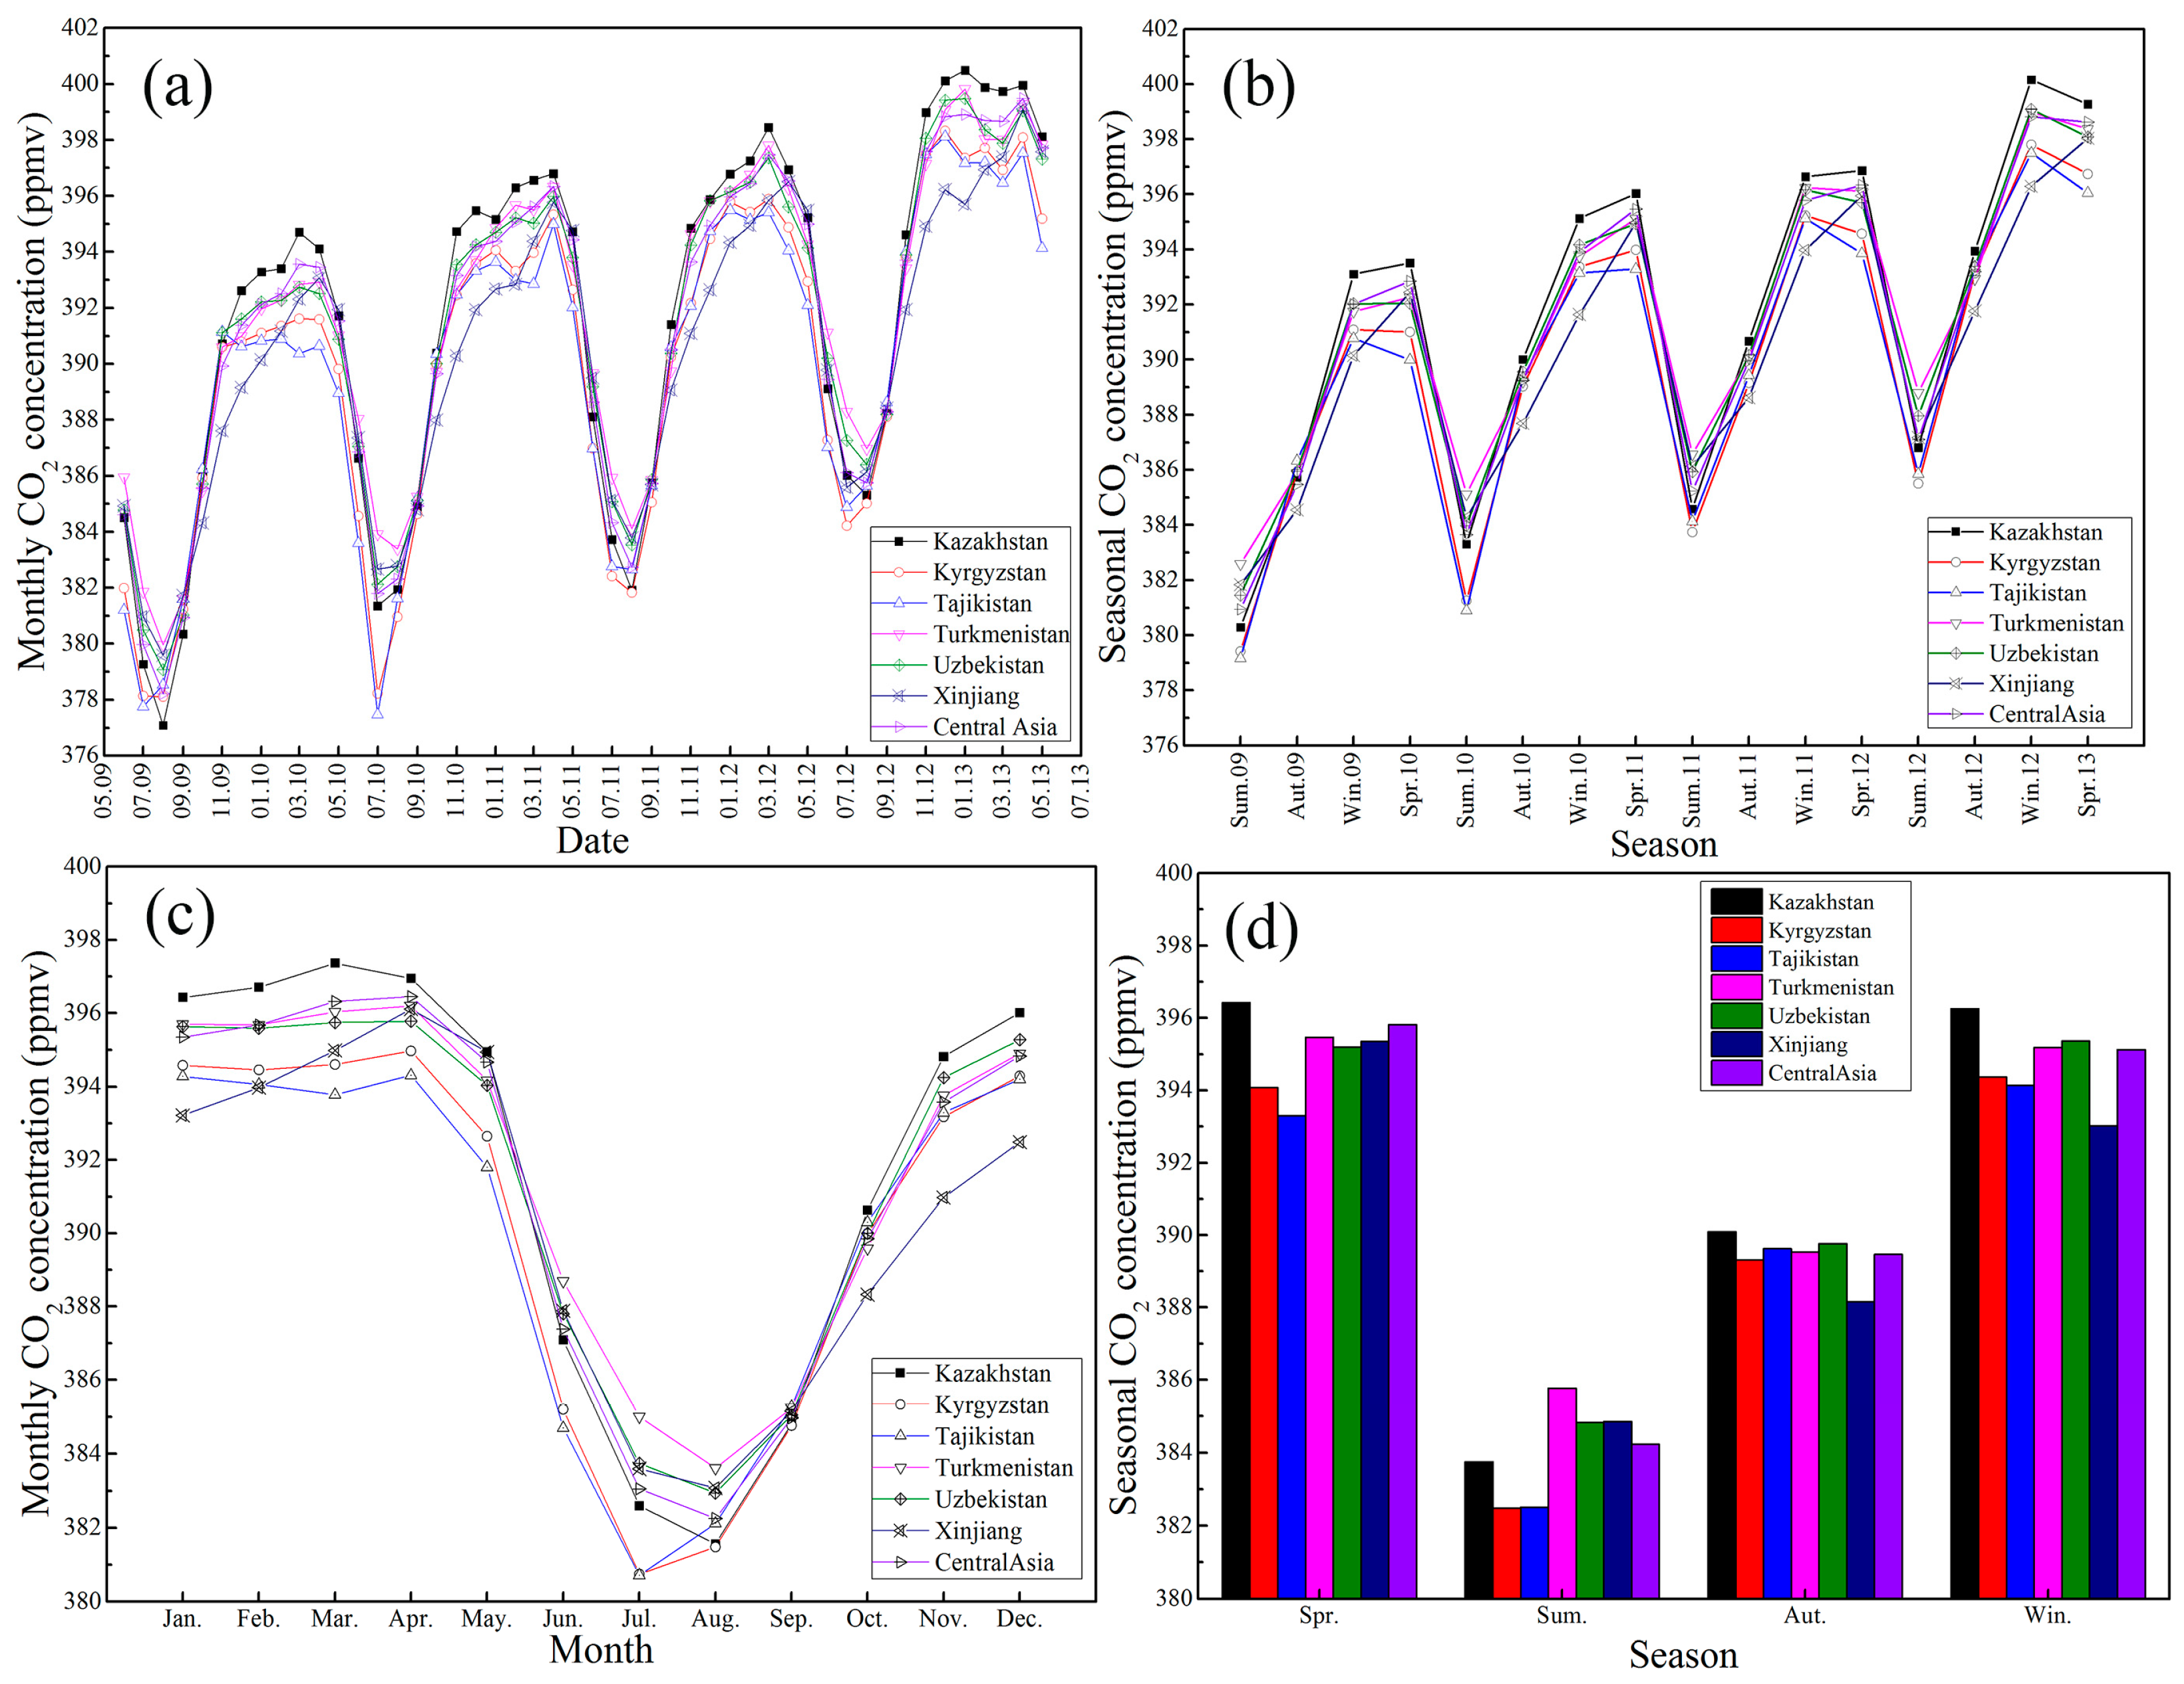
The near-surface CO2 concentrations in Central Asia have an annual increasing trend. The annual mean rate of increase is 2.207 ppmv/a. The near-surface CO2 concentrations of each season increase compared with the preceding years. The near-surface CO2 concentrations of each month are higher than those of the corresponding months of the previous year in Central Asia. The near-surface CO2 concentrations have seasonal and monthly cycles.
(4)
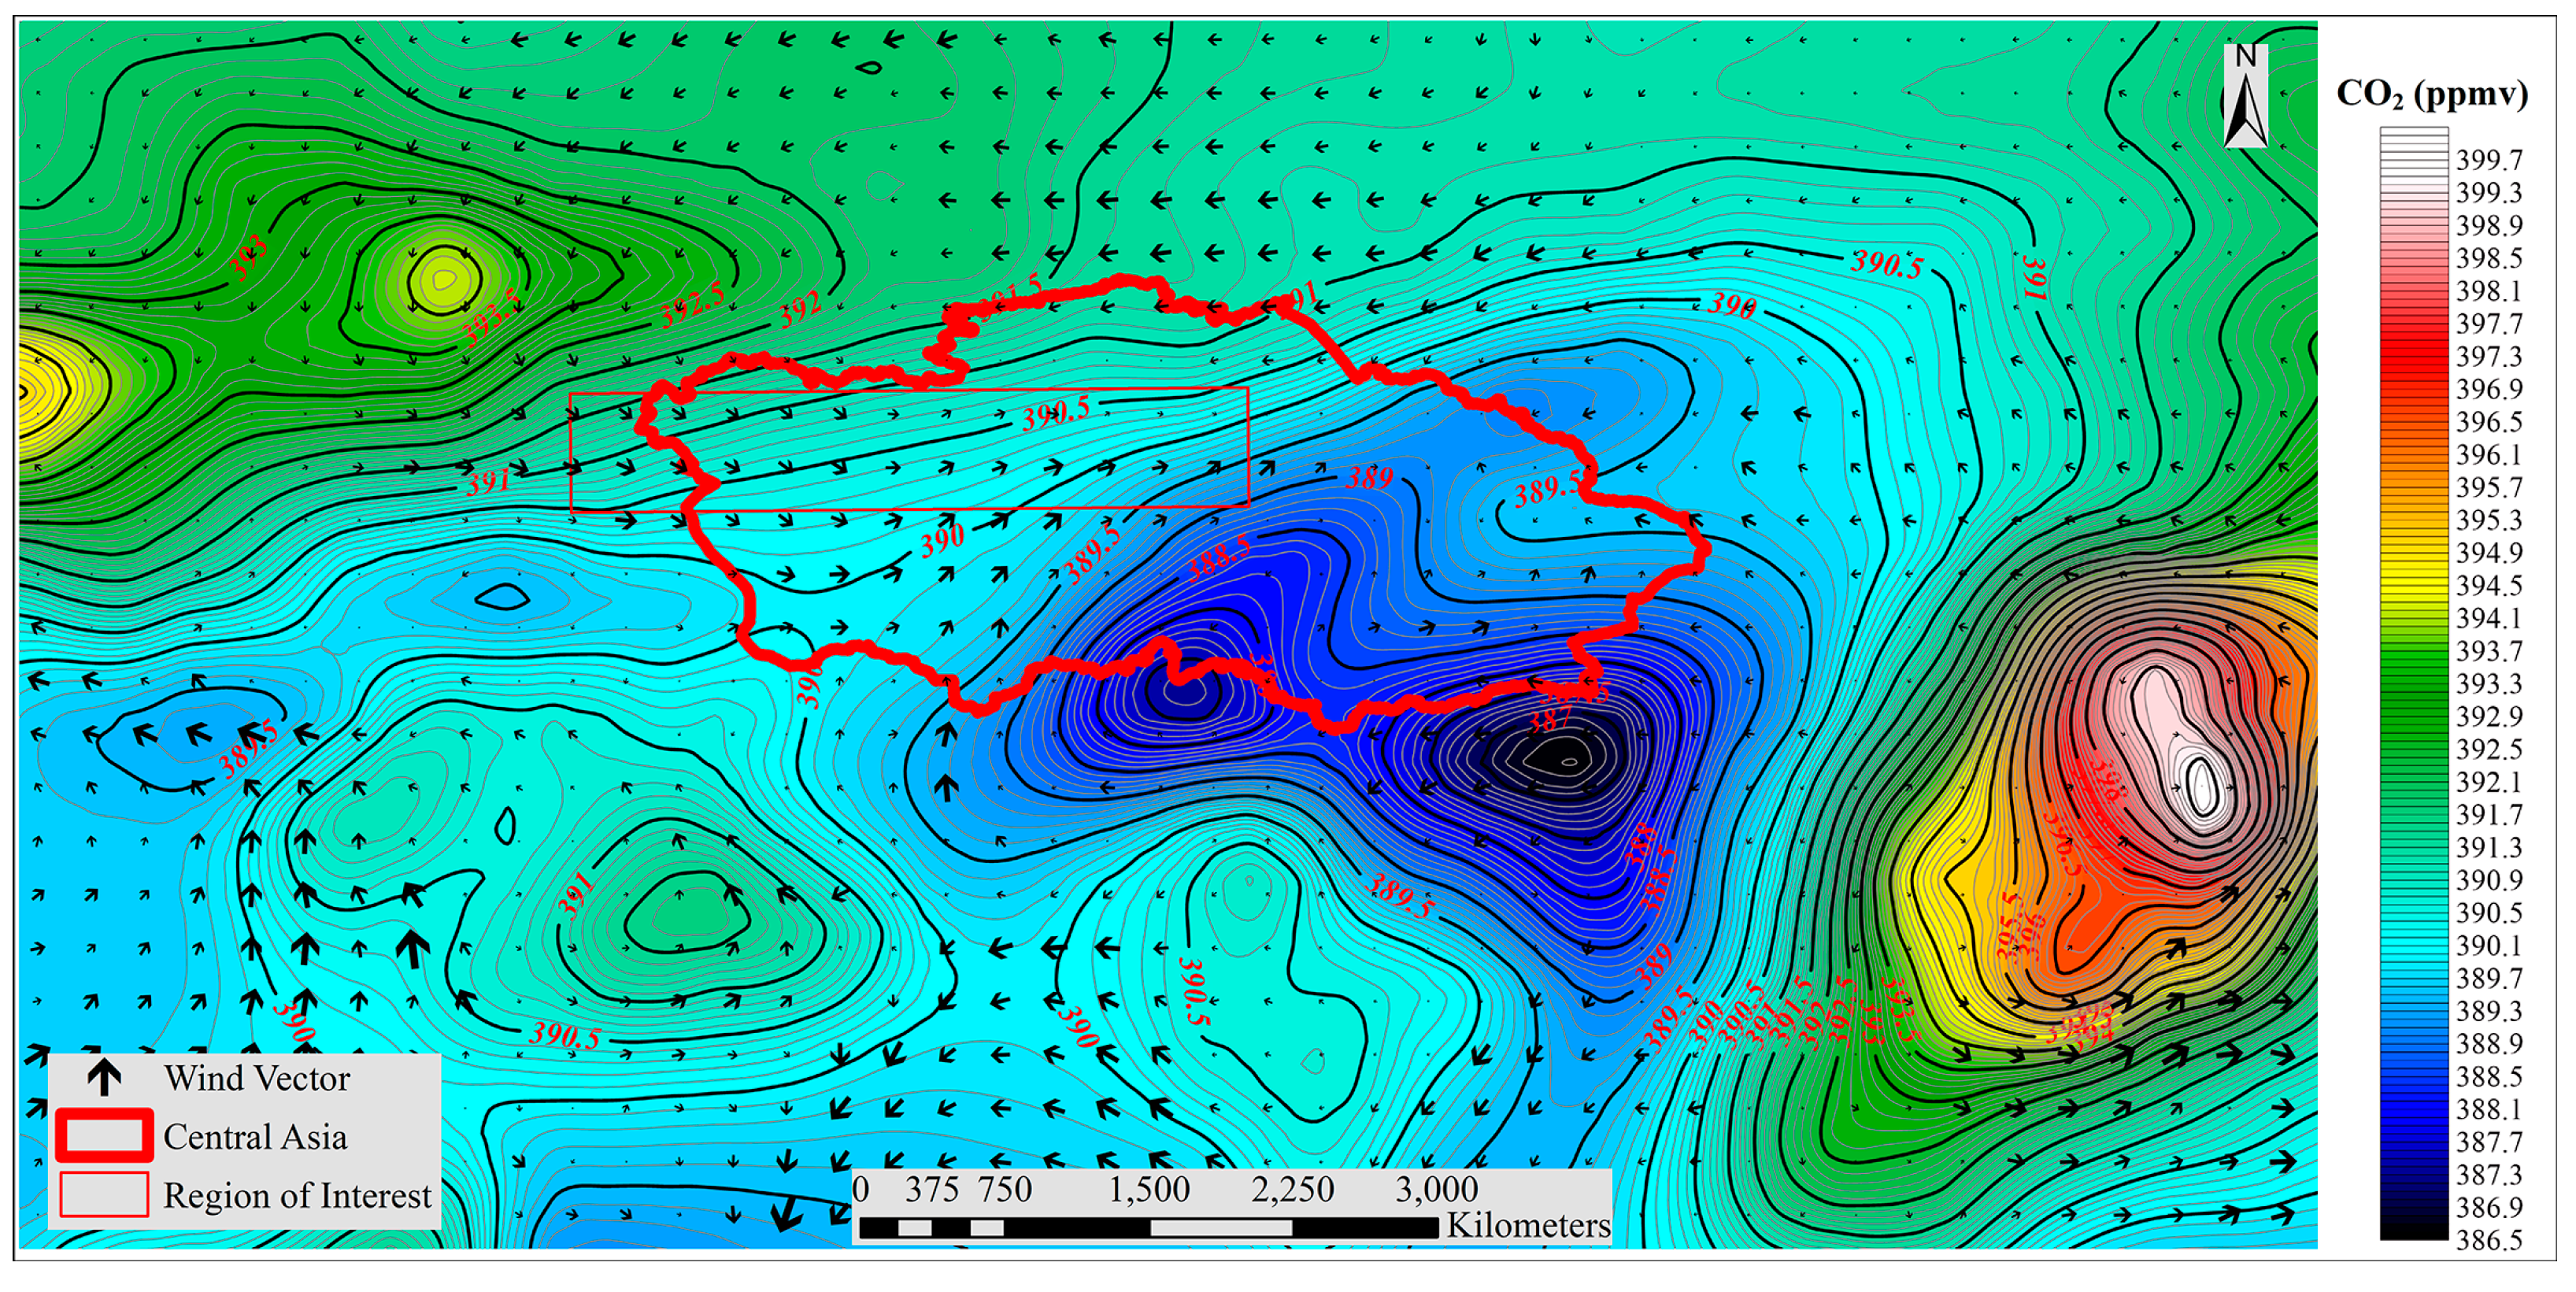
The temporal variations of the near-surface CO2 concentrations in Central Asia are mainly affected by the photosynthesis/respiration of the continental ecosystem and heating. The controlling factors are different during the different seasons. Due to the topography and the prevailing winds, the spatial distribution of the CO2 concentrations in the five Central Asian countries is mainly affected by the CO2 emissions from surrounding countries. Due to the gradual decrease in the diffusion of CO2, the central, eastern, and southeastern regions of the five Central Asian countries are significantly affected by the NPP. At the national scale, the near-surface CO2 concentrations of the five Central Asian countries are not significantly related to energy consumption. Due to the topography, the CO2 concentrations in Xinjiang are not significantly affected by the diffusion of CO2 from outside regions; the spatial heterogeneity is mainly affected by energy consumption and the prevailing winds, and the NPP has an insignificant effect on the CO2 concentrations.
Although this study analyzed the controlling factors of the temporal distribution of the near-surface CO2 concentrations in Central Asia, we cannot perform a verification of the analyses because this region lacks monthly scale NPP and energy consumption data. In addition, because the time scale of the GOSAT data is short, we only have GOSAT data for four years. Therefore, the analysis in this study has some level of uncertainty; however, the magnitude of the uncertainty is unclear. Furthermore, the accuracy in detecting CO2 concentration levels is influenced by the absorption and scattering from aerosols and clouds. Large expanses of desert with high aerosol dust loads and complex topography in Central Asia may lead to significant biases in the GOSAT retrieval, although CAI is used to correct for these effects. Due to the lack of ground-based CO2 observations in Central Asia, the accuracy of near-surface CO2 concentration levels was verified based on sites around the study area. It is unclear whether the verification results reflect the actual precision of the GOSAT in Central Asia. These questions will be the focus of a future study.

Acknowledgments

This research was supported by the National Natural Science Foundation of China (Grant No. 41361140361), the National Basic Research Programs of China (Grant No. 2014CB954204) and the National Natural Science Foundation of China (Grant No. 31570536). This study was also supported by the International Cooperation Training Program of Innovative Talent in 2016, China Scholarship Council (Grant No. 201600090208), and the Sino-Belgian Personnel Training Program for Geo-information.

Author Contributions

Liangzhong Cao, Xi Chen, Chi Zhang, Alishir Kurban, and Philippe De Maeyer provided datasets, performed the experiments, and wrote the paper; Liangzhong Cao, Xiuliang Yuan, and Tao Pan designed the experiments.

Conflicts of Interest

The authors declare no conflict of interest.

References

  1. Bindoff, N.L.; Stott, P.A.; AchutaRao, K.M.; Allen, M.R.; Gillett, N.; Gutzler, D.; Hansingo, K.; Hegerl, G.; Hu, Y.; Jain, S.; et al. Detection and attribution of climate change: From global to regional. In Climate Change 2013: The Physical Science Basis. Contribution of Working Group I to the Fifth Assessment Report of the Intergovernmental Panel on Climate Change; Stocker, T.F., Qin, D., Plattner, G.-K., Tignor, M., Allen, S.K., Boschung, J., Nauels, A., Xia, Y., Bex, V., Midgley, P.M., Eds.; Cambridge University Press: Cambridge, UK; New York, NY, USA, 2013; pp. 867–952. ISBN 978-1-107-05799-1. [Google Scholar]
  2. Shaw, M.R.; Zavaleta, E.S.; Chiariello, N.R.; Cleland, E.E.; Mooney, H.A.; Field, C.B. Grassland responses to global environmental changes suppressed by elevated CO2. Science 2002, 298, 1987–1990. [Google Scholar] [CrossRef] [PubMed]
  3. Zeng, N.; Zhao, F.; Collatz, G.J.; Kalnay, E.; Salawitch, R.J.; West, T.O.; Guanter, L. Agricultural green revolution as a driver of increasing atmospheric CO2 seasonal amplitude. Nature 2014, 515, 394–397. [Google Scholar] [CrossRef] [PubMed]
  4. Graham, E.A.; Nobel, P.S. Long-term effects of a doubled atmospheric CO2 concentration on the cam species agave deserti. J. Exp. Bot. 1996, 47, 61–69. [Google Scholar] [CrossRef]
  5. Hamerlynck, E.P.; Huxman, T.E.; Charlet, T.N.; Smith, S.D. Effects of elevated CO2 (FACE) on the functional ecology of the drought-deciduous Mojave Desert shrub, Lycium andersonii. Environ. Exp. Bot. 2002, 48, 93–106. [Google Scholar] [CrossRef]
  6. Leakey, A.D.B.; Uribelarrea, M.; Ainsworth, E.A.; Naidu, S.L.; Rogers, A.; Ort, D.R.; Long, S.P. Photosynthesis, productivity, and yield of maize are not affected by open-air elevation of CO2 concentration in the absence of drought. Plant Physiol. 2006, 140, 779–790. [Google Scholar] [CrossRef] [PubMed]
  7. Lessin, R.C.; Ghini, R. Effect of increased atmospheric CO2 concentration on powdery mildew and growth of soybean plants. Trop. Plant. Pathol. 2009, 34, 385–392. [Google Scholar] [CrossRef]
  8. Li, C.F.; Zhang, C.; Luo, G.P.; Chen, X. Modeling the carbon dynamics of the dryland ecosystems in Xinjiang, China from 1981 to 2007—The spatiotemporal patterns and climate controls. Ecol. Model. 2013, 267, 148–157. [Google Scholar] [CrossRef]
  9. Butz, A.; Hasekamp, O.P.; Frankenberg, C.; Aben, I. Retrievals of atmospheric CO2 from simulated space-borne measurements of backscattered near-infrared sunlight: Accounting for aerosol effects. Appl. Opt. 2009, 48, 3322–3336. [Google Scholar] [CrossRef] [PubMed]
  10. Feng, L.; Palmer, P.I.; Bösch, H.; Dance, S. Estimating surface CO2 fluxes from space-borne CO2 dry air mole fraction observations using an ensemble kalman filter. Atmos. Chem. Phys. 2009, 9, 2619–2633. [Google Scholar] [CrossRef]
  11. Nevison, C.D.; Mahowald, N.M.; Doney, S.C.; Lima, I.D.; Van der Werf, G.R.; Randerson, J.T.; Baker, D.F.; Kasibhatla, P.; McKinley, G.A. Contribution of ocean, fossil fuel, land biosphere, and biomass burning carbon fluxes to seasonal and interannual variability in atmospheric CO2. J. Geophys. Res. Biogeosci. 2008. [Google Scholar] [CrossRef]
  12. O’Dell, C.W.; Connor, B.; Bösch, H.; O’Brien, D.; Frankenberg, C.; Castano, R.; Christi, M.; Eldering, D.; Fisher, B.; Gunson, M.; et al. The ACOS CO2 retrieval algorithm—Part 1: Description and validation against synthetic observations. Atmos. Meas. Tech. 2012, 5, 99–121. [Google Scholar] [CrossRef]
  13. Reuter, M.; Buchwitz, M.; Schneising, O.; Heymann, J.; Bovensmann, H.; Burrows, J.P. A method for improved SCIAMACHY CO2 retrieval in the presence of optically thin clouds. Atmos. Meas. Tech. 2010, 3, 209–232. [Google Scholar] [CrossRef]
  14. Baker, D.F.; Bosch, H.; Doney, S.C.; O’Brien, D.; Schimel, D.S. Carbon source/sink information provided by column CO2 measurements from the Orbiting Carbon Observatory. Atmos. Chem. Phys. 2010, 10, 4145–4165. [Google Scholar] [CrossRef]
  15. Schneising, O.; Buchwitz, M.; Reuter, M.; Heymann, J.; Bovensmann, H.; Burrows, J.P. Long-term analysis of carbon dioxide and methane column-averaged mole fractions retrieved from SCIAMACHY. Atmos. Chem. Phys. 2011, 11, 2863–2880. [Google Scholar] [CrossRef]
  16. Aumann, H.H.; Gregorich, D.; Gaiser, S. AIRS hyper-spectral measurements for climate research: Carbon dioxide and nitrous oxide effects. Geophys. Res. Lett. 2005, 32, L05806. [Google Scholar] [CrossRef]
  17. Chahine, M.; Barnet, C.; Olsen, E.T.; Chen, L.; Maddy, E. On the determination of atmospheric minor gases by the method of vanishing partial derivatives with application to CO2. Geophys. Res. Lett. 2005, 32, L22803. [Google Scholar] [CrossRef]
  18. Hungershoefer, K.; Breon, F.M.; Peylin, P.; Chevallier, F.; Rayner, P.; Klonecki, A.; Houweling, S.; Marshall, J. Evaluation of various observing systems for the global monitoring of CO2 surface fluxes. Atmos. Chem. Phys. 2010, 10, 10503–10520. [Google Scholar] [CrossRef]
  19. Crevoisier, C.; Chedin, A.; Matsueda, H.; Machida, T.; Armante, R.; Scott, N.A. First year of upper tropospheric integrated content of CO2 from IASI hyperspectral infrared observations. Atmos. Chem. Phys. 2009, 9, 4797–4810. [Google Scholar] [CrossRef]
  20. Bovensmann, H.; Burrows, J.P.; Buchwitz, M.; Frerick, J.; Noël, S.; Rozanov, V.V.; Chance, K.V.; Goede, A.P.H. SCIAMACHY: Mission objectives and measurement modes. J. Atmos. Sci. 1999, 56, 127–150. [Google Scholar] [CrossRef]
  21. Noël, S.; Bovensmann, H.; Burrows, J.P.; Frerick, J.; Chance, K.V.; Goede, A.H.P. Global atmospheric monitoring with SCIAMACHY. Phys. Chem. Earth Part C 1999, 24, 427–434. [Google Scholar] [CrossRef]
  22. Yokota, T.; Yoshida, Y.; Eguchi, N.; Ota, Y.; Tanaka, T.; Watanabe, H.; Maksyutov, S. Global concentrations of CO2 and CH4 retrieved from GOSAT: First preliminary results. SOLA 2009, 5, 160–163. [Google Scholar] [CrossRef]
  23. Yoshida, Y.; Ota, Y.; Eguchi, N.; Kikuchi, N.; Nobuta, K.; Tran, H.; Morino, I.; Yokota, T. Retrieval algorithm for CO2 and CH4 column abundances from short-wavelength infrared spectral observations by the greenhouse gases observing satellite. Atmos. Meas. Tech. 2011, 4, 717–734. [Google Scholar] [CrossRef]
  24. Wang, Q.; Lei, L.P.; Liu, D.; Liu, M.; Qin, X.C.; Sun, B.M. Temporal and spatial analysis of global gosat XCO2 variations characteristics. Proc. SPIE 2015. [Google Scholar] [CrossRef]
  25. Zhao, J.; Cui, W.H.; Sun, Y.H. Spatial and temporal distribution characteristics of near-surface CO2 concentration over China based on GOSAT data. In Proceedings of the Remote Sensing and Modeling of the Atmosphere, Oceans, and Interactions, Beijing, China, 15–16 October 2014. [Google Scholar]
  26. Morino, I.; Uchino, O.; Inoue, M.; Yoshida, Y.; Yokota, T.; Wennberg, P.O.; Toon, G.C.; Wunch, D.; Roehl, C.M.; Notholt, J.; et al. Preliminary validation of column-averaged volume mixing ratios of carbon dioxide and methane retrieved from GOSAT short-wavelength infrared spectra. Atmos. Meas. Tech. 2011, 4, 1061–1076. [Google Scholar] [CrossRef]
  27. Lindqvist, H.; O’Dell, C.W.; Basu, S.; Boesch, H.; Chevallier, F.; Deutscher, N.; Feng, L.; Fisher, B.; Hase, F.; Inoue, M.; et al. Does GOSAT capture the true seasonal cycle of carbon dioxide? Atmos. Chem. Phys. 2015, 15, 13023–13040. [Google Scholar] [CrossRef]
  28. Takagi, H.; Andres, R.; Belikov, D.; Bril, A.; Boesch, H.; Butz, A.; O’Dell, C.; Oshchepkov, S.; Parker, R.; Saito, M. Influence of differences in latest GOSAT XCO2 products on surface CO2 flux estimation. Geophys. Res. Lett. 2014, 41, 2598–2605. [Google Scholar] [CrossRef]
  29. Guo, L.; Lei, L.; Zeng, Z. Spatiotemporal correlation analysis of satellite-observed CO2: Case studies in China and USA. In Proceedings of the 2013 IEEE International Geoscience and Remote Sensing Symposium, Melbourne, Australia, 21–26 July 2013. [Google Scholar]
  30. Tadi, J.M.; Loewenstein, M.; Frankenberg, C.; Butz, A.; Roby, M.; Iraci, L.T.; Yates, E.L.; Gore, W.; Kuze, A. A comparison of in situ aircraft measurements of carbon dioxide and methane to GOSAT data measured over railroad Valley Playa, Nevada, USA. IEEE Trans. Geosci. Remote Sens. 2014, 52, 7764–7774. [Google Scholar] [CrossRef]
  31. Li, C.F.; Zhang, C.; Luo, G.P.; Chen, X.; Maisupova, B.; Madaminov, A.A.; Han, Q.F.; Djenbaev, B.M. Carbon stock and its responses to climate change in Central Asia. Glob. Chang. Biol. 2015, 21, 1951–1967. [Google Scholar] [CrossRef] [PubMed]
  32. Lioubimtseva, E.; Henebry, G.M. Climate and environmental change in arid Central Asia: Impacts, vulnerability, and adaptations. J. Arid Environ. 2009, 73, 963–977. [Google Scholar] [CrossRef]
  33. Saitoh, N.; Imasu, R.; Ota, Y.; Niwa, Y. CO2 retrieval algorithm for the thermal infrared spectra of the Greenhouse Gases Observing Satellite: Potential of retrieving CO2 vertical profile from high-resolution fts sensor. J. Geophys. Res. 2009, 114, D17305. [Google Scholar] [CrossRef]
  34. Maksyutov, S.; Takagi, H.; Valsala, V.K.; Saito, M.; Oda, T.; Saeki, T.; Belikov, D.A.; Saito, R.; Ito, A.; Yoshida, Y.; et al. Regional CO2 flux estimates for 2009–2010 based on GOSAT and ground-based CO2 observations. Atmos. Chem. Phys. 2013, 13, 9351–9373. [Google Scholar] [CrossRef]
  35. Berezin, E.V.; Konovalov, I.B.; Ciais, P.; Richter, A.; Tao, S.; Janssens-Maenhout, G.; Beekmann, M.; Schulze, E.D. Multiannual changes of CO2 emissions in China: Indirect estimates derived from satellite measurements of tropospheric NO2 columns. Atmos. Chem. Phys. 2013, 13, 9415–9438. [Google Scholar] [CrossRef]
  36. Department of Energy Statistics, National Bureau of Statistics, People’s Republic of China. China Statistical Yearbook 2010; China Statistics Press: Beijing, China, 2010; pp. 168–211. ISBN 978-7-5037-6070-9/C.2424. [Google Scholar]
  37. Ciattaglia, L. Interpretation of atmospheric CO2 measurements at Mt. Cimone (Italy) related to wind data. J. Geophys. Res. 1983, 88, 1331–1338. [Google Scholar] [CrossRef]
  38. Rayner, P.J.; O’Brien, D.M. The utility of remotely sensed CO2 concentration data in surface source inversions. Geophys. Res. Lett. 2001, 28, 2429. [Google Scholar] [CrossRef]
  39. Hou, Y.F.; Wang, S.X.; Zhou, Y.; Yan, F.L.; Zhu, J.F. Analysis of the carbon dioxide concentration in the lowest atmospheric layers and the factors affecting China based on satellite observations. Int. J. Remote Sens. 2013, 34, 1981–1994. [Google Scholar] [CrossRef]
Figure 1. The study area and the topography in Central Asia.
Atmosphere 08 00085 g001
Figure 2. The comparison of CO2 concentrations from GOSAT and nine ground-based station observations during June 2009 to May 2013.
Atmosphere 08 00085 g002
Figure 3. Annual average distribution of the near-surface CO2 concentrations from June 2009 to May 2013 over Central Asia.
Atmosphere 08 00085 g003
Figure 4. The near-surface (975 hPa) CO2 concentrations variation in different regions of Central Asia based on GOSAT data from June 2009 to May 2013. (a) Monthly variation; (b) Seasonal variation; (c) The multi-year mean monthly concentration; (d) The multi-year mean seasonal concentration.
Atmosphere 08 00085 g004
Figure 5. The prevailing winds and near-surface CO2 isoclines over Central Asia and surrounding areas.
Atmosphere 08 00085 g005
Figure 6. The relationship between yearly average net primary production (NPP) spatial distribution and yearly average of near-surface CO2 concentrations over the five Central Asian countries in 2010. (a) Uniform sampling in the five Central Asian countries; (b) The relationship between near-surface CO2 concentration and NPP; (c) Uniform sampling in the central and eastern regions; (d) The relationship between near-surface CO2 concentration and NPP.
Atmosphere 08 00085 g006
Figure 7. The relationship between annual anthropogenic CO2 emission and yearly average of near-surface CO2 concentrations in 2010.
Atmosphere 08 00085 g007
Figure 8. Energy consumption, prevailing winds, and annual total NPP spatial distribution over Xinjiang, China in 2010. (a) Near-surface CO2 concentrations and prevailing winds in Xinjiang; (b) average annual NPP spatial distribution and energy consumption in Xinjiang.
Atmosphere 08 00085 g008
Table 1. Comparison of near-surface CO2 concentrations retrieved from Greenhouse Gases Observing Satellite (GOSAT) with ground-based observation from June 2009 to May 2013. *** indicates significance level (p < 0.001).
Site NamesGround−Base StationYearly Growth (ppmv/a)Monthly Average (ppmv)
Coordinate (°)Altitude (m)GroundSatelliteDeviationGroundSatelliteDeviationR
Assekrem23.27° N, 5.63° E27102.0311.7580.273391.235391.0280.2070.975 ***
Baltic Sea55.35° N, 17.22° E282.2832.715−0.432393.778392.2591.5190.950 ***
Cape Rama15.08° N, 73.83° E602.2751.3070.968394.960391.3463.6140.710 ***
King’s Park22.31° N, 114.17° E654.4331.9772.456403.771401.3402.4310.852 ***
Pallas67.97° N, 24.12° E5602.1572.526−0.369394.285393.5270.7570.960 ***
Shangdianzi40.65° N, 117.12° E2872.0702.204−0.134399.035399.135−0.1000.757 ***
Teriberka69.2° N, 35.1° E402.0562.344−0.289394.138393.1490.9890.974 ***
Tiksi71.59° N, 128.92° E82.9962.8070.189396.667395.7910.8750.979 ***
Westerland54.93° N, 8.32° E124.3344.940−0.607399.994396.4493.5450.965 ***
Average 2.7372.5090.228396.429394.8921.5370.902 ***
Table 2. The seasonal and annual CO2 concentration variations in different regions of Central Asia from June 2009 to May 2013.
AreasYearly Average (ppmv)Annual Growth (ppmv/a)Seasonal Average (ppmv)Seasonal Fluctuation (ppmv)
SpringSummerAutumnWinterAverageMaximumMinimum
Kazakhstan391.6632.296396.422383.749390.091396.2576.33612.6730.165
Kyrgyzstan390.0762.145394.074382.478389.309394.3715.94611.5960.297
Tajikistan389.9032.209393.296382.511389.622394.1375.81310.7850.841
Turkmenistan391.5492.217395.469385.769389.529395.1794.8509.7000.291
Uzbekistan391.3212.253395.190384.830389.764395.3635.26710.3610.173
Xinjiang390.3942.023395.347384.852388.153393.0135.24810.4952.334
Central Asia391.2012.207395.818384.230389.467395.1275.79411.5880.691

