Article

Seasonal Variation and Health Risk Assessment of Heavy Metals in PM2.5 during Winter and Summer over Xi’an, China

1
Department of Environmental Sciences and Engineering, Xi’an Jiaotong University, Xi’an 710049, China
2
SKLLQG, Institute of Earth Environment, Chinese Academy of Sciences, Xi’an 710061, China
3
Key Laboratory of Regional Climate-Environment for Temperate East Asia, Institute of Atmospheric Physics, Chinese Academy of Sciences, Beijing 100029, China
*
Author to whom correspondence should be addressed.
Atmosphere 2017, 8(5), 91; https://doi.org/10.3390/atmos8050091
Submission received: 28 February 2017 / Revised: 11 May 2017 / Accepted: 17 May 2017 / Published: 21 May 2017
(This article belongs to the Section Air Quality)

Abstract

:
In this study, 24 h PM2.5 (particles with an equivalent diameter equal to or below 2.5 μm) samples were collected in winter and summer in Xi’an, Northwestern China to characterize the seasonal variations of eleven elements (As, Cd, Cr, Fe, K, Mn, Mo, Pb, Ni, Zn, and Cu) and to evaluate their health risks by using the US EPA (U.S. Environmental Protection Agency) method. Mass concentrations of the elements (except Ni) in winter were much higher than those in summer, with similar variations for both seasons. The levels of elements followed a decreasing order of K > Zn > Fe > Pb > Cr > As > Mn > Cu > Mo > Ni > Cd. According to the enrichment factor (EF) analysis, the highest EF value for Cd inferred that it should be linked with the metal smelting and other anthropogenic sources. In contrast, the EF values of K and Mn (1 < EF < 5) suggested that they were influenced by both natural and anthropogenic sources. The daily average exposure dose for children and adults by different exposure pathways were both ingestion > dermal contact > inhalation. The non-cancer risks for different exposure pathways showed different orders. The non-cancer risks (hazard quotients) were lower than the average risk threshold (1.0) except for As, Pb, and Cr, which require greater attention. Elements of As and Cr were higher than the cancer risk threshold value (1 × 10⁻⁶), indicating that the cancer risks of PM2.5 elements in Xi’an should be a concern.
PACS/MSC/JEL Classification:
42.68.Jg

1. Introduction

After reforming and opening up its markets, economy, urbanization, and energy consumption in China grew rapidly. Haze occurs frequently, and is one of the most important concerns in cities of China [1]. PM2.5 (particles with an equivalent diameter equal to or below 2.5 μm) has been suggested to be closely associated with climatic change, agricultural production, natural ecosystem, and urban environment, especially haze, as well as adverse effects on human health [2,3]. China Ministry of Environmental Protection promulgated PM2.5 standard in early 2012, but PM2.5 concentrations in many cities are still not up to the standard. Health impact due to poor air quality and visual perception are the main concerns of the general public nowadays. Therefore, the identification of dominant pollutant species in ambient air is crucial for making pollution control policies [4].
As the important chemical species in PM2.5, elements could be an indicator for the change of PM2.5 compositions and sources. Studies on the behavior of elements in PM could deepen the comprehension of toxicology characteristics, the mechanism of environmental influence of elements, as well as the emissions of different air pollution sources [5,6,7]. The main natural sources of elements in the atmosphere are soil dust, volcanic emissions, forest fire emissions, and meteoric dust. The anthropogenic sources are dominated by combustion of fuel oil and coal, metallurgical operations, and so on [8].
Many elements or metals are preferentially presented in finer particles [9], owing to lower densities, greater surface area per volume unit, and higher organic matter content in PM2.5 [8,10]. Meanwhile, finer fractions of heavy metals could be more easily re-suspended and remain for longer times in the atmosphere [11] and more easily enter the human body through inhalation, ingestion, and dermal contact, resulting in adverse health effects [12]. A growing body of evidence has demonstrated that metals can accumulate in adipose tissue and the circulatory system of the body, and may affect the digestive, cardiovascular, and central nervous systems, and may also become a cofactor of other diseases [3,13]. For example, Pb exposure can lead to congenital malformations and lesions of the developing nervous system, causing important impairment in newborn’s motor and cognitive abilities [14].
The study of health risk assessment of PM2.5 in China started late, and the assessment of pollutant species and estimated area has been limited. At present, the main risk assessment of heavy metal pollutants are from Pb, Cu, Zn, Cd, Cr, As, Ni, and Hg, related to the assessment of regional polluted city surface soil (dust) and mining soil, diet, drinking water, groundwater, and atmospheric particles [15]. Previous research studies about elements in PM involved source identification, chemical composition, the relationship between elements in PM and the corresponding concentrations in blood and urine, as well as environmental exposure quantity and behavioral effects on different human groups [16]. Studies that consider health risk assessments of elements in PM2.5 are very important in order to explore environmental health issue and strengthen environmental management [17]. The main purposes of this study are to determine PM2.5 elemental concentrations and seasonal variations in Xi’an; identify natural and anthropogenic sources of elements in PM2.5 by using enrichment factors; and assess PM2.5 elemental cancer and non-cancer health risks.

2. Material and Methods

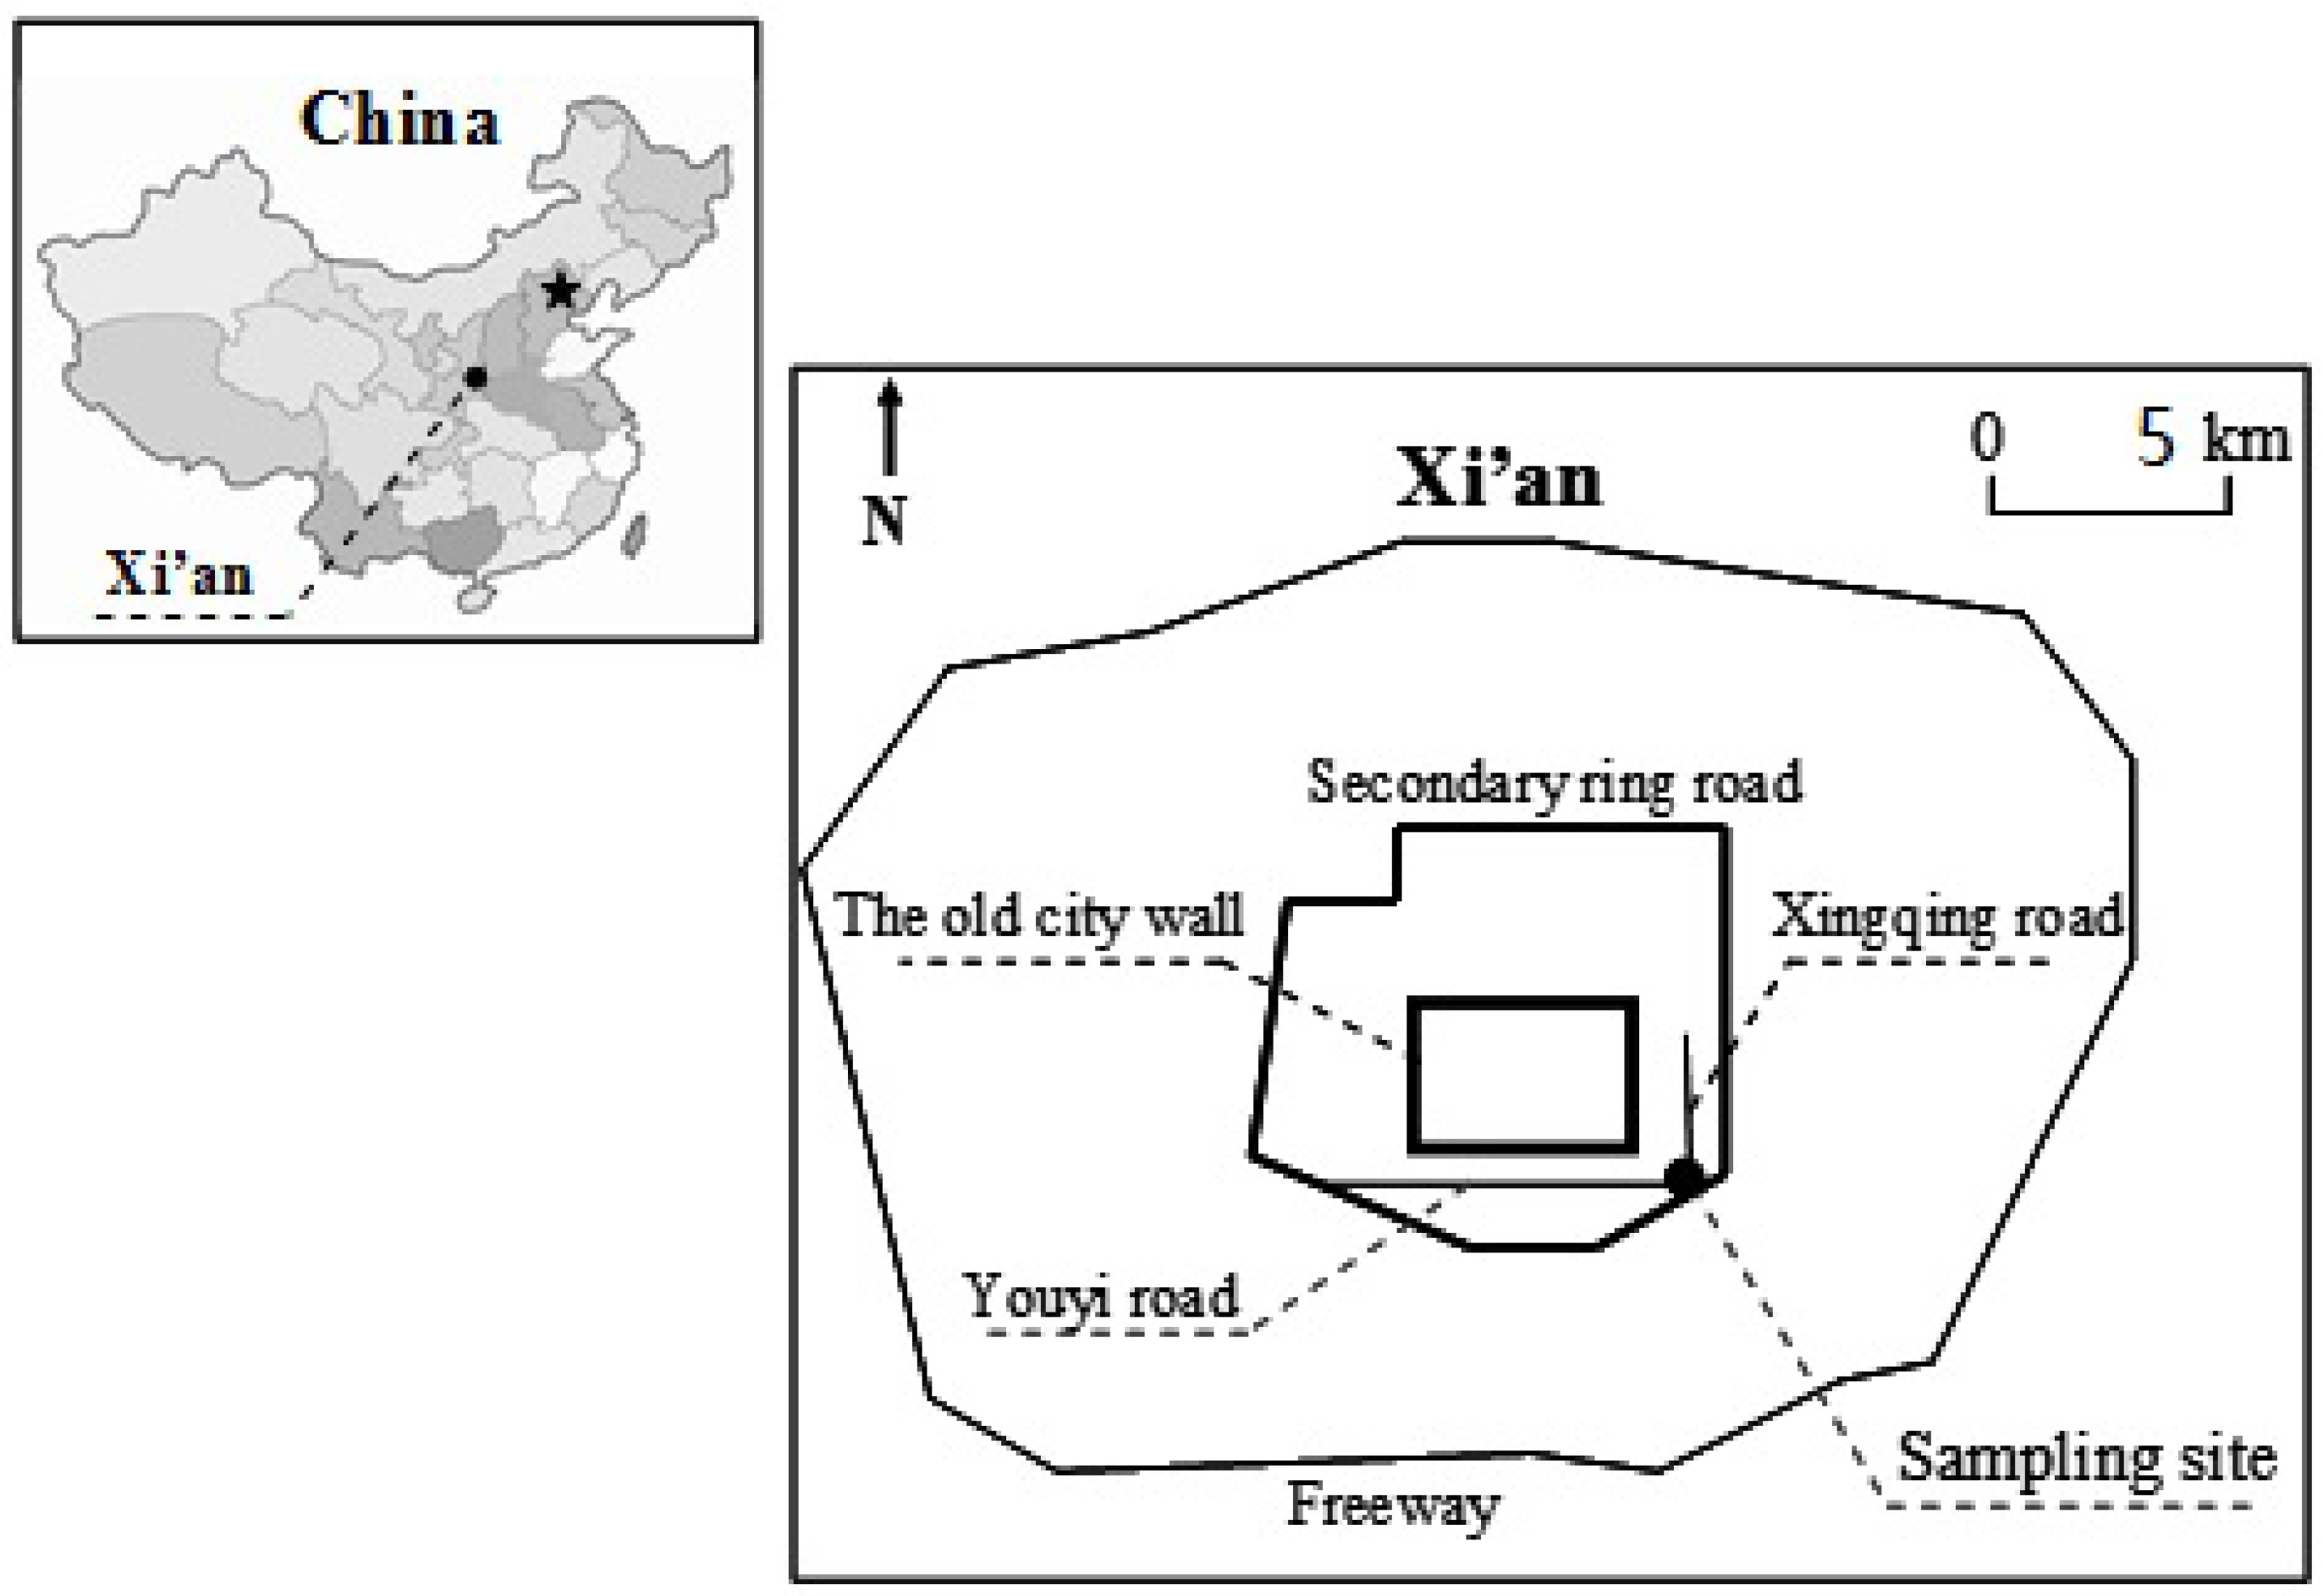
2.1. Description of Study Area

Xi’an, the largest city in Northwestern China, is located in the Guanzhong Plain at the southern edge of the Loess Plateau, which covers an area of 10,108 km2 with a population of approximately 8.83 million, as of 2016. The sampling site (34.23° N, 108.98° E) is located in the southeastern area of Xi’an in a mixture of urban, vehicular, and residential areas (Figure 1). There is no obvious emission source around the sampling site.

2.2. Sample Collection

Twenty-four-hour (24 h) PM2.5 samples (9:30 a.m. to 9:30 a.m. the next day, local time) were collected in two typical seasons (winter: 2 December 2008 to 24 February 2009 and summer: 6 June 2009 to 30 August 2009) on pre-combustion (780 °C, 3 h) quartz filters (20.3 cm × 25.4 cm) every six days. A high-volume PM2.5 air sampler (HVS-PM2.5, Thermo Fisher Scientific, Waltham, MA, USA) was operated on the flow rate of 1.1 m3 min−1 in this study. The sampling head was placed about 20 m high above the ground. We collected 16 samples in winter and 15 samples in summer. Additionally, one summer field blank and one winter field blank were collected at the same site; the field blanks were used to account for any artifacts caused by gas absorption and background of filters. After sampling, the exposed filters were placed in clean plastic cassettes and stored in a refrigerator at about 4 °C until analysis to minimize the evaporation of volatile components [18].

2.3. Experimental Method

One-fourth of a 47-mm punch (an area of 4.337 cm2) filter from PM2.5 sample was placed in a Teflon digestion vessel for acid treatment. Each sample was treated with 8 mL of a mixture of HNO3:HCl (1:3 v/v), 2 mL H2O2 (DC Chemical, EP grade), and 4 mL HF for 12 h to decompose the sample by microwave digestion. The digested solution was transferred into a Teflon cup, with 4 mL of perchloric acid added, then heated on the heating plate until it condensed into a droplet. Heating temperature was gradually increased to 120 °C, 160 °C, and 180 °C. After drying, the digested solution was diluted to 25 mL with 10% HNO3 solution [19]. The solution was analyzed by Inductively Coupled Plasma-Atomic Emission Spectrometer (ICP-AES, Shimadzu, Kyoto, Japan). The field blank filters were analyzed using these same procedures. The results of the blank analyses were corrected for the corresponding filter samples. Eleven elements: As, Cd, Cr, Fe, K, Mn, Mo, Pb, Ni, Zn, and Cu were determined in the present study. Accuracy tests according to standard materials (loess, GBW07408 and coal ash, GBW08401) were carried out in this study to guarantee the accuracy of the data. The recovery of this experiment ranged from 98% to 117% [20].

2.4. Source Identification

Potential sources of elements in PM2.5 were evaluated by enrichment factor (EF), which is an important indicator of the disturbance to the natural environment caused by human activities to a certain extent [21]. By comparing measured values with soil background values, we can gain an understanding of the influence of human activity on the elements in aerosol [11]. The EF of each element was calculated relative to a reference crustal element Fe (it is a good indicator for crustal material due to being less affected from anthropogenic pollution) [22] by the following Equation (1):
EF = (X/Fe)aerosol/(X/Fe)crust
where EF is the enrichment factor of target element X, (X/Fe)aerosol is the concentration ratio of X to Fe in the aerosol samples, and (X/Fe)crust is the average concentration ratio of X to Fe in crustal dust. If EF is 1 to 5, the element X can be considered to originate mainly from soil; if EF > 5, the element X mainly originated from human activities [23].
The mass concentration of certain element from anthropogenic source was calculated by Equation (2):
Cnon = C − CFe × (C/CFe)crust
where Cnon is the mass concentration caused by anthropogenic sources of a certain element in PM2.5. C is the mass concentration of a certain element in PM2.5 during the sampling period. CFe is the mass concentration of Fe in PM2.5 during the sampling period. (C/CFe)crust is the ratio of mass concentration of a certain element and Fe in PM2.5 in upper crustal matter [22].

2.5. Health Risk Assessment

This study adopted health risk assessment model from the US EPA (U.S. Environmental Protection Agency) to evaluate health risks of elements in PM2.5. PM2.5 causes health risks mainly in three ways: ingestion, inhalation, and dermal contact. The average daily dose (D, unit: mg kg−1 day−1) through ingestion (Ding), inhalation (Dinh), and dermal contact (Ddermal) can be calculated as follows [3,24]:
D ing = C ( mg · kg 1 ) × IngR × EF × ED BW × AT × 10 6
D inh = C ( mg · kg 1 ) × InhR × EF × ED PEF × BW × AT
D dermal = C ( mg · kg 1 ) × SA × SL × ABS × EF × ED BW × AT × 10 6
where C is the concentration of the certain element in PM2.5, mg kg−1; IngR is the ingestion rate, 200 mg day−1 for children and 100 mg day−1 for adults [25]; InhR is the inhalation rate, 7.6 m3 day−1 for children and 20 m3 day−1 for adults [12,26,27]; EF is exposure frequency, 350 day year−1 [12]; ED is exposure duration, 6 years for children and 30 years for adults [25]; SA is exposed skin area, 1800 cm2 for children and 4350 cm2 for adults [25,28,29]; SL is skin adherence factor, 0.2 mg cm−2 event−1 for children and 0.07 mg cm−2 event−1 for adults and event frequency is 1 event day−1 [25]; ABS is dermal absorption factor (unitless), 0.001 for all elements [25]; BW is average body weight, 15 kg for children and 60 kg for adults [24]; AT is averaging time, for non-carcinogens, AT = ED × 350 days; for carcinogens, AT = 70 × 350 = 24,500 days; PEF is the particle emission factor, which was calculated as:
PEF ( m 3 / kg ) = Q C × 3600 s / h 0.036 × ( 1 V ) × ( U m U t ) 3 × F ( x )
where Q/C is the inverse of the mean concentration at the center of the source square (g m−2 s per kg m−3), which was selected as 90.80; V is the fraction of vegetable cover, which was selected as 0.5 (unitless) for soil dust and as 0.0 for road dust; Um is the average annual windspeed (m s−1), which was 2.00 m s−1 for Xi’an; Ut is the equivalent threshold value of windspeed at 10 m height, which was selected as 23.66 m s−1; F(x) is the function dependent on Um/Ut as 0.228 (unitless). This gave a value of 1.32 × 10⁹ m3 kg−1 for soil dust and 6.59 × 10⁸ m3 kg−1 for road dust in this study [3].
The non-cancer risk of eight elements (As, Cd, Cr, Mn, Pb, Ni, Zn, and Cu) through the above-mentioned three ways can be evaluated by hazard quotient (HQ) and Hazard Index (HI) [24]:
HQ = D/RfD
HI = HQi
where RfD is the reference dose (mg kg−1 day−1) of each element, which were obtained from the US EPA website [30]. HI can be calculated by adding the individual HQi (i means multiple-element or multiple-route) to estimate the total non-cancer risks of all elements considered in the study. If the HI is lower than 1, then non-cancer effects are impossible. If the HI is equal to or higher than 1, adverse non-cancer health effects might be likely to appear. If the HI is greater than 10, a high chronic adverse risk exists [31].
The lifetime average daily dose (LADD) for the cancer risk (unit: mg kg−1 day−1) of four elements (As, Cd, Cr, and Ni) in this study via inhalation was calculated by Equation (9) [3,32]:
LADD = C × EF PEF × AT × ( InhR child × ED child BW child + InhR adult × ED adult BW adult )
The increased lifetime cancer risks (ILCR) are estimated by Equation (10) [33]:
ILCR = LADD × SF
where SF is the cancer slope factor of a certain element, kg day mg−1, which is obtained from the US EPA website [30]. The value of 10−6 is an internationally accepted precautionary or threshold value, above which the risk is unacceptable [25].
C (exposure-point concentration, mg kg−1) in the Equations (3)–(5) and (9) refers to the upper limit of the 95% confidence interval (95% UCL) for the mean, which is also considered as the estimate of the “reasonable maximum exposure”. In this study, C95%UCL was calculated from the SPSS software (Model 19.0, IBM-SPSS, Armonk, NY, USA).

3. Results and Discussion

3.1. Characteristics of Elements in PM2.5

The concentrations of the eleven elements (As, Cd, Cr, Fe, K, Mn, Mo, Pb, Ni, Zn, and Cu) bound to PM2.5 are presented in Table 1. During the entire sampling period, with a large amount of straw used as the heating and cooking fuel in rural areas around Xi’an [34], the indicator of biomass combustion element, K, was the highest concentration of PM2.5-bound element (357 ng m−3), contributing to 43.5% of the elemental composition. The element found in the lowest concentration was Cd (8 ng m−3), accounting for 0.09%. The annual average concentrations of other elements showed in the descending order: Zn > Fe > Pb > Cr > As > Mn > Cu > Mo > Ni. We can see that traffic and industrial elemental tracer-Zn was enriched in PM2.5, showing a serious PM2.5 pollution contributed from traffic and industrial emissions. Low concentrations of non-essential elements, which would be harmful to human body even at very low dose, including Ni, Cd, As, and Cr, were observed in this study [35].
Except for Ni, a consistent trend was observed in that the elemental mass concentrations in winter were higher than those in summer. This was especially notable for As, where the winter level was almost five times that of the summer level. This could be a result of domestic heating in winter of Xi’an. As is an important marker of coal combustion and a main emission pollutant from coal-fired power plants [21]. The power plant and the smelter near the sampling site also contribute to the high concentration of As [36]. Additionally, less precipitation, lower temperature, and calm weather, which are disadvantageous for the dilution and diffusion of air pollutants, may lead to thermal inversion and haze in Xi’an winter. The washing effect of rain is obvious for PM, so the air pollution level of elements in PM2.5 was much lower in the rainy summer in Xi’an [37]. The average temperature was 1.1 °C, and the average precipitation was 8.9 mm in winter; in summer, the values were 29.3 °C and 76.9 mm, respectively [38].

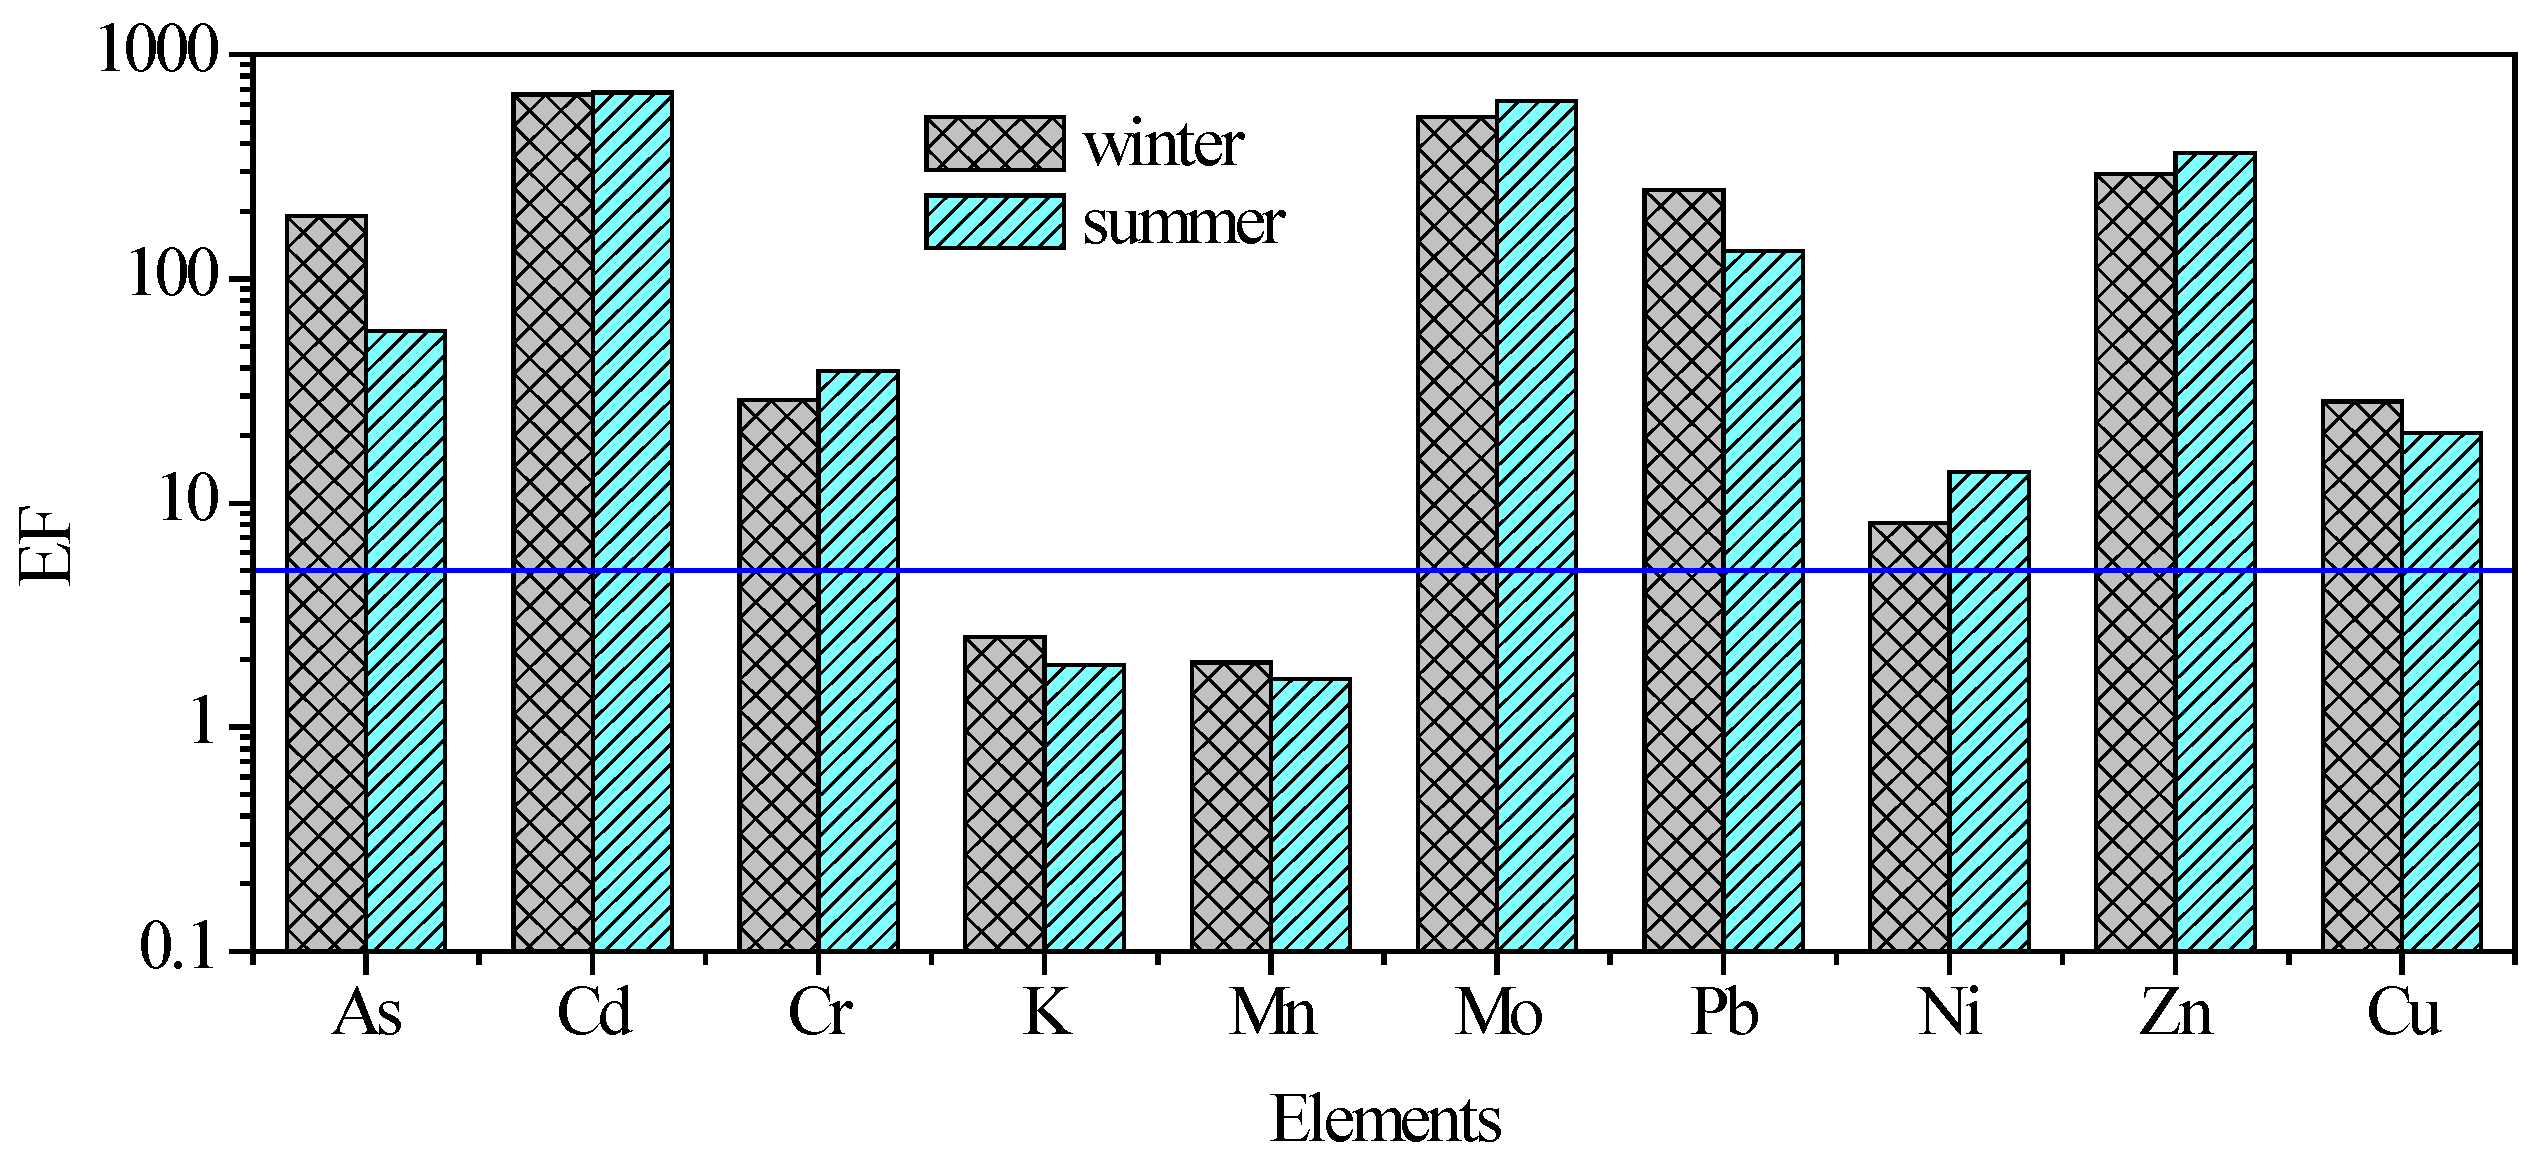
3.2. The Source of Elements

The enrichment factors (EFs) of eleven elements are shown in Figure 2. Elements measured in this study were divided into two groups according to EFs: one was anthropogenic source elements (influenced little by natural sources), such as As, Cd, Cr, Mo, Pb, Zn, and Cu, with much higher EFs than 5; the second group with EFs below 5 (K and Mn) suggested that these elements were mainly influenced by natural sources.
The relative contributions of anthropogenic sources to the elemental concentrations are shown in Table 2. The mass concentrations of As, Mn, and Pb from anthropogenic sources in winter were significantly higher than those in summer. As and Pb are typical markers of coal combustion [39], and K is an effective indicator of biomass burning, as mentioned above. In addition, concentrations of Cd, Cr, Ni, Zn, and Cu were similar between summer and winter, indicating that emission sources of these elements did not obviously change with season. They may be produced from industry or traffic [40].

3.3. Comparison with Other Cities and Standard

Comparisons of elemental concentrations in PM2.5 in Xi’an and other cities over the world are summarized in Table 3. The concentrations of elements in PM2.5 in this study were higher than those in some Chinese cities and in other foreign cities. For example, Mn and Ni exhibited lower levels than those in Guangzhou and Baoshan, Shanghai in summer. The concentration of As in winter and Zn levels in both seasons in Xi’an were 5 to 10 times higher than those in other cities mentioned in Table 3. The concentration of Cd in Xi’an was higher than that in Yinchuan, Shanghai, and Taiwan, but much lower than that in the southern California. In addition, the concentration of Cr in Xi’an was significantly high, which may be associated with the electroplating factories in the suburb area of Xi’an [41]. The level of Pb in Xi’an was comparable to that in Guangzhou and Beijing, 2 to 4 times of that in Baoshan district, Shanghai, and as much as 10 times of that in southern California and New York. The K concentration in Xi’an was similar to Guangzhou, but higher than in foreign cities (Menen and southern California), which indicated that biomass burning was one of the main air pollution sources in Xi’an, and also in China in general. Crustal elements, Mn and Fe, in Xi’an showed higher concentrations than those in other areas except in the Northwestern city of Yinchuan. Generally, the pollution level of metal elements in Xi’an PM2.5 was similar to that of Changsha and Guangzhou, but the pollutant concentration was slightly higher than other cities mentioned in Table 3.
In comparing the element concentrations with the latest China national ambient air quality standard [42], the concentration of As in PM2.5 in Xi’an distinctly exceeded the standard (100%). This was mainly caused by coal combustion. The concentrations of Cd concentrations and Pb concentrations exceed the national standard by 80% and 43.8%, respectively. Therefore, this study confirmed severe pollution of several elements in PM2.5 in Xi’an, especially As and heavy metals, and suggested that there should be reasonable concern for human health status and exposure to As and heavy metals in Xi’an, China.

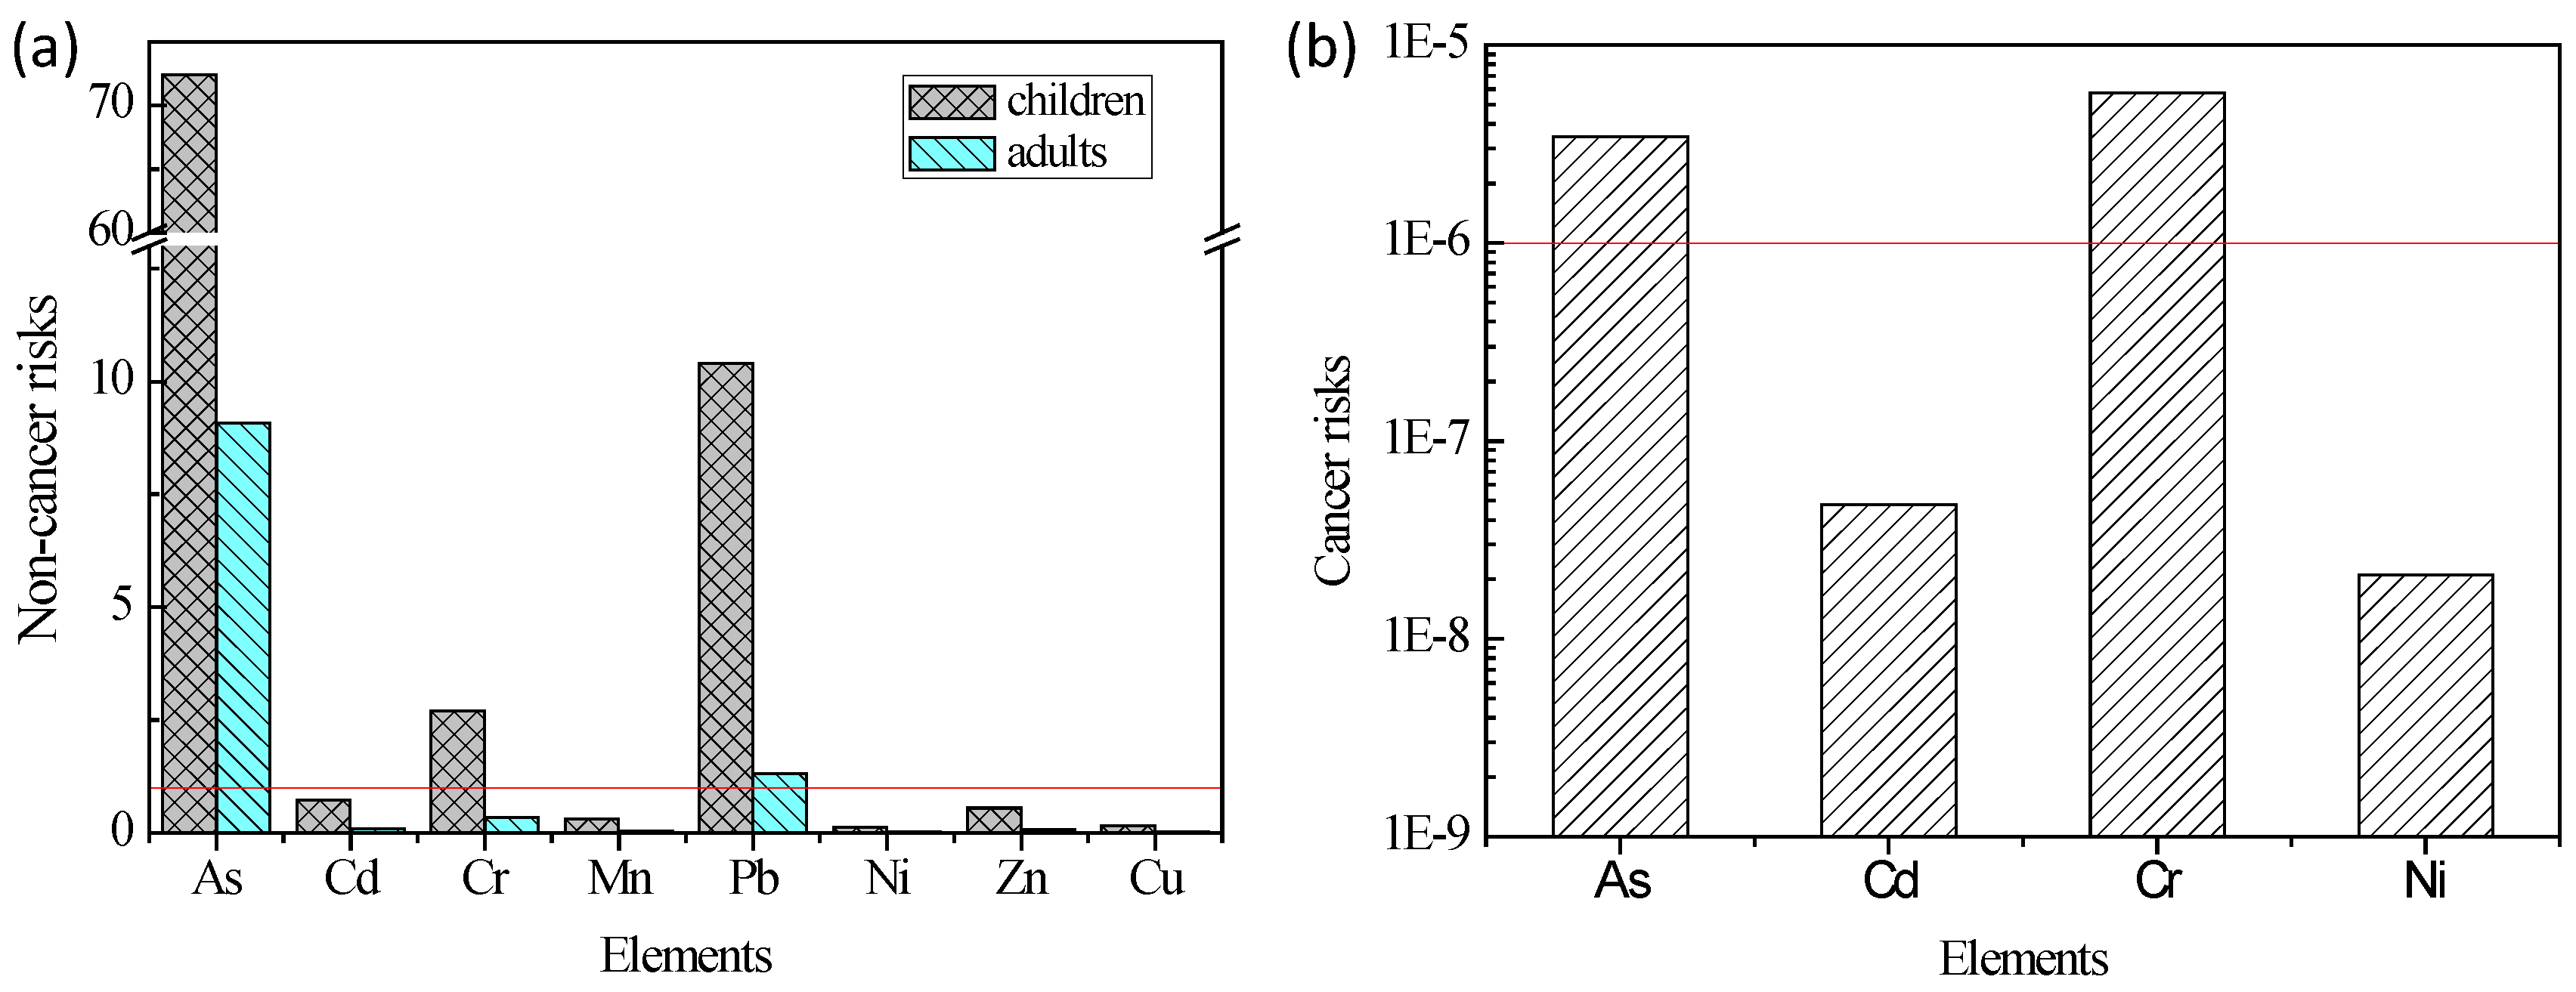
3.4. Health Risk Assessment of Elements in PM2.5

The exposure daily doses of eight elements by different exposure methods are calculated in Table 4. The exposure dose from hand-mouth ingestion was much more than dermal contact and respiratory inhalation for both children and adults. Average daily exposure levels for children were higher than adults for each exposure pathway [46]. For non-cancer risk, the descending order of elements average daily exposure dose was Zn, Pb, As, Cr, Mn, Cu, Ni, and Cd for any exposure method. For cancer risk, the lifetime average daily doses (LADD) trend was As > Cr > Ni > Cd (Table 5).
The non-cancer risk assessments of adults and children for elements in PM2.5 by three pathways are listed in Table 6. The descending order of single element non-cancer risk was as follows: As, Pb, Cr, Cd, Zn, Mn, Cu, and Ni for ingestion; the order was Mn, Cr, As, Pb, Cd, Zn, Cu, and Ni for inhalation; and As, Pb, Cr, Cd, Mn, Cu, Zn, and Ni for dermal contact. Moreover, separating the three main exposure routes, for all eight elements, non-cancers risks from ingestion (10.8 for adults and 86.7 for children) and dermal contact (0.12 for adults and 0.58 for children) are much greater compared to inhalation exposure (0.027 and 0.056 for adults and children) (Table 6). Except for As, Pb, and Cr (children), HIs of other elements were much lower than 1, indicating that the non-cancer risk was controlled within the safe limit [28]. Coupled with the concentrations of elements in PM2.5 in Xi’an in Table 1, As, Pb, and Cr showed lower concentration levels but higher non-cancer risks [51]. Therefore, it is imperative to strengthen air pollution control and air quality management in Xi’an, especially in regard to As, Pb, and Cr related emission sources.
Based on assessments of non-cancer and cancer risks (ILCRs) for elements in Figure 3, the highest threat of non-cancer risk to the human body was As, followed by Pb. The average non-cancer risks of As and Pb for children both were approximately 8 times of adults. Therefore, this indicated that children were more sensitive to non-cancer effects of PM2.5 elements [13] and we should minimize exposure to As, Pb, and Cr sources, especially for children. The decreased cancer risks occur in the following order of Cr, As, Cd, and Ni in Xi’an PM2.5. The values of As and Cr were higher than 10−6, indicating that the PM2.5 in Xi’an had cancer risk to the residents in this study. Even so, we must pay attention to carcinogenic As and Cr in Xi’an, which still are concerns to the residents.

4. Conclusions

Eleven elements (As, Cd, Cr, Fe, K, Mn, Mo, Pb, Ni, Zn, and Cu) in PM2.5 of Xi’an were investigated in summer and winter. The Pb, Cd, and As concentrations exceeded AAQS (Ambient Air Quality Standard) in China, especially As. Mass concentrations of elements in winter were much higher than those in summer, with the exception of Ni. Seasonal variations of As, Pb, and K were observed obviously due to extra coal and biomass burning in winter for domestic heating. The EFs of As, Cd, Pb, Mo, Zn, Cr, and Cu were more than 5, with the highest value for Cd, pointing out relatively higher contributions from anthropogenic sources. Elemental pollution in PM2.5 in Xi’an was serious compared with other cities.
Average daily exposure doses for children were higher than those for adults for each exposure pathway. The average daily exposure dose occurred in the following decreasing order: Zn, Pb, As, Cr, Mn, Cu, Ni, and Cd for non-cancer risk, while the order was As, Cr, Ni, and Cd for cancer risk. The non-cancer risk of As and Pb were much more than 1 for both children and adults, demonstrating that As and Pb emissions should be controlled effectively in Xi’an. The ILCR of As and Cr were higher than 10−6, indicating that cancer risk from elements in PM2.5 should be a concern in Xi’an. Further studies should be conducted to investigate exposure parameters specifically for Chinese residents and air pollution transportation factors in order to reduce the health risk assessment uncertainties in China.

Acknowledgments

This research was supported by the National Natural Science Foundation of China (41503096), State Key Laboratory of Loess and Quaternary Geology, Institute of Earth Environment, CAS (SKLLQG1616), the Fundamental Research Funding for Central Universities in China (xkjc2015002), and the Key Lab of Aerosol Chemistry & Physics of the Chinese Academy of Sciences (KLACP201501).

Author Contributions

P.L. and Z.S. conceived and designed the experiments; Y.L. and Q.Z. performed the experiments; Y.L. and H.R. analyzed the data; P.L., J.G., H.X., C.Z., and H.L. contributed reagents/materials/analysis tools; P.L., Y.L., and H.R. wrote the paper; Z.S., H.X., R.Z., and H.P. contributed to manuscript revision. All authors commented on the manuscript and reviewed the manuscript.

Conflicts of Interest

The authors declare no conflict of interest.

References

  1. Kang, H.Q.; Zhu, B.; Su, J.F.; Wang, H.L.; Zhang, Q.C.; Wang, F. Analysis of a long-lasting haze episode in Nanjing, China. Atmos. Res. 2013, 120–121, 78–87. [Google Scholar] [CrossRef]
  2. Kong, S.F.; Lu, B.; Ji, Y.Q.; Zhao, X.Y.; Bai, Z.P.; Xu, Y.H.; Liu, Y.; Jiang, H. Risk assessment of heavy metals in road and soil dusts within PM2.5, PM10 and PM100 fractions in Dongying city, Shandong Province, China. J. Environ. Monitor. 2012, 14, 791–803. [Google Scholar] [CrossRef] [PubMed]
  3. He, G.X.; Feng, H.; Zhang, H.R. The Diffusion and Attenuation Model of PM2.5 Pollution in Air. Math. Pract. Theory 2014, 455, 107–118. [Google Scholar]
  4. Tao, J.; Zhang, L.M.; Ho, K.; Zhang, R.J.; Lin, Z.J.; Zhang, Z.S.; Lin, M.; Cao, J.J.; Liu, S.X.; Wang, G.H. Impact of PM2.5 chemical compositions on aerosol light scattering in Guangzhou—The largest megacity in South China. Atmos. Res. 2014, 135–136, 48–58. [Google Scholar] [CrossRef]
  5. Tseng, C.Y.; Lin, S.L.; Mwangi, J.K.; Yuan, C.S.; Wu, Y.L. Characteristics of Atmospheric PM2.5 in a Densely Populated City with Multi-Emission Sources. Aerosol Air Qual. Res. 2016, 16, 1–14. [Google Scholar] [CrossRef]
  6. Ragosta, M.; Caggiano, R.; Macchiato, M.; Sabia, S.; Trippetta, S. Trace elements in daily collected aerosol: Level characterization and source identification in a four-year study. Atmos. Res. 2008, 89, 206–217. [Google Scholar] [CrossRef]
  7. Lu, S.; Yao, Z.C.X.; Chen, X.H.; Wu, M.; Sheng, G.Y.; Fu, J.M.; Paul, D. The relationship between physicochemical characterization and the potential toxicity of fine particulates (PM2.5) in Shanghai atmosphere. Atmos. Environ. 2008, 42, 7205–7214. [Google Scholar]
  8. Lu, X.W.; Wang, L.J.; Lei, K.; Huang, J.; Zhai, Y.X. Contamination assessment of copper, lead, zinc, manganese and nickel in street dust of Baoji, NW China. J. Hazard. Mater. 2009, 161, 1058–1062. [Google Scholar] [CrossRef] [PubMed]
  9. Fergusson, J.E.; Forbes, E.A.; Schroeder, R.J.; Ryan, D.E. The elemental composition and sources of house dust and street dust. Sci. Total Environ. 1986, 50, 217–221. [Google Scholar] [CrossRef]
  10. Chang, J.; Liu, M.; Li, X.H.; Lin, X.; Wang, L.L.; Gao, L. Primary research on health risk assessment of heavy metals in road dust of Shanghai. Zhongguo Huanjing Kexue/China Environ. Sci. 2009, 29, 548–554. [Google Scholar]
  11. Loska, K.; Wiechuła, D.; Korus, I. Metal contamination of farming soils affected by industry. Environ. Int. 2004, 30, 159–165. [Google Scholar] [CrossRef]
  12. Ferreira, B.L.; De, M.E. Geochemistry and risk assessment of street dust in Luanda, Angola: A tropical urban environment. Atmos. Environ. 2005, 39, 4501–4512. [Google Scholar] [CrossRef]
  13. Chen, H.; Lu, X.W.; Chang, Y.Y.; Xue, W.Z. Heavy metal contamination in dust from kindergartens and elementary schools in Xi’an, China. Environ. Earth Sci. 2014, 71, 2701–2709. [Google Scholar] [CrossRef]
  14. Bellinger, D.C. Teratogen update: Lead and pregnancy. Birth Defect. Res. Part A Clin. Mol. Teratol. 2005, 73, 409–420. [Google Scholar] [CrossRef] [PubMed]
  15. Liu, R.; Zhang, H.; Gou, X.; Luo, X.Q.; Yang, H.Y. Approaches of Health Risk Assessment for Heavy Metals Applied in China and Advance in Exposure Assessment Models: A Review. Ecol. Environ. Sci. 2014, 23, 1239–1244. [Google Scholar]
  16. Farago, M.E.; Kavanagh, P.; Blanks, R.; Kelly, J.; Kazantzis, G.; Thornton, I.; Simpson, P.R.; Cook, J.M.; Delves, H.T.; Hall, G.E. Platinum concentrations in urban road dust and soil, and in blood and urine in the United Kingdom. Analyst 1998, 123, 451–454. [Google Scholar] [CrossRef] [PubMed]
  17. Cornejo, S.G.; Marin, S.R.; Olave, S.G.; Urrutia, C. Determination of Trace Elements in Aerosol Samples Collected on Polycarbonate Filters by Atomic Absorption Spectrometry. Int. J. Environ. Anal. Chem. 1995, 60, 377–387. [Google Scholar] [CrossRef]
  18. Richard, A.; Bukowiecki, N.; Lienemann, P.; Furger, M.; Fierz, M.; Minguillón, M.C.; Weideli, B.; Figi, R.; Flechsig, U.; Appel, K.; et al. Quantitative sampling and analysis of trace elements in atmospheric aerosols: Impactor characterization and Synchrotron-XRF mass calibration. Atmos. Meas. Tech. 2010, 3, 1473–1485. [Google Scholar] [CrossRef]
  19. Alkarkhi, A.F.M.; Ahmad, A.; Azhar Mat Easa, N.I. Multivariate analysis of heavy metals concentrations in river estuary. Environ. Monit. Assess. 2008, 143, 179. [Google Scholar] [CrossRef] [PubMed]
  20. General Administration of Quality Supervision Inspection and Quarantine of the People’s Republic of China. Reference Material Certificate—Soil composition analysis standard material, GBW07401-GBW07408; Geophysical and Geochemical Exploration Research Institute: Langfang, China, 2003.
  21. Anderson, P. Assessment and development of executive function (EF) during childhood. Child Neuropsychol. J. Norm. Abnorm. Dev. Child. Adolesc. 2002, 8, 71–82. [Google Scholar] [CrossRef] [PubMed]
  22. Taylor, S.R.; Mclennan, S.M. The Continental Crust: Its Composition and Evolution. An Examination of the Geochemical Record Preserved in Sedimentary Rocks; Blackwell Scientific Publications: Boston, MA, USA, 1995. [Google Scholar]
  23. Choi, J.C.; Lee, M.; Chun, Y.S.; Kim, J.Y.; Oh, S.N. Chemical composition and source signature of spring aerosol in Seoul, Korea. J. Geophys. Res. 2001, 106, 18067–18674. [Google Scholar] [CrossRef]
  24. US EPA. Soil Screening Guidance: Technical Background Document; Office of Soild Waste and Emergency Response: Washington, DC, USA, 1996.
  25. US EPA. Supplemental Guidance for Developing Soil Screening Levels for Superfund Sites; Office of Soild Waste and Emergency Response: Washington, DC, USA, 2001.
  26. Zheng, N.; Liu, J.S.; Wang, Q.C.; Liang, Z.Z. Health risk assessment of heavy metal exposure to street dust in the zinc smelting district, Northeast of China. Sci. Total Environ. 2010, 408, 726–733. [Google Scholar] [CrossRef] [PubMed]
  27. Man, Y.B.; Sun, X.L.; Zhao, Y.G.; Lopez, B.N.; Chung, S.S.; Wu, S.C.; Cheung, K.C.; Wong, M.H. Health risk assessment of abandoned agricultural soils based on heavy metal contents in Hong Kong, the world’s most populated city. Environ. Int. 2010, 36, 570–576. [Google Scholar] [CrossRef] [PubMed]
  28. Wang, Z.; Liu, S.Q.; Chen, X.M.; Lin, C.Y. Estimates of exposed dermal surface area of Chinese in view of human health risk assessment. J. Saf. Environ. 2008, 8, 152–156. [Google Scholar]
  29. Environmental Site Assessment Guideline, DB11/T656–2009; Bejing Municipal Administration of Quality and Technology Supervision: Beijing, China, 2009.
  30. US EPA. Risk Assessment Guidance for Superfund. Human Health Evaluation Manual; Office of Soild Waste and Emergency Response: Washington, DC, USA, 2016.
  31. Guney, M.; Zagury, G.J.; Dogan, N.; Onay, T.T. Exposure assessment and risk characterization from trace elements following soil ingestion by children exposed to playgrounds, parks and picnic areas. J. Hazard. Mater. 2010, 182, 656–664. [Google Scholar] [CrossRef] [PubMed]
  32. Kumar, B.; Gaur, R.; Kumar, S.; Sharma, C.S. Environmental and Human Health Risk Assessment of Benzo(a)pyrene Levels in Agricultural Soils from the National Capital Region, Delhi, India. Hum. Ecol. Risk Assess. 2013, 19, 118–125. [Google Scholar] [CrossRef]
  33. Tvermoes, B.E.; Banducci, A.M.; Devlin, K.D.; Kerger, B.D.; Abramson, M.M.; Bebenek, I.G.; Monnot, A.D. Screening level health risk assessment of selected metals in apple juice sold in the United States. Food Chem. Toxicol. 2014, 71, 42–50. [Google Scholar] [CrossRef] [PubMed]
  34. Oanh, N.T.K.; Bich, T.L.; Tipayaroma, D.; Manandhar, B.R.; Prapat, P.; Simpson, C.D.; Sally Liu, L.-J. Characterization of particulate matter emission from open burning of rice straw. Atmos. Environ. 2011, 45, 493–502. [Google Scholar] [CrossRef] [PubMed]
  35. Lu, X.W.; Li, L.Y.; Wang, L.J.; Lei, K.; Huang, J.; Zhai, Y.X. Contamination assessment of mercury and arsenic in roadway dust from Baoji, China. Atmos. Environ. 2009, 43, 2489–2496. [Google Scholar] [CrossRef]
  36. Yang, L.; Li, X.X. Analysis of heavy metal pollution in atmospheric deposition. J. Xi’an Jiaotong Univ. 2014, 48, 118–124. [Google Scholar]
  37. Li, L.Z.; Shen, Z.X.; Du, N.; Zhang, T.; Cao, J.J.; Li, X.X.; Hu, C.S. Chemical composition of water-soluble species between haze and normal days over Xi’an. J. Grad. Sch. Chin. Acad. Sci. 2007, 24, 674–679. [Google Scholar]
  38. National Bureau of Statistics of the People’s Republic of China. China Statistical Yearbook, 2009; China Statistics Press: Beijing, China, 2010.
  39. Chen, Y.; Sun, L.; Yun, Z.L.; Wu, G.N.; Xu, H.Y.; Chen, A.X. Heavy metal pollution of the urban street dust and health risk assessment in Xi’an. J. Saf. Environ. 2016, 16, 370–376. [Google Scholar]
  40. Marcazzan, G.M.; Valli, G.; Vecchi, R. Factors influencing mass concentration and chemical composition of fine aerosols during a PM high pollution episode. Sci. Total Environ. 2002, 298, 65–79. [Google Scholar] [CrossRef]
  41. Han, Y.M.; Du, P.X.; Cao, J.J.; Posmentier, E.S. Multivariate analysis of heavy metal contamination in urban dusts of Xi’an, Central China. Sci. Total Environ. 2006, 355, 176–186. [Google Scholar]
  42. Ministry of Environmental Protection of the People’s Republic of China. China National Ambient Air Quality Standard, GB 3095–2012; Ministry of Environmental Protection of the People’s Republic of China: Beijing, China, 2012.
  43. Zhai, Y.B.; Liu, X.T.; Chen, H.M.; Xu, B.B.; Zhu, L.; Li, C.T.; Zeng, G.M. Source identification and potential ecological risk assessment of heavy metals in PM2.5 from Changsha. Sci. Total Environ. 2014, 493, 109–115. [Google Scholar] [CrossRef] [PubMed]
  44. Yang, F.M.; He, K.B.; Ma, Y.L.; Chen, X.; Steven, H.C.; Tai, C.; Mulawa, P.A. Characteristics and sources of trace elements in ambient PM2.5 in Beijing. Environ. Sci. 2003, 24, 33–37. [Google Scholar]
  45. Fan, S.X.; Fan, T.; Yan, P.J.; Zheng, Y.F.; Jin, G.X.; Chen, S.G. Environmental Pollution Characteristics of Heavy Metal Elements of PM2.5 in Yinchuan. J. Desert Res. 2006, 26, 291–294. [Google Scholar]
  46. Wu, Y.S.; Fang, G.C.; Chen, J.C.; Rau, J.Y.; Huang, S.H. Ambient air particulate dry deposition, concentrations and ionic species study at Taichung Harbor near Taiwan Strait. Toxicol. Ind. Health 2005, 21, 177. [Google Scholar] [CrossRef] [PubMed]
  47. Gao, Y.; Nelson, E.D.; Field, M.P.; Ding, Q.; Li, H.; Sherrell, R.M.; Gigliotti, C.L.; Van Ry, D.A.; Glenn, T.R.; Eisenreich, S.J. Characterization of atmospheric trace elements on PM 2.5 particulate matter over the New York–New Jersey harbor estuary. Atmos. Environ. 2002, 36, 1077–1086. [Google Scholar] [CrossRef]
  48. Moreno, T.; Querol, X.; Alastuey, A.; Viana, M.; Salvador, P.; Campa, A.S.D.L.; Artinano, B.; Rosa, J.D.L.; Gibbons, W. Variations in atmospheric PM trace metal content in Spanish towns: Illustrating the chemical complexity of the inorganic urban aerosol cocktail. Atmos. Environ. 2006, 40, 6791–6803. [Google Scholar] [CrossRef]
  49. Na, K.; Cocker, D.R.I. Characterization and source identification of trace elements in PM2.5 from Mira Loma, Southern California. Atmos. Res. 2009, 93, 793–800. [Google Scholar] [CrossRef]
  50. Ravindra, K.; Stranger, M.; Grieken, R.V. Chemical characterization and multivariate analysis of atmospheric PM2.5 particles. J. Atmos. Chem. 2008, 59, 199–218. [Google Scholar] [CrossRef]
  51. Jiang, H.L.; Wang, Z.S.; Wu, X.F.; Guo, M.; Gu, Y.Y. Pollution Characteristic, Sources and Control of Arsenic in PM2.5 in China. J. Environ. Eng. Technol. 2015, 5, 464–470. [Google Scholar]
Figure 1. Location of sampling site.
Atmosphere 08 00091 g001
Figure 2. Elemental enrichment factors (EFs) relative to UCC (Earth’s upper continental crust, [22]) for elements in PM2.5 (particles with an equivalent diameter equal to or below 2.5 μm) over Xi’an during winter and summer.
Atmosphere 08 00091 g002
Figure 3. Non-cancer (a) and cancer risks (b) for elements in PM2.5 (red lines represent the threshold values for non-cancer and cancer risks).
Atmosphere 08 00091 g003
Table 1. Concentrations of eleven elements in PM2.5 during winter and summer in Xi’an (Unit: ng m−3).
ElementsWinter (n = 16)Summer (n = 15)Annual Average
RangeAverageRangeAverage
As48–523207 ± 2028–5542 ± 8127 ± 160
Cd2–169 ± 42–166 ± 48 ± 4
Cr91–348161 ± 9564–405142 ± 114152 ± 103
Fe1122–71292086 ± 1.399251–19321368 ± 2511739 ± 1068
K2672–82274837 ± 1.663887–41602388 ± 8873570 ± 1800
Mn7–243121 ± 4425–14867 ± 2595 ± 45
Mo27–4935 ± 73–3327 ± 331 ± 7
Pb266–1189595 ± 27880–436208 ± 80408 ± 283
Ni14–2918 ± 46–2920 ± 619 ± 5
Zn806–53011958 ± 1297712–33041593 ± 7121775 ± 1044
Cu12–18755 ± 521–8126 ± 2941 ± 21
Table 2. The relative contributions of natural and anthropogenic sources to elements found in PM2.5.
ElementsSummerWinter
Anthropogenic Source (ng m−3)Natural Source (ng m−3)Anthropogenic Source Percentage (%)Anthropogenic Source (ng m−3)Natural Source (ng m−3)Anthropogenic Source Percentage (%)
As301075.131802088.47
Cd100.00899.82100.01499.85
Cr1701092.241202087.93
K1130126047.122910193060.20
Mn3040.938.91606048.43
Mo300.04499.83300.06799.81
Pb2102091.255902.3999.60
Ni2405081.762906081.83
Zn15904.3899.7319506.6999.66
Cu201.6593.66502.5295.43
Table 3. Comparison of eleven elements concentrations measured in PM2.5 in this study and in other sites (Unit: ng m−3).
CitiesTypeAsCdCrFeKMnMoPbNiZnCuReference
Xi’anwinter2079161208648371213559518195855This study
summer42614213682388672720820159326
Changsha 41 800 9521109[43]
Beijing 98 310 49050[44]
Guangzhou 40 4873387275 4764964463[37]
Yinchuanwinter 5156360 139 191 25415[45]
summer 4197300 183 66 1483
ShanghaiBaoshan325581187 113 1496168154[7]
Putuo28415950 51 1434234929
Huangpu36219682 48 753134433
Jiading27217666 29 673230026
Taiwan 434162 19 283 17711[46]
New York, USA 04160 8 299[47]
Milan, Italy 6310 25 150 170 [40]
Barcelona, Spain 6260 14 120 16032[48]
Southern California, USA 3311553213140.0503911326 [49]
Menen, Belgiumwinter 217021012 5459911[50]
summer 1901005 2144010
Table 4. Average daily dose of each element from different exposure pathways: Ding, ingestion; Dinh, inhalation; Ddermal, dermal contact (Unit: mg kg−1 day−1).
ElementsDing (mg kg−1 day−1)Dinh (mg kg−1 day−1)Dderm (mg kg−1 day−1)
AdultsChildrenAdultsChildrenAdultsChildren
As2.70 × 10−32.16 × 10−24.10 × 10−78.72 × 10−78.23 × 10−63.89 × 10⁻⁵
Cd8.81 × 10−57.05 × 10−41.33 × 10−82.84 × 10−82.68 × 10−71.27 × 10⁻⁶
Cr1.61 × 10−31.29 × 10−22.45 × 10−75.21 × 10−74.92 × 10−62.33 × 10⁻⁵
Mn1.60 × 10−31.28 × 10−22.42 × 10−75.16 × 10−74.87 × 10−62.30 × 10⁻⁵
Pb4.49 × 10−33.59 × 10−26.81 × 10−71.45 × 10−61.37 × 10−56.47 × 10⁻⁵
Ni2.97 × 10−42.37 × 10−34.50 × 10−89.57 × 10−89.04 × 10−74.27 × 10⁻⁶
Zn2.07 × 10−21.66 × 10−13.14 × 10−66.68 × 10−66.31 × 10−52.98 × 10⁻⁴
Cu7.48 × 10−45.99 × 10−31.13 × 10−72.41 × 10−72.28 × 10−61.08 × 10⁻⁵
Table 5. The lifetime average daily dose (LADD) of cancer elements via inhalation pathway (Unit: mg kg−1 day−1).
ElementsLADD (mg kg−1 day−1)
As2.29 × 10−7
Cd7.46 × 10−9
Cr1.37 × 10−7
Ni2.51 × 10−8
Table 6. Non-cancer risks for each element via three exposure pathways. HQ, hazard quotient; HI, hazard index.
ElementsHQingHQinhHQdermalHI
AdultsChildrenAdultsChildrenAdultsChildrenAdultsChildren
As9.017.21 × 1011.02 × 10−33.22 × 10−36.69 × 10−23.16 × 10−19.0872.41
Cd8.81 × 10−27.05 × 10−14.45 × 10−59.47 × 10−55.37 × 10−32.54 × 10−20.090.73
Cr3.23 × 10−12.588.55 × 10−31.82 × 10−21.97 × 10−29.30 × 10−20.352.69
Mn3.40 × 10−22.72 × 10−11.73 × 10−23.69 × 10−22.03 × 10−39.60 × 10−30.050.32
Pb1.281.03 × 1011.93 × 10−44.12 × 10−42.61 × 10−21.23 × 10−11.3110.39
Ni1.48 × 10−21.19 × 10−12.18 × 10−64.65 × 10−69.04 × 10−44.27 × 10−30.020.12
Zn6.91 × 10−25.52 × 10−17.13 × 10−69.27 × 10−61.05 × 10−34.97 × 10−30.070.56
Cu2.02 × 10−21.62 × 10−12.82 × 10−66.00 × 10−61.20 × 10−35.67 × 10−30.020.17
Total1.08 × 1018.67 × 1012.71 × 10−25.56 × 10−21.23 × 10−15.83 × 10−110.9987.39

