

Atmosphere, Volume 8, Issue 6 (June 2017) – 18 articles
Cover Story (view full-size image):
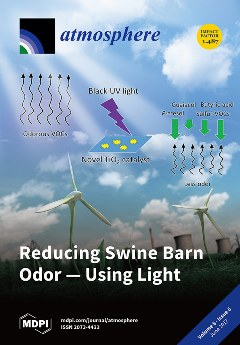
Concentrated livestock feeding operations have become a source of odorous gas emissions that impact air quality. Comprehensive and practical technologies are needed for a sustainable mitigation of the emissions. In this study, we advance the concept of using a catalyst for barn walls and ceilings for odor mitigation. Significant removal of several key odorants was achieved in lab-scale using treatment times consistent with typical barn ventilation rates. Of particular interest is the removal of p-cresol, a 'signature' gas thought to be one of the characteristic compounds responsible for livestock odor far downwind from livestock operations. View this paper.
- Issues are regarded as officially published after their release is announced to the table of contents alert mailing list.
- You may sign up for e-mail alerts to receive table of contents of newly released issues.
- PDF is the official format for papers published in both, html and pdf forms. To view the papers in pdf format, click on the "PDF Full-text" link, and use the free Adobe Reader to open them.
Previous Issue
Next Issue