
Evaluation and Parameter Optimization of Monthly Net Long-Wave Radiation Climatology Methods in China


1
Jiangsu Key Laboratory of Agricultural Meteorology, Nanjing University of Information Science & Technology, Nanjing 210044, China
2
Atmospheric Science and Satellite Remote Sensing Key Laboratory of Anhui Province, Anhui Meteorological Institute, Hefei 230031, China
3
Anhui Agrometeorological Center, Hefei 230031, China
4
Anhui Climate Center, Hefei 230031, China
*
Author to whom correspondence should be addressed.
Atmosphere 2017, 8(6), 94; https://doi.org/10.3390/atmos8060094
Submission received: 4 March 2017
/
Revised: 13 May 2017
/
Accepted: 17 May 2017
/
Published: 23 May 2017
(This article belongs to the Section Meteorology)
Abstract
:Based on surface radiation balance data and meteorological observations at 19 radiation stations in China from 1993 to 2012, we assessed the applicability of seven empirical formulas for the estimation of monthly surface net long-wave radiation (Rnl). We then established a revised method applicable to China by re-fitting the formula using new observational data. The iterative solution method and the multivariate regression analysis method with the minimum root mean square error (RMSE) were used as the objective functions in the revised method. Meanwhile, the accuracy of the CERES (Clouds and the Earth’s Radiant Energy System) estimated Rnl was also evaluated. Results show that monthly Rnl over China was underestimated by the seven formulas and the CERES data. The Tong Hongliang formula with lowest errors was the best among the seven formulas for estimating Rnl over China as a whole, followed by the Penman and the Deng Genyun formulas. The estimated Rnl based on the CERES data also showed relatively higher precision in accordance with the three formulas mentioned above. The FAO56-PM formula (Penman–Monteith formula recommended in the No. 56 report of the Food and Agriculture Organization) without calibration was not applicable to China due to its low accuracy. For individual stations, the Deng Genyun formula was the most accurate in the eastern plain area, while the Tong Hongliang formula was suitable for the plateau. Regional formulas were established based on the geographical distribution of water vapor pressure and elevation over China. The revised national and regional formulas were more accurate than the seven original formulas and the CERES data. Furthermore, the regional formulas produced smaller errors than the national formula at most of the stations. The regional formulas were clearly more accurate than the Deng Genyun formula at stations in Northwestern China and on the Tibetan Plateau. They were also more accurate than the Tong Hongliang formula at the stations located in the eastern area. Therefore, the regional formulas developed in this study are recommended as the standard climatology formulas to calculate monthly Rnl over China.
1. Introduction
Surface net long-wave radiation (Rnl) represents the difference between the upward long-wave radiation emitted from the surface and the downward long-wave radiation from the atmosphere [1]. It is the quantity of heat loss from the ground surface through Rnl exchange [2]. Rnl is one of the important components to the Earth’s surface radiation balance, and the energy exchange between the ground and the atmosphere. Knowing Rnl is necessary for many meteorological studies, e.g., the forecasting of diurnal temperature variations, minimum air temperatures, nocturnal frosts, and fog [3]. Compared with other components of the radiation balance, although Rnl is difficult to observe directly, which is mainly limited by the lack of sophisticated instrumentation, it still can be determined from components of the radiation balance observations using the surface radiation balance equation at a radiation station [2]. However, the stations with complete radiation balance observations are relatively rare, thus, large-scale and long-term Rnl is difficult to obtain in China. Using empirical or semi-empirical radiation formulas, estimating Rnl could complement the above limits of Rnl in time and space. Empirical formulas are the simplest methods to estimate Rnl, compared with, e.g., remote sensing, linear interpolation, and neural networks [4]. The estimated Rnl can be applied in several fields, such as calculating evapotranspiration.
The surface net long-wave radiation is influenced by surface temperature, air temperature, water vapor pressure, and cloud cover. Many different empirical or semi-empirical formulas have been proposed for Rnl using routine observations of these meteorological factors. The formula of Angstrom [5] estimated Rnl from air temperature, water vapor pressure, and cloud cover. From the 1930s to the 1950s, cloud cover was replaced by relative sunshine duration in the formulas of Brunt [6], Bepлянд [7], and Penman [8]. The formulas of Swinbank [9] and Idso [10] were based on air temperature and cloud cover. The Food and Agriculture Organization (FAO) of the United Nations proposed a revised formula based on the Penman method in the Irrigation and Drainage Papers No. 24 [11] (hereafter FAO24) and No. 56 [12] (hereafter FAO56-PM). The FAO56-PM formula has been applied extensively and globally. The accuracy of the common net long-wave radiation equations adopted in Penman-type evapotranspiration formulas was examined in Japan based on observations [13,14]. Regional formulas were established separately for plains and plateaus in China by Tong using measured air temperature, sunshine duration, and water vapor pressure [15]. The Penman method was improved by Deng based on observed data at the Beijing Radiation Station in China [16]. Formulas to estimate Rnl on the Tibetan Plateau were provided by Ji et al. [17] and Li et al. [18]. The variation characteristics and empirical formulas for estimating the net long-wave radiation flux over the oceans were also studied [19,20,21,22,23,24].
In recent years, less attention has been paid to the climatological estimation of Rnl compared with that of solar radiation. Furthermore, the empirical or semi-empirical formulas for Rnl have been rarely studied because of the lack of measured values, and the FAO56-PM formula has been applied in most studies over China [25,26,27,28,29,30,31,32,33] without calibration. However, the parameterization schemes of existing formulas characterized the atmospheric and surface conditions of certain spaces and periods, and are probably not appropriate to China based on the new observations. Thus, due to climate change and regional specificity, calibration must be carried out to improve empirical coefficients to estimate Rnl more accurately in China. Where measurements of the surface radiation balance are available, calibration of Rnl can be conducted. The objective of this study was to assess the applicability of the existing seven empirical formulas for estimating Rnl and make a regional calibration using radiation measurements over China to improve the performance of the method for estimating Rnl in China. The satellite estimated datasets of long-wave radiation of the Clouds and Earth’s Radiant Energy System (CERES) have been widely used in various applications. The accuracy of the surface net long-wave radiation fluxes from CERES Energy Balanced And Filled (EBAF)-Surface Edition 2.8 (National Aeronautics and Space Administration, Washington, DC, USA) is also evaluated along with others from the seven formulas mentioned above.
2. Data and Methods
2.1. Data
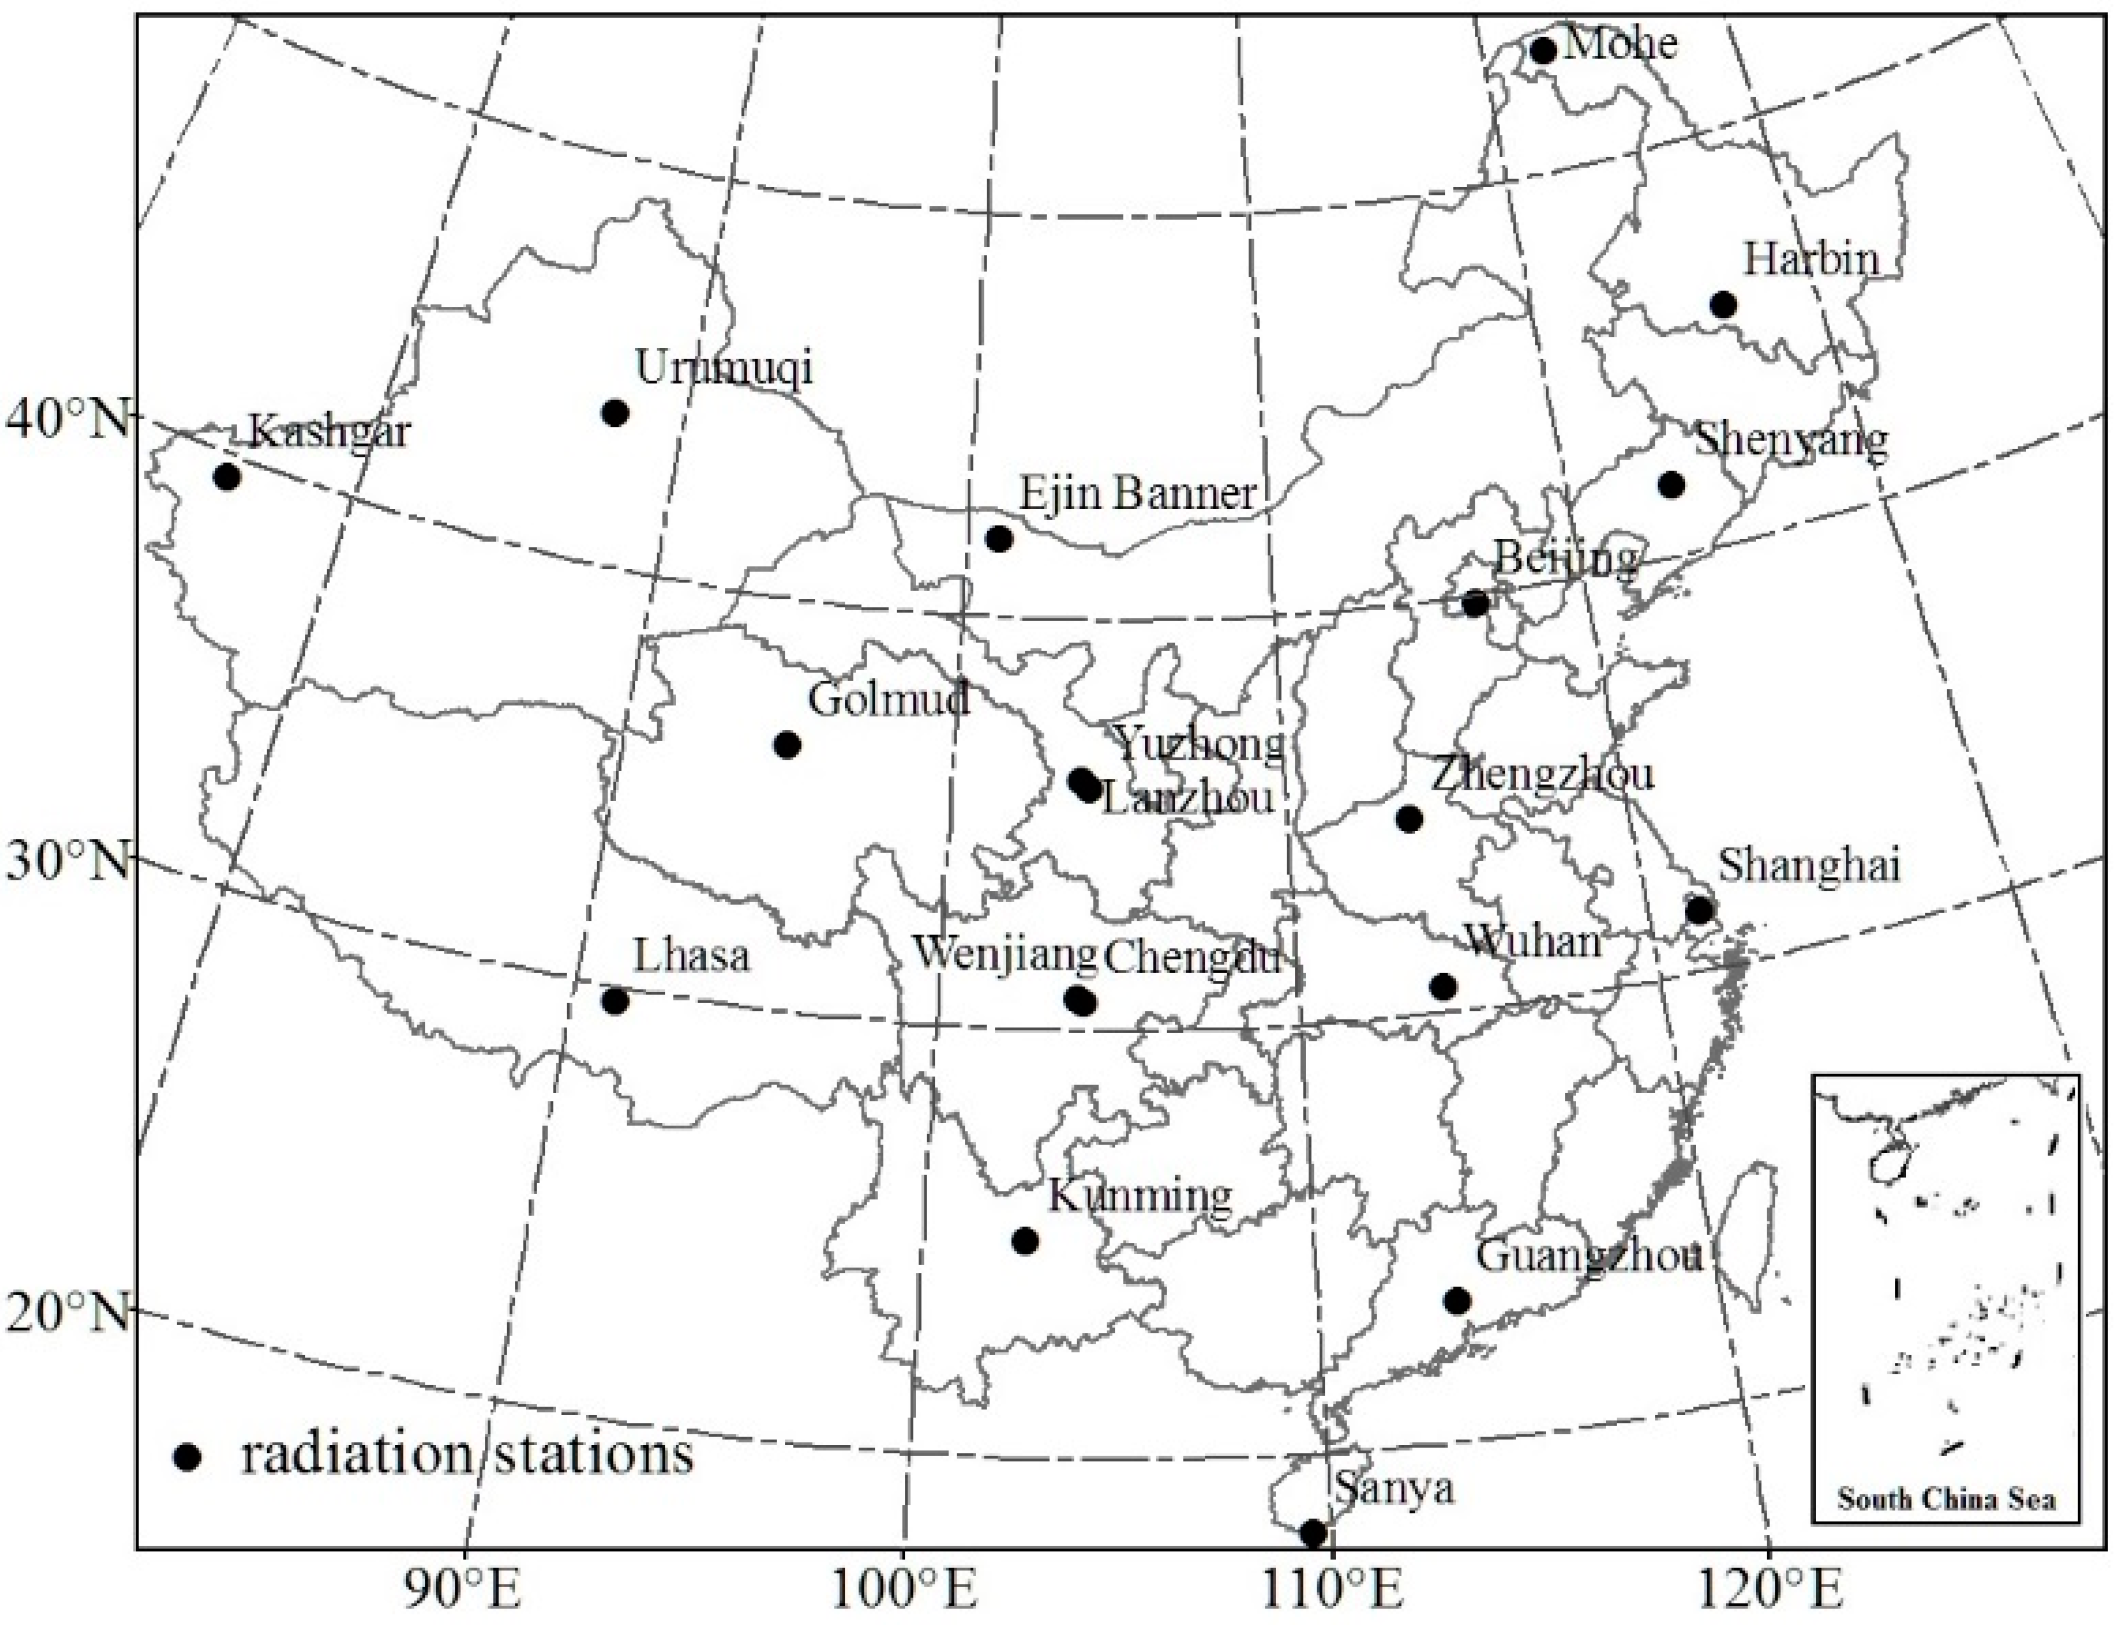
High-quality monthly observations of net radiation, solar radiation, reflected radiation, maximum and minimum air temperature, water vapor pressure, and sunshine duration were collected at 19 radiation stations in China during 1993–2012 (Table 1). The 19 stations are nearly uniformly distributed across the whole country (Figure 1). The radiation data were measured using automatic thermoelectric pyranometers. The observed data, latitude, longitude, and elevation of the stations were provided by the National Meteorological Information Center (NMIC) of the China Meteorological Administration (CMA). Radiation and meteorological measurements made at the stations were carefully checked using quality control procedures, and quality control flags were supplied with the data by NMIC. In order to ensure the veracity of the evaluation, 4.56% of the total samples were removed if the radiation observation is missing. Some missing meteorological data were estimated by averaging the observed values over 1993–2012 at the same station.
As one of the highest priority scientific satellite instruments developed for NASA’s Earth Observing System (EOS), CERES sensors were placed onboard the Terra and Aqua satellites. EBAF-Surface Ed 2.8 is one of the CERES products, which provides monthly and climatological averages of computed fluxes of the Earth’s surface. CERES EBAF-Surface Ed 2.8 data of surface net long-wave radiation are available online from the CERES website [34]. The CERES data products use meteorological assimilation data from the Goddard Earth Observing System (GEOS-4 and 5) Data Assimilation System reanalysis to characterize the atmospheric state. GEOS-4 was used from March 2000 through December 2007, and GEOS-5 was used beginning in January 2008. The CERES EBAF-Surface Ed 2.8 data during the period of March 2000 to December 2012 were interpolated into the station points listed in Table 1 by bi-linear interpolation, so they could be compared with the standard Rnl over China.
Observations of the surface energy balance in China were initiated at the radiation stations in January 1993, however, observations of the Rnl were not made at that time. Rnl at a radiation station can be determined from components of the radiation balance observations using the surface radiation balance equation:
where Rn is the net radiation, Rs is the solar radiation, Rk is the reflected radiation, and Rnl is the net long-wave radiation. Rs represents the incoming radiation energy, and Rk and Rnl are the short-wave and long-wave radiation energy loss, respectively. Rn, Rs, and Rk have been measured using automatic thermoelectric pyranometers in China since January 1993.
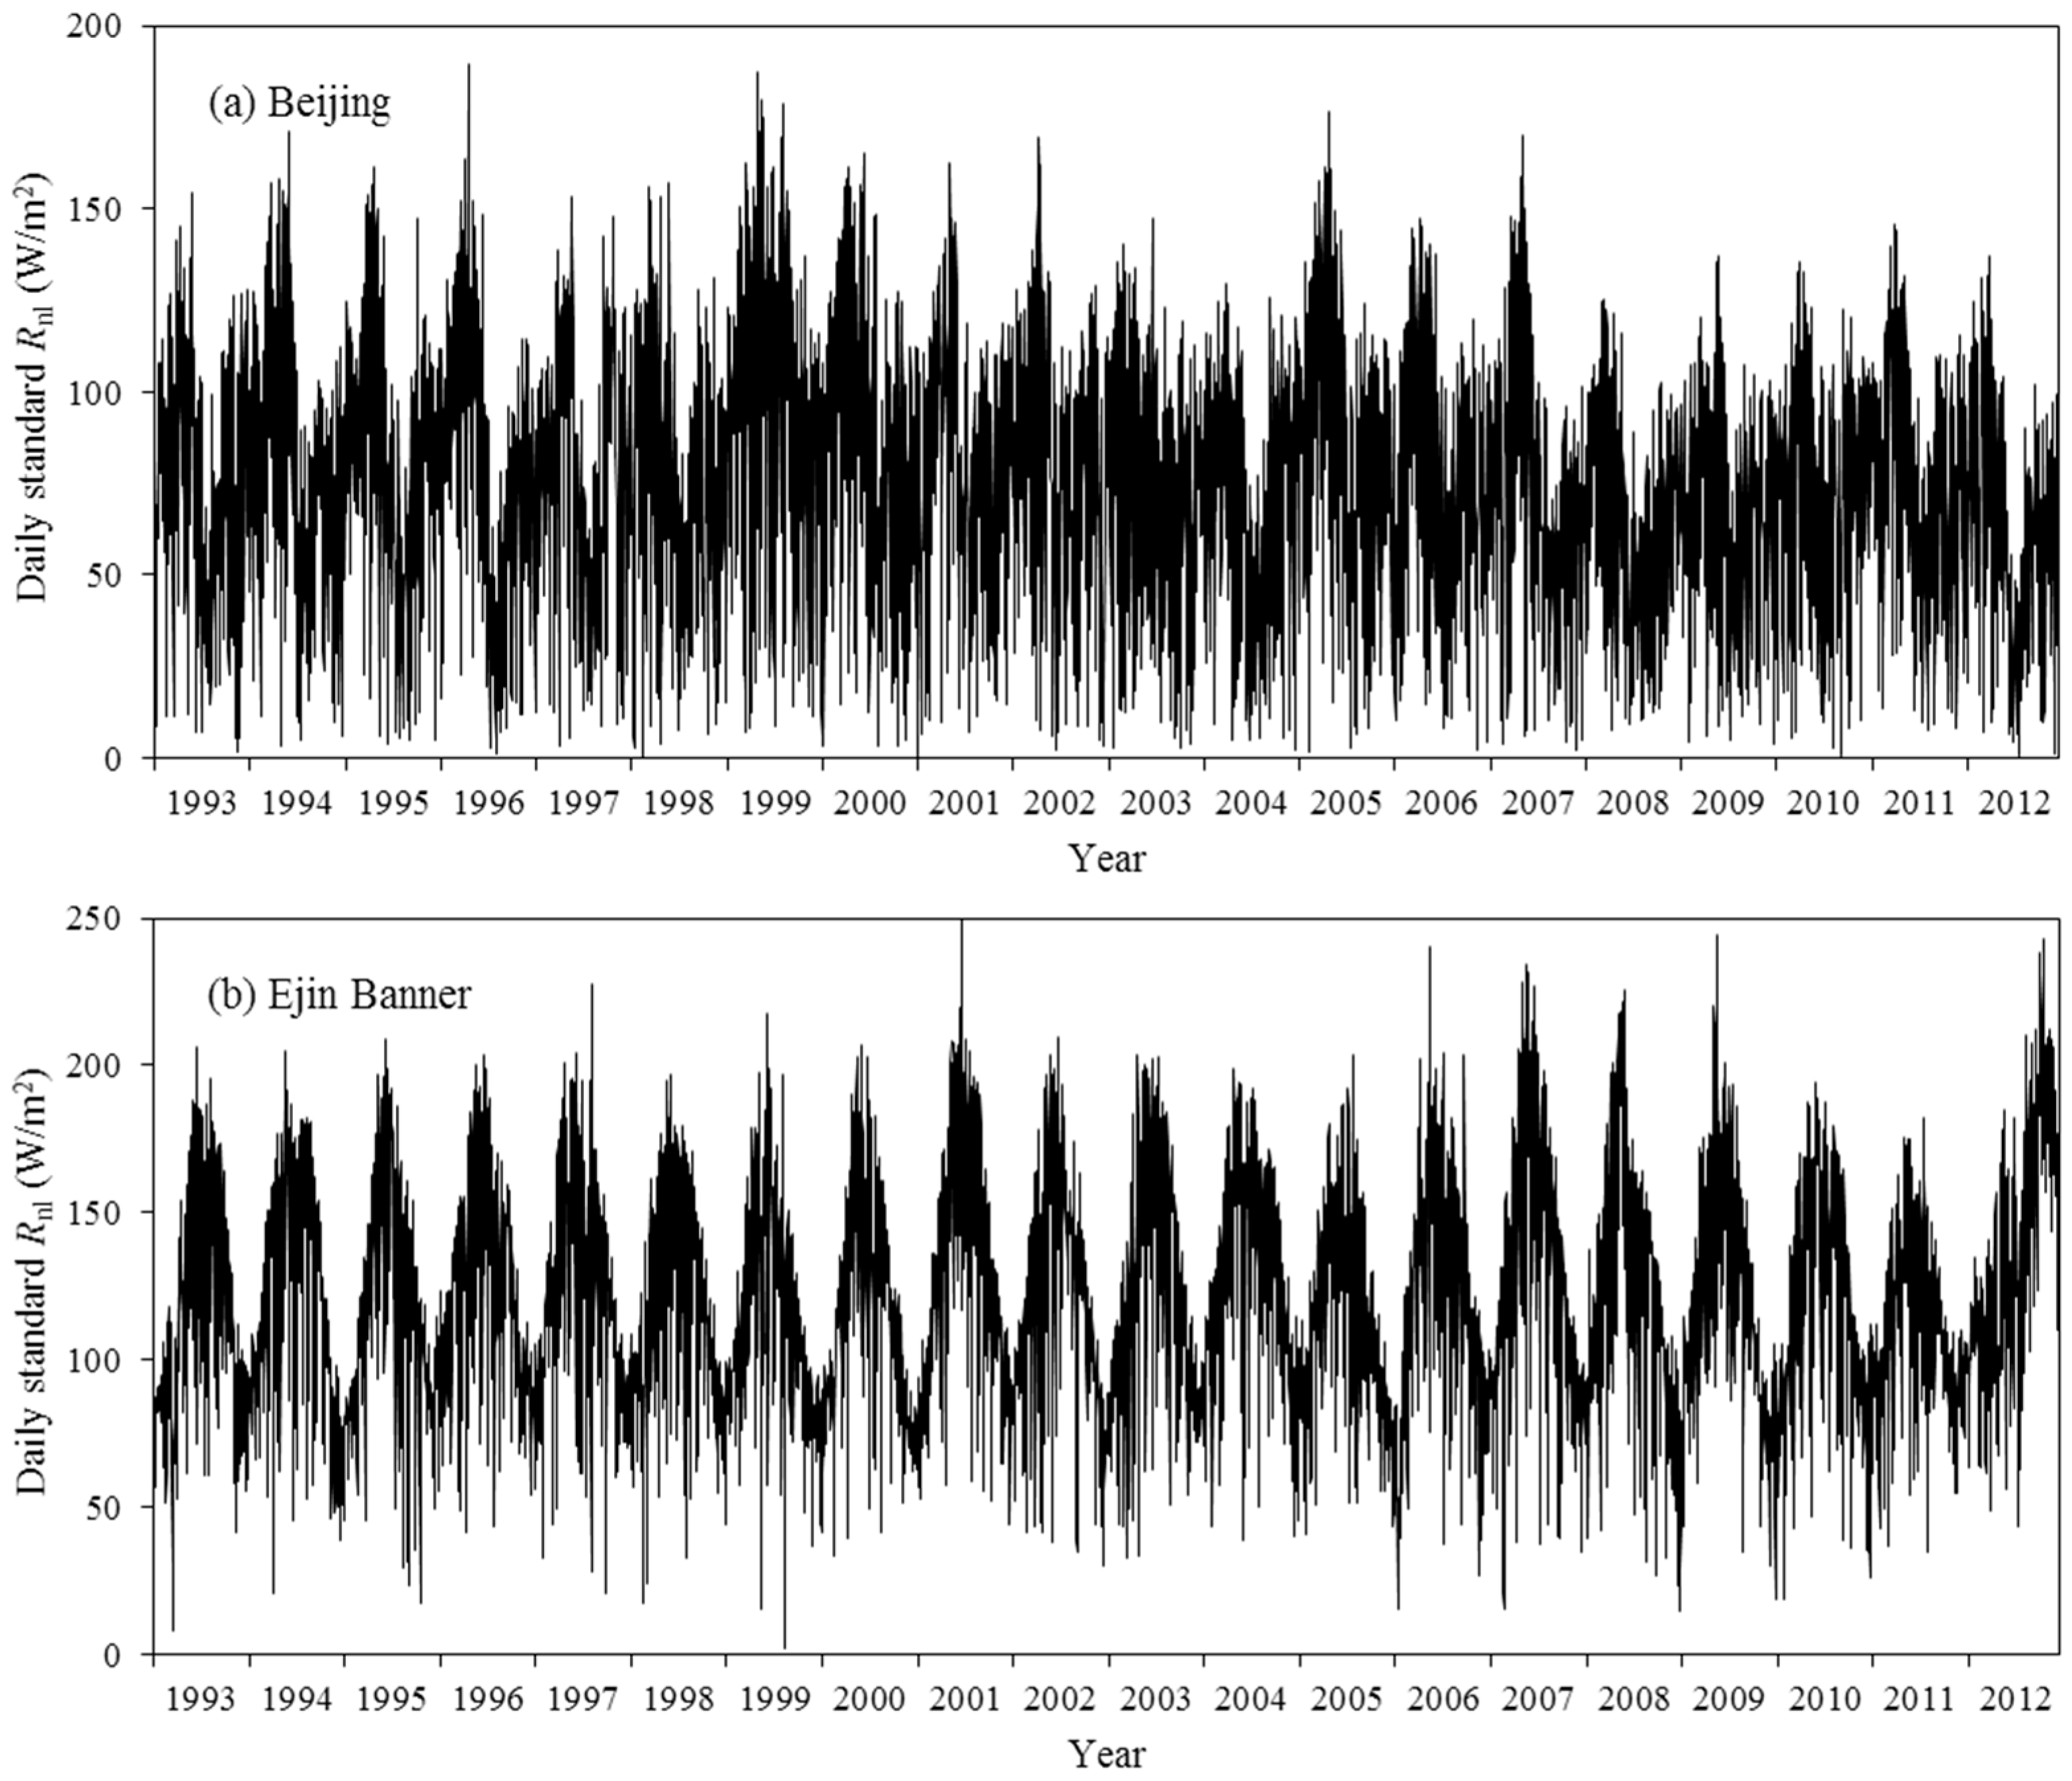
From Equation (1), we obtained monthly Rnl values based on the observations of Rn, Rs, and Rk at the 19 solar radiation stations from 1993 to 2012 as a standard to assess the applicability of the existing seven empirical formulas for computing Rnl, and to establish an optimum net long-wave radiation formula for China. Mean annual values of monthly standard Rnl for each station are listed in Table 1. The values of monthly standard Rnl ranged from 40.3 to 121.5 W/m2 at the 19 stations. Rnl decreased, in general, from Southeast to Northwest China. Lower Rnl occurred in Sichuan Province (Chengdu and Wenjiang), and higher values occurred on the Tibetan Plateau (Golmud and Lhasa) and the northwestern part of Inner Mongolia (Ejin Banner). The range of values and the spatial distribution were similar to some previous studies [35,36,37] and NCEP (National Centers for Environmental Prediction) reanalysis data. Meanwhile, as shown in Table 1, the standard Rnl increased with the station altitude, especially when the altitude above 1000 m. The evolution of standard Rnl at some stations (e.g., Beijing and Ejin Banner) was shown in Figure 2, and it can be seen that the values increased during spring, reaching a maximum in summertime and a minimum in winter. Monthly minimum Rnl varied between 0 and 50.0 W/m2, and the maximum values were between 200.0 and 250.0 W/m2. The standard Rnl at Lhasa station, which were 116.4, 85.8, and 78.7 W/m2 from June to August, respectively, agreed with the measured values of the first and second Tibetan Plateau Meteorology Scientific Experiment [38,39]. The standard Rnl at Wuhan station was 48.6 W/m2, similar to that at the nearby Shouxian station, where the observed values were supported by the Atmospheric Radiation Measurement (ARM) Program. These comparisons showed that the standard monthly Rnl determined from the components of the radiation balance observations using the surface radiation balance equation were credible. In addition, this method was widely applied to calculate Rnl as a standard to establish a climatology formula and temporal-spatial distribution analysis in several studies [15,36,39,40,41] due to the lack of directly-observed data. This confirmed that the Rnl obtained in this study can be applied as the standard for the parameter evaluation and modification of the Rnl climatology formula.
2.2. Methods
2.2.1. Empirical Formulas
We tested the application of the seven existing empirical formulas for computing the monthly surface net long-wave radiation (Rnl). The magnitude of Rnl is influenced by air temperature, surface temperature, humidity, and cloud cover [42]. These formulas were derived on a physical basis and obtained by empirical correlations, and the Rnl was estimated from maximum and minimum air temperature, water vapor pressure, and relative sunshine duration. Rnl can be estimated using the following equation:
where Rnl is the net long-wave radiation (W/m2), σ is the Stefan–Boltzmann constant (5.67 × 10⁻⁸ W/(K4∙m2)), Tmin is the minimum absolute temperature (K), Tmax is the maximum absolute temperature (K), ea is the water vapor pressure (kPa), ns is the actual sunshine duration (hour), Ns is the maximum possible sunshine duration (hour), ns/Ns is the relative sunshine duration, and a0, a1 (kPa−1), and b0 are the coefficients of the parameterization schemes. Ns was calculated based on latitude, elevation, and the number of the day of the year according to the FAO56 report [12].
2.2.2. Analytical Methods
The performance of the existing and refitted formulas reported here was judged based on the correlation coefficient (R), mean bias error (MBE), mean absolute bias error (MABE), mean absolute percentage error (MAPE), and root mean square error (RMSE) between the estimates and the standard values. The MBE reflects the estimation error, where a positive value means a higher estimate and a negative value means a lower estimate, and a smaller absolute MBE indicates a more accurate method [43,44,45]. RMSE reflects the estimated sensitivity and extreme effects of samples, with smaller values indicating better accuracy [46]. MBE, MABE, MAPE, and RMSE are calculated by:
where xi is the observation or standard value; yi is the estimate; and n is the number of samples. For the amount of data in this study, 3894 monthly values of radiation and climate factors based on surface observations and 2459 monthly values of CERES EBAF-Surface Ed 2.8 Rnl data were used.
3. Results and Discussion
3.1. Assessment of the Existing Rnl Empirical Formulas
Based on the observed data during 1993–2012, the monthly Rnl at the 19 solar radiation stations in China was calculated using the seven formulas listed in Table 2. The average standard Rnl of the 19 stations was 75.4 W/m2. The average estimated Rnl based on the Penman, Deng Genyun, and Tong Hongliang formulas and CERES data were 69.1, 61.0, 65.4 and 64.6 W/m2, respectively. They were much closer to the average standard Rnl than those based on the other four formulas; Brunt, Bepлянд, FAO24, and FAO56-PM formulas produced estimated Rnl values of 60.3, 46.1, 44.7, and 42.6 W/m2, respectively. We also compared the R, MBE, MABE, MAPE, and RMSE of the standard and estimated Rnl based on the seven tested formulas, as well as CERES data for the 19 stations (Figure 3 and Table 3). This showed that the Rnl based on the empirical coefficients recommended in the Deng Genyun formula had the highest R compared with the standard values (Figure 3f), followed by the Tong Hongliang formula (Figure 3g). The Rnl based on the Brunt formula had the lowest R (Figure 3a). The MBE of the estimated Rnl was negative for the seven formulas and CERES data, suggesting that Rnl was underestimated by all of the formulas. In particular, the Bepлянд, FAO24, and FAO56-PM simulations were much lower than the standard values for most of the samples (Figure 3c–e) compared with those of the other four formulas.
In general, the Tong Hongliang formula had the highest accuracy with the lowest MABE, MAPE, and RMSE among the seven empirical formulas for estimating monthly Rnl over the whole of China, followed by the Penman and the Deng Genyun formulas. The estimated Rnl based on the CERES data also showed relatively higher precision in accordance with these three formulas mentioned above. The FAO56-PM formula with the lowest accuracy was not applicable to China. These results agreed with the research of Yin et al. [47]. For individual stations, the accuracy of the Deng Genyun formula was the highest on the eastern plains. Compared with the other six formulas, the Deng Genyun formula had the lowest MABE, MAPE, and RMSE at nine stations, including Beijing, Chengdu, Harbin, Mohe, Sanya, Shanghai, Shenyang, Wenjiang, and Zhengzhou (Table 4). The Deng Genyun formula was, therefore, suitable for stations located on the plain in Eastern China at an altitude of less than 600 m. This was most likely because the empirical constants of the relative sunshine duration (ns/Ns) were different from those of the other formulas and correctly described the effect of cloud cover on Rnl. Furthermore, the empirical constants derived from the Beijing station data only using the Deng Genyun formula largely fit east China, suggesting that the coefficient was almost the same for this area. The Tong Hongliang formula was more accurate at stations with an elevation greater than 900 m, including Golmud, Kashgar, Kunming, Lanzhou, Urumuqi, and Yuzhong (Table 4). The Tong Hongliang formula was suitable for the plateau area because of the altitude correction that is applied when calculating the atmospheric moisture. The FAO24 and FAO56-PM formulas showed the lowest accuracy at most of the stations.
3.2. Establishment of Optimal Rnl Empirical Formulas
The partial correlation analysis showed that the estimated errors of the seven tested formulas were mainly related to water vapor pressure or elevation, except for FAO56-PM. Therefore, water vapor pressure and elevation were the two most critical factors affecting the Rnl estimate. In this paper, apart from revising the formula for the whole of China (hereafter, the national formula), we also established revised regional formulas for the eastern and northwestern areas and the Tibetan Plateau, according to the geographical distribution of water vapor pressure and elevation over China.
First, the monthly standard net long-wave radiation at the 19 stations was calculated based on the surface radiation balance equation using observations from 1993 to 2012. Second, the parameter b0 in Equation (2) was iterated with a step of 0.01 from 0 to 1. The maximum and minimum air temperature, water vapor pressure, and relative sunshine duration were used as inputs to obtain a0 and a1 using multivariate regression for different b0. Finally, the Rnl of different b0, a0, and a1 was estimated. The best b0, a0, and a1 was determined using the minimum RMSE between the estimate and standard values as the objective function. Considering the limited data, some samples from odd years (n = 1949) were used to calibrate the parameters, and the other samples from even years (n = 1945) were preserved to validate an optimum net long-wave radiation formula calibration, which is called the validated Rnl. The national and regional formulas are listed in Table 5.
The correlation coefficient, R, between the validated and standard Rnl for national and regional formulas, were 0.85 and 0.87, respectively (Figure 4), which were both higher than those for most of the existing seven formulas evaluated in this study. Some discrepancies existed with Rnl values greater than 120 W/m2. However, the two formulas provided a reasonable simulated Rnl, and the regression equation could adequately describe Rnl and can be used to analyze Rnl. Table 6 presents the MBE, MABE, MAPE, and RMSE of the standard and validated Rnl based on national and regional formulas for the 19 radiation stations. The negative MBE, with an average absolute value of approximately 1.0 W/m2 for the 19 stations, illustrates that Rnl was slightly underestimated by the two revised formulas. Moreover, the validated Rnl had the lowest average MAPE and RMSE of the 19 stations compared with the other formulas listed in Table 2. In general, the Rnl based on the two revised formulas was relatively more accurate compared with the other calculations over China. Therefore, further modifications must be made using meteorological observations when the Rnl formulas are applied.
As a whole, the average MABE, MAPE, RMSE, and absolute MBE of the 19 stations using the regional formula were smaller than those using the national formula (Table 6). Furthermore, the Rnl based on the regional formula showed less MABE, MAPE, and RMSE than that based on the national formula for most stations. The accuracy of the estimated Rnl, in particular, was significantly improved by the regional formula at the stations located in Eastern China (e.g., Beijing, Chengdu, Guangzhou, Harbin, Kunming, Mohe, Sanya, Shanghai, Shenyang, Wenjiang, Wuhan, and Zhengzhou) and the Tibetan Plateau, while it was slightly improved at the stations located in the northwestern area (e.g., Ejin Banner, Kashgar, Lanzhou, Urumuqi, and Yuzhong) compared with the national formula. The results show that the regional formula was more accurate at estimating Rnl in China than the national formula, and it is essential to separate the eastern and northwestern areas, as well as the Tibetan Plateau, in the development of the method for the determination of Rnl.
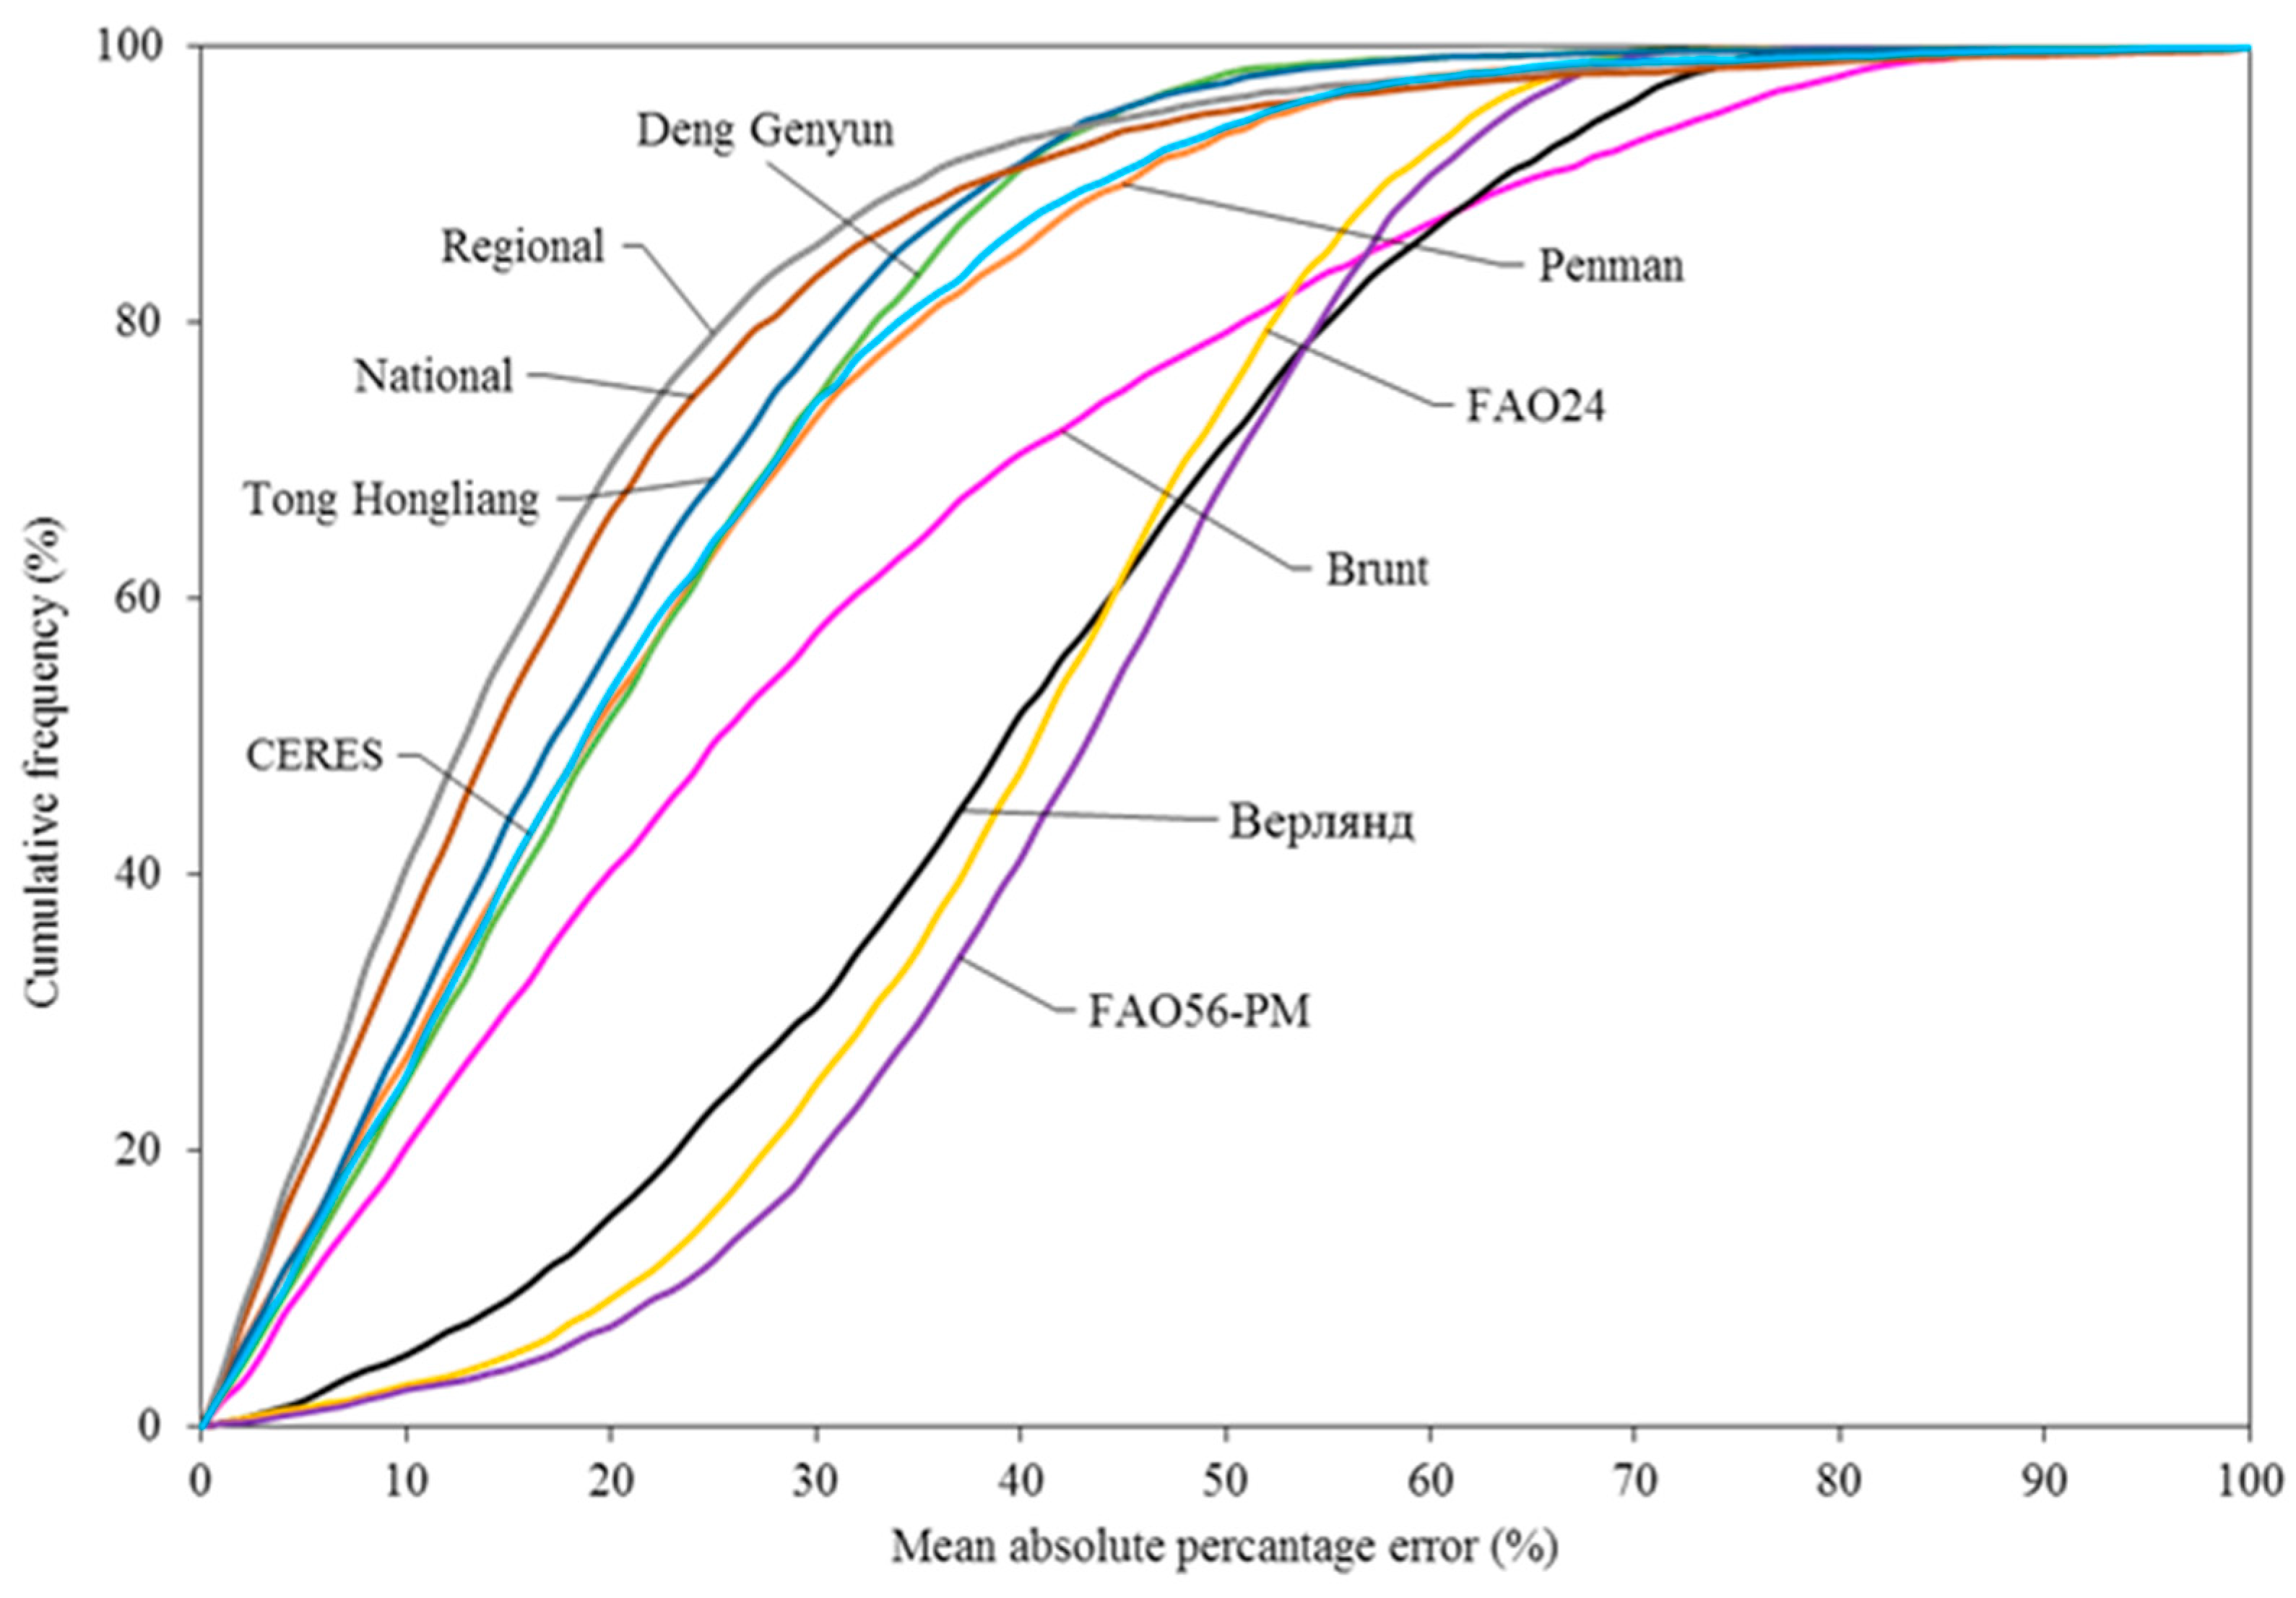
Figure 5 shows the cumulative frequency of MAPE between the standard and estimated monthly net long-wave radiation values based on the seven existing empirical formulas, two refitted formulas, and CERES data. The frequency of MAPE less than 10.0% was 40% and 35% for the revised regional and national formulas, respectively, followed by Tong Hongliang, Deng Genyun, and Penman formulas, as well as CERES data with the frequency ca. 30%, while the frequency did not exceed 5% for Bepлянд, FAO24, and FAO56-PM formulas. The frequency of MAPE less than 15.0% and 20.0% had similar characteristics. When MAPE was over 40.0%, the frequency exceeded 50% for Bepлянд, FAO24 and FAO56-PM formulas. However, the frequency was less than 10% for the revised regional and national formulas. These results illustrated that the calibrated formulas improved the accuracy of estimating Rnl over China compared with the original ones, and were more accurate than the estimations based on the CERES data.
Compared with the other five existing formulas, the Deng Genyun and Tong Hongliang formulas were more accurate at estimating Rnl. Therefore, based on the radiation and observed meteorological data of the 19 radiation stations over China for the full 20 years, we compared the MBE, MABE, MAPE, and RMSE of the standard and estimated Rnl using the revised regional, the Deng Genyun, and the Tong Hongliang formulas to illustrate the effect of the parameter optimization more clearly. Taking the 19 stations as a whole, the correlation between the estimated and standard Rnl using the regional formula was higher than that for the Deng Genyun and Tong Hongliang formulas (Table 7). The MBE of the regional formula was −0.59 W/m2 and the absolute value was much smaller than that of the other two formulas. The regional formula also produced a lower MABE, MAPE, and RMSE, indicating that it was more accurate than the Deng Genyun and Tong Hongliang formulas.
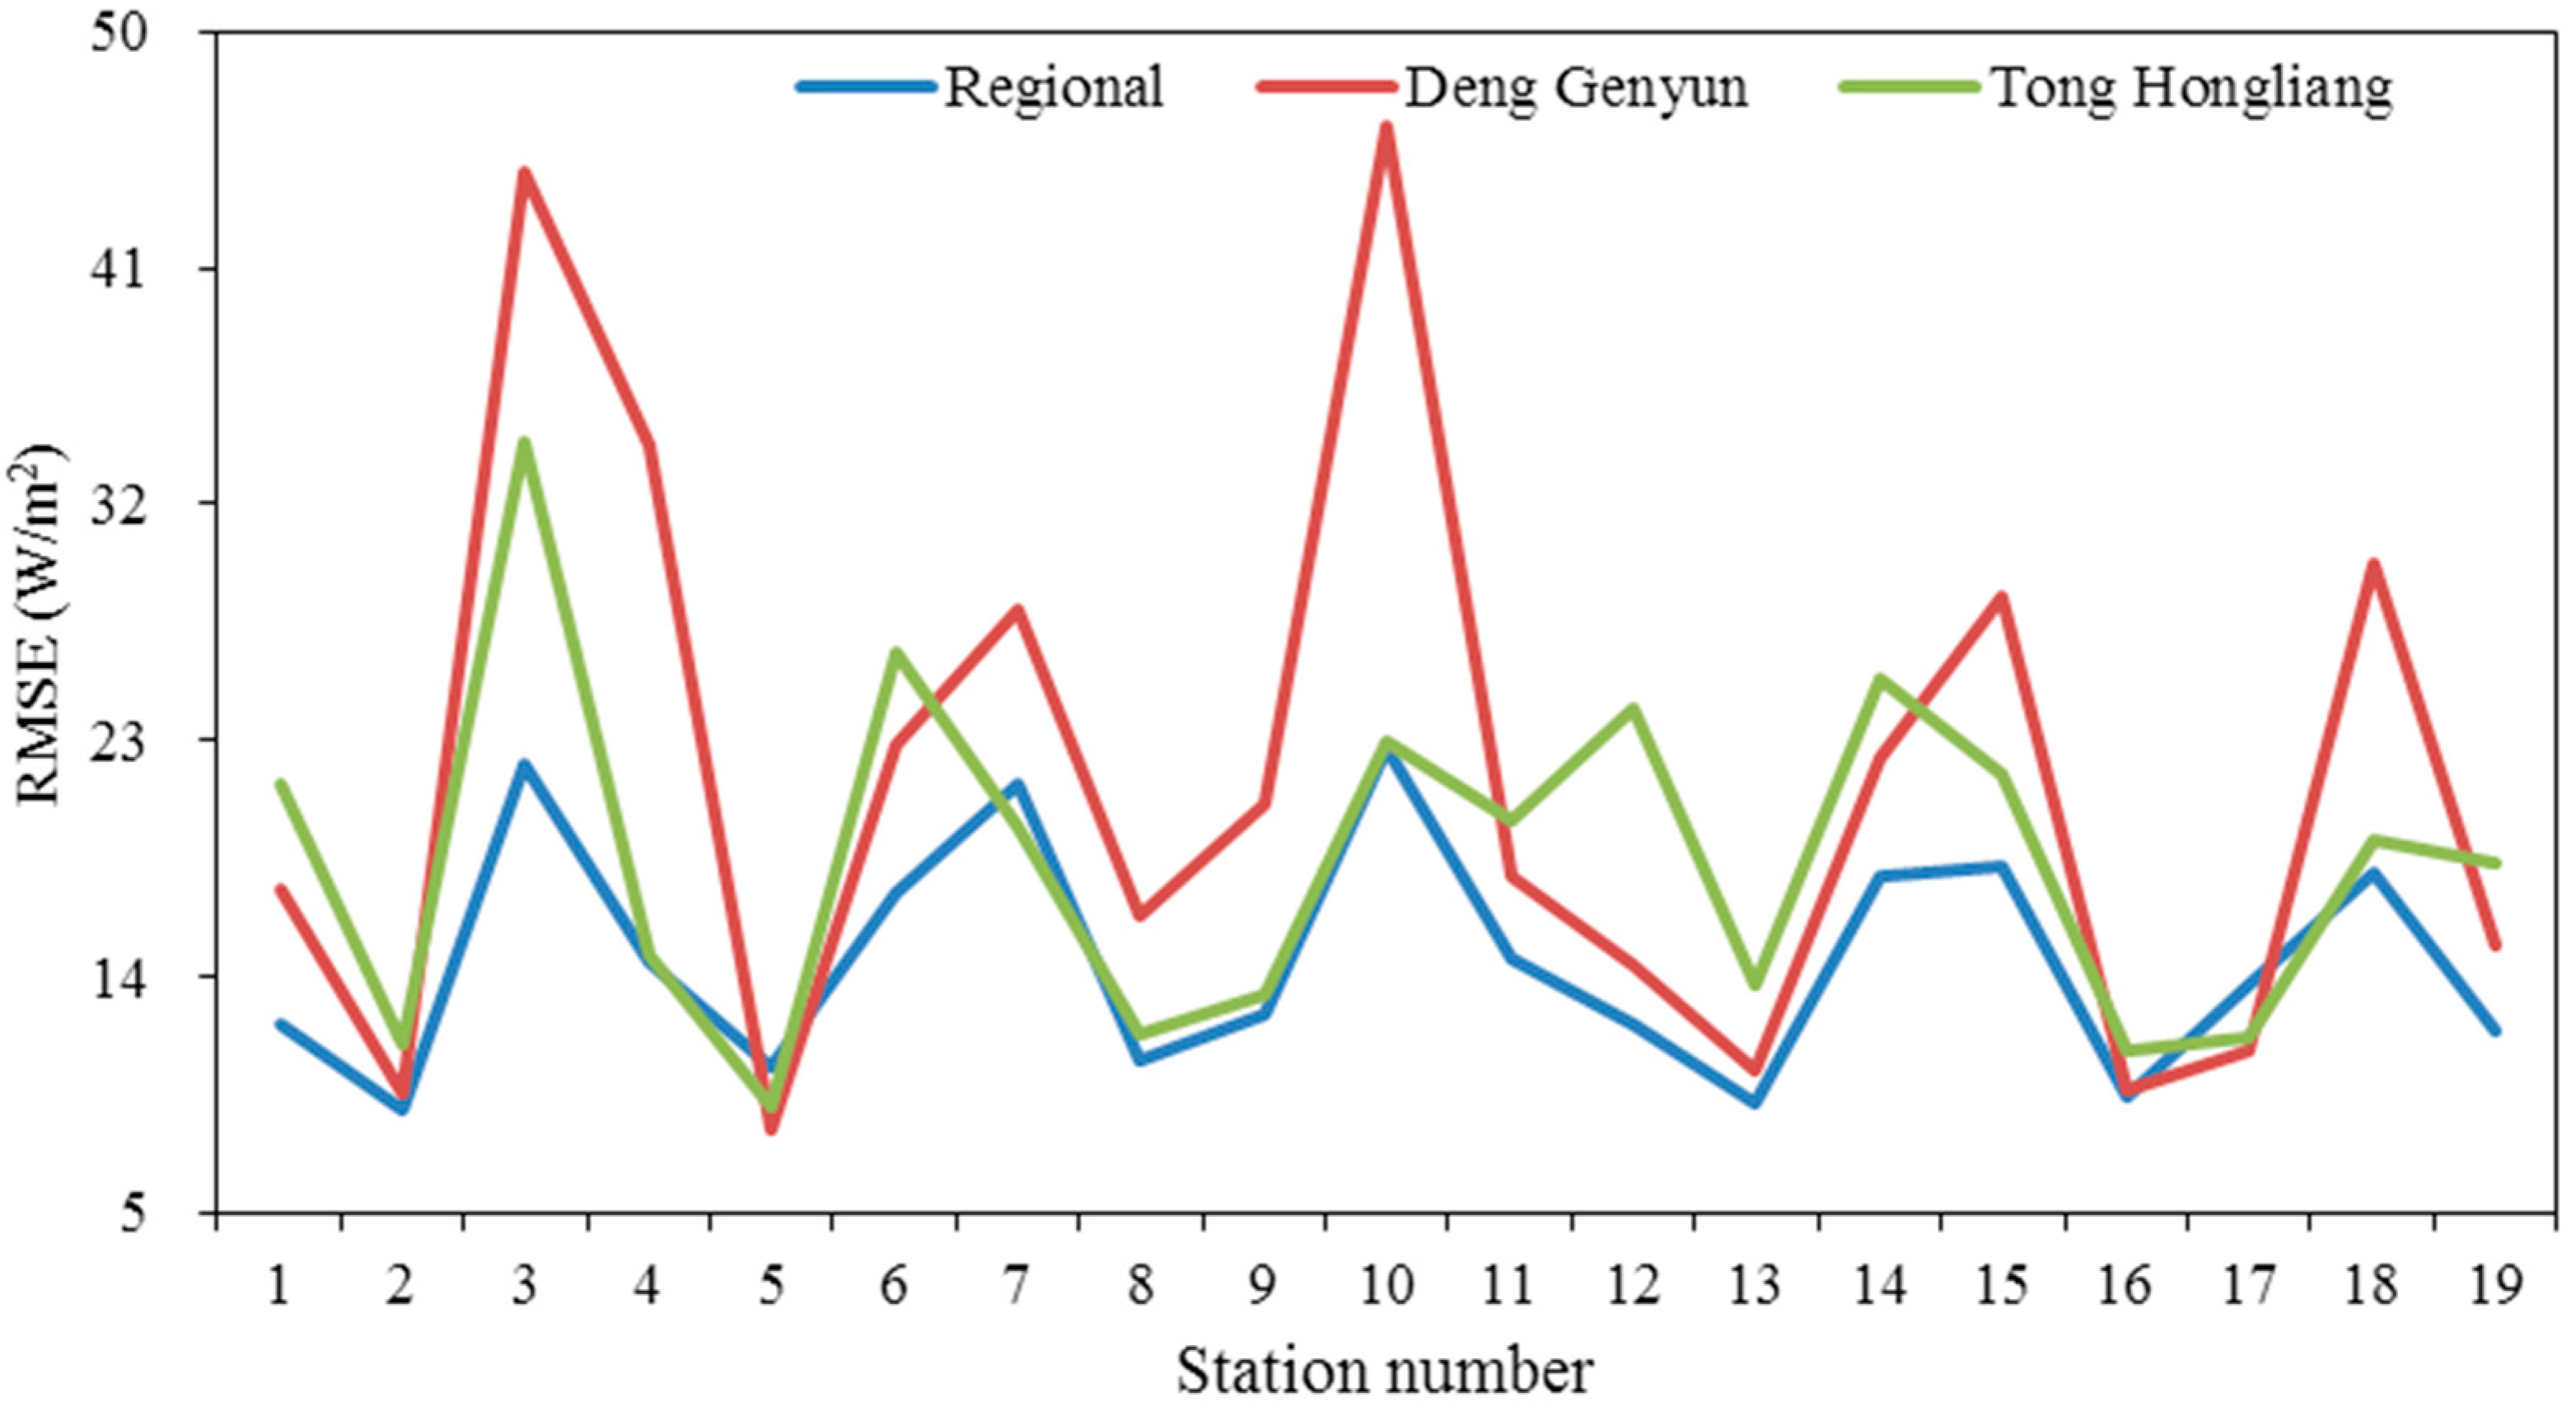
For most of the 19 stations, the RMSE of the Rnl based on the regional formula was the smallest among the three formulas (Figure 6). In particular, the regional formula was clearly more accurate than the Deng Genyun formula at the stations located in Northwestern China (e.g., Ejin Banner, Kashgar, Lanzhou, Urumuqi, and Yuzhong) and the Tibetan Plateau. It was also clearly more accurate than the Tong Hongliang formula at the stations located in the eastern area (e.g., Beijing, Chengdu, Guangzhou, Harbin, Kunming, Mohe, Sanya, Shanghai, Shenyang, Wenjiang, Wuhan, and Zhengzhou). Therefore, we recommend this formula as the standard climatology method to calculate the net long-wave radiation over China.
4. Conclusions
The performance of empirical formulas for the estimation of monthly net long-wave radiation (Rnl), with both original parameter values and recalibrated parameters, was tested and compared at 19 radiation stations in China. Meanwhile, the accuracy of the CERES EBAF-Surface Ed 2.8 estimated Rnl also evaluated, along with others from the seven formulas. The monthly Rnl over China was underestimated by all of the existing formulas with original parameters. The Tong Hongliang formula was the best among these methods for estimating Rnl over China, as a whole, followed by the Penman and the Deng Genyun formulas. The estimated Rnl based on the CERES data also showed relatively higher precision in accordance with the three formulas mentioned above. The FAO56-PM formula, with the lowest precision, was not applicable to China. For individual stations, the accuracy of the Deng Genyun formula was the highest on the eastern plain, while the Tong Hongliang formula was suitable for the plateau area because it includes altitude correction in the atmospheric moisture calculation. The revised formulas with recalibrated parameters were more accurate than the seven original formulas and the estimation based on the CERES data. Furthermore, the regional formula produced smaller errors than the formula for the whole of China at most stations, indicating that it is necessary to distinguish different areas in the development of new methods to determine Rnl. The regional formulas were clearly more accurate than the Deng Genyun formula at the stations located in Northwestern China and the Tibetan Plateau, and were clearly more accurate than the Tong Hongliang formula at the stations located in the eastern area. Therefore, the regional formulas developed in this study are recommended as the standard climatology methods to calculate the monthly net long-wave radiation over China.
Compared with other meteorological factors, the low number of stations, short data length, and relatively large observation errors of surface radiation balance components were the main factors limiting the generality of the results drawn from this study over China. Therefore, multi-source data, such as remote sensing and sounding data, must be applied to develop future net long-wave radiation methods. According to this paper, there are discrepancies between observations and estimations from CERES data at the stations over China, which may be mainly caused by cloud. The difference between the meteorological assimilation data from reanalysis and the actual data may be another cause leading to the error in surface Rnl fluxes. However, with the development of technology, the accuracy of satellite-based data will be improved further. Another future study will be carried out to establish separate formulas for the four seasons to improve the precision and accuracy of the net long-wave radiation calculation. In addition, it should be calculated that Rnl under clear-sky and all-sky conditions in China in the future, following the previous study [48].
Acknowledgments
This investigation was financially supported by the Jiangsu Key Laboratory of Agricultural Meteorology Foundation (grant number KYQ1205) and by the National Natural Science Foundation of China (grant number 41405111).
Author Contributions
Wen Cao and Shuanghe Shen proposed the idea. Chunfeng Duan and Yun Yao processed and analyzed the data. Wen Cao and Chunfeng Duan wrote the paper.
Conflicts of Interest
The authors declare no conflict of interest.
References
- Rodskjer, N. Net long-wave radiation at Uppsala, Sweden. Theor. Appl. Climatol. 1979, 27, 189–192. [Google Scholar] [CrossRef]
- Zhou, S.Z.; Zhang, R.R.; Zhang, C. Meteorology and Climatology; Higher Education Press: Beijing, China, 1990; pp. 40–42. [Google Scholar]
- Jimenez, J.I.; Alados-Arboledas, L.; Castro-Diez, Y.; Ballester, G. On the estimation of long–wave radiation flux from clear skies. Theor. Appl. Climatol. 1987, 38, 37–42. [Google Scholar] [CrossRef]
- Trnka, M.; Zalud, Z.; Eitzinger, J.; Dubrovský, M. Global solar radiation in Central European lowlands estimated by various empirical formulae. Agric. For. Meteorol. 2005, 131, 54–76. [Google Scholar] [CrossRef]
- Angstrom, A.K. On the variation of the atmosphere radiation. Gerl. Beitr. Geophys. 1925, 4, 21–145. [Google Scholar]
- Brunt, D. Notes on radiation in the atmosphere. I. Quart. J. R. Meteor. Soc. 1932, 58, 389–420. [Google Scholar] [CrossRef]
- Lu, B. Probe into the calculating method of evaporation capacity in Poyang Lake. Jiangxi Hydraul. Sci. Technol. 1994, 20, 347–354. [Google Scholar]
- Penman, H.L. Natural Evaporation from Open Water, Bare Soil and Grass. Proc. R. Soc. 1948, A193, 120–145. [Google Scholar] [CrossRef]
- Swinbank, W.C. Long–wave radiation from clear skies. Quart. J. R. Meteorol. Soc. 1963, 89, 339–348. [Google Scholar] [CrossRef]
- Idso, S.B.; Jackson, R.D. Thermal radiation from the atmosphere. J. Geophys. Res. 1969, 74, 5397–5403. [Google Scholar] [CrossRef]
- Doorenbos, J.; Pruitt, W.O. Guidelines for Predicting Crop. Water Requirements; Food and Agriculture Organization of the United Nations: Rome, Italy, 1977; p. 27. [Google Scholar]
- Allen, R.G.; Perreira, L.S.; Raes, D. Crop. Evapotranspiration: Guidelines for Computing Crop. Water Requirements; Food and Agriculture Organization of the United Nations: Rome, Italy, 1998; pp. 51–52. [Google Scholar]
- Matsui, H. Comparison of net longwave radiation equation in penman–type evapotranspiration equation. Trans. Jap. Soc. Irrig. Drain. Rural Eng. 2011, 78, 531–536. [Google Scholar]
- Matsui, H.; Osawa, K. Calibration effects of the net longwave radiation equation in Penman—Type methods at Tateno, Japan. Hydrol. Res. Lett. 2015, 9, 113–117. [Google Scholar] [CrossRef]
- Tong, H.L. A climatic calculation method for the evaporation power in China. J. Nanjing Inst. Meteorol. 1989, 12, 19–33. [Google Scholar]
- Deng, G.Y. A climatic calculative method of evaporation from open water. Acta Meteorol. Sin. 1979, 37, 87–96. [Google Scholar]
- Ji, G.L.; Jiang, H.; Zha, S.F. The computation and some distribution characteristics of effective radiation over the Qinghai–Xizang Plateau and its adjacent areas. Plateau Meteorol. 1987, 6, 141–149. [Google Scholar]
- Li, R.; Zhao, L.; Wu, T.H.; Wu, X.D.; Xiao, Y.; Du, Y.Z.; Qin, Y.H. The impacts of net long–wave radiation on the surface soil thermal regimes over the Qinghai–Tibetan Plateau, China. Environ. Earth Sci. 2016. [Google Scholar] [CrossRef]
- Reed, R.K. Variations in oceanic net long-wave radiation caused by atmospheric thermal structure. J. Geophys. Res. Atmos. 1975, 80, 3819–3820. [Google Scholar] [CrossRef]
- Reed, R.K. On estimation of net long–wave radiation from the oceans. J. Geophys. Res. Atmos. 1976, 81, 5793–5794. [Google Scholar] [CrossRef]
- Siegel, D.A.; Dickey, T.D. Variability of net longwave radiation over the eastern North Pacific Ocean. J. Geophys. Res. Atmos. 1986, 91, 7657–7666. [Google Scholar] [CrossRef]
- Allan, R.P.; Slingo, A. Simulated long–wave clear–sky irradiance over the ocean: Spatial and temporal variability 1979–1993. Phys. Chem. Earth 1998, 23, 599–604. [Google Scholar] [CrossRef]
- Zapadka, T.; Woźniak, S.B.; Woźniak, B. A simple formula for the net long–wave radiation flux in the southern Baltic Sea. Oceanologia 2001, 43, 265–277. [Google Scholar]
- Zapadka, T.; Woźniak, B.; Dera, J. A more accurate formula for calculating the net longwave radiation flux in the Baltic Sea. Oceanologia 2007, 49, 449–470. [Google Scholar]
- Yao, Y.J.; Zhao, S.H.; Zhang, Y.H.; Jia, K.; Liu, M. Spatial and Decadal Variations in Potential Evapotranspiration of China Based on Reanalysis Datasets during 1982–2010. Atmosphere 2014, 5, 737–754. [Google Scholar] [CrossRef]
- Gao, G.; Chen, D.L.; Ren, G.Y.; Chen, Y.; Liao, Y.M. Spatial and temporal variations and controlling factors of potential evapotranspiration in China: 1956–2000. J. Geogr. Sci. 2006, 16, 3–12. [Google Scholar] [CrossRef]
- Xu, C.Y.; Gong, L.; Tong, J.; Chen, D. Decreasing reference evapotranspiration in a warming climate—A case of Changjiang (Yangtze) river catchment during 1970–2000. Adv. Atmos. Sci. 2006, 23, 513–520. [Google Scholar] [CrossRef]
- Li, Z.L.; Li, Z.J.; Xu, Z.X.; Zhou, X. Temporal variations of reference evapotranspiration in Heihe River basin of China. Hydrol. Res. 2013, 44, 904–916. [Google Scholar] [CrossRef]
- Shi, Z.J.; Xu, L.H.; Yang, X.H.; Shan, N. Trends in reference evapotranspiration and its attribution over the past 50 years in the Loess Plateau, China: Implications for ecological projects and agricultural production. Stoch. Environ. Res. Risk A 2016, 31, 1–17. [Google Scholar] [CrossRef]
- Zhang, X.Q.; Ren, Y.; Yin, J.; Zheng, D. Spatial and temporal variation patterns of reference evapotranspiration across the Qinghai–Tibetan Plateau during 1971–2004. J. Geophys. Res. 2009. [Google Scholar] [CrossRef]
- Zhang, Y.Q.; Liu, C.M.; Tang, Y.H.; Yang, Y.H. Trends in pan evaporation and reference and actual evapotranspiration across the Tibetan Plateau. J. Geophys. Res. 2007. [Google Scholar] [CrossRef]
- Gao, Z.D.; He, J.S.; Dong, K.B.; Bian, X.D.; Li, X. Sensitivity study of reference crop evapotranspiration during growing season in the West Liao River basin, China. Theor. Appl. Climatol. 2016, 124, 1–17. [Google Scholar] [CrossRef]
- Huo, Z.L.; Shi, H.B.; Chen, Y.X.; Qu, Z.Y. Spatiotemporal variation and dependence analysis of ET0 in north arid and cold region. Trans. Chin. Soc. Agric. Eng. 2004, 20, 60–63. [Google Scholar]
- CERES EBAF-Surface Product. Available online: https://ceres.larc.nasa.gov/products.php? product=EBAF-Surface (accessed on 6 May 2017).
- Sun, Z.A.; Weng, D.M. Climatological calculation and distributional features of effective radiation over China part II: Empirical computation method and distributional features. J. Nanjing Inst. Meteorol. 1986, 4, 335–347. [Google Scholar]
- Zhu, X.C.; Qiu, X.F.; Zeng, Y.; He, Y.J.; Liu, H.B. The research on the estimation method of effective radiation in China based on remote sensing data. J. Yunnan Univ. 2014, 36, 674–682. [Google Scholar]
- Cao, W.; Duan, C.F.; Yang, T.M.; Liu, R.N. The evaluation and parameter optimization of surface effective radiation climatology model. Acta Meteorol. Sin. 2016, 74, 947–958. [Google Scholar]
- Weng, D.M.; Feng, Y.H. Analysis on the characteristics of effective radiation and atmospheric radiation in summer on the Tibetan Plateau. Chin. Sci. Bull. 1984, 13, 796–799. [Google Scholar]
- Bian, L.G.; Lu, L.H.; Lu, C.G.; Chen, Y.J.; Gao, Z.Q. The characteristics of radiation balance components of the Tibetan Plateau in the summer of 1998. Chin. J. Atmos. Sci. 2001, 25, 577–588. [Google Scholar]
- Sun, Z.A.; Weng, D.M. Climatological calculation and distributional features of effective radiation over China part I: Theoretical discussion of calculation methodology. J. Nanjing Inst. Meteorol. 1986, 3, 228–238. [Google Scholar]
- Li, R.; Zhao, L.; Ding, Y.J.; Shen, Y.P.; Ji, G.L.; Liu, G.Y.; Du, E.J.; Xiao, Y.; Sun, L.C.; Liu, Y.; et al. Variations of Surface Effective Radiation and Its Effect on Superficial Ground Temperatures on Tibetan Plateau. J. Glaciol. Geocryol. 2011, 33, 1022–1032. [Google Scholar]
- Lhomme, J.P.; Vacher, J.J.; Rocheteau, A. Estimating downward long–wave radiation on the Andean Altiplano. Agric. For. Meteorol. 2007, 145, 139–148. [Google Scholar] [CrossRef]
- Stone, R.J. Improved statistical procedure for the evaluation of solar radiation estimation models. Sol. Energy 1993, 5, 289–291. [Google Scholar] [CrossRef]
- Jacovides, C.P.; Kontoyiannis, H. Statistical procedures for the evaluation of evapotranspiration computing models. Agric. Water Manag. 1995, 27, 365–371. [Google Scholar] [CrossRef]
- Itenfisu, D.; Elliott, R.L.; Allen, R.G.; Walter, I.A. Comparison of reference evapotranspiration calculation as part of the ASCE standardization effort. J. Irrig. Drain. Eng. 2003, 129, 440–448. [Google Scholar] [CrossRef]
- Duan, C.F.; Cao, W.; Huang, Y.; Wen, H.Y.; Liu, J.J. Effect of time resolution of meteorological variables on estimation of reference evapotranspiration. Trans. Chin. Soc. Agric. Eng. 2015, 31, 158–164. [Google Scholar]
- Yin, Y.H.; Wu, S.H.; Zheng, D.; Yang, Q.Y. Radiation calibration of FAO56 Penman–Monteith model to estimate reference crop evapotranspiration in China. Agric. Water Manag. 2008, 95, 77–84. [Google Scholar] [CrossRef]
- Bilbao, J.; De Miguel, A. Estimation of daylight downward longwave atmospheric irradiance under clear-sky and all-sky conditions. J. Appl. Meteorol. Clim. 2007, 46, 878–889. [Google Scholar] [CrossRef]
Figure 1.
Distribution of the nineteen radiation stations in China.

Figure 2.
Evolution of daily net long-wave radiation for the period from January 1993 to December 2012 at Beijing (a) and Ejin Banner (b).
Figure 2.
Evolution of daily net long-wave radiation for the period from January 1993 to December 2012 at Beijing (a) and Ejin Banner (b).

Figure 3.
Correlation between the standard and estimated monthly net long-wave radiation based on the seven existing empirical formulas (a) Brunt; (b) Penman; (c) Bepлянд; (d) FAO24; (e) FAO56-PM; (f) Deng Genyun; (g) Tong Hongliang) and CERES data (h) at the nineteen radiation stations.
Figure 3.
Correlation between the standard and estimated monthly net long-wave radiation based on the seven existing empirical formulas (a) Brunt; (b) Penman; (c) Bepлянд; (d) FAO24; (e) FAO56-PM; (f) Deng Genyun; (g) Tong Hongliang) and CERES data (h) at the nineteen radiation stations.
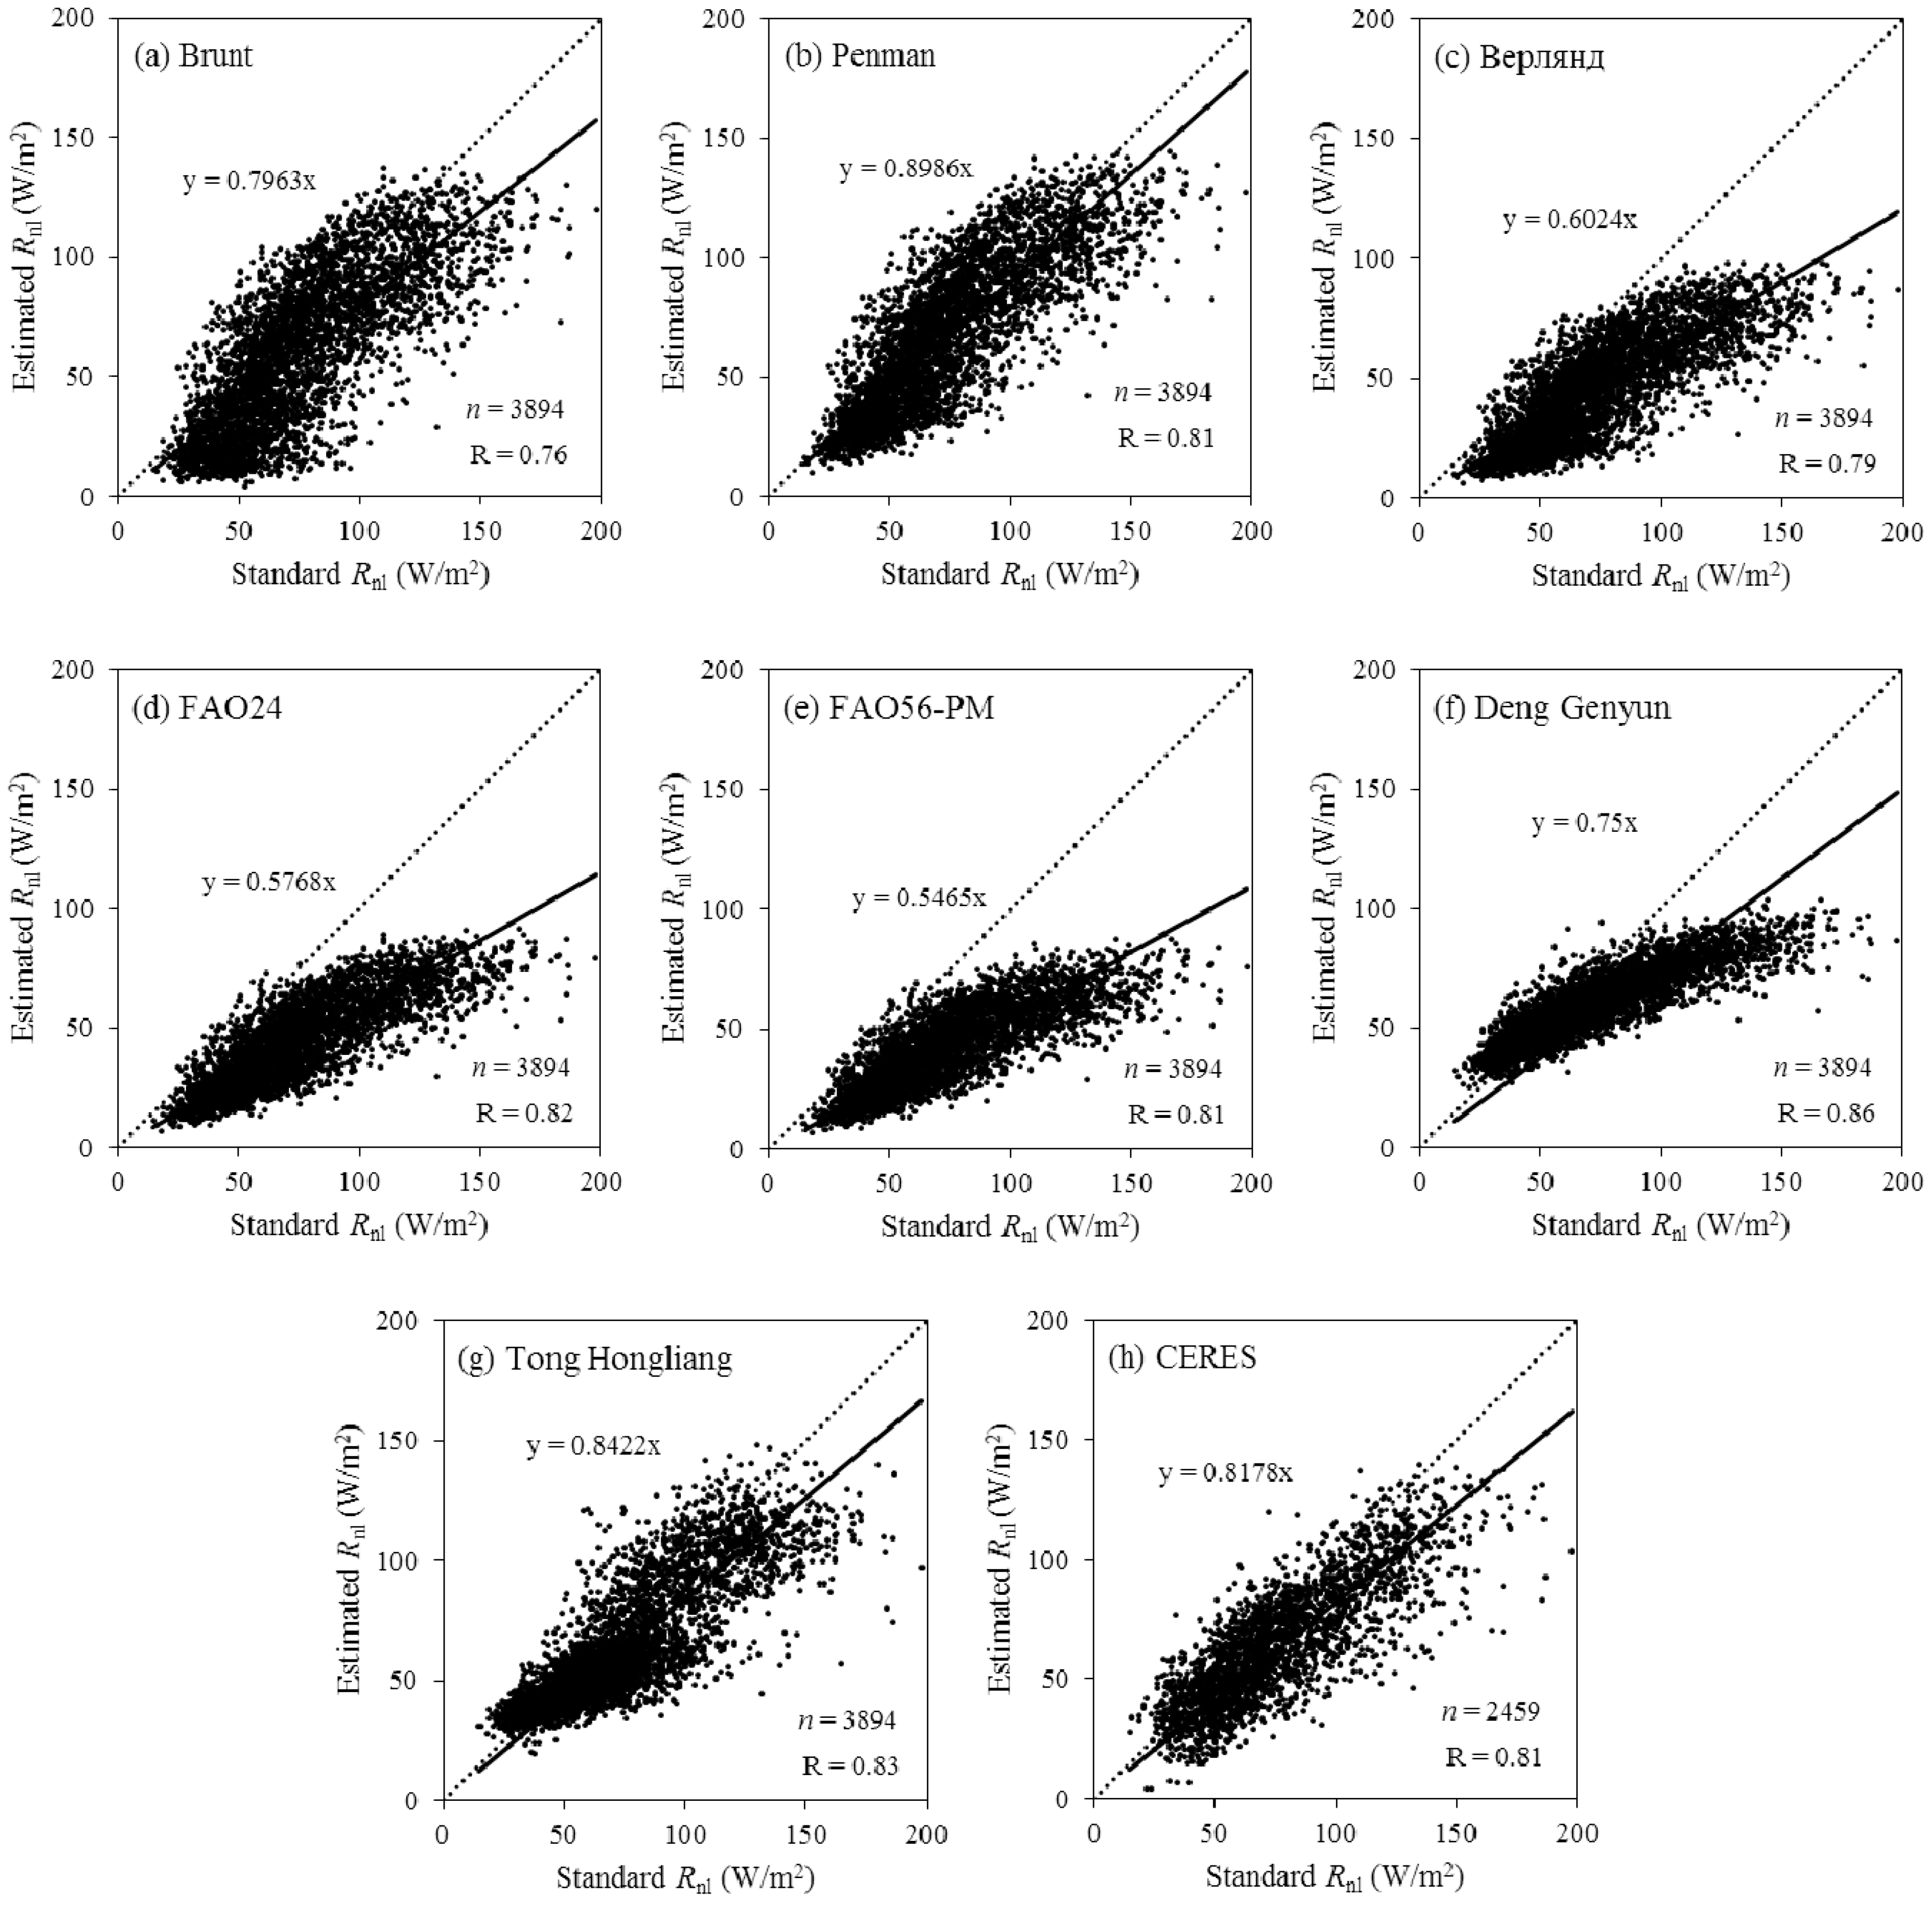
Figure 4.
Correlation between the standard and validated monthly net long-wave radiation (a) national formula; (b) regional formula) at the nineteen radiation stations.
Figure 4.
Correlation between the standard and validated monthly net long-wave radiation (a) national formula; (b) regional formula) at the nineteen radiation stations.
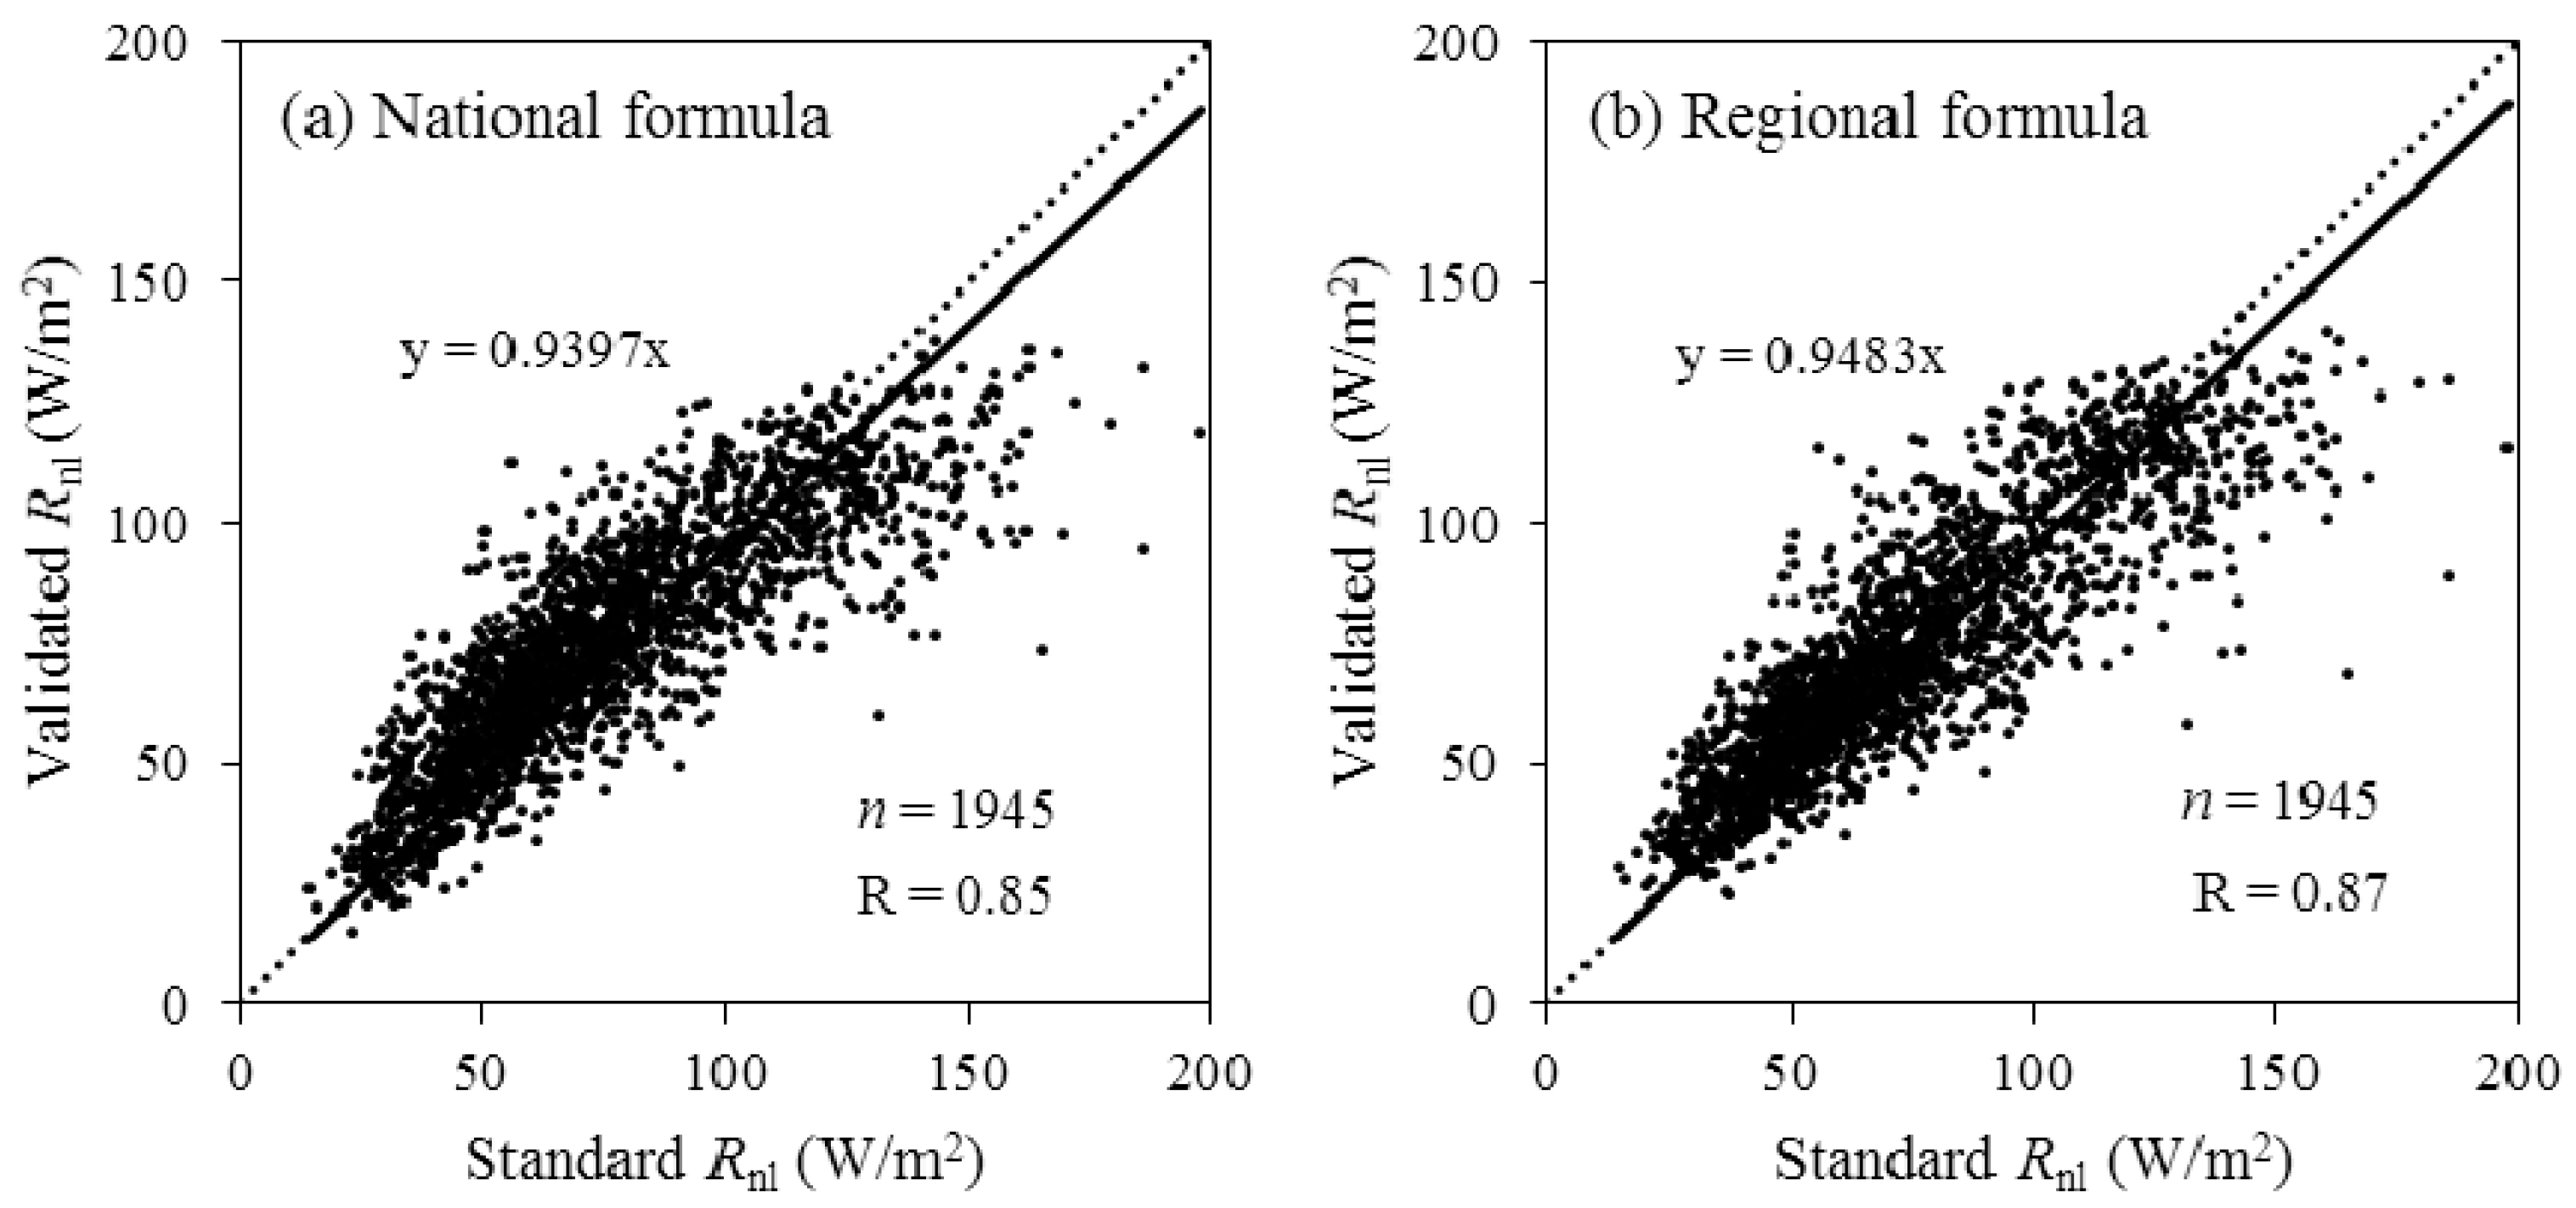
Figure 5.
Cumulative frequency of MAPE between the standard and estimated monthly net long-wave radiation based on the nine empirical formulas and the CERES data.
Figure 5.
Cumulative frequency of MAPE between the standard and estimated monthly net long-wave radiation based on the nine empirical formulas and the CERES data.

Figure 6.
RMSE of the regional, Deng Genyun, and Tong Hongliang formulas compared with the standard net long-wave radiation at nineteen stations in China.
Figure 6.
RMSE of the regional, Deng Genyun, and Tong Hongliang formulas compared with the standard net long-wave radiation at nineteen stations in China.


Table 1.
Radiation stations used in the study.
| No. | Station | Latitude (°N) | Longitude (°E) | Elevation (m) | Observed Period | Standard Rnl (W/m2) |
|---|---|---|---|---|---|---|
| 1 | Beijing | 39.80 | 116.47 | 31.3 | 1993–2012 | 76.0 |
| 2 | Chengdu | 30.67 | 104.02 | 506.1 | 1993–2003 | 40.4 |
| 3 | Ejin Banner | 41.95 | 101.07 | 940.5 | 1993–2012 | 121.5 |
| 4 | Golmud | 36.42 | 94.92 | 2807.6 | 1993–2012 | 106.4 |
| 5 | Guangzhou | 23.22 | 113.48 | 70.7 | 1993–2012 | 44.7 |
| 6 | Harbin | 45.75 | 126.77 | 142.3 | 1993–2012 | 73.9 |
| 7 | Kashgar | 39.47 | 75.98 | 1289.4 | 1993–2012 | 90.8 |
| 8 | Kunming | 25.00 | 102.65 | 1888.1 | 1993–2012 | 71.2 |
| 9 | Lanzhou | 36.05 | 103.88 | 1517.2 | 1993–2004 | 81.0 |
| 10 | Lhasa | 29.67 | 91.13 | 3648.9 | 1993–2012 | 116.1 |
| 11 | Mohe | 52.97 | 122.52 | 433.0 | 1993–2012 | 65.3 |
| 12 | Sanya | 18.22 | 109.58 | 419.4 | 1993–2012 | 64.6 |
| 13 | Shanghai | 31.40 | 121.45 | 5.5 | 1993–2012 | 55.0 |
| 14 | Shenyang | 41.73 | 123.52 | 49.0 | 1993–2012 | 74.0 |
| 15 | Urumuqi | 43.78 | 87.65 | 935.0 | 1993–2012 | 85.1 |
| 16 | Wenjiang | 30.75 | 103.87 | 547.7 | 2004–2012 | 40.3 |
| 17 | Wuhan | 30.60 | 114.05 | 23.6 | 1993–2012 | 48.6 |
| 18 | Yuzhong | 35.87 | 104.15 | 1874.4 | 2005–2012 | 86.9 |
| 19 | Zhengzhou | 34.72 | 113.65 | 110.4 | 1993–2012 | 64.2 |
Table 2.
The seven common formulas to calculate monthly net long-wave radiation.
| Formulas | Equations | No. | |
|---|---|---|---|
| Brunt | (3) | ||
| Penman | (4) | ||
| Bepлянд | (5) | ||
| FAO24 | (6) | ||
| FAO56-PM | (7) | ||
| Deng Genyun | (8) | ||
| Tong Hongliang | Plain | (9) | |
| Plateau | (10) | ||
| (11) | |||
Rnl, σ, Tmin, Tmax, ea, ns, and Ns represent the same factors and constants as above. Rs is the solar radiation, Rso is the clear-sky solar radiation, and Rs and Rso in the FAO56-PM formula were calculated according to the FAO56 report [12]. W∞ is the atmospheric moisture content calculated based on ea and z using Equation (11). Z is the elevation (m).
Table 3.
Comparison of the standard and estimated monthly net long-wave radiation based on the seven existing empirical formulas and CERES data.
Table 3.
Comparison of the standard and estimated monthly net long-wave radiation based on the seven existing empirical formulas and CERES data.
| Formulas | R | MBE (W/m2) | MABE (W/m2) | MAPE (%) | RMSE (W/m2) |
|---|---|---|---|---|---|
| Brunt | 0.762 | –15.152 | 21.061 | 30.266 | 26.420 |
| Penman | 0.809 | –6.280 | 15.662 | 22.068 | 19.972 |
| Bepлянд | 0.795 | –29.302 | 29.707 | 39.294 | 34.967 |
| FAO24 | 0.817 | –30.733 | 30.913 | 39.826 | 36.116 |
| FAO56-PM | 0.809 | –32.771 | 32.904 | 42.078 | 38.426 |
| Deng Genyun | 0.860 | –14.441 | 17.871 | 20.965 | 24.606 |
| Tong Hongliang | 0.827 | –10.027 | 15.107 | 19.562 | 20.092 |
| CERES | 0.814 | –11.941 | 16.454 | 21.819 | 21.612 |
Table 4.
Order of formula precisions for calculating the monthly net long-wave radiation at nineteen radiation stations in China.
Table 4.
Order of formula precisions for calculating the monthly net long-wave radiation at nineteen radiation stations in China.
| Order | 1 | 2 | 3 | 4 | 5 | 6 | 7 | |
|---|---|---|---|---|---|---|---|---|
| Station | ||||||||
| Beijing | Deng | Penman | Tong | Brunt | Bepлянд | FAO24 | FAO56 | |
| Chengdu | Deng | Tong | Penman | Brunt | FAO24 | FAO56 | Bepлянд | |
| Ejin Banner | Penman | Brunt | Tong | Deng | Bepлянд | FAO24 | FAO56 | |
| Golmud | Tong | Penman | Brunt | Deng | Bepлянд | FAO24 | FAO56 | |
| Guangzhou | Tong | Deng | Penman | FAO24 | FAO56 | Brunt | Bepлянд | |
| Harbin | Deng | Penman | Tong | Brunt | Bepлянд | FAO24 | FAO56 | |
| Kashgar | Tong | Deng | Penman | Brunt | Bepлянд | FAO24 | FAO56 | |
| Kunming | Tong | Deng | Penman | Brunt | Bepлянд | FAO24 | FAO56 | |
| Lanzhou | Tong | Penman | Deng | Brunt | Bepлянд | FAO24 | FAO56 | |
| Lhasa | Penman | Tong | Brunt | Deng | Bepлянд | FAO24 | FAO56 | |
| Mohe | Deng | Tong | Penman | Bepлянд | Brunt | FAO24 | FAO56 | |
| Sanya | Deng | Tong | Penman | FAO24 | FAO56 | Bepлянд | Brunt | |
| Shanghai | Deng | Tong | Penman | Brunt | FAO24 | FAO56 | Bepлянд | |
| Shenyang | Deng | Penman | Tong | Brunt | Bepлянд | FAO24 | FAO56 | |
| Urumuqi | Tong | Penman | Brunt | Deng | Bepлянд | FAO24 | FAO56 | |
| Wenjiang | Deng | Tong | Penman | Brunt | FAO24 | Bepлянд | FAO56 | |
| Wuhan | Tong | Deng | Penman | Brunt | FAO24 | FAO56 | Bepлянд | |
| Yuzhong | Tong | Penman | Brunt | Deng | Bepлянд | FAO24 | FAO56 | |
| Zhengzhou | Deng | Tong | Penman | Brunt | Bepлянд | FAO24 | FAO56 | |
Table 5.
Revised national and regional formulas to calculate net long-wave radiation in China.
| Formulas | Stations Used to Modeling | Equations | Area Recommended to Use |
|---|---|---|---|
| National formula | The whole of 19 stations listed in Table 1 | Entire China | |
| Regional formulas | Beijing, Chengdu, Guangzhou, Harbin, Kunming, Mohe, Sanya, Shanghai, Shenyang, Wenjiang, Wuhan, Zhengzhou | Eastern area of China | |
| Ejin Banner, Kashgar, Lanzhou, Urumuqi, Yuzhong | Northwestern area of China | ||
| Golmud, Lhasa | Tibetan Plateau |
Table 6.
Comparison of the standard and validated net long-wave radiation of the nineteen radiation stations based on the revised national and regional formulas.
Table 6.
Comparison of the standard and validated net long-wave radiation of the nineteen radiation stations based on the revised national and regional formulas.
| Errors | MBE (W/m2) | MABE (W/m2) | MAPE (%) | RMSE (W/m2) | |||||
|---|---|---|---|---|---|---|---|---|---|
| Station | National Formula | Regional Formula | National Formula | Regional Formula | National Formula | Regional Formula | National Formula | Regional Formula | |
| Beijing | 6.062 | 1.667 | 10.999 | 9.451 | 16.468 | 13.755 | 13.351 | 11.810 | |
| Chengdu | –1.433 | 1.334 | 6.062 | 5.836 | 16.010 | 16.199 | 7.966 | 7.624 | |
| Ejin Banner | –12.760 | –13.870 | 18.317 | 17.545 | 13.930 | 13.189 | 24.460 | 24.263 | |
| Golmud | –3.966 | 5.671 | 12.389 | 11.556 | 11.915 | 12.353 | 14.804 | 14.069 | |
| Guangzhou | 5.987 | 5.674 | 8.893 | 7.633 | 20.530 | 18.814 | 11.586 | 9.817 | |
| Harbin | –3.596 | –6.722 | 12.149 | 12.168 | 16.021 | 15.571 | 16.292 | 17.012 | |
| Kashgar | 5.154 | 8.064 | 17.366 | 17.258 | 22.973 | 22.674 | 21.290 | 20.924 | |
| Kunming | 1.398 | –2.003 | 9.133 | 8.477 | 13.311 | 12.088 | 11.855 | 11.515 | |
| Lanzhou | 0.351 | 2.086 | 9.911 | 9.901 | 12.237 | 12.639 | 12.457 | 12.432 | |
| Lhasa | –18.152 | –7.855 | 22.229 | 17.911 | 18.108 | 16.064 | 28.025 | 22.961 | |
| Mohe | 3.857 | 0.545 | 13.355 | 12.485 | 23.368 | 21.043 | 15.959 | 15.323 | |
| Sanya | 1.840 | –1.887 | 11.359 | 10.700 | 20.029 | 17.944 | 14.247 | 13.530 | |
| Shanghai | 2.543 | 1.367 | 7.671 | 7.269 | 15.863 | 14.885 | 9.821 | 9.129 | |
| Shenyang | –0.560 | –4.246 | 14.871 | 14.330 | 21.271 | 19.592 | 19.251 | 19.291 | |
| Urumuqi | –3.449 | –1.969 | 14.216 | 12.875 | 17.866 | 16.649 | 19.326 | 17.657 | |
| Wenjiang | –3.927 | –0.925 | 7.595 | 6.844 | 19.754 | 19.035 | 9.127 | 8.562 | |
| Wuhan | 8.449 | 7.134 | 12.434 | 11.451 | 27.807 | 26.069 | 15.069 | 14.104 | |
| Yuzhong | –8.907 | –7.817 | 16.649 | 16.280 | 17.119 | 17.388 | 22.734 | 20.804 | |
| Zhengzhou | –0.046 | –1.610 | 9.437 | 9.092 | 15.097 | 14.193 | 11.984 | 11.786 | |
| Average | –1.113 | –0.808 | 12.370 | 11.530 | 17.878 | 16.850 | 15.769 | 14.874 | |
Table 7.
Comparison of the standard and estimated monthly net long-wave radiation based on the regional, Deng Genyun, and Tong Hongliang formulas.
Table 7.
Comparison of the standard and estimated monthly net long-wave radiation based on the regional, Deng Genyun, and Tong Hongliang formulas.
| Formulas | R | MBE (W/m2) | MABE (W/m2) | MAPE (%) | RMSE (W/m2) |
|---|---|---|---|---|---|
| Regional | 0.870 | –0.590 | 11.536 | 16.601 | 15.432 |
| Deng Genyun | 0.860 | –14.441 | 17.871 | 20.965 | 24.606 |
| Tong Hongliang | 0.827 | –10.027 | 15.107 | 19.562 | 20.092 |
© 2017 by the authors. Licensee MDPI, Basel, Switzerland. This article is an open access article distributed under the terms and conditions of the Creative Commons Attribution (CC BY) license (http://creativecommons.org/licenses/by/4.0/).
Share and Cite
MDPI and ACS Style
Cao, W.; Duan, C.; Shen, S.; Yao, Y. Evaluation and Parameter Optimization of Monthly Net Long-Wave Radiation Climatology Methods in China. Atmosphere 2017, 8, 94. https://doi.org/10.3390/atmos8060094
AMA Style
Cao W, Duan C, Shen S, Yao Y. Evaluation and Parameter Optimization of Monthly Net Long-Wave Radiation Climatology Methods in China. Atmosphere. 2017; 8(6):94. https://doi.org/10.3390/atmos8060094
Chicago/Turabian StyleCao, Wen, Chunfeng Duan, Shuanghe Shen, and Yun Yao. 2017. "Evaluation and Parameter Optimization of Monthly Net Long-Wave Radiation Climatology Methods in China" Atmosphere 8, no. 6: 94. https://doi.org/10.3390/atmos8060094
Note that from the first issue of 2016, this journal uses article numbers instead of page numbers. See further details here.