
Observed Effects of Vegetation Growth on Temperature in the Early Summer over the Northeast China Plain


1
Key Laboratory of Remote Sensing Monitoring of Geographic Environment, Harbin Normal University, Harbin 150025, China
2
Key Laboratory of Land Surface Pattern and Simulation, Institute of Geographical Sciences and Natural Resources Research, Chinese Academy of Sciences, Beijing 100101, China
3
University of Chinese Academy of Sciences, Beijing 100049, China
*
Author to whom correspondence should be addressed.
Atmosphere 2017, 8(6), 97; https://doi.org/10.3390/atmos8060097
Submission received: 8 January 2017
/
Revised: 17 May 2017
/
Accepted: 23 May 2017
/
Published: 25 May 2017
(This article belongs to the Section Biosphere/Hydrosphere/Land–Atmosphere Interactions)
Abstract
:The effect of vegetation on temperature is an emerging topic in the climate science community. Existing studies have mostly examined the effects of vegetation on daytime temperature (Tmax), whereas this study investigates the effects on nighttime temperature (Tmin). Ground measurements from 53 sites across northeastern China (NEC) from 1982 to 2006 show that early summer (June) Tmax and Tmin increased at mean rates of approximately 0.61 °C/10 year and 0.67 °C/10 year, respectively. Over the same period, the satellite-based Normalized Difference Vegetation Index (NDVI) decreased by approximately 0.10 (accounting for 18% of the climatological NDVI for 1982–1991). It is highlighted that a larger increase in Tmax (Tmin) co-occurred spatially with a larger (smaller) decrease in NDVI. Deriving from such spatial co-occurrences, we found that the spatial variability of changes in Tmax (i.e., ΔTmax) is negatively correlated with the spatial variability of changes in NDVI (i.e., ΔNDVI), while the spatial variability of changes in Tmin (i.e., ΔTmin) is positively correlated (r2 = 0.10; p < 0.05) with that of ΔNDVI. Similarly, we detected significant positive correlations between the spatial variability of ΔNDVI and the change in surface latent heat flux (r2 = 0.16; p < 0.01) and in surface air specific humidity (r2 = 0.28; p < 0.001). These findings on the spatial co-occurrences suggest that the vegetation growth intensifies the atmospheric water vapor through evapotranspiration, which enhances the atmospheric downward longwave radiation and strengthens the greenhouse warming effects at night. Thereby, the positive correlation between ΔNDVI and ΔTmin is better understood. These results indicate that vegetation growth may not only exert effects on daytime temperature but also exert warming effects on nighttime temperature by increasing atmospheric water vapor and thus intensifying the local greenhouse effect. This study presents new observation evidence of the effects of vegetation on local temperature.
1. Introduction
The terrestrial biosphere is a key regulator of climate [1,2]. Changes in vegetation may provide feedback to the climate via shifts in the surface energy balance, evapotranspiration, friction, and the resultant effects on surface temperature, precipitation, pressure, and wind. Since the iconic study by Charney et al. [3], which depicted the feedback of vegetation degradation on local precipitation over Sahel, the role of vegetation variations on the weather and climate have been a hot topic in the climate science community. As indicated by the reviews by Pitman et al. [4] and Mahmood et al. [5], the biogeophysical effects of vegetation variation on the global climate may be limited, but the effects on the regional and local weather and climate are significant. Due to such knowledge, vegetation variations are being evaluated to understand past climate changes [6] and predict future climate at the regional scale [7].
It has extensively reported that temperature, as an important metric of climate changes, is significantly regulated by vegetation variations at the regional scale. Most studies have examined the effects of vegetation on daytime temperature, i.e., Tmax. According to the existing studies, we found that there are generally two biogeophysical pathways in which vegetation regulates Tmax. The first pathway is the cooling effect of evapotranspiration (Et). The growth of vegetation leads to an increase in Et and, consequently, a decrease in sensible heat, which directly heats the bottom of the atmosphere. The other pathway is a warming effect due to the decrease in albedo. The albedo of vegetation canopy is smaller than that of bare ground. Vegetation growth would reduce the albedo of the ground surface and, thus, lead to an increase in surface net radiation. Thus, a potential warming effect would occur.
The two abovementioned pathways conflict with each other. The relative strengths of the cooling and warming effects vary with geographic region [8]. The cooling effect would be stronger than the warming effect during the growth season in mid- and low-latitude areas, such as East Asia [9], India [10], the North China Plain [11], and the Tibet Plateau [12]. In these areas, the net biogeophysical effect of vegetation growth is exhibited as surface cooling. The reverse is true in mid- and high-latitude areas, such as around the Arctic [13,14] and East China [15], where the cooling effect would be weaker than the warming effect. In these regions, the net biogeophysical effect of vegetation growth is exhibited as surface warming.
Compared to the prolific results for the effects on Tmax, the knowledge of the regulations of vegetation growth on Tmin is poor. Moreover, the limited number of existing studies have not depicted consistent pathways in which vegetation regulates Tmin. More importantly, these studies were primarily based on model simulations rather than in situ observations. For instance, Collatz et al. [16] reported that vegetation growth could enhance Et and thus enhance the atmospheric vapor and cloud cover fractions. This prevents the emission of longwave radiation, thereby trapping energy at the surface and increasing nighttime temperatures. However, another modeling study by Zhou et al. [17] reported that vegetation growth might cool nighttime temperatures (i.e., Tmin) by enhancing surface emissivity over the Sahel, an arid area.
The poor knowledge of the regulations of vegetation growth on Tmin obstructs us from comprehensively depicting the interactions between vegetation and the atmosphere. Such knowledge shortages thereby limit the development of earth system models and, hence, our ability to predict future climate changes. At present, observation-based studies are needed to enrich our knowledge.
This study aimed to examine the influence of vegetation growth on surface air temperature, especially at night. The examinations were carried out using in situ observation data consisting of ground-based temperature measurements and vegetation growth, which were quantified by the satellite-based Normalized Difference Vegetation Index (NDVI). To explain the potential physical mechanism in which vegetation growth regulates temperature, the ERA-Interim reanalysis dataset was applied. This paper was designed as follows: Section 2 introduced the data and the methods; Section 3 presented the results; finally, in Section 4, the conclusions were drawn, and the implications and uncertainty of the results were discussed.
2. Study Area, Data, and Approach
2.1. Study Area and Data
This study focused on northeastern China, mainly covering the provinces of Heilongjiang, Jilin, and Liaoning (Figure 1). The study area occupies a total of 1.228 million km2, accounting for 12.8% of the total area of China. The study area is characterized by a central plain, namely the Northeast China Plain (NECP) and surrounding mountains. The central plain is mostly covered by cropland. The crop system involves one harvest per year, and the dominant crops are wheat, corn, soybean, and rice. The climate of the study area is dominated by the East Asian Monsoon. The summer is hot and wet, and the winter is cold and dry. The mean temperatures in 1960–2009 in January (July) ranged from approximately −20 °C (21 °C) in the north to −10 °C (25 °C) in the south. The annual precipitation decreased from approximately 800 mm in the east to 400 mm in the west; over two-thirds of the annual rainfall occurs during the summer (June–August).
This study used three categories of datasets: ground-based meteorological measurements, satellite-based NDVI measurements, and reanalysis data. The ground-based measurements were provided by the China Meteorological Administration (CMA). The daily maximum temperature (Tmax), minimum temperature (Tmin), mean relative humidity, and surface pressure were used. Additionally, the daily mean specific humidity (SH), which quantifies the total content of atmospheric vapor, was calculated from these variables. In total, we used data from 53 sites across the NECP (Figure 1). These sites met the following criteria: (1) all had an elevation below 400 m to ensure that the site was located on the plain; (2) all had continuous records from 1982 to 2006 with no missing daily data from March to June; and (3) all were surrounded by cropland throughout the study period. The third criterion was defined as cultivated land being the dominant land use category within 10 km around the site and encompassing more than 33.3% of the area in 1990 and 2000. To ensure compliance with this criterion, we used the 1 km land-use data for the years 2000 and 1990 retrieved from Landsat images and China-Brazil Earth Resources Satellite-1 images [18].
The satellite-based NDVI data were provided by the Global Inventory Monitoring and Modeling Studies (GIMMS) group (https://ecocast.arc.nasa.gov/data/pub/gimms/). The GIMMS NDVI3g data, derived from the NOAA/AVHRR land dataset, were utilized in this study. The dataset has a spatial resolution of 8 km by 8 km and a temporal interval of 15 days for the period from January 1982 to December 2011 [19]. The 15-day interval is a composite period. As the raw NDVI values may be contaminated by non-vegetation factors, such as clouds and smoke, the maximum NDVI values for each 15-day period was selected to represent the vegetation status to minimize non-vegetation effects. The data were also processed to correct the atmospheric effects of two major volcanic eruptions, El Chichón in 1982 and Mount Pinatubo in 1991 [20]. These data have been verified and used extensively to investigate vegetation dynamics [21,22]. In this study, the mean NDVI of a 3-pixel by 3-pixel window around each meteorological site was calculated to determine the NDVI for the site.
In addition to the abovementioned observation data, we used the latest ERA-Interim reanalysis data with a resolution of 0.125 by 0.125 degrees. This dataset was provided by the European Centre for Medium-Range Weather Forecasts [23]. Here, we used the monthly mean of latent heat flux (λE) to the atmosphere and the monthly mean of atmospheric downward longwave radiation (Ld). Based on the 0.125 by 0.125-degree resolution of the reanalysis data, we performed a spatial interpolation using the Kriging method to estimate values for each meteorological site.
2.2. Data Analysis
The observed climate change is determined together by large-scale circulation patterns and local forcings, such as the surface radiation/energy budget, the moisture flux to the atmosphere, and the frictional drag of the surface on the air. Within a specified region, the large-scale circulation patterns provide a homogeneous background, whereas the local forcings exert modifications on the background and result in irregular spatial variability. In other words, individual site observation of climate changes is the combined effects of global warming and local forcings. In the absence of local forcings, the individual site observation of temperature variations would be mostly same as other sites within the small region. Therefore, highlighting the differences of climate changes amplitude among the sites and examining the relations between spatial differences of climate changes amplitude and that of vegetation growth may contribute to our understanding of the effects of vegetation on local weather and climate. Thus, the core idea of this study is to disclose the spatial co-occurrence of meteorological changes amplitude and vegetation growth changes. In other words, we attempted to quantify how the climate changes amplitude matches well with the vegetation changes in the spatial dimension and, then, to present a proposal to explain the relations. Such methodology has been applied by many existing studies [9,11,12,24].
Following the abovementioned methodology, this study first calculated the regional mean temperature variations using the available 53 sites from 1982 to 2006. Since the regional mean variations represent the common signal of the 53 sites, it may be determined by global climate changes. Then, the regional mean variations were subtracted from each individual site observation. The remaining variations, which removed the global change signal, thereby may have resulted from local forcing. Using the remaining variations, the differences between the mean of 1982–1991 (hereafter, the 1980s) and the mean of 1997–2006 (hereafter, the 1990s) were calculated. The differences for each site were defined as local climate changes, because the effects of global climate changes had been removed. Using this method, we calculated the local climate changes for Tmax, Tmin, SH, λE, and Ld. Hereafter, these local climate changes are respectively noted as ΔTmax, ΔTmin, ΔSH, ΔλE, and ΔLd. In addition, we calculated the changes of NDVI from the 1980s to the 1990s and noted it as ΔNDVI.
Next, using the site as a sample, we calculated the Pearson correlations between the local climate changes and ΔNDVI. This correlation represents how the climate changes amplitude matches with the vegetation changes in the spatial dimension. To explain the correlations between ΔT and ΔNDVI and understand their possible physical mechanisms, we also analyzed the Pearson correlations between ΔSH, ΔλE, ΔLd and ΔNDVI.
3. Results
3.1. Changes in NDVI and Temperature
As shown in Figure 2, from the 1980s to the 1990s, the regional mean surface greenness decreased greatly during the early summer and slightly increased during the early spring and late summer. The NDVI in August increased by only 0.02–0.03 and the NDVI in March increased by less than 0.01, whereas the NDVI in June decreased by up to −0.1, accounting for approximately 18% of the climatological mean NDVI of 1982–1991. The spatial distribution of the pixel-based changes shows that there was a widespread decrease in NDVI across the Northeast China Plain, which was predominantly covered by cropland (see Figure 1). In particular, ΔNDVI was as high as −0.15 in the northern part of the study area. However, in the southern part of the study area, ΔNDVI was not as dramatic, reaching approximately −0.05. Thus, ΔNDVI showed a pattern that was characterized by strong surface browning in the north and weak browning in the south.
Along with the surface browning, there was significant climate warming in June across northeastern China from the 1980s to the 1990s. Both the daytime and the nighttime warmed greatly. Tmin increased by 0.67 °C, and Tmax increased by 0.61 °C across the 53 observation sites. As shown in Figure 3, Tmax increased strongly in the western part of the study area and weakly in the northeastern part of the study area, whereas Tmin increased weakly in the north and increased strongly in the central to southern parts of the study area. The pattern of Tmin increase, i.e., nighttime warming, revokes our idea that the strength of climate warming weakens with decreases in latitude from high- to mid-latitudes. This unexpected finding may suggest a contribution by local forcing on the spatial variability of local climate change. By comparing these changes with changes in NDVI, shown in Figure 2, we found that a strong increase in Tmin likely co-occurred with a weak decrease in NDVI, whereas a weak increase in Tmin likely co-occurred with a strong decrease in NDVI.
To exhibit the co-occurrence of changes in temperature and NDVI, we compared the temperature changes for groups of observation sites by ΔNDVI amplitude (Figure 4). The 53 sites were classified into three groups as follows: ΔNDVI > −0.06 (weak browning), −0.06 ≥ ΔNDVI > −0.08 (medium browning), and ΔNDVI ≤ −0.08 (strong browning). Figure 4a,b show that greater Tmax increases and smaller Tmin increases occurred at the sites with greater surface browning. Both Tmax and Tmin increased at rate of 0.53 °C/10 year and 0.71 °C/10 year, respectively, in the weak browning group, whereas Tmax and Tmin increased at rate of 0.69 °C/10 year and 0.65 °C/10 year, respectively, in the strong browning group. Such characteristics were exhibited much more clearly when the regional mean temperature changes were removed. As shown in Figure 4c,d, Tmax decreased and Tmin increased in the weak browning group, whereas Tmax increased and Tmin decreased in the strong browning group. These results suggest that, along with increased surface browning, daytime warming may be intensified while nighttime warming may be slowed. The vegetation degradation would potentially exert a warming effect on daytime and a cooling effect on nighttime.
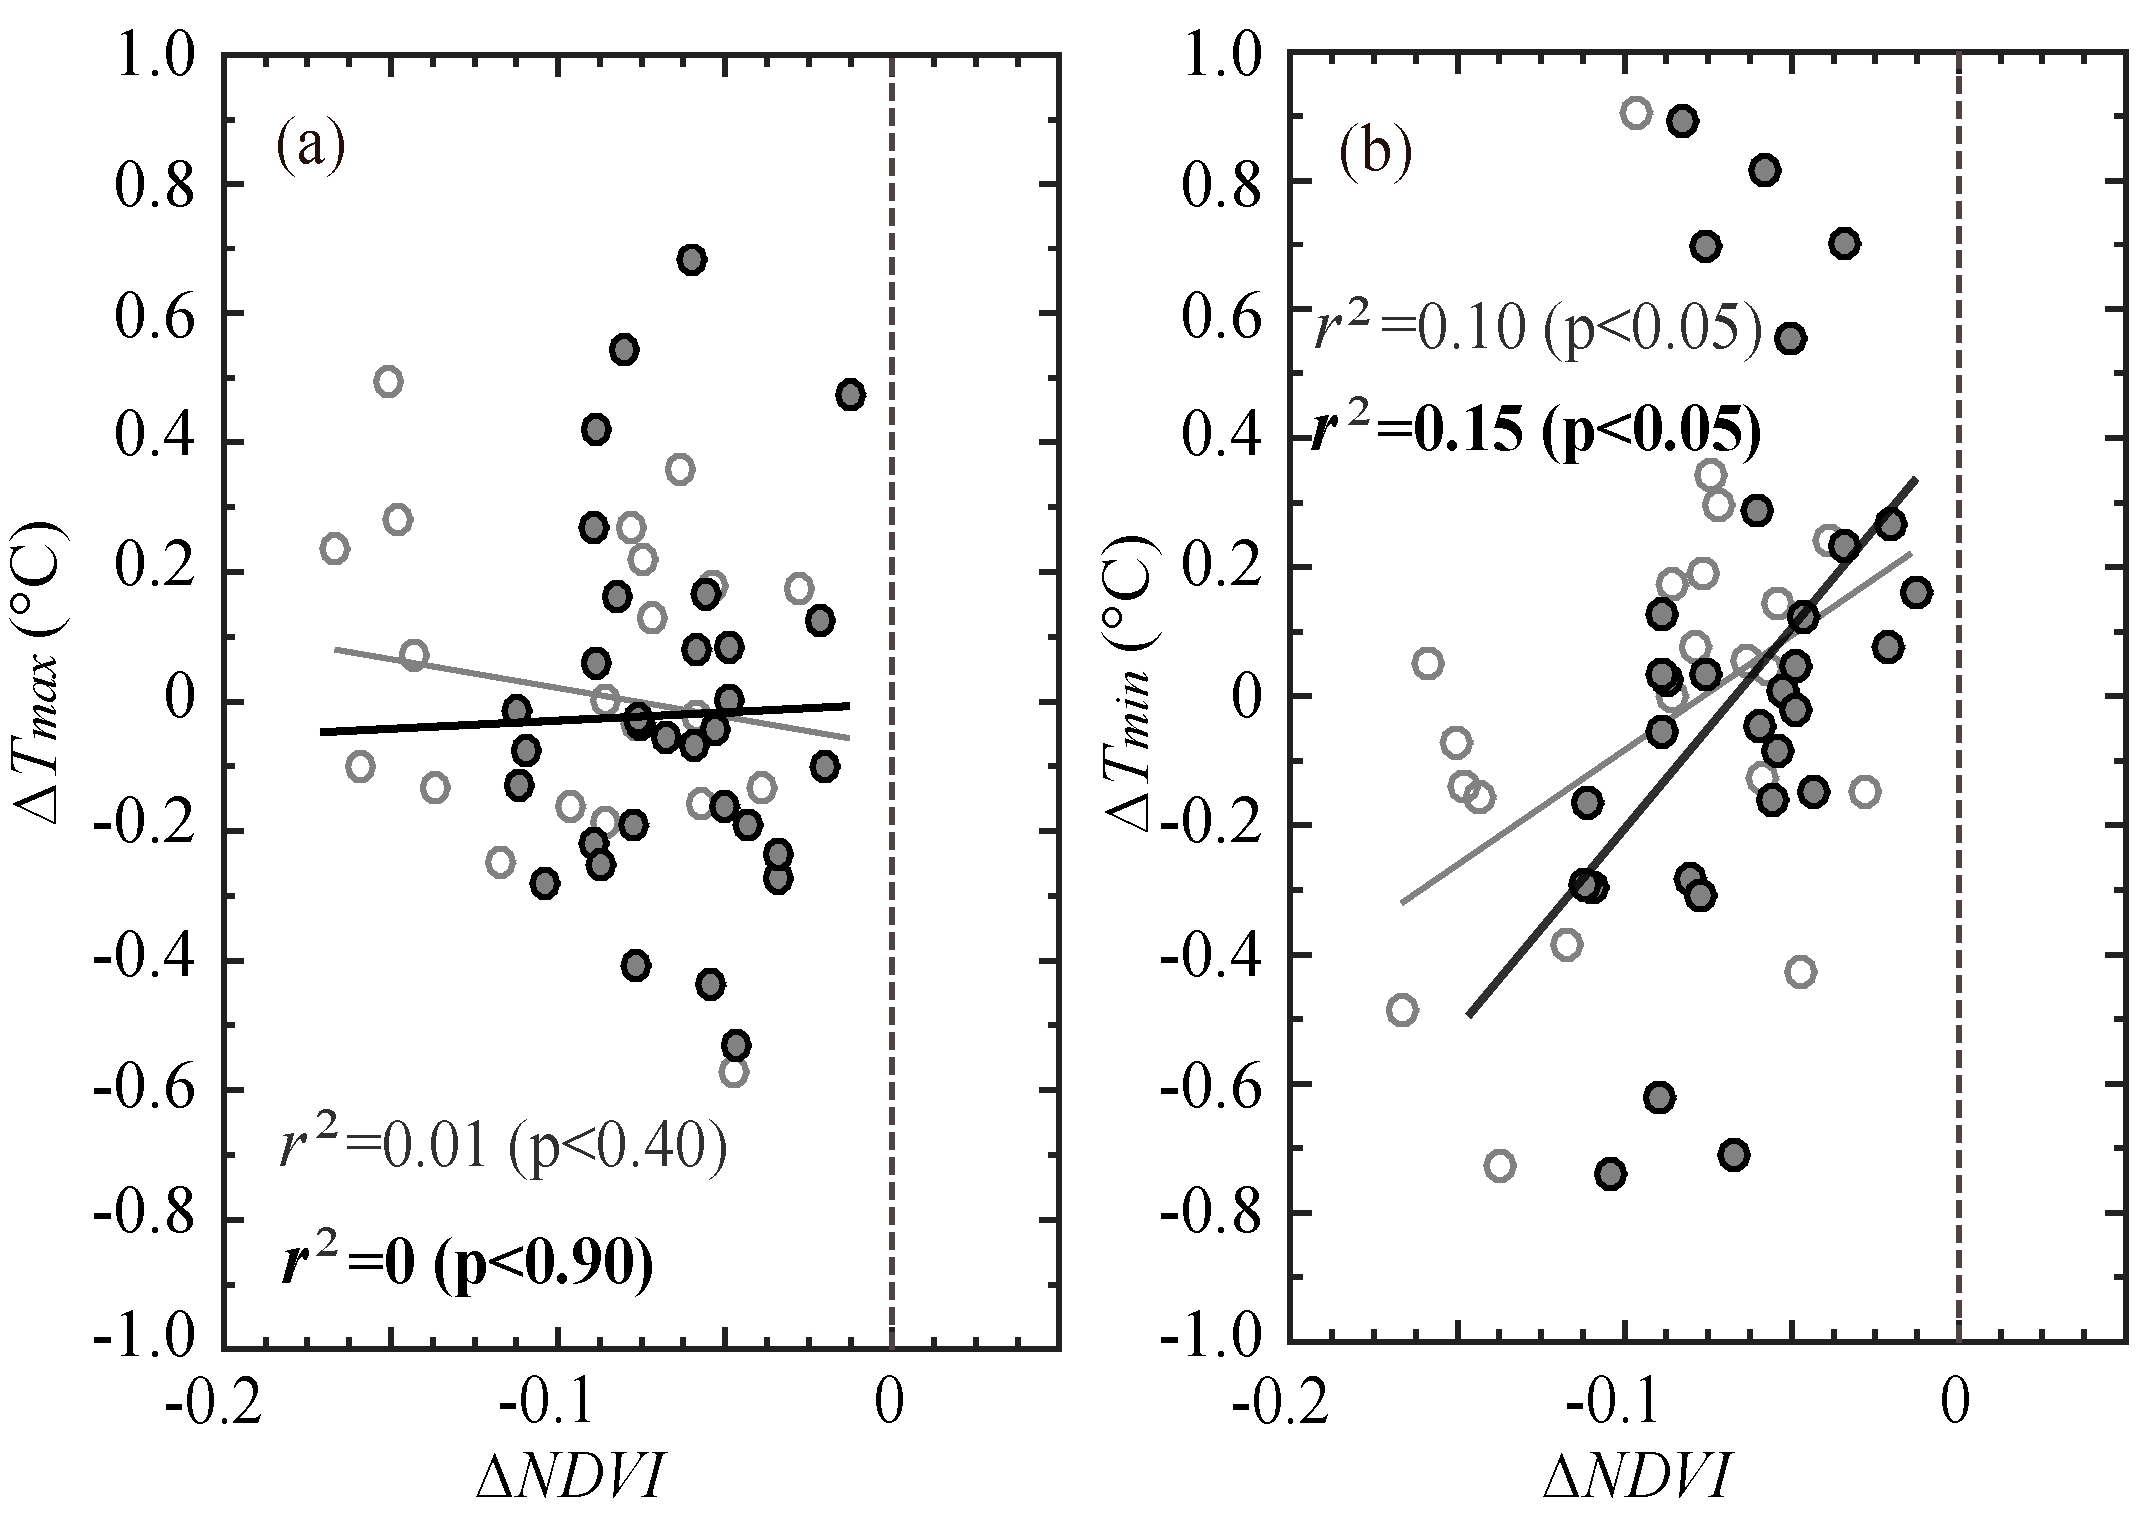
Such spatial co-occurrences between temperature changes and vegetation growth are apparent in the site-based correlations between ΔNDVI and ΔT. Figure 5 shows that the spatial variability of ΔTmax is negatively correlated with that of ΔNDVI (r = −0.1, p < 0.4), with a slope of −0.21 °C per 0.1 NDVI, while the spatial variability of ΔTmin shows a positive Pearson correlation with that of ΔNDVI (r = 0.32; p < 0.05), with a slope of 0.74 °C per 0.1 NDVI. Because ΔNDVI may be partly induced by land use and land cover changes (LULCC) in addition to vegetation growth, these correlations may be in part derived from the effects of LULCC on temperature. To exclude the effects of LULCC, we recalculated the correlation coefficients using the sites without LULCC. Here, we defined LULCC as a change in cropland area of more than 5% of the total area of the 3- by 3-pixel window (i.e., the 9 NDVI pixels) surrounding the site. Following this criterion, there are 21 LULCC sites. By excluding the 21 LULCC sites and retaining the other 32 sites, the correlation between the spatial variability of ΔNDVI and ΔTmax was still not significant. However, the positive correlation between the spatial variability of ΔNDVI and ΔTmin strengthens; the correlation coefficient increased to 0.39 (p < 0.05) and the slope was 1.2 °C per 0.1 NDVI.
The negative correlation between the spatial variability of ΔNDVI and ΔTmax has been reported by several studies, including Jeong et al. [9] for eastern Asia during the spring, Zhang et al. [11] for the North China Plain during the spring, and Shen et al. [12] for the Tibetan Plateau during the growing season. Although this study presented a negative correlation between the spatial variability of ΔNDVI and ΔTmax and suggested a likely cooling effect in the daytime, the correlation is not significant and is weaker than those reported by previous studies. Such a weak correlation suggests that vegetation growth may contribute little to the spatial variability of daytime warming over northeastern China. Other local forcing factors may have a stronger contribution to the spatial variability of daytime warming than the vegetation growth.
3.2. Changes in Surface Energy Budget and Atmospheric Vapor
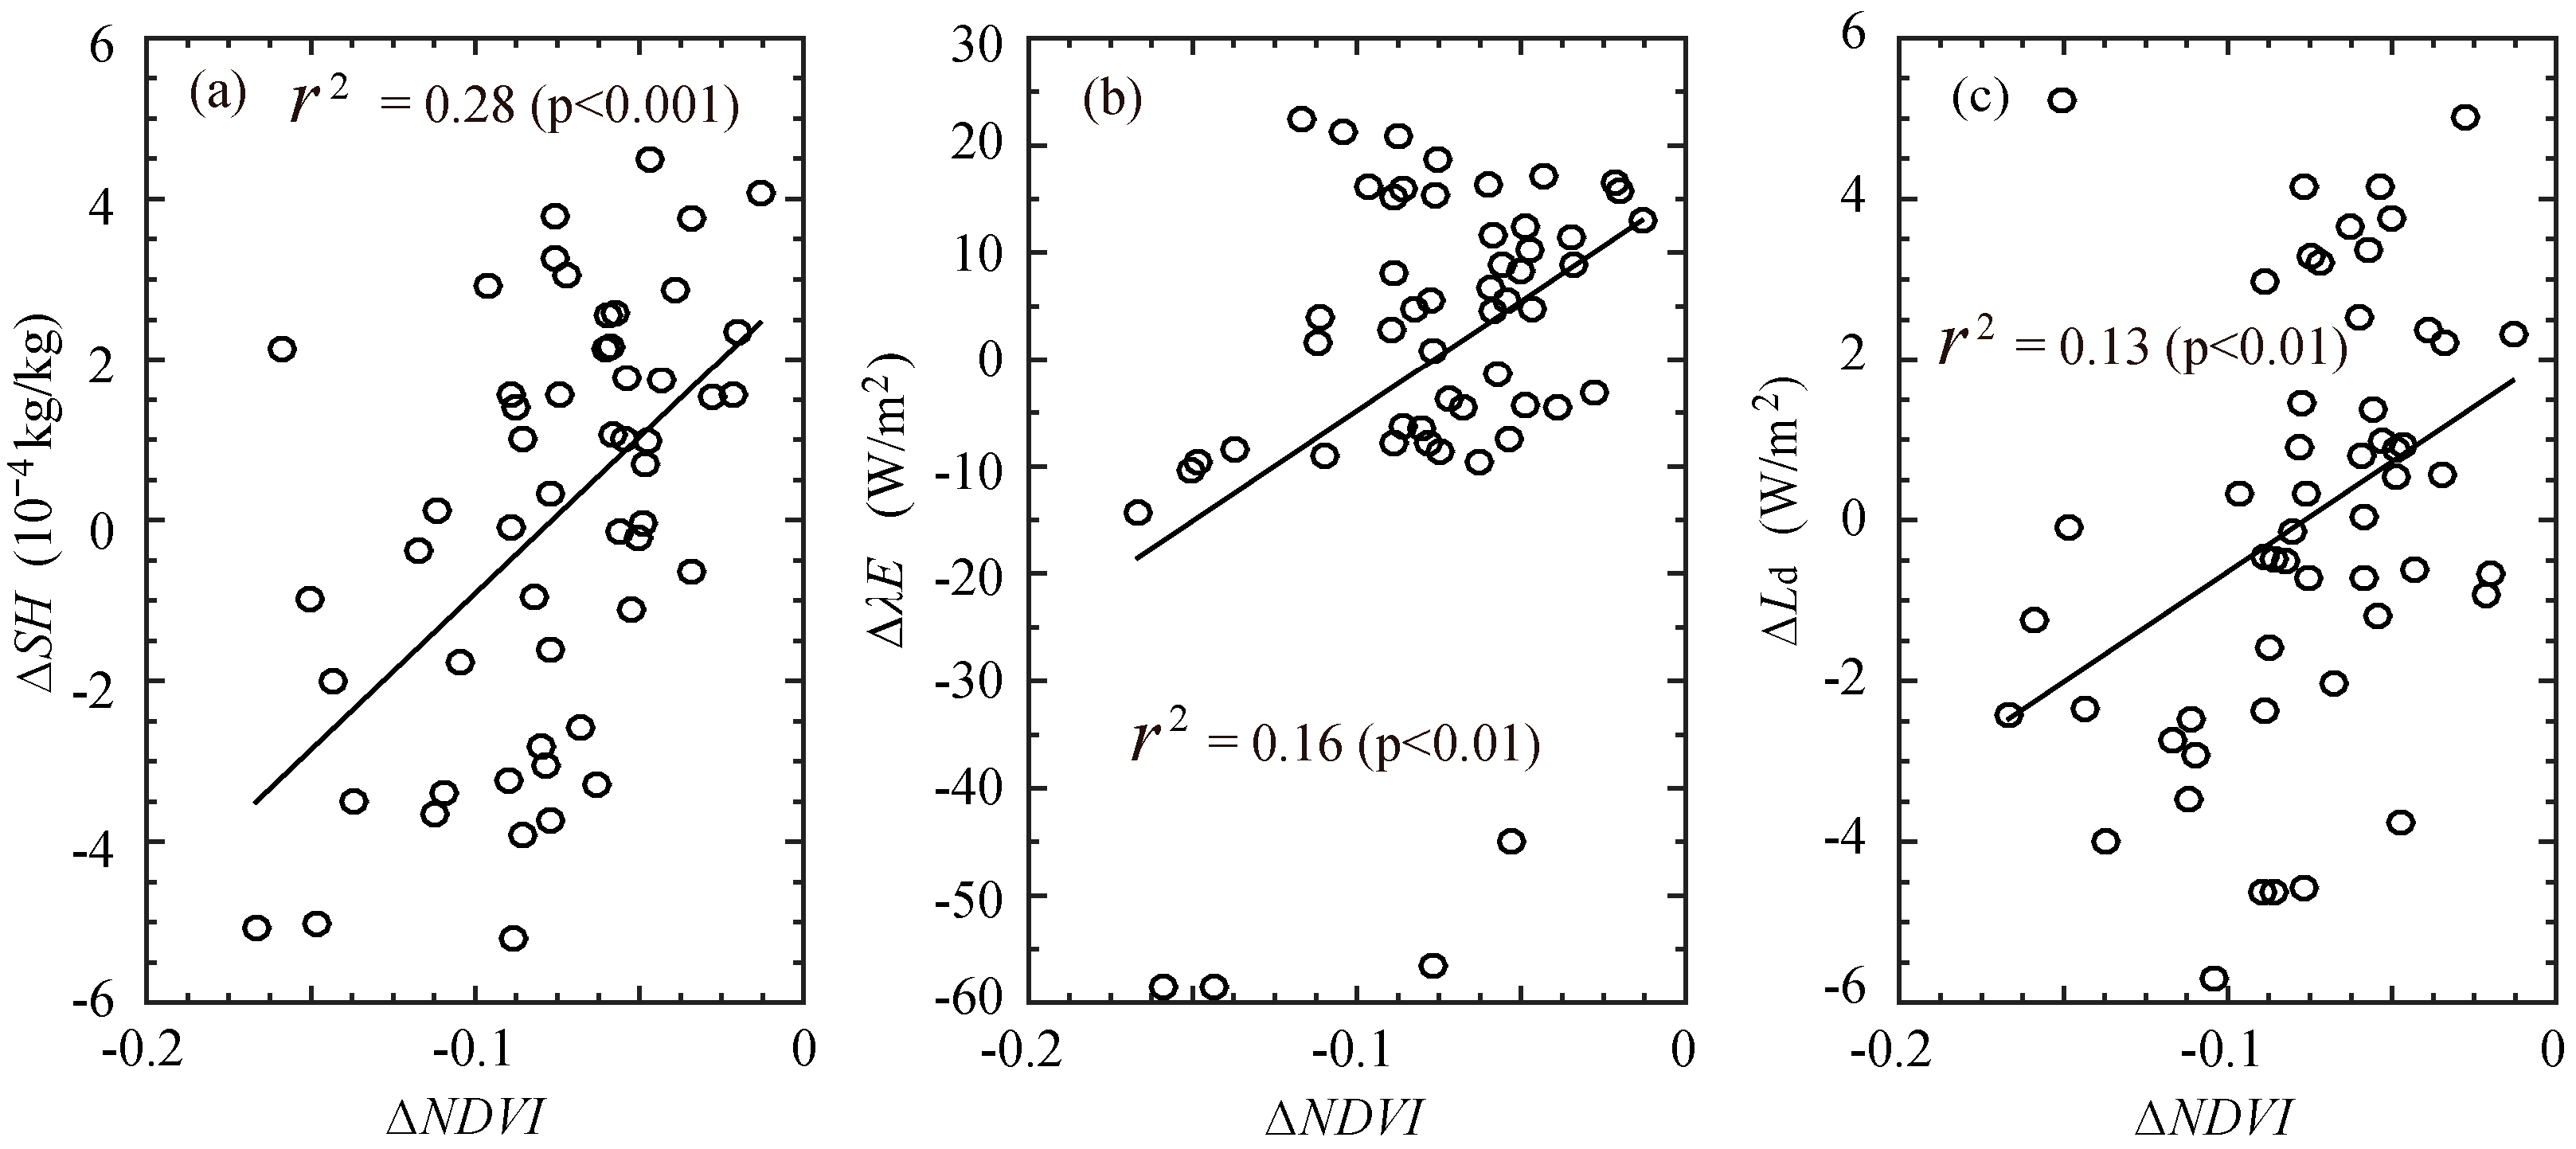
To explore the underlying physical links between spatial variability of ΔNDVI and ΔTmin, we further analyzed the correlation between the spatial variability of surface energy fluxes changes (ΔλE) and NDVI changes. As shown in Figure 6, the spatial variability of ΔλE is positively correlated with that of ΔNDVI, and the correlation coefficient is 0.4 (p < 0.01). These findings suggest that greater vegetation growth (degradation) co-occurred with much more (less) latent heat flux to the atmosphere. The changes in vegetation growth may explain ~16% of the spatial variability of ΔλE.
Following the strong correlation between the spatial variability of ΔNDVI and ΔλE, the spatial variability of atmospheric vapor changes were also correlated with that of vegetation growth changes. As shown in Figure 6, there was a strong positive correlation between the spatial variability of ΔNDVI and ΔSH, and the correlation coefficient was as high as 0.53 (p < 0.001). This positive correlation suggests that vegetation growth (degradation) co-occurred with much more (less) atmospheric water vapor. The changes in vegetation growth may explain ~28% of the spatial variability of ΔSH.
The spatial variability of atmospheric downward longwave radiation changes also exhibited a positive correlation with that of vegetation growth changes (Figure 6). The correlation coefficient was 0.36. This positive correlation suggests that vegetation growth (degradation) co-occurred with much more (less) atmospheric downward longwave radiation. The changes in vegetation growth may explain ~13% of the spatial variability of ΔLd.
The abovementioned findings demonstrate that vegetation growth may strengthen the local atmospheric downward longwave radiation by increasing the local atmospheric water vapor. Specifically, the vegetation growth may intensify latent heat, which is closely related to moisture flux in the atmosphere. It is well known that water vapor is an effective greenhouse gas that prevents the loss of heat to outer space. Therefore, the atmospheric downward longwave radiation increases with increased atmospheric vapor. The positive correlations between the spatial variability of ΔLd, ΔλE, ΔSH and that of ΔNDVI may thereby explain the positive correlation between the spatial variability of ΔNDVI and that of ΔTmin. In summary, vegetation growth could lead to nighttime warming by intensifying the latent heat and atmospheric vapor. Then, as an effective greenhouse gas, atmospheric vapor prevents loss of heat and strengthens the local greenhouse effect by enhancing atmospheric downward longwave radiation.
4. Discussion and Conclusions
Using the meteorological observations and satellite NDVI data, the effects of vegetation growth in croplands on temperature was studied. The results demonstrate that vegetation growth in June across the Northeast China Plain may cool the daytime temperatures and warm the nighttime temperatures. Moreover, the results also indicate that both effects are likely related to the evapotranspiration due to vegetation growth. By enhancing the canopy transpiration rate, vegetation growth may intensify the latent heat and exhibit a cooling effect during the daytime, which is consistent with the findings of Zhang et al. [11]. On the other hand, the enhanced canopy transpiration may provide much more moisture to the atmosphere. The increased atmospheric vapor would intensify the atmospheric downward longwave radiation and retain more energy at low levels of the atmosphere at night due to the greenhouse effect.
The daytime cooling effect of vegetation growth has been extensively discussed, whereas the potential nighttime warming effects have received less attention. The results of this study support the idea that vegetation growth may have a warming effect, which was proposed based on climate modeling by Collatz et al. [16]. It was implicated that this study provided essential observation evidence to support the modeling results. Additionally, since there are opposite effects on daytime and nighttime temperature, the vegetation growth may potentially contribute to the asymmetry between daytime and nighttime warming. Hence, the strong nighttime warming and weak daytime warming observed over the last several decades may be explained in part by the vegetation, along with significant surface greening.
This study attempts to disclose the potential effects of vegetation growth on local temperature using observation data. There is an interaction between vegetation and the atmosphere. As suggested by Kaufmann et al. [25], the feedback of vegetation on temperature may be valid within a limited range of temperature change. Once temperature changes break a certain threshold, the vegetation growth might be destroyed, and the feedback effects would thereby differ. So, our observation-based results might only be valid for a limited range of temperature changes. Additionally, although we used strict criteria to select the cropland area sites, mosaic pixels remained in the study area. Hence, the NDVI might consist of other vegetation information combined with crop growth. The correlations between changes in temperature and NDVI might be partially derived from the effects of changes in other vegetation on local temperature.
The regulations of vegetation on temperature vary greatly with geography. For instance, there were strong cooling effects during the daytime in the North China Plain [11] and the Tibet Plateau [12]. However, the cooling effect detected by this study is not significant. Additionally, the nighttime warming effect of vegetation growth may be dependent on the geographical location and season. More studies are needed for other areas and seasons. Moreover, more studies, particularly modeling studies, are necessary to assess the mechanisms leading to these geographical differences.
Additionally, the findings of this study are based on essential observations and linearly correlation methods. Model-based simulations would be needed to explain the underlying mechanism to support the observation-based results. However, the model simulation would be challenged. On one hand, the model configuration may be not exactly suitable for this region. Thereby, some physical parameters, such as soil and vegetation parameters, would be updated using local data. On the other hand, it would be difficult to represent the satellite-based NDVI changes in the model. Traditionally, the NDVI is represented only by green vegetation coverage in the model [11,26]. To fully represent the NDVI changes, it may be necessary to consider other parameters, such as leaf area index (LAI), surface albedo, and so on. Finally, the changes of temperature and NDVI from the 1980s to the 1990s may be mainly caused by global warming. Though we attempted to isolate the effects of global warming by analysis of the co-occurrence of spatial variations of temperature change and NDVI change, the effects of global warming were hardly excluded completely.
Acknowledgments
This research is supported by the China Global Change Research Program (2014CB954301) from the Ministry of Science and Technology of China, the National Natural Science Foundation of China (No. 41471171; 41271217), the Youth Innovation Promotion Association CAS (No. 2015038), and the Kezhen Outstanding Young Scholars from IGSNRR (No. 2015RC101).
Author Contributions
X.Z. designed the study and provided the analysis method; X.L. and L.Z. collected and analyzed the data; X.Z. and L.Z. interpreted the data; X.L. figured the pictures; X.Z., X.L. and L.Z. wrote the article.
Conflicts of Interest
The authors declare no conflict of interest.
References
- Foley, J.A.; Costa, M.H.; Delire, C.; Ramankutty, N.; Snyder, P. Green surprise? How terrestrial ecosystems could affect earth’s climate. Front. Ecol. Environ. 2003, 1, 38–44. [Google Scholar] [CrossRef]
- Bellucci, A.; Haarsma, R.; Bellouin, N.; Booth, B.; Cagnazzo, C.; Hurk, B.; Keenlyside, N.; Koenigk, T.; Massonnet, F.; Materia, S.; et al. Advancements in decadal climate predictability: The role of nonoceanic drivers. Rev. Geophys. 2015, 53, 165–202. [Google Scholar] [CrossRef]
- Charney, J.; Stone, P.H.; Quirk, W.J. Drought in the Sahara: A biogeophysical feedback mechanism. Science 1975, 187, 434–435. [Google Scholar] [CrossRef] [PubMed]
- Pitman, A.J.; Avila, F.B.; Abramowitz, G.; Wang, Y.; Phipps, S.J.; Noblet, N. Importance of background climate in determining impact of land-cover change on regional climate. Nat. Clim. Chang. 2011, 1, 472–475. [Google Scholar] [CrossRef]
- Mahmood, R.; Pielke, R.A., Sr.; Hubbard, K.G.; Niyogi, D.; Dirmeyer, P.A.; Mcalpine, C.; Carleton, A.M.; Hale, R.; Gemeda, S.; Beltran-Przekurat, A.; et al. Land cover changes and their biogeophysical effects on climate. Int. J. Clim. 2014, 34, 929–953. [Google Scholar] [CrossRef]
- Jiang, B.; Liang, S.; Yuan, W. Observational evidence for impacts of vegetation change on local surface climate over northern China using the Granger causality test. J. Geophys. Res. 2015, 120, 1–12. [Google Scholar] [CrossRef]
- Wu, M.; Schurgers, G.; Rummukainen, M.; Smith, B.; Samuelsson, P.; Jansson, C.; Siltberg, J.; May, W. Vegetation-climate feedbacks modulate rainfall patterns in Africa under future climate change. Earth Syst. Dyn. Discuss. 2016, 3, 627–647. [Google Scholar] [CrossRef]
- Liu, Z.; Notaro, M.; Kutzbach, J. Assessing Global Vegetation—Climate Feedbacks from Observations. J. Clim. 2006, 19, 787. [Google Scholar] [CrossRef]
- Jeong, S.J.; Ho, C.H.; Jeong, J.H. Increase in vegetation greenness and decrease in springtime warming over East Asia. Geophys. Res. Lett. 2009, 36, 436–448. [Google Scholar] [CrossRef]
- Halder, S.; Saha, S.K.; Dirmeyer, P.A.; Chase, T.N.; Nath Goswami, B. Investigating the impact of land-use land-cover change on Indian summer monsoon daily rainfall and temperature during 1951–2005 using a regional climate model. Earth Syst. Sci. 2016, 12, 1765–1784. [Google Scholar] [CrossRef]
- Zhang, X.Z.; Tang, Q.H.; Zheng, J.Y.; Ge, Q.S. Warming/cooling effects of cropland greenness changes during 1982–2006 in the North China Plain. Environ. Res. Lett. 2013, 8, 279–288. [Google Scholar] [CrossRef]
- Shen, M.G.; Piao, S.L.; Jeong, S.J.; Zhou, L.; Zeng, Z.; Ciais, P.; Chen, D.; Huang, M.; Jin, C.S.; Li, L.Z.; et al. Evaporative cooling over the Tibetan Plateau induced by vegetation growth. Proc. Natl. Acad. Sci. USA 2015, 112, 9299–9304. [Google Scholar] [CrossRef] [PubMed]
- Chapin, F.S.; Sturm, M.; Serreze, M.C.; Mcfadden, J.P.; Key, J.R.; Lloyd, A.H.; Schimel, J.P.; Beringer, J.; Chapman, W.L.; Epstein, H.E.; et al. Role of land-surface changes in Arctic summer warming. Science 2005, 310, 657–660. [Google Scholar] [CrossRef] [PubMed]
- Pearson, R.G.; Phillips, S.J.; Loranty, M.M.; Beck, P.S.A.; Damoulas, T.; Knight, S.J.; Goetz, S. Shifts in Arctic vegetation and associated feedbacks under climate change. Nat. Clim. Chang. 2013, 3, 673–677. [Google Scholar] [CrossRef]
- Takata, K.; Saito, K.; Yasunari, T. Changes in the Asian monsoon climate during 1700–1850 induced by preindustrial cultivation. Proc. Natl. Acad. Sci. USA 2009, 106, 9586–9589. [Google Scholar] [CrossRef] [PubMed]
- Collatz, G.J.; Bounoua, L.; Los, S.O.; Randall, D.A.; Fung, I.Y.; Sellers, P.J. A mechanism for the influence of vegetation on the response of the diurnal temperature range to changing climate. Geophys. Res. Lett. 2000, 27, 3381–3384. [Google Scholar] [CrossRef]
- Zhou, L.M.; Dickinson, R.E.; Tian, Y.H.; Vose, R.S.; Dai, Y. Impact of vegetation removal and soil aridation on diurnal temperature range in a semiarid region: Application to the Sahel. Proc. Natl. Acad. Sci. USA 2007, 104, 17937–17942. [Google Scholar] [CrossRef] [PubMed]
- Liu, J.Y.; Kuang, W.H.; Zhang, Z.X.; Xu, X.L.; Qin, Y.W.; Ning, J.; Zhou, W.C.; Zhang, S.W.; Li, R.D.; Yan, C.Z.; et al. Spatiotemporal characteristics, patterns, and causes of land-use changes in China since the late 1980s. J. Geogr. Sci. 2014, 24, 195–210. [Google Scholar] [CrossRef]
- Tucker, C.J.; Slayback, D.A.; Pinzon, J.E.; Los, S.O.; Mynei, R.O.; Taylor, M.G. Higher northern latitude normalized difference vegetation index and growing season trends from 1982 to 1999. Int. J. Biometeorol. 2001, 45, 184–190. [Google Scholar] [CrossRef] [PubMed]
- Tucker, C.J.; Pinzon, J.E.; Brown, M.E.; Slayback, D.A.; Pak, E.W.; Mahoney, R.; Vermote, E.; Saleous, N.Z. An extended AVHRR 8-km NDVI dataset compatible with MODIS and spot vegetation NDVI data. Int. J. Remote Sens. 2005, 26, 2285–2298. [Google Scholar] [CrossRef]
- Piao, S.L.; Wang, X.H.; Ciais, P.; Zhu, B.; Wang, T.; Liu, J.I.E. Changes in satellite-derived vegetation growth trend in temperate and boreal Eurasia from 1982 to 2006. Glob. Chang. Biol. 2011, 17, 3228–3239. [Google Scholar] [CrossRef]
- Eastman, J.R.; Sangermano, F.; Machado, E.A.; Rogan, J.; Anyamba, A. Global trends in seasonality of normalized difference vegetation index (NDVI), 1982–2011. Remote Sens. 2013, 5, 4799–4818. [Google Scholar] [CrossRef]
- Dee, D.P.; Uppala, S.M.; Simmons, A.J.; Berrisford, P.; Poli, P.; Kobayashi, S.; Andrae, U.; Balmaseda, M.A.; Balsamo, G.; Bauer, P.; et al. The ERA-Interim reanalysis: Configuration and performance of the data assimilation system. Quart. J. R. Meteorol. Soc. 2011, 137, 553–597. [Google Scholar] [CrossRef]
- Zhang, X.Z.; Tang, Q.H.; Zheng, J.Y.; Ge, Q.S.; Mao, R. Suppression of spring rain by surface greening over the North China Plain. Int. J. Clim. 2015, 35, 2752–2758. [Google Scholar] [CrossRef]
- Kaufmann, R.K.; Zhou, L.; Myneni, R.B.; Tucker, C.J.; Slayback, D.; Shabanov, N.V.; Pinzon, J.E. The effect of vegetation on surface temperature: A statistical analysis of NDVI and Climate data. Geophys. Res. Lett. 2003, 30, 2147. [Google Scholar] [CrossRef]
- Ge, Q.S.; Zhang, X.Z.; Zheng, J.Y. Simulated effects of vegetation increase/decrease on temperature changes from 1982 to 2000 across the Eastern China. Int. J. Climatol. 2014, 1, 187–196. [Google Scholar] [CrossRef]
Figure 1.
Location of the study area in China and spatial distribution of the meteorological sites from the China Meteorological Administration (gray shading denotes the percentage of cropland within 10 km around the site in the year 2000).
Figure 1.
Location of the study area in China and spatial distribution of the meteorological sites from the China Meteorological Administration (gray shading denotes the percentage of cropland within 10 km around the site in the year 2000).
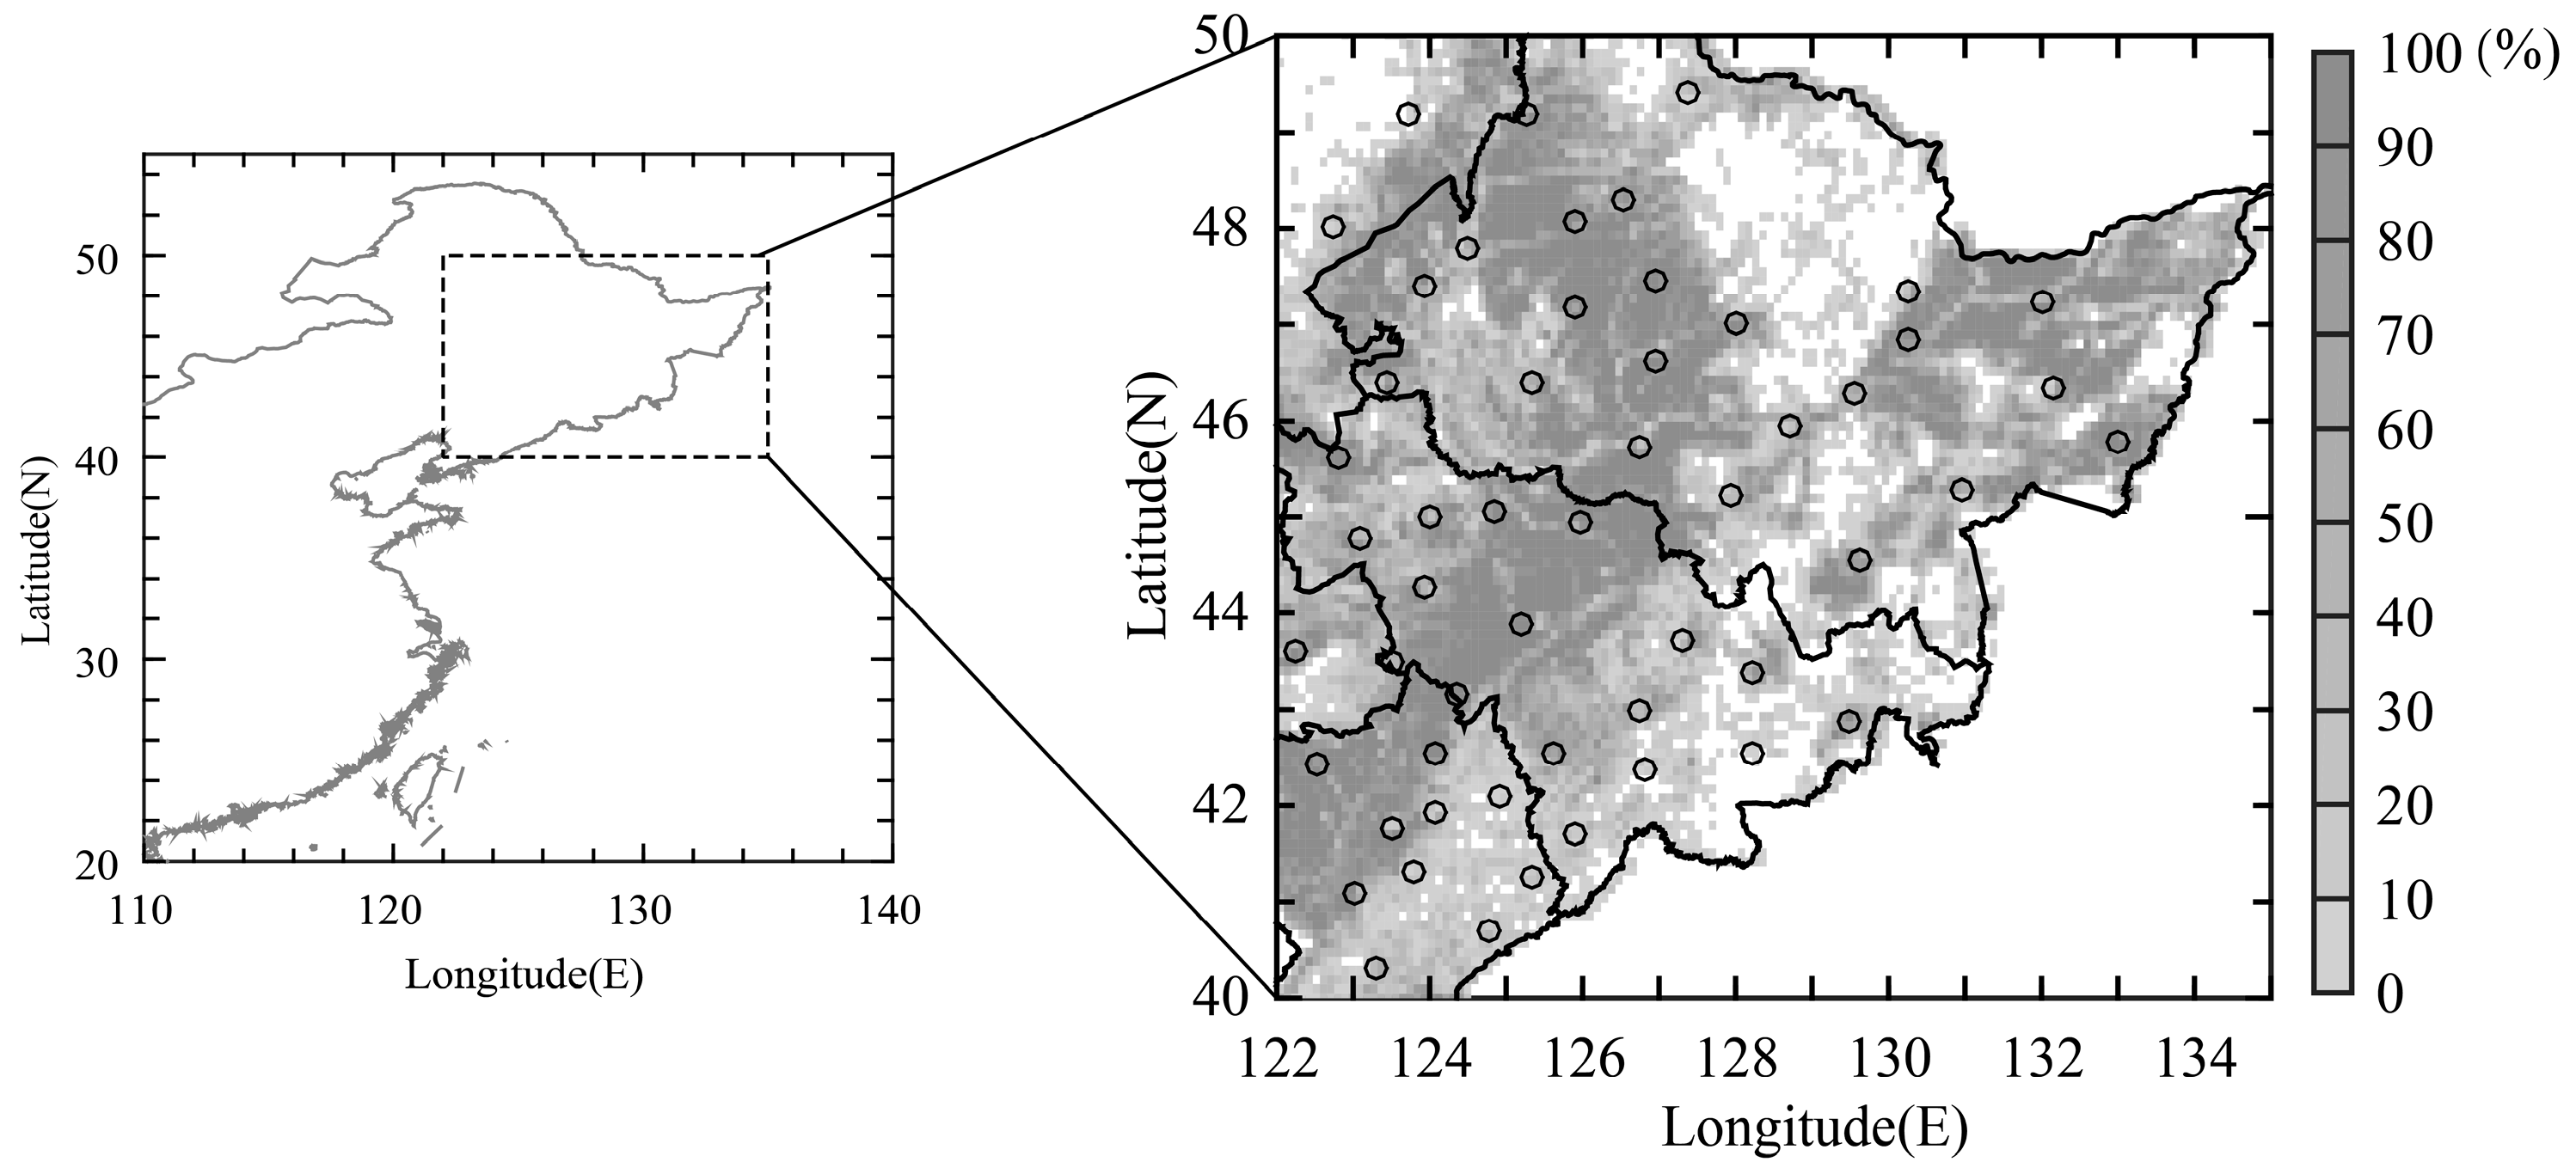
Figure 2.
Mean half-monthly Normalized Difference Vegetation Index (NDVI) for 1982–1991 and 1997–2006 within the study area (a) and the spatial pattern of NDVI changes (1997–2006 minus 1982–1991) for June (b).
Figure 2.
Mean half-monthly Normalized Difference Vegetation Index (NDVI) for 1982–1991 and 1997–2006 within the study area (a) and the spatial pattern of NDVI changes (1997–2006 minus 1982–1991) for June (b).
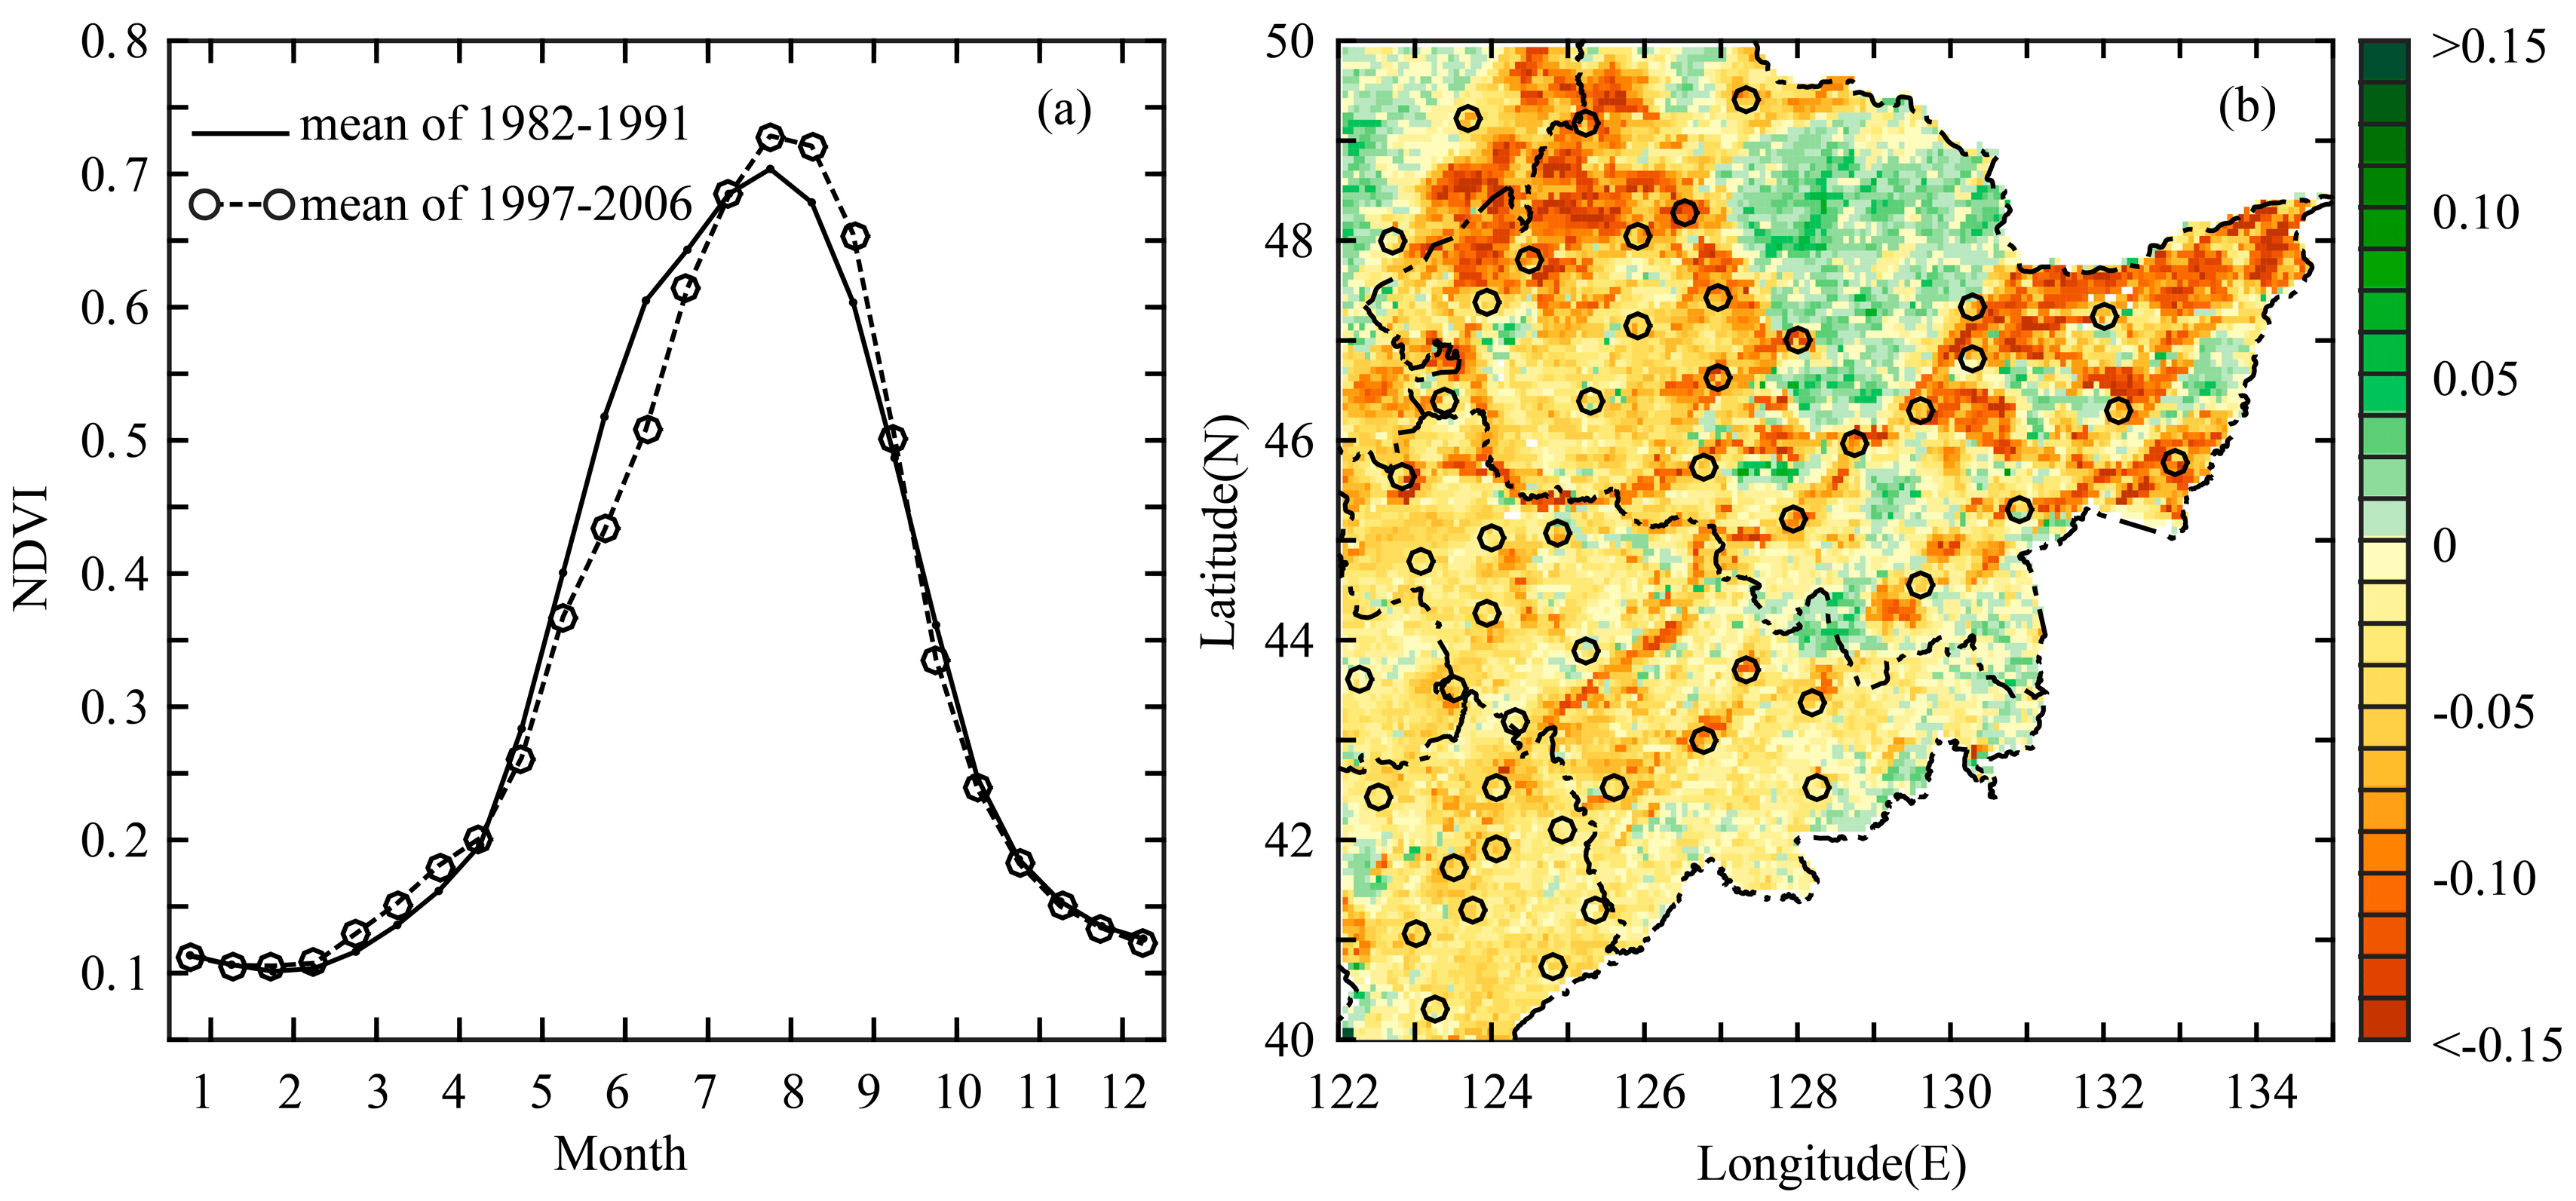
Figure 3.
Changes in the monthly mean daily maximum (Tmax) and minimum (Tmin) temperatures during June between 1982–1991 and 1997–2006 (1997–2006 minus 1982–1991) at each site.
Figure 3.
Changes in the monthly mean daily maximum (Tmax) and minimum (Tmin) temperatures during June between 1982–1991 and 1997–2006 (1997–2006 minus 1982–1991) at each site.
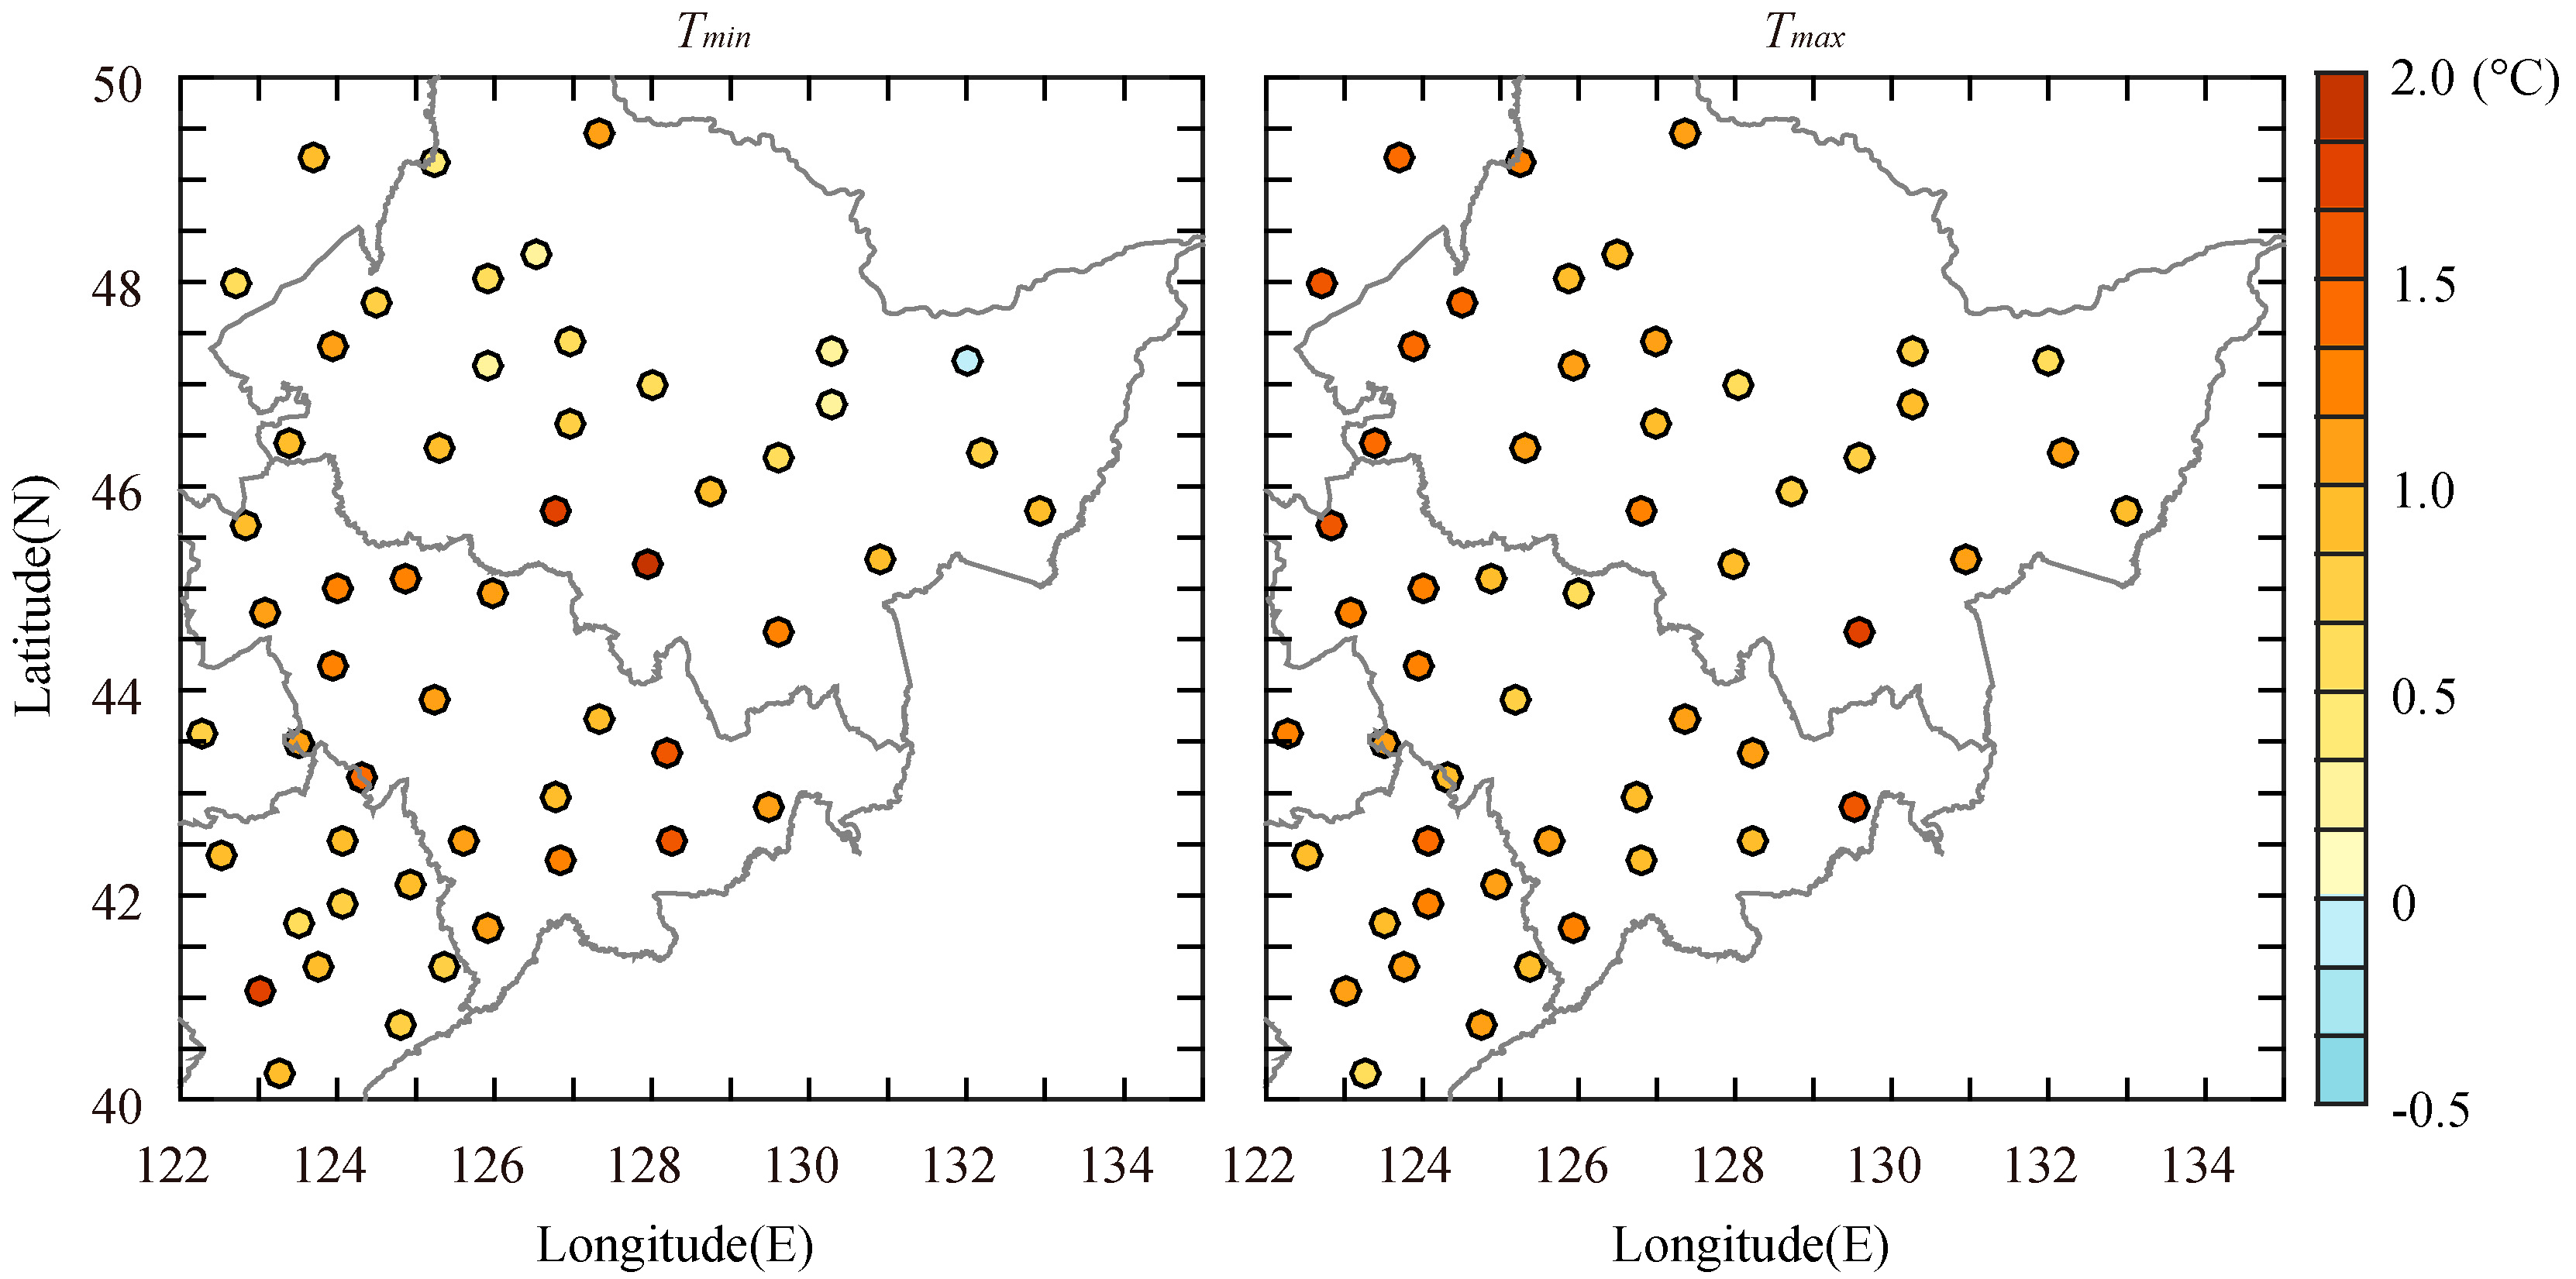
Figure 4.
Mean Tmax and Tmin changes at sites grouped by the amplitude of NDVI decrease (ΔNDVI), between 1982–1991 and 1997–2006 (top panel, (a,b), are derived directly from site observations; bottom panel, (c,d), are after removing the regional mean temperature changes).
Figure 4.
Mean Tmax and Tmin changes at sites grouped by the amplitude of NDVI decrease (ΔNDVI), between 1982–1991 and 1997–2006 (top panel, (a,b), are derived directly from site observations; bottom panel, (c,d), are after removing the regional mean temperature changes).
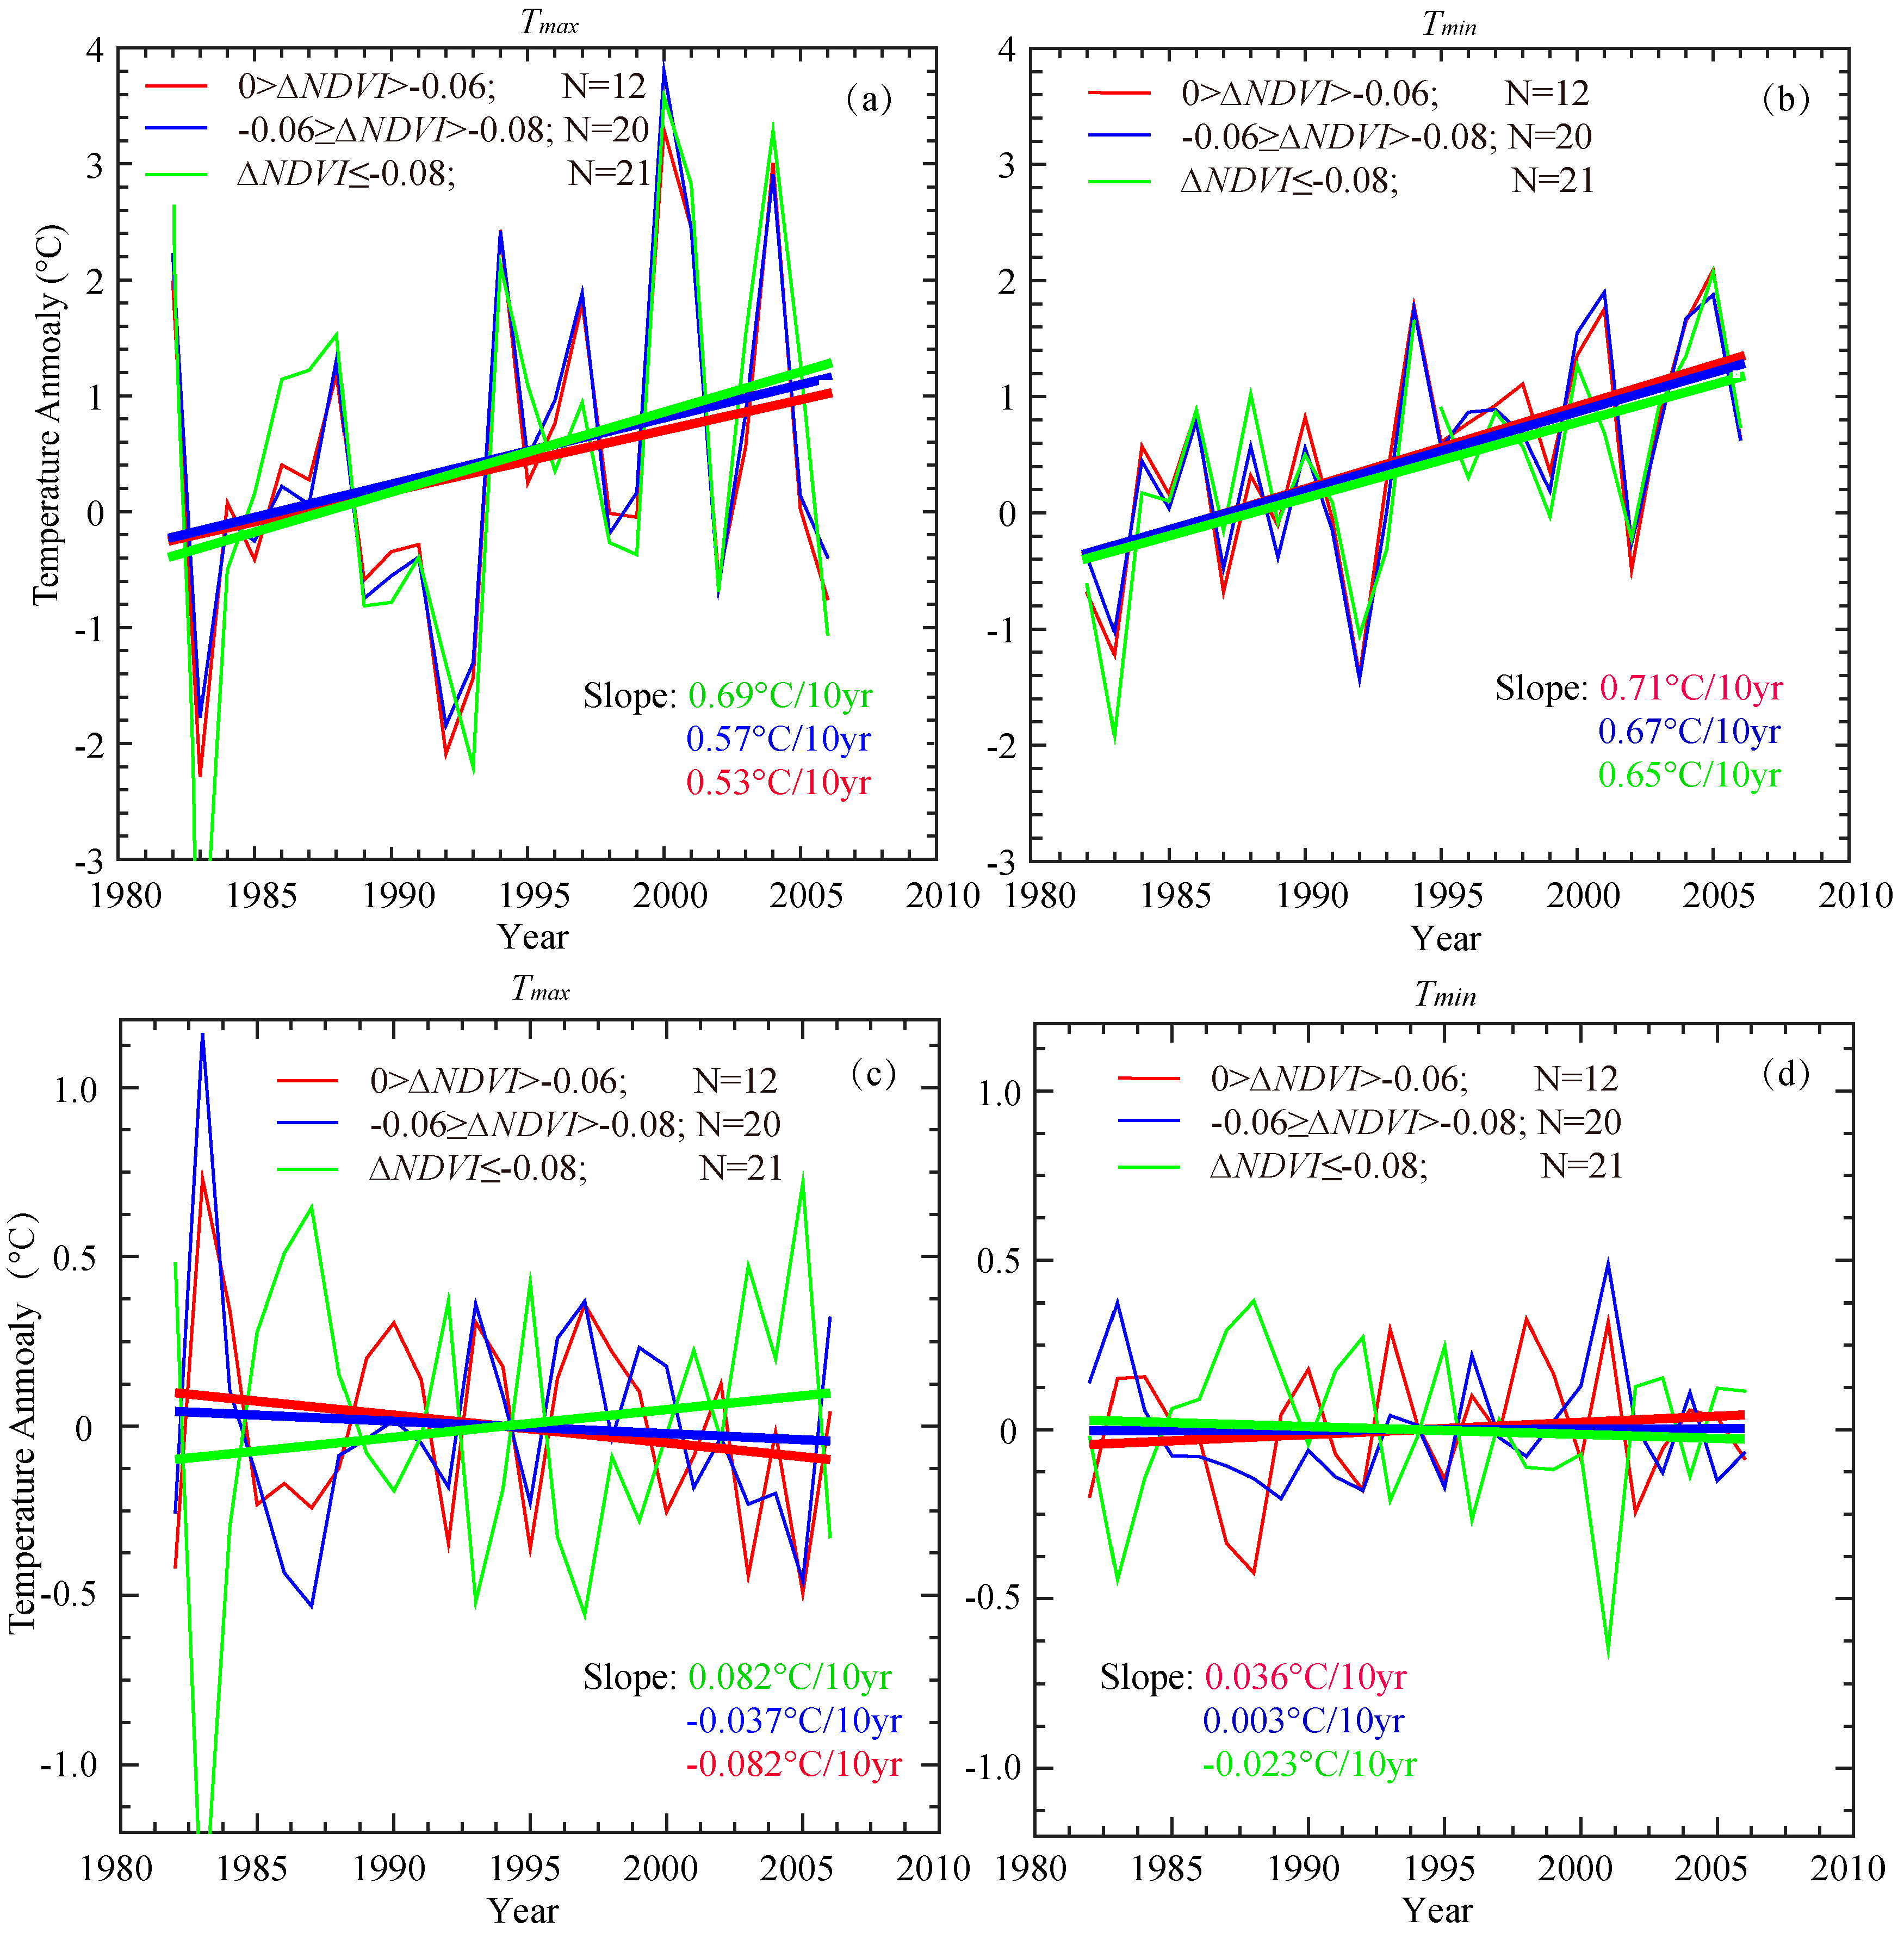
Figure 5.
Correlations between the spatial variability of NDVI changes (ΔNDVI) and local temperature changes (a), ΔTmax; (b), ΔTmin in June from 1982–1991 to 1997–2006 across all sites in northeastern China (shaded solid circles represent sites without significant land use and land cover change).
Figure 5.
Correlations between the spatial variability of NDVI changes (ΔNDVI) and local temperature changes (a), ΔTmax; (b), ΔTmin in June from 1982–1991 to 1997–2006 across all sites in northeastern China (shaded solid circles represent sites without significant land use and land cover change).

Figure 6.
The same as in Figure 5, but for the daily mean specific humidity ((a), ΔSH), surface latent heat flux ((b), ΔλE), and atmospheric downward longwave radiation ((c), ΔLd).
Figure 6.
The same as in Figure 5, but for the daily mean specific humidity ((a), ΔSH), surface latent heat flux ((b), ΔλE), and atmospheric downward longwave radiation ((c), ΔLd).

© 2017 by the authors. Licensee MDPI, Basel, Switzerland. This article is an open access article distributed under the terms and conditions of the Creative Commons Attribution (CC BY) license (http://creativecommons.org/licenses/by/4.0/).
Share and Cite
MDPI and ACS Style
Li, X.; Zhang, X.; Zhang, L. Observed Effects of Vegetation Growth on Temperature in the Early Summer over the Northeast China Plain. Atmosphere 2017, 8, 97. https://doi.org/10.3390/atmos8060097
AMA Style
Li X, Zhang X, Zhang L. Observed Effects of Vegetation Growth on Temperature in the Early Summer over the Northeast China Plain. Atmosphere. 2017; 8(6):97. https://doi.org/10.3390/atmos8060097
Chicago/Turabian StyleLi, Xiaxiang, Xuezhen Zhang, and Lijuan Zhang. 2017. "Observed Effects of Vegetation Growth on Temperature in the Early Summer over the Northeast China Plain" Atmosphere 8, no. 6: 97. https://doi.org/10.3390/atmos8060097
Note that from the first issue of 2016, this journal uses article numbers instead of page numbers. See further details here.