
Characteristics of Strong Cold Air Outbreaks in China’s Central and Eastern Mongolian Region between 1970 and 2013


Key Laboratory of Meteorological Disasters of China Ministry of Education, Collaborative Innovation Center on Forecast and Evaluation of Meteorological Disasters, Nanjing University of Information Science & Technology, Nanjing 210044, China
*
Author to whom correspondence should be addressed.
Atmosphere 2017, 8(6), 98; https://doi.org/10.3390/atmos8060098
Submission received: 16 March 2017
/
Revised: 11 May 2017
/
Accepted: 23 May 2017
/
Published: 26 May 2017
(This article belongs to the Section Meteorology)
Abstract
:Strong cold air outbreak tracking has been a key meteorological focal point over the years. With observational data and gridded datasets, we used the “three-dimensional wind speed trajectory inverse method” to trace cold air intrusion tracks that occurred during the winter half-years for the central and eastern parts of Inner Mongolia in 1970–2013. The results indicated that there were a total of 303 northwest and 32 westward tracks intruding from along the north end and southern side of the Altai Mountains, respectively, 118 northward tracks intruding from the two individual sides of the Yablonoi Mountains, and 16 occurrences of “other” tracks. The imminent circulation evolution pattern prior to outbreaks essentially causes three categories of cold air masses to undergo dramatic temperature increases, thereby reducing the impacts of source regional differences on the subject air masses. The measure of the annual frequency reduction in northwest tracks was determined to be 0.41 incidents every ten years, while other tracks’ annual frequencies increased, which essentially implies the probable increase of extreme cold in northeast and central China and an increase in the frequency of continuous cold weather exceeding a three-day span in southern China.
1. Introduction
Strong cold air outbreaks (CAOs) are quite common during the winter half-year period in East Asia. The extremely frigid north wind formed by cold advection at the high-pressure edge of Siberia regularly causes abrupt temperature declinations that often result in strong winds, freezing rain, blizzard conditions, and other severe wintry-like occurrences within the mid-latitude regions [1,2,3,4,5]. China is located in the fragile zone of East Asia, with an ever-changing, fluctuating climate. Against the backdrop of global warming, climate change is a highly uncertain domain and steadily influenced by issues like population growth, aging, and increased traffic corridors as well as associated infrastructural enhancements. Facets such as these make the occurrence of CAOs altogether increasingly concerning given their potential to render ever-increasing adverse impacts to human health and local economies with the continuing passage of time [6,7,8,9].
Past studies have largely focused on the frequency changes of CAOs. It is generally advocated that the intrusion frequency of strong CAOs has declined over the past several decades in northern China [10,11,12]. One likely reason for this is that with the increase of average seasonal temperatures, the “low” temperature also accordingly rises; as such, the CAO frequency is ultimately reduced [13]. Another likely reason for this decreased trend is the recent change of air circulation systems, particularly the change of winter monsoon system behaviors across eastern Asia [14,15,16,17,18,19,20]. The development and evolution of winter monsoon systems have a close relation with the Rossby wave train of the mid-upper troposphere, which can produce northwest air currents that result in unusual coldness across Siberian areas. The upper wave train and the lower cold temperatures interact to strengthen Siberian high pressure, which then ultimately trigger ground-level cold surges [19,20,21,22,23]. Moreover, it has been pointed out in several studies that during certain cold surges the expansion and strengthening of Siberian high pressure differ from the influences exerted by wave trains, but rather instead may be directly correlated with the slowly decaying obstructive dipole [19,24].
Although the frequency of strong CAOs has shown a declining trend, the extremely frigid conditions of recent winter phenomena in China have grown increasingly harmful over recent years. The link between winter monsoons and temperature is quite complex, and the link is not only dependent upon the strength of cold air but also the tracking of multi-modal changes [25,26,27]. Park et al. [5] pointed out that in different Arctic Oscillation (AO) phases, cold surges track is different too, as well as the persistent period and damage degree in two different AO phases. Research of Li et al. [27] conforms to this point of view; their studies show that the high latitude circulation evolution might be the cause of track difference. Until the present juncture, there have been few relevant studies available on this topic, especially with regard to specific differences among strong CAOs with different tracks. Over the past, the location displacements of Siberian high pressure centers have been used as a cold mass’s track, but since cold advection is located at the edge of cold high-pressure systems and the incubation period of a cold-center before an outbreak is quite far from the ground-center's strengthening high pressure [28], to directly adopt the cold advection center to research CAOs is hence deemed considerably more accurate. For example, Park et al. [5] applied the FLEXTRA Lagrangian trajectory model, with accelerated speed as a constant, to derive a cold air track influencing the Korean Peninsula, South Japan, and East China. Furthermore, Walsh et al. [29] traced a strong cold air’s track influencing the eastern region of the United States as well as northwestern European areas.
Based on such previous studies, this paper endeavors to reference the Walsh et al. [29] “backward method” in the attempt to further analyze the observed characteristics of CAOs, including tracks, origins, outbreaks, discontinuities, and connections with relevant circulation systems. Methods of statistical analysis and dynamic interpretation are hence accordingly utilized in this study supporting the accomplishment of this goal.
As a roadmap to what follows, Section 2 below describes datasets and employed analytical methods, including strong CAO screening steps and track calculation processes. Section 3 introduces the general characteristics of strong CAOs with three separate categories of tracks and provides distinct details of their associated disparate features. Finally, we will draw the summary and some discussions in Section 4.
2. Data and Methods
2.1. Data
The primary data employed in this study is from the reanalysis of Dataset-1 from the National Centers for Environmental Prediction–National Center for Atmospheric Research (NCEP–NCAR) [30], which includes six-hour temperatures, location heights, air pressure, and three-dimensional wind speed with a horizontal resolution ratio of 2.5° × 2.5° and a vertical resolution ratio of 17 layers. The advantage of this dataset lies in that a “frozen” state-of-the-art analysis and forecast system were used in performing the data assimilation throughout the whole period, which resultantly circumvents problems of previous numerical weather prediction analyses due to changes in techniques, models, and data assimilation [14]. To confirm the cases of sudden temperature-drops by strong cold air and its influence on downstream areas, the basic datum ground temperature homogenization dataset by the National Meteorological Information Center (NMIC) is applied. In total, there were 825 stations; we then eliminated stations if their altitude was over 1500 m, and stations which were continuously absent for over 10 days of the study period. The data of the remaining 646 stations will be discussed in Section 3.4. This study applies the Arctic oscillation (AO) index from the National Oceanic and Atmospheric Administration (NOAA) Climate Prediction Center (CPC) [31].
For this study, a winter half-year is defined to be from October to April of the following year, and the subject analysis interval spanned the period from October 1970 to April 2013. All anomalies are relevant to the daily statistical mean (i.e., the 43 year average) for the calendar date and region. The daily means for a region were obtained by employing the 43 year averages of the daily values for all grid points in the region. The spatial averaging was performed by summing the grid point anomalies in a region and dividing by the number of grid points.
2.2. Definition of Strong CAOs
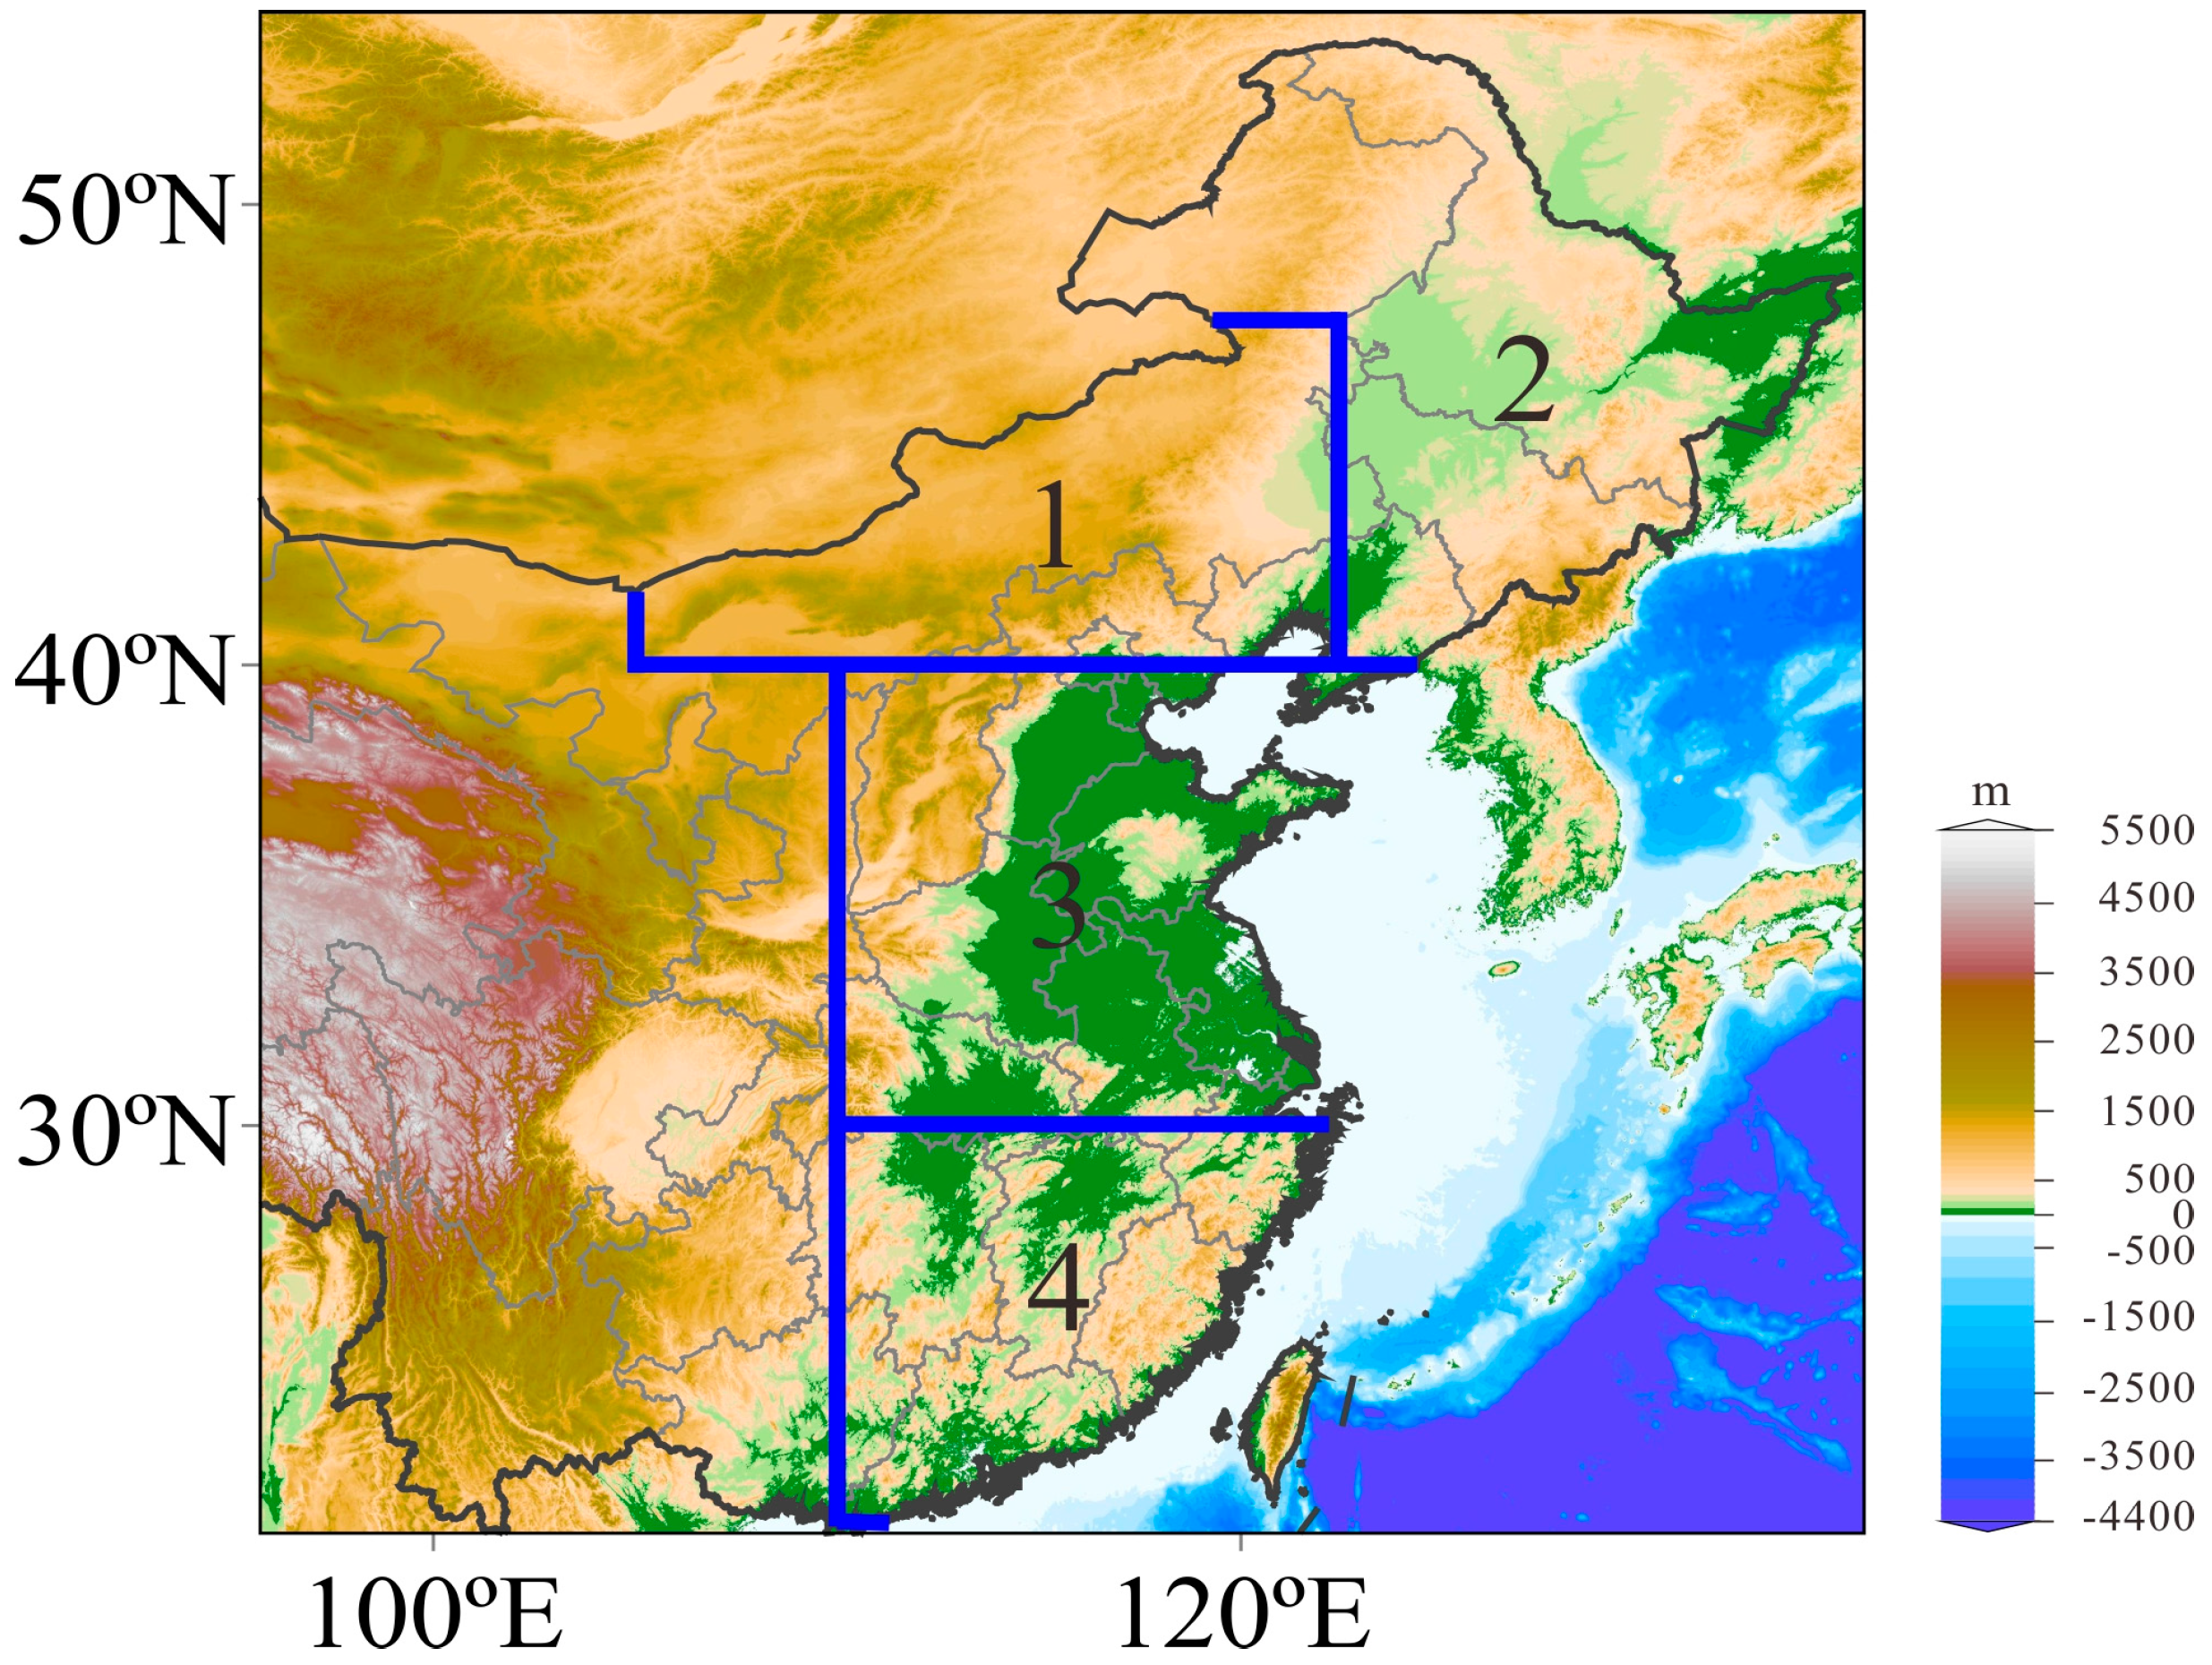
Strong CAOs are generally constrained within the central and eastern part of Inner Mongolia (105–122.5° E, north of 40° N), as shown in Region 1 of Figure 1, and is where strong CAOs occur most frequently in China as a whole [10,11,12]. Therein lies many standards of strong CAOs; Boyle and Chen summarized such commonly used standards [6], with some of them exclusively designed for operational forecasts, while others are defined based on research designs. The essence of CAOs is the fast southward moving of ground anticyclones and the associated sharp temperature drops of relevant regions [14,15]. This study focuses upon the subject sharp fluctuations in temperature, with a dropped temperature of surface air (from the lowest model level, σ = 0.995) over 24 h in Region 1, with a greater drop of 10 °C being defined as a strong CAO. Regions 2, 3, and 4 are located at the east side of the second stage of China’s geomorphology, wherein lies the country's largest population and economy as well as its major cold surge centers [7,14]. Evaluation of potential impacts from strong CAOs in this region with different tracks on downstream regions is commonplace. The shapes of the applicable boundaries are constrained by the 2.5° × 2.5° resolution of the reanalysis output.
Since strong CAOs are large-scale weather processes, to maintain the independence of track samples and avoid increases in the weighting of some classes, two individual steps must be taken: (1) centered by the greatest daily temperature drop value, the temperature drop of the region within its 1200 km area is characterized by the same strong CAO; and (2) the earliest outbreak of strong cold air within three days should be recorded. Over the 43 winter half-years from 1970–2013, a total of 469 strong CAOs were selected, 11 incidents each year on average. When compared with the NMIC datasets, the results were determined to be the same.
2.3. Tracing and Calculation of Tracks
The calculation of tracks was based on the Walsh et al. [29] scheme, with the starting point setting above the grid point of the largest daily drop of surface air temperature of 50 hPa within Region 1. Established with a three-dimensional trajectory model [32], with air mass replaced by mass point, the trajectory equation is thus determined to be the following:
whereby X(t) is the coordinate of the mass point at time t, and V is the wind speed under the current coordinate. When comprehensively considering calculation accuracy and the time interval of meteorological field departure, it is more suitable to choose a second-order difference equation [33] as follows:
where ∆t is the time step (set at one hour), X is the position vector, and is the wind speed vector. The variable input for the calculation includes a three-dimensional wind field, temperature field, topography, ground air pressure, and the application of a P-coordinate system. When trajectory clusters are prevalent, the partition clustering method presented by Lee et al. [34] is adopted. Given realistic forecast effects, this study keenly evaluates the 72 h track characteristics prior to outbreaks.
3. Results
3.1. Track Differences
Cold air flow, blocked and partitioned by the high-altitude terrains of western Mongolia and northwestern China, is classified according to the horizontal track characteristics of air masses moving into the following regimes (Figure 2a): (1) Cold air mass of northwest track clusters in Baraba Plateau, intruding from along the north side of the Altai Mountains: 303 incidents; that of the north track mainly intruding from the two sides of the Yablonoi Mountains: 118 incidents; that of the west track clusters east of the Kazakhstan hills, generally intruding from along the south side of the Altai Mountains: 32 incidents; (2) Another 16 tracks largely dwell and hover within Mongolia and northern China within 72 h before outbreaks, and are moreover classified into “unusual” tracks based on real investigations. This latter cohort is quite complicated and thus necessitates further assessment.
In the vertical direction, the three categories of cold air masses primarily move at 850 hPa (Figure 2b–d), among which such air masses of northwest and west tracks undergo the process of firstly rising and then lowering, with the rising being at about 50 hPa and the lowering within the realm of about 100 hPa, thus ultimately causing a decrease of 2.11 °C and then an increase of 9.71 °C to the potential temperature of the cold air mass of northwest tracks, respectively. Similarly, a decrease of 4.93 °C followed by an increase of 6.42 °C is expected of that from west tracks. In contrast, cold air masses of north tracks have consistently exhibited a decreasing trend, with vertical dynamics resulting in an increase of 10.40 °C to the potential temperature of these tracks, along with a relatively slow rising speed during the 72 h to 30 h mark. When cold air masses accelerate to lower altitudes, it is usually triggered by the gradual approaching of a cold-center to a high-pressure center caused by an upper-level jet stream moving into slots [28].
Over the subject 43-year evaluation period, the standard deviation of the annual frequency for northwest tracks was 2.01 incidents, that of north tracks was 1.33 incidents, and that of west tracks was 0.93 incidents. The annual frequency of northwest tracks decreased at a rate of 0.41 incidents every 10 years (Figure 3a), making the proportion of northwest tracks in annual strong CAO frequency dramatically decrease (Figure 3d), with both of the two decreasing trends exhibiting statistical significance (p < 0.05). Correspondingly, the other two track categories actually account for greater incidents, with an increased rate of north tracks at 0.18 incidents every 10 years and that of west tracks at 0.09 incidents 10 years. Although these increased trends do not pass statistical-significance tests, they do in fact indicate that the percentage of strong CAOs impacting central and eastern Mongolia changes every year.
Figure 2b–d shows the 72 h period before an outbreak with the potential temperature of north tracks being the lowest (i.e., −18.53 °C), that of northwest tracks being −16.10 °C, and that of west tracks being −10.19 °C. At the moment of outbreak, north tracks are about −8.85 °C, northwest tracks are about −8.53 °C, and west tracks are approximately −8.71 °C. Thus, it can be seen that origin differences exist among the three categories of tracks, causing considerable potential temperature differences of cold air masses within the 72 h period before an outbreak, but the circulation evolution characteristic is obviously more important inside the 72 h window because potential temperature differences are dramatically reduced at the time of actual outbreak.
3.2. Origin Difference
The position where an air mass crosses south of the Arctic Circle (66.5° N) is the final position at which it can be defined as the origin destination of a cold air mass. The origins of the three tracks differed greatly in this study; there were 162 occasions when northwest tracks were located between 40–80° E, 106 incidents between 80–120° E, and 35 incidents west of 40° E. Furthermore, there were 84 incidents when north tracks were east of 80° E, 32 incidents between 40–80° E, and just 2 incidents west of 40° E. In addition, there were 21 incidents when west tracks were located between 40–80° E, 8 incidents west of 40° E, and only 3 incidents east of 80° E. Generally speaking, 40–80° E and 80–120° E were shown to be the major origin zones of cold air masses intruding into the central and eastern regions of Mongolia. Table 1 provides the communication speeds of the three categories of cold air masses and their potential temperatures and pressures when leaving the polar circle. It can be seen that cold air masses of northwest tracks (NW) are fast-communicating, with relatively high potential temperatures. The early 25% of potential temperatures for west tracks (W) is lower than that of north tracks (N), which is caused by the fact that the altitude is quite high when cold air masses leave the polar circle and the moving latitude of west tracks is consistently lower than that of north tracks (Figure 2a). Hence, the cold air masses of north tracks are greatest within the 72 h period before outbreaks occur.
3.3. General Circulation of Atmosphere
In order to further manifest the mechanism of the three categories of CAOs associated with the upper-level wave train, composite anomaly fields of geopotential heights at 500 hPa and 850 hPa, vertical cross-sections of geopotential heights and potential temperatures, and temperature and horizontal wind anomalies at 850 hPa averaged for various times prior to the arrival of cold air mass cores in the central and eastern Inner Mongolian regions were constructed. The southward transportation of cold air is the most important transient eddy in the East Asia winter monsoon system [14]. Generally speaking, the background characteristics of large-scale circulation are profoundly similar [5,35], but classified in terms of tracks, the circulation differences of the three categories are quite distinctive.
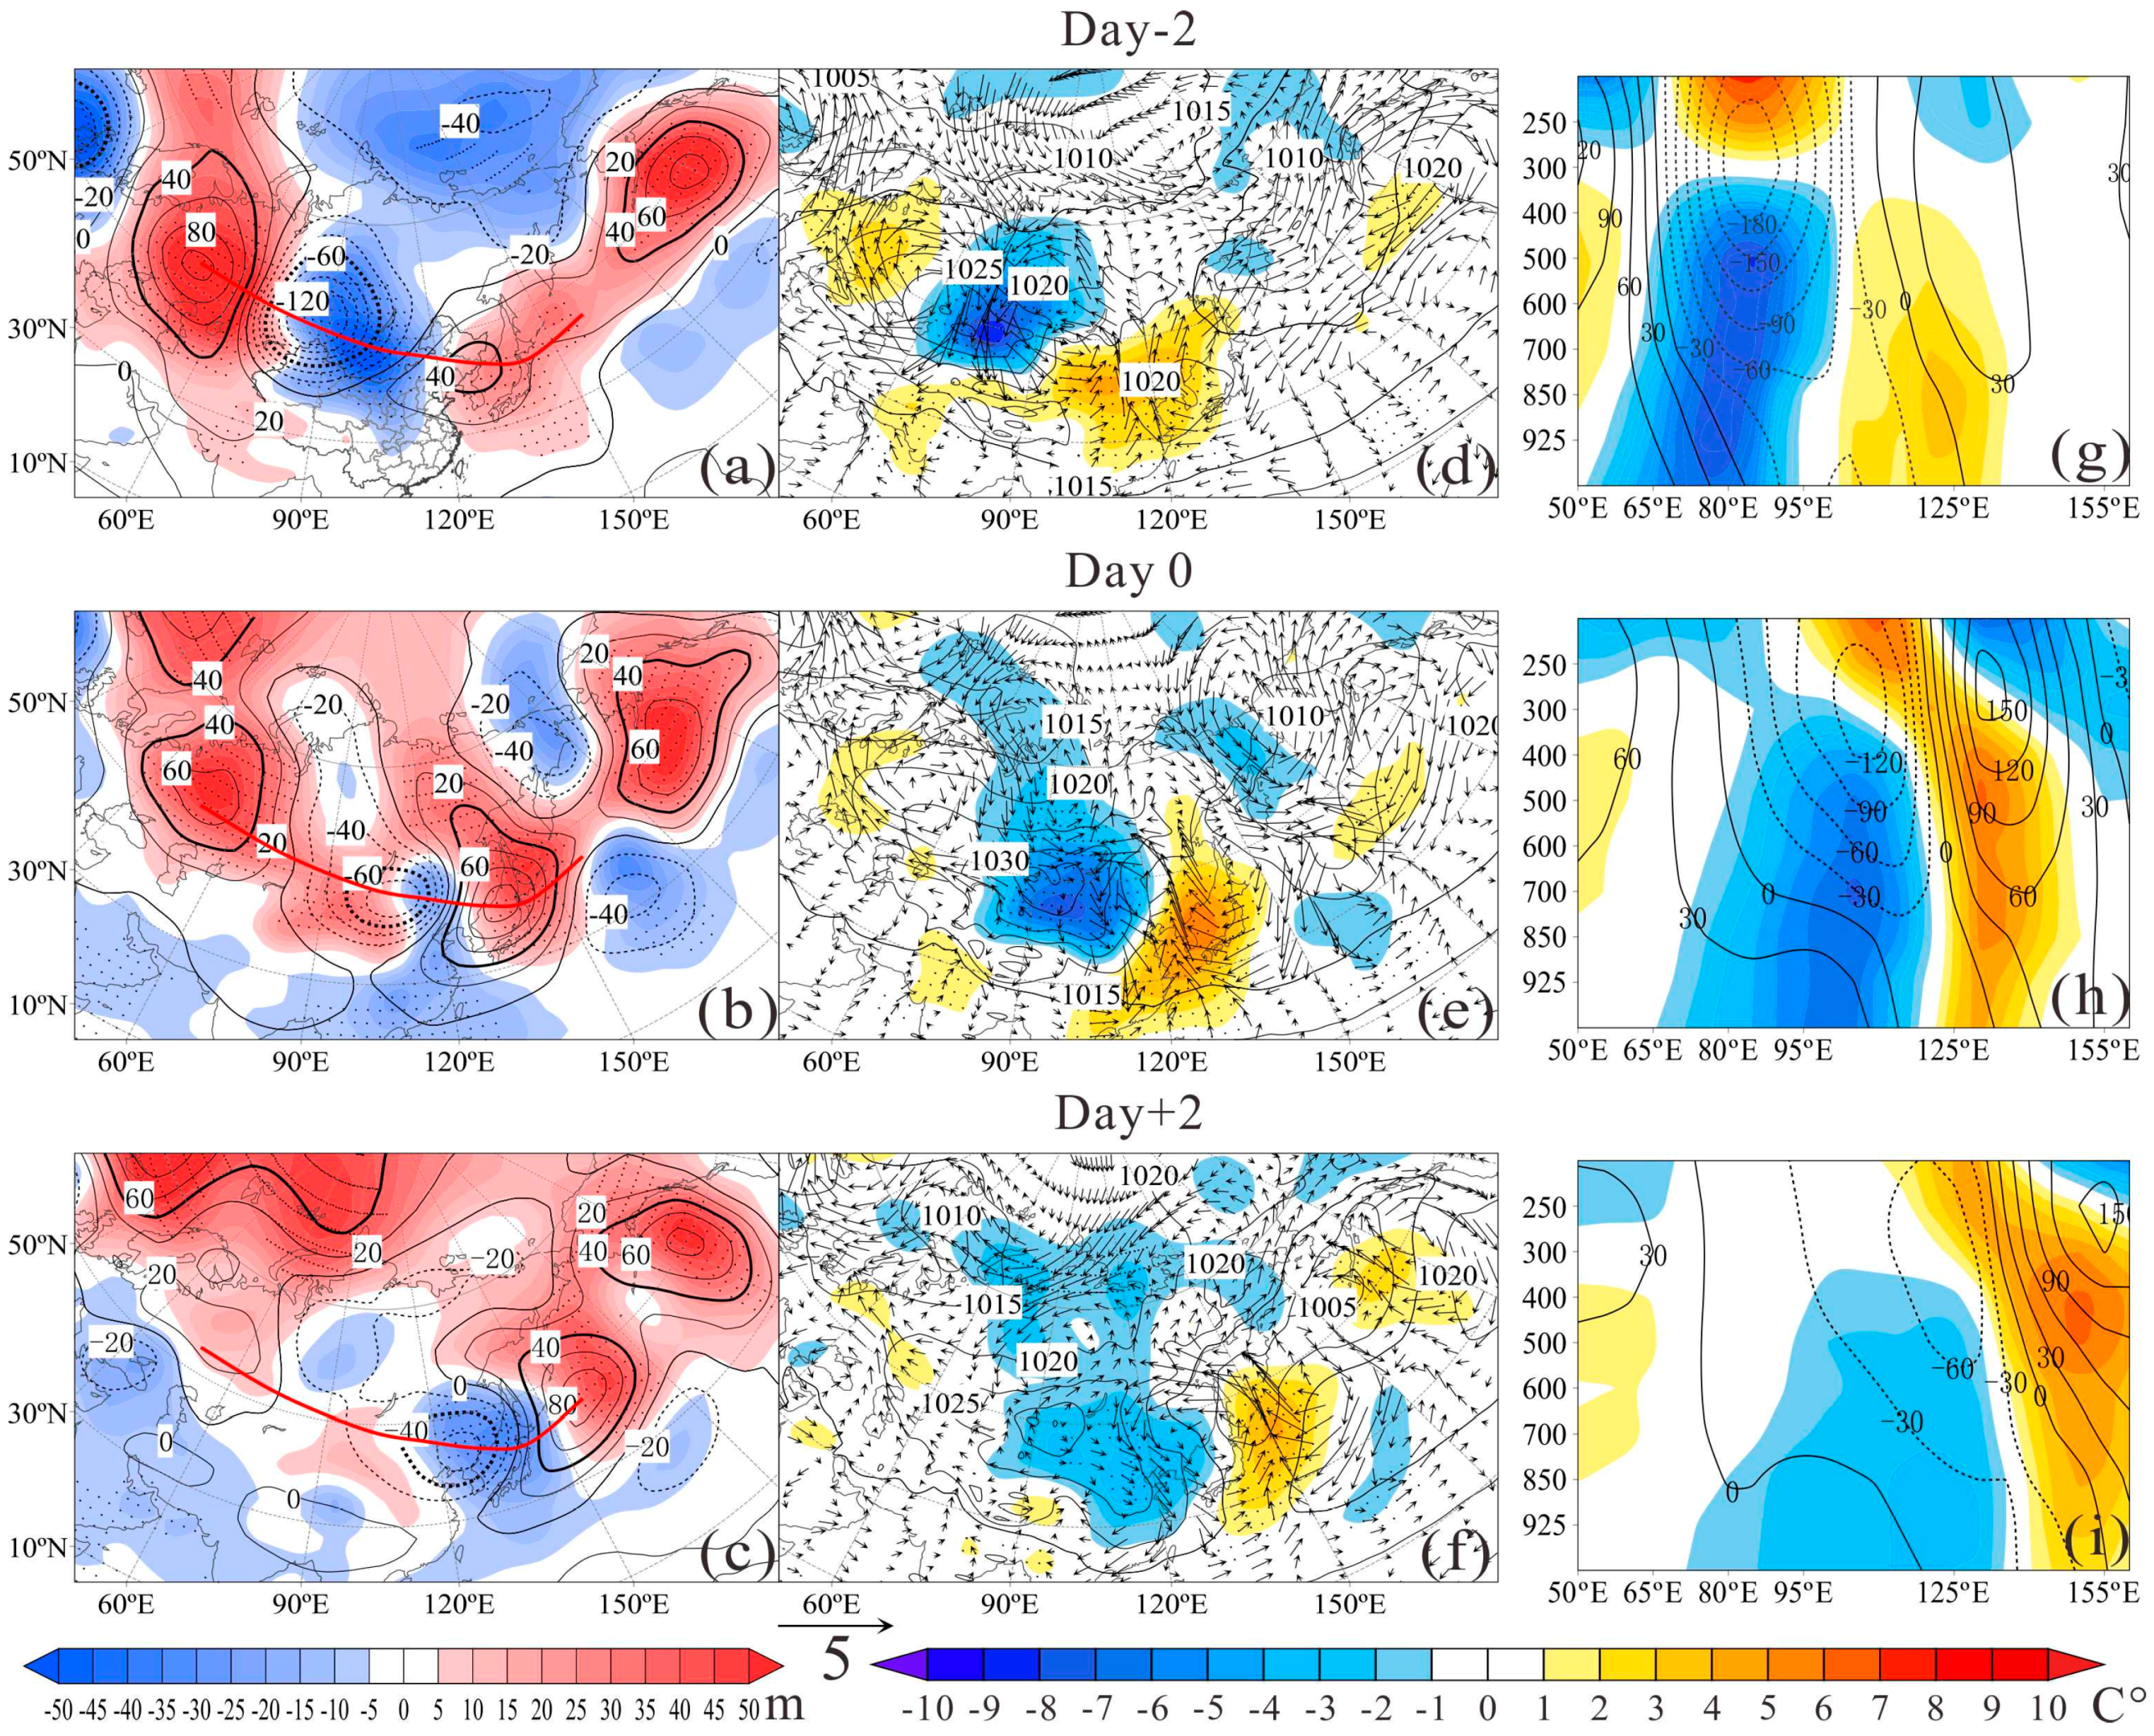
Northwest tracks have obvious ridges, troughs, and ridge movements (Figure 4a) at the upper troposphere on day −2 (the second day of outbreaks), running roughly northwest-southeast of the Ural Mountains (50–70° E, 50–70° N), Baikal (80–120° E, 45–75° N), and northeast China (110–140° E, 35–55° N). This ridge-trough-ridge structure means there are wave trains communicating from the continent of Europe to East Asia along the southeast and then to the northeast (Figure 4a–c). The cold advection between Novaya Zemlya and the Taymyr Peninsula leads to the Balkhash Lake. The existence of a cold anomaly at mid- and high-latitudes is the premise of the development of Siberian high-pressure [18], with the anticyclone process making Siberian high-pressure expand from Mongolia along the direction of the upper wave train toward South China (Figure 4d–f). The vertical structure along the wave train shows that geopotential height tilts obviously from the lower troposphere to the higher troposphere (Figure 4g–i), while potential temperature is quite opposite (i.e., the tilted warm ridge and cold trough structure are typical of extratropical cyclone baroclinic development systems [36] where low level low-pressure is located in the east side of the upper trough with cold advection accordingly located west of the subject low pressure). The ongoing interaction of cold advection from the low level and the upper trough results in the consistent strengthening of the Siberian high-pressure system. On day 0, anticyclone-cyclone combinations lead strong northwest winds to create a cold anomaly in the southward direction (Figure 4b,e) which maintains the southward expansion of Siberian high-pressure. On day +2, the warm anomaly center located in Japan moves eastward toward the west Pacific Ocean (Figure 4f), with the Siberian high-pressure center subsequently weakening and withdrawing westward to the north of Xinjiang. Accordingly, cold advection of northwest tracks weaken to the south and coastal cyclones likewise weaken greatly, thereby causing cold surges of northwest tracks to weaken as well [37].
The general characteristics of upper wave trains in the troposphere of north tracks are similar to Figure 4, with the main difference lying in the ridge-trough-ridge model, which runs northwest-southeast from the Ural Mountains to the Korean Peninsula. The center (warm ridge) located over the Ural Mountains can be up to 100 m, promoting mass transfer between high latitudes and low latitudes thus causing more cold air to be led to Balkhash Lake (Figure 5d). With the wave train moving southeastward toward East Asia (Figure 5a–c), Siberian high-pressure extends and expands southward. By comparison, the day 0 strength of the high-pressure center and cold anomaly are greater than in Figure 5e, with the front end of the high-pressure depicted by north wind airflow directly leading Siberian cold air to move southward and thus easily bringing extremely cold temperatures to the central part of China (Figure 5e). Figure 5g–i clearly presents a growing baroclinic system whose characteristics are similar to Figure 4g–i, but day +2 has obvious geopotential height and potential temperature tilts. The south end of the Aleutian low-pressure system is located at the Sea of Okhotsk, with the central air pressure lower than 1005 hPa, forming a strong coastal cyclonic scenario of a most unusual nature. The anomalous isoline of −1 °C extending to 25° N implies that the southward intrusion capability of north tracks is greater than that of northwest tracks.
The upper warm ridge of day −2 west tracks is located at the East European Plain. Similar to Figure 5, the center of this extremely great height accelerates the transportation of cold air to lower latitudes from the polar regions around Novaya Zemlya; moreover, lower cold anomalies of the troposphere extend to Balkhash Lake (Figure 6g–i), with corresponding Siberian high-pressure ultimately strengthened there. The vertical structure shows that the baroclinicity of west tracks is greater than that of the other two categories (Figure 6g–i), the geopotential height of day 0 polar regions increases (Figure 6a,b), cold advection is transported to the northwest part of China from the polar regions around Novaya Zemlya, and the front end of Siberian high-pressure is of a northwest airflow. This study composited the AO indices of the 10 days prior to and following outbreaks (Figure 7). AO indices of west tracks started reducing from day −4 and began to reverse that trend on day +2. AO negative phases indicate that large-scale circulation modes are more favorable for cold air in polar regions to move southward, and that the strengthening of cold anomalies will maintain the strength of Siberian high-pressure [5,18]. This implies that west tracks would probably trigger cold surges hovering for quite a long period of time. Day 0 is located at the warm anomaly center of the Korean Peninsula. Strong and westerly situated, as well as obstructing the cold advection to move eastward, the anticyclone-cyclone combination formed by the coastal anticyclone and Siberian high-pressure is more helpful for advancing cold advection southward. Obvious northeast wind anomalies occur south of 30° N (Figure 6f), conforming to the characteristics of typical strong cold surges in the South [7,14,21].
3.4. Impacts of Strong CAOs on Downstream Areas
This study employed station datasets to verify and quantitatively describe the characteristic differences of strong CAOs resulting from circulation system evolution. Figure 8a–c shows that the outbreak location (i.e., central and eastern Inner Mongolia) has the largest temperature-fall center, but what’s noteworthy is that there is also a temperature-fall center in northeast China because the temperature changes in the two regions are closely linked and the latter is the principal component of temperature normality in China [38]. North tracks resulted in a temperature decrease of −10 °C to −7.5 °C in the central and eastern parts, as well as the South, while west tracks have greater influences on the regions south of 30 °N than do north tracks. The distribution of temperature anomalies of the three categories of tracks north of 40 °N shows the obvious track differences (Figure 8d–f). Northwest tracks would cause the temperature anomaly of the area north of Xinjiang and the central and eastern Inner Mongolian areas to decrease to below −5.4 °C. North tracks have greater influences on temperature anomalies of the central and eastern regions north of 30 °C than the other two categories. Jilin can be below −6.2 °C and the average temperature of the central part can be as low as −3.8 °C. West tracks can cause the temperature anomaly of north Xinjiang to reduce to −7 °C, and prompt an unusually low temperature of below −3.8 °C in the southern part of Hunan. As observed in Figure 8g–i, northwest tracks can last for over 2.6 days in the northeast; north tracks can last for more than 2.6 days in the central part and south of the northeastern region; west tracks can exert over 2.6 days influence in the southeastern area south of 35 °N, and for over 3 days in Jiangxi. Given that the daily average temperature is not accurately measurable, and that the lowest temperature is not influenced by solar radiation (and can moreover better reflect the relative extent of temperature drops and the influential degrees of strong CAOs), this study also investigated the temperature-fall process and temperature anomaly of the lowest temperature and found that the results were identical across the board. Obviously, the influential characteristics of the three categories of strong CAOs calculated with station datasets on downstream areas accord with the circulation evolution process depicted in Figure 4, Figure 5, Figure 6 and Figure 7.
3.5. Heat Budget Analysis of Downstream Areas
Influenced by the three categories of tracks, the unique heat and dynamic force factors of each region produce regional differences in strong CAOs. To quantitatively compare these differences, for each strong CAO, on a 850 hPa level set on the day with the average largest temperature-fall of each region as day 0, the regional averages of each item three days before and after were sequenced. The respective sequences were then compounded for the three categories. Since daily change extremes of each item are contained, the evolution process of strong CAOs should be more clear [39]. As such, the associated heat balance equation is as follows:
whereby, DT is daily temperature change, HA is daily averaged temperature horizontal advection, VA is daily averaged temperature vertical advection, and DIA is the mean diabatic contribution to the 24 h temperature change. HA, VA, and DT are calculated based on reanalysis datasets, and DIA is calculated via equation; hence, some degree of calculation error may exist. In addition, the daily change of temperature anomaly (TA) and total cloud cover anomaly (TCDC) is presented.
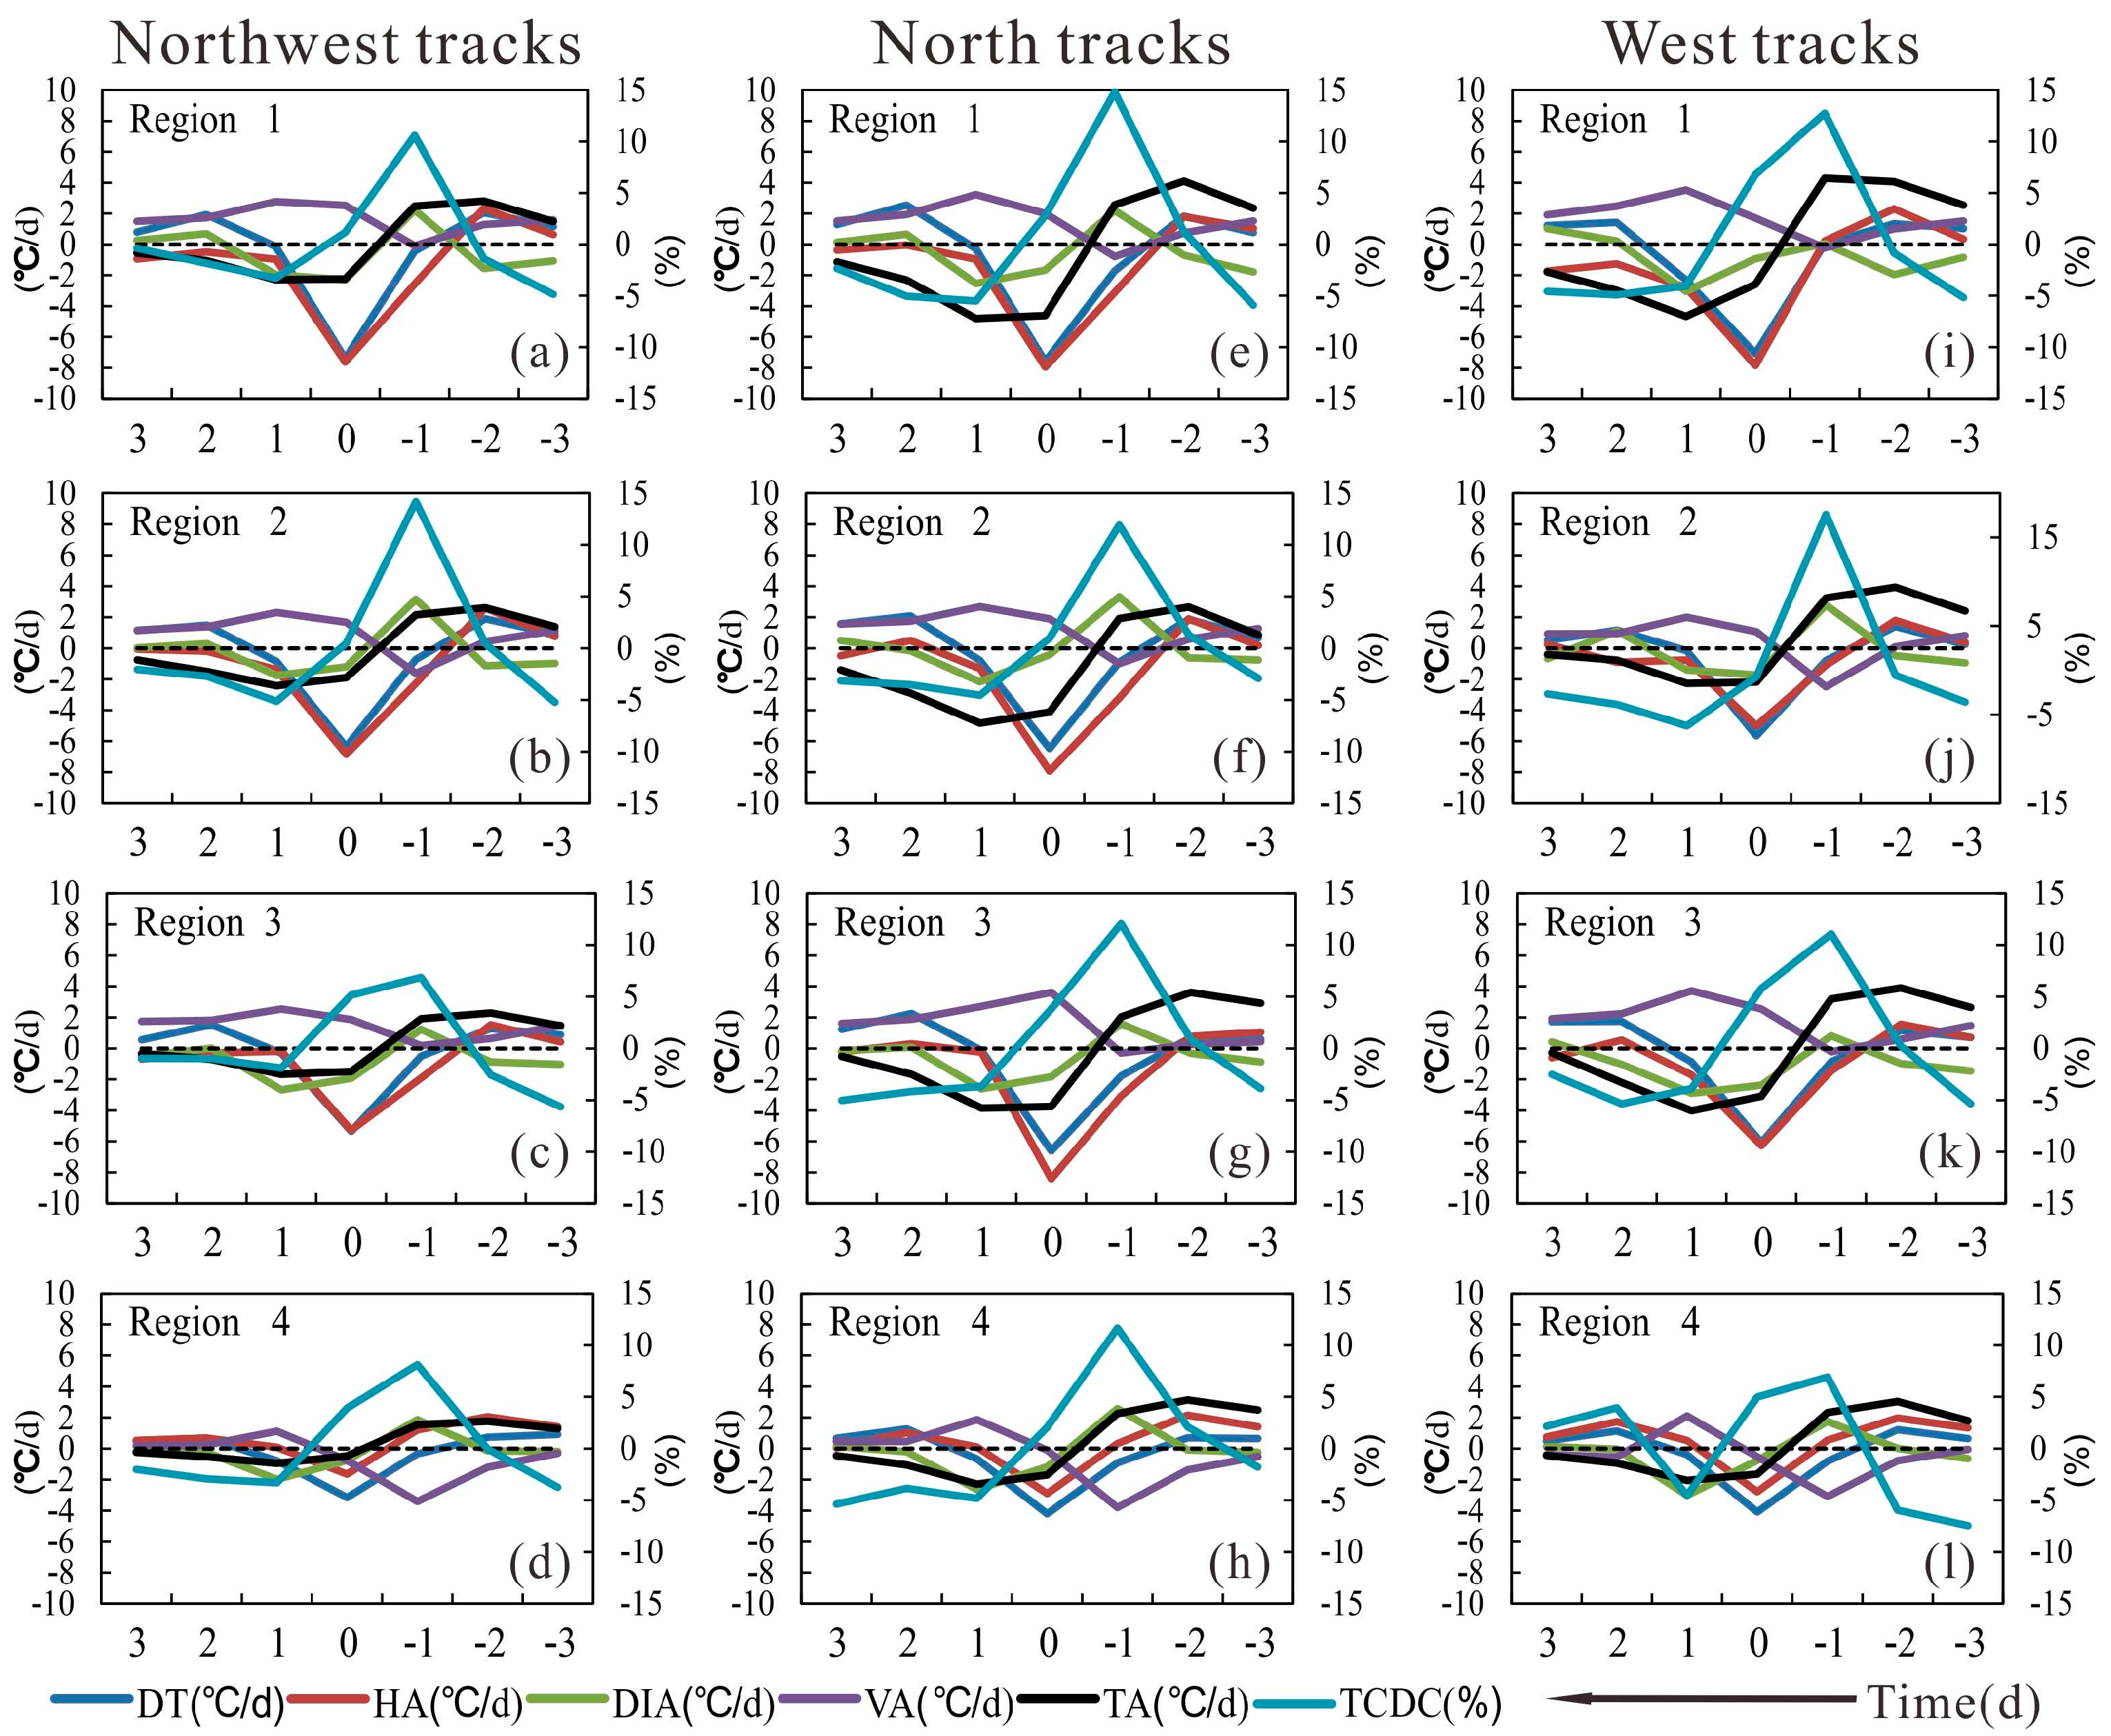
As shown in Figure 9, cold advection occurs to each region on day −1, TA begins to decrease, a cold front becomes relatively thin when arriving at lower (southern) latitudes, ascending motion prevails in each region for the existence of a warm anomaly (Figure 4, Figure 5 and Figure 6), TCDC increases and DIA plays the role of warming (latent heat release and radiation cooling reduction occurs), thus ultimately weakening the cooling effects of VA and HA. Influenced by north tracks, the aforementioned process causes DT to decrease sharply, with the decreases of Regions 1–4 respectively portrayed as 1.72, 0.89, 1.77, and 0.92 °C/day, and the temperature of Region 3 decreases by two times that of regions influenced by other tracks. What’s noteworthy is that VA has stronger cooling effects in Region 4 (Figure 9d,h,l) for superimposed topographic lifting, −3.81 °C/day when influenced by north tracks, −3.09 °C/day by west tracks, and −3.41 °C/day by northwest tracks. On day 0, cold advection causes DT to decrease sharply, obviously, in the evolution process of strong CAOs. HA has temporal specificity or “sudden influences” on DT, and not the same lasting process as VA and DIA. Because ground cold-highs arrive, descending motion dominates in Regions 1–3, TCDC reduces sharply, and the clear sky strengthens the influences of radiation cooling effects. After HA and DIA offset the warming effects by descending, DT then decreases to a large extent, but the decrease of DT in Region 4 is ultimately caused by the joint cooling of HA, DIA and VA. On day +1, although cold advection in each region has weakened, DT is still negative because the cooling effects of DIA strengthen, thus the temperature anomaly reaches a minimum. Ultimately, the cold maintenance mechanism mainly relies on DIA and HA to jointly ease the warming effects of VA.
4. Conclusions and Discussion
This paper analyzed the characteristic differences of strong CAOs from different tracks intruding central and eastern Inner Mongolia during the winter-half years of 1970–2013, with the main conclusions drawn as follows:
- (1)
- The strong CAOs of different tracks intruding central and eastern Inner Mongolia in the winter-half years of 1970–2013 can be classified based on track differences into four types: 303 incidents of northwest tracks intruding from the north side of the Altai Mountains; 118 incidents of north tracks intruding from along the Yablonoi Mountains; 32 incidents of west tracks generally intruding from the south side of the Altai Mountains; and 16 incidents of “unusual” tracks.
- (2)
- The circulation evolution before outbreaks causes a temperature increase of 9.71 °C for cold air masses of northwest tracks, 6.42 °C of west tracks, and 10.40 °C of north tracks, which altogether denote a weakening of influences for origin differences in the potential temperatures of cold air masses.
- (3)
- West tracks are mainly impacted by the warm high anomaly of Eastern Europe and the negative phase changes at AO (which causes continuous cold advection transport in polar regions). Both of these factors are thought to likely influence the existence of the abnormally low temperatures in Northwest China with notable temperature decreases in the southeast regions of the country (south of 35° N) over a period of three consecutive days. North tracks are largely influenced by the warm high anomaly of the Ural Mountains, which may cause sharp temperature decreases in East China resulting in a greater possibility of cold-related damage. Northwest tracks are typically engendered by cold air masses at high latitudes that move southward in tandem with the East Asian winter monsoon circulation. The Siberian high under northwest tracks is weaker than these under the west and north tracks, and northwest tracks mainly impacting Northeast China.
In the past, the characteristics (intensity, frequency, and duration) and tracks of strong CAOs were generally studied separately [10,11,12], as opposed to jointly discussing their relationships as conducted forth in this paper. Since strong CAOs of different tracks exert different impacts on downstream regions, including impacted areas, intensity, and duration, the generation of disparate CAO tracks (in particular, north tracks and west tracks that can severely impact China) is essentially impacted by changes in the large-scale circulation. An example of this is the change in warm high anomalies of the Ural Mountains, Eastern Europe, and AO, which inspires the possibility of applying these system changes to help predict the tracks and impacted areas of strong CAOs. It is noteworthy that strong CAOs often adjust via synoptic eddy activity. Therefore, the interaction of transient synoptic eddies and low-frequency flows should be considered within prediction schemes due to their important contribution in the generating and maintenance of low-frequency flows for controlling synoptic eddy activities [2,5]. Therefore, it is necessary to thoroughly assess the relationship between the daily change of strong CAOs and that of scale circulation systems over a week (e.g., blocking, AO) to improve the prediction capability for regionally strong CAO characteristics. This paper essentially provides a preliminary revelation of the connection between different tracks and major atmospheric circulation systems. In particular, physical mechanisms will be further analyzed in greater detail. Over the 1970–2013 period, northwest tracks decrease to 0.41 incidents every 10 years. For the past 43 years, northwest tracks have significantly decreased in frequency, i.e., it currently is 0.41 incidents every 10 years, while north and west tracks have slightly increased. A large proportion of northwest tracks in the overall frequencies of most years has resulted in a decrease of the overall frequency of strong CAOs in central-eastern Inner Mongolia. The northwest tracks, compared to other tracks, typically lack a main forcing system three days prior to outbreaks, which makes it easier to be impacted by the climate changes of polar regions and high-latitude areas. For instance, sea ice, ground temperatures, westerly currents, and other changes may result in the decrease of strong CAOs of northwest tracks [10,14,27], and some major causes are yet to be further analyzed. In addition, the frequencies of north tracks and west tracks have been increasing moderately, indicating that the abnormal cold-temperature damage caused by strong CAOs of Inner Mongolia has accordingly experienced a discernibly increasing frequency. As such, additional attention needs to be paid to the analysis and prediction of strong CAOs in this geographical area.
Acknowledgments
This work was supported by the National Nature Science Foundation of China (41575085 and 41575102).
Author Contributions
Zongming Wang and Zhaobo Sun initiated and designed the study. Gang Zeng collected the data. Zongming Wang analyzed the data and wrote the paper.
Conflicts of Interest
The authors declare no conflict of interest. The founding sponsors had no role in the design of the study; in the collection, analyses, or interpretation of data; in the writing of the manuscript, and in the decision to publish the results.
References
- Hsu, H.H.; Wallace, J.M. Vertical structure of wintertime teleconnection patterns. J. Atmos. Sci. 1985, 42, 1693–1710. [Google Scholar] [CrossRef]
- Lau, K.M.; Chang, C.P. Planetary scale aspects of the winter monsoon and atmospheric teleconnections. Monsoon. Meteorol. 1987, 7, 161. [Google Scholar]
- Yang, S.; Lau, K.M.; Kim, K.M. Variations of the East Asian jet stream and Asian–Pacific–American winter climate anomalies. J. Clim. 2002, 15, 306–325. [Google Scholar] [CrossRef]
- Chen, W.; Graf, H.F.; Huang, R.H. The interannual variability of East Asian winter monsoon and its relation to the summer monsoon. Adv. Atmos. Sci. 2000, 17, 48–60. [Google Scholar]
- Park, T.W.; Ho, C.H.; Yang, S. Relationship between the Arctic Oscillation and Cold Surges over East Asia. J. Clim. 2011, 24, 68–83. [Google Scholar] [CrossRef]
- Boyle, J.S.; Chen, T.J. Synoptic aspects of the wintertime East Asian monsoon. In Monsoon Meteorology; Chang, C.P., Krishnamurti, T.N., Eds.; Oxford University Press: Oxford, UK, 1987; pp. 125–160. [Google Scholar]
- Ding, Y.H.; Meng, X. A case study of development of a cold surge after outbreak of cold wave in East Asia. Acta Meteorol. Sin. 1994, 52, 442–451. (In Chinese) [Google Scholar]
- Chen, T.C. A North Pacific Short-Wave Train during the Extreme Phases of ENSO. J. Clim. 2001, 15, 2359–2376. [Google Scholar] [CrossRef]
- Moschos, N.; Christoforaki, M.; Antonatos, P. Seasonal distribution of acute myocardial infarction and its relation to acute infections in a mild climate. Int. J. Card. 2004, 93, 39–44. [Google Scholar] [CrossRef]
- Wang, Z.Y.; Ding, Y.H. Climate Change of the Cold Wave Frequency of China in the Last 53 Years and the Possible Reasons. Chin. J. Atmos. Sci. 2006, 30, 1068–1076. (In Chinese) [Google Scholar]
- Qian, W.H.; Zhang, W.W. Changes in Cold Wave Events and Warm Winter in China during the Last 46 Years. Chin. J. Atmos. Sci. 2007, 31, 1266–1278. (In Chinese) [Google Scholar]
- Wang, Z.M.; Sun, Z.B.; Li, Z.X.; Hong, N.D. Variation characteristics of strong cold air activity frequency in eurasia from 1949 to 2009. Meteorol. Disast. Reduct. Res. 2011, 34, 16–23. (In Chinese) [Google Scholar]
- Gong, D.Y.; Wang, S.W. Influence of Arctic Oscillation on winter climate over China. J. Geogr. Sci. 2003, 13, 208–216. [Google Scholar]
- Zhang, Y.; Sperber, K.R.; Boyle, J.S. Climatology and interannual variation of the East Asian winter monsoon: Results from the 1979–95 NCEP/NCAR reanalysis. Mon. Weather Rev. 1997, 125, 2605–2619. [Google Scholar] [CrossRef]
- Zhang, Y.; Wang, W.C. Model-simulated northern winter cyclone and anticyclone activity under a greenhouse warming scenario. J. Clim. 1997, 10, 1616–1634. [Google Scholar] [CrossRef]
- Gong, D.Y.; Ho, C.H. The Siberian High and climate change over middle to high latitude Asia. Theor. Appl. Climatol. 2002, 72, 1–9. [Google Scholar] [CrossRef]
- Gong, D.Y.; Ho, C.H. Intra-seasonal variability of wintertime temperature over East Asia. Int. J. Climatol. 2004, 24, 131–144. [Google Scholar] [CrossRef]
- Takaya, K.; Nakamura, H. Mechanisms of Intraseasonal Amplification of the Cold Siberian High. J. Atmos. Sci. 2005, 62, 4423–4440. [Google Scholar] [CrossRef]
- Takaya, K.; Nakamura, H. Geographical Dependence of Upper-Level Blocking Formation Associated with Intraseasonal Amplification of the Siberian High. J. Atmos. Sci. 2004, 62, 4441–4449. [Google Scholar] [CrossRef]
- Ding, Y.; Krishnamurti, T.N. Heat budget of the Siberian high and the winter monsoon. Mon. Weather Rev. 1987, 115, 2428–2449. [Google Scholar] [CrossRef]
- Yihui, D. Build-up, air mass transformation and propagation of Siberian high and its relations to cold surge in East Asia. Meteorol. Atmos. Phys. 1990, 44, 281–292. [Google Scholar] [CrossRef]
- Joung, C.H.; Hitchman, M.H. On the role of successive downstream development in East Asian polar air outbreaks. Mon. Weather Rev. 1982, 110, 1224–1237. [Google Scholar] [CrossRef]
- Lau, N.C.; Lau, K.M. The structure and energetics of midlatitude disturbances accompanying cold-air outbreaks over East Asia. Mon. Weather Rev. 1984, 112, 1309–1327. [Google Scholar] [CrossRef]
- Park, T.W.; Jeong, J.H.; Ho, C.H.; Kim, S.J. Characteristics of atmospheric circulation associated with cold surge occurrences in East Asia: A case study during 2005/06 winter. Adv. Atmos. Sci. 2008, 25, 791–804. [Google Scholar] [CrossRef]
- Shi, N.; Bueh, C. Three-dimensional dynamic features of two arctic oscillation types. Adv. Atmos. Sci. 2013, 30, 1039–1052. [Google Scholar] [CrossRef]
- Bueh, C.; Li, Y.; Lin, D.W.; Lian, Y. Interannual variability of summer rainfall over the northern part of China and the related circulation features. J. Meteorol. Res. 2016, 30, 615–630. [Google Scholar] [CrossRef]
- Li, F.; Jiao, M.Y.; Ding, Y.H.; Jin, R.H. Climate change of arctic atmospheric circulation in last 30 years and its effect on strong cold events in China. Plateau Meteor. 2006, 25, 209–219. [Google Scholar]
- Xie, A.; Lu, Y.; Chen, S.J. The Evolution of Siberian High Prior to the Outbreak of Cold Air (in Chinese). Chin. J. Atmos. Sci. 1992, 16, 677–685. [Google Scholar]
- Walsh, J.E.; Phillips, A.S.; Portis, D.H.; Chapman, W.L. Extreme cold outbreaks in the United States and Europe, 1948–99. J. Clim. 2001, 14, 2642–2658. [Google Scholar] [CrossRef]
- Kalnay, E.; Kanamitsu, M.; Kistler, R.; Collins, W.; Deaven, D.; Gandin, L.; Iredell, M.; Saha, S.; White, G.; Woollen, J. The NCEP/NCAR 40-year reanalysis project. Bull. Am. Meteorol. Soc. 1996, 77, 437–471. [Google Scholar] [CrossRef]
- Climate Prediction Center (CPC). Teleconnections: Arctic Oscillation. Available online: http://www.cpc.ncep.noaa.gov/products/precip/CWlink/daily_ao_index/ao.shtml (accessed on 1 October 2016).
- Draxler, R.R. Boundary layer isentropic and kinematic trajectories during the August 1993 North Atlantic Regional Experiment Intensive. J. Geophys. Res. Atmos. 1996, 101, 29255–29268. [Google Scholar] [CrossRef]
- Stohl, A. Computation, accuracy and applications of trajectories—A review and bibliography. Atmos. Environ. 1998, 32, 947–966. [Google Scholar] [CrossRef]
- Lee, J.G.; Han, J.W.; Whang, K.Y. Trajectory Clustering: A Partition-and-Group Framework. In Proceedings of the 2007 ACM SIGMOD International Conference on Management of Data, Beijing, China, 11–14 June 2007; Association for Computing Machinery: New York, NY, USA, 2007; pp. 593–604. [Google Scholar]
- Jhun, J.G.; Lee, E.J. A new East Asian winter monsoon index and associated characteristics of the winter monsoon. J. Clim. 2004, 17, 711–726. [Google Scholar] [CrossRef]
- Holton, J.R.; Hakim, G.J. An Introduction to Dynamic Meteorology, 5th ed.; Academic Press: London, UK, 2012; pp. 146–147. [Google Scholar]
- Konrad, C.E.; Colucci, S.J. An examination of extreme cold air outbreaks over eastern North America. Mon. Weather Rev. 1989, 117, 2687–2700. [Google Scholar] [CrossRef]
- Wang, H.; Gong, Q.; Sun, F.; Yang, S. Temperature anomaly features in northeast China and east of North China and primarily analysis of its mechanism. Plateau Meteorol. 2005, 24, 1024–1033. [Google Scholar]
- Portis, D.H.; Cellitti, M.P.; Chapman, W.L.; Walsh, J.E. Low-frequency variability and evolution of North American cold air outbreaks. Mon. Weather Rev. 2006, 134, 579–597. [Google Scholar] [CrossRef]
Figure 1.
Map showing the study area.

Figure 2.
72 h track before outbreaks. Horizontal views in (a): the grey are north tracks, the red are northwest tracks, and the black are west tracks. The bold lines and dots are average tracks and daily average positions, respectively. Vertical views in (b–d): (b) is northwest tracks, (c) is north tracks, and (d) is west tracks; 0 in the horizontal coordinate represents outbreak and “-” represents before the outbreak, with an associated time interval of 1 h.
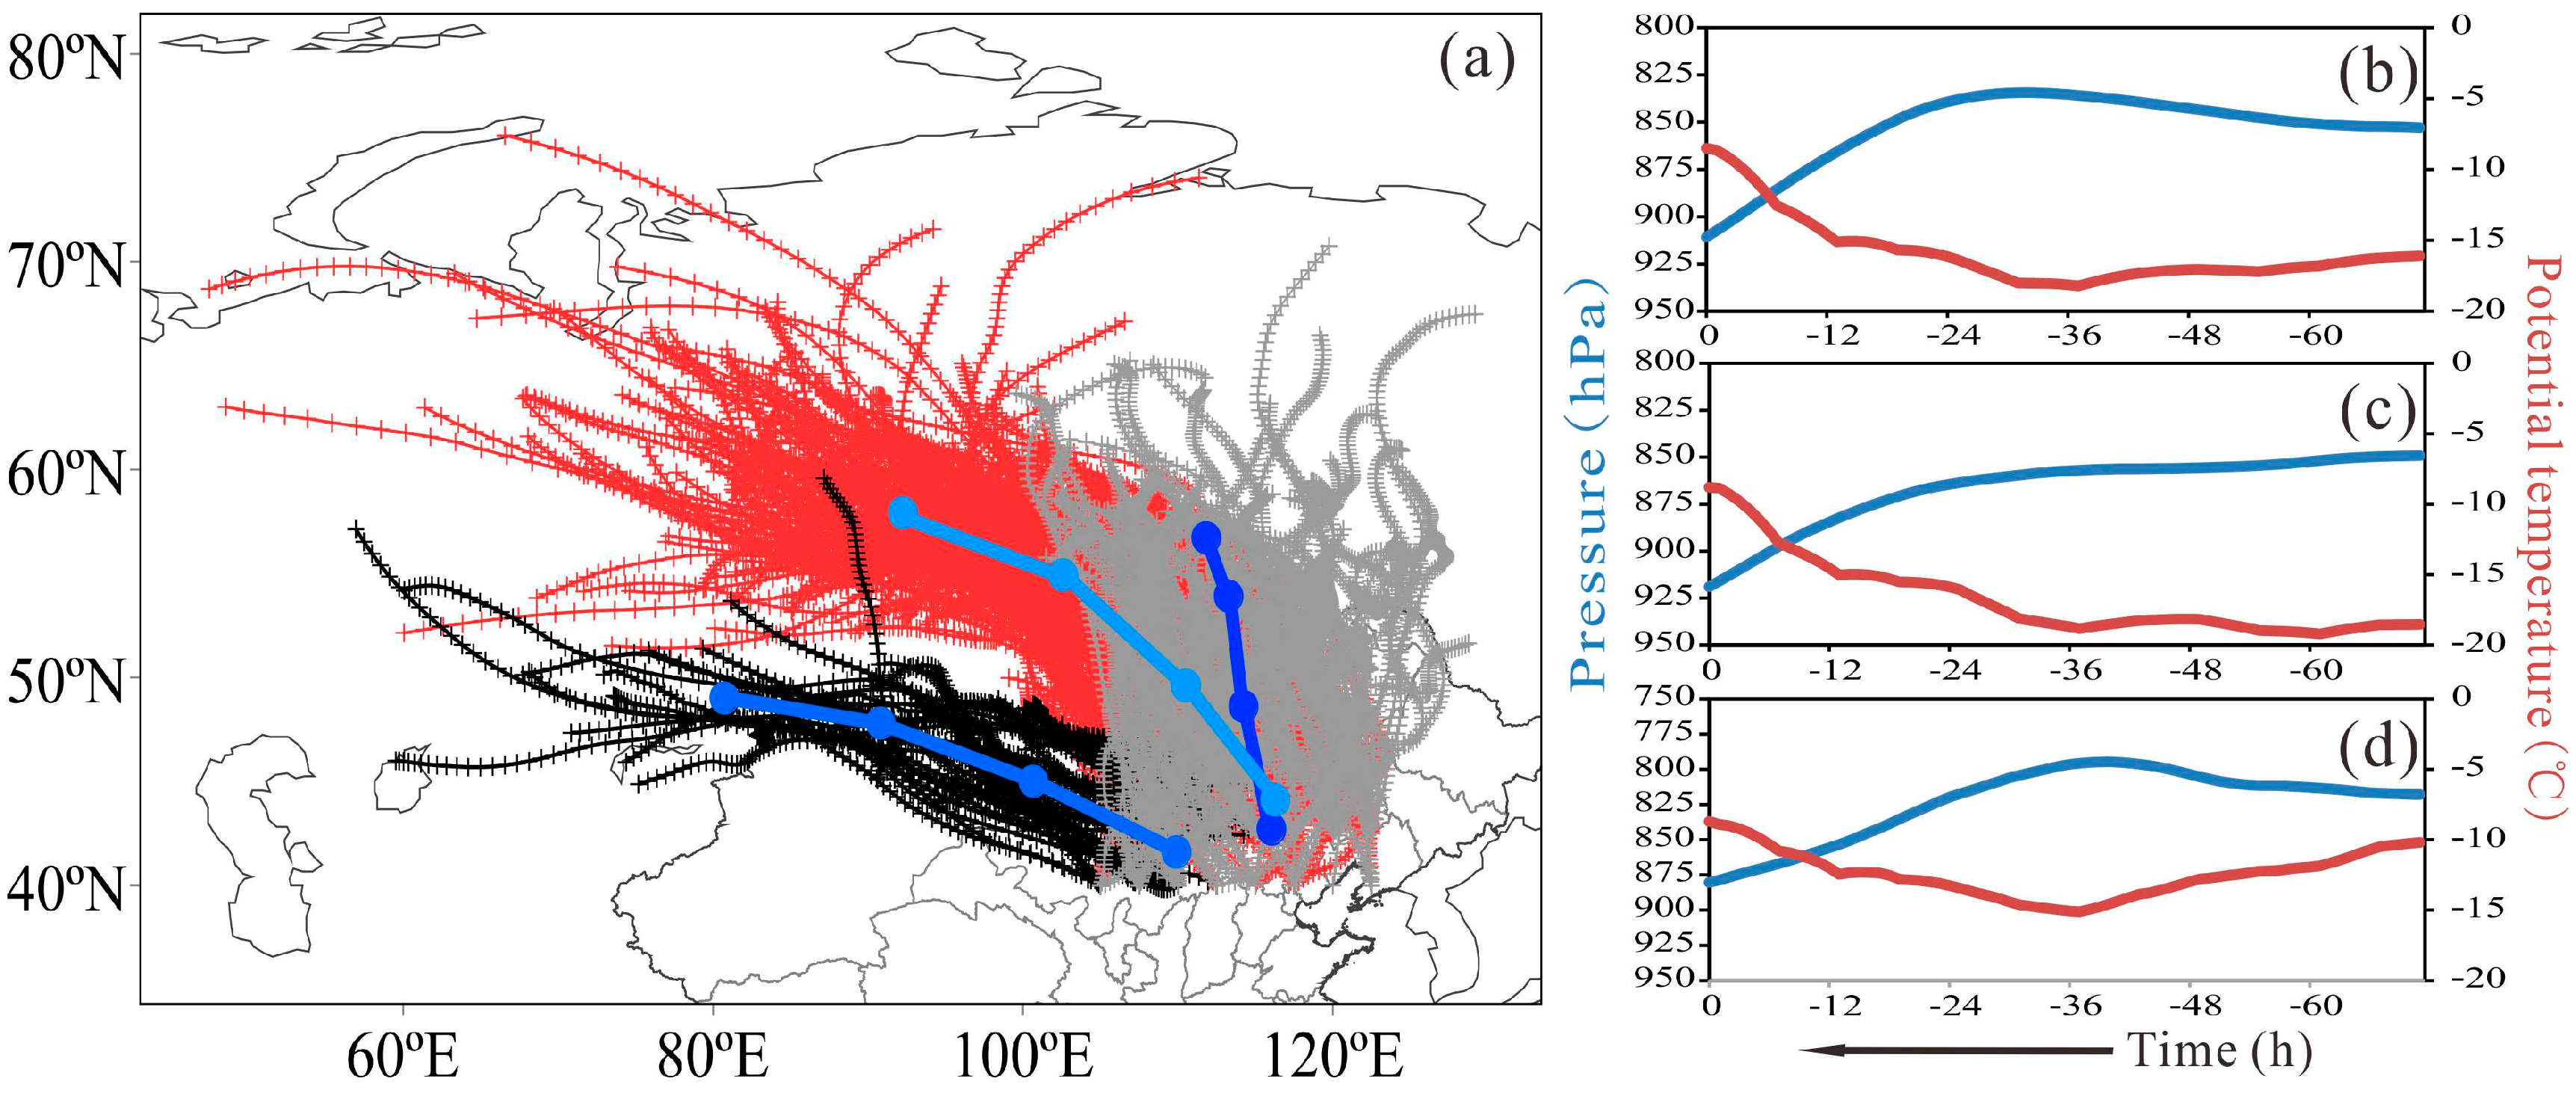
Figure 3.
Interannual variation of frequency (a–c) and interannual variation of frequency proportion (d–f) obtained by dividing the total frequencies. The dotted line is a simple-regression trend line.
Figure 3.
Interannual variation of frequency (a–c) and interannual variation of frequency proportion (d–f) obtained by dividing the total frequencies. The dotted line is a simple-regression trend line.
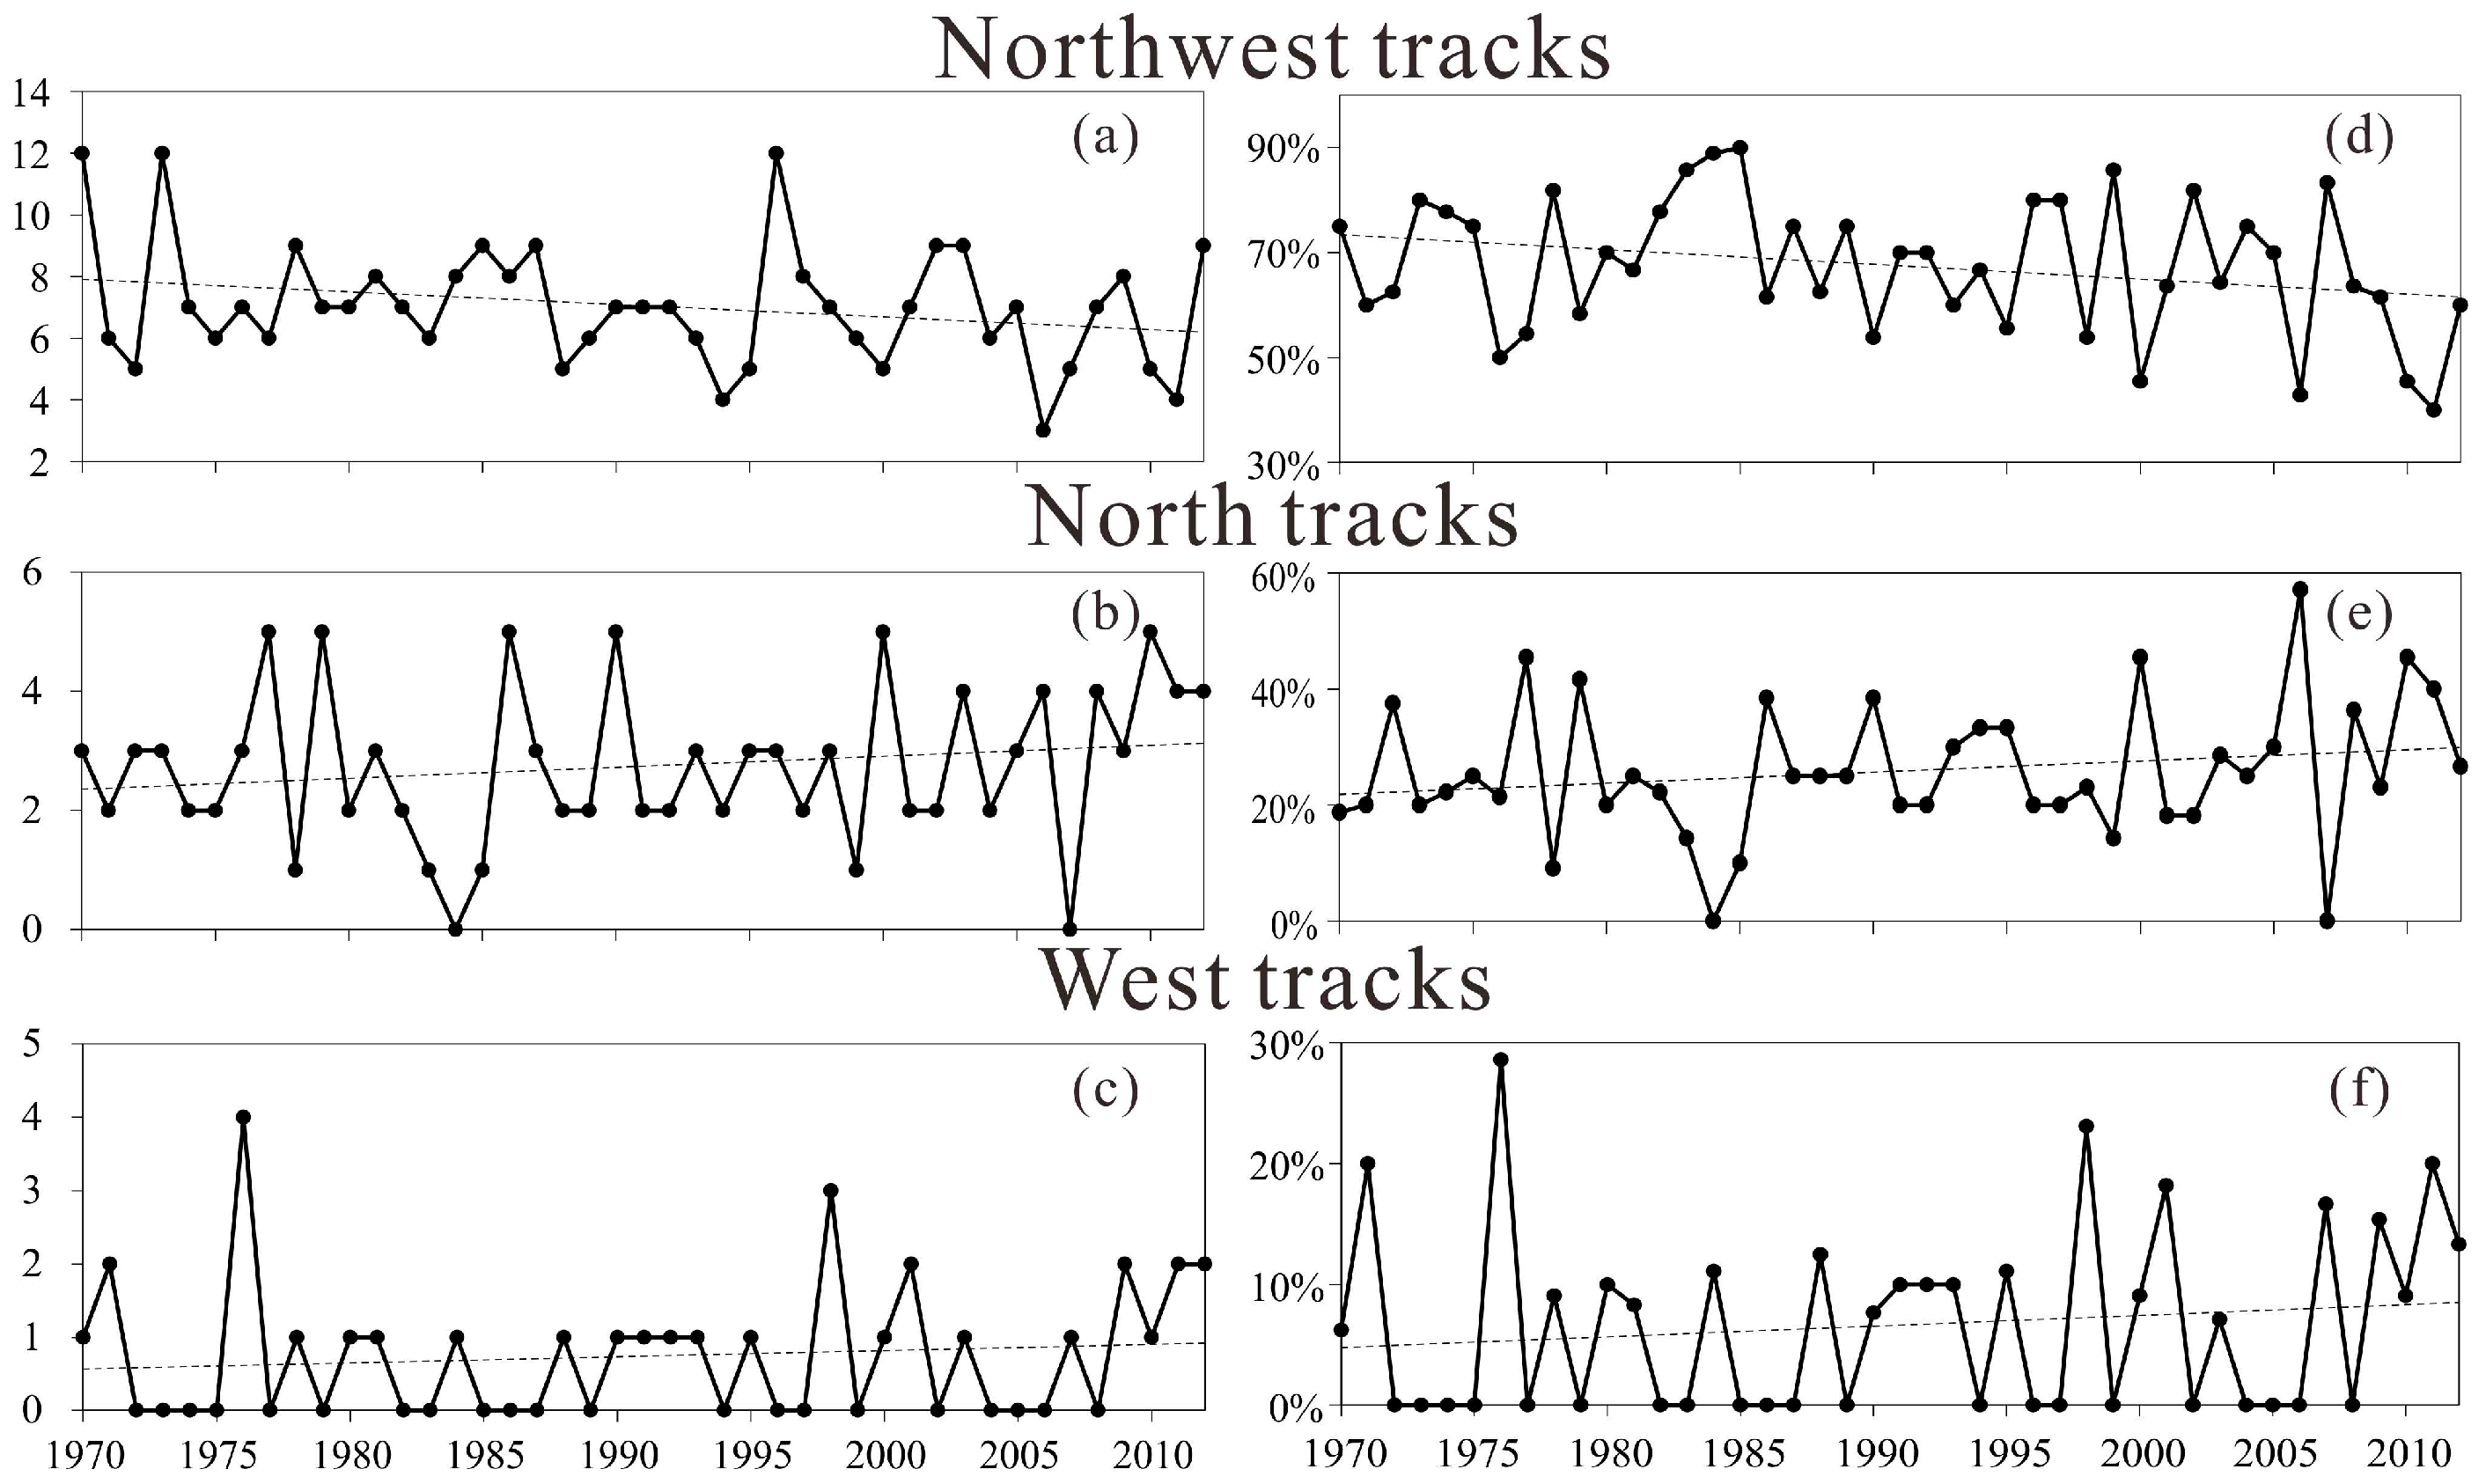
Figure 4.
Composite sea level pressure (contours, 5hPa interval) in (d–f). Composite anomalies of (a–c) geopotential height at 500 hPa (contours, 20 m interval, and the bolded items with a 95% reliability test) and 850 hPa (shadow, grey dots marked with 95% reliability test area), (d–f) temperature (shadow, grey dots marked with 95% reliability test area) and winds (vectors) at 850 hPa, and (g–i) vertical cross sections of geopotential height (contours, 20 m interval) and potential temperature (shadings) along red lines in (a–c) during ±2 days relative to 303 cold events of northwest tracks occurrences in the entire analysis period.
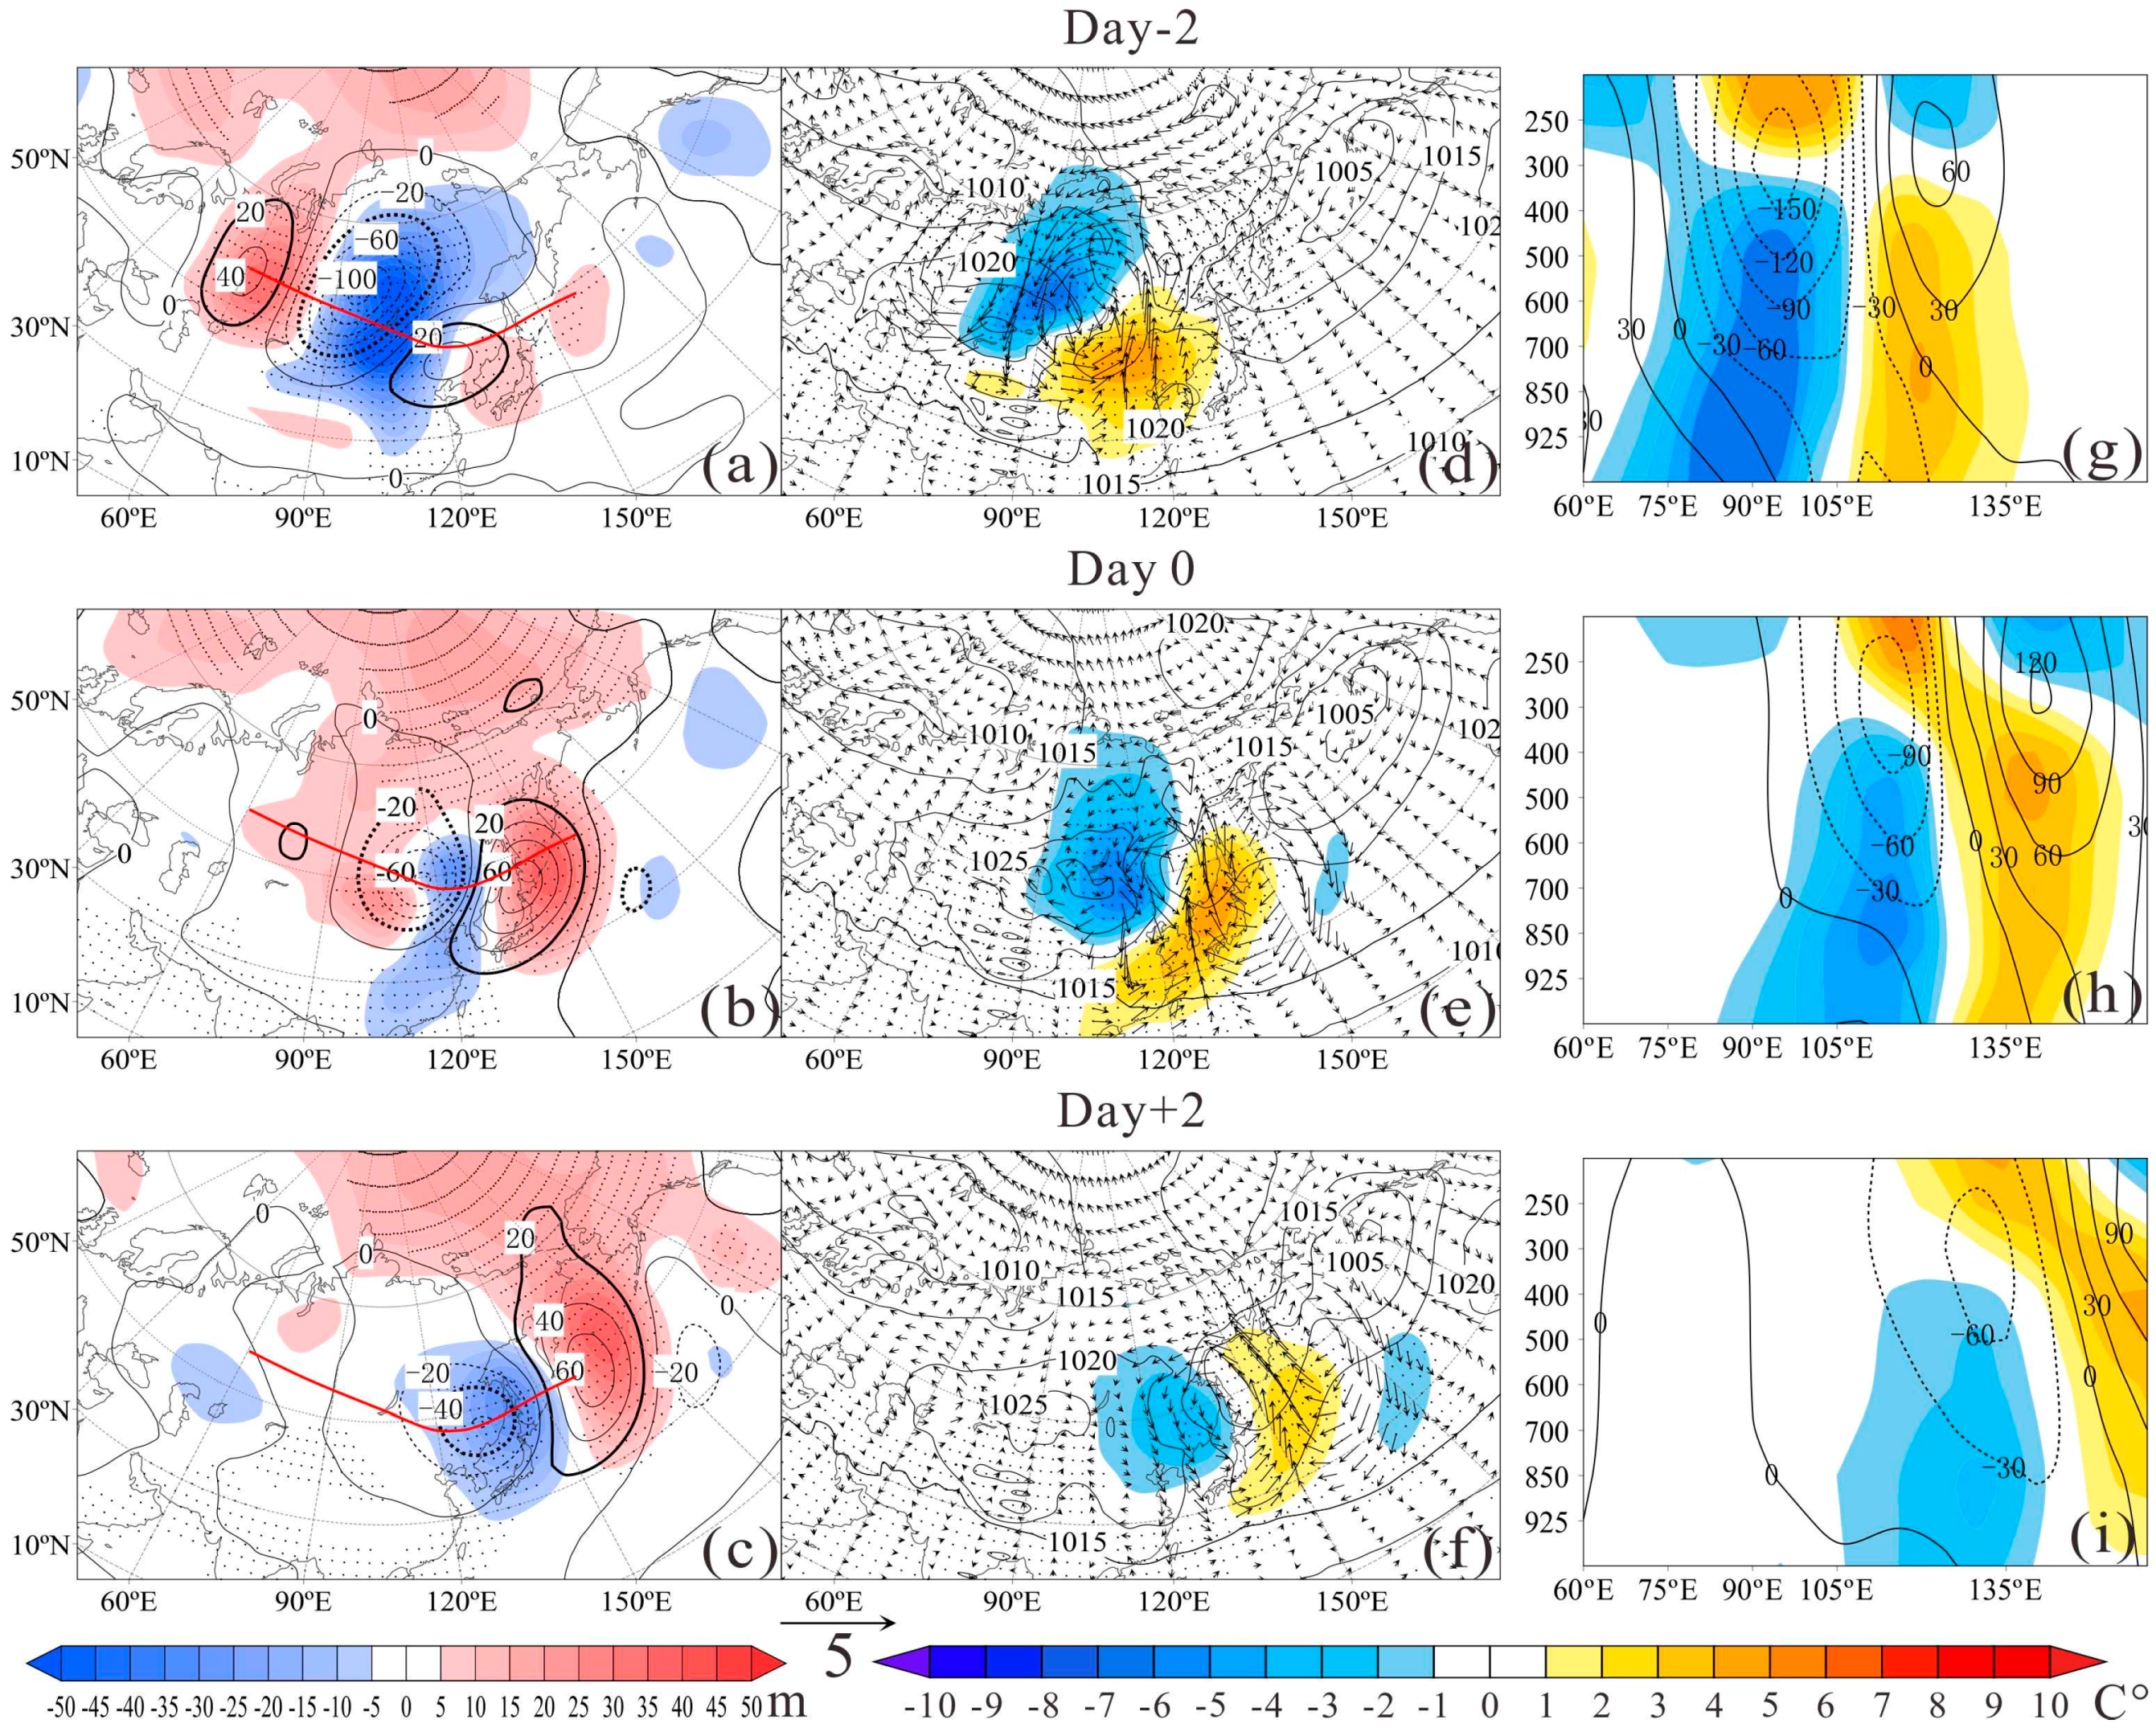
Figure 5.
Same as Figure 4, but for 118 cold events of north tracks.
Figure 5.
Same as Figure 4, but for 118 cold events of north tracks.
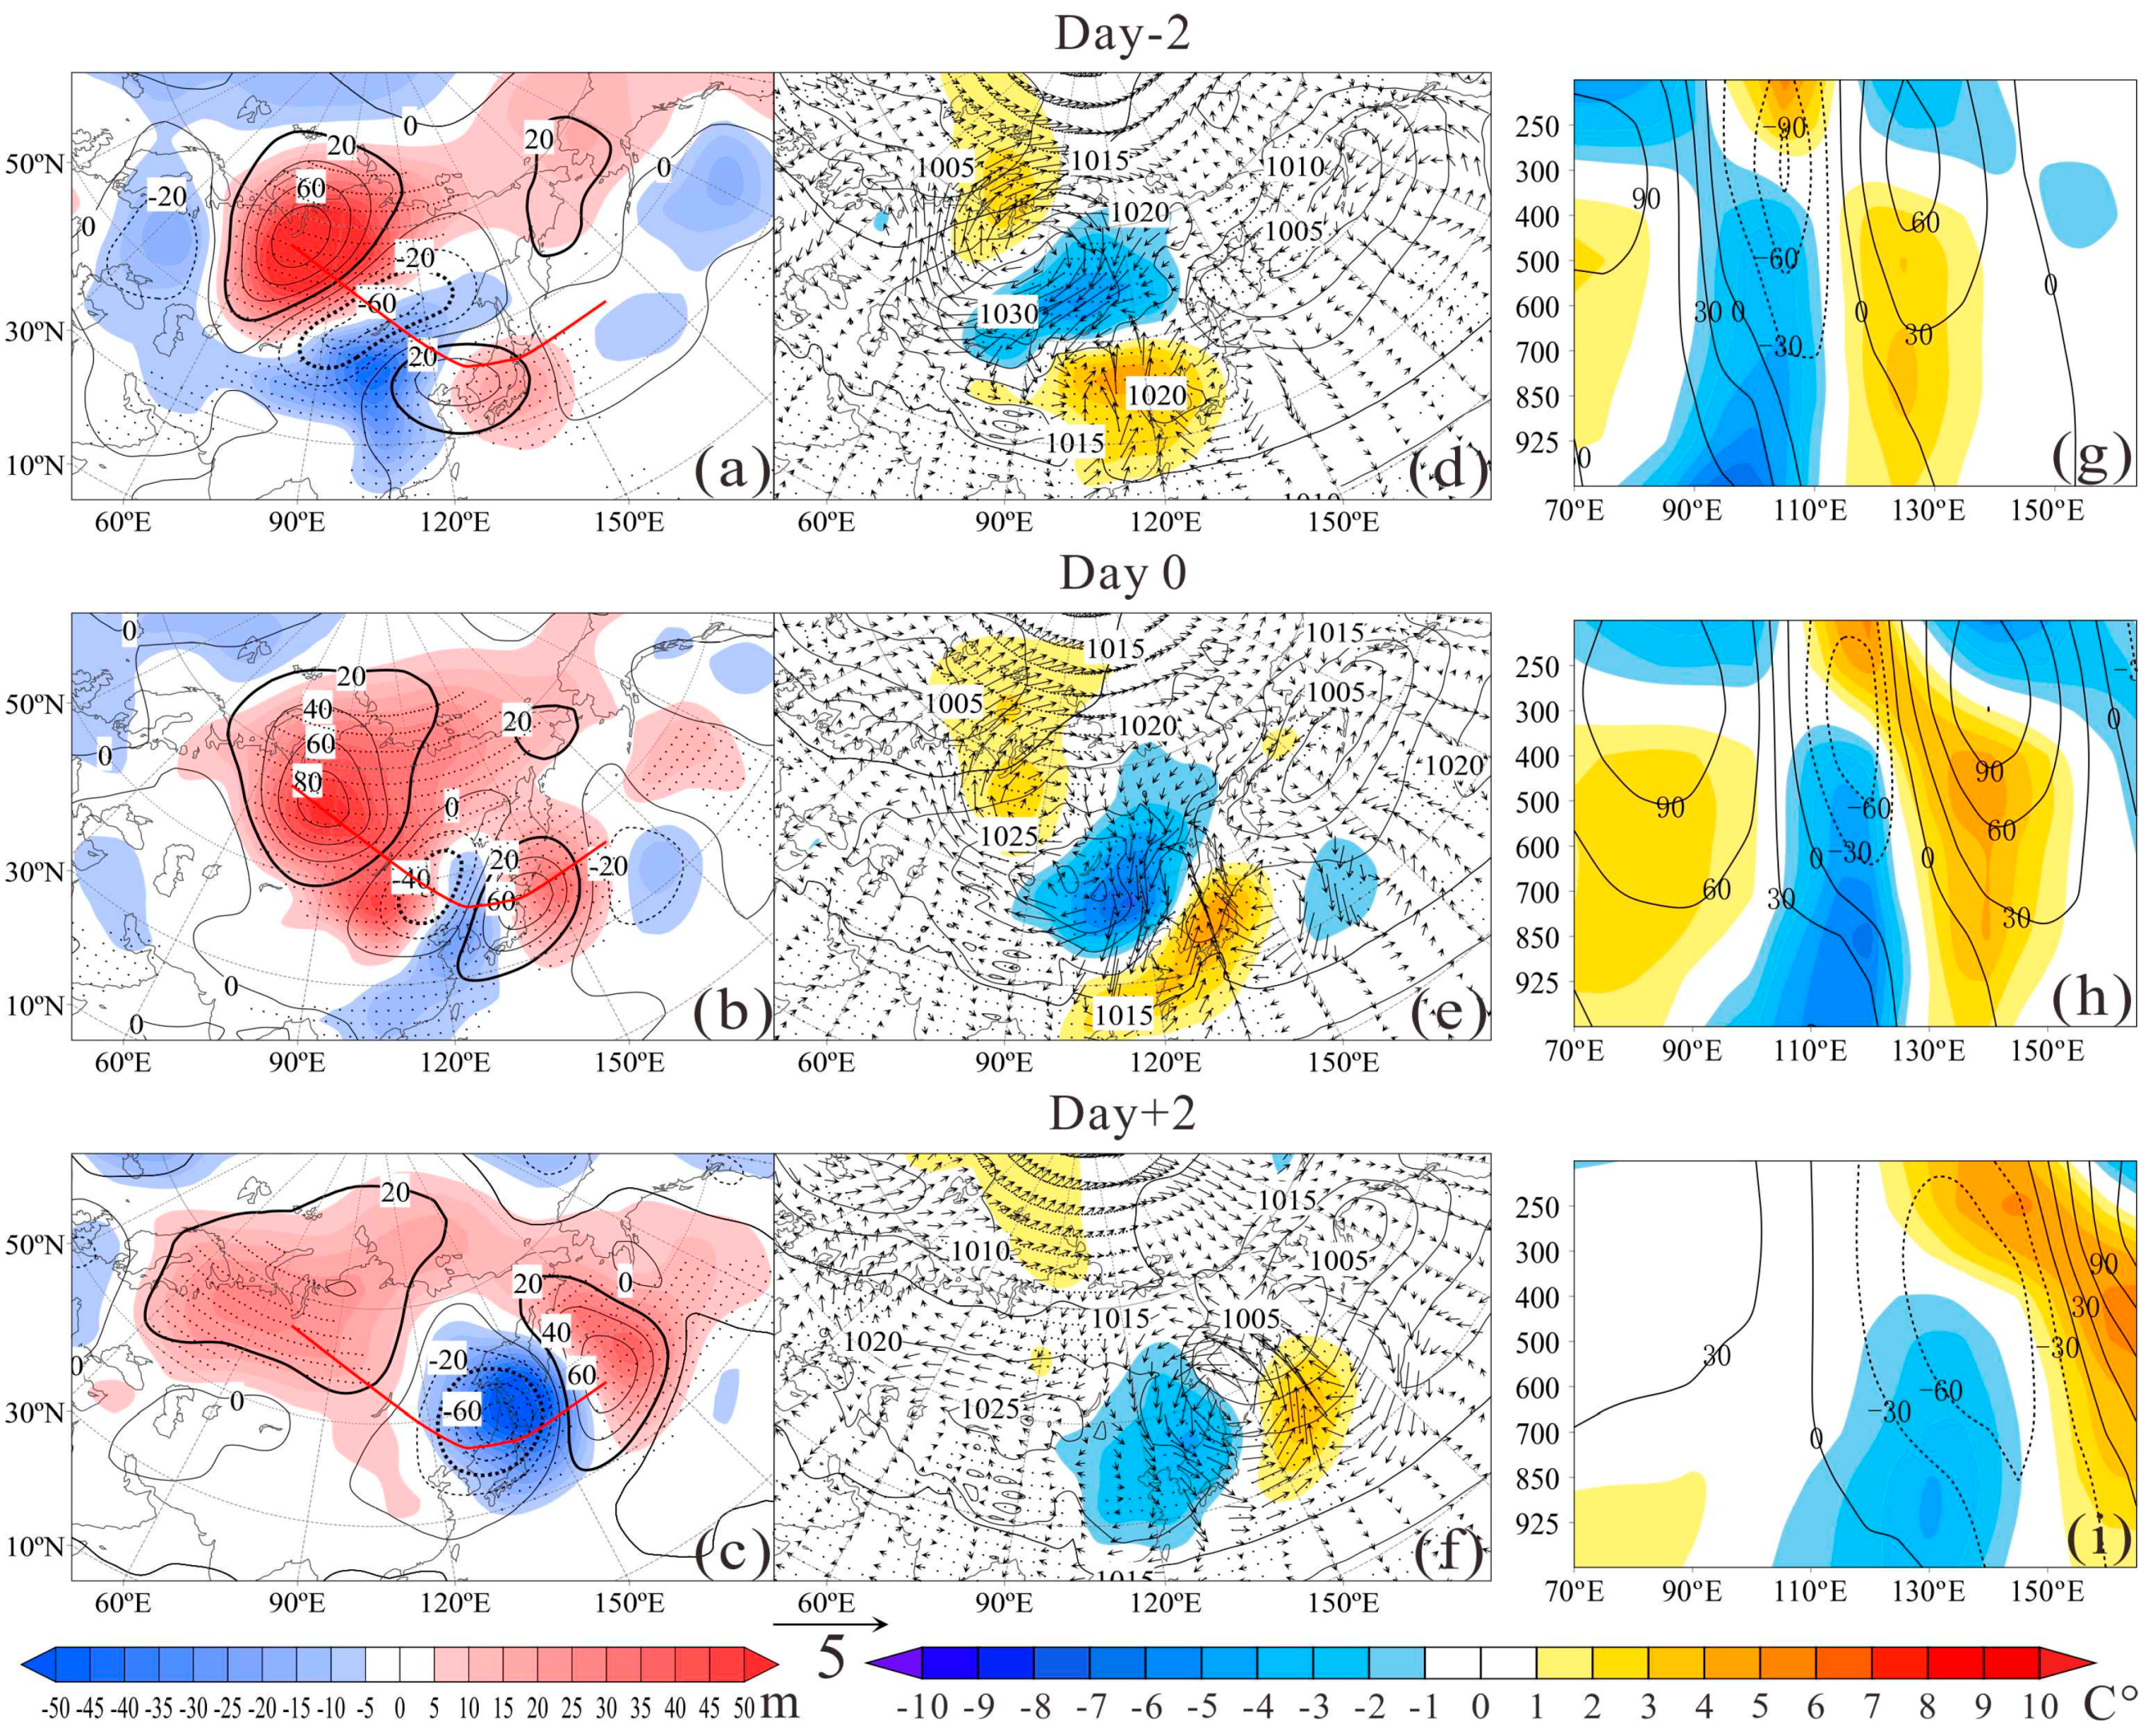
Figure 6.
Same as Figure 4, but for 32 cold events of west tracks.
Figure 6.
Same as Figure 4, but for 32 cold events of west tracks.

Figure 7.
Composite Arctic Oscillation (AO) index of the 10 days before and after outbreaks.
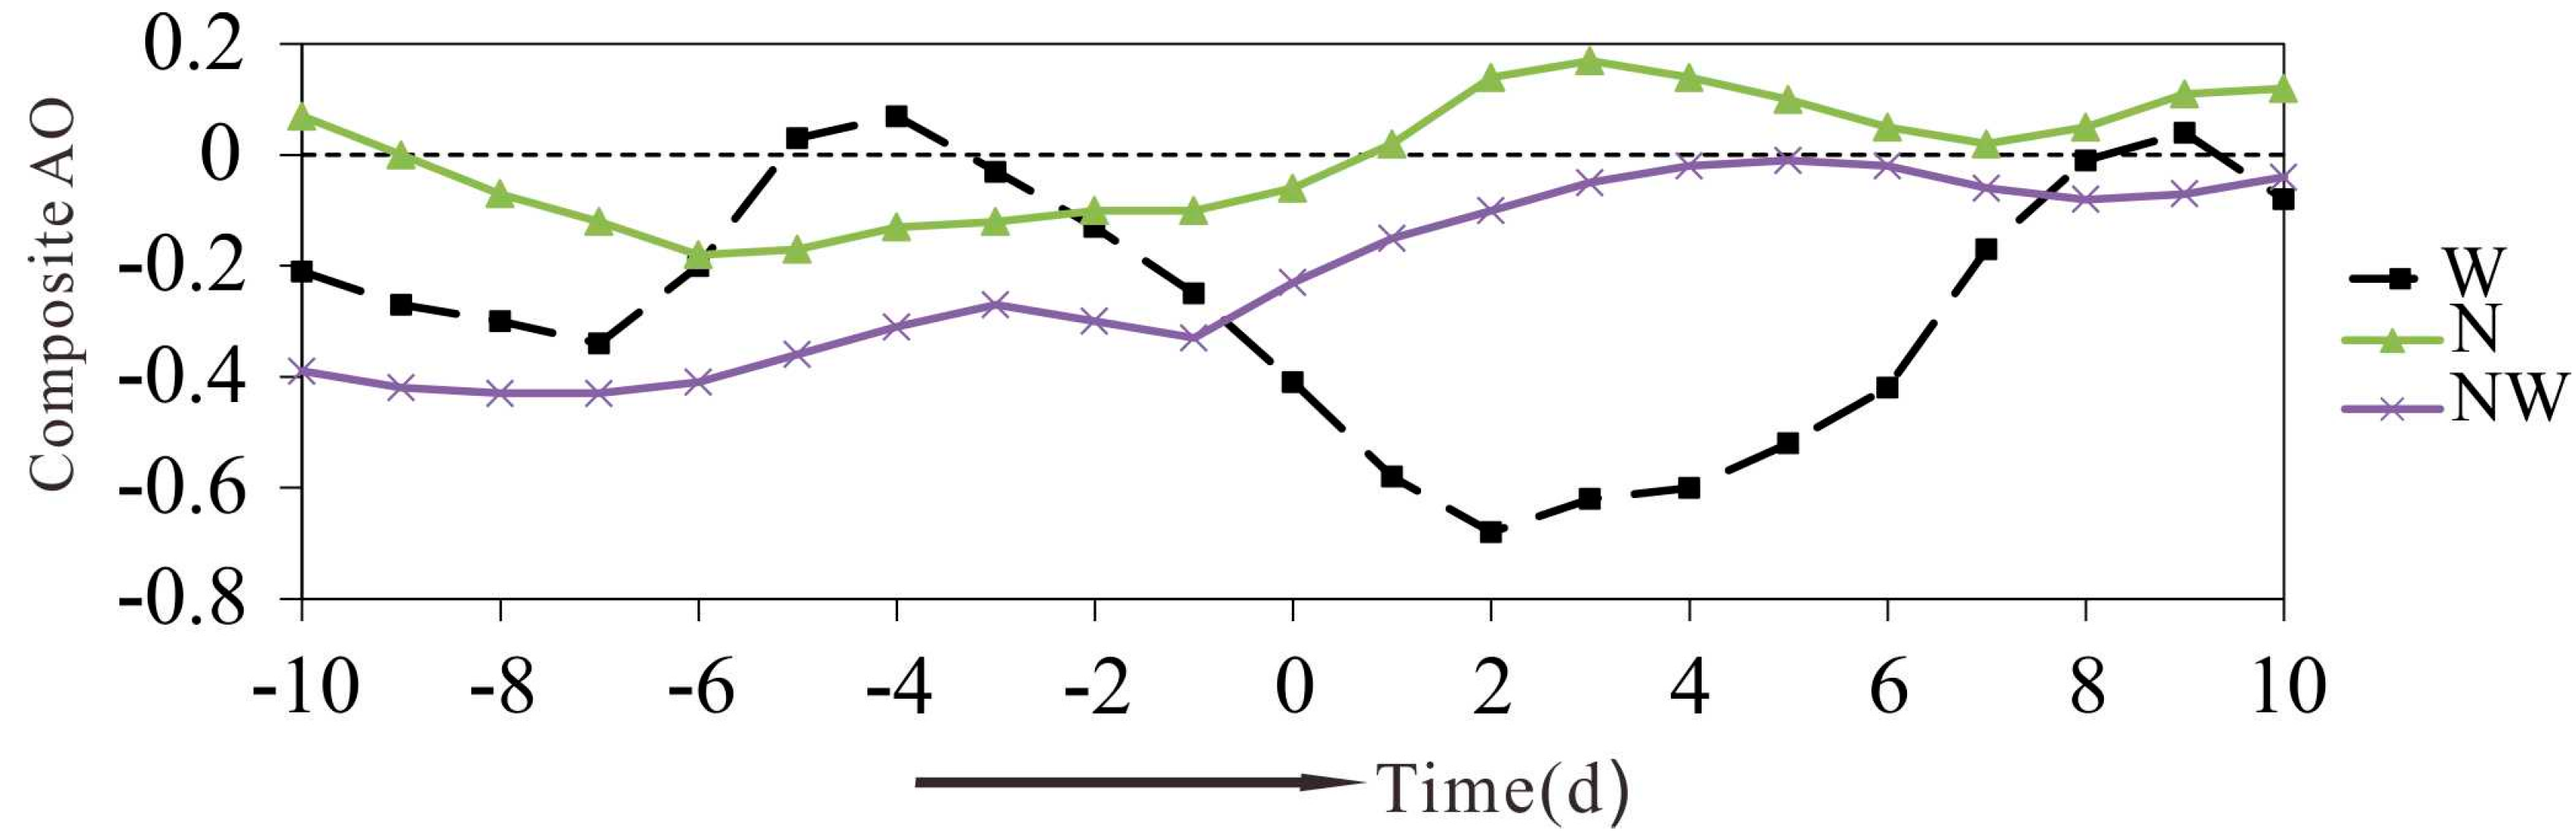
Figure 8.
Temperature-fall period caused by the three categories of strong cold air outbreaks (CAOs) (a–c), temperature anomaly (d–f), and lasting days (g–i). (a,d,g) are northwest tracks; (b,e,h) are north tracks; and (c,f,i) are west tracks.
Figure 8.
Temperature-fall period caused by the three categories of strong cold air outbreaks (CAOs) (a–c), temperature anomaly (d–f), and lasting days (g–i). (a,d,g) are northwest tracks; (b,e,h) are north tracks; and (c,f,i) are west tracks.
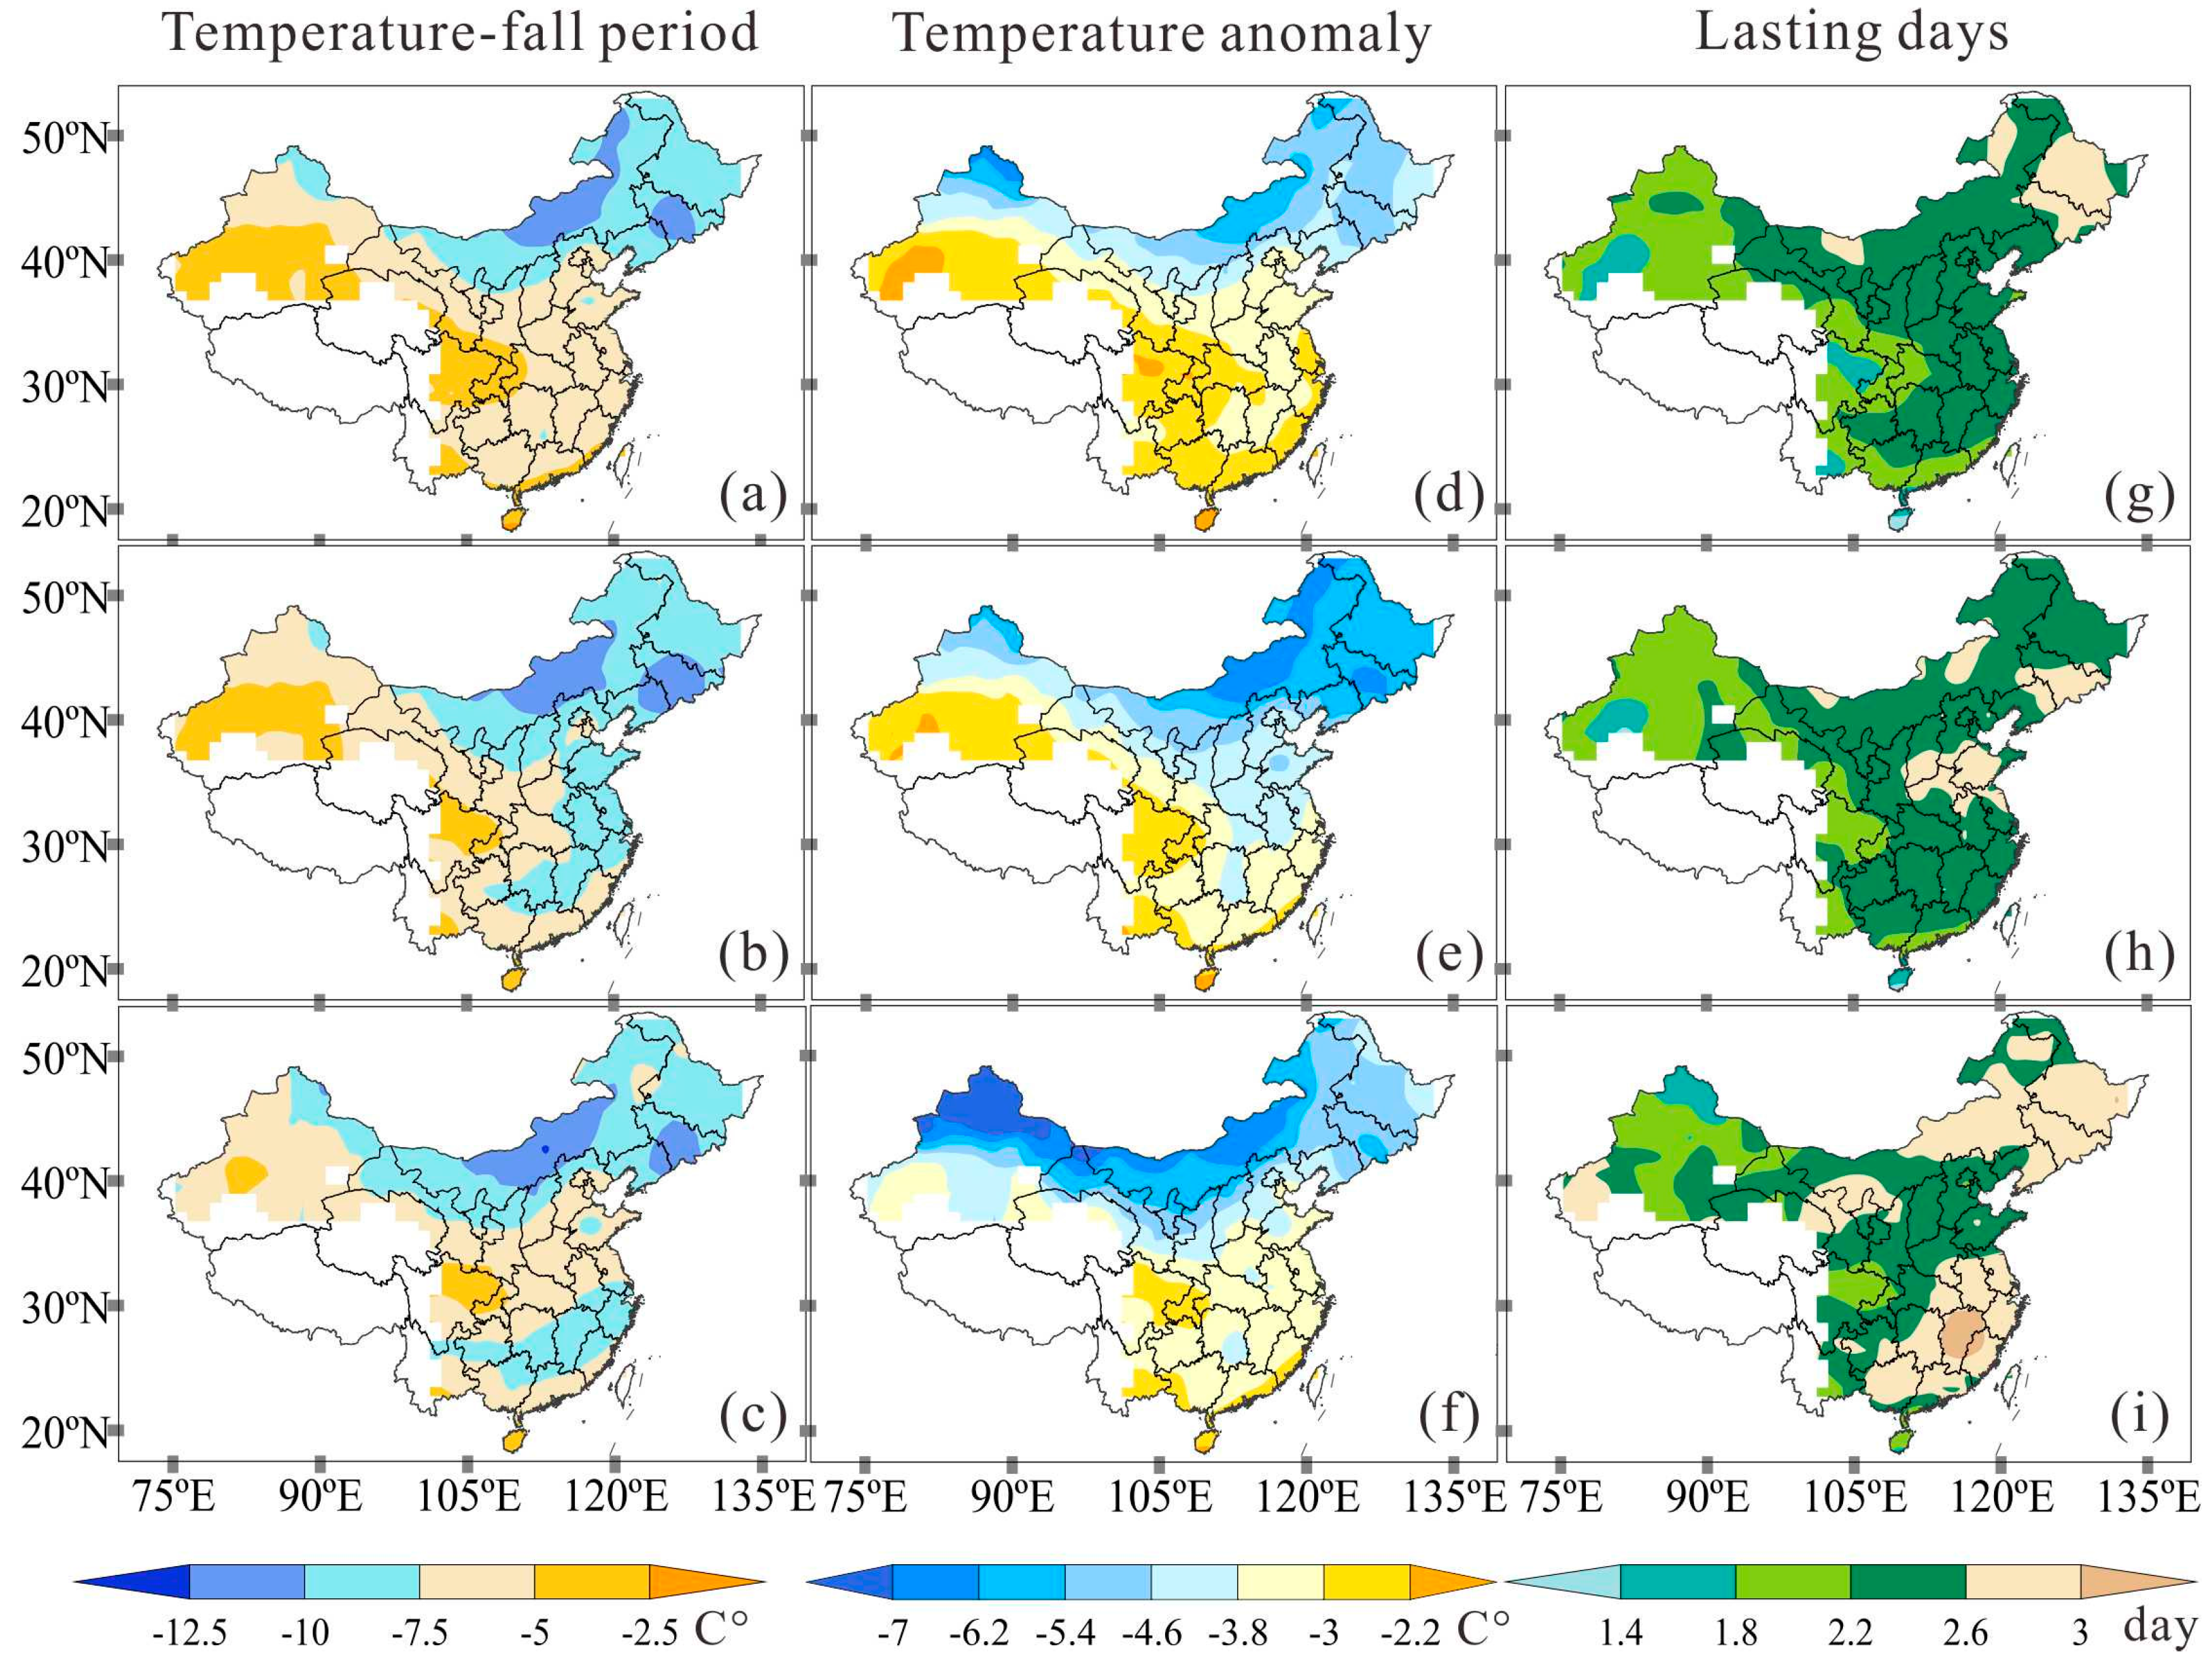
Figure 9.
Time evolution of each item three days before and after outbreaks on 850 hPa. (a–d) are northwest tracks; (e–h) are north tracks; and (i–l) are west tracks. Panels are arranged on the basis of each region’s geographic position (Figure 1).
Figure 9.
Time evolution of each item three days before and after outbreaks on 850 hPa. (a–d) are northwest tracks; (e–h) are north tracks; and (i–l) are west tracks. Panels are arranged on the basis of each region’s geographic position (Figure 1).


Table 1.
Time of origin to outbreak location, potential temperature (PT) when leaving the polar circle, and air pressure.
Table 1.
Time of origin to outbreak location, potential temperature (PT) when leaving the polar circle, and air pressure.
| Standard Division | Time/h | PT/°C | P/hPa | ||||||
|---|---|---|---|---|---|---|---|---|---|
| NW | N | W | NW | N | W | NW | N | W | |
| min | 32 | 51 | 64 | −68.61 | −48.23 | −55.49 | 379 | 506 | 422 |
| q1 | 91 | 116 | 121 | −27.87 | −29.41 | −31.17 | 734 | 763 | 654 |
| median | 128 | 159 | 165 | −19.55 | −23.08 | −21.34 | 832 | 838 | 748 |
| q3 | 193 | 197 | 207 | −11.48 | −16.12 | −15.63 | 900 | 897 | 839 |
| max | 296 | 258 | 324 | 7.87 | −0.09 | −1.49 | 1005 | 979 | 970 |
Notes: From min to max, the min and the max respectively represent the minimum and the maximum values for each parameter whilst q1 represents the numerical value of the 25%’ile, q3 represents the numerical value of the 75%’ile, and the median depicts the middle-positioned value.
© 2017 by the authors. Licensee MDPI, Basel, Switzerland. This article is an open access article distributed under the terms and conditions of the Creative Commons Attribution (CC BY) license (http://creativecommons.org/licenses/by/4.0/).
Share and Cite
MDPI and ACS Style
Wang, Z.; Sun, Z.; Zeng, G. Characteristics of Strong Cold Air Outbreaks in China’s Central and Eastern Mongolian Region between 1970 and 2013. Atmosphere 2017, 8, 98. https://doi.org/10.3390/atmos8060098
AMA Style
Wang Z, Sun Z, Zeng G. Characteristics of Strong Cold Air Outbreaks in China’s Central and Eastern Mongolian Region between 1970 and 2013. Atmosphere. 2017; 8(6):98. https://doi.org/10.3390/atmos8060098
Chicago/Turabian StyleWang, Zongming, Zhaobo Sun, and Gang Zeng. 2017. "Characteristics of Strong Cold Air Outbreaks in China’s Central and Eastern Mongolian Region between 1970 and 2013" Atmosphere 8, no. 6: 98. https://doi.org/10.3390/atmos8060098
Note that from the first issue of 2016, this journal uses article numbers instead of page numbers. See further details here.