Passive Sampling and Analysis of Naphthalene in Internal Combustion Engine Exhaust with Retracted SPME Device and GC-MS


1
Department of Agricultural and Biosystems Engineering, Iowa State University, Ames, IA 50011, USA
2
Center of Physical Chemical Methods of Research and Analysis, Faculty of Chemistry and Chemical Technology, al-Farabi Kazakh National University, Almaty 050012, Kazakhstan
*
Author to whom correspondence should be addressed.
Atmosphere 2017, 8(7), 130; https://doi.org/10.3390/atmos8070130
Submission received: 11 June 2017
/
Revised: 18 July 2017
/
Accepted: 20 July 2017
/
Published: 22 July 2017
(This article belongs to the Section Air Quality)
Abstract
:Exhaust gases from internal combustion engines are the main source of urban air pollution. Quantification of Polycyclic aromatic hydrocarbons (PAHs) in the exhaust gases is needed for emissions monitoring, enforcement, development, and testing of control technologies. The objective was to develop quantification of gaseous naphthalene in diesel engine exhaust based on diffusion-controlled extraction onto a retracted solid-phase microextraction (SPME) fiber coating and analysis on gas chromatography-mass spectrometry (GC-MS). Extraction of naphthalene with retracted fibers followed Fick’s law of diffusion. Extracted mass of naphthalene was proportional to Cg, t, Dg, T and inversely proportional to Z. Method detection limit (p = 0.95) was 11.5 ppb (0.06 mg·m−3) at t = 9 h, Z = 10 mm and T = 40 °C, respectively. It was found that the % mass extracted of naphthalene by SPME needle assembly depended on the type of fiber. Storage time at different temperatures did not affect analyte losses extracted by polydimethylsiloxane (PDMS) 100 µm fiber. The developed method was tested on exhaust gases from idling pickup truck and tractor, and compared side-by-side with a direct injection of sampled exhaust gas method. Time-weighted average (TWA) concentrations of naphthalene in exhaust gases from idling pickup truck and a tractor ranged from 0.08 to 0.3 mg·m−3 (15.3–53.7 ppb).

1. Introduction
1.1. PAHs and Air Pollution
Air pollution causes disruption of ecosystems and creates significant economic and social cost to society. Polycyclic aromatic hydrocarbons (PAHs) are one of the main toxic groups of ambient air pollutants due to their mutagenic and carcinogenic properties. The U.S. Environmental Protection Agency’s (EPA) list of carcinogenicity or genotoxicity includes 16 priority PAHs [1]: naphthalene, acenaphthylene, acenaphthene, fluorene, phenanthrene, anthracene, fluoranthene, pyrene, benz[a]anthracene, chrysene, benzo[b]fluoranthene, benzo[k]fluoranthene, benzo[a]pyrene, dibenz[a,h]anthracene, benzo[g,h,i]perylene, indeno[1,2,3-c,d]pyrene.
1.2. Naphthalene Toxicity
Naphthalene is a PAH with the simplest 2-ring structure, and is often used as a model and target compound studied in this group. Naphthalene is classified as a “possible” human carcinogen [2]. Acute exposure to naphthalene by inhalation, ingestion and dermal contact leads to a headache, nausea, vomiting, diarrhea, malaise, confusion, anemia, jaundice, convulsions, and coma [2,3]. Chronic exposure to naphthalene by inhalation or skin contact caused cataracts and retinal hemorrhage [2,3,4]. Reference Concentration for chronic inhalation exposure (RfC) of naphthalene is 3 × 10⁻³ mg·m−3 (0.57 ppbv) [5,6]. The RfC is defined by U.S. EPA as a chemical concentration of continuous inhalation exposure that is likely not causing any significant risk of detrimental health effects associated with carcinogenic substances.
1.3. Source of PAHs and Fuel Content Regulations
Exhaust gases from internal combustion engines are the main source of urban air pollution [7,8]. Incomplete combustion for residential heating [9,10] and tailpipe vehicle emissions using low-quality fuel [11,12] are the most important reasons of PAHs in fast-growing cities. Also, the PAH content in the fuel (diesel [13] and gasoline [14]) affects the emission of PAHs in the exhaust [13,14]. In Armenia, Kyrgyzstan, Russia and Uzbekistan, the total content of PAHs in diesel fuel is limited by 8% (v/v) [15]. In Europe, the PAHs content of diesel fuel ranged from ~0 to 4.5% wt. in 2003 [16]. For example, in some countries having very stringent regulations (e.g., Sweden), Class 1 diesel fuel has a maximum PAHs limit of 0.02% vol. [17]. In U.S., the concentration of naphthalene reported in service stations in California was 2.6 g·L−1 and 1.6 g·L−1 in gasoline and diesel fuel, respectively [11]. Cold engine startups increase the amounts of pollutants in exhaust emissions [18,19,20]. According to EPA Federal Test Procedure (FTP-75) test, 50 to 80% of the total amount of measured compound are emitted during the cold start phase of the transient driving cycle (0–505 s) of the car (gasoline light-duty exhaust emissions) [19]. Besides the aromatics, the sulfur content has a direct influence on the emissions of PAHs and/or particulate matter (PM) [19]. The composition of exhaust gases depends on the type and make of engine, the age of the vehicle, and emission control (catalyst) besides the type of fuel. Thus, there is a need to assess emissions from single vehicles. Quantification of PAHs in the exhaust gases is needed for emissions monitoring, enforcement, development, and testing of control technologies.
1.4. Methods for PAHs Quantification
Quantification of PAHs is a complex, time-consuming, and costly process considering their hydrophobicity, low water solubility, and propensity for low recoveries due to their losses during sampling and sample preparation. Many established quantification techniques focus on PAHs recovery from PM, an airborne carrier for sorbed PAHs. They have disadvantages such as a multistep sampling and sample preparation process requiring specialized equipment (pumps and gas sampling calibration), use of toxic solvents, and significant analytical skills.
Gas-phase PAHs sampling and sample preparation is typically completed by trapping on a different type of sorbents and filters (polyurethane foam (PUF) [21,22], XADs [23], Teflon [24] and Carbopack C [25]) by subsequent extraction with organic solvent. As an alternative to using organic solvent-based methods, thermal desorption or solid phase microextraction (SPME) are widely used.
SPME was applied in conjunction with sampling of gas-phase PAHs on sorbents such as XAD-2 [26]. PAHs were collected from the indoor air on XAD-2 sorbent and were mixed with 10 mL extraction solution (ethylene glycol mol·L−1 NaCl, 7:3) in a 25 mL flask with the ground-glass joint. Then, microwave-assisted thermal desorption (MAD) coupled to headspace SPME (exposed mode) was applied [26]. Another SPME-based method involves capturing of 16 U.S. EPA priority PAHs (adsorbed on diesel particulate matters) on glass microfiber filters, following thermal extraction of analytes by using the thermogravimetric analyzer to Tedlar bags and determination of concentration by SPME in a conventional exposed fiber coating mode [27]. Also, exposed SPME fibers were used for determination of PAHs directly in exhaust pipes [28,29].
Passive sampling offers an alternative for gas-phase PAHs while addressing many deficiencies for conventional methods. Many methods for long-term monitoring of exposure to environmental pollutants use passive sampling to estimate TWA concentration. The time-weighted averaging (TWA) approach to sampling could be a useful way to “even out” these variations during sampling from vehicle exhaust gases, i.e., a source that is inherently variable [30]. Passive sampling is based on the diffusion of the analyte, either into a large sorbent bed (e.g., passive badges) or onto the retracted SPME fiber. The relatively large size of typical passive badges (10 to 40 mm I.D.) limits their applicability for vehicle tailpipe emissions. The small size of SPME needle (0.64 mm O.D.) is suitable for insertion in narrow conduits with minimal practical considerations.
1.5. SPME for Sampling of Vehicle Exhaust Gases
Until now, SPME was used for sampling and quantitative analysis of PAHs in water [31], soil [32,33,34,35] and in ambient air [28]. There are few studies using SPME for sampling PAHs in exhaust gases [27,28,29]. In previous studies [27,28,29], SPME fibers were used in a conventional exposed mode (i.e., SPME fiber is sampling outside of the needle housing). Pancenti et al. (2014) reported testing eight different vehicles for exhaust emission sampling: four diesel cars, a gasoline car, heavy-duty diesel truck and two motorcycles directly in the exhaust pipe for 150 s using 7 µm polydimethylsiloxane (PDMS) coating [28]. Gaseous PAHs were responsible for 73–96% of the total 26 PAHs mass in gasoline engine samples [28]. Ballesteros et al. (2009) developed a method of determination of 16 EPA PAHs concentrations in the exhaust gas of 4-cylinder, 4-stroke, turbocharged, inter-cooled, 2.2 L diesel engine involving capture of diesel PM on glass microfiber filters, followed by thermal desorption of analytes in diesel PM from filters into Tedlar bags, and then using 100 µm PDMS for extraction from Tedlar bags [27]. It was found that emissions of the naphthalene were higher than those other light PAHs [27].
Koziel et al. (2001) collected diesel exhaust samples from a truck using exposed 7 µm PDMS SPME fiber for 1 to 16 min [29]. It was established that PAHs with lower molecular weights (naphthalene, acenaphthylene, acenaphthene, fluorene, phenanthrene, anthracene, fluoranthene, and pyrene) were likely to be in the gas phase and adsorbed on SPME fiber. PAHs with higher molecular weights (chrysene, benzo[a]pyrene and indenopyrene) were likely to be in the solid phase and stuck on metallic parts of SPME fiber. It was suggested that solid particles were “glued” to PDMS coating [29]. The follow-up paper by Odziemkowski et al. (2001) showed the “glued” immobilized single particles from diesel exhaust could be analyzed using Raman spectroscopy [36].
Sampling with exposed SPME fiber in fast flowing gas with PM and soot could be problematic due to the possibility of mechanical damage, overloading with PM, and an inherent variability associated with analyte partitioning between PM and gas phases. In our previous research, Woolcock et al. [37,38], Baimatova et al. [30], and Koziel et al. [29] addressed these concerns by proposing to use retracted SPME sampling for benzene, toluene, ethylbenzene and o-xylene (BTEX) in hot gas streams from syngas plant, vehicle exhaust, and phenolics, mercaptans and a heterocyclic amine in potentially infectious process reactor air. Baimatova et al. [30] and Koziel et al. [39] showed that the adsorption to metallic surfaces of SPME assembly is significant, reproducible, yet can be controlled and accounted for. Adsorption to metallic SPME assemblies is likely more of a concern for PAHs but was not assessed before.
SPME technology is relatively simple, time-saving, and solventless. Sampling, extraction, concentration and the introduction of the sample are reduced into one-step. This decreases cost, reduces need for highly-skilled analysts and equipment requirements, and can increase the sensitivity of the analysis. These advantages of SPME, i.e., acceptable analytical performance at low cost, can be attractive for scientists and engineers studying air pollution at low budgets. Thus, the selection of SPME as an alternative approach can provide simpler and more efficient determination of TWA naphthalene in exhaust gases of internal combustion engines.
1.6. Objectives
The objective of this study was to develop the method for quantification of naphthalene TWA concentrations in exhaust gases by passive sampling with retracted SPME and analysis on gas chromatography–mass spectrometry (GC-MS). The effects of (1) variability of SPME fibers quality, (2) losses during sample storage time, (3) sampling time, (4) concentrations, (5) fiber retraction depth, and the (6) interfering contribution of extraction by metallic parts of SPME needle assembly itself were studied. Finally, the new method was tested on exhaust gases from idling pickup truck and a tractor and compared side-by-side with a direct injection of sampled exhaust gas method. The working hypotheses were that (a) the contribution of adsorption by metallic SPME assembly parts is reproducible yet significant for naphthalene, a semi-volatile PAH with multiple aromatic rings, and greater than those observed [30] for the mono-aromatic group BTEX group and that (b) naphthalene can be quantified in vehicle exhaust gas using the retracted fiber TWA-SPME approach when the contribution to extraction via SPME metallic parts is accounted.
This work builds on the development TWA method for determination BTEX in exhaust gases [30] and hot syngas process gas [37,38] with retracted SPME fibers for lower molecular weight compounds. It was shown that the TWA model based on Ficks’ law works reasonably well for BTEX when the contribution of extraction by metallic parts of the SPME assembly is accounted for [30]. This contribution is reproducible and dependent on the type of compound [30]. Thus, it is critically important to assess that contribution for other key air pollutants with larger molecular weight and more complex structure and properties so that the TWA-SPME approach has a wider applicability.
2. Theory
2.1. Passive TWA Naphthalene Gas Sampling with Retracted SPME Fiber
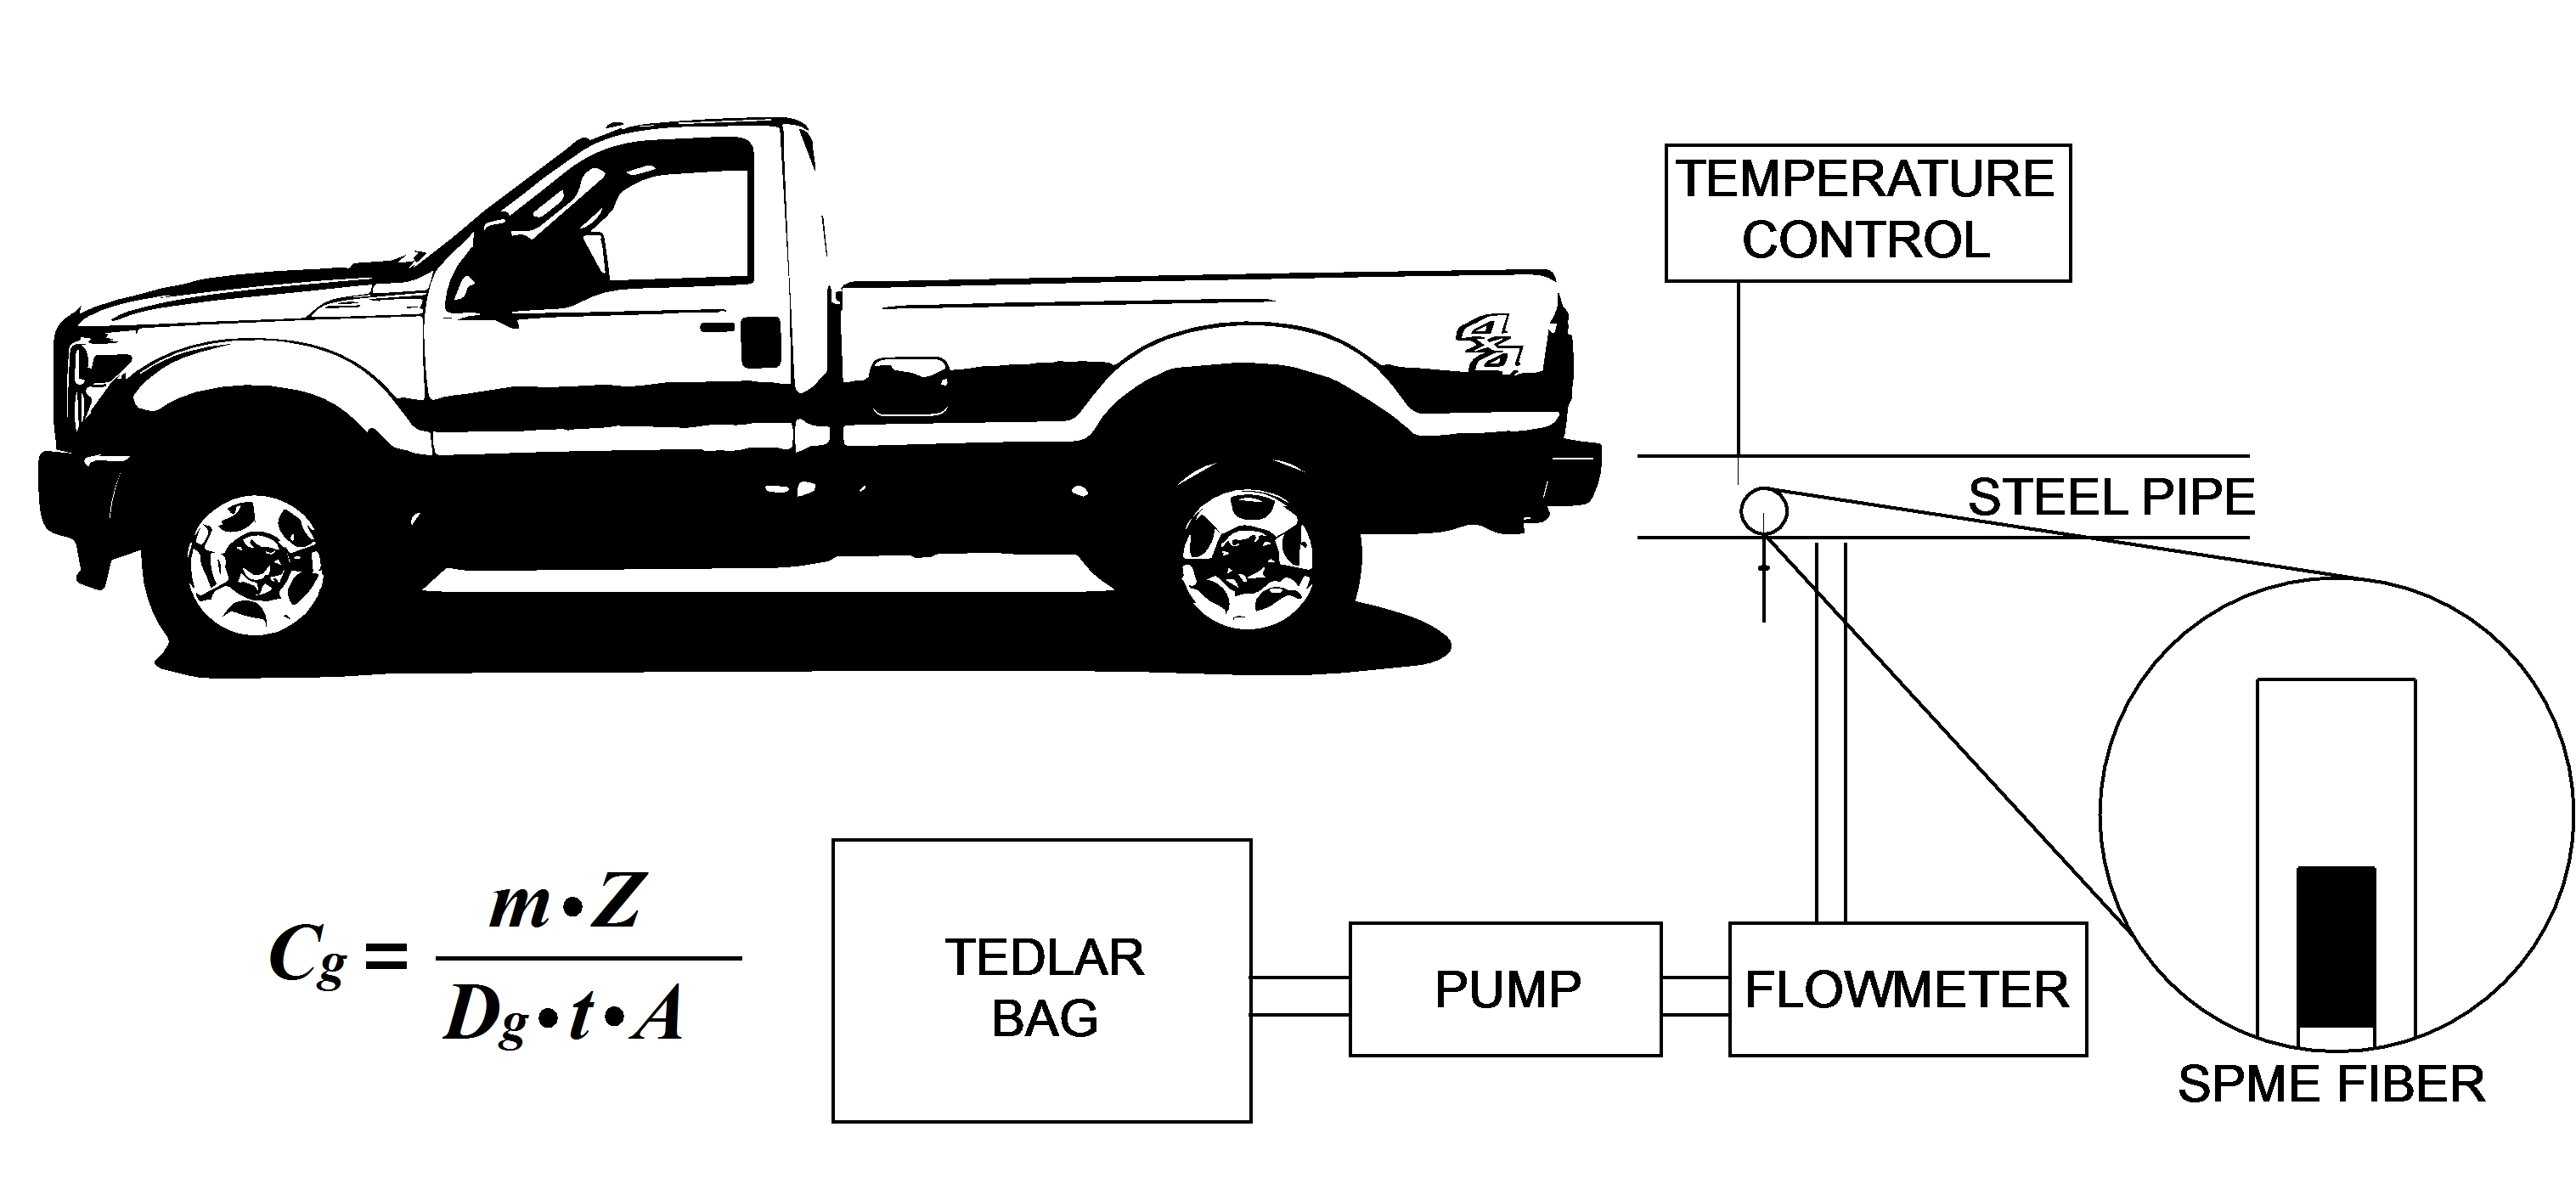
Gas-phase naphthalene TWA sampling with retracted SPME fibers is controlled by diffusion from the SPME needle opening to the retracted SPME fiber. TWA concentration (Cg) of naphthalene in air flow was estimated by Fick’s Law. SPME gas sampling rate with retracted SPME fiber was controlled by gas-phase molecular diffusion coefficient for naphthalene (Dg) and retraction depth (Z).
where:
- m = naphthalene mass extracted by fiber coating (mg);
- Z = SPME fiber retraction depth (diffusion path length) (cm);
- Dg = gas-phase naphthalene diffusion coefficient (cm2·s−1);
- t = extraction (sampling) time (s);
- A = cross-sectional area of SPME needle opening (cm2).
2.2. Contribution of Adsorption by Metallic Parts of SPME Needle Assembly
The contribution of mass extracted on fiber needle metallic surfaces to the whole extraction process needs to be considered. It is recommended that simultaneous extractions with retracted “broken” fibers (i.e., SPME stainless steel assembly without coating) and SPME fibers with all extraction parameters kept identical are made. Then, the contribution of extraction by metallic surfaces can be subtracted from mass extracted by the SPME fiber [30]. Baimatova et al. [30] showed that the “broken” fiber acted like a reliable “sampling device” (i.e., extractions with low variability among replicates for BTEX), thus, making it possible to quantify this effect.
3. Experiments
3.1. Chemicals
Naphthalene (99.7% purity) was purchased from Sigma-Aldrich (St. Louis, MO, USA). Methanol (HPLC grade) was obtained from AppliChem (Darmstadt, Germany). Ultra-high purity helium (99.99% purity) was obtained from Air Gas (Des Moines, IA, USA).
3.2. SPME Conditions
All extractions were completed using a manual SPME holder with 100 μm (PDMS), 85 μm polyacrylate (PA) and 65 µm PDMS/divinylbenzene (DVB) (Supelco, Bellefonte, PA, USA), fibers. The manual holder was modified for sampling with retracted SPME fiber, according to Koziel and Pawliszyn [40]. Additional notches were milled into the holder Z-slot to retract fiber inside the needle for precisely 5, 10, 15, 20, 25 and 30 mm.
3.3. GC-MS Conditions
The analyte was desorbed from the SPME fiber and analyzed on 6890N/5975C (Agilent, Santa Clara, CA, USA) GC-MS equipped with split/splitless inlet. For separation of naphthalene, a 30 m × 0.53 mm BP-20 (SGE Analytical Science, Ringwood, VIC, Australia) column with film thickness 0.50 µm was used. The constant flow of He in the column was 7.5 mL·min−1. The column flow rate was higher than typical because of a permanent 1:4 split at the end of the GC column to an olfactometry port (not used for this research). The ion source, quadrupole and MS interface temperatures were 230, 150 and 240 °C, respectively. The GC injection port was working in splitless mode at 240 °C; purge activation time was 1 min. Oven temperature was programmed from initial 70 °C (held for 0.5 min) to 240 °C at the heating rate of 20 °C·min−1. Retention time for naphthalene was 5.80 min. Detection was carried out in a SIM mode at m·z−1 127 and 128 for selective detection and quantification of naphthalene. Total GC run time was 14 min.
3.4. MS Detector Calibration with Naphthalene Standard Solution
Naphthalene purity was confirmed by its direct injection to GC-MS. A methanolic solution of 5.5 mg of crystal naphthalene was completely dissolved in 5.0 mL of solvent. The concentration of the analyte in the prepared solution made up 1.10 mg·mL−1. On the second dilution, a 10 µL of the first solution was diluted with 990 µL of MeOH to the concentration of 10.0 ng·mL−1 and diluted again to concentrations of 10, 30, 50, 100, 300, 500, 1000 and 3000 pg·µL−1, respectively. All prepared standards were analyzed in triplicates. Resulting chromatographic peaks were integrated and identified using previously established retention times of single analytes. Detector response was plotted using MSD ChemStation software and MS Excel software. Obtained detector calibrations were linear in the whole studied concentration range with coefficients of determination R2 > 0.999 (Figure S1), and relative standard deviations (RSDs) ranged from 3 to 6%.
Detector response factors (RFs) (i.e., slopes of calibrations) for target analytes were used to estimate experimental mass extracted onto SPME using experimental RFs for naphthalene peak area (PA) counts.
3.5. Method Detection Limits (MDLs)
MDLs were calculated using following formula:
where:
- t = the student’s value at 95% confidence level and SD estimate with n − 1 degrees of freedom;
- SD = the standard deviation of 10 replicates;
- MDL for p = 0.95 was then estimated at 11.5 ppb or 0.06 mg·m−3.
3.6. Standard Gas Generation System
Standard gases were used for calibrations of MS detector and extractions with retracted SPME fibers. The standard gas generation system was modified and constructed based on a design described elsewhere [30]. Standard gas generation system was built to continuously deliver gas to simulate dynamic conditions (flowing gas) and temperatures near tailpipe end of a typical engine exhaust. Dynamic gas generation minimized potential problems with target compound losses due to sorption/desorption onto surfaces [41,42], i.e., an especially crucial aspect of research with PAHs. Theoretical (desired) naphthalene concentration for a compound “i” to be generated in the system was calculated similarly as shown in [30].
3.7. Variability Associated with the Same SPME Fiber Type and Fiber Coating Type
Observations from preliminary experiments suggested that fiber types had an apparent effect on precision. Thus, the goal of this experiment was to study variability between SPME fiber coatings of the same type using three of PDMS, three of PA, and three of DVB randomly selected fibers. The concentration of naphthalene in the standard gas system was set to Cg = 2.0 ppm, T = 40 °C, t = 60 min. Two diffusion path lengths were set to Z = 10 mm. The 100 μm PDMS coating was chosen for further work as a result of these experiments.
3.8. Effects of Storage Time and Temperature on Analyte Mass Loss
Analyte losses were studied for a practical application scenario for a sampling of gas exhaust in the field, cold storage and transportation, and time lag between sampling and analysis in the lab. The following parameters were used: 100 μm PDMS (n = 3), Z = 10 mm, Cg = 2.0 ppm, storage temperature = 23 °C and 0 °C. Storage time = 0 (immediate injection), 15, 30, 45 and 60 min, respectively.
3.9. Effects of t, Cg, Z and Adsorption by Metallic SPME Assembly: Verification of Fick’s Law Model for TWA-SPME Gas Sampling of Naphthalene
Fick’s Law model for passive sampling with retracted SPME fiber was tested. Effects of several operating parameters for practical gas sampling were tested. These include t, Cg, and Z. For the experiments testing the effect of t, the following parameters were used: t = 30, 60, 180, 540, 1440 and 2880 min, while others were kept constant, i.e., Z = 10 mm, Cg = 2.0 ppm. Set of n = 3100 μm PDMS fibers and a set of “broken” fibers (i.e., for testing of the adsorption on metallic parts) of the 100 μm PDMS type was used. There was no statistical difference between the performance of the SPME fibers or metal assemblies as determined by a t-test. For the experiments testing the effect of retraction depth Z, the following parameters were used: Z = 7, 10 and 20 mm while t = 9 h, T = 40 °C, Cg = 5.9 mg·m−3 (2.0 ppm) were kept constant. For the experiments testing the effect of concentration, i.e., calibrations of SPME and direct injection method, the following parameters were used: Cg for naphthalene ranged from 0.1 to 12 ppm while other parameters were kept constant: i.e., Z = 10 mm retracted fiber, t = 9 h, T = 40 °C.
Effect of temperature was not tested. It was assumed that the effect of T would be insignificant, similarly to our previous work [30] on TWA-SPME and BTEX. Increasing T slightly increases the Dg while the effect is offset by lower analyte partitioning to SPME coating at higher T [43]. Compounds with lower molecular weight (BTEX) were affected by the effects of T more those with greater molecular weight (naphthalene).
3.10. Verification of TWA-SPME Method for Naphthalene Quantification in Vehicle Exhaust Gas
A sampling of naphthalene in the diesel exhaust gases was carried out in Iowa on a 2005 Ford F-250 XL Super Duty pickup truck with ~139,200 km mileage and a John Deere 5830 forage harvester, ~30 years old. Exhaust gas sampling setup consisted of a 102 mm o.d. and 1 m length galvanized steel pipe with 7 gas sampling ports equipped with Thermogreen septa, three of them for simultaneous TWA SPME sampling with three fibers, two of them for controlling the contribution of metallic surfaces, one for gas collecting gas into Tedlar gas sampling bags, and the last one for measuring temperature of exhaust gases with a digital thermometer. Gas TWA SPME sampling time was set to 8 h and 100 µm PDMS fibers were used. Retraction depth was Z = 10 mm (Figure S1).
Tedlar bags, pumps, and direct injection were used for side-by-side comparisons with retracted SPME approach. Exhaust gases were sampled into 5-L Tedlar bags (Fisher Scientific, Tustin, CA, USA) using air sampling pump (Universal PCXR8, SKC Inc., Pittsburgh, PA, USA) with a set flow rate of 100 mL·min−1. Model M-30 Mini Buck calibrator (A.P. Buck, Inc., Orlando, FL, USA) was used for controlling and confirming the gas sampling flow rate. A 10 µL gastight microsyringe was used for direct injections of sampled gas. One µL of gas from Tedlar bags was injected into GC at the same parameters as described in Section 3.3 for comparison with SPME-based measurements.
4. Results and Discussion
4.1. Variability Associated with the Same SPME Fiber Type and Fiber Coating Type
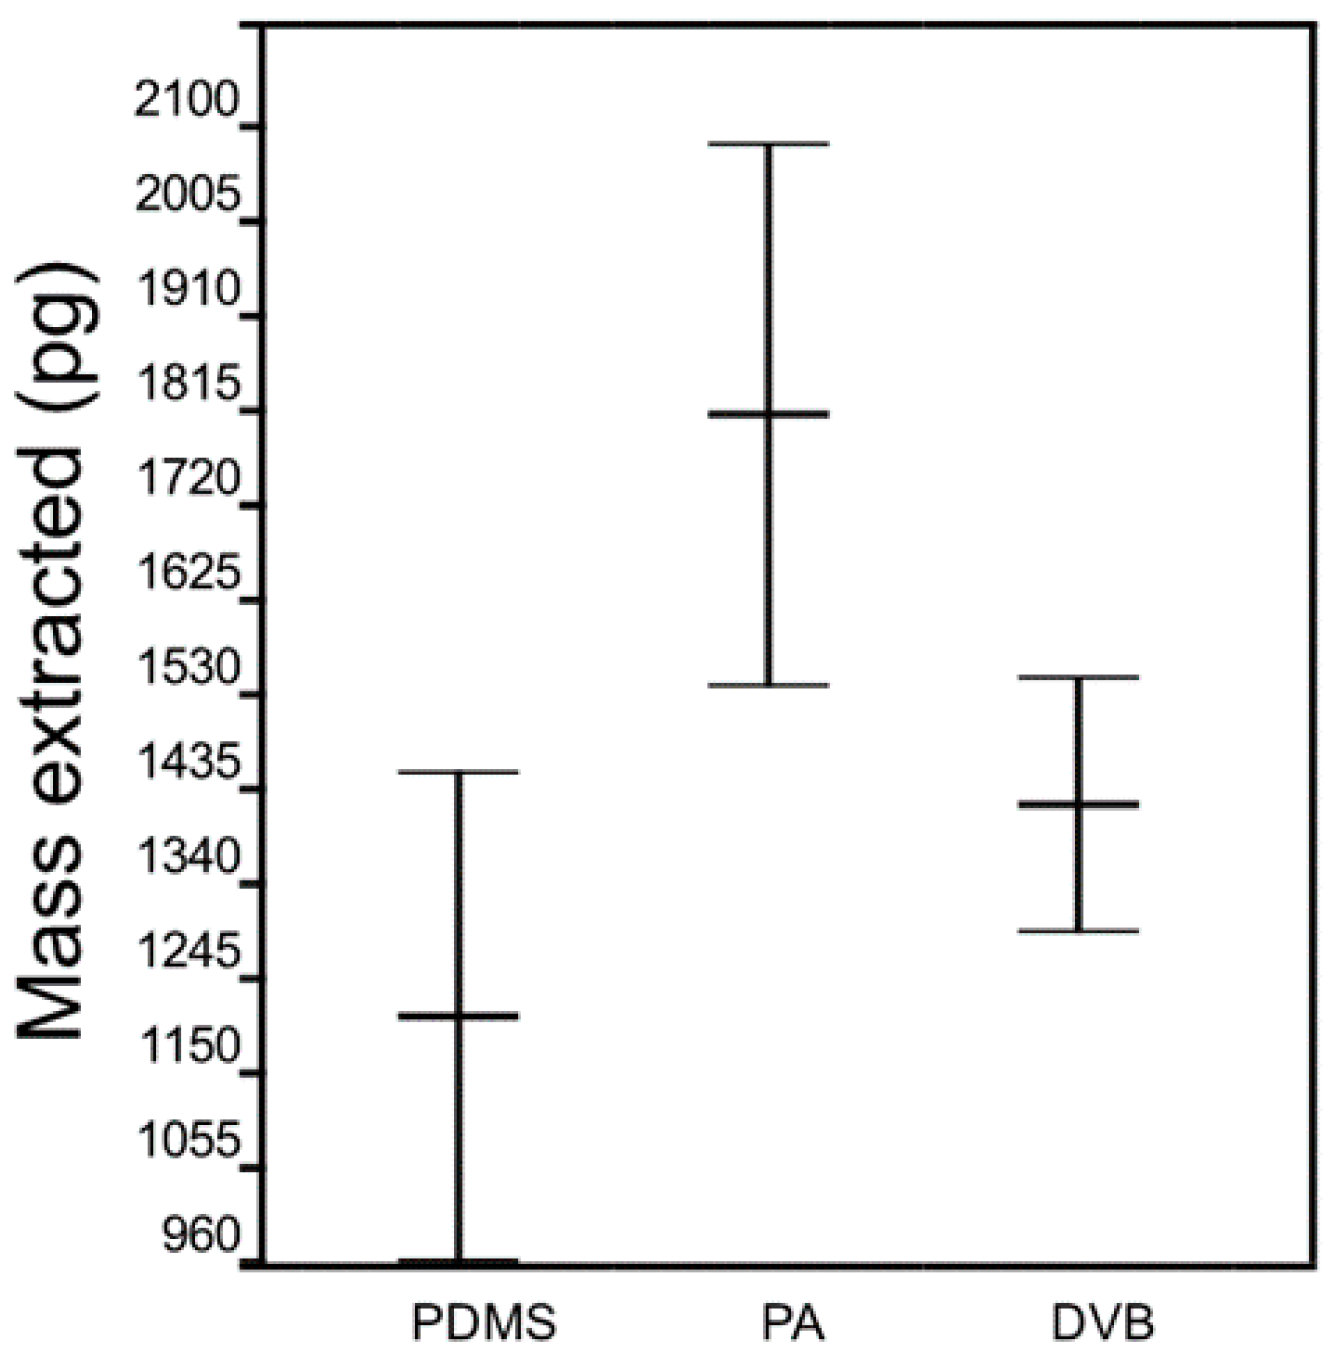
The main goal was to test the effects of SPME fiber type on the mass of naphthalene extracted in retracted mode. Our working hypothesis was that the fiber type does not influence the amount of mass extracted (i.e., it follows Fick’s law of diffusion and SPME coating acts as a zero sink sorbent). Thus, the goal of the experiment was to study differences in naphthalene extraction effectiveness within three randomly selected (n = 3) PDMS, PA, and DVB fiber coatings, respectively. An Analysis of variance (ANOVA) analysis of variance showed that the effect of the same type of PDMS, PA, and DVB fiber coating on extracted mass was significant, F(2,6) = 5.49 (Figure 1) while the critical value F(2,6) is 5.14 at p = 0.05. This result rejected the null hypothesis.
One plausible explanation is that observed differences between extracted mass by the same type of PDMS, PA, and DVB fiber coating can be impacted by the variability of SPME fibers within one type of coating.
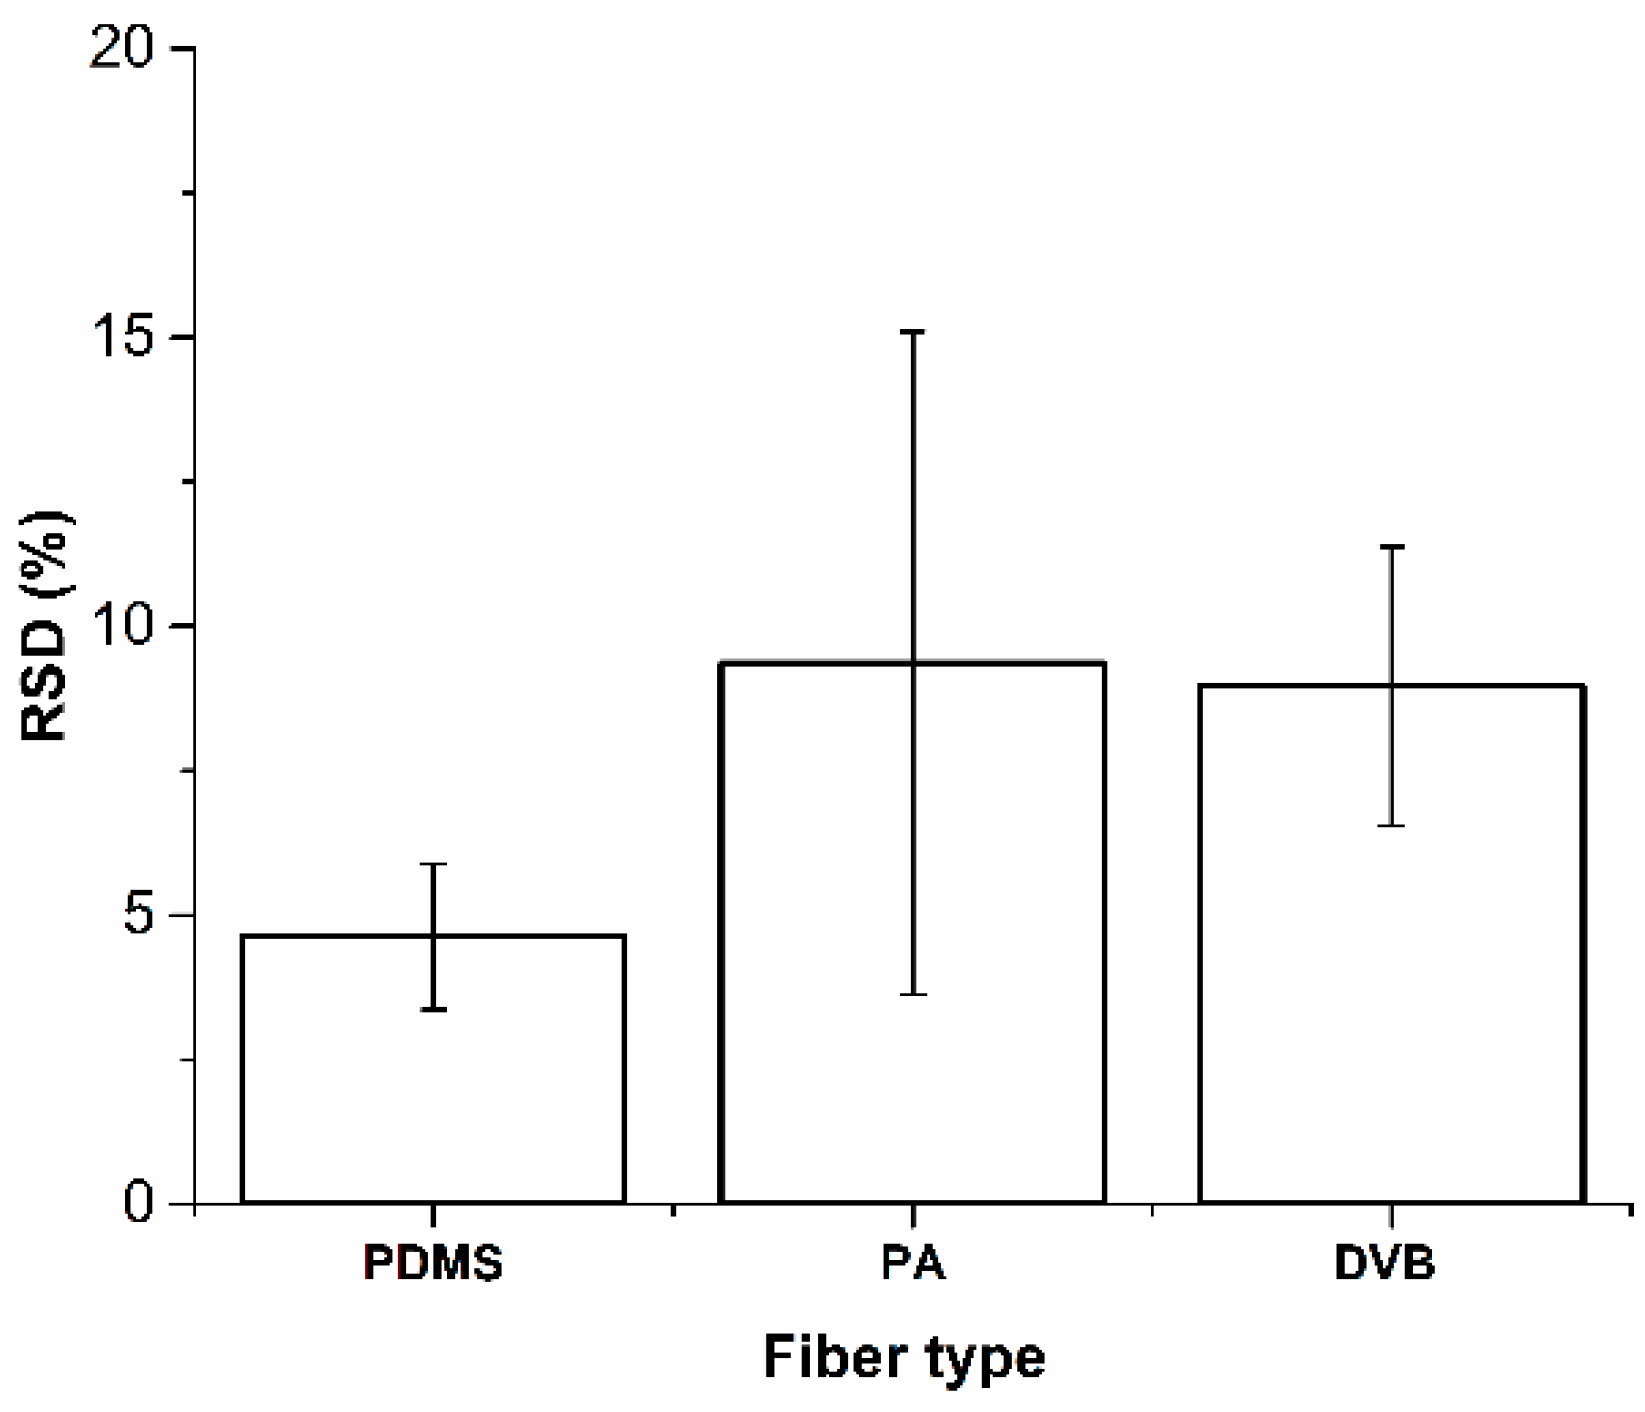
ANOVA showed no effect on mass extracted by randomly selected PA and DVB fiber coating (Figure 2b,c), F(2,6) = 4.93 and F(2,6) = 4.07 for PA and DVB fibers, respectively, the critical value F(2,6) = 5.14 at p = 0.05. Randomly selected PDMS fibers extract significantly different masses of analytes, F(2,6) = 62.4 (Figure 2a), while the critical value F(2,6) = 5.14 at p = 0.05. However, reproducible results with lower RSD (4.6 ± 1.3%) were obtained with PDMS coating (Figure 3). RSDs for PA and DVB fiber coating were 9.4 ± 5.7% and 9.0 ± 2.4%, respectively. The 100 μm PDMS fiber coating was chosen as an optimal fiber for further experiments.
For achieving the highest accuracy by preventing additional errors caused by random differences in SPME fiber efficiency, a separate calibration must be obtained for each particular PDMS fiber for TWA extraction of naphthalene.
4.2. Effects of Storage Time and Temperature on Sample Mass Loss
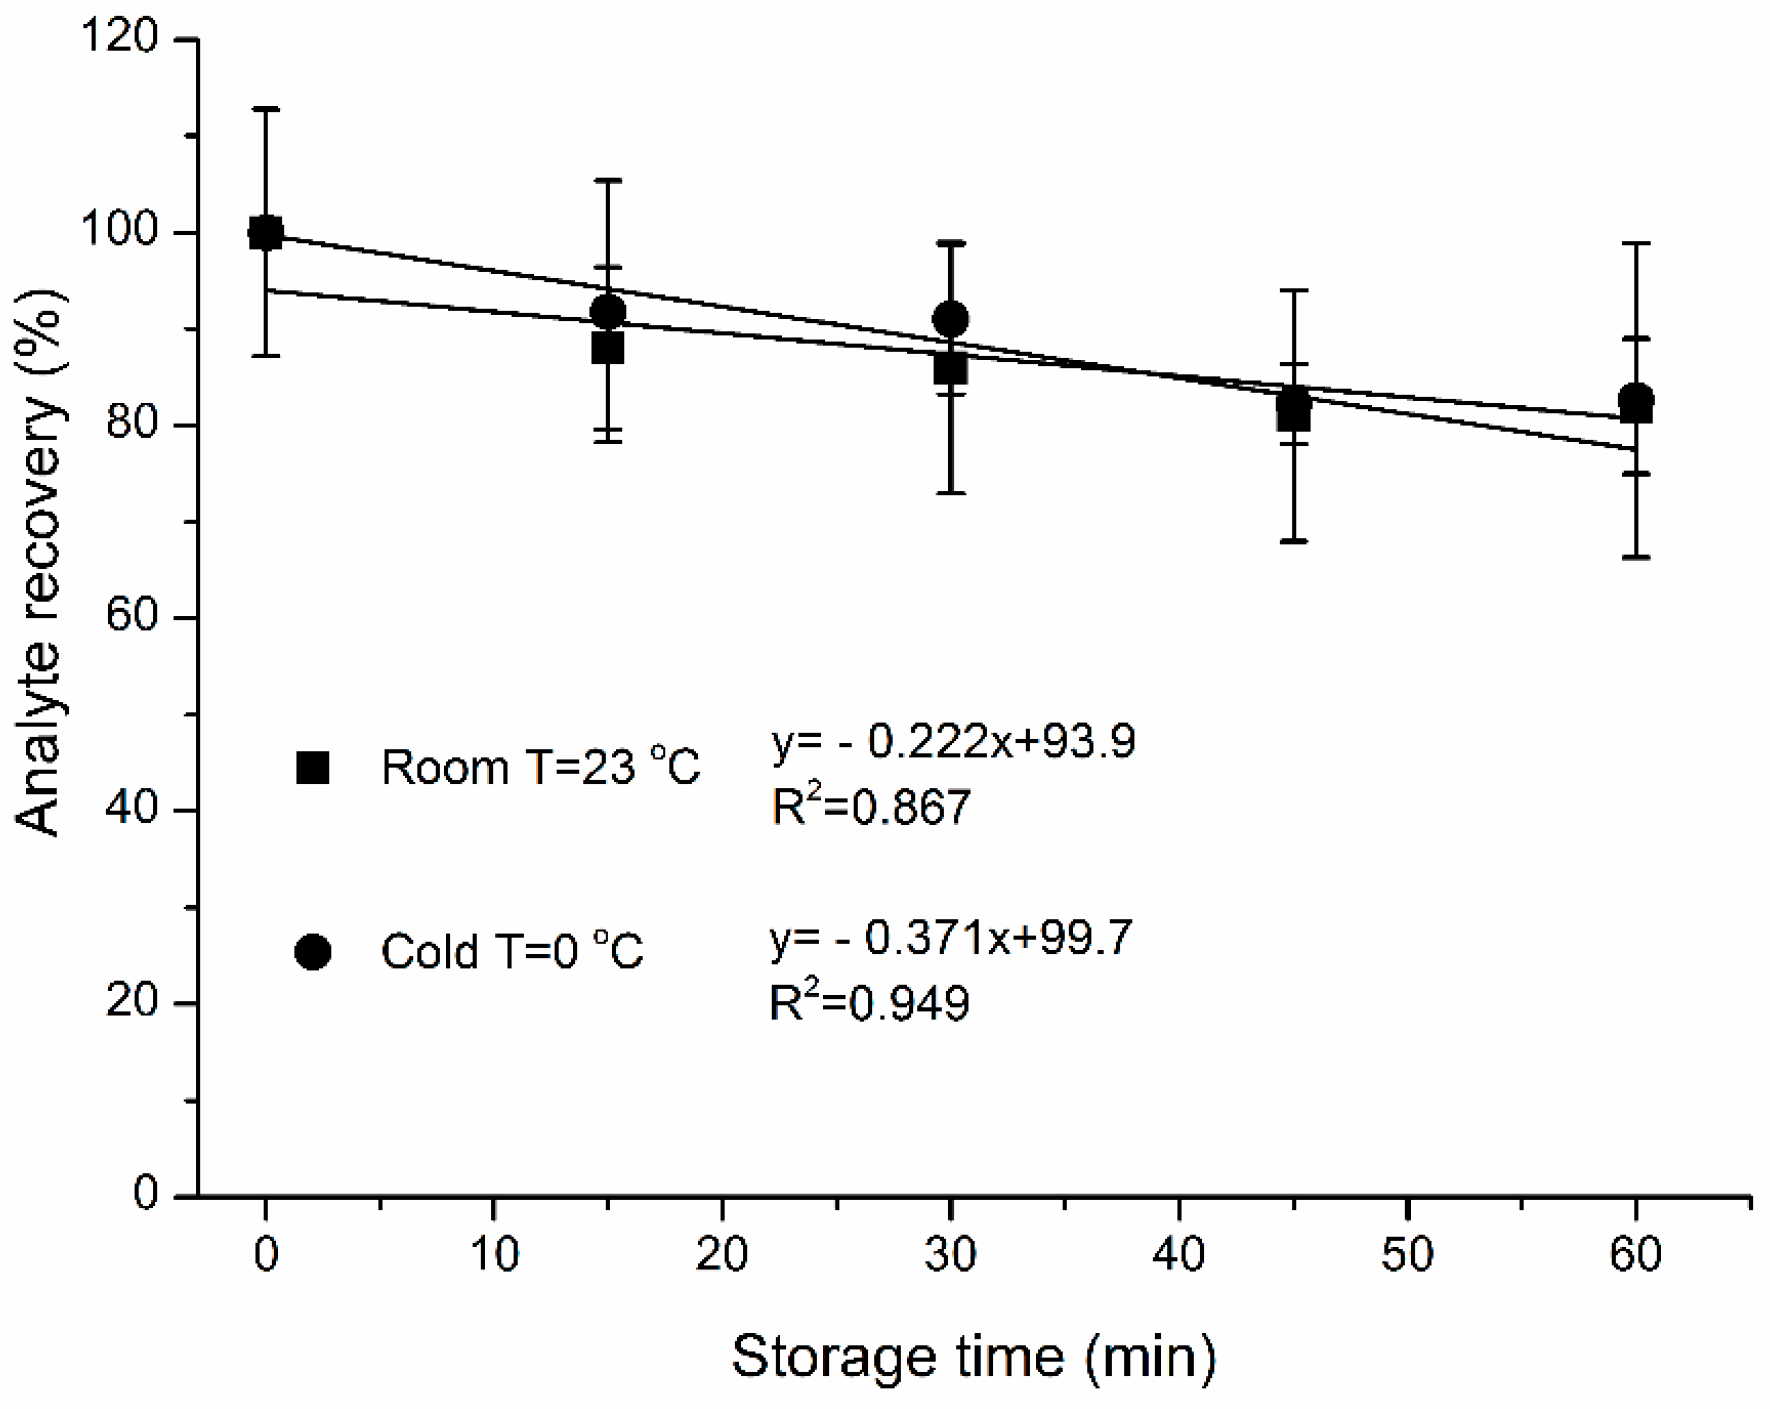
Figure 4 summarizes the effect of storage time and temperature on analyte loss. There were 0.4 ± 0.07%/min and 0.2 ± 0.07%/min sample losses for 0 °C and 23 °C, respectively, within the first hour of storage. Temperature had no significant influence on analyte losses from SPME fiber coating for 0 (p = 0.5), 15 (p = 0.4), 30 (p = 0.3), 45 (p = 0.4) and 60 min (p = 0.5) of storage time, respectively. There was no apparent benefit to refrigerate samples.
4.3. Effect of Sampling Time (t)
RSDs associated with mass extracted for all studied extraction times varied from 4 to 10%. The use of longer extraction time (t ≥ 1440 min) led to the saturation of SPME fiber coating (Figure 5). Thus, the use of longer than t ≥ 1440 min is not recommended.
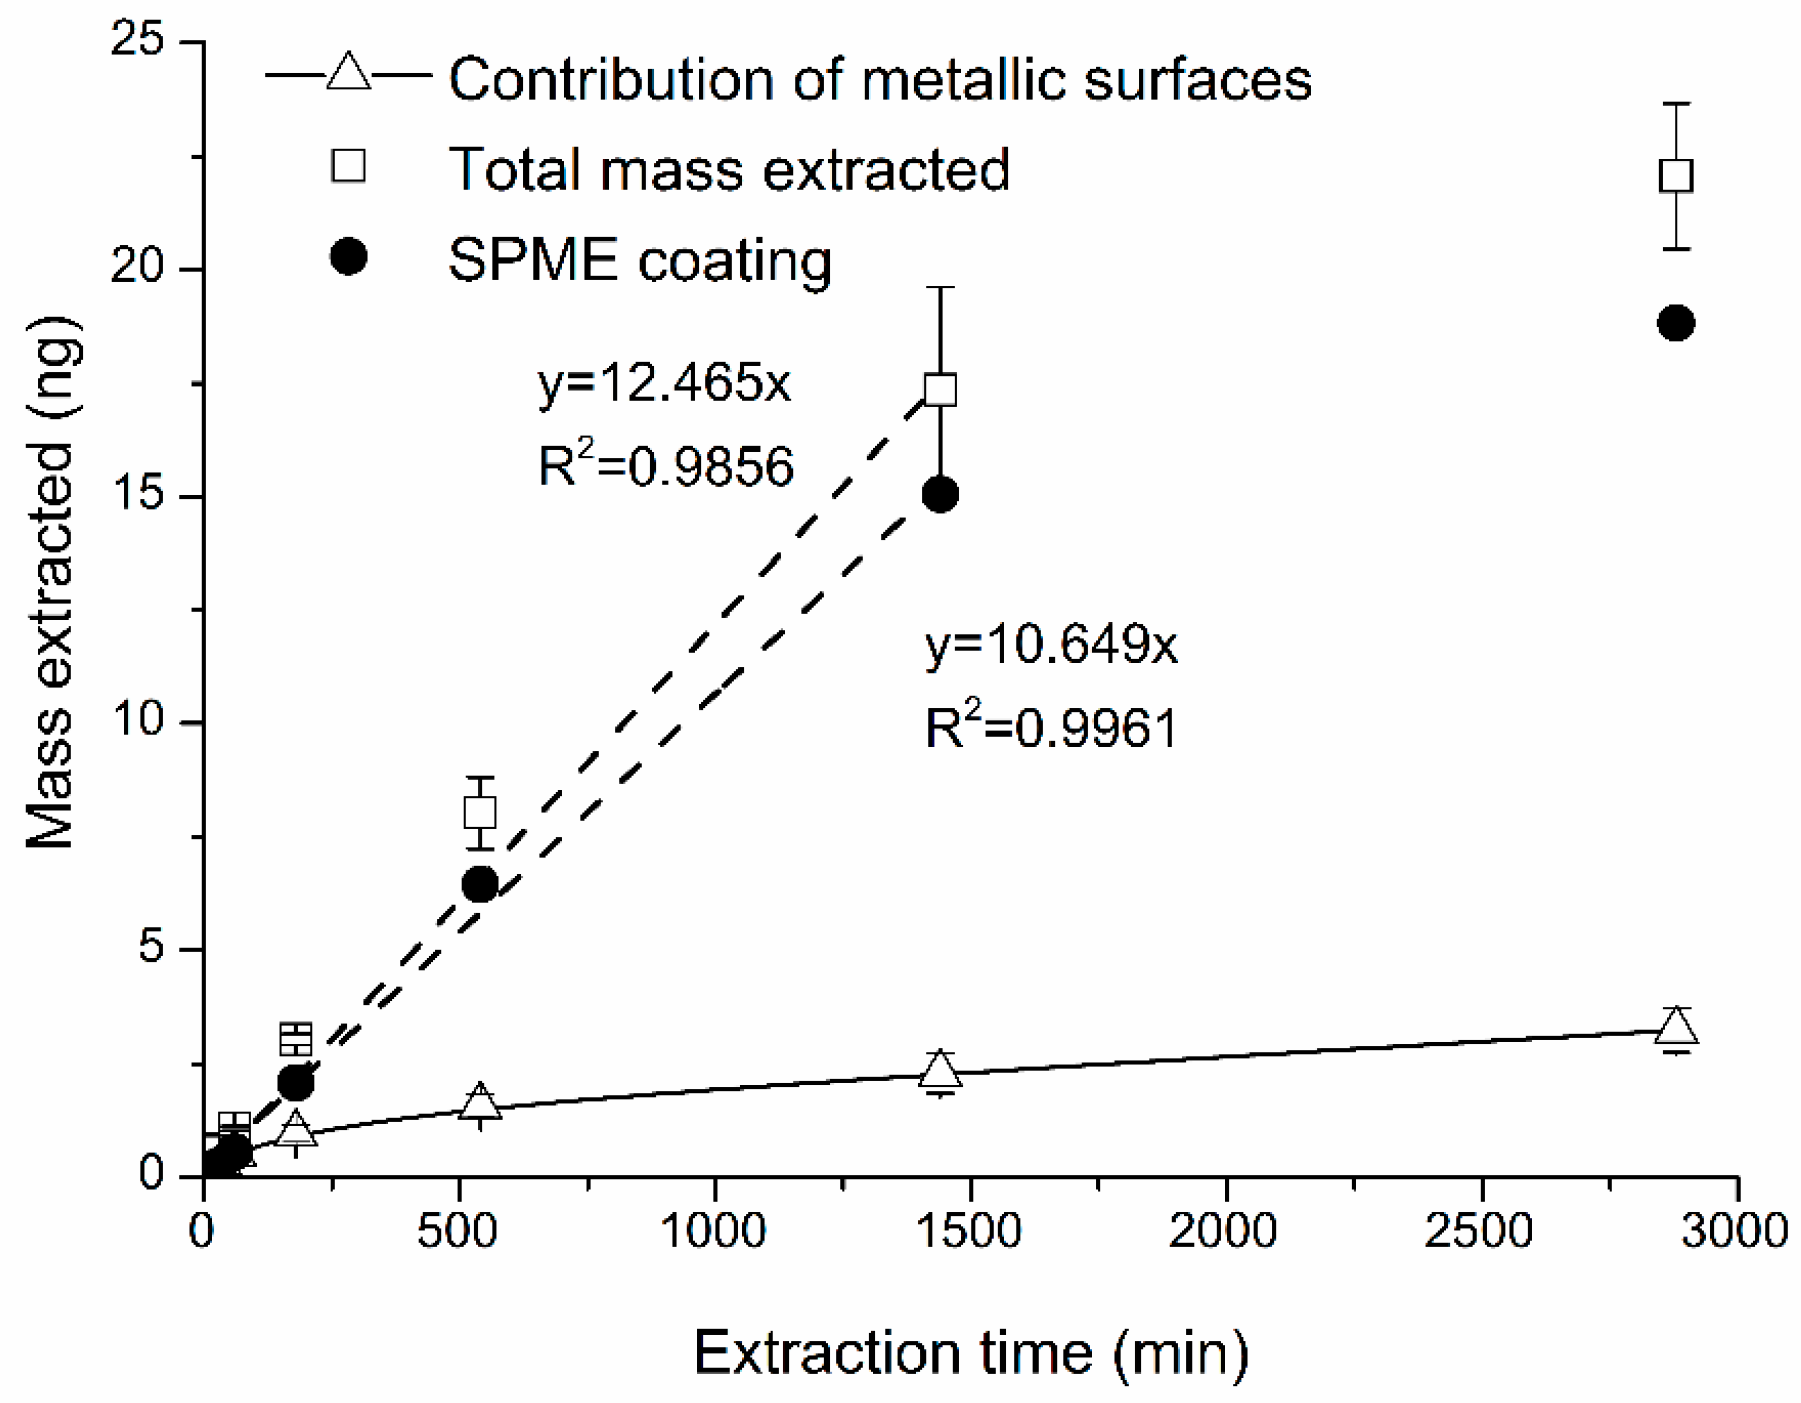
It is also important to consider the contribution of mass extracted by metallic surfaces of SPME assembly to the total mass extracted (Figure 6). Shorter t (<540 min) were characterized by higher % contribution of metal assembly ranging from 26% to 43%. For extractions longer than 540 min, the % contribution was virtually constant, at 16% (Figure 6). It was caused by “saturation” of metallic surfaces. This effect was reproducible, i.e., RSDs for the % contribution were lower at longer t (540–2880 min) ranging from 17 to 23%. For shorter extraction times (<540 min), RSDs were higher (20–29%). Thus, an optimal sampling time for naphthalene using retracted TWA-SPME is between ~600 and ~1000 min considering minimization of (a) the effects of extraction time and (b) the variability associated with the effect of metallic parts of SPME assembly. In the ~8 to ~48 h sampling time, the contribution of extraction by metallic parts of SPME assembly can be considered constant (16%) and accounted for (i.e., subtracted from the total mass extracted) and used for quantification with Equation (1).
Selection of TWA-SPME sampling time needs to be informed by the range of naphthalene concentrations, and thus, it needs to be considered for specific applications. Fiber sorption capacity is the ultimate limitation to assure that TWA-SPME extractions follow the Fick’s Law model (Equation (1)). Thus, only shorter sampling times can be used for very high Cg (>2 ppm) for naphthalene (e.g., diesel exhaust from low-quality fuel and out-of-tune or cold engine). On the other hand, much longer sampling times are feasible for low Cg (≤2 ppm) for naphthalene (e.g., diesel exhaust from high-quality fuel and well-performing engine, or ambient air). The method development was on a relative clean system and in many areas the system is not as clean (0.06–0.147 mg·m−3) [44] as those in US (0.008 mg·m−3) [45]. Thus, the sampling time of the proposed method has to be optimized to a specific application. Many practical applications such as ambient air quality measurements, tunnels, and long-term operating diesel engines (e.g., small power stations, trains, oil rigs, cold-climate machinery) can be considered for the TWA-SPME method.
4.4. Effect of Retraction Depth Z
The mass and sampling rate were obtained as a function of 1/Z at extraction time 540 min (Figure 7). RSDs ranged from 15 to 19%. Percent difference between experimental and theoretical mass was 39%. Theoretically, an increase of Z can increase the area of the metallic surface of SPME assembly inside protecting needle and increase % contribution of extraction by metallic SPME parts (measured with the “broken” fiber). The % of naphthalene mass extracted by needle assembly and retracted wire were calculated by dividing mass extracted by “broken” fiber to the total mass extracted by SPME assembly (coating + metallic parts). Thus, using a shorter Z is recommended to minimize the % contribution by metallic parts of SPME fiber.
4.5. Effect of Naphthalene Concentration (Cg)
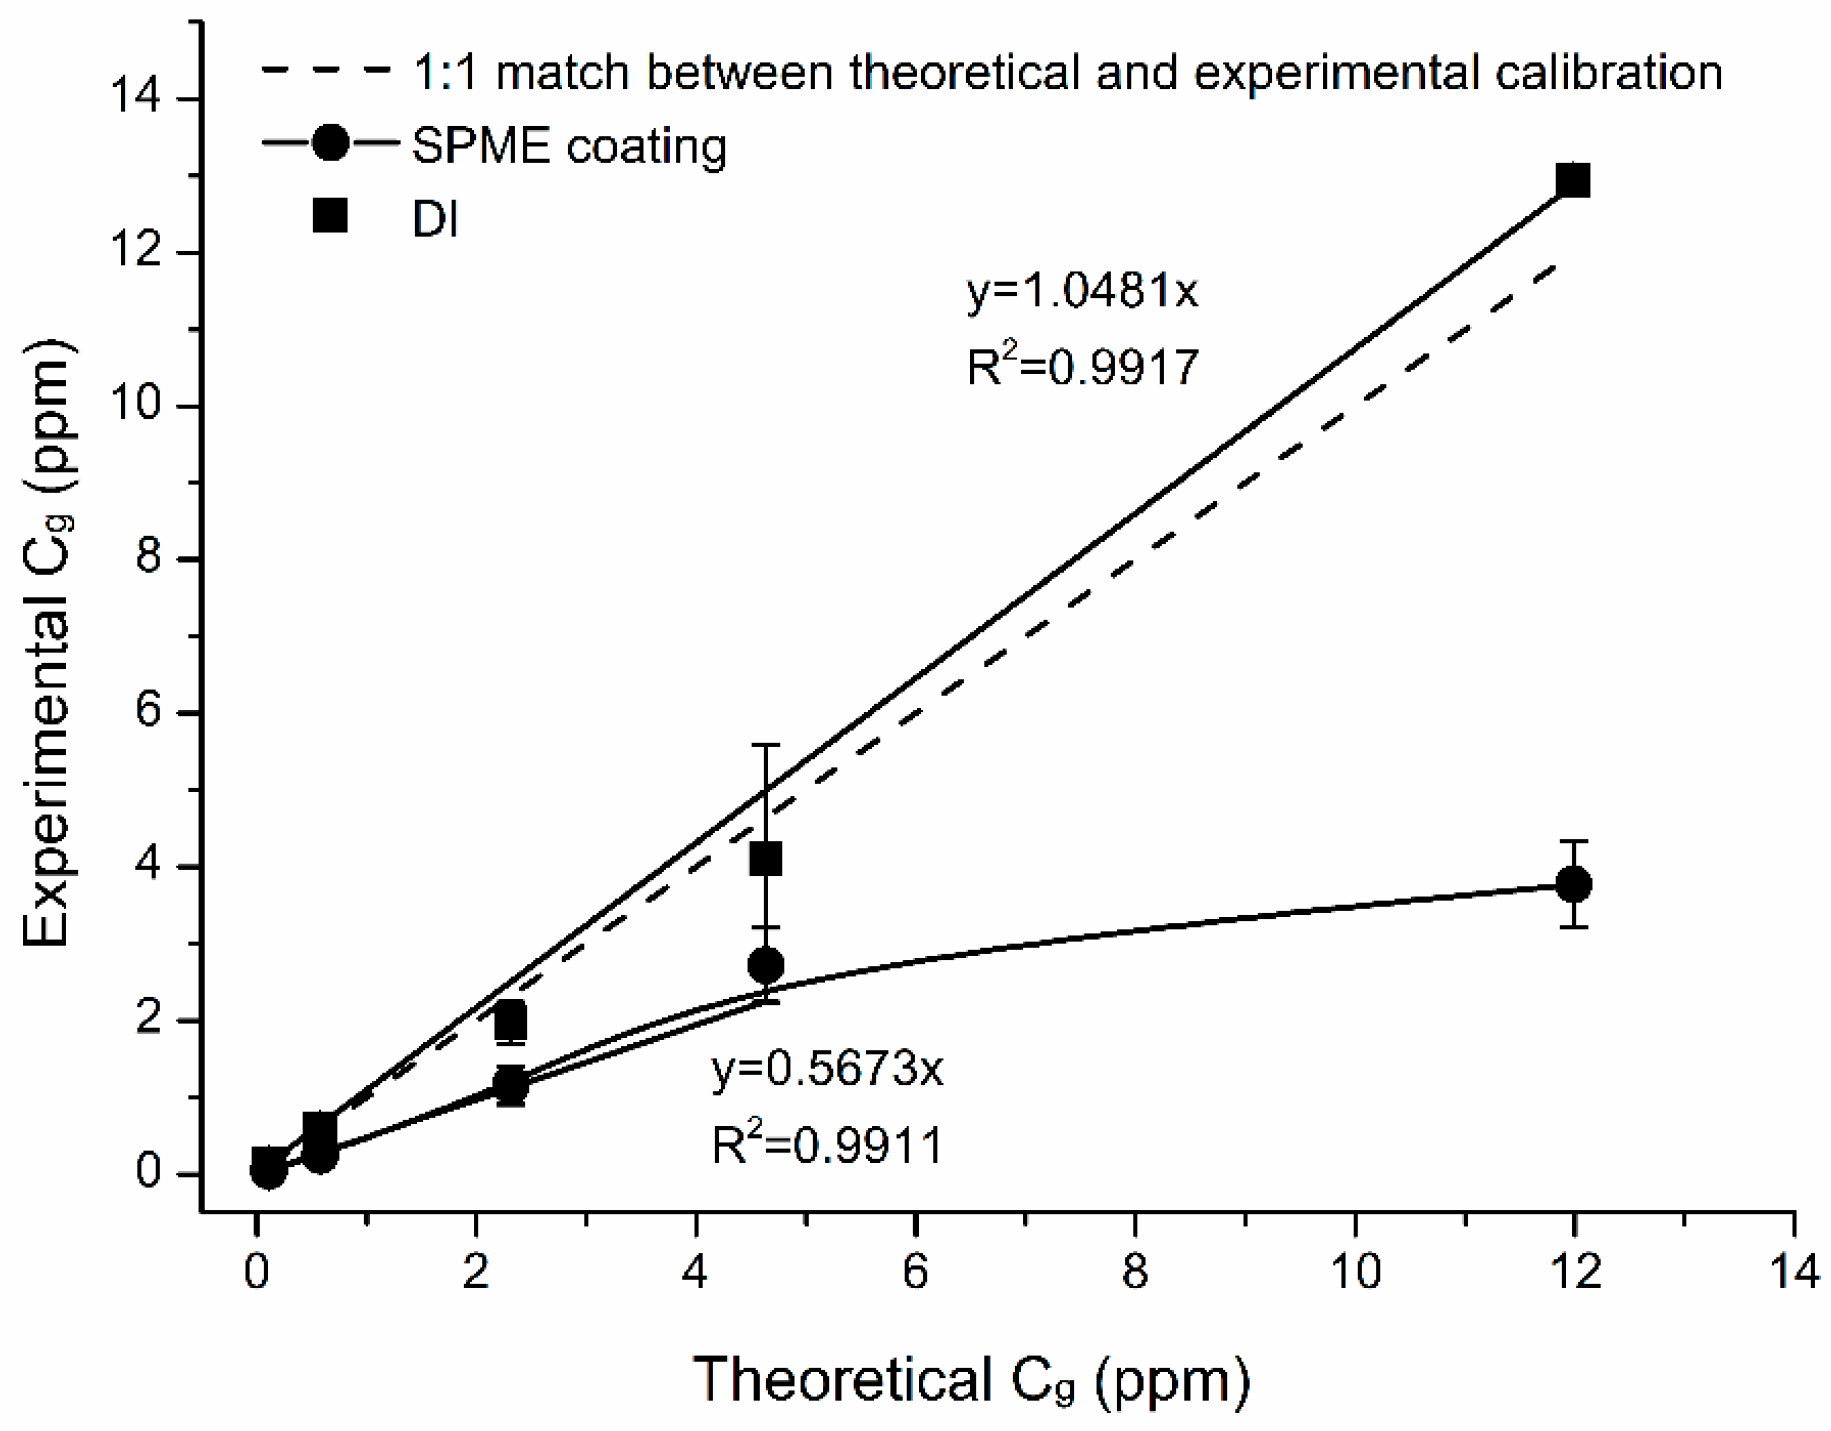
Calibration plots for naphthalene were linear in the whole studied concentration range (0.1–12 ppm) with R2 > 0.99 (Figure 8).
Method detection limits estimated at p = 0.95 confidence level were 11.5 ppb or 0.06 mg·m−3. Calibrations were made for the DI method for comparisons (Table 1). Mean concentrations of naphthalene detected by DI were higher than “theoretical” by 3%. Mean concentrations extracted by SPME were lower than “theoretical” by 54%. It was likely due to a saturation of SPME fiber when subjected to Cg = 4 ppm. The mean % difference for Cg < 4 ppm was 49%. The mean % difference for (higher range) Cg > 4 ppm was 60%. RSDs varied from 2 to 36% and 13 to 21% for DI injection and SPME calibration curves, respectively.
4.6. Validation of TWA-SPME Method for Naphthalene Quantification in Vehicle Exhaust Gas
The developed method was applied for measuring the concentration of naphthalene in exhaust gases of full-size pickup (Table 2, Figure S2) and tractor. TWA-SPME sampling was tested for longer (8 h) and shorter (1 h) sampling times. RSDs for TWA-SPME sampling were 16, 21 and 27%. DI analyses were below method detection limits.
Table 3 presents naphthalene concentrations in exhaust gases reported in the literature.
5. Conclusions
The new method for quantification of TWA concentrations of naphthalene in exhaust gases using retracted SPME fibers and GC-MS was developed. The following conclusions can be made about the effects of sampling parameters on the SPME method:
- The effects of variability of SPME fibers quality on mass extracted are significant. ANOVA showed no effect on mass extracted by randomly selected PA and DVB fiber coating, while randomly selected PDMS fibers extract significantly different masses of analytes. However, reproducible results with lower than 5% RSD were obtained with PDMS coating, which was chosen as an optimal fiber for further experiments.
- Losses during sample storage time ranged from ~0.2 ± 0.07%/min and 0.4 ± 0.07%/min sample losses for 23 °C and 0 °C, respectively. Storage temperature had no influence on sample recovery from SPME fiber coating. Sample storage in cool temperatures does not appear to have practical benefits.
- SPME fiber coating was saturated by using a sampling time of longer than 1440 min.
- Effects of gas concentrations on naphthalene mass extracted with TWA-SPME were linear in the whole studied concentration range (0.1–12 ppm) with R2 > 0.99. Mean masses extracted by SPME were lower than predicted by theory by 54%. It was likely due to a saturation of SPME fiber when subjected to Cg = 4 ppm. The mean % difference for (lower range) Cg < 4 ppm was 49% for naphthalene. The mean % difference for (higher range) Cg > 4 ppm was 60%.
- Effects of fiber retraction depth % of naphthalene mass were calculated by dividing mass extracted by “broken” fiber to the total mass extracted by SPME assembly (coating + metallic parts). Percent difference between experimental and theoretical mass was 39%. It is recommended using a shorter Z to minimize the % contribution by metallic parts of SPME fiber.
- The interfering contribution of extraction by (adsorption to) metallic parts of SPME needle assembly itself was reproducible and ranged from 26% to 43% for shorter sampling time (<540 min) and was virtually constant (16%) for sampling time longer than 540 min.
- The new method was verified on exhaust gases from idling pickup truck and a tractor and compared side-by-side with a direct injection of sampled exhaust gas method. DI analysis was below method detection limits.
- The TWA-SPME approach can be considered for adoption to a wide range of measurements involving volatile organic compounds (VOCs) and semivolatile organics, a condition that careful method development focuses on the variability of SPME fibers, fiber coatings, and quantifying the contribution of extraction (adsorption) to SPME metallic parts.
Supplementary Materials
The following are available online at https://www.mdpi.com/2073-4433/8/7/130/s1, Figure S1: Calibration of MS detector for naphthalene, Figure S2: Side-by-side vehicle exhaust gas sampling using (a) passive sampling with retracted SPME fibers in triplicates and (b) dynamic sampling into a Tedlar bag.
Acknowledgments
This research has been supported by the grant from the U.S. Civilian Research & Development Foundation (CRDF) Global Program “2014 Kazakhstan collaborative research travel fellowship” (award number GISX-14-60330-0) and the grant 4185/GF4 of the Ministry of Education and Science of the Republic of Kazakhstan (2015-2017). Authors would like to thank Miras Derbissalin for technical support.
Author Contributions
Nassiba Baimatova and Jacek A. Koziel conceived and designed the experiments. Nassiba Baimatova performed the experiments and analyzed the data. Nassiba Baimatova, Jacek A. Koziel and Bulat Kenessov wrote the paper. All authors contributed to shaping the content of the paper during the revisions. All authors have read and approved the final manuscript.
Conflicts of Interest
The authors declare no competing financial interests.
References
- U.S. Environmental Protection Agency. Compendium of Methods for the Determination of Toxic Organic Compounds in Ambient Air. Available online: https://www3.epa.gov/ttnamti1/files/ambient/airtox/tocomp99.pdf (accessed on 3 September 2014).
- U.S. Environmental Protection Agency. Naphthalene (CASRN 91-20-3). Available online: https://cfpub.epa.gov/ncea/iris/iris_documents/documents/subst/0436_summary.pdf (accessed on 15 September 2014).
- U.S. Environmental Protection Agency. Health and Environmental Effects Profile for Naphthalene. Available online: https://cfpub.epa.gov/ncea/iris_drafts/recordisplay.cfm?deid=49301 (accessed on 28 January 2015).
- U.S. Environmental Protection Agency. Health Effects Assessment for Naphthalene. Available online: https://cfpub.epa.gov/ncea/iris_drafts/recordisplay.cfm?deid=40598 (accessed on 15 October 2014).
- U.S. Environmental Protection Agency. Interim Methods for Development of Inhalation Reference Doses. Available online: https://cfpub.epa.gov/ncea/risk/recordisplay.cfm?deid=35707&CFID=80546352&CFTOKEN=63397154 (accessed on 28 October 2014).
- U.S. Environmental Protection Agency. Methods for Derivation of Inhalation Reference Concentrations and Application of Inhalation Dosimetry. Available online: https://www.epa.gov/sites/production/files/2014-11/documents/rfc_methodology.pdf (accessed on 28 November 2014).
- Shaltout, A.A.; Boman, J.; Welz, B.; Castilho, I.N.B.; Al Ashkar, E.A.; Gaita, S.M. Method development for the determination of Cd, Cu, Ni and Pb in PM2.5 particles sampled in industrial and urban areas of Greater Cairo, Egypt, using high-resolution continuum source graphite furnace atomic absorption spectrometry. Microchem. J. 2014, 113, 4–9. [Google Scholar] [CrossRef]
- De Abrantes, R.; de Assuncao, J.; Pesquero, C. Emission of polycyclic aromatic hydrocarbons from light-duty diesel vehicles exhaust. Atmos. Environ. 2004, 38, 1631–1640. [Google Scholar] [CrossRef]
- Moreira dos Santos, C.Y.; de Almeida Azevedo, D.; de Aquino Neto, F.R. Atmospheric distribution of organic compounds from urban areas near a coal-fired power station. Atmos. Environ. 2004, 38, 1247–1257. [Google Scholar] [CrossRef]
- Liu, K.; Zhang, C.; Cheng, Y.; Liu, C.; Zhang, H.; Zhang, G.; Sun, X.; Mu, Y. Serious BTEX pollution in rural area of the North China Plain during winter season. J. Environ. Sci. (China) 2015, 30, 186–190. [Google Scholar] [CrossRef] [PubMed]
- Marr, L.C.; Kirchstetter, T.W.; Harley, R.A. Characterization of polycyclic aromatic hydrocarbons in motor vehicle fuels and exhaust emissions. Environ. Sci. Technol. 1999, 33, 3091–3099. [Google Scholar] [CrossRef]
- Heeb, N.V.; Schmid, P.; Kohler, M.; Gujer, E.; Zennegg, M.; Wenger, D.; Wichser, A.; Ulrich, A.; Gfeller, U.; Honegger, P.; et al. Secondary effects of catalytic diesel particulate filters: Conversion of PAHs versus formation of nitro-PAHs. Environ Sci. Technol. 2008, 42, 3773–3779. [Google Scholar] [CrossRef] [PubMed]
- Westerholm, R.; Li, H. A multivariate statistical analysis of fuel-related polycyclic aromatic hydrocarbon emissions from heavy-duty diesel vehicles. Environ. Sci. Technol. 1994, 28, 965–972. [Google Scholar] [CrossRef] [PubMed]
- Westerholm, R.N.; Alsberg, T.E.; Frommelin, A.B.; Strandell, E. Effect of fuel polycyclic aromatic hydrocarbon content on the emissions of polycyclic aromatic hydrocarbons and other mutagenic substances from a gasoline-fueled automobile. Environ. Sci. Technol. 1988, 22, 925–930. [Google Scholar] [CrossRef] [PubMed]
- EN 590. Automotive Fuels-Diesel-Requirements and Test Methods. Available online: http://www.envirochem.hu/www.envirochem.hu/documents/EN_590_2009_hhV05.pdf (accessed on 25 February 2016).
- Hill, N. EU Fuel Quality Monitoring—2002 Summary Report Final report produced for the European Commission, DG Environment. A E A Technol. Environ. 2004, 33–46. Available online: https://circabc.europa.eu/sd/a/ae36bf6d-2a23-46e7-b14b-5c15f70efc6d/fqm_summary_2003.pdf (accessed on 25 February 2016).
- Aakko, P. PAH Content of Diesel Fuels. Available online: http://www.vtt.fi/inf/julkaisut/muut/2006/VTT-1155-06-AROM.pdf (accessed on 3 March 2015).
- Laurikko, J.; Nylund, N.O. Regulated and Unregulated Emissions from catalyst vehicles at Low Ambient Temperatures. SAE Tech. Pap. 1993, 13. [Google Scholar] [CrossRef]
- Westerholm, R.; Christensen, A. Regulated and unregulated exhaust emissions from two three-way catalyst equipped gasoline fuelled vehicles. Atmos. Environ. 1996, 30, 3529–3536. [Google Scholar] [CrossRef]
- Clairotte, M.; Adam, T.W.; Zardini, A.A.; Manfredi, U.; Martini, G.; Krasenbrink, A.; Vicet, A.; Tournié, E.; Astorga, C. Effects of low temperature on the cold start gaseous emissions from light duty vehicles fuelled by ethanol-blended gasoline. Appl. Energy 2013, 102, 44–54. [Google Scholar] [CrossRef]
- Tsapakis, M.; Stephanou, E.G. Occurrence of gaseous and particulate polycyclic aromatic hydrocarbons in the urban atmosphere: Study of sources and ambient temperature effect on the gas/particle concentration and distribution. Environ. Pollut. 2005, 133, 147–156. [Google Scholar] [CrossRef] [PubMed]
- Mandalakis, M.; Tsapakis, M.; Tsoga, A.; Stephanou, E.G. Gas-particle concentrations and distribution of aliphatic hydrocarbons, PAHs, PCBs and PCDD/Fs in the atmosphere of Athens (Greece). Atmos. Environ. 2002, 36, 4023–4035. [Google Scholar] [CrossRef]
- Possanzini, M.; di Palo, V.; Gigliucci, P.; Tomasi Scianò, M.C.; Cecinato, A. Determination of phase-distributed PAH in Rome ambient air by denuder/GC-MS method. Atmos. Environ. 2004, 38, 1727–1734. [Google Scholar] [CrossRef]
- Bezabeh, D.Z. Screening of aerosol filter samples for PAHs and Nitro-PAHs by laser desorption ionization TOF Mass Spectrometry. Aerosol Sci. Technol. 1999, 30, 288–299. [Google Scholar] [CrossRef]
- Bertoni, G.; Tappa, R.; Cecinato, A. Environmental monitoring of semi-volatile polyciclic aromatic hydrocarbons by means of diffusive sampling devices and GC-MS analysis. Chromatographia 2001, 53, 312–316. [Google Scholar] [CrossRef]
- Wei, M.C.; Chang, W.T.; Jen, J.F. Monitoring of PAHs in air by collection on XAD-2 adsorbent then microwave-assisted thermal desorption coupled with headspace solid-phase microextraction and gas chromatography with mass spectrometric detection. Anal. Bioanal. Chem. 2007, 387, 999–1005. [Google Scholar] [CrossRef] [PubMed]
- Ballesteros, R.; Hernández, J.J.; Lyons, L.L. Determination of PAHs in diesel particulate matter using thermal extraction and solid phase micro-extraction. Atmos. Environ. 2009, 43, 655–662. [Google Scholar] [CrossRef]
- Pacenti, M.; Lofrumento, C.; Dugheri, S.; Zoppi, A.; Borsi, I.; Speranza, A.; Boccalon, P.; Arcangeli, G.; Antoniucci, A.; Castellucci, E.M. Physicochemical characterization of exhaust particulates from gasoline and diesel engines by solid-phase micro extraction sampling and combined raman microspectroscopic/fast gas-chromotography mass spectrometry analysis. Eur. J. Inflamm. 2009, 7, 25–37. [Google Scholar]
- Koziel, J.A.; Odziemkowski, M.; Pawliszyn, J. Sampling and analysis of airborne particulate matter and aerosols using in-needle trap and SPME fiber devices. Anal. Chem. 2001, 73, 47–54. [Google Scholar] [CrossRef] [PubMed]
- Baimatova, N.; Koziel, J.A.; Kenessov, B. Quantification of benzene, toluene, ethylbenzene and o-xylene in internal combustion engine exhaust with time-weighted average solid phase microextraction and gas chromatography mass spectrometry. Anal. Chim. Acta 2015, 873, 38–50. [Google Scholar] [CrossRef] [PubMed]
- Lesellier, E. Extraction and analysis of polycyclic aromatic hydrocarbons (PAHs) by solid phase micro-extraction/supercritical fluid chromatography (SPME/SFC). Analusis 1999, 27, 363–368. [Google Scholar] [CrossRef]
- Tuncel, S.G.; Topal, T. Multifactorial optimization approach for determination of polycyclic aromatic hydrocarbons in sea sediments of Turkish Mediterranean coast. Am. J. Anal. Chem. 2011, 02, 783–794. [Google Scholar] [CrossRef]
- Cam, D.; Gagni, S.; Meldolesi, L.; Galletti, G. Determination of polycyclic aromatic hydrocarbons in sediment using solid-phase microextraction with gas chromatography-mass spectrometry. J. Chromatogr. Sci. 2000, 38, 55–60. [Google Scholar] [CrossRef] [PubMed]
- Doong, R.; Chang, S.; Sun, Y. Solid-phase microextraction and headspace solid-phase microextraction for the determination of high molecular-weight polycyclic aromatic hydrocarbons in water and soil samples. J. Chromatogr. Sci. 2000, 38, 528–534. [Google Scholar] [CrossRef] [PubMed]
- Wang, Y.; Zhang, J.; Ding, Y.; Zhou, J.; Ni, L.; Sun, C. Quantitative determination of 16 polycyclic aromatic hydrocarbons in soil samples using solid-phase microextraction. J. Sep. Sci. 2009, 32, 3951–3957. [Google Scholar] [CrossRef] [PubMed]
- Odziemkowski, M.; Koziel, J. A.; Irish, D.E.; Pawliszyn, J. Sampling and raman confocal microspectroscopic analysis of airborne particulate matter using poly(dimethylsiloxane) solid-phase microextraction fibers. Anal. Chem. 2001, 73, 3131–3139. [Google Scholar] [CrossRef] [PubMed]
- Woolcock, P.J.; Koziel, J.A.; Cai, L.; Johnston, P.A.; Brown, R.C. Analysis of trace contaminants in hot gas streams using time-weighted average solid-phase microextraction: Proof of concept. J. Chromatogr. A 2013, 1281, 1–8. [Google Scholar] [CrossRef] [PubMed]
- Woolcock, P.J.; Koziel, J.A.; Johnston, P.A.; Brown, R.C.; Broer, K.M. Analysis of trace contaminants in hot gas streams using time-weighted average solid-phase microextraction: Pilot-scale validation. Fuel 2015, 153, 552–558. [Google Scholar] [CrossRef]
- Koziel, J.A.; Nguyen, L.T.; Glanville, T.D.; Ahn, H.K.; Frana, T.S.; van Leeuwen, J.H. Method for sampling and analysis of volatile biomarkers in process gas from aerobic digestion of poultry carcass using time-weighted average SPME and GC-MS. Food Chem. 2017, 232, 799–807. [Google Scholar] [CrossRef] [PubMed]
- Koziel, J.A.; Pawliszyn, J. Air sampling and analysis of volatile organic compounds with solid phase microextraction. J. Air Waste Manag. Assoc. 2001, 51, 173–184. [Google Scholar] [CrossRef] [PubMed]
- Koziel, J.A.; Spinhirne, J.P. Generation and calibration of standard gas mixtures for volatile fatty acids using permeation tubes and solid-phase microextraction. Am. Soc. Agric. Eng. 2003, 46, 1639–1646. [Google Scholar]
- Koziel, J.A.; Martos, P.A.; Pawliszyn, J. System for the generation of standard gas mixtures of volatile and semi-volatile organic compounds for calibrations of solid-phase microextraction and other sampling devices. J. Chromatogr. A 2004, 1025, 3–9. [Google Scholar] [CrossRef] [PubMed]
- Pawliszyn, J. Handbook of Solid Phase Microextraction, 1st ed.; Elsevier Inc.: Amsterdam, The Netherlands, 2012; ISBN 9780124160170. [Google Scholar]
- Rhead, M.M.; Pemberton, R.D. Sources of naphthalene in diesel exhaust emissions. Energy Fuels 1996, 10, 837–843. [Google Scholar] [CrossRef]
- Khalili, N.R.; Scheff, P.A.; Holsen, T. PAH source fingerprints for coke ovens, diesel and gasoline engines, highway tunnels, and wood combustion emissions. Atmos. Environ. 1995, 29, 533–542. [Google Scholar] [CrossRef]
- Mi, H.; Lee, W.; Tsai, P.; Chen, C. A comparison on the emission of polycyclic aromatic hydrocarbons and their corresponding carcinogenic potencies from a vehicle engine using leaded and lead-free gasoline. Environ. Health Perspect. 2001, 109, 1285–1290. [Google Scholar] [CrossRef] [PubMed]
Figure 1.
Analysis of variance (ANOVA) between solid-phase microextraction (SPME) fiber coating groups (polydimethylsiloxane (PDMS), polyacrylate (PA) and divinylbenzene (DVB)).
Figure 1.
Analysis of variance (ANOVA) between solid-phase microextraction (SPME) fiber coating groups (polydimethylsiloxane (PDMS), polyacrylate (PA) and divinylbenzene (DVB)).

Figure 2.
ANOVA within fiber groups: (a) PDMS; (b) PA; and (c) DVB.
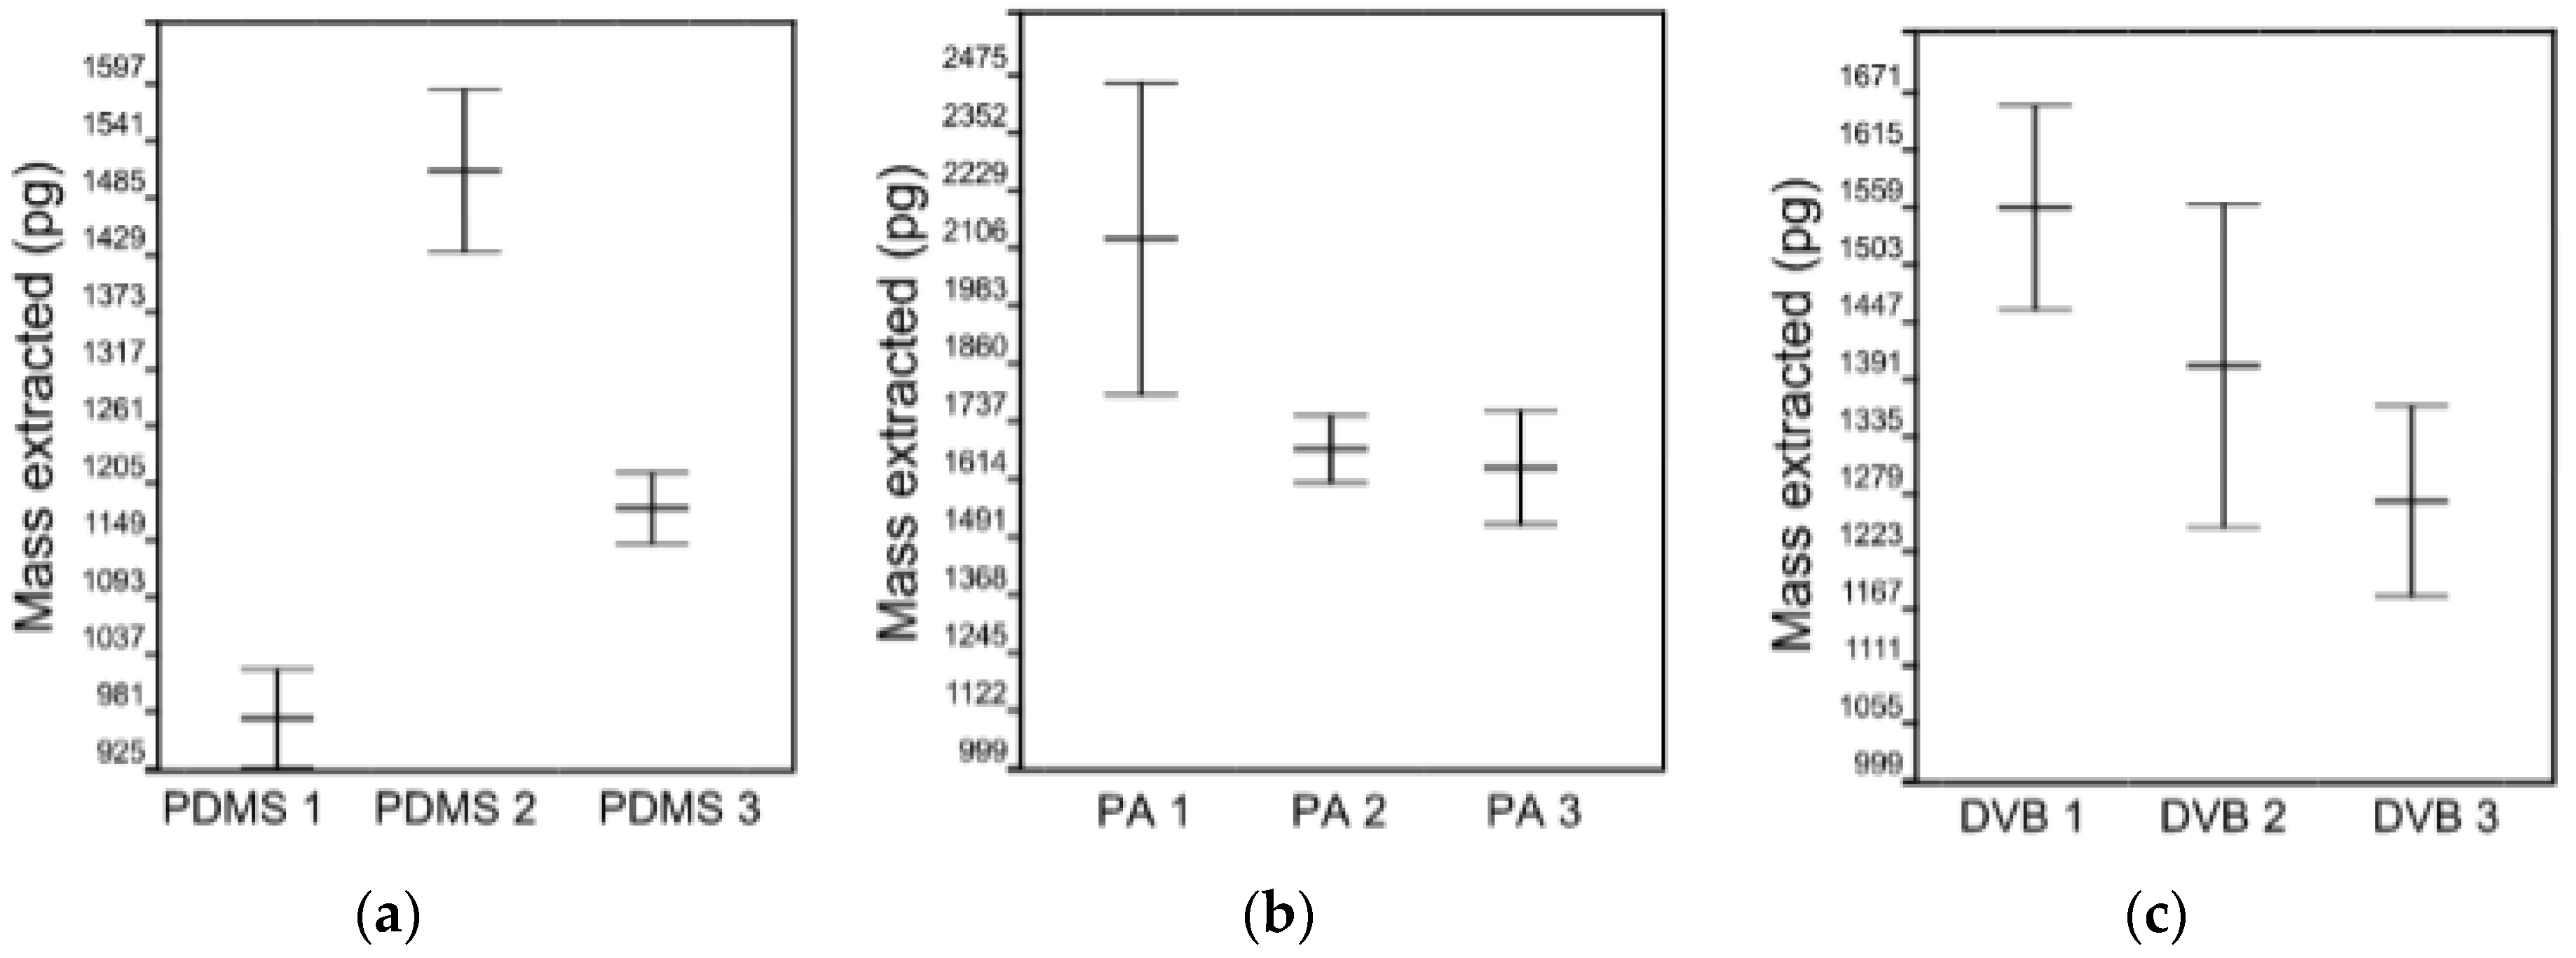
Figure 3.
Relative standard deviations (RSDs) of different fiber types.

Figure 4.
Effect of storage time at 23 and 0 °C on the recovery (%) of extracted naphthalene

Figure 5.
Effects of sampling time on the extracted naphthalene mass. t = 30, 60, 180, 300, 540, 1440, 2880 min. Z = 10 mm, T = 313 K, Cg = 2.0 ppm.
Figure 5.
Effects of sampling time on the extracted naphthalene mass. t = 30, 60, 180, 300, 540, 1440, 2880 min. Z = 10 mm, T = 313 K, Cg = 2.0 ppm.

Figure 6.
Effect of sampling time t on the % of naphthalene mass extracted onto metallic surfaces of SPME assembly.
Figure 6.
Effect of sampling time t on the % of naphthalene mass extracted onto metallic surfaces of SPME assembly.
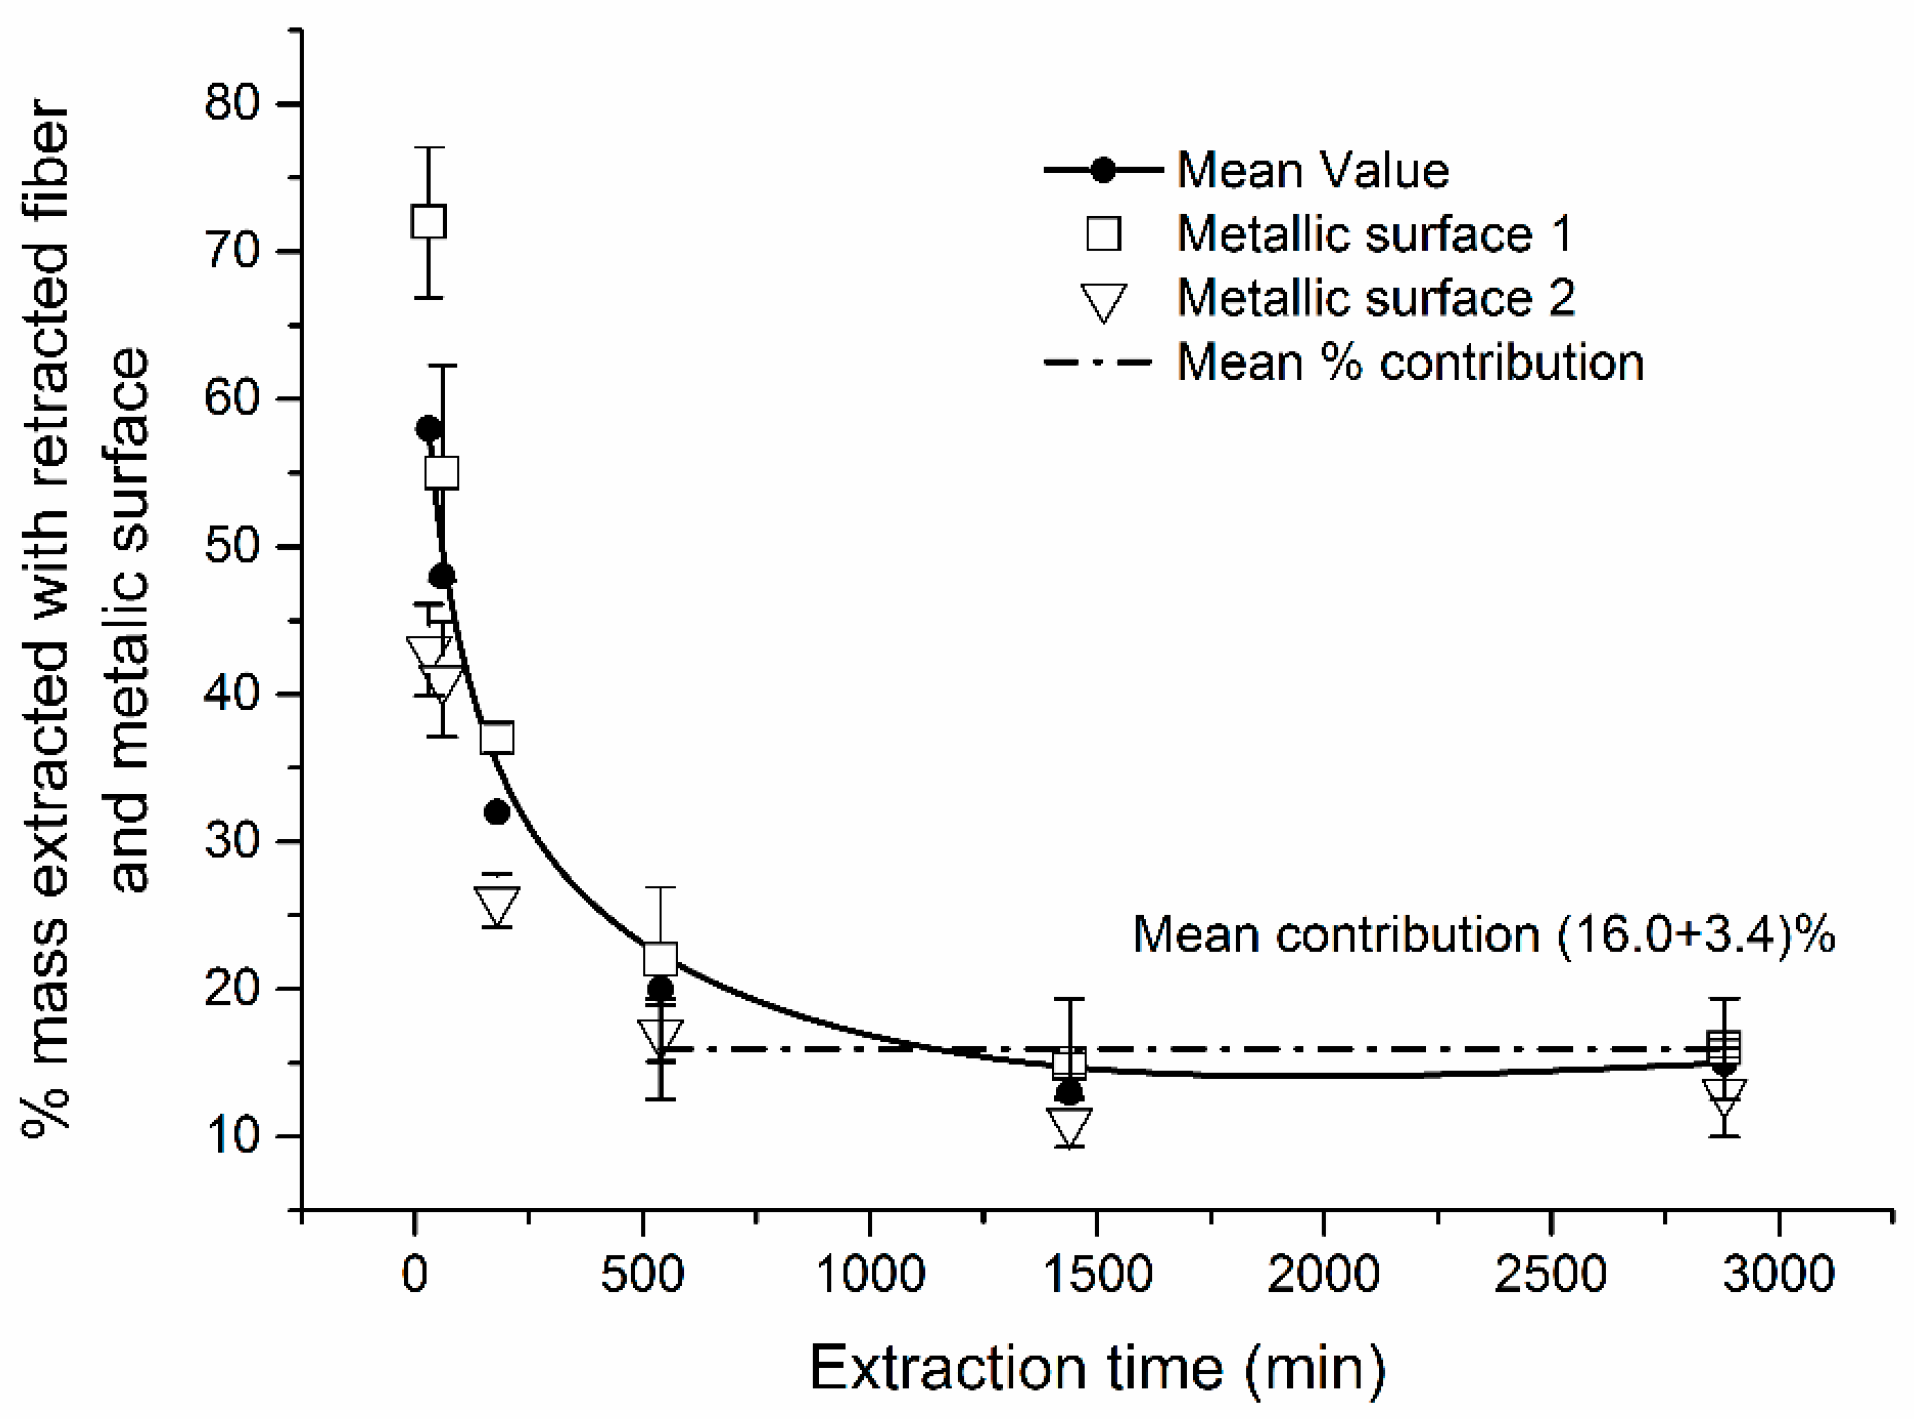
Figure 7.
Relationship between sampling rate and diffusion path length. T = 40 °C. Sampling rate (R) = m/Cg × t [volume/time]. Sampling conditions: t = 9 h, T = 40 °C, Cg = 5.9 mg·m−3.
Figure 7.
Relationship between sampling rate and diffusion path length. T = 40 °C. Sampling rate (R) = m/Cg × t [volume/time]. Sampling conditions: t = 9 h, T = 40 °C, Cg = 5.9 mg·m−3.
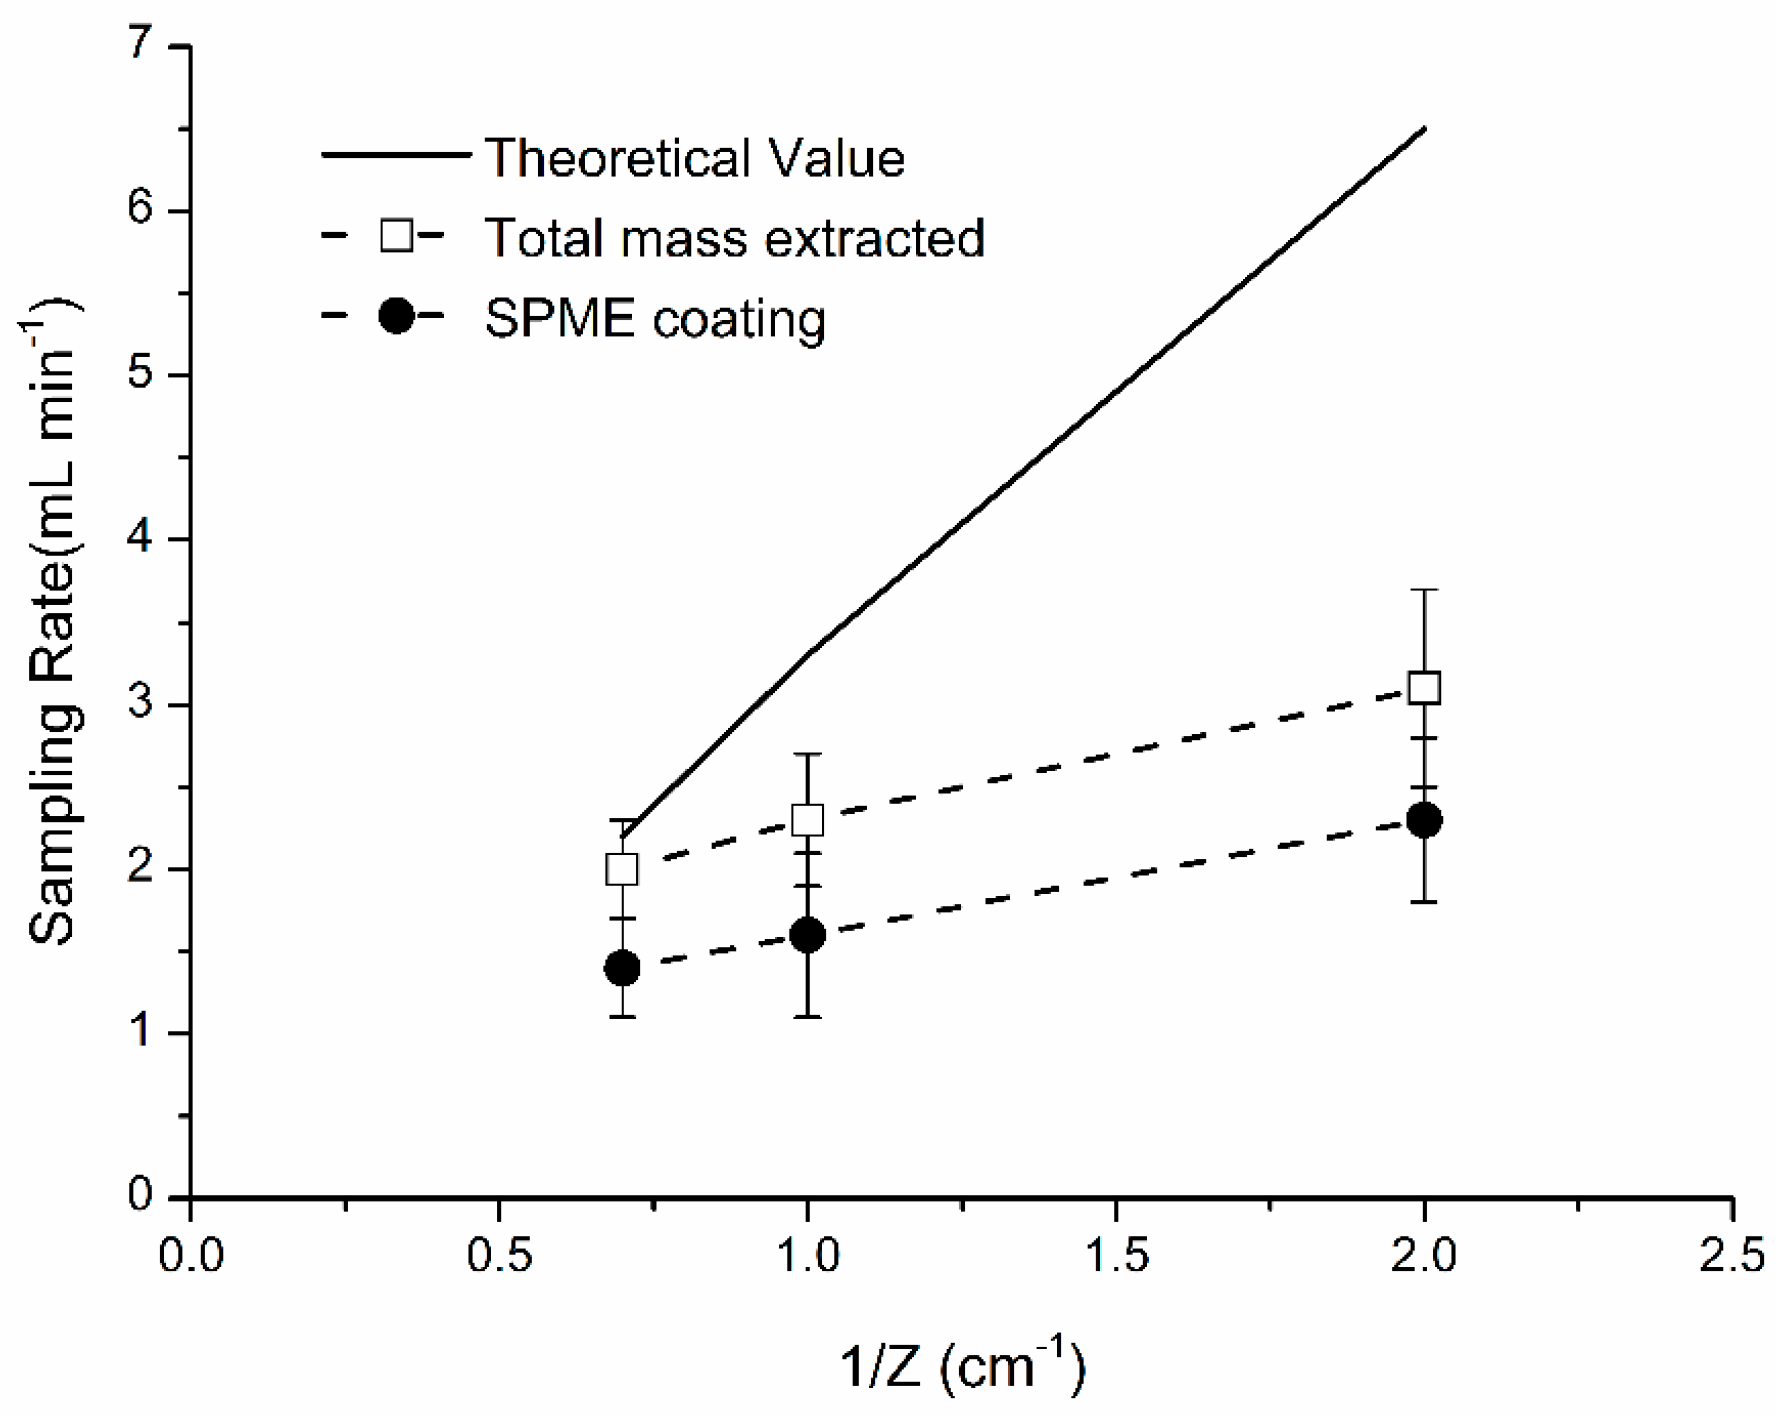
Figure 8.
Calibration plots for naphthalene with SPME fiber and direct injection (DI). PDMS 100 µm retracted fiber, t = 9 h, Z = 10 mm, T = 40 °C. Cg for naphthalene ranged from 0.1 to 12 ppm. MDL P (0.95) = 11.5 ppb or 0.06 mg·m−3.
Figure 8.
Calibration plots for naphthalene with SPME fiber and direct injection (DI). PDMS 100 µm retracted fiber, t = 9 h, Z = 10 mm, T = 40 °C. Cg for naphthalene ranged from 0.1 to 12 ppm. MDL P (0.95) = 11.5 ppb or 0.06 mg·m−3.


Table 1.
Comparison of mean (n = 3) experimental (SPME and DI) and theoretical (gas standard) Cg.
| Theoretical Cg, ppm | Experimental Cg, ppm | |||||
|---|---|---|---|---|---|---|
| SPME | DI | |||||
| Mean | STDEV | RSD | Mean | STDEV | RSD | |
| 0.11 | 0.052 | 0.007 | 13 | 0.15 | 0.02 | 16 |
| 0.58 | 0.25 | 0.04 | 15 | 0.60 | 0.11 | 18 |
| 2.3 | 1.2 | 0.3 | 21 | 2.0 | 0.3 | 14 |
| 4.6 | 2.7 | 0.5 | 18 | 4.1 | 1.5 | 36 |
| 12 | 3.8 | 0.6 | 15 | 13.0 | 0.2 | 1.5 |
Table 2.
Measured naphthalene concentration in exhaust gases and sampling conditions.
| Vehicle | Z, mm | t, h | T, °C * | Cg, mg·m−3 | |||
|---|---|---|---|---|---|---|---|
| TWA SPME Mean | RSD (%) | DI Mean | RSD | ||||
| Full-size pickup | 10 | 8 | 27–95 | (0.08 ± 0.02) | 21 | n/d | n/d |
| Full-size pickup | 3 | 1 | 27–75 | (0.3 ± 0.05) | 16 | n/d | n/d |
| Tractor | 10 | 1 | 27–122 | (0.2 ± 0.05) | 27 | n/d | n/d |
* Note: Range of temperatures measured from cold start to hot engine run. DI-concentration measured by direct injection is sampled gas onto GC column. n/d: not detected.
Table 3.
Comparison of measured naphthalene concentrations with other studies.
| Vehicle Characteristics | Type of Sampling | Country of Study | Concentration Range, mg·m−3 | References | ||
|---|---|---|---|---|---|---|
| Model | Year | Mileage, km | ||||
| Diesel exhaust | ||||||
| Ford F-250 XL Super Duty pickup truck | 2005 | ~139,200 | TWA SPME 8 h | USA | (0.08 ± 0.02) | This study |
| Ford F-250 XL Super Duty pickup truck | 2005 | ~139,200 | TWA SPME 1 h | (0.30 ± 0.05) | ||
| John Deere 5830 forage harvester | ~30 years | - | (0.20 ± 0.05) | |||
| Perkins Prima diesel engine | - | - | Exhaust gas sampling was performed using the total exhaust solvent stripping apparatus (TESSA) sampling system. The TES was dissolved in hexane (1 mL) and transferred quantitatively to the top of a slurry-packed silica column. The silica was cleaned by Soxhlet extraction with DCM for 24 h before being fully activated at 185 °C for 12 h. | UK | 0.026 | [44] |
| Mazda E5 with Premium leaded gasoline | - | 100,00 | Collected with XAD-2 adsorbent, extracted by Soxhlet for 24 h, with a mixed solvent (n-hexane and dichloromethane, v:v = 1:1, 500 mL each). The extract was concentrated by purging with ultrapure nitrogen (flow rate 1.0 L/min) to 2 mL | Taiwan | 0.0615–0.120 * | [46] |
| Mazda E5 with 92-Lead-free gasoline | 0.0882–0.146 * | |||||
| Mazda E5 with 95-Lead-free gasoline | 0.0875–0.147 | |||||
* Concentration range under 4 specified operating conditions (idling and 3 cruising speeds of 40 km/h, 80 km/h, and 120 km/h).
© 2017 by the authors. Licensee MDPI, Basel, Switzerland. This article is an open access article distributed under the terms and conditions of the Creative Commons Attribution (CC BY) license (http://creativecommons.org/licenses/by/4.0/).
Share and Cite
MDPI and ACS Style
Baimatova, N.; Koziel, J.A.; Kenessov, B. Passive Sampling and Analysis of Naphthalene in Internal Combustion Engine Exhaust with Retracted SPME Device and GC-MS. Atmosphere 2017, 8, 130. https://doi.org/10.3390/atmos8070130
AMA Style
Baimatova N, Koziel JA, Kenessov B. Passive Sampling and Analysis of Naphthalene in Internal Combustion Engine Exhaust with Retracted SPME Device and GC-MS. Atmosphere. 2017; 8(7):130. https://doi.org/10.3390/atmos8070130
Chicago/Turabian StyleBaimatova, Nassiba, Jacek A. Koziel, and Bulat Kenessov. 2017. "Passive Sampling and Analysis of Naphthalene in Internal Combustion Engine Exhaust with Retracted SPME Device and GC-MS" Atmosphere 8, no. 7: 130. https://doi.org/10.3390/atmos8070130
Note that from the first issue of 2016, this journal uses article numbers instead of page numbers. See further details here.