Article

Occurrence and Potential Sources of Quinones Associated with PM2.5 in Guadalajara, Mexico

by
Adriana Barradas-Gimate
1,
Mario Alfonso Murillo-Tovar
2,*,
José De Jesús Díaz-Torres
1,
Leonel Hernández-Mena
1,*,
Hugo Saldarriaga-Noreña
3,
Juana Maria Delgado-Saborit
4 and
Alberto López-López
1
1
Centro de Investigación y Asistencia en Tecnología y Diseño del Estado de Jalisco, Av. Normalistas 800, Col. Colinas de la Normal, Guadalajara, Jalisco 44270, México
2
Catedrático CONACYT, Centro de Investigaciones Químicas- IICBA, Universidad Autónoma del Estado de Morelos, Av. Universidad 1001, Col. Chamilpa, Cuernavaca, Morelos 62209, México
3
Centro de Investigaciones Químicas-IICBA, Universidad Autónoma del Estado de Morelos, Av. Universidad 1001, Col. Chamilpa, Cuernavaca, Morelos 62209, México
4
Division of Environmental Health & Risk Management, School of Geography, Earth & Environmental Science, University of Birmingham, Edgbaston, Birmingham B15 2TT, UK
*
Authors to whom correspondence should be addressed.
Atmosphere 2017, 8(8), 140; https://doi.org/10.3390/atmos8080140
Submission received: 20 April 2017 / Revised: 21 July 2017 / Accepted: 26 July 2017 / Published: 29 July 2017
(This article belongs to the Special Issue Urban Air Pollution)

Abstract

:
This study aims to establish the influence of primary emission sources and atmospheric transformation process contributing to the concentrations of quinones associated to particulate matter of less than 2.5 µm (PM2.5) in three sites within the Metropolitan Area of Guadalajara (MAG), namely Centro (CEN), Tlaquepaque (TLA) and Las Águilas (AGU). Environmental levels of quinones extracted from PM2.5 filters were analyzed using Gas Chromatography coupled to Mass Spectrometry (GC-MS). Overall, primary emissions in combination with photochemical and oxidation reactions contribute to the presence of quinones in the urban atmosphere of MAG. It was found that quinones in PM2.5 result from the contributions from direct emission sources by incomplete combustion of fossil fuels such as diesel and gasoline that relate mainly to vehicular activity intensity in the three sampling sites selected. However, this also suggests that the occurrence of quinones in MAG can be related to photochemical transformation of the parent Polycyclic Aromatic Hydrocarbons (PAHs), to chemical reactions with oxygenated species, or a combination of both routes. The higher concentration of 1,4-Chrysenequinone during the rainy season compared to the warm-dry season indicates chemical oxidation of chrysene, since the humidity could favor singlet oxygen collision with parent PAH present in the particle phase. On the contrary, 9,10-Anthraquinone/Anthracene and 1,4-Naftoquinone/Naphthalene ratios were higher during the warm-dry season compared to the rainy season, which might indicate a prevalence of the photochemical formation during the warm-dry season favored by the large solar radiation typical of the season. In addition, the estimated percentage of photochemical formation of 9,10-Phenanthrenequinone showed that the occurrence of this compound in Tlaquepaque (TLA) and Las Águilas (AGU) sites is mainly propagated by conditions of high solar radiation such as in the warm-dry season and during long periods of advection of air masses from emission to the reception areas. This was shown by the direct association between the number hourly back trajectories arriving in the TLA and AGU from Centro and other areas in MAG and the highest photochemical formation percentage.

1. Introduction

Epidemiological studies have demonstrated that long- and short-term exposure to high environmental levels of breathable airborne particulates with an aerodynamic diameter of less than 2.5 µm (PM2.5) is associated with several adverse health effects in humans [1,2]. Although PM2.5 can penetrate deeply into the alveoli and may induce human health effects, it has been found that specific chemicals substances present in PM2.5, such as trace metals, inorganic ions, or polycyclic aromatic hydrocarbons and their derivatives nitrogenated PAHs (NPAHs) and oxygenated PAHs (OPAHs), might also have a highlighted role in determining the toxicity of PM2.5 [3].
The occurrence of quinones in PM2.5, a class of oxygenated PAHs, is of concern because of their genotoxic effects. In addition to direct mutagenicity and carcinogenicity [4,5], in vivo assays have shown that quinones are highly redox active, cascading the formation of reactive oxygen species (ROS) within the cell [6]. The presence of ROS can cause severe oxidative stress within cells [7] and lead to the development of diseases and pathological conditions such as asthma, cardiovascular diseases, Alzheimer, diabetes, or cancer [8].
Quinones are emitted as primary pollutants during the incomplete combustion of fossil fuel [9] and can also be formed in the atmosphere as a result of atmospheric reactions [10]. The atmospheric formation of quinones from parent PAHs can either be by photochemical formation or through reactions with oxygenated species, such as hydroxyl radical, nitrate, and ozone. The descriptions of the chemical and photochemical formation mechanisms are mainly based on simulated atmospheric conditions [11,12]. However, knowledge of the occurrence of the transformation processes that result in the presence of quinones in ambient air is still scarce [13].
The aim of this study is to establish the influence of primary combustion sources and secondary atmospheric formation on the occurrence of quinones in PM2.5. Spatial and seasonal analysis of a comprehensive measurement data set obtained under two distinct environmental conditions—the dry-warm and the rainy season—in combination with the analysis of different air mass trajectories in three urban sites were employed to elucidate origin of quinones in the Metropolitan Area of Guadalajara, Mexico.

2. Experimental

2.1. Standards and Material

Standard of oxygenated PAHs 1,4-naphthoquinone (1,4-NQ), 1,4-phenanthrenoquinone (1,4-PQ), 9,10-anthracenequinone (9,10-AQ), 9,10-phenanthrenequinone (9,10-PQ), 1,2-Benzanthrenoquinone (1,2-BQ), 1,4-Chrysenequinone (1,4-CQ), 5,12-naphthacenequinone (5,12-NQ) and surrogate 1,4-naphthoquinone-d6 (1,4-NQ-d6), and anthracenequinone-d8 (AQ-d8) were obtained individually as a neat and supplied by Chiron (Trondheim, Norway). Standards of PAHs were obtained as a mixture, containing naphthalene (Nap), acenaphthylene (Acy), acenaphthene (Acn), fluorene (Flu), phenanthrene (Phe), anthracene (Ant), fluoranthene (Flt), pyrene (Pyr), benzo[a]anthracene (BaA), chrysene (Chry), benzo[b]fluoranthene (BbF), benzo[k]fluoranthene (BkF), benzo[a]pyrene (BaP), indeno[1,2,3-cd]pyrene (IcdP), dibenzo[ah]anthracene (DBahA), and benzo[ghi]perylene (BghiP). Internal Standards were also obtained as mixtures constituted of five deuterated PAHs (naphthalene-d8, acenaphthene-d10, phenanthrene-d10, chrysene-d12 and perylene-d12). Both sets of mixture standards were supplied by Restek (Bellefonte, PA, USA). Surrogate PAHs fluorene-d10 (Flu-d10), fluoranthene-d10 (Flt-d10), pyrene-d10 (Pyr-d10) and benzo[a]pyrene-d12 (BaP-d12) were individually purchased from Sigma-Aldrich (San Luis, CA, USA). Solvents, HPLC grade, such as methylene chloride, acetone, and n-hexane, were purchased from Burdick and Jackson-Honeywell (Muskegon, Michigan, MI, USA).

2.2. Sampling of PM2.5 and Meteorological Conditions

The study was performed on the flat roof of the local health center (CEN), the roof of a government building (AGU), and the roof of one elementary school (Tlaquepaque) located in the Metropolitan Area of Guadalajara (MAG), Jalisco, Mexico, in 2014 (Figure 1). Sampling site are located mainly in urban zones and their selection was based on analysis of the historic dominant surface wind direction and speed in the MAG using the WRPlot Software. In the warm-dry season, from March to May, wind direction from CEN to TLA were predominantly observed; while on the rainy season–July to September– the surface wind direction were found from CEN to AGU. Those places also have atmospheric automatic monitoring stations run by the Jalisco State Government with validated historical registers of PM2.5, criteria pollutants (Table S1), and meteorological measurements, which were kindly supplied for this study.
During the warm-dry season, the total rainfall was 14.9 mm, the average temperature and relative humidity were 25 °C ranging from 19 °C to 33 °C and 48% ranging from 46% to 49%. While on rainy season, the total rainfall was 372.5 mm, the average temperature was 19 °C with a range from 24 °C to 31 °C and humidity relative was 74% and ranged from 72% to 76%.
The samples of PM2.5 were collected with a Partisol 2300 sampling (Rupprecht & Patashnick Co.; New York, NY, USA) at a flow rate of 16.7 L min-1 on quartz fiber filters 47 mm (Whatman). The PM2.5 were collected approximately every third day for 24 h, transported in a sealed petri dish, and stored until analysis at 4 °C. To collect a sufficient amount of sample to reach the detection threshold of the chemical analysis, duplicates were simultaneously taken for 24 h, and then the two filters were extracted together.

2.3. Analysis of Quinones in PM2.5

PAHs and quinones were extracted from PM2.5 filters twice using 30 mL of methylene chloride at 40 °C in an ultrasonic bath (Bransonic, Danbury, OH, USA) for 30 min [14]. The extraction was carried out in a flask that was fitted with a condenser to avoid volatilization of compounds [15]. The organic extract was concentrated almost to dryness in a rotary evaporator RV10 (IKA, Wilmington, CA, USA), then passed through a Teflon filter (0.44 μm) and adjusted to 0.1 mL. The concentrated extract was then analyzed by gas chromatographic (GC) 6890N (Agilent Technologies, San Francisco, CA, USA) and mass spectrometric (MS) 5975 (Agilent Technologies). The standards of calibration and sample solutions were injected (2 μL) automatically at 280 °C and separated through a capillary column HP5MS 30 m, 0.25 mm with a film thickness of 0.25 μm (Agilent Technologies; San Francisco, USA). An ultra-high purity (INFRA) helium (99.999%) was used as carrier gas at a flow rate of 1 mL min−1. The temperature program that was started in 40 °C and elevated at 20 °C min−1 to 110 °C, then at 5 °C min−1 to 300 °C, and finally increased at 20 °C min−1 to 310 °C (maintained for 10 min). The mass spectrums were obtained by electronic impact (70 EV) and quadrupole mass analyzer. The scan mode (40–500 uma) was used to obtain retention time and to select the m/z that was characteristic of each compound. The quantitation was carried out in SIM mode by calibration curves prepared by dilution of standards, ranging from 0.1–500 ng/mL, with correlation coefficients greater than 0.99, and detection limits between 0.002 ng/m3 (9,10-AQ) and 0.02 ng/m3 (9,10-PQ). The environmental concentrations in samples were corrected with blanks and averaged recoveries ± standard deviation based on the surrogate compounds were 43 ± 18 (1,4-NQ-d6), 55 ± 17 (Flu-d10), 79 ± 7 (Pyr-d10), 80 ± 9 (Flt-d10), 84 ± 19 (BaP-d12), to 96 ± 27 (AQ-d10).

2.4. Statistical and Trajectory Analysis

The Mann-Whitney U test was used to compare medians between sites and seasons. Spearman rank coefficient was used to obtain a correlation between the quinones with PM2.5, criteria atmospheric pollutants, and meteorological parameters. These tests were applied only when at least three records were obtained and validated. Principal component analysis (PCA) was applied to evaluate emissions sources for the whole period and for each site.
The origin of the air masses arriving at the receptor sites was evaluated using the National Oceanographic and Atmospheric Administration’s (NOAA) Hybrid Single Particle Langrangian Integrated Trajectory model (HYSPLIT4) [16]. Back trajectories were simulated using Global Data Assimilation System (GDAS) meteorological data, containing 3 hourly, 1 degree pressure level data for analysis and forecasting. Seventy-two-hour back trajectories were simulated every hour from 0:00 20/07/2014 to 23:00 15/09/2014 arriving at AGU site for the rainy season campaign and from 0:00 25/03/2014 to 23:00 30/05/2014 arriving at TLA site for the dry warm season campaign, at 10, 100, and 500 m air mass heights [17]. The cluster analysis of 456 hourly back trajectories—19 day × 24 h—arriving in the AGU area on rainy season and 480 hourly back trajectories—20 days × 24 h—arriving in the TLA area on warm-dry season was carried out on the sampling days for this study.

3. Results and Discussion

3.1. Quinones in PM2.5

3.1.1. Environmental Levels

In the entire study, seven quinones and their PAHs precursors were simultaneously determined in PM2.5 collected in the Guadalajara Metropolitan Area (Table 1). The most abundant quinone was 1,2-BQ accounting for 28.6% followed by 9,10-AQ (17.5%), 5,12-NQ (15.5%), 9,10-PQ (12.8%), 1,4-CQ (11.4%), 1,4-PQ (8.8%), and 1,4-NQ (5.7%). The individual environmental concentrations ranged from 0.01 ng m−3 (1,2-BQ) to 2.66 ng m−3 (9,10-PQ). The atmospheric concentrations found for 9,10-AQ are in the same order of magnitude than those already reported in an earlier studies in Guadalajara [18], while 1,4-NQ concentrations are almost three times higher than those found in Mexico City [19]. Overall, the majority of quinones have the same order of magnitude as those in Fresno, CA, USA, except for 5,12-NQ [20]. They are also similar to those found in Birmingham, UK, except for 9,10-PQ and 1,4-NQ [21,22], but concentrations of quinones in this work were higher than those reported in Santiago and Temuco, Chile [23], and in an Eastern coastal site in the UK [17].

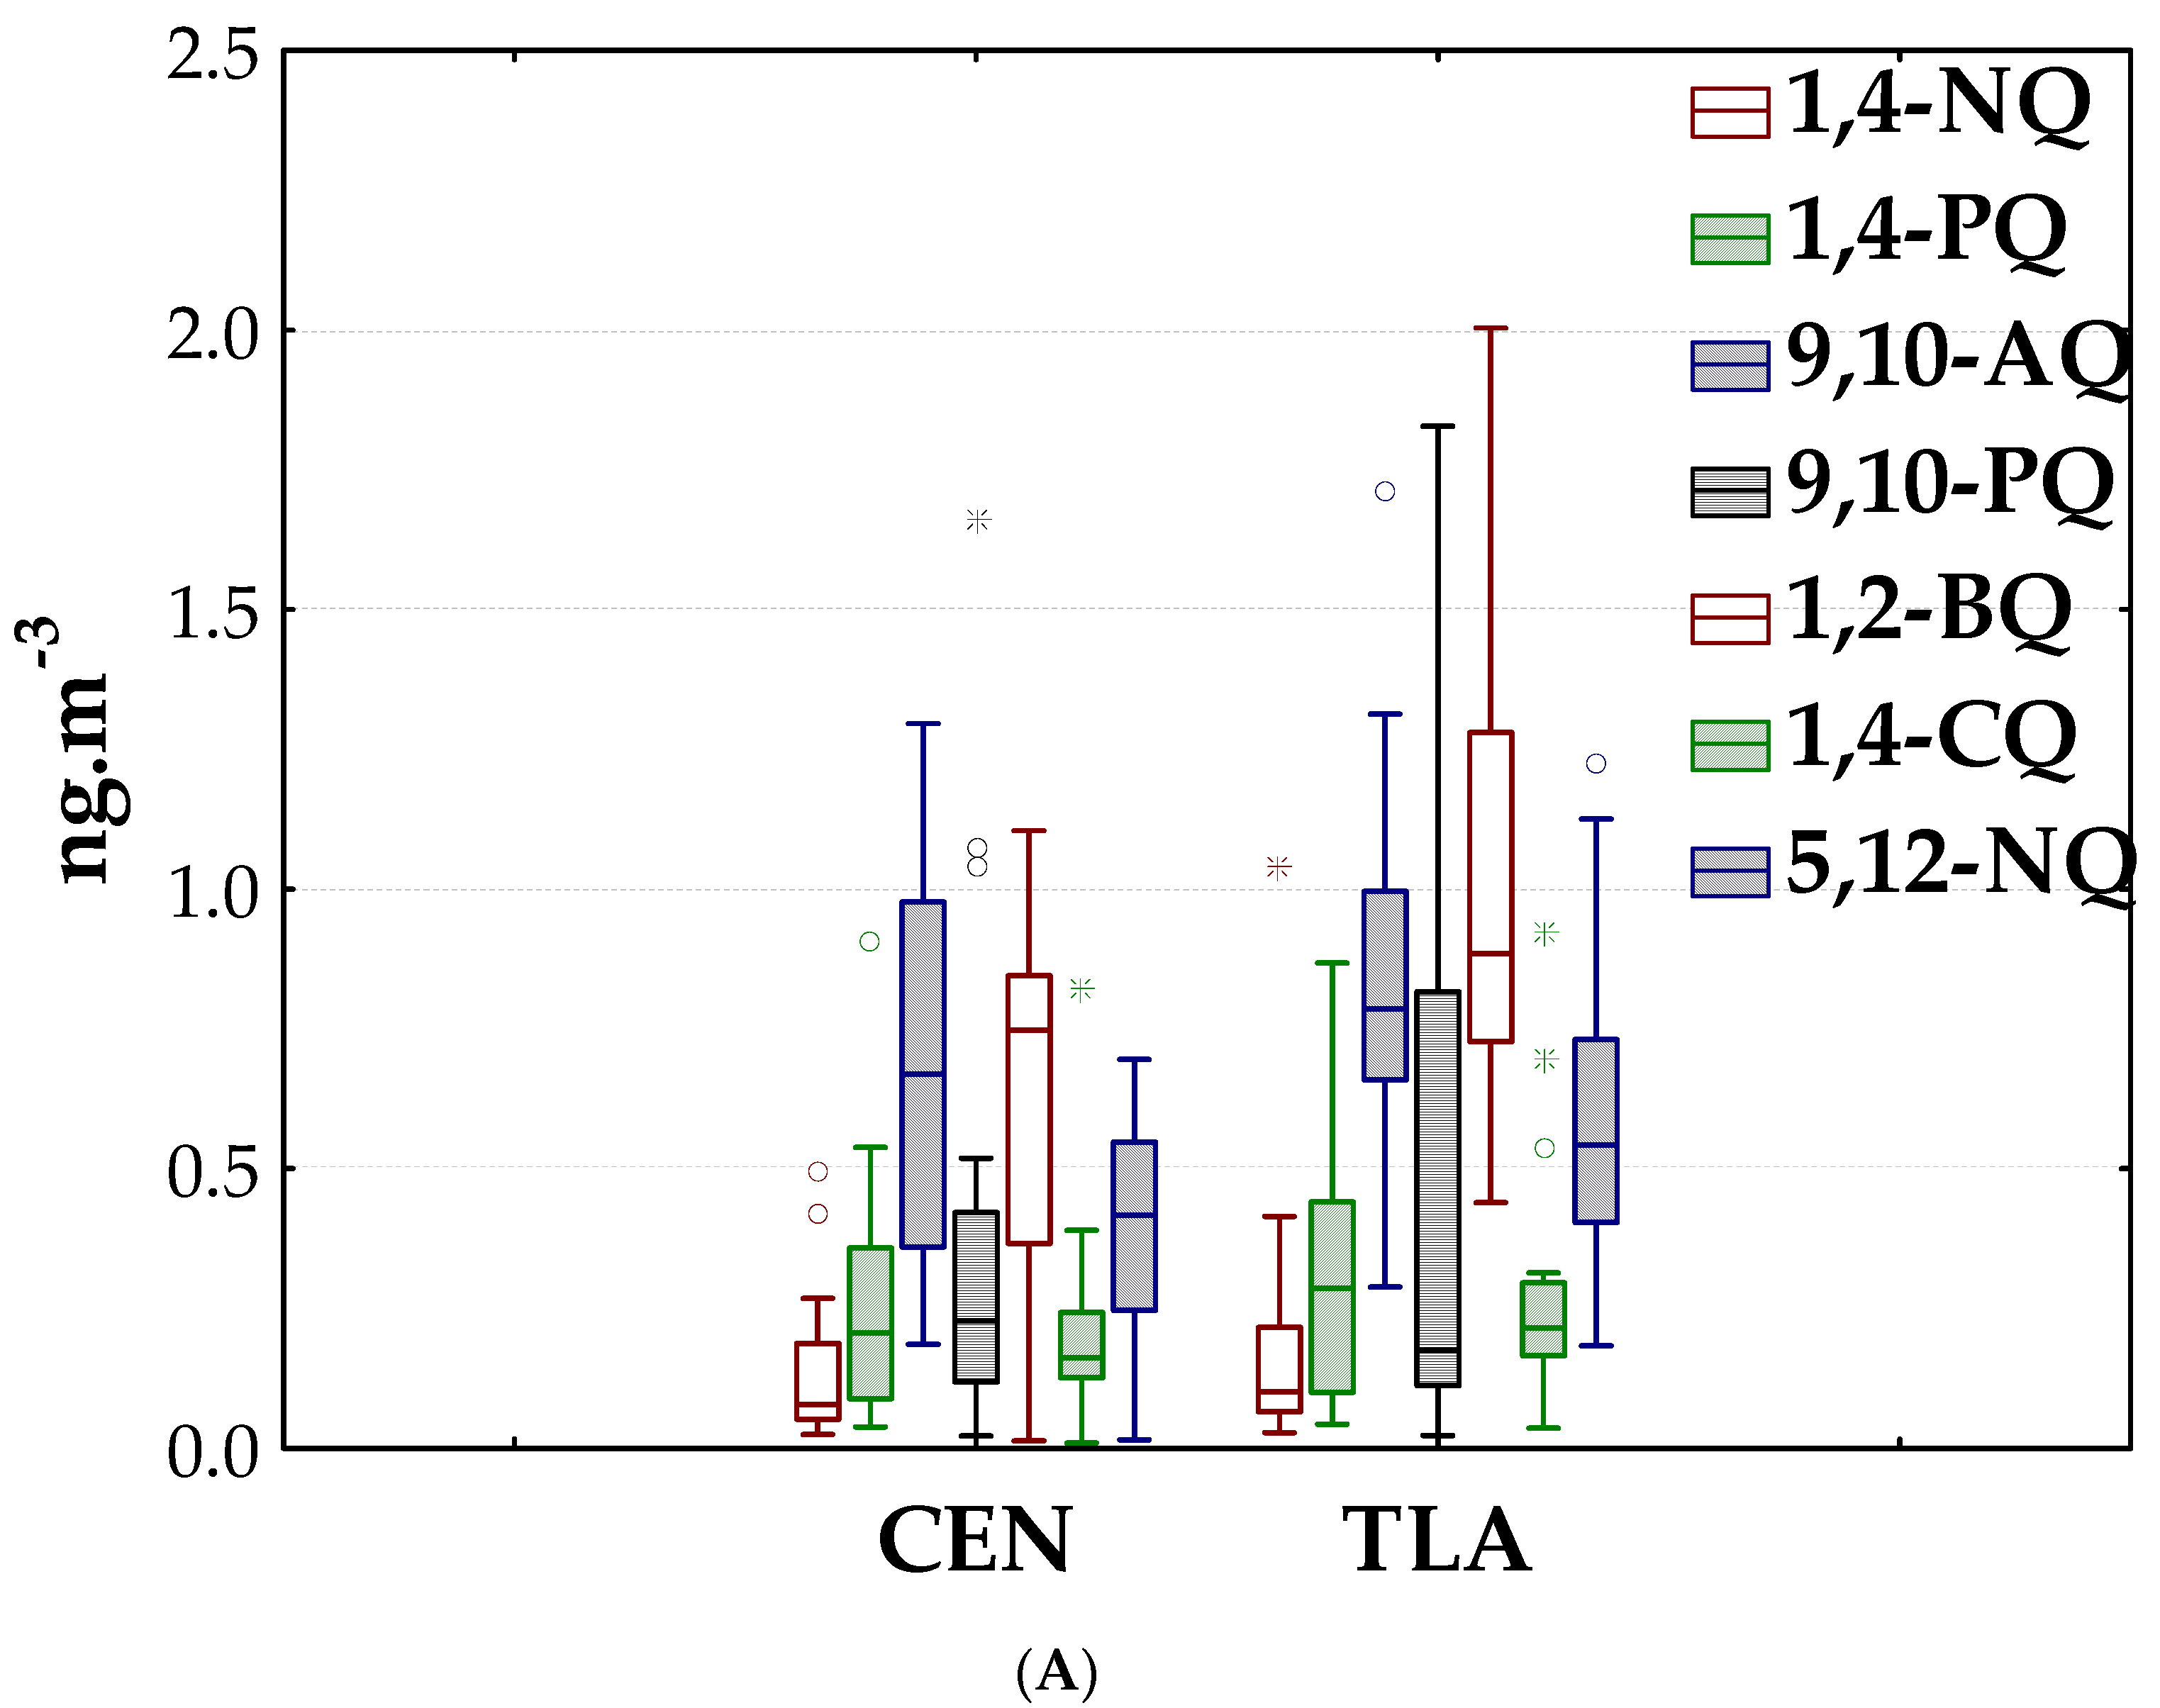
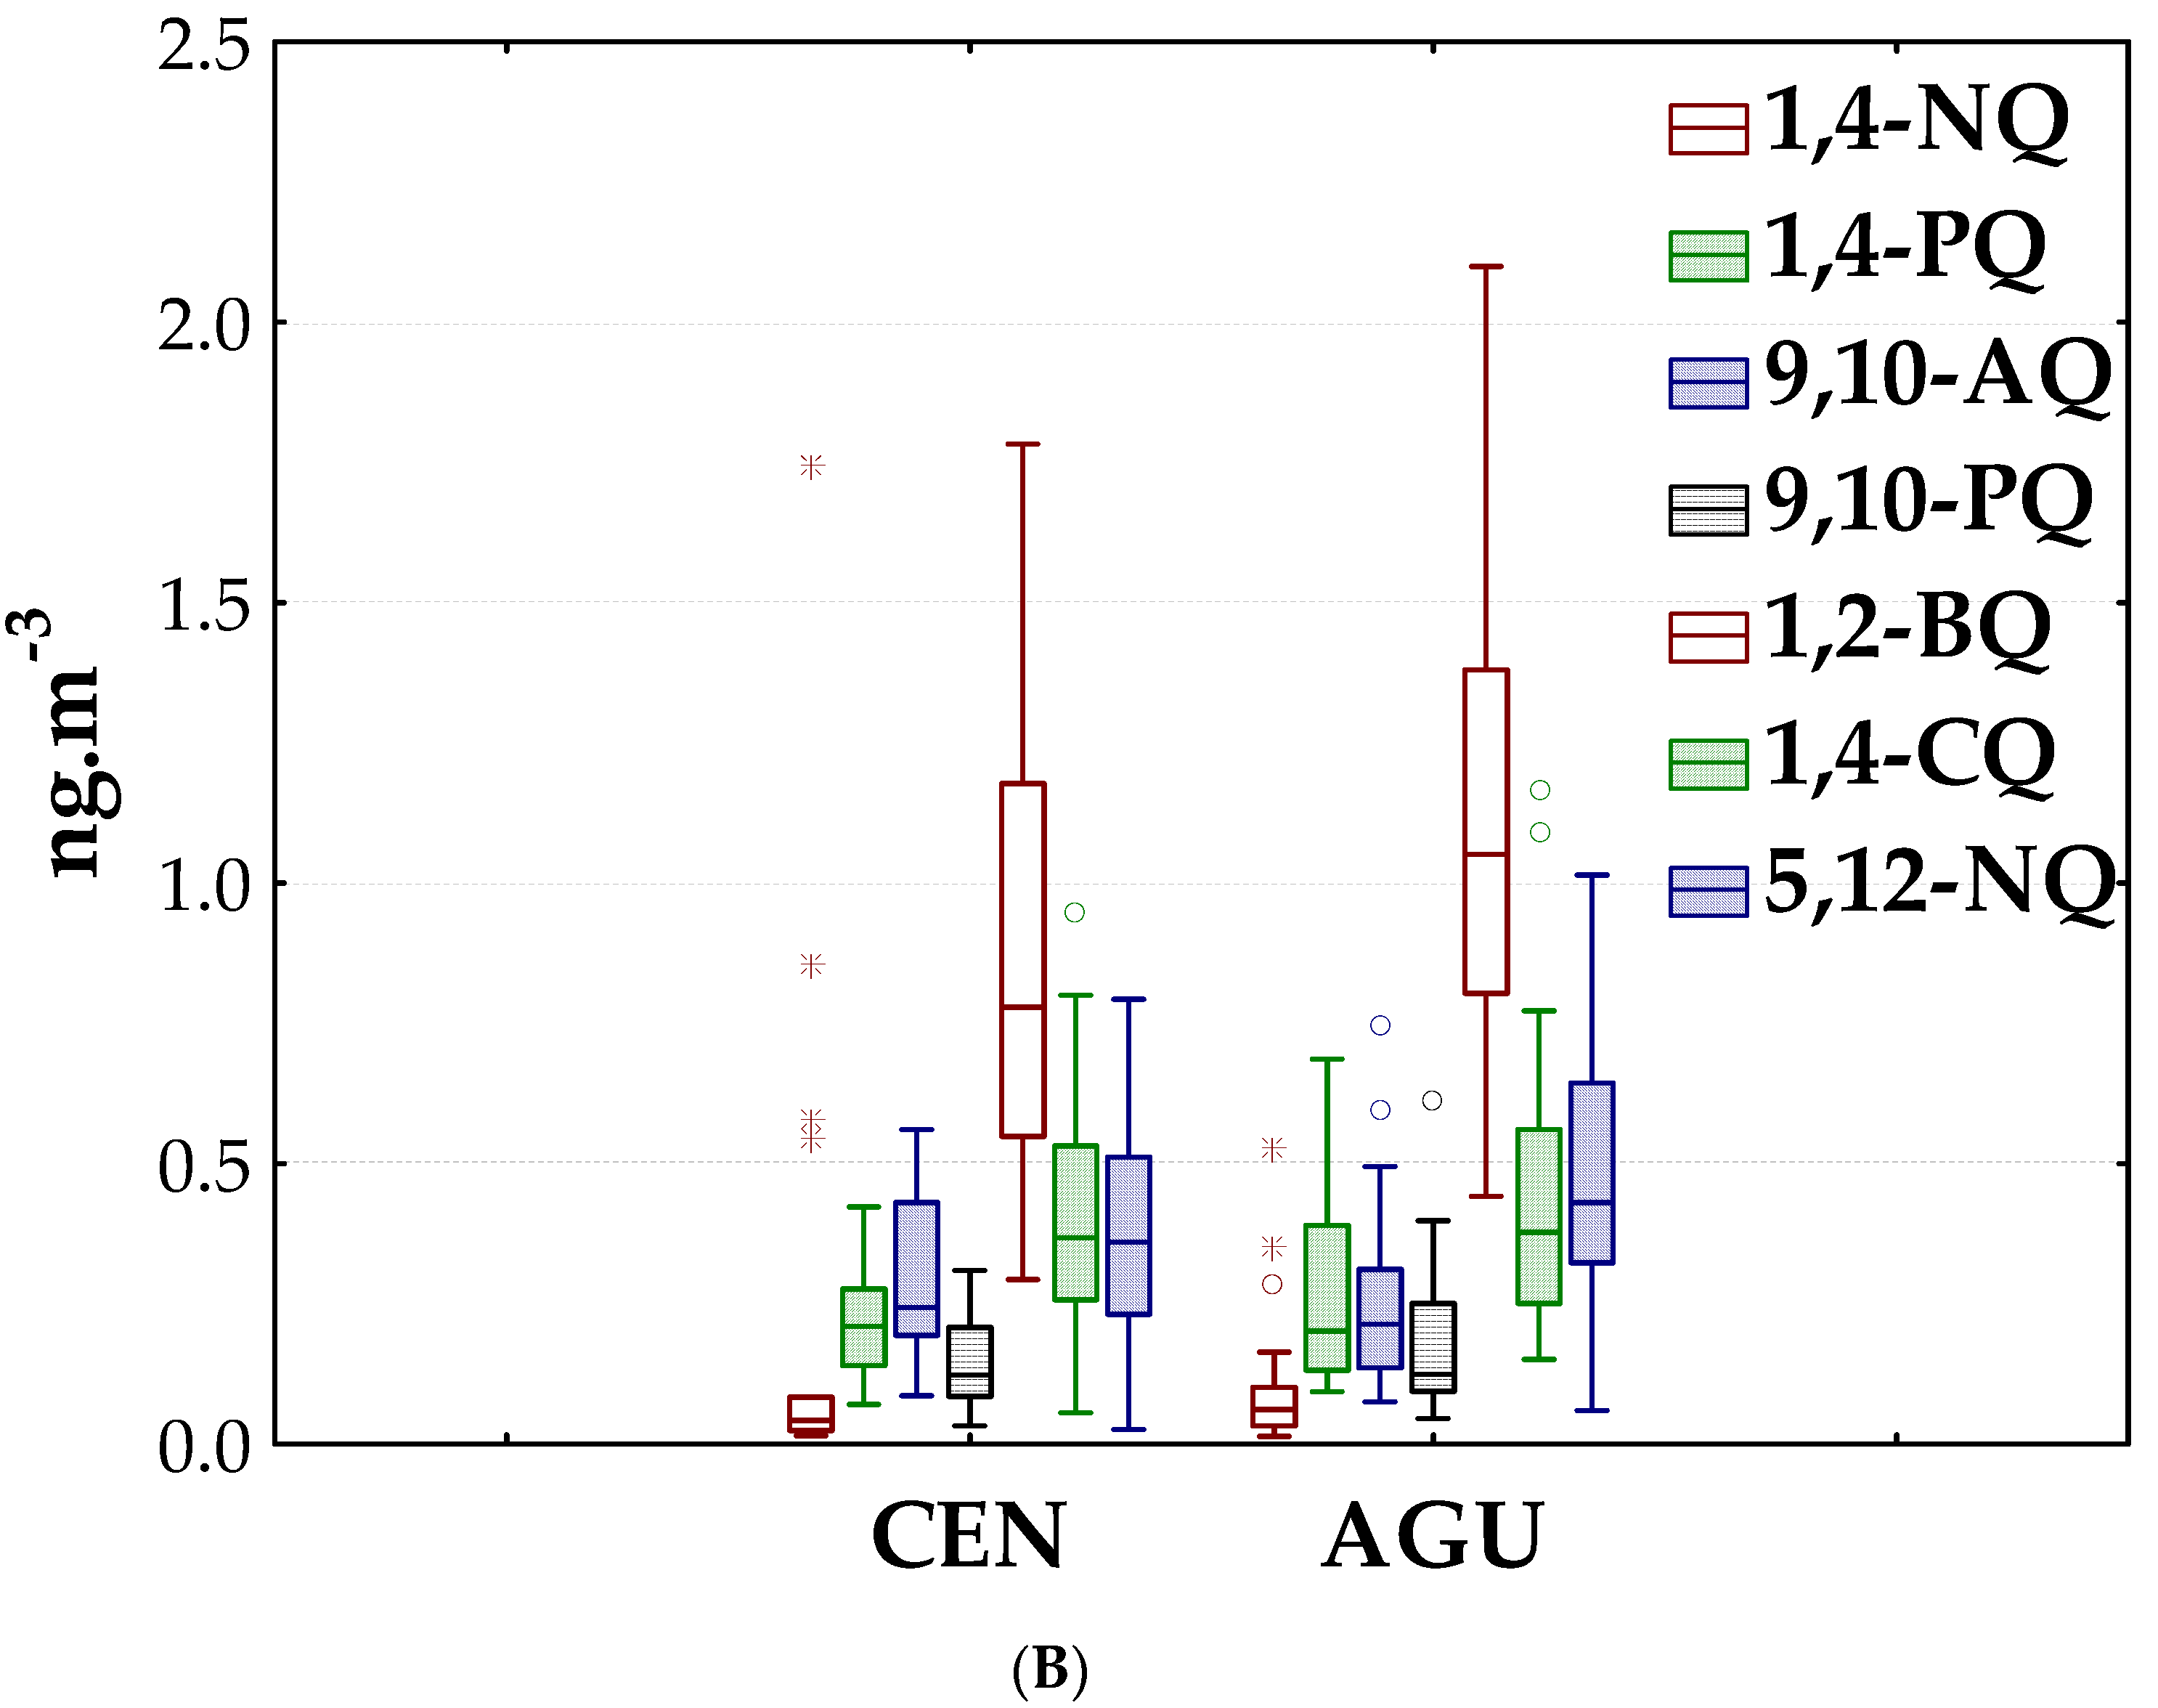
3.1.2. Spatial and Seasonal Patterns

The environment levels of both quinones and PAHs showed spatial variation during the warm-dry season. The atmospheric concentrations of quinones (Figure 2), MMW-, and HMW-PAHs in Tlaquepaque were higher than those determined in Centro (Table 1). The individual atmospheric concentrations in Tlaquepaque/Centro ratios ranged from 1.2 (9,10-AQ) to 1.5 (1,4-PQ) for quinones, while those for PAHs were from 1.25 (Phe) to 2.12 (BkF). On the contrary, the atmospheric concentrations of Nap, the 1,4-NQ’s precursor, were lower in Tlaquepaque than Centro. The highest atmospheric concentrations of both quinones and PAHs in Tlaquepaque are likely to have received an important contribution from fossil fuel combustion since that site is located close to streets with high vehicular traffic including heavy-duty vehicles. In fact, it has been suggested that BkF is a combustion derived PAH [24], while PAHs such as Flt, Pyr, and Chry are from diesel emissions, and IcdP and BghiP are frequently associated with emissions from gasoline vehicles [25].
Seasonal variation was also observed in Centro. Median concentrations of 9,10-AQ and 9,10-PQ were significantly lower (p < 0.05) in the rainy season than those found on the warm-dry season (Table 1), which is consistent with the negative correlation (−0.75 and −0.30) of those quinones with relative humidity (Table S2). On the contrary, medians of 1,4-CQ were increased with rainfall from 0.18 to 0.34 ng m−3 (Tabla 1). Kong and Ferry [26] reported that photochemical oxidation of Chry is favored with high humidity, which is consistent with the highest atmospheric concentration of 1,4-CQ in the rainy season. The reaction rate between O2 and Chry is also increased when the reaction takes place in a heterogeneous surface such as that on particulate matter [26].

3.2. Potential Sources of Quinones

3.2.1. Correlation with Criteria Atmospheric Pollutants

Overall, the significant correlation of 1,4-NQ (p < 0.01), 9,10-AQ (p < 0.01), and 9,10-PQ (p < 0.05) on PM2.5 with solar radiation (Table S2) indicate than they were likely to form via atmospheric reactions. The atmospheric formation of quinones would occur both in the warm-dry and rainy seasons [27], since the MAG is located in a region with high exposure to solar radiation [28,29]. In fact, it has been suggested that solar radiation could favor the direct photolysis of the parent PAHs —Nap, Ant, and Phe [11]. In addition to the influence of solar radiation on quinones, a significant correlation (p < 0.05) of 9,10-PQ with O3 was found in AGU (Table S5), which suggests its formation by a reaction of Phe with O3 either in the gas phase or directly on particulate matter with subsequent partition between both phases [30]. The atmospheric chemistry of quinones can also involve NOx: solar radiation contributes to the formation of NO2 by oxidation of NO [31] with photochemically formed and short-lived radicals such as O3 and O1D [32], and it is also oxidized to nitrate radical, which can attack parent PAHs [30]. The significant correlations found of 1,4-NQ, 9,10-AQ, 9,10-PQ, and 5,12-NQ in CEN (Table S3) and of 1,2-BQ and 5,12-NQ in AGU with NO2 (Table S5) could be mainly a result of the atmospheric reaction of precursors Nap, Ant, and Phe with nitrate radicals in the gas phase during the night, as has been previously suggested [30]. On the other hand, the quinones found in PM2.5 apparently had also a primary origin. The correlation of 1,4-NQ, 1,2-BQ, and 5,12-NQ in CEN (Table S3) and 1,2-BQ, 1,4-CQ, and 5,12-NQ in AGU (Table S5) with NO suggests an important contribution by combustion of gasoline and diesel to quinone concentrations in those sites. This was also found that 1,2-BQ, 1,4-CQ, and 5,12-NQ in AGU (Table S5) and TLA (Table S4) significantly correlated with CO, which indicate emissions of quinone particulate from either incomplete combustion of gasoline [33] or biomass burning [34]. In addition, the correlation of 9,10-AQ with SO2 in CEN (Table S3) shows the influence of motor vehicle emissions or coal combustion.

3.2.2. Analysis of Ratios of Quinone/Precursor

The individual ratios of quinone/PAHprecursor (Table 2) could provide evidence about the contribution of photochemical reactions to the occurrence of quinones on PM2.5 [35]. The higher the radiation, the greater the probability of photochemical degradation of PAHprecursor. The consequence is the increase of the ratio quinone/PAHprecursor. This analysis showed that the ratio 9,10-AQ/Ant median was higher from March to June (7.55–9.05)—the warm-dry season—than from July to September (3.45–4.25)—the rainy season—which suggest that anthracene was either photochemical excited [11] or could have undergone reactions with hydroxyl radicals, nitrate radicals, and ozone and subsequently be oxidized to 9,10-AQ [30].

3.2.3. Principal Component Analysis (PCA)

To further identify sources of quinones, a PCA was conducted on the data obtained in each site (Table 3). Concentrations of individual quinones were entered as variables in the PCA, whereas the 16 PAHs were grouped according to their molecular weight as follows: lower molecular weight (LMW) PAHs containing 2- and 3-ring PAHs, middle molecular weight (MMW) PAHs containing 4-ring PAHs and higher molecular weight (HMW) PAHs containing 5-, 6-, and 7-ring PAHs. For Centro, PC1 was highly loaded with PAHs. Since these compounds are primarily associated with gasoline and diesel use in motor vehicles in urban areas [36], the first component could be attributed to emissions by mobile sources mainly due to vehicular traffic fueled with gasoline. PC2 showed that 1,4-CQ and 1,2-BQ share a similar profile, which might involve reactions linked to photochemical processes in the atmosphere. It has previously been suggested that complex heterogeneous reactions in aqueous and particulate phases involving Chry and O3 are routes for the formation of 1,4-CQ [26]. However, the significant spearman correlation of 1,2-BQ with NO (Table S3) also indicate that this component might be linked to primary emission by local sources [37]. On the other hand, PC3 showed a strong correlation with 1,4-PQ and 9,10-PQ (Table 3). These two quinones are formed either in the gas phase, involving reaction of phenanthrene directly with oxygenated secondary species like O3, HO•, and NO3 [38], or they are emitted by the incomplete combustion of fossil fuel [39], particularly diesel [40]. A diesel source is consistent with the intensity and type of vehicular traffic at the sampling site in Centro, which is mainly constituted by heavy-duty vehicles employed for passenger transport [41]. The significant spearman anti-correlation found of 1,4-NQ with NO and the direct correlation of 9,10-PQ with NO2 (Table S3) suggest that the occurrence of those quinones in CEN is due to a more aged profile, which could be associated with other factor distinct to local and primary sources, such a chemical and photochemical transformation in the atmosphere [38].
For TLA site, PC1 was also highly loaded with MMW and HMW PAHs and 1,2-BQ (Table 3). These PAHs compounds are frequently associated with combustion sources in urban areas, mainly by vehicles [42]. Unlike CEN site, for PC2 in TLA, this component was significantly loaded with 1,4-NQ and LMW PAHs. Since, LMW-PAHs are formed mainly by incomplete combustion in stationary sources, PC2 might be attributed to biomass burning and coal combustion, as well as emissions through industrial processes [24,25,43]. On the other hand, PC3 had the highest correlation with 1,4-NQ and 9,10-PQ, which had been mainly related with photochemical formation on the atmosphere. In addition, 1,4-NQ was significantly anti-correlated with ozone (Table S4), suggesting reaction with their precursors. Therefore, PC3 might be associated with atmospheric reactions with air mass containing Nap. This is in accordance with the highest ratio 1,4-NQ/Nap found in TLA (Table 2) and the dominant surface wind direction during the sampling days, which comes predominantly from those areas and streets located to the southwest (Figure 3a). This monitoring site is located approximately 2 km North of a trafficked street that connects MAG to the airport and the industrial sector El Salto, and approximately to 200 m East of one of the main streets of the municipality of Tlaquepaque.
The PCA in AGU (Table 3) showed that PC1 strongly correlated with two quinones (1,4-PQ and 9,10-AQ) and HMW PAHs (BbF, BaP, IcdP, DBahA, and BghiP). Therefore, this component can be associated mainly with vehicular emissions. PC2 showed that the highest load was due to 1,2-BQ, 1,4-CQ and MMW PAHs (Flt, Pyr, and Chry). This could be indicative of a probable association of this component with fuel combustion, gasoline, and diesel [39], as well as wood and coal burning [44]. This site is located near a street with significant vehicular flow of light and heavy vehicles connecting the motorways to the south of the city. The frequency of winds coming from the southwest of this site, where several handmade brick factories are located, could explain the contribution from biomass burning (Figure 3b). PC3 was loaded with 9,10-PQ and was attributed to atmospheric formation due to the significantly anti-correlation with NO (Table S5), indicating formation by other factors distinct from local primary emission sources [37].

3.3. Photochemical Formation of Quinones

In order to estimate formation of quinones via photochemical reactions, we used a similar reason proposed by Eiguren-Fernandez [13]. Then, the percentage of photochemically formed 9,10-PQ was calculated as,
= 100 [ ( BghiP 9 , 10 PQ ) T L A   o   A G U X   100 ( BghiP 9 , 10 PQ ) C E N ]
If 9,10-PQ is not photochemically formed, the concentration ratio of BghiP to 9,10-PQ will be constant across of MAG. BghiP was selected for estimation because it is a marker of vehicular emissions and does not undergo photochemical transformation: its environmental levels are only affected by dilution as the air parcel moves from CEN toward TLA and AGU.
The contribution by photochemical formation was then calculated for each day in AGU and TLA site (Table S6 and S7). To corroborate contribution of precursor, a cluster analysis of hourly back trajectories arriving in those sites was run (Figure 4). In the rainy season in AGU, the percentages of photochemically formed 9,10-PQ were the lowest (18 to 68%) and occurred over 10 days (Table S6). In spite of this, AGU had more days during which 9,10-PQ photochemically formed{ it was found that was observed that the 24 hourly back trajectories arriving in AGU from those area occurred only on 29 July (Table S6). On the contrary, in the warm-dry season, the photochemical contribution to 9,10-PQ was only found for four days: the formation percentages of 9,10-PQ ranged from 18% to 97% (Table S7). Those days with the highest estimated 9,10-PQ photochemical production 97% (27 April) and 92% (3 April) were also those with the largest number of hourly back-trajectories (24), arriving in TLA from the West-Northwest, the location of the CEN site and downtown MAG (red trajectory in Figure 4B). Therefore, the percentage of formation of 9,10-PQ in MAG was highly favored during the longest periods without flow solar interruption, as those occurred in the warm-dry season and when the transport of 9,10-PQ’s precursor arrived in AGU and TLA from the CEN area. There is another distinct area, which apparently contributes precursors to the formation of 9,10-PQs in AGU and TLA. However, we need to know the atmospheric concentration of precursors in that area to demonstrate this hypothesis.

4. Conclusions

This study showed that the atmospheric formation of quinones was highly favored when the air parcel containing PAH precursors was exposed to the longest period of solar radiation without interruption, which occurred during the warm-dry season. Over the rainy season, this was attenuated by an increase in rainfall, but was observed more frequently, which suggests that photochemical oxidation of higher molecular weight PAHs on particulate matter can also become favored by high humidity, as was proposed for 1,4-CQ from its parent chrysene. On the other hand, it can be suggested that those PAHs precursors containing 2- and 3- ring Nap, Ant, and Phe underwent either transformation by direct photolysis or reaction with ozone in the particle phase, since quinones had a significant correlation (p < 0.05) with radiation and O3. However, the correlation with NO2 indicated that they could react with nitrate radicals at night in the gas phase when they were partitioned. The correlation of 9,10-AQ with NO2 and the higher ratio of 9,10-AQ to parent in the warm-dry season compared to that in the rainy season in CEN support a possible formation by the attack of nitrate radical on Ant. The photochemical transformation of Phe in the air parcel was more strongly supported: it was found that the highest percentage of photochemically formed 9,10-PQ corresponded with those days with the largest number of hourly back trajectories (24) arriving in AGU and TLA. Indeed, photochemical reactions had a highlighted role on the formation of quinones from Phe and Ant. However, correlations with criteria pollutants and PCA showed that incomplete combustion and fossil fuel are also important sources of those compounds.

Supplementary Materials

The following are available online at www.mdpi.com/2073-4433/8/8/140/s1, Table S1: Concentrations of criteria atmospheric pollutants (ppm), Table S2: Quinone correlation with meteorological parameter for the full database, Table S3: Quinone correlation with PM2.5 and criteria pollutants at Centro for both seasons, Table S4: Quinone correlation with PM2.5 and criteria pollutants at Tlaquepaque, Table S5: Quinone correlation with PM2.5 and criteria pollutants at Las Águilas, Table S6: Number of hourly trajectories assigned to each cluster by day during the rainy season and percentage of 9,10-PQ photochemically formed in AGU site, and Table S7: Number of hourly trajectories assigned to each cluster by day during the dry-warm season and percentage of 9,10-PQ photochemically formed in TLA site.

Acknowledgments

The author would like to thank the Consejo Nacional de Ciencia y Tecnología-CONACYT (Grant number 183444).

Author Contributions

A.B.-G. conducted the literature research, analyzed the data, performed the experiments and was involved in drafting of the manuscript; M.A.M.-T. conceived and designed the study and wrote the main part of paper; J.D.J.D.-T. contributed to sampling design and validation of meteorological parameters; L.H.-M. performed sampling and contributed to statistical analysis; H.S.-N. advised chemical and statistical analysis; J.M.D.-S. contributed to interpretation and analysis of results; A.L.-L. (R.I.P) contributed to conceive the idea of study. All authors contributed to shaping the content of the paper during the revisions. All authors have read and approved the final manuscript.

Conflicts of Interest

The authors declare no conflict of interest.

References

  1. Kappos, A.D.; Bruckmann, P.; Eikmann, T.; Englert, N.; Heinrich, U.; Hoppe, P.; Koch, E.; Krause, G.H.; Kreyling, W.G.; Rauchfuss, K.; et al. Health effects of particles in ambient air. Int. J. Hyg. Environ. Health 2004, 207, 399–407. [Google Scholar] [CrossRef] [PubMed]
  2. Englert, N. Fine particles and human health—A review of epidemiological studies. Toxicol. Lett. 2004, 149, 235–242. [Google Scholar] [CrossRef] [PubMed]
  3. De Kok, T.M.C.M.; Driece, H.A.L.; Hogervorst, J.G.F.; Briedé, J.J. Toxicological assessment of ambient and traffic-related particulate matter: A review of recent studies. Mutat. Res. 2006, 613, 103–122. [Google Scholar] [CrossRef] [PubMed]
  4. Pedersen, D.U.; Durant, J.L.; Penman, B.W.; Crespi, C.L.; Hemond, H.F.; Lafleur, A.L.; Cass, G.R. Human-cell mutagens in respirable airborne particles in the Northeastern United States. 1. Mutagenicity of fractionated samples. Environ. Sci. Technol. 2004, 38, 682–689. [Google Scholar] [CrossRef]
  5. Pedersen, D.U.; Durant, J.L.; Taghizadeh, K.; Hemond, H.F.; Lafleur, A.L.; Cass, G.R. Human cell mutagens in respirable airborne particles from the Northeastern United States. 2. Quantification of mutagens and other organic compounds. Environ. Sci. Technol. 2005, 39, 9547–9560. [Google Scholar] [CrossRef] [PubMed]
  6. Bolton, J.L.; Trush, M.A.; Penning, T.M.; Dryhurst, G.; Monks, T.J. Role of Quinones in Toxicology. Chem. Res. Toxicol. 2000, 13, 135–160. [Google Scholar] [CrossRef] [PubMed]
  7. Knecht, A.L.; Goodale, B.C.; Truong, L.; Simonich, M.T.; Swanson, A.J.; Matzke, M.M.; Anderson, K.A.; Waters, K.M.; Tanguay, R.L. Comparative developmental toxicity of environmentally relevant oxygenated PAHs. Toxicol. Appl. Pharm. 2013, 271, 266–275. [Google Scholar] [CrossRef] [PubMed]
  8. Hiyoshi, K.; Talkano, H.; Inoue, K.I.; Ichinose, T.; Yanaqisawa, R.; Tomura, S.; Kumagai, Y. Effects of phenanthraquinone on allergic airway inflammation in mice. Clin. Exp. Allergy 2005, 35, 1243–1248. [Google Scholar] [PubMed]
  9. Zielinska, B.; Sagebiel, J.; McDonald, J.D.; Whitney, K.; Lawson, D.R. Emission rates and comparative chemical composition from selected in-use diesel and gasoline-fueled vehicles. J. Air Waste Manage 2004, 54, 1138–1150. [Google Scholar] [CrossRef]
  10. Walgraeve, C.; Demeestere, K.; Dewulf, J.; Zimmermann, R.; van Langenhove, H. Oxygenated polycyclic aromatic hydrocarbons in atmospheric particulate matter: Molecular characterization and occurrence. Atmos. Environ. 2010, 44, 1831–1846. [Google Scholar]
  11. Vione, D.; Maurino, V.; Minero, C.; Pelizzetti, E.; Harrison, M.A.J.; Olariu, R.I.; Arsene, C. Photochemical reactions in the tropospheric aqueous phase and on particulate matter. Chem. Soc. Rev. 2006, 35, 441–453. [Google Scholar] [CrossRef] [PubMed]
  12. Wang, L.; Atkinson, R.; Arey, J. Formation of 9,10-phenanthrenequinone by atmospheric gas-phase reactions of phenanthrene. Atmos. Environ. 2007, 41, 2025–2035. [Google Scholar] [CrossRef]
  13. Eiguren-Fernandez, A.; Miguel, A.H.; Lu, R.; Purvis, K.; Grant, B.; Mayo, P.; Di Stefano, E.; Cho, A.K.; Froines, J. Atmospheric formation of 9,10-phenanthraquinone in the Los Angeles air basin. Atmos. Environ. 2008, 42, 2312–2319. [Google Scholar] [CrossRef]
  14. Murillo-Tovar, M.A. Desempeño de cromatografía de gases con espectrometría de masas (CGEM) por monitoreo selectivo de iones (SIM) para el análisis de oxi-HAP en partículas respirables finas (PM2.5). In Proceedings of the XXVIII Congreso Nacional de Química Analítica y el XVIII Simposio Estudiantil, Ixtapa-Guerrero, México, 27 June 2015. [Google Scholar]
  15. Valle-Hernández, B.L.; Múgica-Álvarez, V.; Salinas-Talavera, E.; Amador-Muñoz, O.; Murillo-Tovar, M.A.; Villalobos-Pietrini, R.; De Vizcaya-Ruíz, A. Temporal variation of nitro-polycyclic aromatic hydrocarbons in PM10 and PM2.5 collected in Northern Mexico City. Sci. Total Environ. 2010, 408, 5429–5438. [Google Scholar] [CrossRef] [PubMed]
  16. Draxler, R.R.; Rolph, G.D. HYSPLIT—Hybrid Single-Particle Lagrangian Integrated Trajectory Model. Available online: http://www.arl.noaa.gov/HYSPLIT.php (accessed on 11 April 2017).
  17. Alam, M.S.; Delgado-Saborit, J.M.; Stark, C.; Harrison, R.M. Investigating PAH relative reactivity using congener profiles, quinone measurements and back trajectories. Atmos. Chem. Phys. 2014, 14, 2467–2477. [Google Scholar] [CrossRef]
  18. Flores Arriola, A. Determinación de Hidrocarburos Aromáticos Policíclicos Oxigenados en las Aeropartículas finas de la Zona Metropolitana de Guadalajara. Ph.D. Thesis, Universidad Autónoma de Guadalajara, Guadalajara, Jalisco, Mexico, April 2012. [Google Scholar]
  19. Murillo Tovar, M. A. Optimización de las condiciones analíticas para la determinación simultánea de n-alcanos, hidrocarburos aromáticos policíclicos y sus derivados oxigenados en las aeropartículas <2.5 μm. Ph.D. Thesis, Universidad Nacional Autónoma de México, Ciudad de México, Mexico, March 2012. [Google Scholar]
  20. Chung, M.; Lazaro, R.; Lim, D.; Jackson, J.; Lyon, J.; Rendulic, D.; Hasson, A. Aerosol-Borne Quinones and Reactive Oxygen Species Generation by Particulate Matter Extracts. Environ. Sci. Technol. 2006, 40, 4880–4886. [Google Scholar] [CrossRef] [PubMed]
  21. Delgado-Saborit, J.; Alam, M.; Godri Pollit, K.; Stark, C.; Harrison, R. Analysis of atmospheric concentrations of quinones and polycyclic aromatic hydrocarbons in vapour and particulate phases. Atmos. Environ. 2013, 77, 974–982. [Google Scholar] [CrossRef]
  22. Alam, M.S.; Delgado-Saborit, J.M.; Stark, C.; Harrison, R.M. Using atmospheric measurements of PAH and quinone compounds at roadside and urban background sites to assess sources and reactivity. Atmos. Environ. 2013, 77, 24–35. [Google Scholar] [CrossRef]
  23. Tsapakis, M.; Lagoudaki, E.; Stephanou, E.; Kavouras, I.; Koutrakis, P.; Oyola, P.; von Baer, D. The composition and sources of PM2.5 organic aerosol in two urban areas of Chile. Atmos. Environ. 2002, 36, 3851–3863. [Google Scholar] [CrossRef]
  24. Kong, S.; Li, X.; Li, L.; Yin, Y.; Chen, K.; Yuan, L.; Zhang, Y.; Shan, Y.; Ji, Y. Variation of polycyclic aromatic hydrocarbons in atmospheric PM2.5 during winter haze period around 2014 Chinese Spring Festival at Nanjing: Insights of source changes, air mass direction and firework particle injection. Sci. Total Environ. 2015, 520, 59–72. [Google Scholar] [CrossRef] [PubMed]
  25. Wu, D.; Wang, Z.; Chen, J.; Kong, S.; Fu, X.; Deng, H.; Shao, G.; Wu, G. Polycyclic aromatic hydrocarbons (PAHs) in atmospheric PM2.5 and PM10 at a coal-based industrial city: Implication for PAH control at industrial agglomeration regions, China. Atmos. Res. 2014, 149, 217–229. [Google Scholar] [CrossRef]
  26. Kong, L.; Ferry, J. Photochemical oxidation of chrysene at the silica gel-water interface. J. Photoch. Photobio. A 2004, 162, 415–421. [Google Scholar] [CrossRef]
  27. Díaz-Torres, J.J.; Hernández-Mena, L.; Murillo-Tovar, M.A.; León-Becerril, E.; López-López, A.; Suárez-Plascencia, C.; Aviña-Rodríguez, E.; Barradas-Gimate, A.; Ojeda-Castillo, V. Assessment of the modulation effect of rainfall on the solar radiation availability at the earth’s surface. Meteorol. Appl. 2017, 24, 180–190. [Google Scholar] [CrossRef]
  28. Almanza, R.; Lopez, S. Total solar radiation in Mexico using sunshine hours and meteorological data. Sol. Energy 1978, 21, 441–448. [Google Scholar] [CrossRef]
  29. Galindo, I.; Castro, S.; Valdés, M. Satellite derived solar irradiance over Mexico. Atmosfera 1991, 4, 189–200. [Google Scholar]
  30. Vione, D.; Barra, S.; De Gennaro, G.; De Rienzo, M.; Gilardoni, S.; Perrone, M.G.; Pozzoli, L. Polycyclic aromatic hydrocarbons in the atmosphere: monitoring sources, sinks and fate. II: Sinks and fate. Ann. Chim. 2004, 94, 257–268. [Google Scholar] [CrossRef] [PubMed]
  31. Finlayson-Pitts, B.J.; Pitts, J.N., Jr. Chemistry of the upper and lower atmosphere; Academic Press: New York, NY, USA, 2000; p. 265. [Google Scholar]
  32. Liang, J. Radiation in the atmosphere. In Chemical Modeling for Air Resources; Academic Press: Boston, USA, 2013; pp. 43–63. [Google Scholar]
  33. Fernández-Bremauntz, A.A.; Ashmore, M.R. Exposure of commuters to carbon monoxide in Mexico City—I. Measurement of in-vehicle concentrations. Atmos. Environ. 1995, 29, 525–532. [Google Scholar] [CrossRef]
  34. Crutzen, P.J.; Andreae, M.O. Biomass burning in the tropics: impact on atmospheric chemistry and biogeochemical cycles. Science 1990, 250, 1669–1678. [Google Scholar] [CrossRef]
  35. Reisen, F.; Arey, J. Atmospheric reactions influence seasonal PAH and nitro-PAH concentrations in the Los Angeles basin. Environ. Sci. Technol. 2005, 39, 64–73. [Google Scholar] [CrossRef] [PubMed]
  36. Ravindra, K.; Bencs, L.; Wauters, E.; Hoog, J.; Deutsch, F.; Roekens, E.; Bleux, N.; Berghmans, P.; Grieken, R. Seasonal and site-specific variation in vapour and aerosol phase PAHs over Flanders (Belgium) and their relation with anthropogenic activities. Atmos. Environ. 2006, 40, 771–785. [Google Scholar] [CrossRef]
  37. Wang, W.; Jariyasopit, N.; Schrlau, J.S.; Jia, Y.; Tao, S.; Yu, T.W.; Dashwood, R.H.; Zhang, W.; Wang, X.; Massey-Simonich, S. Concentration and Photochemistry of PAHs, NPAHs and OPAHs and Toxicity of PM2.5 during the Beijing Olympic Games. Environ. Sci. Technol. 2011, 45, 6887–6895. [Google Scholar] [CrossRef] [PubMed]
  38. Kishikawa, N.; Nakao, M.; Ohba, Y.; Nakashima, K.; Kuroda, N. Concentration and trend of 9,10-phenanthrenequinone in airborne particulates collected in Nagasaki city, Japan. Chemosphere 2006, 64, 834–838. [Google Scholar] [CrossRef] [PubMed]
  39. Fang, G.; Chang, C.; Wu, Y.; Fu, P.; Yang, L.; Chen, M. Characterization, identification of ambient air and road dust polycyclic aromatic hydrocarbons in Central Taiwan Taichung. Sci. Total Environ. 2004, 327, 135–146. [Google Scholar] [CrossRef] [PubMed]
  40. Cho, A.K.; Di Stefano, E.; You, Y.; Rodriguez, C.E.; Schmitz, D.A.; Kumagai, Y.; Miguel, A.H.; Eiguren-Fernandez, A.; Kobayashi, T.; Avol, E.; et al. Determination of Four Quinones in Diesel Exhaust Particles, SRM 1649a, and Atmospheric PM2.5. Aerosol Sci. Technol. 2004, 38, 68–81. [Google Scholar] [CrossRef]
  41. Murillo-Tovar, M.A.; Saldarriaga-Noreña, H.; Hernández-Mena, L.; Campos-Ramos, A.; Cárdenas-González, B.; Ospina-Noreña, J.E.; Cosío-Ramírez, R.; Díaz-Torres, J.J.; Smith, W. Potential Sources of Trace Metals and Ionic Species in PM2.5 in Guadalajara, Mexico: A Case Study during Dry Season. Atmosphere 2015, 6, 1858–1870. [Google Scholar] [CrossRef]
  42. Li, X.; Kong, S.; Yin, Y.; Li, L.; Yuan, L.; Li, Q.; Xiao, H.; Chen, K. Polycyclic aromatic hydrocarbons (PAHs) in atmospheric PM2.5 around 2013 Asian Youth Games period in Nanjing. Atmos. Res. 2016, 174, 85–86. [Google Scholar] [CrossRef]
  43. Larsen, R.K.; Baker, J.E. Source apportionment of polycyclic aromatic hydrocarbons in the urban atmosphere: A comparison of three methods. Environ. Sci. Technol. 2003, 37, 1873–1881. [Google Scholar] [CrossRef] [PubMed]
  44. Wang, X.F.; Cheng, H.X.; Xu, X.B.; Zhuang, G.M.; Zhao, C.D. A wintertime study of polycyclic aromatic hydrocarbons in PM2.5 and PM2.5–10 in Beijing: assessment of energy structure conversion. J. Hazard Mater. 2008, 157, 47–56. [Google Scholar] [CrossRef] [PubMed]
Figure 1. Tlaquepaque and Las Águilas located southeast and southwest, respectively, to Centro.
Atmosphere 08 00140 g001
Figure 2. Seasonal and spatial median concentrations (middle line); extreme values (∗), outliers (◦), boxes 25–75% and whiskers 10th–90th percentiles of the quinones in PM2.5 on Warm-Dry season (A) and Rainy season (B).
Atmosphere 08 00140 g002aAtmosphere 08 00140 g002b
Figure 3. Wind roses during the study period in (A) Tlaquepaque and (B) Las Águilas.
Atmosphere 08 00140 g003
Figure 4. Cluster analysis of 456 hourly back trajectories arriving in the AGU area in the rainy season (A) and 480 hourly back trajectories arriving in the TLA area in the warm-dry season (B).
Atmosphere 08 00140 g004
Table 1. Quinones (QNs) and polycyclic aromatic hydrocarbons (PAHs) atmospheric concentrations (ng m−3) in PM2.5 in Metropolitan Area Guadalajara (Mexico).
Centro TlaquepaqueÁguilas
Warm-dry season (n = 16)Rainy season (n = 18)Warm-dry season (n = 20)Rainy season (n = 19)
QuinonesMean ± SDMedian(10–90th)Mean ± SDMedian(10–90th)Mean ± SDMedian(10–90th)Mean ± SDMedian(10–90th)
1,4-NQ0.15 ± 0.160.08(0.04–0.43)0.24 ± 0.460.04(0.02–0.66)0.17 ± 0.200.10(0.04–0.31)0.10 ± 0.140.05(0.02–0.26)
1,4-PQ0.28 ± 0.250.20(0.06–0.53)0.21 ± 0.120.18(0.10–0.38)0.33 ± 0.260.29(0.04–0.68)0.22 ± 0.160.17(0.09–0.44)
9,10-AQ0.70 ± 0.340.74(0.25–1.09)0.27 ± 0.140.20(0.15–0.48)0.86 ± 0.330.86(0.43–1.20)0.23 ± 0.160.18(0.10–0.45)
9,10-PQ0.57 ± 0.720.29(0.04–1.48)0.15 ± 0.110.13(0.04–0.31)0.64 ± 0.750.24(0.06–1.85)0.16 ± 0.140.13(0.06–0.31)
1,2-BQ0.63 ± 0.330.74(0.13–0.99)0.83 ± 0.360.79(0.48–1.36)1.04 ± 0.510.92(0.47–1.79)0.87 ± 0.390.85(0.46–1.32)
1,4-CQ0.25 ± 0.220.18(0.11–0.40)0.41 ± 0.240.34(0.14–0.71)0.28 ± 0.220.21(0.07–0.59)0.40 ± 0.240.29(0.19–0.81)
5,12-NQ0.42 ± 0.220.46(0.13–0.70)0.38 ± 0.200.34(0.16–0.64)0.62 ± 0.310.56(0.27–1.15)0.41 ± 0.230.37(0.07–0.65)
Σ 7 QNs2.98 ± 1.582.88(1.14–4.35)2.50 ± 1.182.08(1.46–4.18)3.93 ± 1.773.86(2.11–5.20)2.38 ± 1.092.30(1.31–3.37)
PAHs
Nap0.03 ± 0.020.03(0.01–0.06)0.02 ± 0.020.02(0.01–0.04)0.02 ± 0.020.01(0.01–0.05)0.02 ± 0.020.02(0.01–0.05)
Acy0.13 ± 0.150.11(0.02–0.26)0.02 ± 0.010.02(0.01–0.04)0.26 ± 0.690.08(0.04–0.27)0.02 ± 0.010.02(0.01–0.04)
Acn0.10 ± 0.070.09(0.04–0.16)0.04 ± 0.010.04(0.03–0.06)0.15 ± 0.170.11(0.04–0.18)0.03 ± 0.010.03(0.02–0.05)
Flu0.03 ± 0.040.02(0.01–0.05)0.01 ± 0.000.01(0.01–0.02)0.13 ± 0.380.03(0.01–0.19)0.01 ± 0.000.01(0.01–0.02)
Phe0.36 ± 0.340.25(0.12–0.76)0.13 ± 0.060.13(0.08–0.21)0.70 ± 1.480.32(0.14–0.97)0.12 ± 0.050.11(0.08–0.17)
Ant0.11 ± 0.100.08(0.03–0.24)0.06 ± 0.030.06(0.03–0.09)0.29 ± 0.610.13(0.05–0.47)0.06 ± 0.020.05(0.03–0.09)
Flt0.18 ± 0.110.17(0.05–0.32)0.10 ± 0.030.10(0.06–0.14)0.24 ± 0.120.23(0.13–0.36)0.10 ± 0.050.11(0.06–0.13)
Pyr0.22 ± 0.140.20(0.06–0.39)0.13 ± 0.050.12(0.08–0.20)0.30 ± 0.140.28(0.16–0.44)0.13 ± 0.060.14(0.07–0.19)
BaA0.25 ± 0.160.21(0.09–0.40)0.09 ± 0.040.08(0.05–0.15)0.35 ± 0.180.30(0.17–0.66)0.10 ± 0.050.10(0.04–0.15)
Chry0.25 ± 0.140.21(0,08–0.40)0.25 ± 0.120.23(0.12–0.37)0.38 ± 0.180.36(0.19–0.64)0.27 ± 0.120.27(0.12–0.45)
BbF0.52 ± 0.360.50(0.13–1.04)0.19 ± 0.140.14(0.08–0.34)0.87 ± 0.500.80(0.39–1.70)0.19 ± 0.210.13(0.06–0.38)
BkF0.43 ± 0.300.33(0.12–0.71)0.40 ± 0.170.36(0.26–0.62)0.72 ± 0.360.70(0.39–1.09)0.36 ± 0.190.32(0.19–0.54)
BaP0.47 ± 0.270.42(0.14–0.83)0.52 ± 0.240.49(0.31–0.79)0.70 ± 0.330.63(0.35–1.10)0.48 ± 0.270.43(0.18–0.89)
IcdP0.69 ± 0.450.64(0.18–1.28)0.45 ± 0.210.39(0.23–0.70)1.12 ± 0.511.10(0.56–1.76)0.42 ± 0.270.36(0.14–0.75)
DBahA0.08 ± 0.040.09(0.03–0.12)0.11 ± 0.070.09(0.03–0.20)0.14 ± 0.060.13(0.66–0.22)0.11 ± 0.090.08(0.03–0.24)
BghiP0.82 ± 0.520.75(0.19–1.59)0.61 ± 0.230.59(0.37–0.90)1.25 ± 0.531.26(0.73–1.83)0.54 ± 0.320.47(0.24–0.93)
LMW0.75 ± 0.650.52(0.24–1.58)0.29 ± 0.100.29(0.19–0.41)1.56 ± 3.320.63(0.38–1.92)0.27 ± 0.100.25(0.17–0.38)
MMW0.90 ± 0.540.76(0.29–1.49)0.57 ± 0.220.54(0.32–0.86)1.27 ± 0.611.25(0.65–2.12)0.61 ± 0.260.64(0.32–0.87)
HMW3.01 ± 1.862.76(0.76–5.45)2.28 ± 0.962.10(1.44–3.57)4.79 ± 2.184.54(2.51–7.75)2.10 ± 1.291.84(0.85–3.72)
LMW-PAHs: lower molecular weight (containing 2 and 3-ring PAHs), MMW-PAHs: middle molecular weight (containing 4-ring PAHs), HMW: higher molecular weight (containing 5-, 6-, and 7-ring PAHs).
Table 2. Median and percentile10th and 90th of the ratio quinone over precursor PAH according to sampling site and season.
Ratio Quinone/PAHCentroTlaquepaque
Warm-Dry Season
Las Águilas
Rainy Season
Full Database
Warm-Dry SeasonRainy Season
MedianPercentileMedianPercentileMedianPercentileMedianPercentileMedianPercentile
10901090109010901090
1,4-NQ/Nap3.150.8727.762.770.6983.089.231.2724.304.190.7011.623.970.7230.11
1,4-PQ/Phe0.700.123.491.350.952.851.170.043.931.490.792.771.320.183.52
9,10-AQ/Ant9.053.8215.794.252.607.867.551.9213.993.451.656.935.741.9913.50
1,4-AQ/Ant20.168.7978.6949.3523.79104.8516.832.1743.0949.1628.5699.8538.6210.0398.61
9,10-PQ/Phe0.870.238.901.030.452.210.640.254.700.920.572.700.920.263.93
1,2-BQ/BaA2.290.855.818.746.4612.752.982.005.069.036.6013.885.791.9710.84
1,4-CQ/Chry0.710.412.511.501.012.090.590.221.771.471.061.881.300.412.12
Table 3. The factor loadings for individual quinones, lower molecular weight (LMW), middle molecular weight (MMW), and higher molecular weight (HMW) in PM2.5.
PCACEN (n = 37)TLA (n = 23)AGU (n = 22)
PC1PC2PC3PC1PC2PC3PC1PC2PC3
Eigenvalues3.092.151.973.592.212.023.873.601.21
Variance accumulated (%)30.8952.3472.0435.9358.0178.2138.7474.6986.79
1,4-NQ0.170.51−0.05−0.120.92−0.000.680.18−0.04
1.4-PQ−0.070.140.810.05−0.190.760.900.140.12
9,10-AQ0.76−0.100.280.53−0.120.480.900.130.10
9,10-PQ0.080.050.990.140.570.800.090.040.99
1,2-BQ0.080.770.020.86−0.110.250.280.950.00
1,4-CQ−0.250.770.340.35−0.050.53−0.070.950.00
5,12-NQ0.400.600.360.72−0.090.430.420.770.11
LMW0.86−0.04−0.07−0.070.99−0.150.680.500.43
MMW0.860.30−0.110.960.140.020.370.900.08
HMW0.880.47−0.090.99−0.050.100.970.250.07

