Validation and Accuracy Analysis of Global MODIS Aerosol Products over Land
by
 ,
,
Qingxin Wang
1, 
Lin Sun
1,*,
Jing Wei
1,2 ,
,
Yikun Yang
1,
Ruibo Li
1,
Qinhuo Liu
3 and
Liangfu Chen
3 1
College of Geomatics, Shandong University of Science and Technology, Qingdao 266590, China
2
Institute of Space and Earth Information Science, Chinese University of Hong Kong, Shatin, NT, Hong Kong, China
3
State Key Laboratory of Remote Sensing Science, Institute of Remote Sensing and Digital Earth, Chinese Academy of Sciences, Beijing 100101, China
*
Author to whom correspondence should be addressed.
Atmosphere 2017, 8(8), 155; https://doi.org/10.3390/atmos8080155
Submission received: 7 July 2017
/
Revised: 10 August 2017
/
Accepted: 17 August 2017
/
Published: 21 August 2017
(This article belongs to the Section Aerosols)
Abstract
:Land surface reflectance (LSR) and aerosol types are the two main factors that affect aerosol inversions over land. According to LSR determination methods, Moderate resolution Imaging Spectroradiometer (MODIS) aerosol products are produced using the Deep Blue (DB) and Dark Target (DT) algorithms. Five aerosol types that are determined from Aerosol Robotic Network (AERONET) ground measurements are used to describe the global distribution of aerosol types in each algorithm. To assess the influence of LSR and the method used to determine aerosol type from aerosol retrievals, 10-km global aerosol products that cover 2013 are selected for validation using Level 2.0 aerosol observations from 175 AERONET sites. The variations in the retrieval accuracy of the DB and DT algorithms for different LSR values are analyzed by combining them with a global 10-km LSR database. Meanwhile, the adaptability of the MODIS products over areas covered with different aerosols is also explored. The results are as follows. (1) Compared with DT retrievals, the DB algorithm yields lower root mean squared error (RMSE) and mean absolut error (MAE) values, and a greater number of appropriate sample points fall within the expected error (EE). The DB algorithm shows higher overall reliability; (2) The aerosol retrieval accuracy of the DB and DT algorithms decline irregularly as the surface reflectance increases; the DB algorithm displays relatively high accuracy; (3) Both algorithms have a high retrieval accuracy over areas covered by weak absorbing aerosols, whereas dust aerosols and continental aerosols produce a low retrieval accuracy. The DB algorithm shows good retrieval results for most aerosols, but a lower accuracy for strong absorbing aerosols.
1. Introduction
Atmospheric aerosols are solid, liquid, and gaseous particles that are suspended in the atmosphere, and their diameters range from 10−3 to 102 μm [1,2]. Aerosol particles affect the atmospheric radiation balance through direct and indirect radiation forcing, and they lead to important effects on local and global ecological environments and climate change [3,4]. Atmospheric aerosols are also primary pollutants. They cause decreases in atmospheric visibility and affect transportation; moreover, they present a hazard to human health through the distribution of harmful substances and cause respiratory and cardiopulmonary disease [5,6]. Therefore, aerosol monitoring is crucial. The wide coverage and continuous monitoring provided by remote sensing techniques compensate for the limited nature of ground observations and permit effective large-scale aerosol detection [7,8].
Aerosol optical depth (AOD), which is an important optical parameter, has been successfully obtained by Advanced Very High Resolution Radiometer (AVHRR), Sea-Viewing Wide Field-of-View Sensor (SeaWiFS), Moderate resolution Imaging Spectroradiometer (MODIS), Landsat8 Operational Land Imager (OLI), and other sensors [4,8]. The MODIS instrument onboard the Terra and Aqua satellites observes a swath that is approximately 2330 km wide and includes 36 spectral bands that extend from the visible to the thermal infrared (415–14,235 nm) with spatial resolutions of 0.25 km, 0.5 km and 1 km and temporal resolutions of 1 to 2 days [5,6,9]. It provides regular observations of AOD corresponding to ground sites, which contribute to the analysis of the regional and global effects of aerosols that are caused by natural and artificial factors [5].
The current MOD04 C6 AOD product is based on the Dark Target (DT) and Deep Blue (DB) algorithms. The DT algorithm, which was proposed by Kalfman in 1997, has high retrieval accuracy over “dark areas”. The basic principle of the DT algorithm is that the land surface reflectance (LSR) is relatively low in the visible red (0.66 μm) and blue (0.47 μm) bands over areas covered with dense vegetation or dark soil and shows a constant linear relation with the shortwave infrared band (2.12 μm) [7,9,10,11,12]. In addition, the shortwave infrared band is rarely influenced by water, CO2 or aerosols; therefore, the DT algorithm uses the apparent reflectance of the shortwave infrared band as a proxy for the LSR to determine the LSR of the red and blue bands. This aerosol retrieval method has been applied to the MODIS C4 products and earlier versions of these products with several modifications [13]. However, the MODIS C4 products display substantial biases because of the underestimation of the LSR and the incorrect classification of aerosol types [14]. Hence, the C5 DT algorithm denies the assumption at 2.12 μm and assumes that the 2.12 μm channel contains information on the coarse particle aerosols, as well as the LSR. Moreover, it has been found that the proportional relation between the red and blue bands, and that at 2.12 μm, is affected by observation geometry and the “greenness” of the land surface. To accurately determine LSR, the C5 DT algorithm applies the scattering angle and the Normalized Difference Vegetation Index (NDVISWIR) as parameters of LSR. These parameters have an influence on the proportional relationship between the red and blue bands mentioned above [14]. The improvements in the cloud mask and the assignment of the aerosol type have led to the MOD04 C6 product containing more reliable aerosol retrieval results than those contained in the C5 DT product [2,15].
For the areas not covered by dense vegetation, such as deserts and semiarid areas, the top of the atmosphere (TOA) reflectance received by most satellite sensors in the red and near-infrared bands is overwhelmed by LSR, making it difficult to separate the contribution of aerosols to the TOA signal from that of the surface [16,17]. As a result, AOD retrievals are much more difficult over deserts and semiarid areas, which have a high reflectance [18]. The DB algorithm was proposed by Hsu [19] to perform AOD retrievals over areas with high surface reflectance. This algorithm retrieves AOD using the deep blue wavelength, where the land surface reflectance is lower than that at longer wavelengths over “bright surfaces”, such as deserts. Therefore, the DB algorithm successfully retrieves AOD over arid and semiarid areas by building a land surface reflectance database [19,20]. The DB algorithm has been updated and improved by many studies. It has been introduced in the MODIS C5 product to compensate for the DT algorithm in aerosol retrievals over deserts and semiarid areas. However, a static LSR database is not applicable over areas with varying vegetation. Thus, Hsu employed a comprehensive LSR database and dynamic LSR data for the C6 DB algorithm. The MODIS land type product (MCD12C1) is introduced as supporting data to accurately determine the LSR, especially within areas that display vegetation changes. As a result, LSR determination methods can be selected as a function of the surface type. Accordingly: (1) arid/semiarid pixels are retrieved using an LSR database built according to season and the NDVI; (2) vegetation pixels use an LSR determination method that is based on the proportional relation between the 2.12 μm wavelength and the visible wavelength in the red and blue bands; (3) within urban areas, the pixels are first grouped by their NDVI values to calculate the Bidirectional Reflectance Distribution Function (BRDF) model, in which the angle model is applied to LSR determination combined with the LSR database [16,19,21,22]. The MOD04 C6 product, which employs the modified DB algorithm, contains much more accurate aerosol retrieval results [18].
The determination of aerosol type, a key attribute in AOD retrievals, has changed considerably during the development of the MODIS aerosol retrieval algorithms. To determine aerosol type, in the early MODIS C4 product, the AOD retrieved over the continental model, along with the continental model’s single scattering albedos and phase functions, are used to determine the path radiance, the spectral dependence of which is then used to separate dust aerosols from fine aerosols. The aerosol type is then identified via the size distribution parameters and the single scattering albedo [13]. In contrast with MODIS C4, the C5 and C6 products determine aerosol types using the cluster analysis for AERONET sites proposed by Omar [23]. To better distinguish the three fine aerosols, a single scattering albedo (ω0) at 0.67 μm and an asymmetry factor (g) at 0.44 μm are applied using the MODIS algorithms [14,15]. The results of C5 and C6 differ strongly from those of C4.
Evaluation of aerosol retrievals has significant theoretical and practical significance in climatic research and the improvement of retrieval algorithms. It is of great significance for the research of individual users to choose MODIS aerosol products that contain reasonable results, based on the quantitative analysis and evaluation of different MODIS aerosol products. In recent years, scholars have performed several clear and deep studies of MODIS aerosol evaluations. Bilal and Nichol evaluated different aerosol retrieval algorithms over the Beijing-Tianjin-Hebei region using AERONET data. Specifically, they investigated the MODIS DB/DT C5 and C6 10-km algorithms and the DT/DB 10-km and DT 3-km algorithms, as well as simple aerosol retrieval algorithms with spatial resolutions of 500 m, 3 km and 10 km. They validated the retrieval accuracy of the different MODIS products using different algorithms, and they also provided necessary descriptions of the causes of errors [18]. Jalal et al. studied the MODIS aerosol products over the Kuching area in 2012–2013 using AERONET data [24]. Levy et al. validated the DT-based global AOD products over land using AERONET data. Meanwhile, the relation between the retrieval accuracy in areas with lower AOD and the reflectance at 2.12 μm was also studied [9]. Sayer et al. studied the accuracy and uncertainty of the C6 DB product using data from 60 AERONET sites. In addition, regional differences in accuracy and a comparison with the MODIS C5 product were studied [25].
Current validation studies of the accuracy of the MODIS products can be roughly divided into regional and global validation studies. The former focus on the adaptability of the products over particular regions. Such studies are targeted and have lower universality, whereas the latter studies provide overall accuracy and general guidance for users. However, existing global validations do not examine the influence of the accuracy with which the surface reflectance and aerosol types are determined on the overall accuracy.
In this paper, the root mean squared error (RMSE), the mean absolute error (MAE), the mean relative error (MRE), the relative mean bias (RMB), the correlation coefficient (R) and the expectation error (EE) are used to validate the MODIS aerosol products over 175 AERONET sites. The LSR database built using the MOD09 reflectance data and the aerosol type database built using the MOD04 aerosol type data were applied to study the variations in accuracy of the MODIS DT/DB products with different reflectance and accuracy differences of the various aerosol types. Comprehensive validation results of the MOD04 product were obtained that provide a reference for the selection and application of MODIS aerosol products and the improvement of the accuracy of aerosol retrievals.
2. Data and Methods
2.1. MODIS Aerosol Products
In this paper, an accuracy validation is applied to the standard MODIS aerosol product over land (MOD04), a Level 2 MODIS C6 product with a spatial resolution of 10 km. Released by NASA, MOD04 was produced using the DT and DB aerosol retrieval algorithms and is provided in the HDF4 scientific data format, which contains geographical location, aerosol data and their auxiliary parameters. The DT and DB AOD products over land at 550 nm with a quality grade Q = 3 were extracted for accuracy validation.
2.2. AERONET Data
AERONET is a federation of ground-based remote sensing aerosol networks established by NASA and its collaborators. AERONET provides a long-term, continuous and readily accessible (public domain) database of aerosol optical, microphysical and radiative properties for use in research on aerosols and their characterization, as well as the validation of satellite retrievals.
AERONET provides globally distributed observations of spectral aerosol optical depth (AOD) data that are computed for three data quality levels. The Level 1.0 data are unscreened, the Level 1.5 data are cloud-screened, and the Level 2.0 data are cloud-screened and quality-assured [15]. With AOD observation errors that lie within the range of 0.01–0.02, the AERONET products are often used for AOD remote sensing validation [4,18,26,27,28]. The MODIS aerosol products used in this study are validated using the Level 2.0 data from 175 global AERONET sites collected in 2013.
As the AOD data at 550 nm are deficient, an interpolation is performed using the AERONET data and the Angstrom exponent:
here, τ(λ) is AOD at a wavelength of λ, α is the Angstrom wavelength exponent, and β is the Angstrom turbidity coefficient. Substituting AOD at 440 μm, 500 μm and 675 μm into Equation (1), we obtain β and α. The AOD value at 550 μm can then be obtained [7,29].
2.3. LSR Database
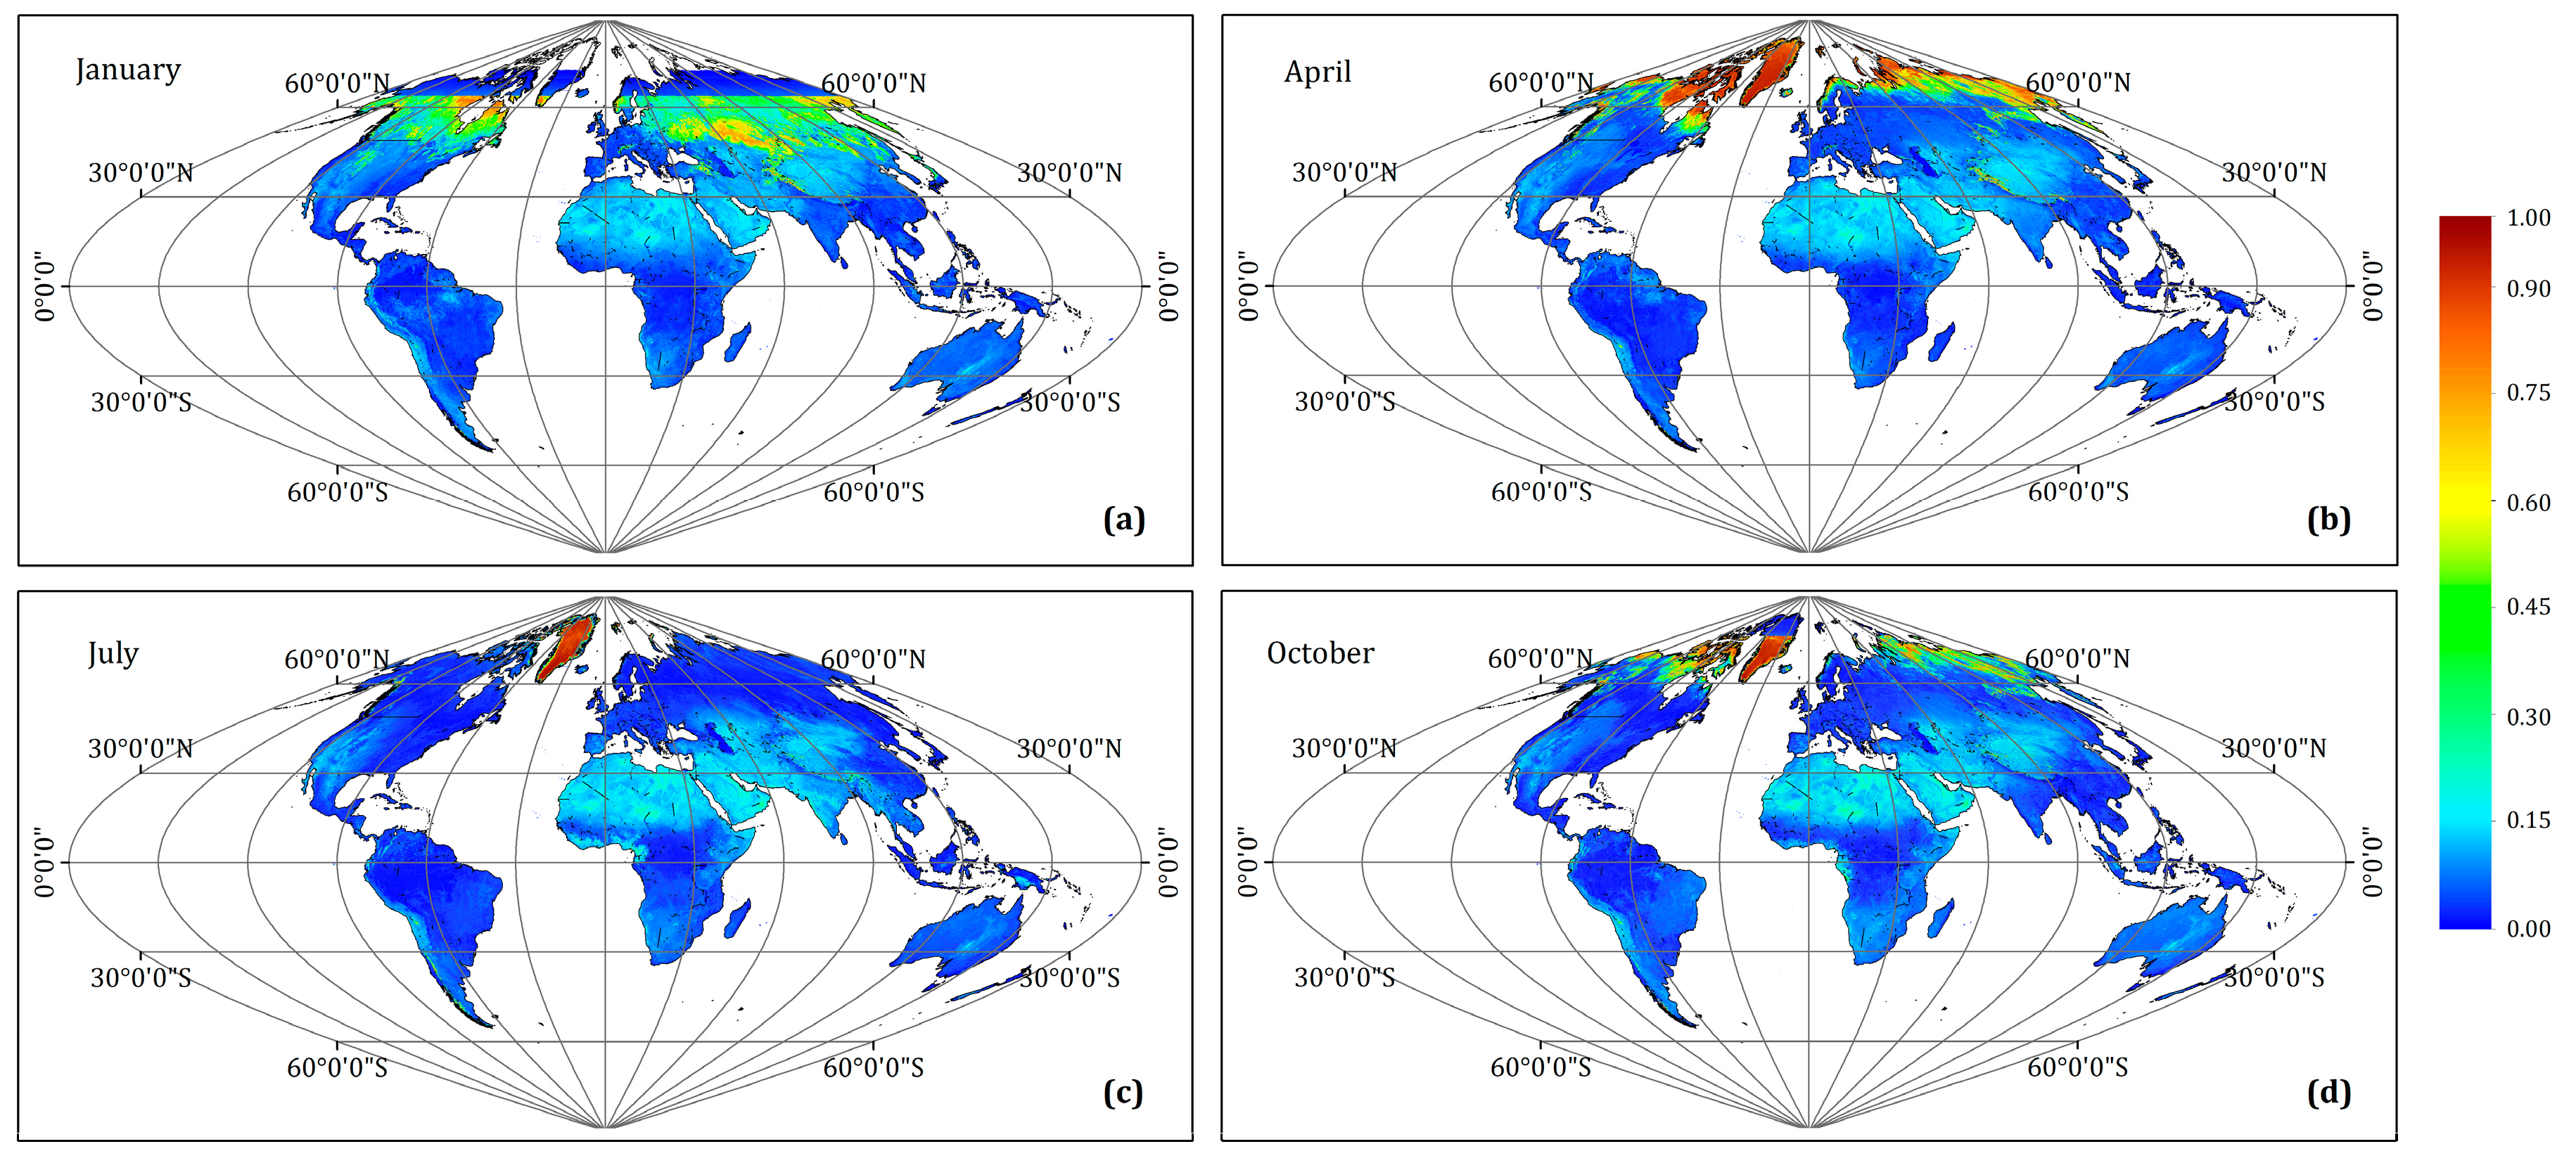
To avoid the influence of clouds on surface reflectance, the monthly blue band data in 2013 were composited using the MOD09A1 product and the LSR database via the second minimum value synthesis method [30,31].
MOD09A1 is a global surface reflectance 8-day gridded product that includes 7 bands at a resolution of 500 m from the visible to the near-infrared bands. To match the AOD values with the surface reflectance, monthly composite reflectance data were resampled to pixels with a resolution of 10 km, as shown in Figure 1.
2.4. Aerosol Type Database
MOD04 provides daily aerosol types over land at a resolution of 10 km in the “Aerosol_Type_Land” dataset. Aerosol type is obtained via cluster analysis of AERONET aerosol parameters. These types include dust, continental, and fine aerosols; the fine aerosols can be subdivided into strong absorbing, moderate absorbing and weak absorbing types. Aerosol properties mainly include single scattering albedo (SSA) and the asymmetry factor (g) [2,14,16]. Studies have shown that the optical properties of fine aerosols change slightly; however, this change rarely influences variations in aerosol type [2]. Therefore, we assume that: (1) the optical properties of aerosols change slightly over short periods of time; (2) the dominant factors at each AERONET site that determine aerosol type are affected a lot by the season. Thus, we built a seasonal aerosol type dataset via the modal synthesis method, as shown in Figure 2. Table 1 shows the SSA and g values of each aerosol type, according to the AERONET data.
2.5. Evaluation Methods
AERONET provides continuous AOD values at 15-min intervals. On the other hand, MODIS captures instantaneous AOD values with a pixel size of 10 km × 10 km. Thus, AERONET and MODIS differ in terms of their spatial-temporal scales. Substantial matching errors or incorrect matching results would be produced if AERONET AOD values were improperly matched with MODIS data. Therefore, in terms of temporal scale, the average AERONET AOD values within ±30 min of the times when the satellite passed overhead were applied in this study. In terms of spatial scale, a grid of 3 × 3 MODIS pixels centered on AERONET sites are selected, in which AOD is determined by the median of the nonzero values. The aerosol type and surface reflectance are determined by the same method described above, in which the aerosol type was determined as the mode of a 3 × 3 grid of pixels. The evaluation statistic matrix includes the RMSE, the MAE, the MRE, the EE, the RMB and R [1,4,18].
The RMSE, the MAE, and the MRE are used to measure the differences between the MOD04 AOD values and the AOD values measured using a Sun photometer. Here, AODMOD04 represents MOD04 AOD values, and AODAERONET represents AERONET AOD values. RMB indicates the overall bias of MOD04 and AERONET AOD; RMB > 1 and RMB < 1 represent overestimates and underestimates, respectively. EE is used here for the confidence envelopes of the retrieval algorithm over land to evaluate the quality of the MOD04 AOD estimates. The correlation coefficient R is a good indicator of the agreement between the AERONET and MOD04 AOD values; higher values of R indicate better agreement [1,18].
3. Results and Discussion
3.1. Overall Validation of MOD04 C6 DT and DB AOD Products
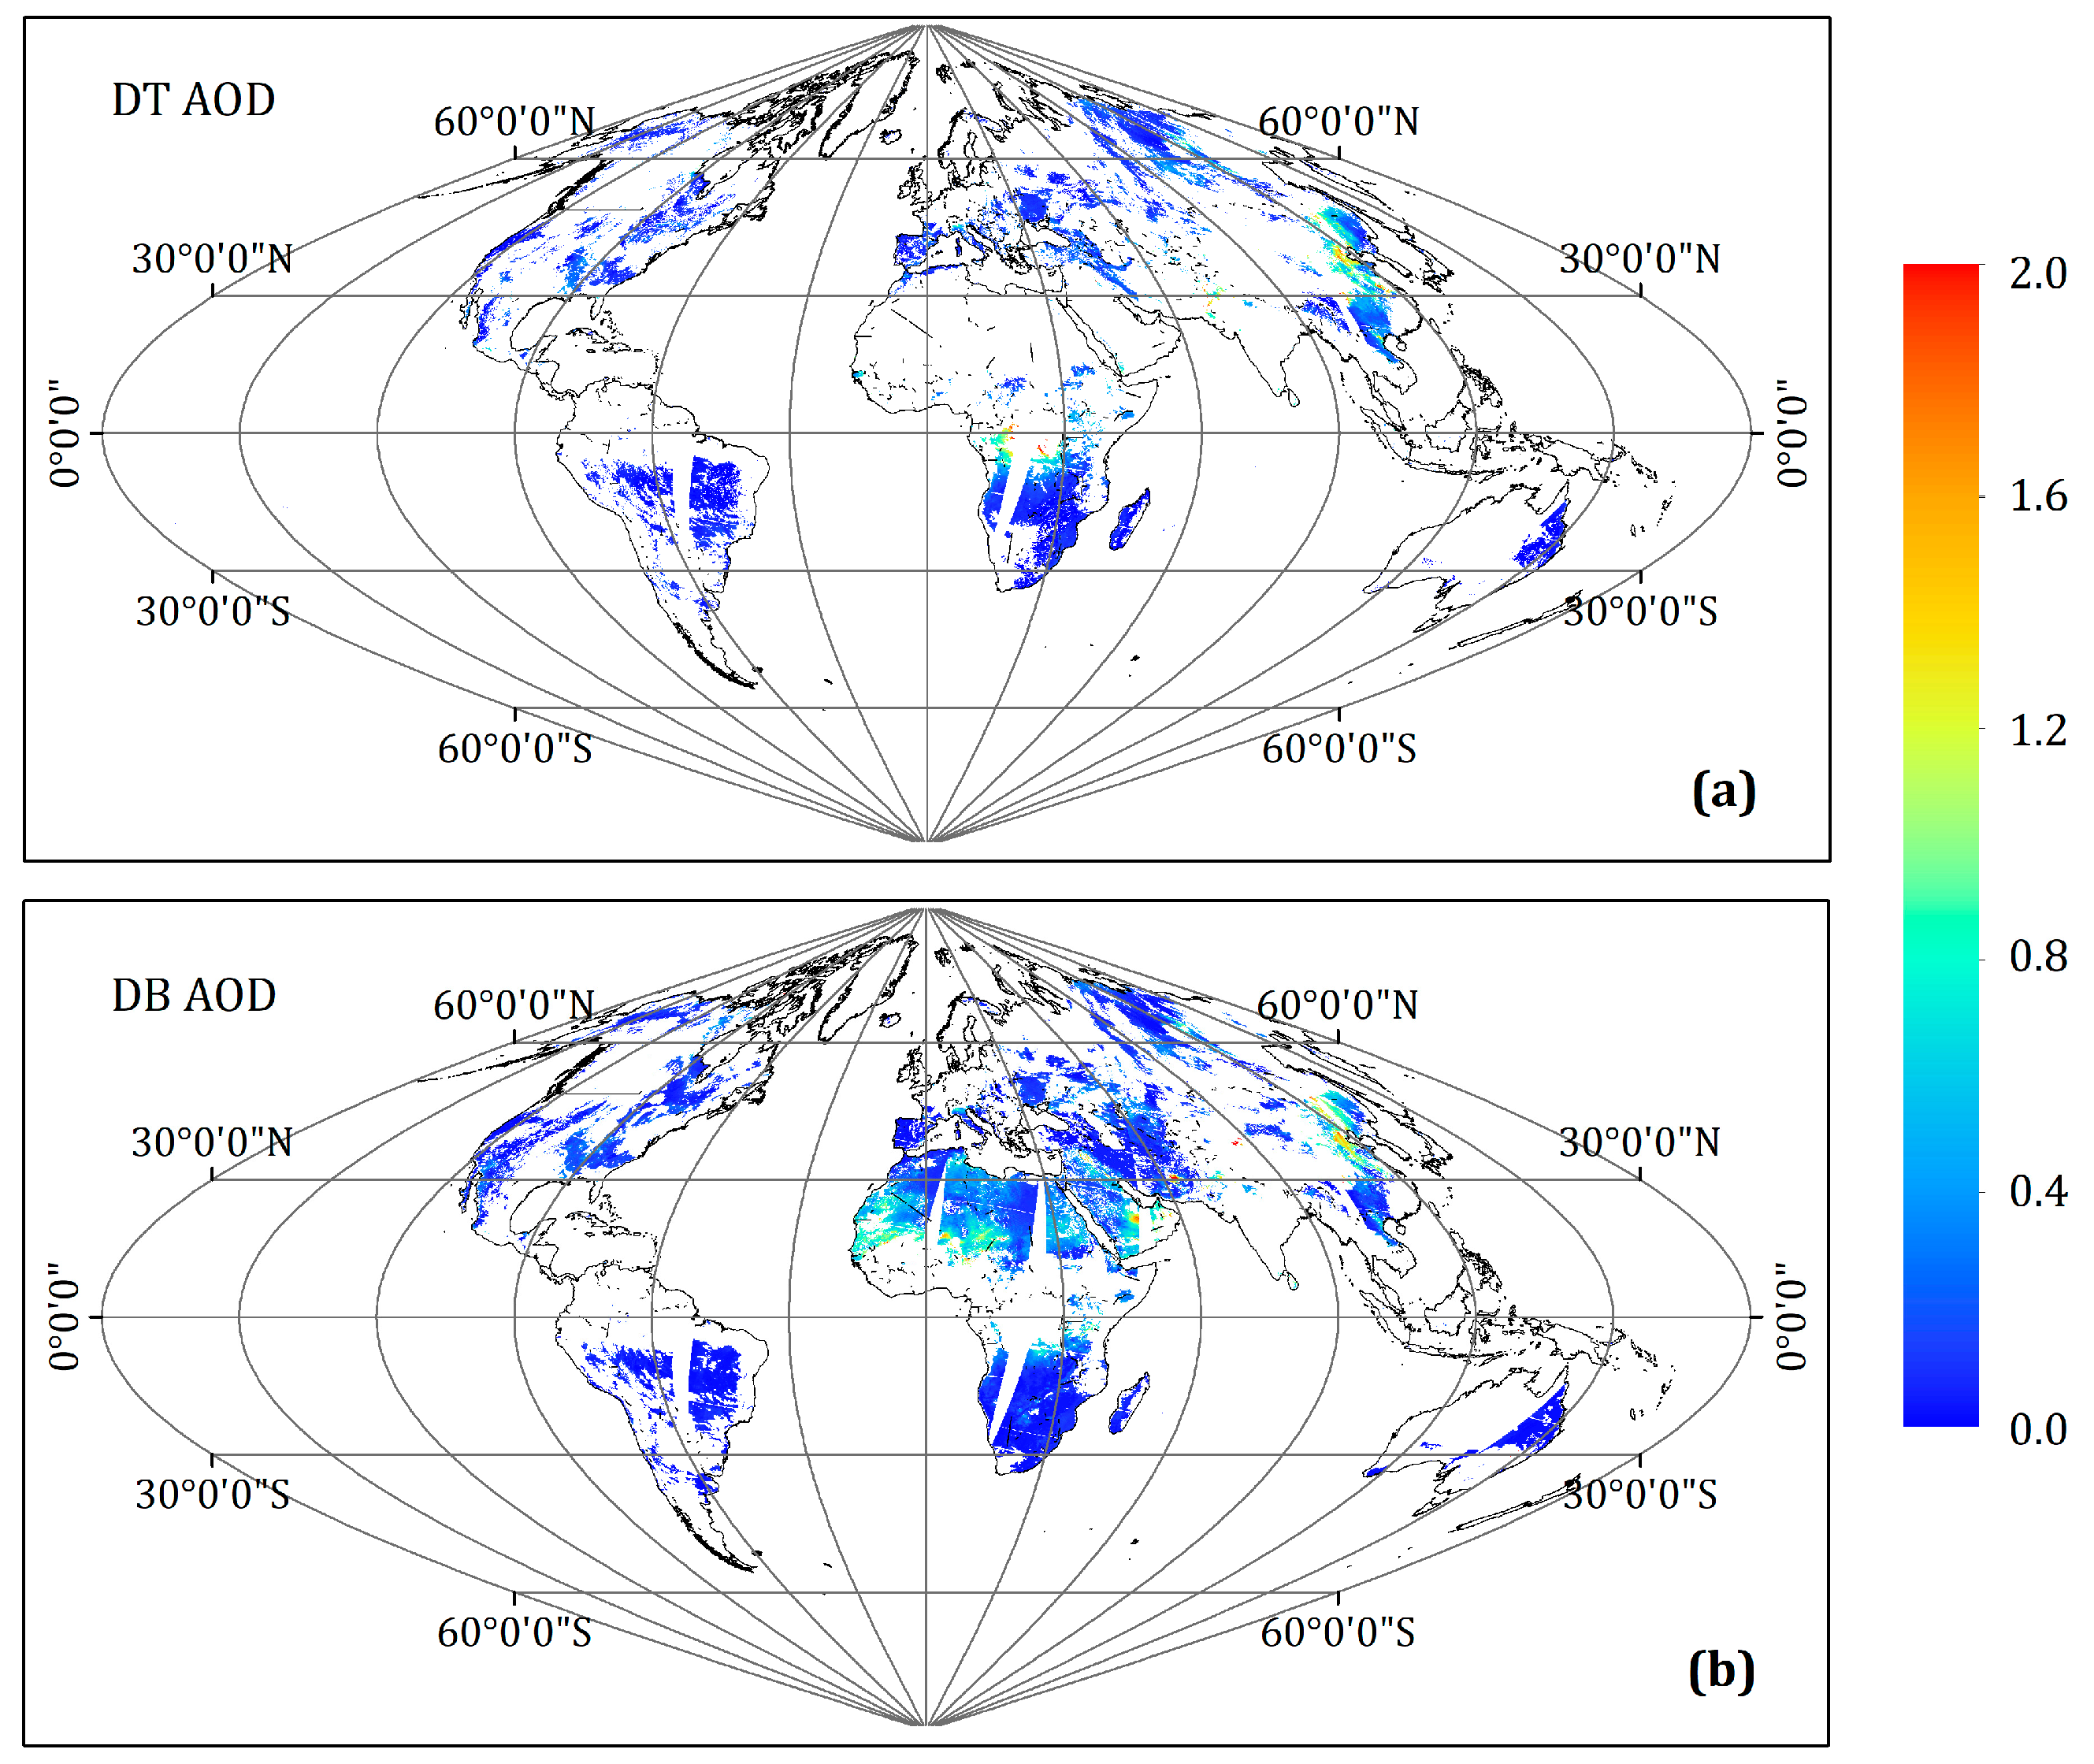
Panels (a) and (b) in Figure 3 represent the global aerosol optical thickness obtained using the DT and DB algorithms of MOD04 C6 on the 165th day. The results clearly indicate that the DB algorithm produces more continuous AOD results with wider retrieval scales and compensates for the errors generated by the DT algorithm over the Sahara Desert.
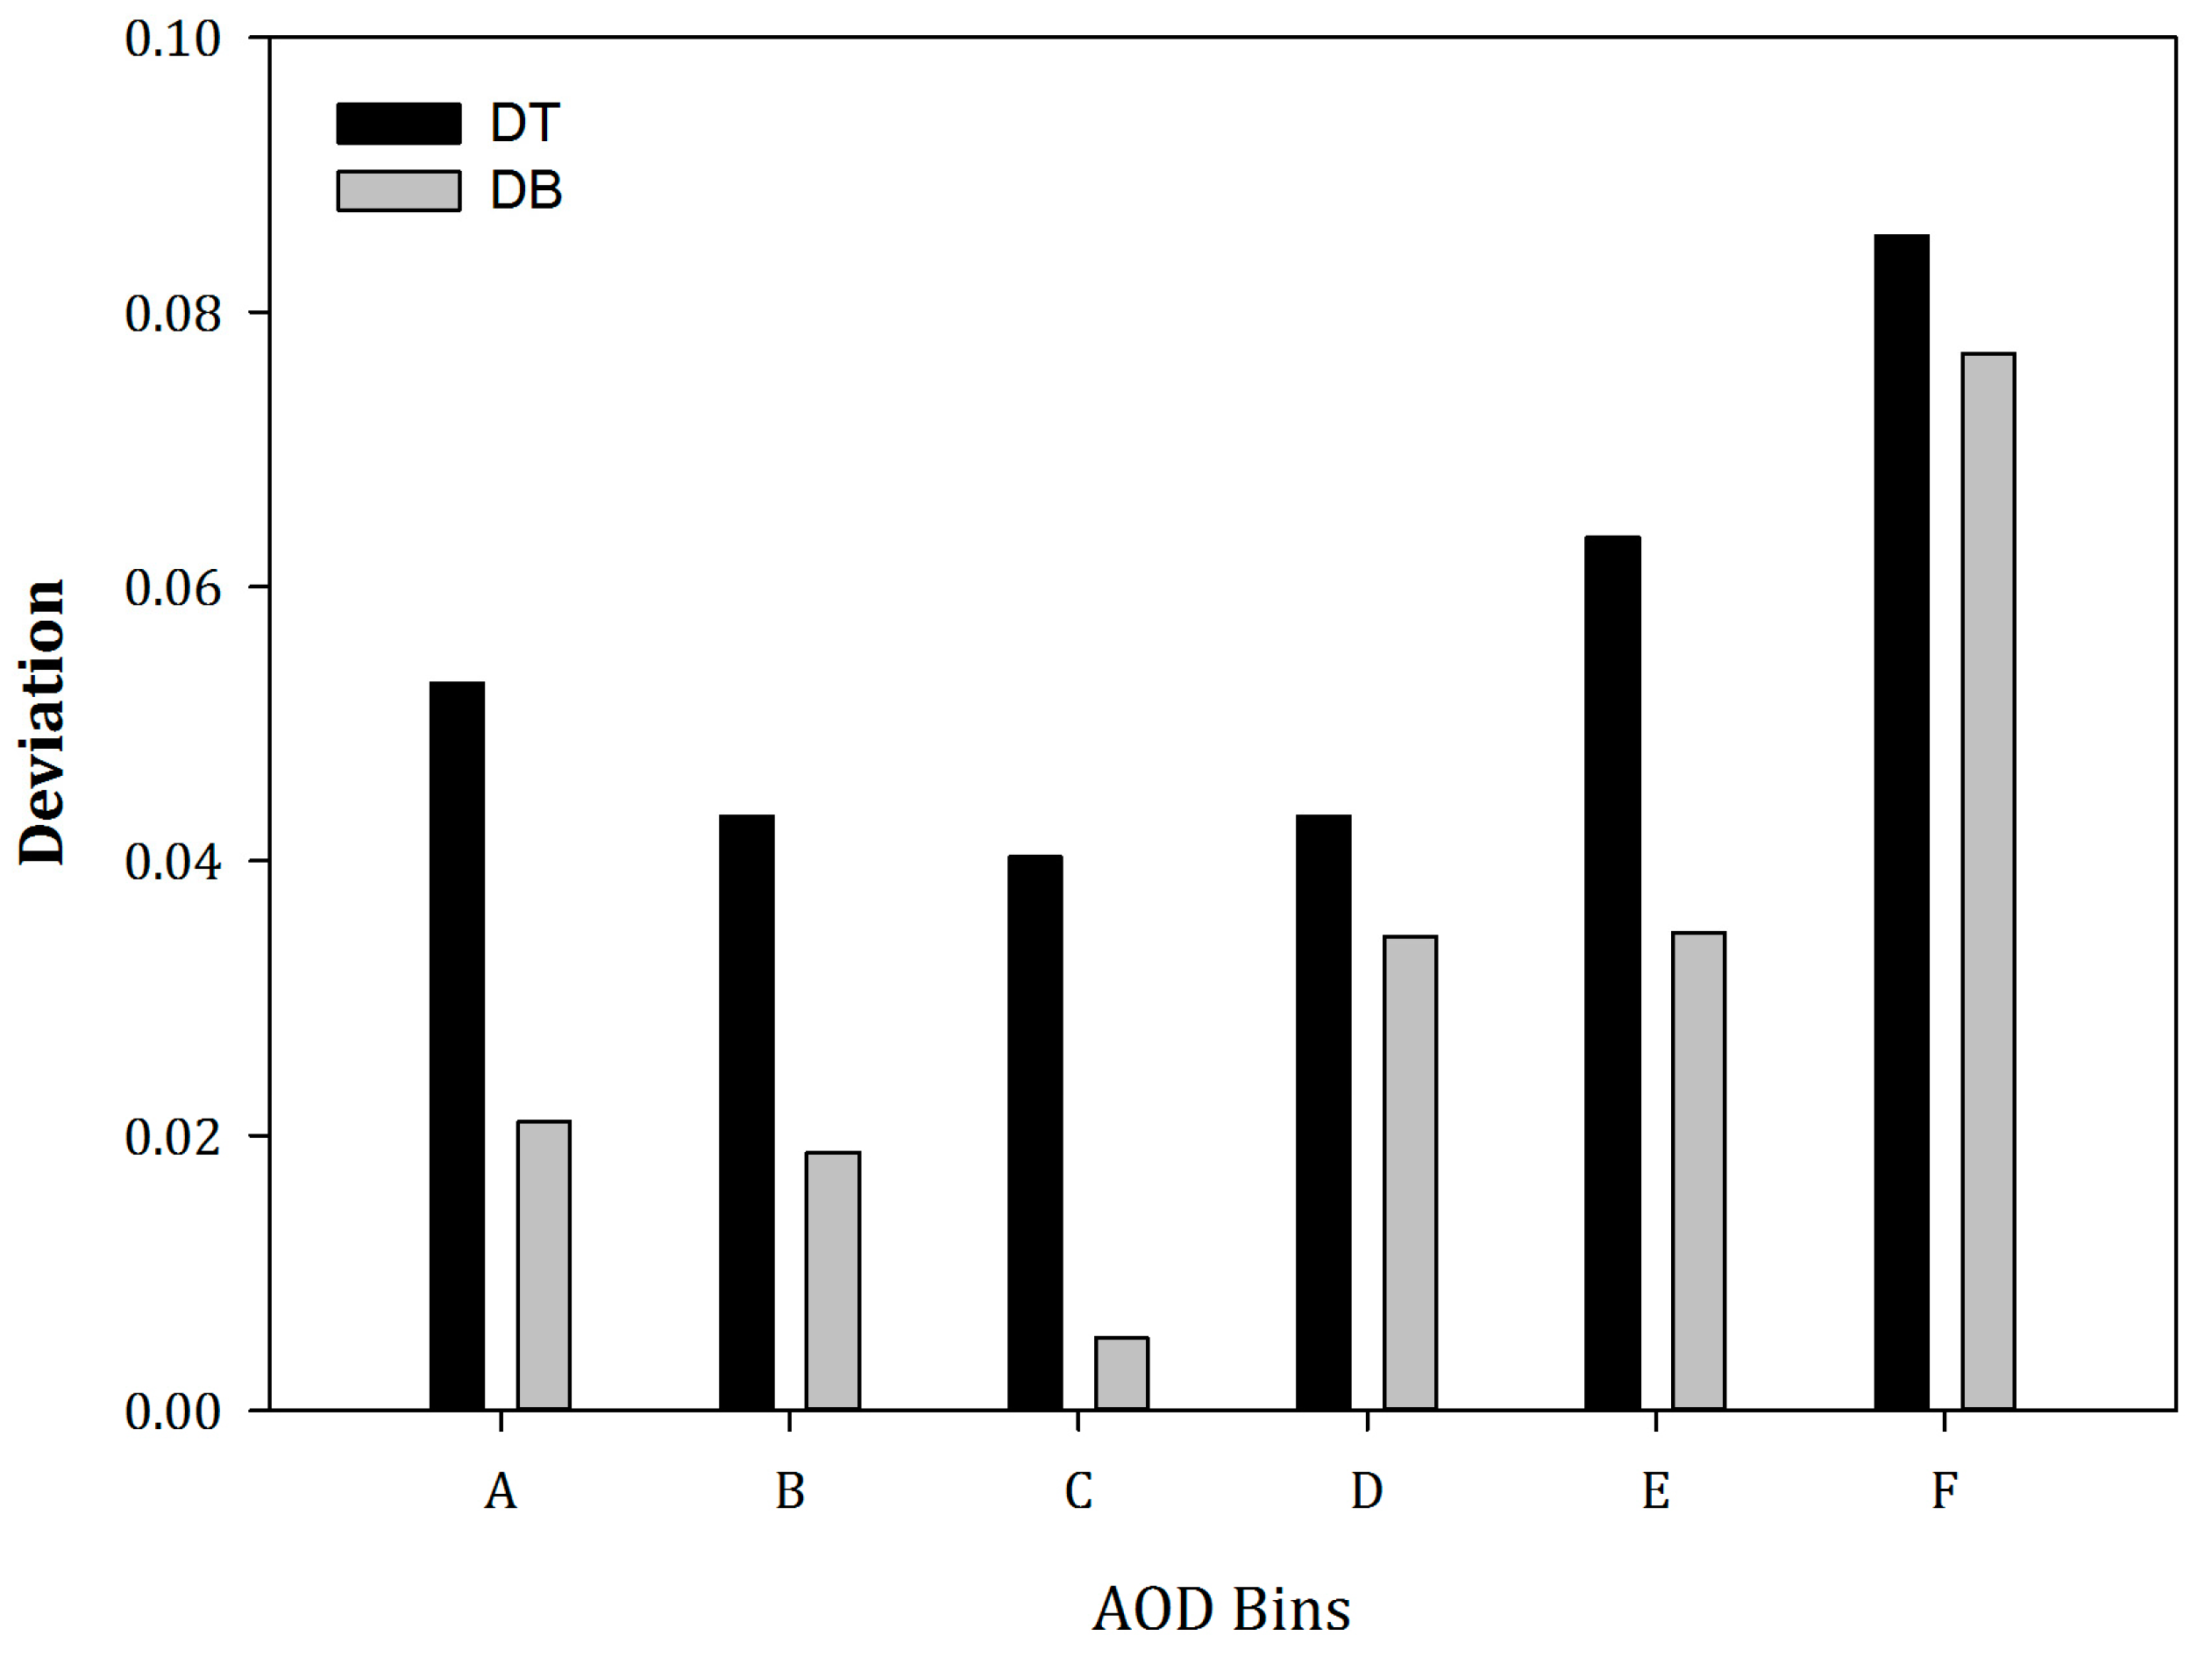
Panels (a) and (b) of Figure 4 show the results of comparing the MOD04 DT and DB AOD values and the AERONET AOD values at 550 nm, where the dotted lines are the EE bounds of the MODIS products over land. The solid line indicates the X = Y line. The retrieval results of DT and DB are similarly distributed, especially where the AOD values are less than 1.0. Compared with those of DT the DB AOD products are more evenly distributed on both sides of the 1:1 line; 67.94% of the sample points fall within the EE range, which is higher than the proportion associated with the DT AOD products (61.09%). The evaluation indicators of the DB algorithm (RMSE = 0.113 and MAE = 0.072) are lower than those of the DT algorithm (RMSE = 0.126 and MAE = 0.082). Both algorithms produce overestimates to some extent; 32.53% of the DT samples fall above the EE and 6.38% fall below the EE. With an RMB of 1.265, the DT algorithm shows obvious signs of overestimation which are over the threshold of the science requirement of AOD measurement accuracy on the average level [32,33]. However, the DB algorithm shows a small degree of overestimation; 17.64% of the samples fall above the EE, 14.42% fall below the EE, and the RMB is 1.010. Moreover, the DB algorithm can be applied over areas with higher surface reflectance, enlarging the scale of aerosol retrieval scale and leading to higher numbers of valid sample points (N = 11,694 for DB and N = 9869 for DT). Figure 5 is the deviation histogram () for different AERONET AOD ranges (A: 0–0.05, B: 0.05–0.1, C: 0.1–0.2, D: 0.2–0.5, E: 0.5–1.0, F: >1.0). As shown, the DB product also has an overall lower deviation than that of the DT algorithm within each AOD bin. Overall, the MOD04 C6 DB product displays greater adaptability and higher retrieval accuracy and product reliability, especially over areas with larger AOD values.
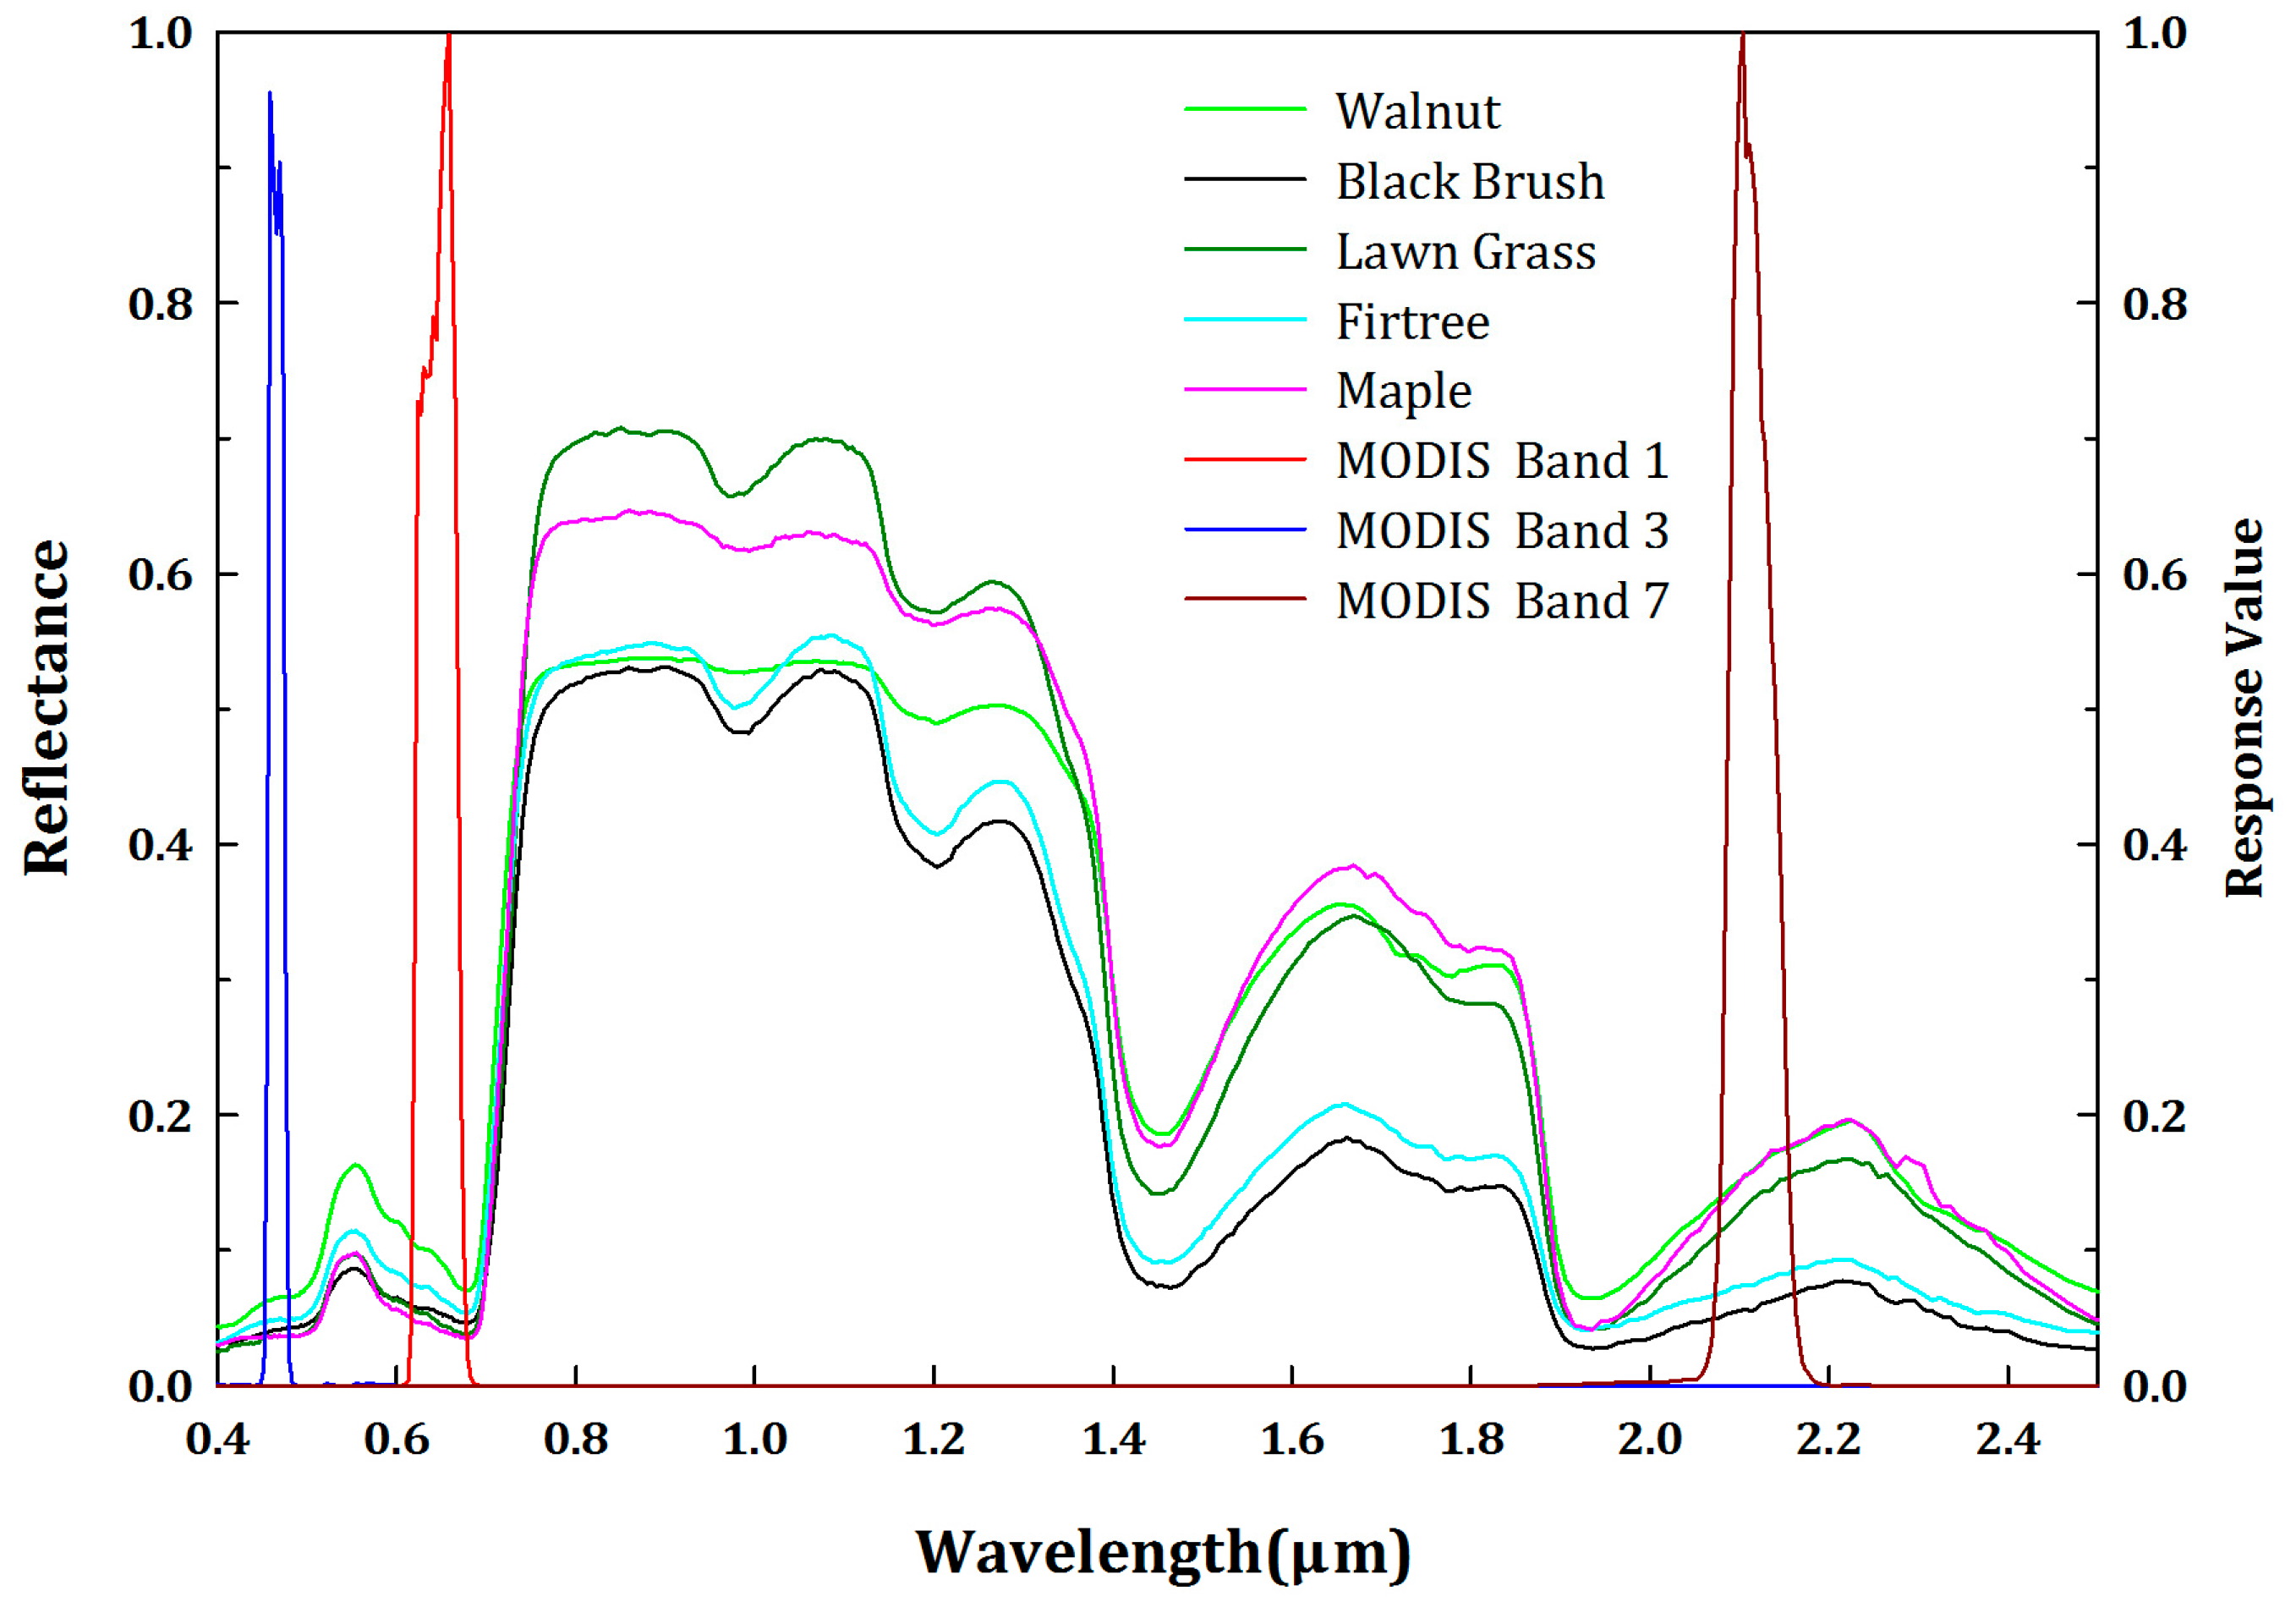
Additionally, the reason for the accuracy differences between the DT and DB algorithms lies in the theory of surface reflectance determination: for the DT algorithm, the surface reflectance in the visible red and near-infrared band is a function of the scattering angle and vegetation index; however, the fixed linear relation between the visible red and blue bands is not stable. Figure 6 shows spectral curves (i.e., measured spectral curves from the USGS) of five different vegetation types, specifically walnut, black brush, lawn grass, firtree and maple. The surface reflectance of these vegetation types at 2.1 μm, 0.47 μm and 0.66 μm are shown in Table 2. The reflectance at 0.66 μm leads to an underestimation of the reflectance of 0.0159–0.0258 in the blue band, which further leads to an error in the AOD values of 0.159–0.258. In contrast, the C6 DB algorithm determines surface reflectance comprehensively via the prior LSR database and NDVI values. Thus, it possesses additional reliability and stability. Thus, the MOD04 C6 DB algorithm produces more accurate AOD retrieval results.
3.2. Validation of the MOD04 C6 DT and DB AOD Products within Different LSR
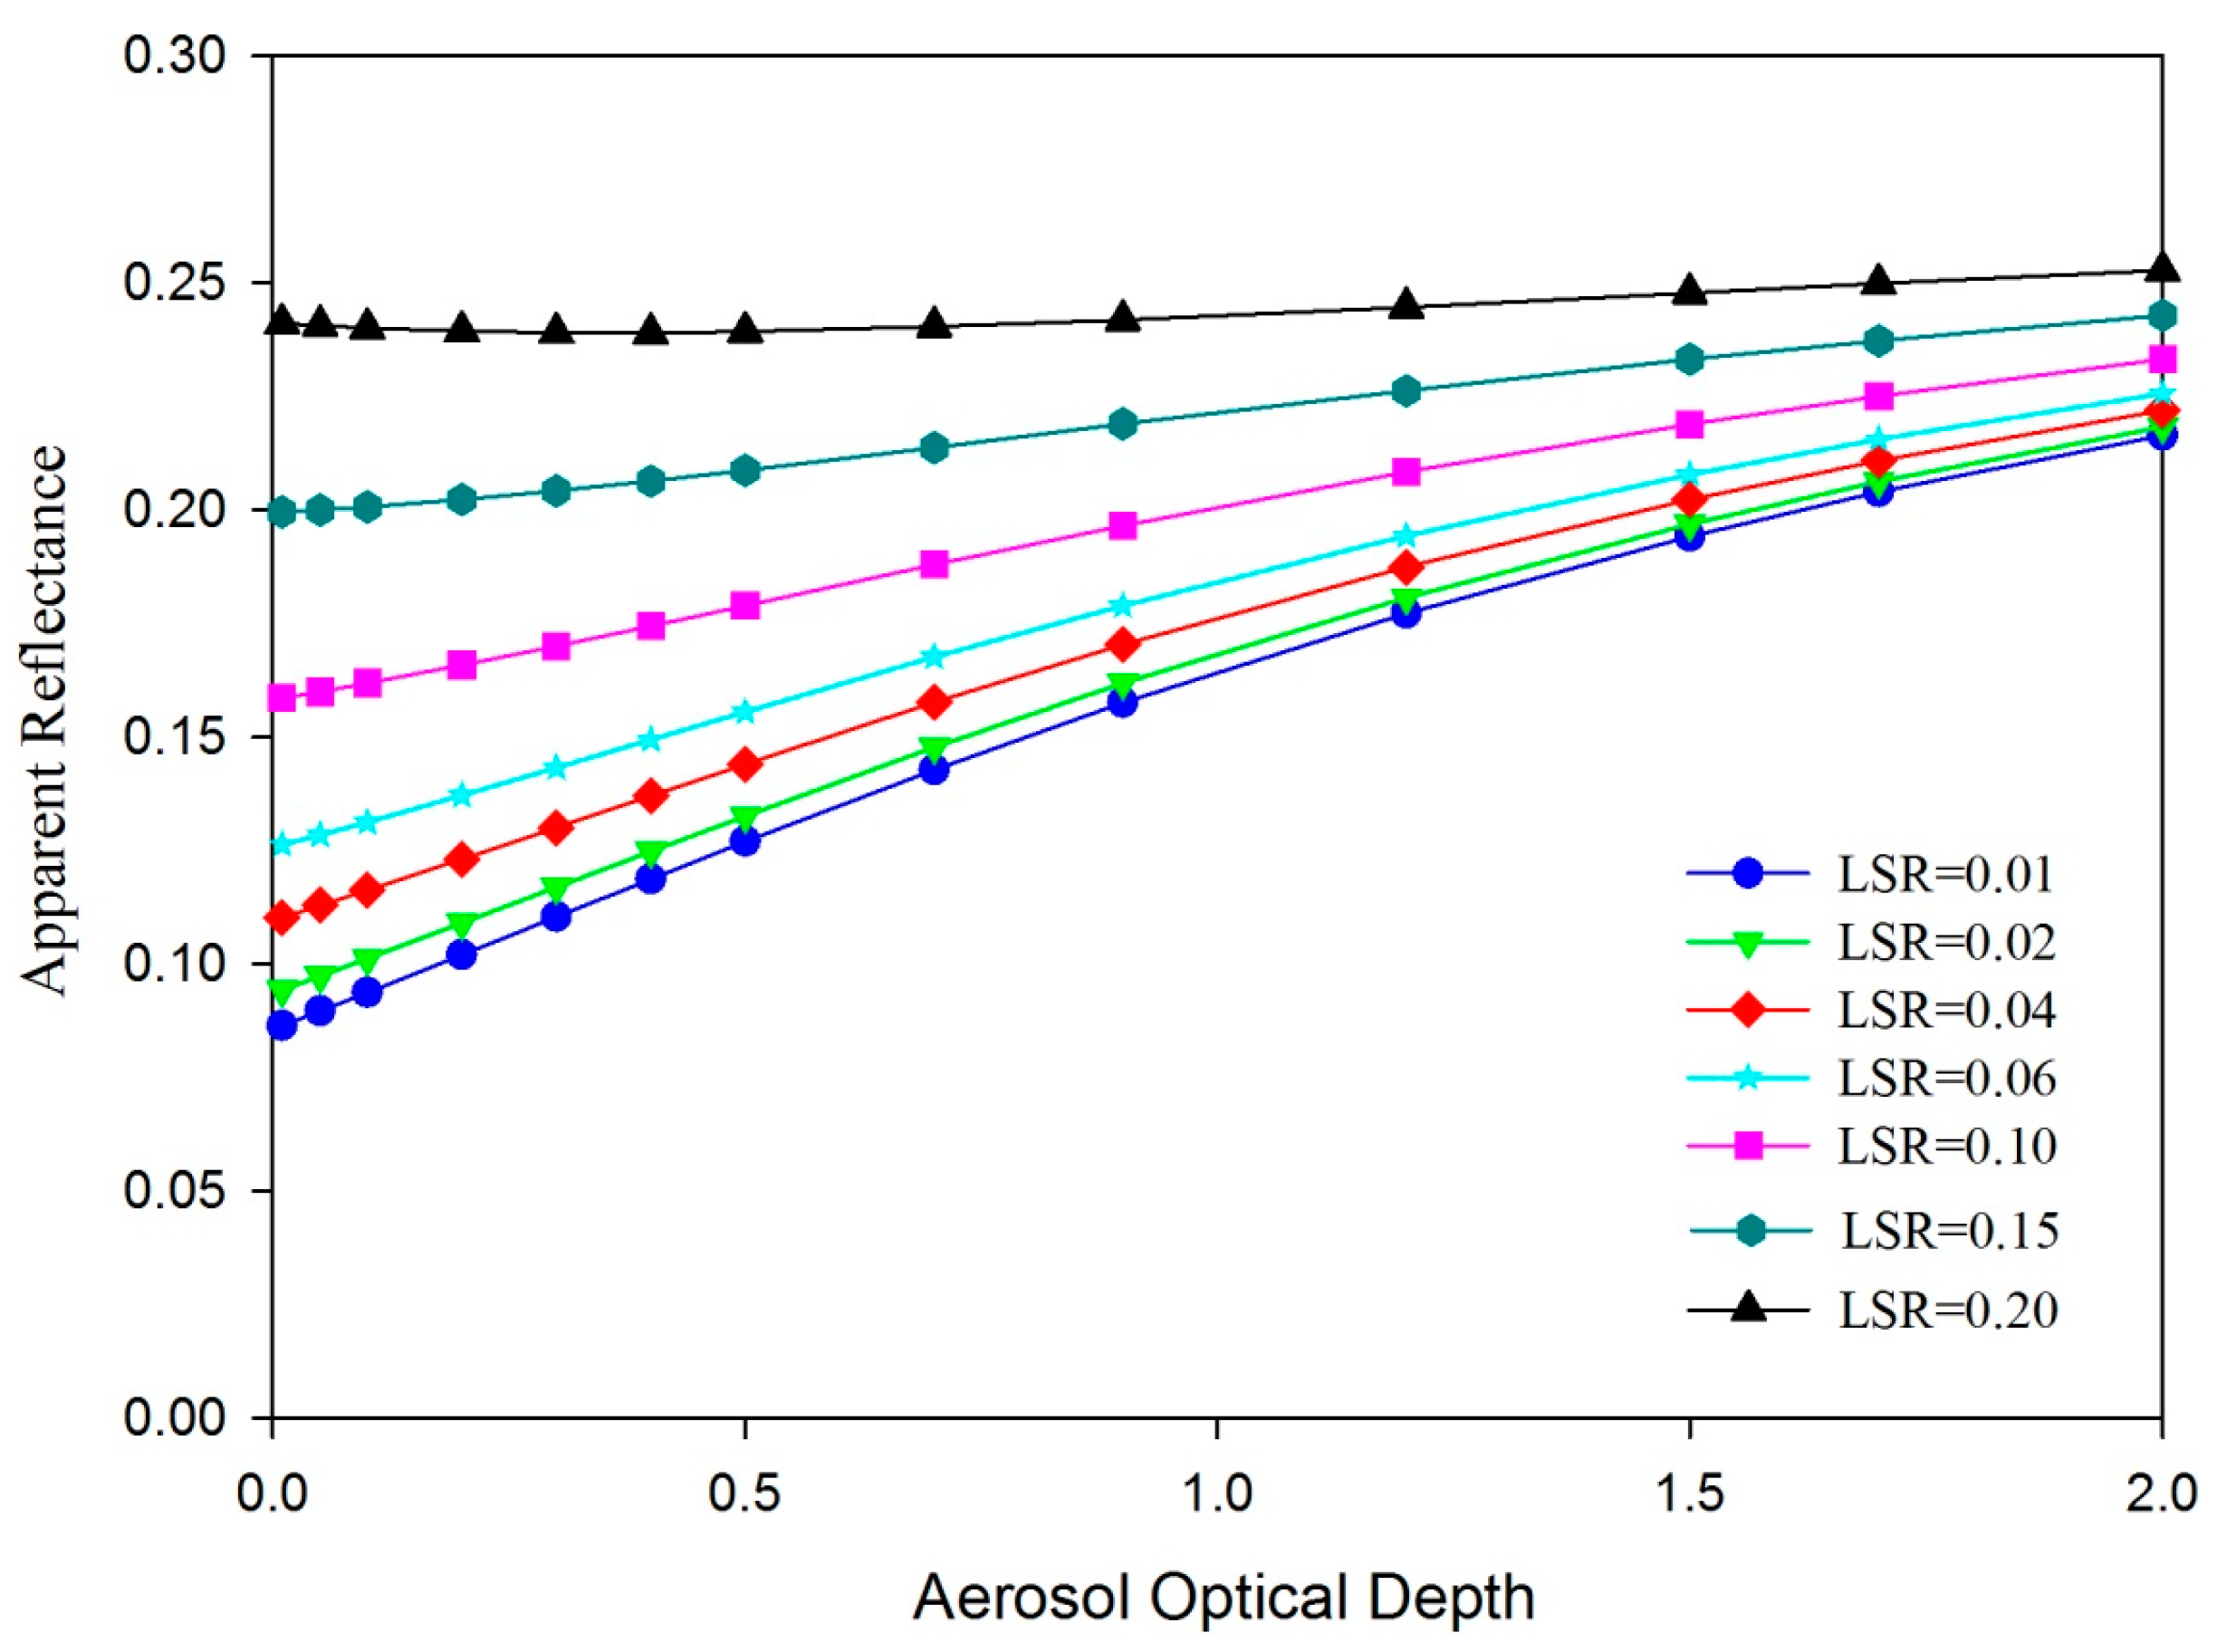
The key factor in aerosol retrieval is the separation between the land surface and aerosol reflectance [34]. Thus, the accuracy of the surface reflectance estimate is of considerable importance. Studies have shown that errors in surface reflectance estimates are magnified, becoming ten times larger, when applied to the retrieval of AOD [22].
To assess the influence of surface reflectance on AOD retrieval accuracy, the apparent reflectance of different surface reflectance and AOD values in the blue band were simulated using the 6 s (Second Simulation of the Satellite Signal in the Solar Spectrum) model [29], as shown in Figure 7. As surface reflectance increases, the sensitivity of the apparent reflectance to AOD changes decreases gradually and declines sharply when surface reflectance is larger than 0.06, leading to difficulties in AOD retrieval.
The DT and DB AOD samples were classified into five intervals based on LSR, specifically 0–0.02, 0.02–0.03, 0.03–0.04, 0.04–0.06 and greater than 0.06. Scatterplots and accuracy verifications are shown in Figure 8. The DB product has an overall higher retrieval accuracy than that of the DT algorithm within each interval (i.e., the N, RMSE and MAE are all greater). The number of valid DT retrieval samples is greater than that of the DB algorithm over low reflectance areas (LSR < 0.03), and the samples are distributed evenly on both sides of the 1:1 line. More than 70% of the DT samples fall within the EE over areas with reflectance lower than 0.02, where RMSE = 0.086 and MAE = 0.057. All of the data support the conclusion that DT AOD retrievals are overestimated in all of the intervals, especially over high reflectance areas (LSR > 0.06), where RMB = 1.402 and 40% of the samples fall above the EE. This overestimation occurs because the DT algorithm yields biased aerosol type determinations; moreover, the underestimation of LSR leads to large errors in AOD [18].
As LSR increases, the AOD retrieval accuracy of both DT and DB decrease gradually. The fraction of the DB samples that fall within the EE decrease from 81.34% in the 0–0.02 LSR interval to 55.59% in the LSR > 0.06 interval, whereas the RMSE and the MAE grow from 0.072 and 0.045 to 0.142 and 0.098. Nevertheless, the DT algorithm displays high accuracy and reliability in the 0–0.02 LSR interval when it is used for dark target areas. The product accuracy of both DT and DB reaches a minimum for areas with LSR values larger than 0.06. In such areas, 45.12% of the DT samples fall within the EE, and RMSE = 0.153, MAE = 0.111, and RMB = 1.402. In conclusion, although the improved DB algorithm reduces the degree of underestimation over areas with low AOD, the scattering diagram indicates that the AOD retrieval accuracy of the DB algorithm needs to be improved in cases where LSR is high and AOD is low (in areas with LSR > 0.06, over 90% of the AERONET AOD samples are distributed within 0.5).
3.3. Variations in the Accuracy of MOD04 C6 DT and DB AOD Retrievals with Different LSR
The results presented in the preceding section reveal that the accuracy of DT and DB AOD retrievals decreases as LSR increases. This pattern is described in a more intuitive and complete way in the following section.
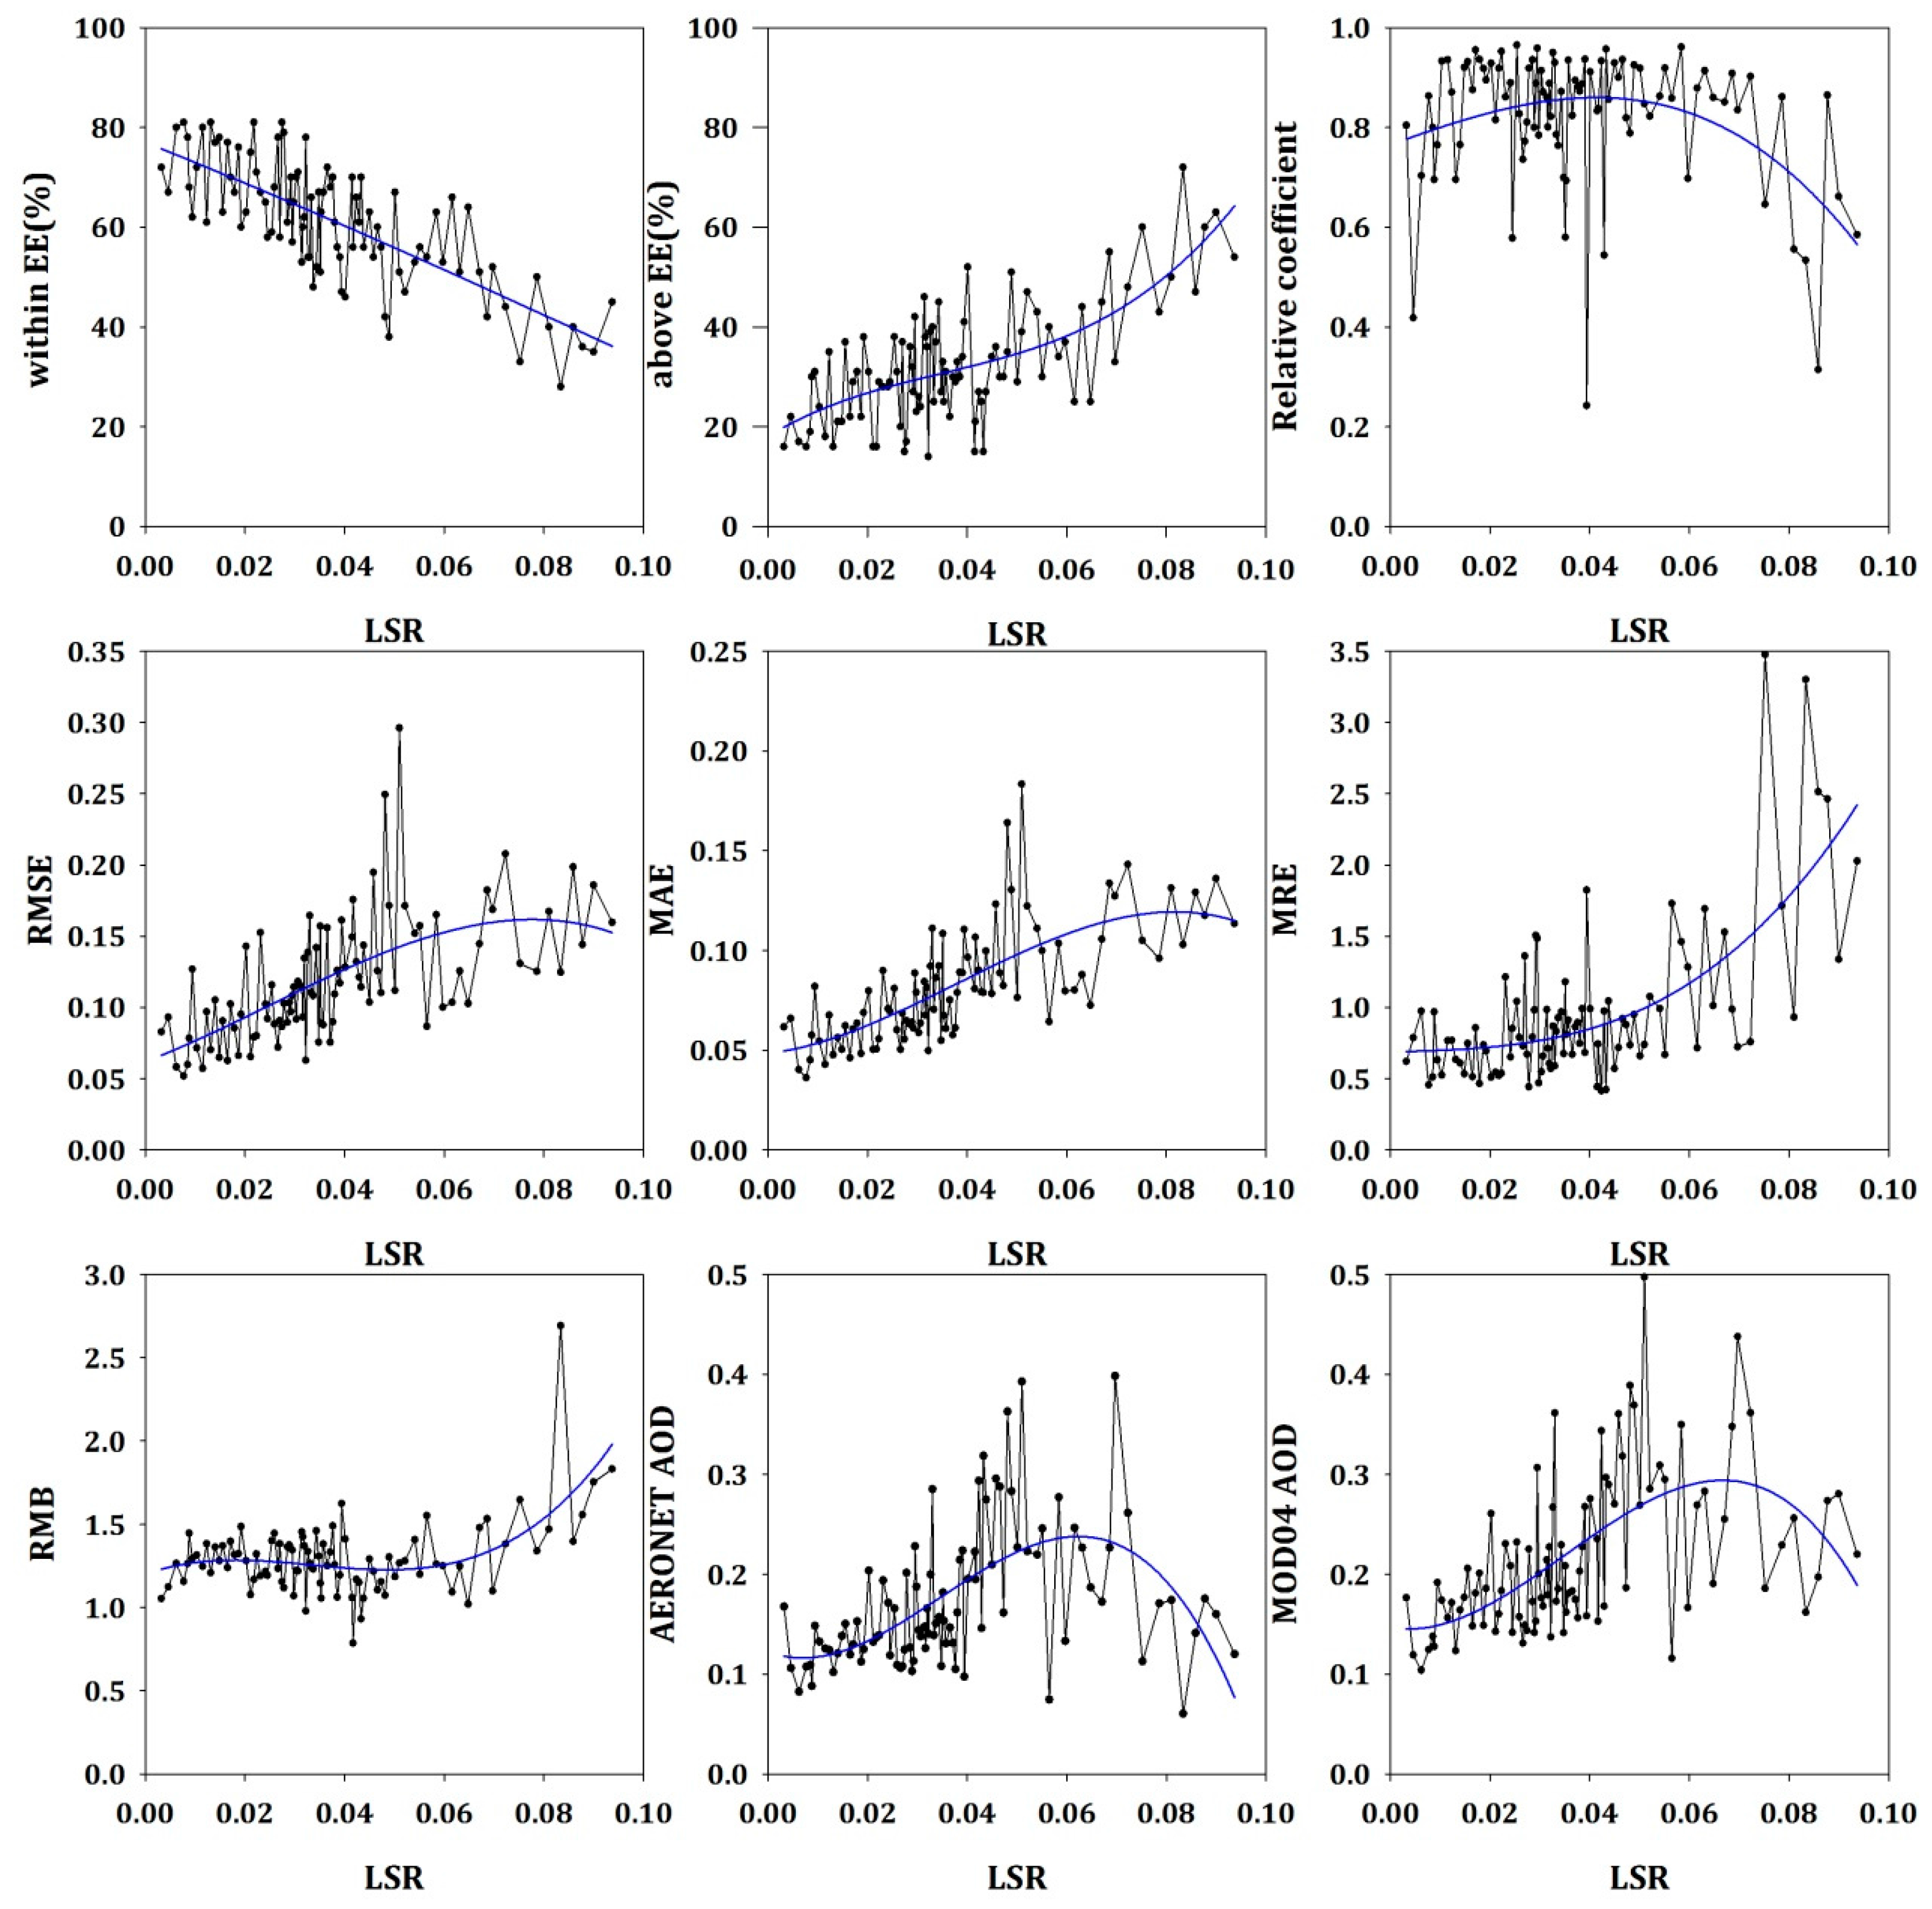
Figure 9 clearly shows the variations in the accuracy indicators and MOD04/AERONET AOD. To avoid errors caused by the number of samples, the LSR data are assigned to groups containing 100 samples each and ordered from low to high, of which the median value is determined to be the LSR. Indexes including the RMSE, the RMB, and the MAE are calculated for each group of data. The results calculated are then fitted on an LSR line chart to obtain more intuitive variation trends and rates. Theoretically, the AOD extracted should be distributed within the range of the surface reflectance that is below 0.0625 in the blue band when the DT algorithm is applied to dark areas. However, in view of the severe underestimation and inevitable matching errors produced by the DT algorithm, some of the samples are selected from areas where LSR > 0.09.
As shown in Figure 9, the fluctuations in the accuracy indicators increase with LSR. Examples include the proportion above the EE, the RMSE, the MAE and the MRE, whereas the proportion within the EE and the R decline gradually. Therefore, the accuracy of DT AOD retrievals generally declines as LSR increases. In addition, the RMB fluctuates smoothly with increased LSR within the range of 1.0–1.5, showing an overall overestimation. The AOD values are smaller (<0.2) over low LSR areas (<0.04) that have high retrieval accuracy. In general, the accuracy of DT AOD retrievals decreases as LSR increases and contain clear errors, including an overall overestimation.
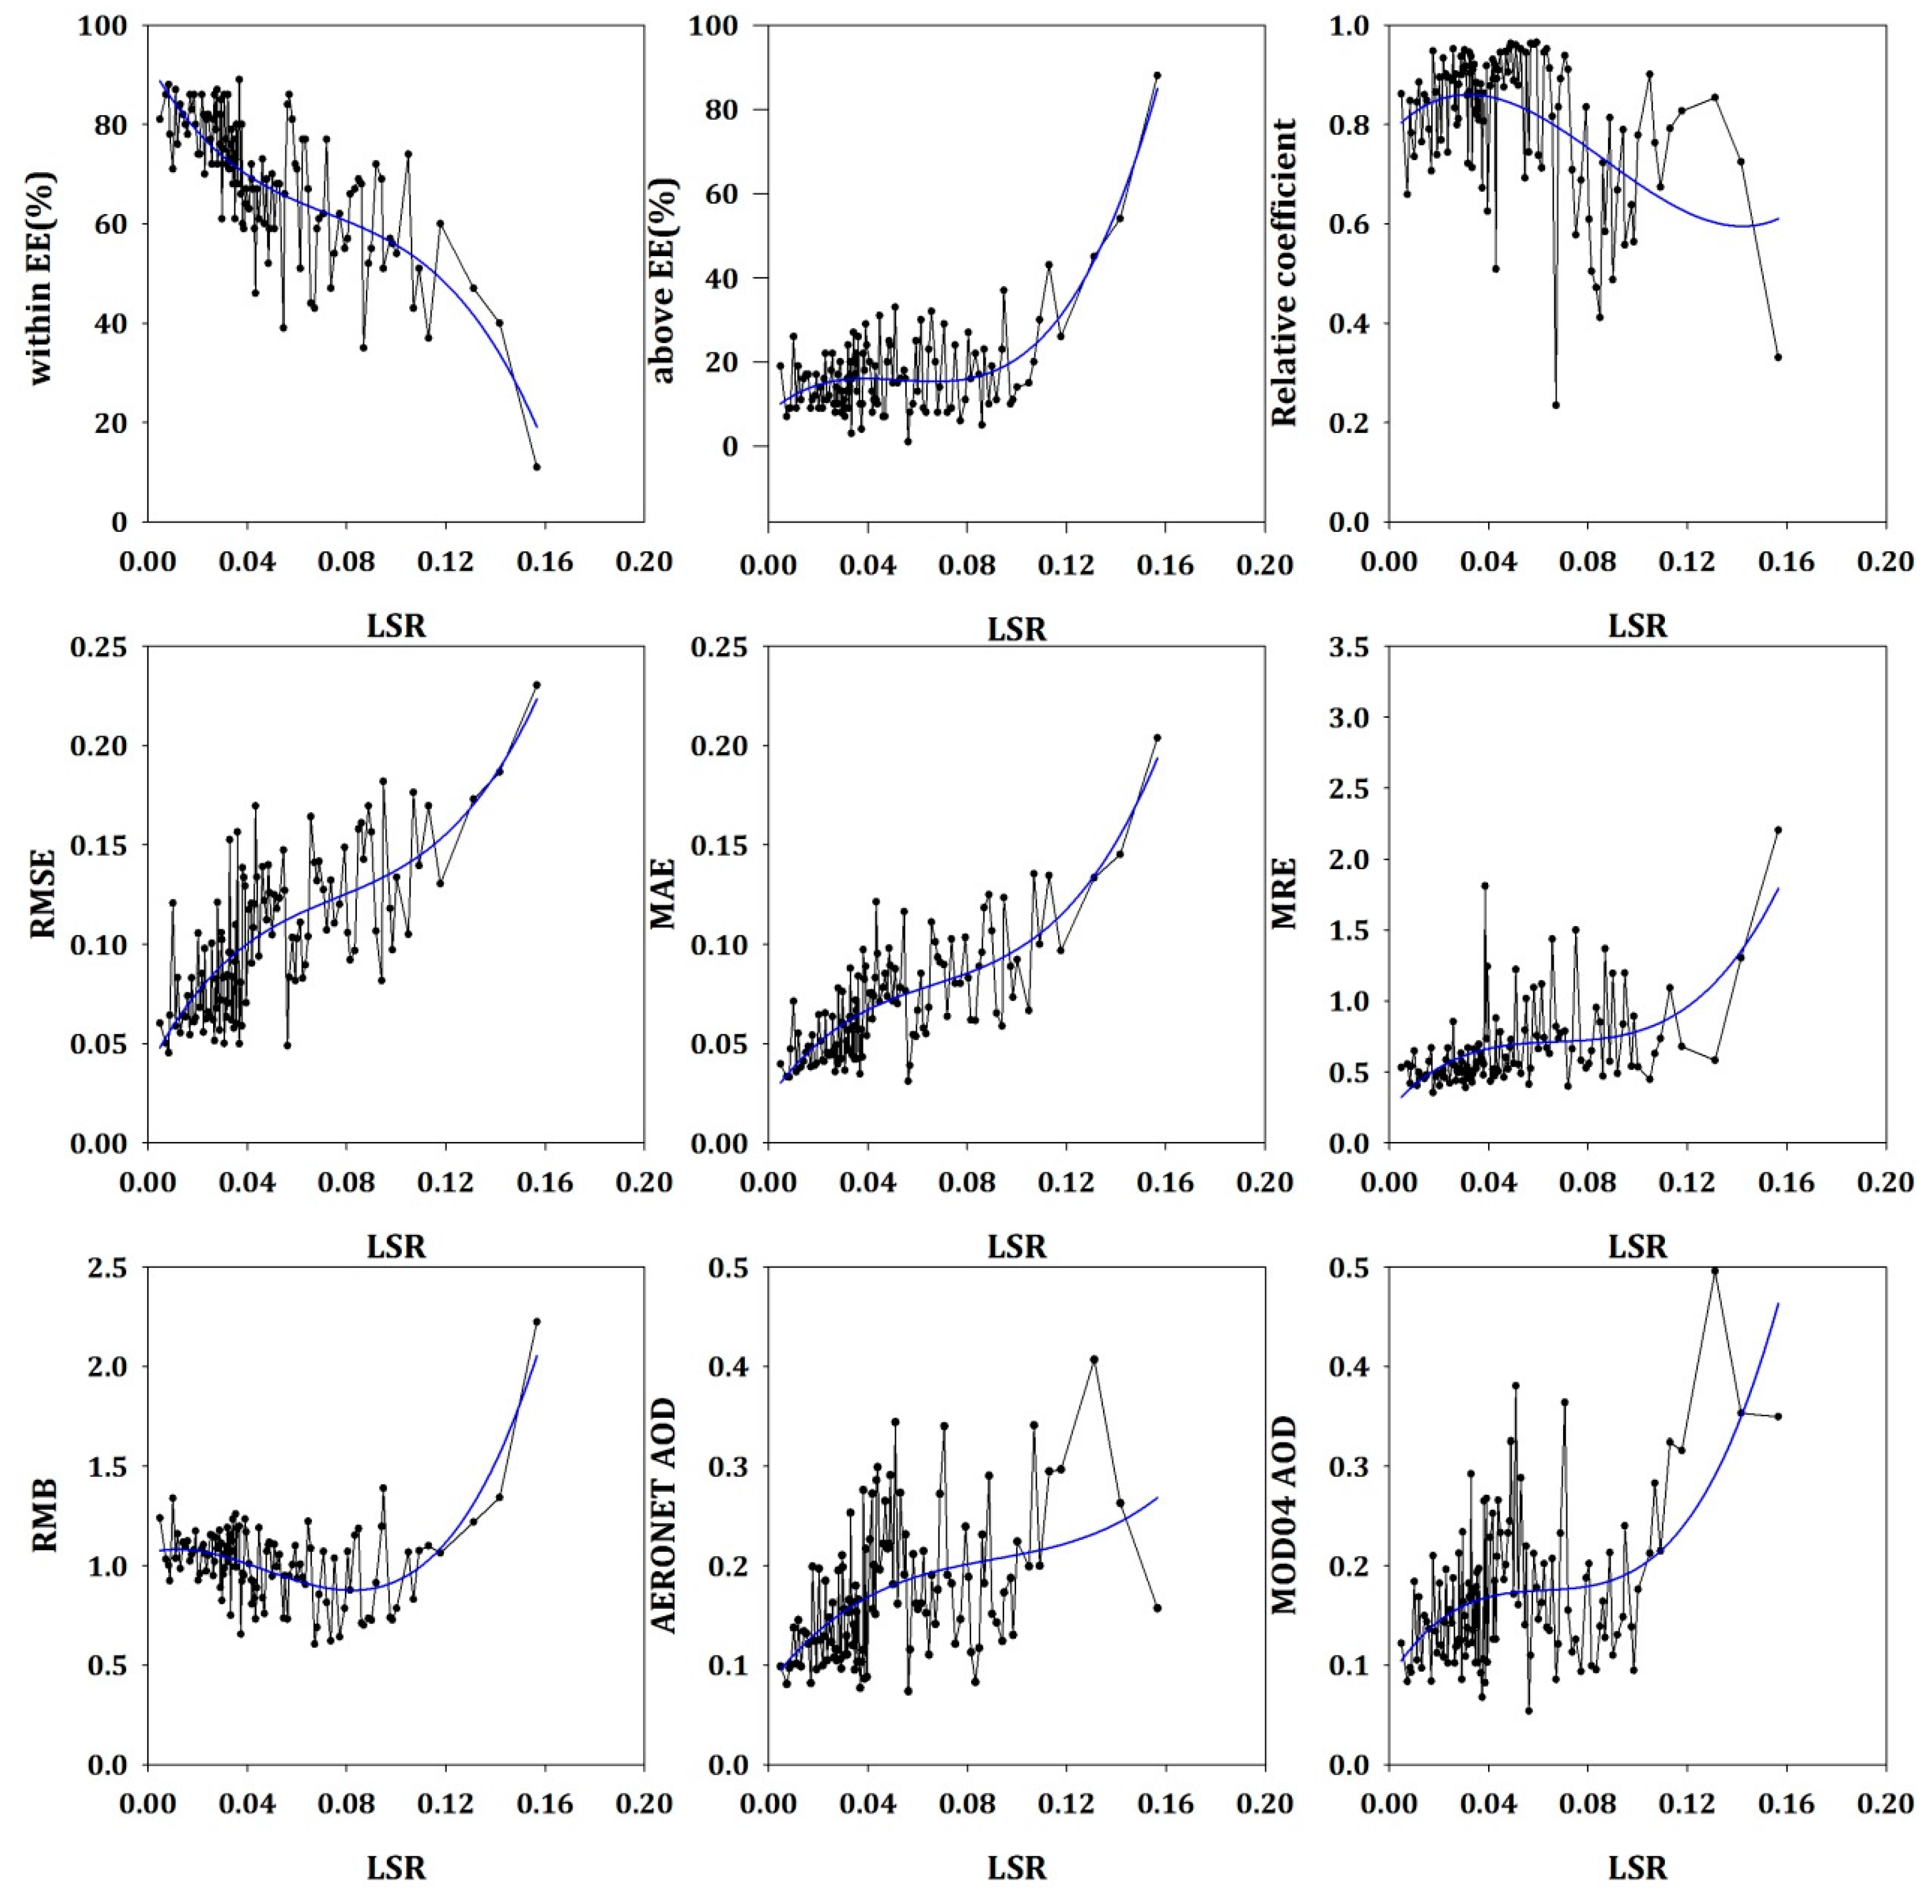
As the DB algorithm can be applied to perform AOD retrievals over urban and desert areas, the LSR selected for this research is enlarged to 0.16. Figure 10 shows that the accuracy indicators for the DB algorithm are similar to those of the DT algorithm and increase sharply when LSR is larger than 0.11. In areas with a mean LSR of 0.1566, 88% of the samples fall above the EE, and RMSE = 0.26, MAE = 0.23 and MRE = 2.2. The indicators display obvious changes in areas with LSR > 0.11, where 37% of the samples fall within the EE. In conclusion, the DB algorithm achieves AOD retrievals in areas with high LSR; however, its accuracy decreases quickly, and its estimates tend to overestimate the true values substantially.
To sum up, the accuracy of DT and DB AOD retrievals falls gradually as LSR increases, but they are highly reliable in low LSR areas. Additionally, the accuracy must be improved in areas with high LSR.
3.4. Variations in the Accuracy of MOD04 C6 DT and DB AOD Retrievals with Different Aerosol Types
Aerosol type is another key factor that influences AOD retrievals. Aerosol types differ in terms of their ability to reflect, scatter, and absorb solar radiation. Thus, incorrect aerosol type determinations lead to incorrect aerosol retrievals [35].
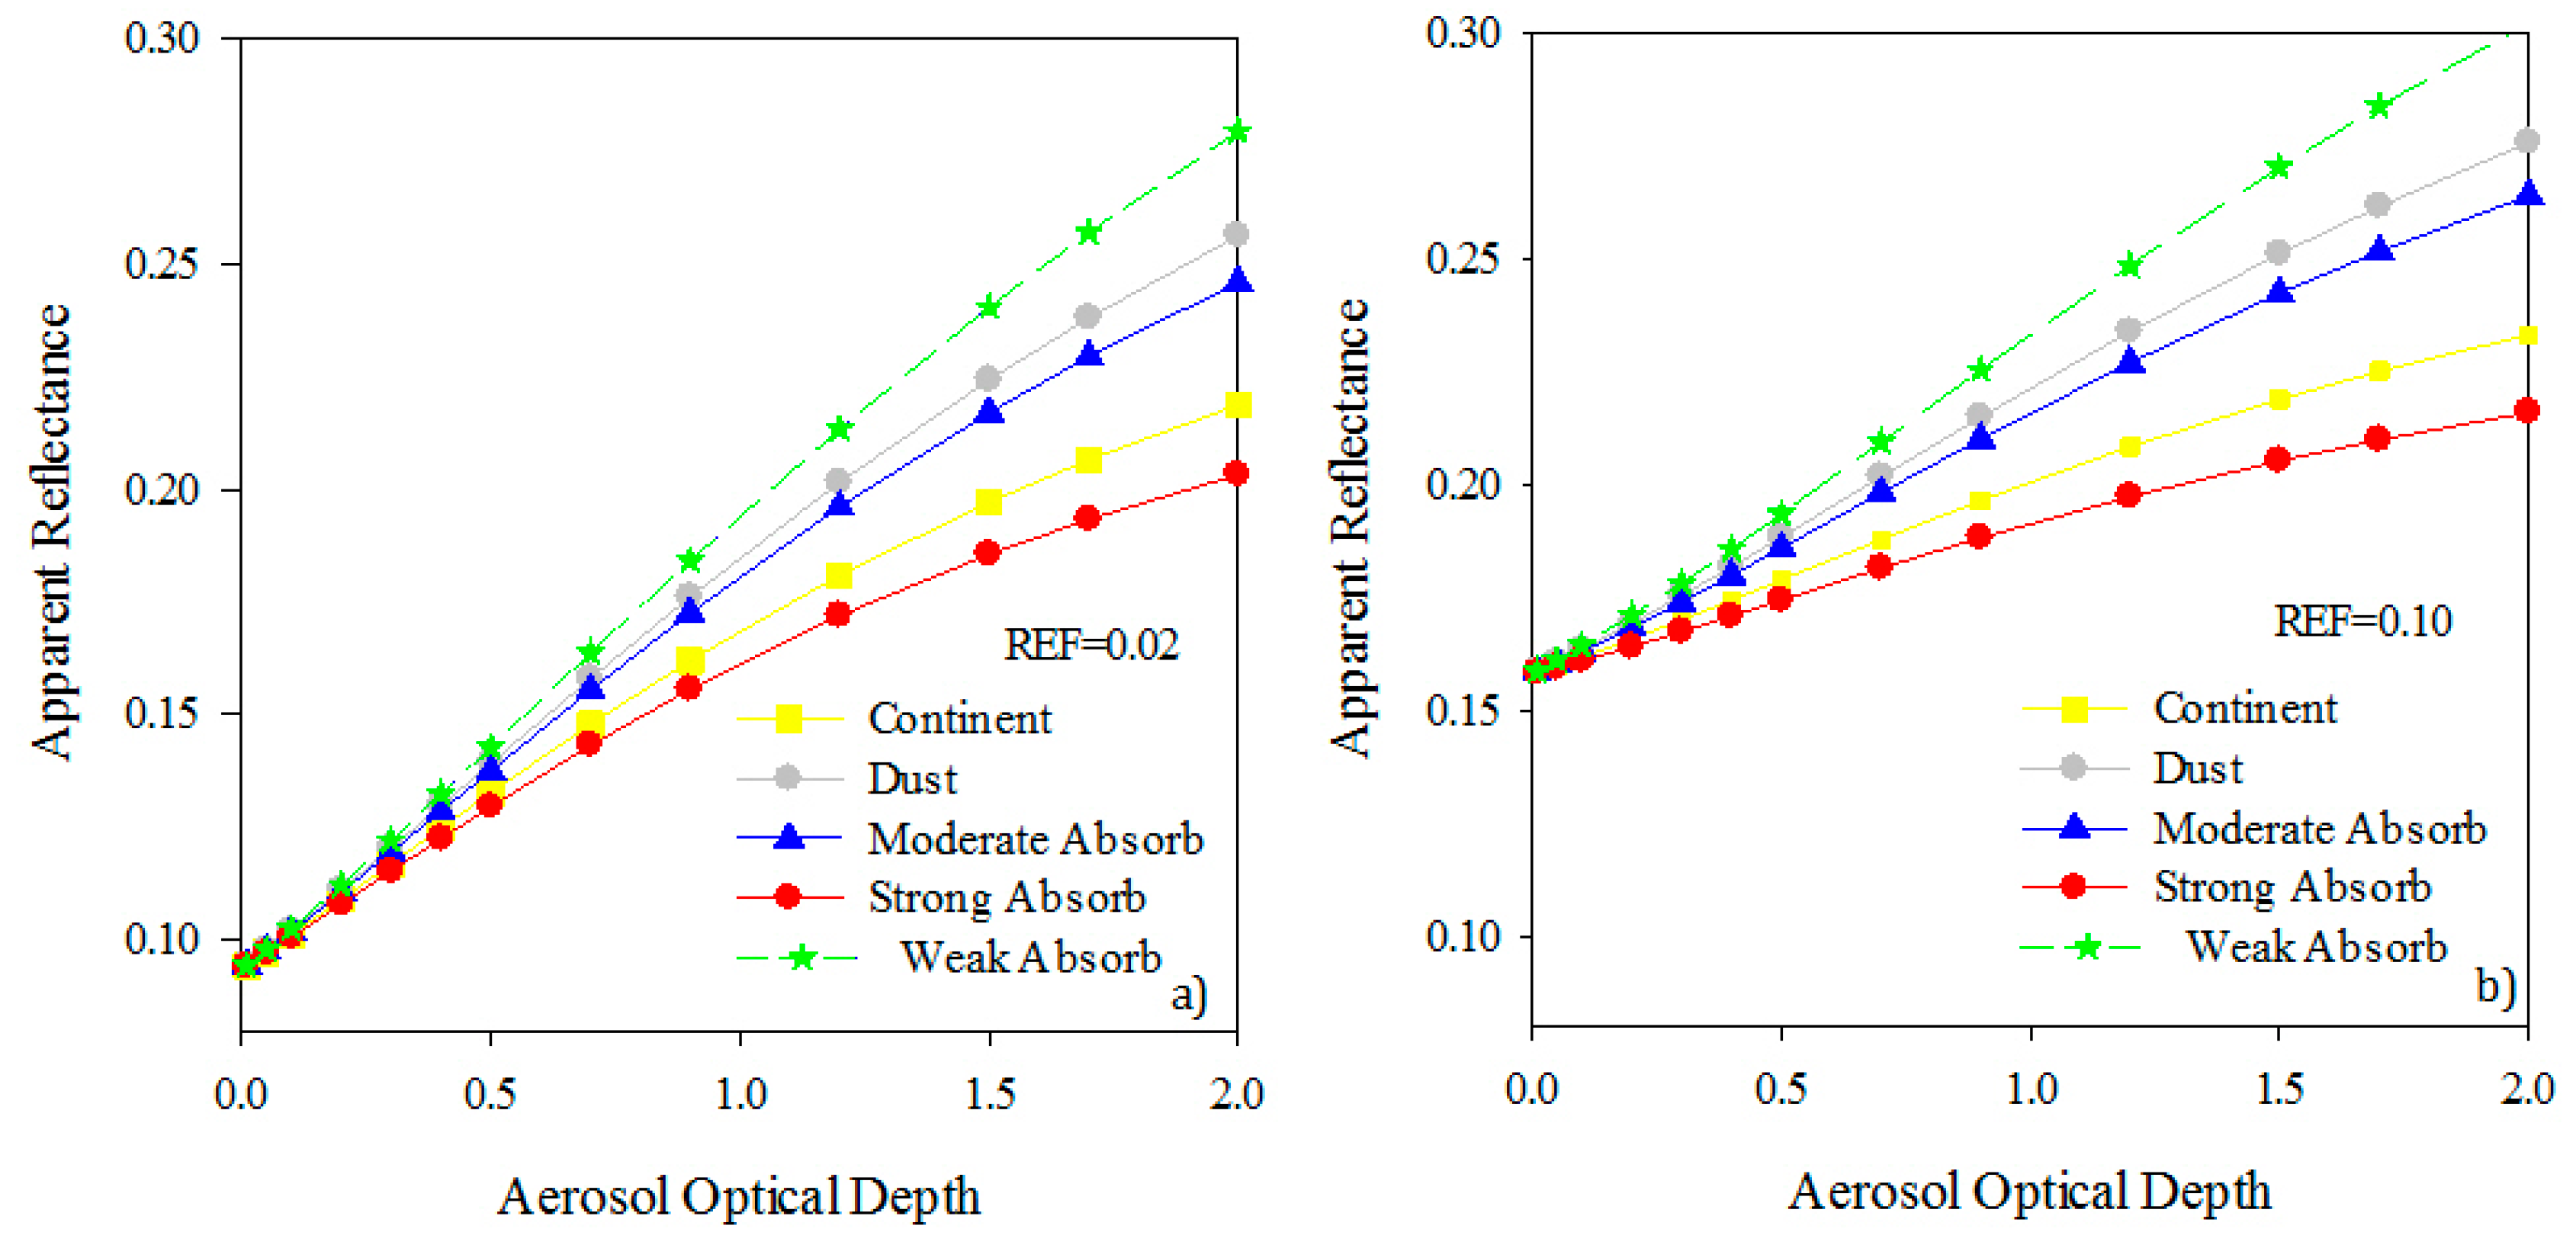
To study the sensitivity to AOD of different aerosol types, we also used the 6s model to simulate the variation in apparent reflectance with different AOD values in the blue band [36]. The results are shown in Figure 11. In the two panels of the figure, the LSR values are 0.02 (a) and 0.1 (b). In other words, these panels reflect dark and bright land surfaces. It can be seen that the relative sensitivity of aerosols is stable over both dark and bright areas. Weak absorbing and dust aerosols display the greatest sensitivity, followed by the moderate absorbing and continental aerosols; the strong absorbing aerosols are the least sensitive. The low sensitivity of continental and strong absorbing aerosols increases the difficulties associated with performing aerosol retrievals over areas with these two aerosol types.
Figure 12 presents scatterplots that indicate the accuracy of DT AOD retrievals and the variations of indicators. Panels a, b, c, d and e represent weak absorbing, moderate absorbing, strong absorbing, continental and dust aerosols, respectively. This figure indicates that more than 97% of the samples represent fine aerosols. In addition, fine aerosols are widely distributed, and the moderate absorbing aerosols are the most widely distributed, whereas continental aerosols are sparsely distributed and concentrated around dust aerosols. As continental and dust aerosols are distributed mainly in desert areas, aerosol retrievals cannot be performed by the DT algorithm; therefore, few samples are produced for continental and dust aerosols. Panels d and e of Figure 12 show that most of the AOD values are smaller than 0.5 and fall above the 1:1 line, indicating substantial overestimation. About a third (30.44%) of the continental aerosol samples and 50% of the dust aerosol samples fall within the EE for the following two reasons: (1) dust aerosols occur mainly in the Sahara Desert, and seasonal factors have little influence on these aerosols, leading to stable aerosol types and easy aerosol retrievals; and (2) the overall retrieval accuracy is affected by inevitable matching errors and a lack of samples (N = 10).
Among the fine aerosols, the weak absorbing type is associated with the greatest accuracy. This type is primarily distributed in eastern South America, western Europe and eastern Asia during the first three seasons, which feature favorable air conditions and small variations in aerosol type. In terms of weak absorbing aerosols, 66.68% of the samples fall within the EE, and RMSE = 0.1, MAE = 0.067 and RMB = 1.274. These values reflect substantial overestimation. These overestimates result from errors in determining LSR and aerosol type and the underlying surface distribution of large scale urban areas. Aerosol type determinations based on AERONET data contain some bias. For example, the Beijing-Tianjin-Hebei region, an area with high LSR and a complex distribution of land surface types, displays a complex mix of aerosol types. However, large-scale aerosol type products suggest that this area is dominated by a single aerosol type. Compared with the weak and moderate absorbing aerosols, the results for strong absorbing aerosols are distributed more evenly along the 1:1 line and show no obvious overestimation (RMB = 1.036; fraction above the EE = 21.15%; fraction below the EE = 20.00%). However, the air quality in this area is bad, and the AOD values of 27% of the samples are larger than 0.5. The retrieval of AOD values using the modified C6 product is greatly increased over areas of “dense smoke”. In view of the wide distribution of moderate absorbing aerosols, 58.31% of the samples fall within the EE with RMSE = 0.134 and RMB = 1.302, showing medium aerosol retrieval accuracy. As with the weak absorbing aerosols, the DT product displays considerable overestimation over areas with moderate absorbing aerosols.
As shown in Figure 13, the DB AOD accuracy is the highest over areas with weak absorbing aerosols, and all of the indicators show that the DB algorithm yields better results than the DT algorithm. A substantial majority (76.99%) of the samples fall within the EE, which is 15.46% greater than that of the DT algorithm; RMB = 1.071; the 15.93% overestimation represents a decrease; and the RMSE (0.075) and the MAE (0.051) decrease to 0.025 and 0.016, respectively, showing a high retrieval accuracy. The accuracy of areas with moderate absorbing aerosols is slightly lower than that of weak absorbing areas and substantially higher than areas covered by other aerosol types. For the DB AOD product, the accuracy is similar over areas with strong absorbing, land and dust aerosols, and the corresponding proportions of samples that fall within the EE are 55.28%, 51.59% and 51.39%; the RMSE values are 0.176, 0.151 and 0.157; the MAE values are 0.123, 0.107 and 0.11; and the RMB values are 0.983, 1.177 and 1.254, respectively. Moreover, the continental and dust aerosols are associated with higher RMB values that reflect severe overestimation, especially for the dust aerosols. In contrast, the RMB values of the continental aerosols are close to 1, indicating a small bias. In addition, the accuracy of DB AOD retrievals over areas with strong absorbing aerosols is slightly lower than that of the DT algorithm. In terms of the accuracy of DT AOD retrievals, the proportion of samples within the EE is 5.92% greater than that of DB, and the RMSE and MAE decrease by 0.018 and 0.012. Figure 12 and Figure 13 (panel c) indicate that the DT samples are closer to the AERONET data for AOD values less than 1, showing a good convergence effect. The DT samples reflect substantial overestimates for AOD values greater than 1 (a large proportion of the samples fall above the upper bound of the EE), whereas the DB samples are distributed close to the EE bounds and have a smaller bias than the DT samples. Taken together, the DT algorithm displays better adaptability over areas with strong absorbing aerosols, whereas the DB algorithm is more suitable for aerosol retrievals over areas that are heavily polluted over time. In view of areas with continental and dust aerosols, the DB AOD product shows severe overestimation, and 35.45% and 35.28% of the samples fall above the EE, and the RMB reaches 1.177 and 1.254. The scatterplot shows that the overestimation occurs in the area with low AOD values (<0.5), which is close to the Y-axis.
As is well known, the sensitivity of apparent reflectance decreases with increasing AOD; however, in areas with strong absorbing aerosols, more than 25% (DB) and 27% (DT) of the samples are larger than 0.5, far more than other aerosol types. The combination of the above two factors leads to a lower retrieval accuracy in areas with strong absorbing aerosols. In addition, the low sensitivity of continental aerosols also enhance the difficulties involved in performing aerosol retrievals over areas with continental aerosols. High-frequency variations that occur due to causes including dust intrusions, meteorological or volcanic factors also have some impact on the accuracy of inversion.
In conclusion, both the DT and DB products have the highest accuracy and reliability over areas with weak absorbing aerosols; on the other hand, the opposite conclusion can be drawn for areas with dust aerosols. The accuracy of the DB product is higher than that of the DT product over most areas, except for those with strong absorbing aerosols.
4. Conclusions
This study aims to investigate the global accuracy of the MODIS DT and DB aerosol products over continental AERONET sites in areas with different aerosol types and LSR variations. The results are as follows.
- The DB results are closer to the data observed from AERONET; a higher proportion of the samples fall within the EE, and the values of the RMSE, MAE and RMB are lower. Therefore, the DB algorithm has greater reliability and a wider range of application. The reason for this accuracy difference is that the underestimates of LSR produced by the DT algorithm lead to severe overestimation of AOD, whereas the DB algorithm estimates LSR more accurately when combined with the LSR database.
- The DT and DB algorithms display the highest AOD retrieval accuracy over areas with low reflectance, where the fluctuations decrease as the LSR increase. Although the DB algorithm implements AOD retrievals over high reflectance areas, the overestimation is obvious.
- Both algorithms display high retrieval accuracy over areas with weakly absorbing aerosols, whereas the accuracy is low over areas with continental and dust aerosols. The DB algorithm has an overall advantage in performing retrievals for all aerosol types, whereas the accuracy is slightly lower than that of the DT algorithm, given the underestimation of strongly absorbing aerosols over areas with low AOD.
Acknowledgments
The MODIS data used in the paper are available from NASA. The authors thank the National Natural Science Foundation of China [41771408] and the Outstanding Youth Foundation of Shandong Province [JQ201211].
Author Contributions
All of the authors made substantial contributions to this work. Lin Sun and Qingxin Wang designed the experiments and prepared the paper; Jing Wei, Qinhuo Liu and Liangfu Chen provided advice. Yikun Yang and Ruibo Li assisted in the collection and processing of the ground-based data and the satellite remote sensing data.
Conflicts of Interest
The authors declare no conflict of interest.
References
- Wei, J.; Sun, L. Comparison and Evaluation of Different MODIS Aerosol Optical Depth Products Over the Beijing-Tianjin-Hebei Region in China. IEEE J. Sel. Top. Appl. Earth Obs. Remote Sens. 2017, 10, 835–844. [Google Scholar] [CrossRef]
- Levy, R.C.; Mattoo, S.; Munchak, L.A.; Rember, L.A.; Sayer, A.M.; Hsu, N.C. The Collection 6 MODIS aerosol products over land and ocean. Atmos. Meas. Tech. 2013, 6, 2989–3034. [Google Scholar] [CrossRef]
- Colvile, R.N.; Hutchinson, E.J.; Warren, R.F. The transport sector as a source of air pollution. Atmos. Environ. 2001, 35, 1537–1565. [Google Scholar] [CrossRef]
- Bilal, M.; Nichol, J.E.; Bleiweiss, M.P.; Dubois, D. A Simplified high resolution MODIS Aerosol Inversion Algorithm (SARA) for use over mixed surfaces. Remote Sens. Environ. 2013, 136, 135–145. [Google Scholar] [CrossRef]
- Nichol, J.E.; Bilal, M. Validation of MODIS 3 km Resolution Aerosol Optical Depth Retrievals Over Asia. Remote Sens. 2016, 8, 328. [Google Scholar] [CrossRef]
- Bilal, M.; Nichol, J.E.; Chan, P.W. Validation and accuracy assessment of a Simplified Aerosol Retrieval Algorithm (SARA) over Beijing under low and high aerosol loadings and dust storms. Remote Sens. Environ. 2014, 153, 50–60. [Google Scholar] [CrossRef]
- Zhou, C.Y.; Liu, Q.H.; Tang, Y.; Wang, K.; Sun, L.; He, Y.X. Comparison between MODIS aerosol product C004 and C005 and evaluation of their applicability in the north of China. J. Remote Sens. 2009, 13, 854–872. [Google Scholar]
- Ma, X.; Bartlett, K.; Harmon, K.; Yu, F. Comparison of AOD between CALIPSO and MODIS: Significant differences over major dust and biomass burning. Atmos. Meas. Tech. 2013, 6, 2391–2401. [Google Scholar] [CrossRef]
- Levy, R.C.; Remer, L.A.; Kleidman, R.G.; Mattoo, S.; Ichoku, C.; Kahn, R.; Eck, T.F. Global evaluation of the Collection 5 MODIS dark-target aerosol products over land. Atmos. Chem. Phys. 2010, 10, 10399–10420. [Google Scholar] [CrossRef] [Green Version]
- Tian, X.P.; Sun, L. Retrieval of Aerosol Optical Depth over Arid Areas from MODIS Data. ATMOCZ 2016, 7, 134. [Google Scholar] [CrossRef]
- Kaufman, Y.J.; Tanré, D.; Remer, L.A.; Vermote, E.F.; Chu, A.; Holben, B.N. Operational remote sensing of tropospheric aerosol over land from EOS moderate resolution imaging spectroradiometer. J. Geophys. Res. 1997, 102, 17051–17067. [Google Scholar] [CrossRef]
- Levy, R.C.; Remer, L.A.; Mattoo, S.; Vermote, E.F.; Kaufman, Y.J. Second-generation operational algorithm: Retrieval of aerosol properties over land from inversion of moderate resolution imaging spectroradiometer spectral reflectance. J. Geophys. Res. Atmos. 2007, 112, 1–21. [Google Scholar] [CrossRef]
- Remer, L.A.; Kaufman, Y.J.; Tanré, D.; Mattoo, S.; Chu, D.A.; Martins, J.V.; Li, R.-R.; Ichoku, C.; Levy, R.C.; Kleidman, R.G.; et al. The MODIS Aerosol Algorithm, Products, and Validation. J. Atmos. Sci. 2005, 62, 947–973. [Google Scholar] [CrossRef]
- Levy, R.C.; Remer, L.A.; Tanré, D.; Mattoo, S.; Kaufman, Y.J. Algorithm for Remote Sensing of Tropospheric Aerosol over Dark Targets from MODIS: Collections 005 and 051. Revision 2, MODIS Algorithm Theoretical Basis Document. Available online: https://pdfs.semanticscholar.org/e5f8/fa50577584a2ef9d2ed6417b4156fb9b474b.pdf (accessed on 7 July 2017).
- Holben, B.N.; Tanré, D.; Smirnov, A.; Eck, T.F.; Slutsker, I.; Abuhassan, N.; Newcomb, W.W.; Schafer, J.S.; Chatenet, B.; Lavenu, F.; et al. An emerging ground-based aerosol climatology: Aerosol optical depth from AERONET. J. Geophys. Res. Atmos. 2001, 106, 12067–12097. [Google Scholar] [CrossRef]
- Hsu, N.C.; Jeong, M.-J.; Bettenhausen, C.; Sayer, A.M.; Hansell, R.; Seftor, C.S. Enhanced deep blue aerosol retrieval algorithm: The second generation. J. Geophys. Res. Atmos. 2013, 118, 9296–9315. [Google Scholar] [CrossRef]
- King, M.D.; Menzel, W.P.; Kaufman, Y.J.; Tanré, D.; Gao, B.C.; Platnick, S.; Ackerman, S.A.; Remer, L.A.; Pincus, R.; Hubanks, P.A. Cloud and aerosol properties, precipitable water, and profiles of temperature and water vapor from MODIS. IEEE Trans. Geosci. Remote Sens. 2003, 41, 442–458. [Google Scholar] [CrossRef]
- Bilal, M.; Nichol, J.E. Evaluation of MODIS aerosol retrieval algorithms over the Beijing-Tianjin-Hebei region during low to very high pollution events. J. Geophys. Res. Atmos. 2015, 120, 7941–7957. [Google Scholar] [CrossRef]
- Hsu, C.N.; Tsay, S.C.; King, M.D.; Herman, J.R. Deep Blue Retrievals of Asian Aerosol Properties during ACE-Asia. IEEE Trans. Geosci. Remote Sens. 2006, 44, 3180–3195. [Google Scholar] [CrossRef]
- Hsu, N.C.; Tsay, S.C.; King, M.D.; Herman, J.R. Aerosol properties over bright-reflecting source regions. IEEE Trans. Geosci. Remote Sens. 2004, 42, 557–569. [Google Scholar] [CrossRef]
- Friedl, M.A.; McIvera, D.K.; Hodgesa, J.C.F.; Zhanga, X.Y.; Muchoneyb, D.; Strahlera, A.H.; Woodcocka, C.E.; Gopala, S.; Schneidera, A.; Coopera, A.; et al. Global land cover mapping from MODIS: Algorithms and early results. Remote Sens. Environ. 2002, 83, 287–302. [Google Scholar] [CrossRef]
- Munchak, L.A.; Levy, R.C.; Mattoo, S.; Remer, L.A. MODIS 3 km aerosol product: Applications over land in an urban/suburban region. Atmos. Meas. Tech. 2013, 6, 1747–1759. [Google Scholar] [CrossRef]
- Omar, A.H.; Won, J.G.; Winker, D.M.; Yoon, S.C.; Dubovik, O.; McCormick, M.P. Development of global aerosol models using cluster analysis of Aerosol Robotic Network (AERONET) measurements. J. Geophys. Res. 2005, 110, 10–14. [Google Scholar] [CrossRef]
- Jalal, K.A.; Asmat, A.; Ahmad, N. Aerosol Optical Depth (AOD) Retrieval Method using MODIS. In Proceedings of the 2015 International Conference on Space Science and Communication (IconSpace), Longkawi, Malaysia, 10–12 August 2015. [Google Scholar]
- Sayer, A.M.; Hsu, N.C.; Bettenhausen, C.; Jeong, M.J. Validation and uncertainty estimates for MODIS Collection 6 “Deep Blue” aerosol data. J. Geophys. Res. Atmos. 2013, 118, 7864–7872. [Google Scholar] [CrossRef]
- Shi, Y.; Zhang, J.; Reid, J.S.; Hyer, E.J.; Hsu, N.C. Critical evaluation of the MODIS Deep Blue aerosol optical depth product for data assimilation over North Africa. Atmos. Meas. Tech. 2012, 5, 7815–7865. [Google Scholar] [CrossRef]
- Levy, R.C.; Remer, L.A.; Dubovik, O. Global aerosol optical properties and application to Moderate Resolution Imaging Spectroradiometer aerosol retrieval over land. J. Geophys. Res. Atmos. 2007, 112, 3710–3711. [Google Scholar] [CrossRef]
- Holben, B.N.; Eck, T.F.; Slutsker, I.; Tanré, D.; Buis, J.P. AERONET—A Federated Instrument Network and Data Archive for Aerosol Characterization. Remote Sens. Environ. 1998, 66, 1–16. [Google Scholar] [CrossRef]
- Sun, L.; Wei, J.; Bilal, M.; Tian, X.P.; Jia, C. Aerosol Optical Depth Retrieval over Bright Areas Using Landsat 8 OLI Images. Remote Sens. 2016, 8, 23. [Google Scholar] [CrossRef]
- Sun, L.; Wei, J.; Wang, J.; Mi, X.; Guo, Y.; Lv, Y.; Yang, Y.K.; Gan, P.; Zhou, X.Y.; Jia, C.; Tian, X.P. A universal dynamic threshold cloud detection algorithm (UDTCDA) supported by a prior surface reflectance database. J. Geophys. Res. Atmos. 2016, 121, 7172–7196. [Google Scholar] [CrossRef]
- Sun, L.; Wei, J.; Jia, C.; Yang, Y.K.; Zhou, X.Y. A high resolution global dataset of aerosol optical depth over land from MODIS data. In Proceedings of the IEEE International Geoscience & Remote Sensing Symposium, Beijing, China, 10–15 July 2016. [Google Scholar]
- Mishchenko, M.I.; Cairns, B.; Hansen, J.E.; Travis, L.D.; Burg, R.; Kaufman, Y.J.; Martins, J.V.; Shettle, E.P. Monitoring of aerosol forcing of climate from space: Analysis of measurement requirements. J. Quant. Spectrosc. Radiat. Transf. 2004, 88, 149–161. [Google Scholar] [CrossRef]
- Hansen, J.; Rossow, W.; Carlson, B.; Lacis, A.; Travis, L.; Del Genio, A.; Fung, I.; Cairns, B.; Mishchenko, M.; Sato, M. Low-cost long-term monitoring of global climate forcings and feedbacks. Clim. Chang. 1995, 31, 247–271. [Google Scholar] [CrossRef]
- Li, Y.J.; Xue, Y.; Leeuw, G.D.; Li, C.; Yang, L.K.; Hou, T.T.; Marir, F. Retrieval of aerosol optical depth and surface reflectance over land from NOAA AVHRR data. Remote Sens. Environ. 2013, 133, 1–20. [Google Scholar] [CrossRef]
- Bassani, C.; Manzo, C.; Braga, F.; Bresciani, M.; Giardino, C. The impact of the microphysical properties of aerosol on the atmospheric correction of hyperspectral data in coastal waters. Atmos. Meas. Tech. 2015, 8, 1593–1604. [Google Scholar] [CrossRef]
- Vermote, E.F.; Tanre, D.; Deuze, J.L.; Herman, M. Second Simulation of the Satellite Signal in the Solar Spectrum, 6S: An Overview. IEEE Trans. Geosci. Remote Sens. 1997, 35, 675–686. [Google Scholar] [CrossRef]
Figure 1.
Monthly composite images of global 10-km surface reflectance in the blue band (0.47 μm; (a–d) represent January, April, July and October, respectively).
Figure 1.
Monthly composite images of global 10-km surface reflectance in the blue band (0.47 μm; (a–d) represent January, April, July and October, respectively).

Figure 2.
Global aerosol distribution in each season ((a–d) represent spring, summer, autumn and winter, respectively).
Figure 2.
Global aerosol distribution in each season ((a–d) represent spring, summer, autumn and winter, respectively).
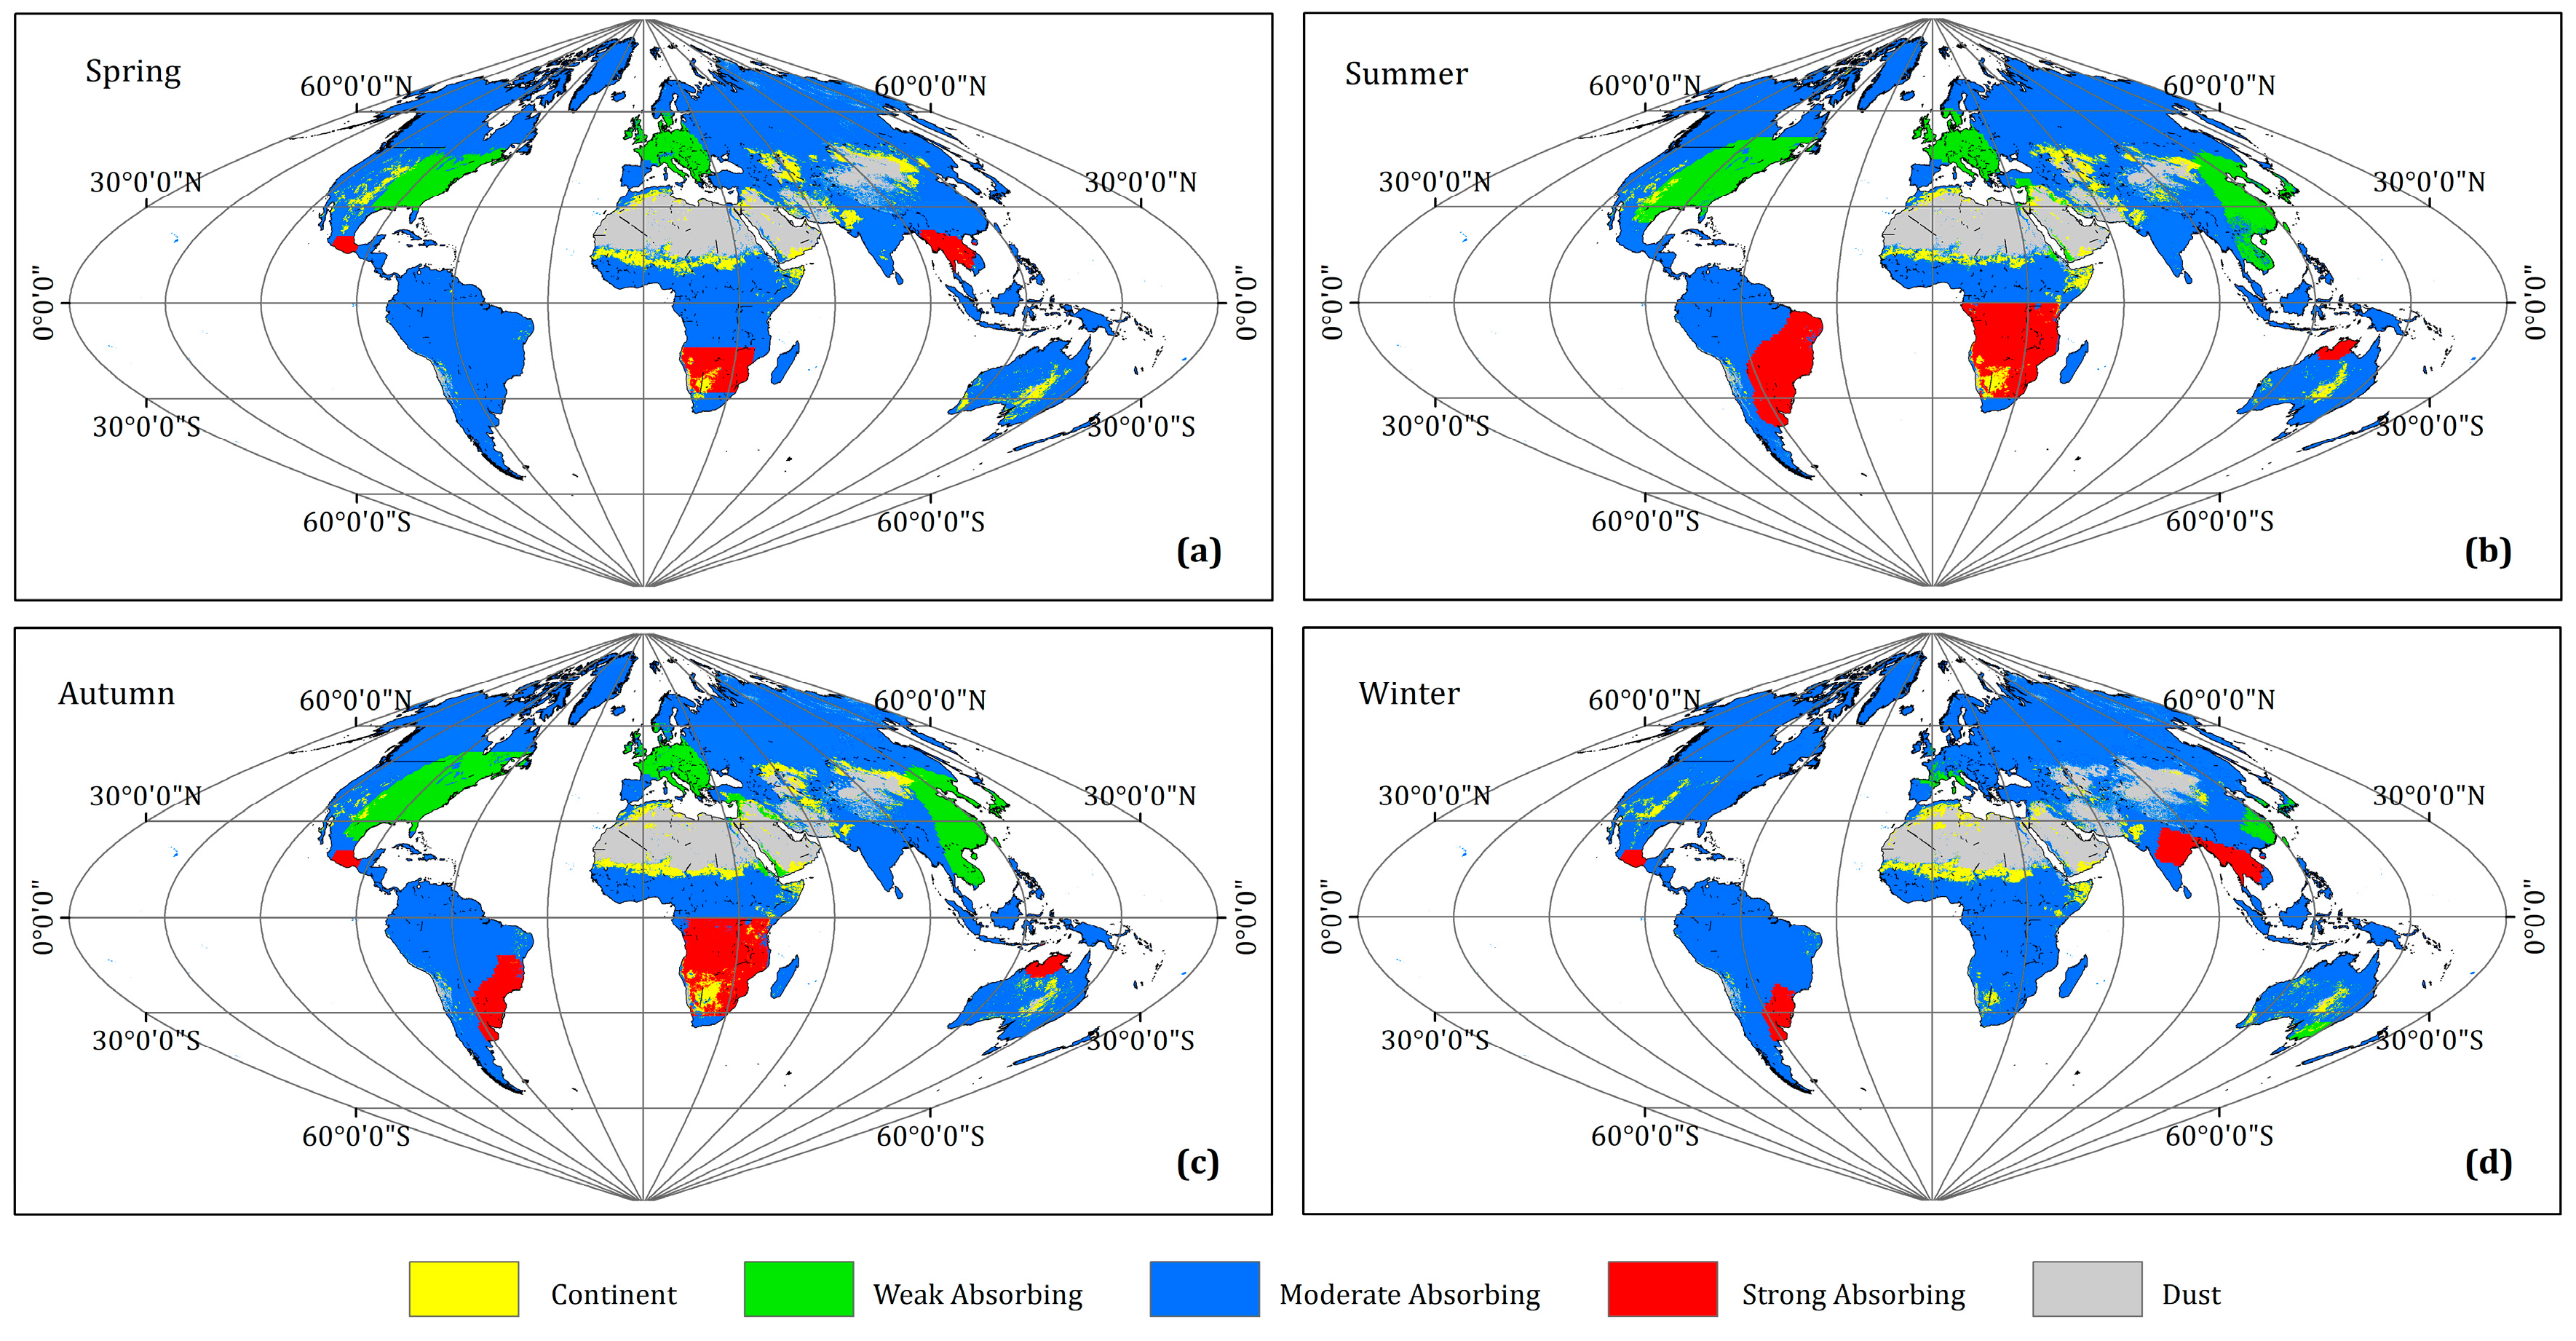
Figure 3.
Global aerosol distribution of MOD04 C6 AOD products over land on day 165 ((a) MOD04 C6 DT; (b) MOD04 C6 DB). DT: Dark Target; DB: Deep Blue.
Figure 3.
Global aerosol distribution of MOD04 C6 AOD products over land on day 165 ((a) MOD04 C6 DT; (b) MOD04 C6 DB). DT: Dark Target; DB: Deep Blue.

Figure 4.
Scatterplot of MOD04 DT (a) and DB (b) AOD values and AERONET AOD values at 550 nm (resolution: 10 km). AOD: aerosol optical depth; AERONET: Aerosol Robotic Network.
Figure 4.
Scatterplot of MOD04 DT (a) and DB (b) AOD values and AERONET AOD values at 550 nm (resolution: 10 km). AOD: aerosol optical depth; AERONET: Aerosol Robotic Network.
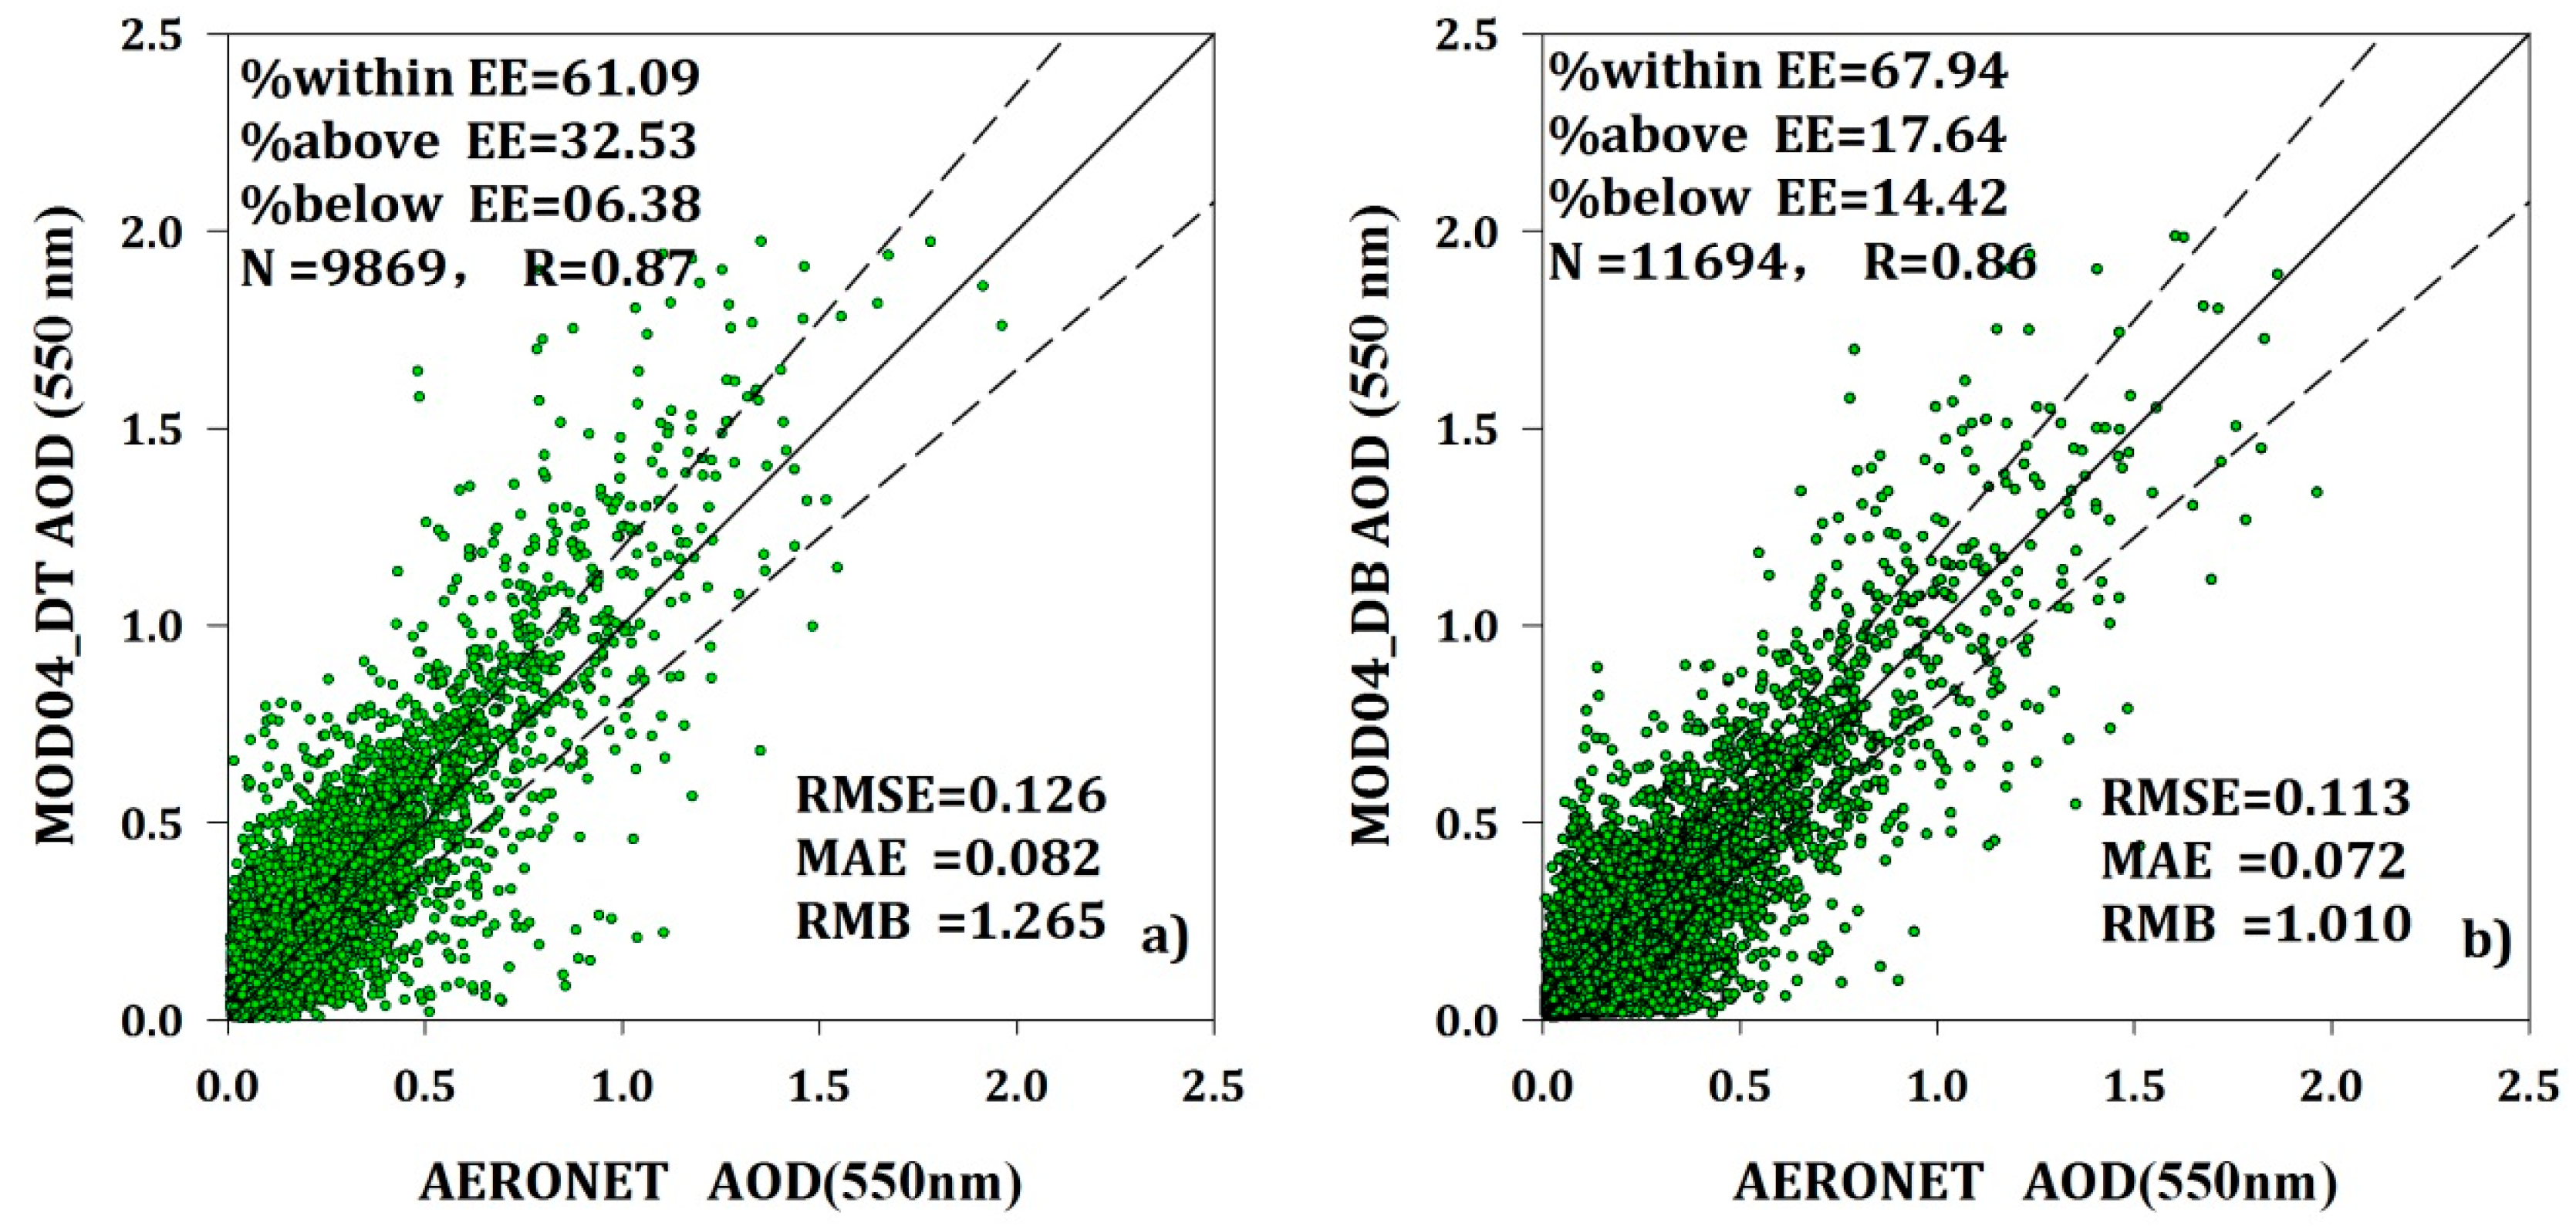
Figure 5.
Deviation histograms for different AERONET AOD ranges.

Figure 6.
Spectral curves of different vegetation types.

Figure 7.
Simulations of AOD and apparent reflectance for different surface reflectances.

Figure 8.
Validation of MOD04 DB and DT products with AERONET AOD values for different surface reflectances.
Figure 8.
Validation of MOD04 DB and DT products with AERONET AOD values for different surface reflectances.
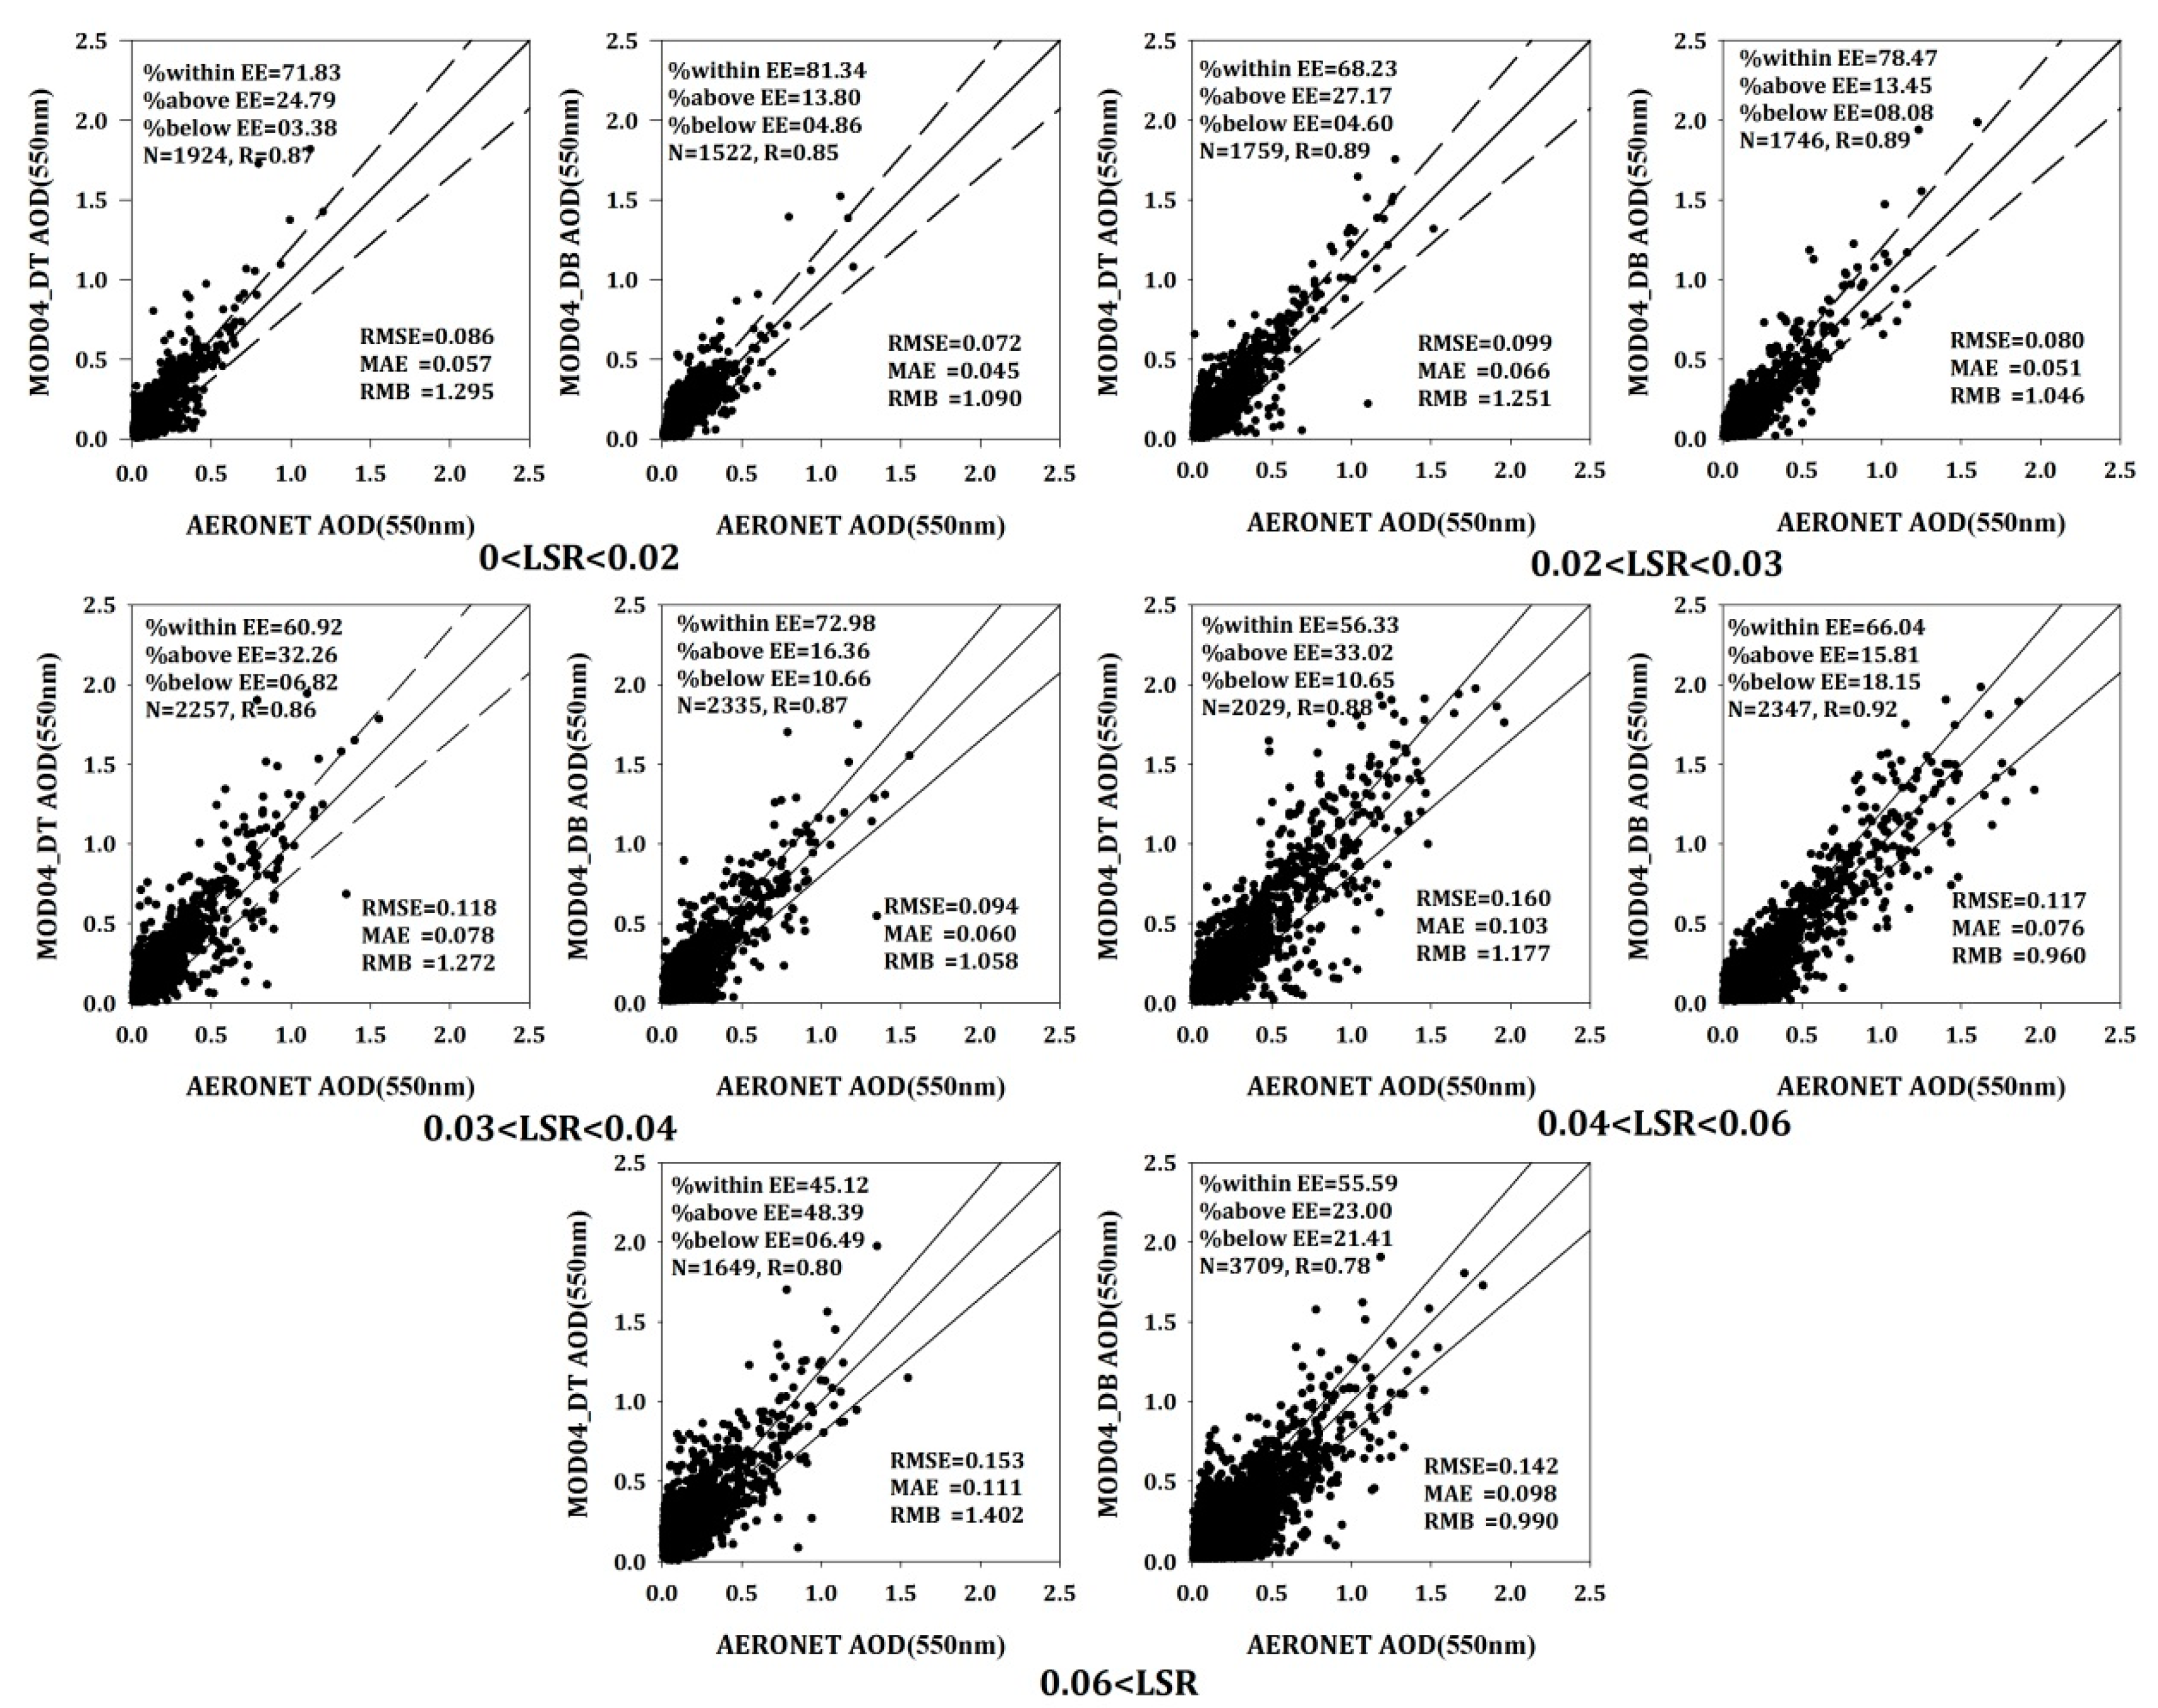
Figure 9.
Variations in the accuracy of DT AOD retrievals with land surface reflectance (LSR).

Figure 10.
Variations in the accuracy of DB AOD retrievals for different LSR.

Figure 11.
Variations in apparent reflectance of different aerosol types with increasing AOD values under the surface reflectance of 0.02 (a) and 0.10 (b).
Figure 11.
Variations in apparent reflectance of different aerosol types with increasing AOD values under the surface reflectance of 0.02 (a) and 0.10 (b).

Figure 12.
The accuracy of DT AOD retrievals over areas with different aerosol types.
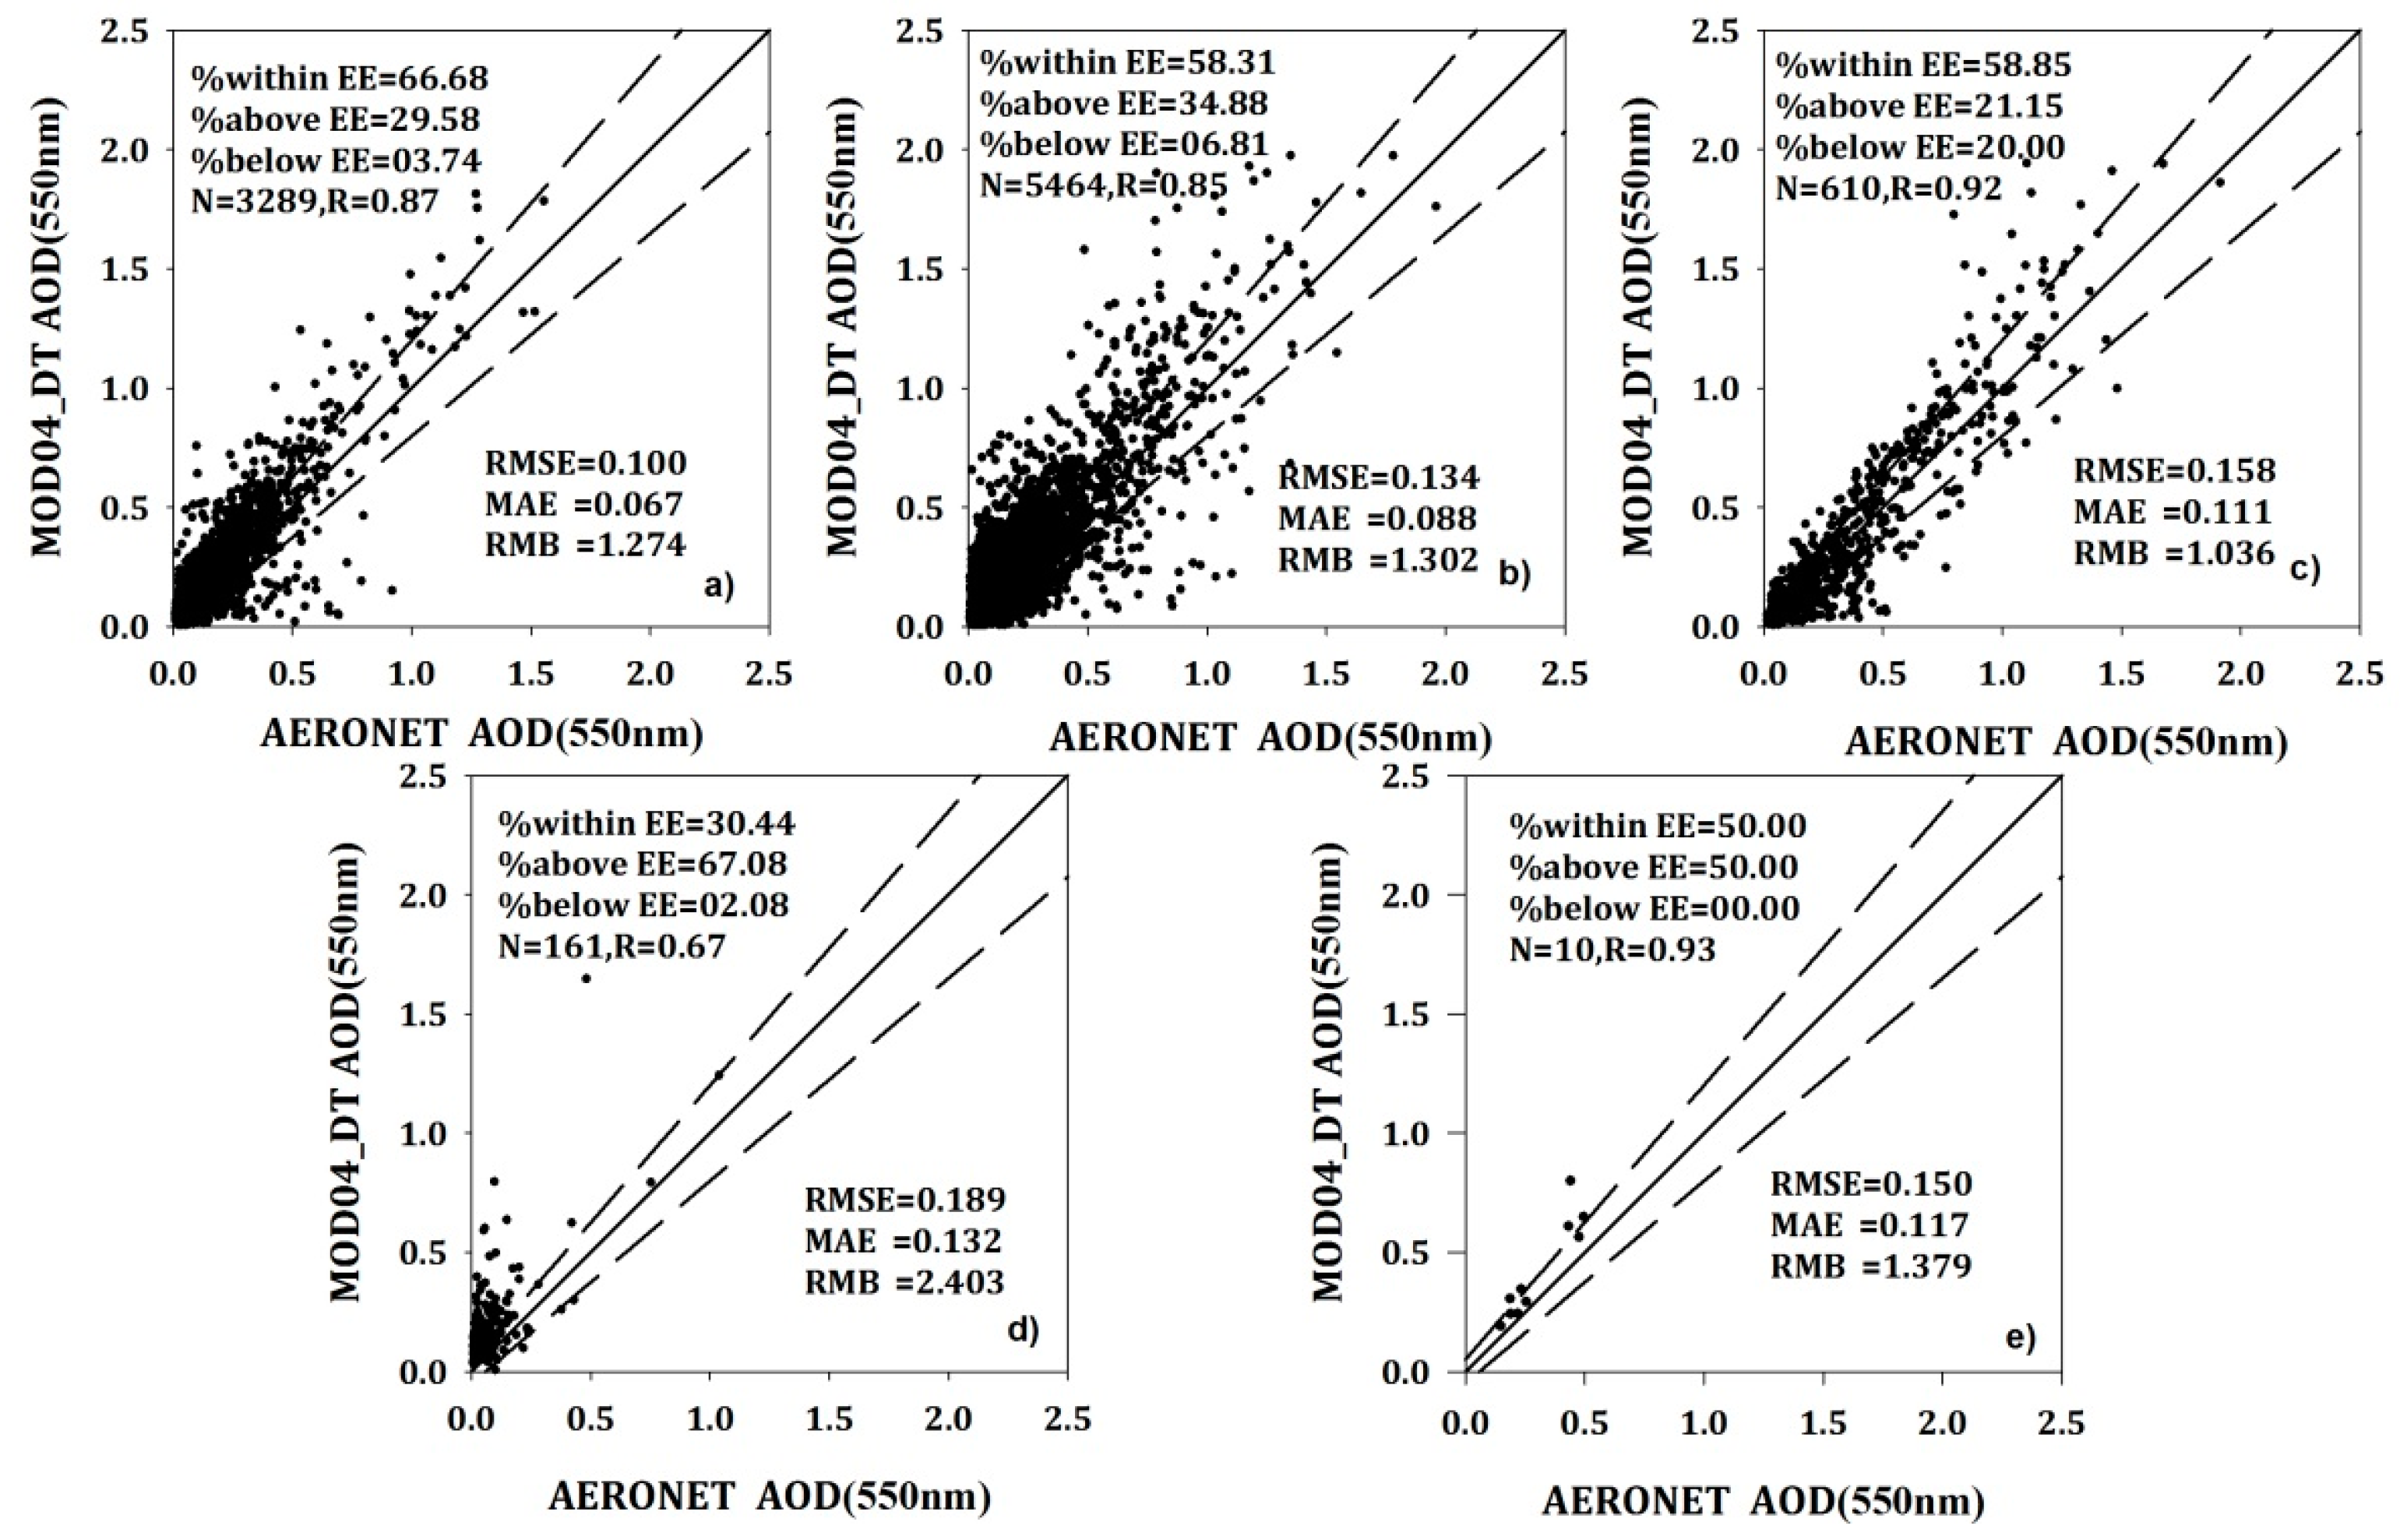
Figure 13.
DB AOD retrieval accuracy over areas with different aerosol types.


Table 1.
Parameters of each aerosol type.
| Aerosol Type | Single Scattering Albedo (SSA) 0.47/0.55/0.66 μm | Asymmetry Factor g 0.47/0.55/0.66 μm |
|---|---|---|
| Continent | 0.90/0.89/0.88 | 0.64/0.63/0.63 |
| Weak absorbing | 0.96/0.95/0.94 | 0.71/0.68/0.65 |
| Moderate absorbing | 0.93/0.92/0.91 | 0.68/0.65/0.61 |
| Strong absorbing | 0.88/0.87/0.86 | 0.64/0.60/0.56 |
| Dust | 0.94/0.95/0.96 | 0.71/0.70/0.69 |
Table 2.
Surface reflectance at 2.1 μm, 0.47 μm and 0.66 μm.
| Vegetation Type | Blue Band (0.47 µm) | Red Band (0.66 µm) | Near-Infrared Band (2.1 µm) |
|---|---|---|---|
| Walnut | 0.06540 | 0.08080 | 0.15170 |
| Black Brush | 0.04160 | 0.05020 | 0.05535 |
| Lawn Grass | 0.03658 | 0.04214 | 0.12793 |
| Firtree | 0.04923 | 0.05986 | 0.07373 |
| Maple | 0.03670 | 0.03794 | 0.15050 |
© 2017 by the authors. Licensee MDPI, Basel, Switzerland. This article is an open access article distributed under the terms and conditions of the Creative Commons Attribution (CC BY) license (http://creativecommons.org/licenses/by/4.0/).
Share and Cite
MDPI and ACS Style
Wang, Q.; Sun, L.; Wei, J.; Yang, Y.; Li, R.; Liu, Q.; Chen, L. Validation and Accuracy Analysis of Global MODIS Aerosol Products over Land. Atmosphere 2017, 8, 155. https://doi.org/10.3390/atmos8080155
AMA Style
Wang Q, Sun L, Wei J, Yang Y, Li R, Liu Q, Chen L. Validation and Accuracy Analysis of Global MODIS Aerosol Products over Land. Atmosphere. 2017; 8(8):155. https://doi.org/10.3390/atmos8080155
Chicago/Turabian StyleWang, Qingxin, Lin Sun, Jing Wei, Yikun Yang, Ruibo Li, Qinhuo Liu, and Liangfu Chen. 2017. "Validation and Accuracy Analysis of Global MODIS Aerosol Products over Land" Atmosphere 8, no. 8: 155. https://doi.org/10.3390/atmos8080155
Note that from the first issue of 2016, this journal uses article numbers instead of page numbers. See further details here.