Article

Multi-Year (2013–2016) PM2.5 Wildfire Pollution Exposure over North America as Determined from Operational Air Quality Forecasts

1
Canadian Meteorological Centre Operations, Environment and Climate Change Canada, 2121 Rte Transcanadienne, Montreal, QC H9P 1J3, Canada
2
Air Quality Research Division, Environment and Climate Change Canada, Toronto, ON M3H 5T4, Canada
3
Environmental Health Services, British Columbia Centre for Disease Control, Vancouver, BC V5Z 4R4, Canada
*
Author to whom correspondence should be addressed.
Atmosphere 2017, 8(9), 179; https://doi.org/10.3390/atmos8090179
Submission received: 30 June 2017 / Revised: 8 September 2017 / Accepted: 14 September 2017 / Published: 19 September 2017
(This article belongs to the Special Issue Air Quality Monitoring and Forecasting)

Abstract

:
FireWork is an on-line, one-way coupled meteorology–chemistry model based on near-real-time wildfire emissions. It was developed by Environment and Climate Change Canada to deliver operational real-time forecasts of biomass-burning pollutants, in particular fine particulate matter (PM2.5), over North America. Such forecasts provide guidance for early air quality alerts that could reduce air pollution exposure and protect human health. A multi-year (2013–2016) analysis of FireWork forecasts over a five-month period (May to September) was conducted. This work used an archive of FireWork outputs to quantify wildfire contributions to total PM2.5 surface concentrations across North America. Different concentration thresholds (0.2 to 28 µg/m3) and averaging periods (24 h to five months) were considered. Analysis suggested that, on average over the fire season, 76% of Canadians and 69% of Americans were affected by seasonal wildfire-related PM2.5 concentrations above 0.2 µg/m3. These effects were particularly pronounced in July and August. Futhermore, the analysis showed that fire emissions contributed more than 1 µg/m3 of daily average PM2.5 concentrations on more than 30% of days in the western USA and northwestern Canada during the fire season.

1. Introduction

Wildfires are large, uncontrolled vegetation fires that result from natural processes or anthropogenic activities. In North America they are a major natural hazard, with high interannual variability in both the number of fires and the total burned area. Every year, wildfires consume millions of hectares of forest in North America, resulting in several community evacuations due to the direct threat of fire or the indirect threat of heavy smoke [1]. According to the 2016 report of the Canadian Interagency Forest Fire Centre (CIFFC), during the last decade an average of 7000 wildfires occurred each year in Canada and burned an average of 2.6 million hectares per year [2]. Annual costs of wildfire suppression in Canada have ranged from about $0.5 billion to $1 billion in the last decade [3]. As an extreme example, one wildfire in western Canada from 1 May to 4 July 2016 burned an area of 590,000 ha, roughly the size of the Canadian province of Prince Edward Island, and forced the evacuation of nearly 90,000 people from the city of Fort McMurray in northeastern Alberta. The damages caused by this fire were estimated to be on the order of $9.5 billion [4].
In addition to economic impacts, wildfires can adversely affect both air quality (AQ) and human health. The AQ impacts depend on the amount and chemical composition of the emissions from these fires, the smoke plume dynamics, and the meteorological conditions that drive the transport and diffusion of wildfire smoke. Biomass burning from wildfires can release significant amounts of pollutants into the atmosphere, including particulate matter (PM), ammonia (NH3), and ozone (O3) precursors such as nitrogen oxides (NOx), volatile organic compounds (VOCs), and carbon monoxide (CO) [5]. Although many of these species are harmful to human health, the population health impacts of wildfire smoke have been attributed mainly to short-term concentrations of PM less than 2.5 µm in aerodynamic diameter (PM2.5). Two recent systematic reviews found that short-term smoke exposure is strongly associated with small increases in daily mortality from all causes, and with acute respiratory outcomes ranging in severity from increased reporting of symptoms through to increased risk of hospital admissions. Associations were weaker for acute cardiovascular morbidity and birth outcomes, but suggestive of effects in both cases [6,7]. In addition, new evidence about wildfire smoke is emerging rapidly given the severity of fires across North America over the past decade. Furthermore, wildfire smoke is playing an increasingly important role in long-term air pollution as fires get larger and other sources such as motor vehicles and industry come under increasingly strict regulation [8]. Long-term exposure to PM2.5 is associated with the development of a wide and growing range of chronic diseases [9].
During wildfire events, PM2.5 concentration at the ground level may be significantly increased, such that it exceeds the levels established by regulatory agencies to protect the environment and human health. In Canada, for example, the established Canadian Ambient Air Quality Standards (CAAQS) for PM2.5 concentration are an annual mean of 10 µg/m3 and a daily mean of 28 µg/m3 [10]. The CAAQS metric for annual concentration of PM2.5 is based on the three-year average of the annual average concentrations, and on the three-year average of the annual 98th percentile of the daily 24-h average concentrations. Furthermore, the AQ impacts of wildfire emissions are not limited to the local or regional scales. Under some meteorological conditions, wildfire smoke plumes can disperse widely and travel thousands of kilometers, affecting people living far away from the fire location [11]. Observational evidence indicates that the long-range transport of wildfire smoke can episodically increase PM and O3 ground-level concentrations at regional and continental scales. For example, smoke from Canadian wildfires was associated with high concentrations of PM in areas great distances from the fire source, such as Baltimore and Washington, D.C. in the eastern USA and as far away as Europe [11,12,13,14]. Moreover, Canadian wildfires have also been linked to increased O3 concentrations in Houston, TX and the northeastern USA, as well as Europe [15,16,17,18,19]. On the other hand, long-range transport of Siberian wildfire smoke has also contributed to exceedances in O3 and PM2.5 on the west coast of Canada [20,21].
The assessment of human exposure to smoke from wildfires is challenging because such smoke episodes are typically sporadic and short-lived, with highly variable concentrations in both space and time [22,23]. Furthermore, the spatial variability of population exposure to wildfire smoke cannot be correctly represented based solely on regulatory monitoring data because these data provide limited spatial coverage. For example, impacts are often observed in populated non-urban areas where regulatory monitoring networks are sparse or not available. On the other hand, remote sensing data from satellites can be used over very large areas, covering locations where the monitoring networks are missing. However, these measurements provide information about the total atmospheric column of air pollutants rather than the ground-level concentrations. They are also generally not available at night and can be masked by the occurrence of clouds. Additionally, satellite overpasses may occur only once a day or every few days, resulting in large amounts of missing information. Therefore, deterministic AQ forecast models have become a useful tool to fill the temporal and spatial gaps in available measurements and provide guidance about AQ over the coming hours and days [24,25,26,27,28,29,30,31].
AQ forecasting systems consisting of 3D numerical weather prediction (NWP) models with on-line or off-line chemical transport models (CTMs) have become a valuable tool in the past 15 years. They can provide guidance in the production of AQ forecasts and assist public health authorities in understanding pollutant exposures and developing public actions to protect populations against those exposures. The accuracy of pollutant exposure estimates using modeled AQ data depends on the ability of the forecast systems to reproduce observed concentrations of air pollutants. The differences among the current AQ forecast systems that consider anthropogenic emissions of pollutants have been reviewed recently [24,25], but to date only a few AQ forecast systems have been developed that combine information from wildfires and meteorology to retrospectively or prospectively estimate the emissions, transport, and diffusion of wildfire smoke [26,27].
In order to provide guidance to regional AQ forecasters, first responders, and public health decision-makers about the dispersion of smoke from large wildfires, Environment and Climate Change Canada (ECCC) has developed FireWork [27], an on-line, one-way coupled meteorology–chemistry model based on near-real-time wildfire emissions. FireWork was built on the existing ECCC operational AQ forecast system, and was first deployed in 2013 during the Canadian wildfire season to deliver real-time forecasts of wildfire smoke plumes over North America. Previous studies have shown the ability of FireWork to forecast PM2.5 in terms of statistical scores and spatial distributions, as well as public health impacts [27,28,29]. Observed trends and seasonal variability of PM2.5 are well captured by the model. However, FireWork’s ability to simulate the emission and dispersion of wildfire smoke is currently limited by factors such as the accuracy of wildfire emission factors, the treatment of fire behavior, and the suitability of plume-rise algorithms.
Here we conduct a multi-year (2013–2016) analysis of FireWork forecasted PM2.5 concentrations from biomass burning over North America to provide estimates of the population exposure to PM2.5 from wildfires for several concentration thresholds. The number of days that exceed these thresholds as well as the magnitude of the area in exceedance was estimated. The goal of this work is to help public health professionals, policymakers, and the general public better understand the human health impacts of wildfire-related PM2.5 pollution.

2. Methodology

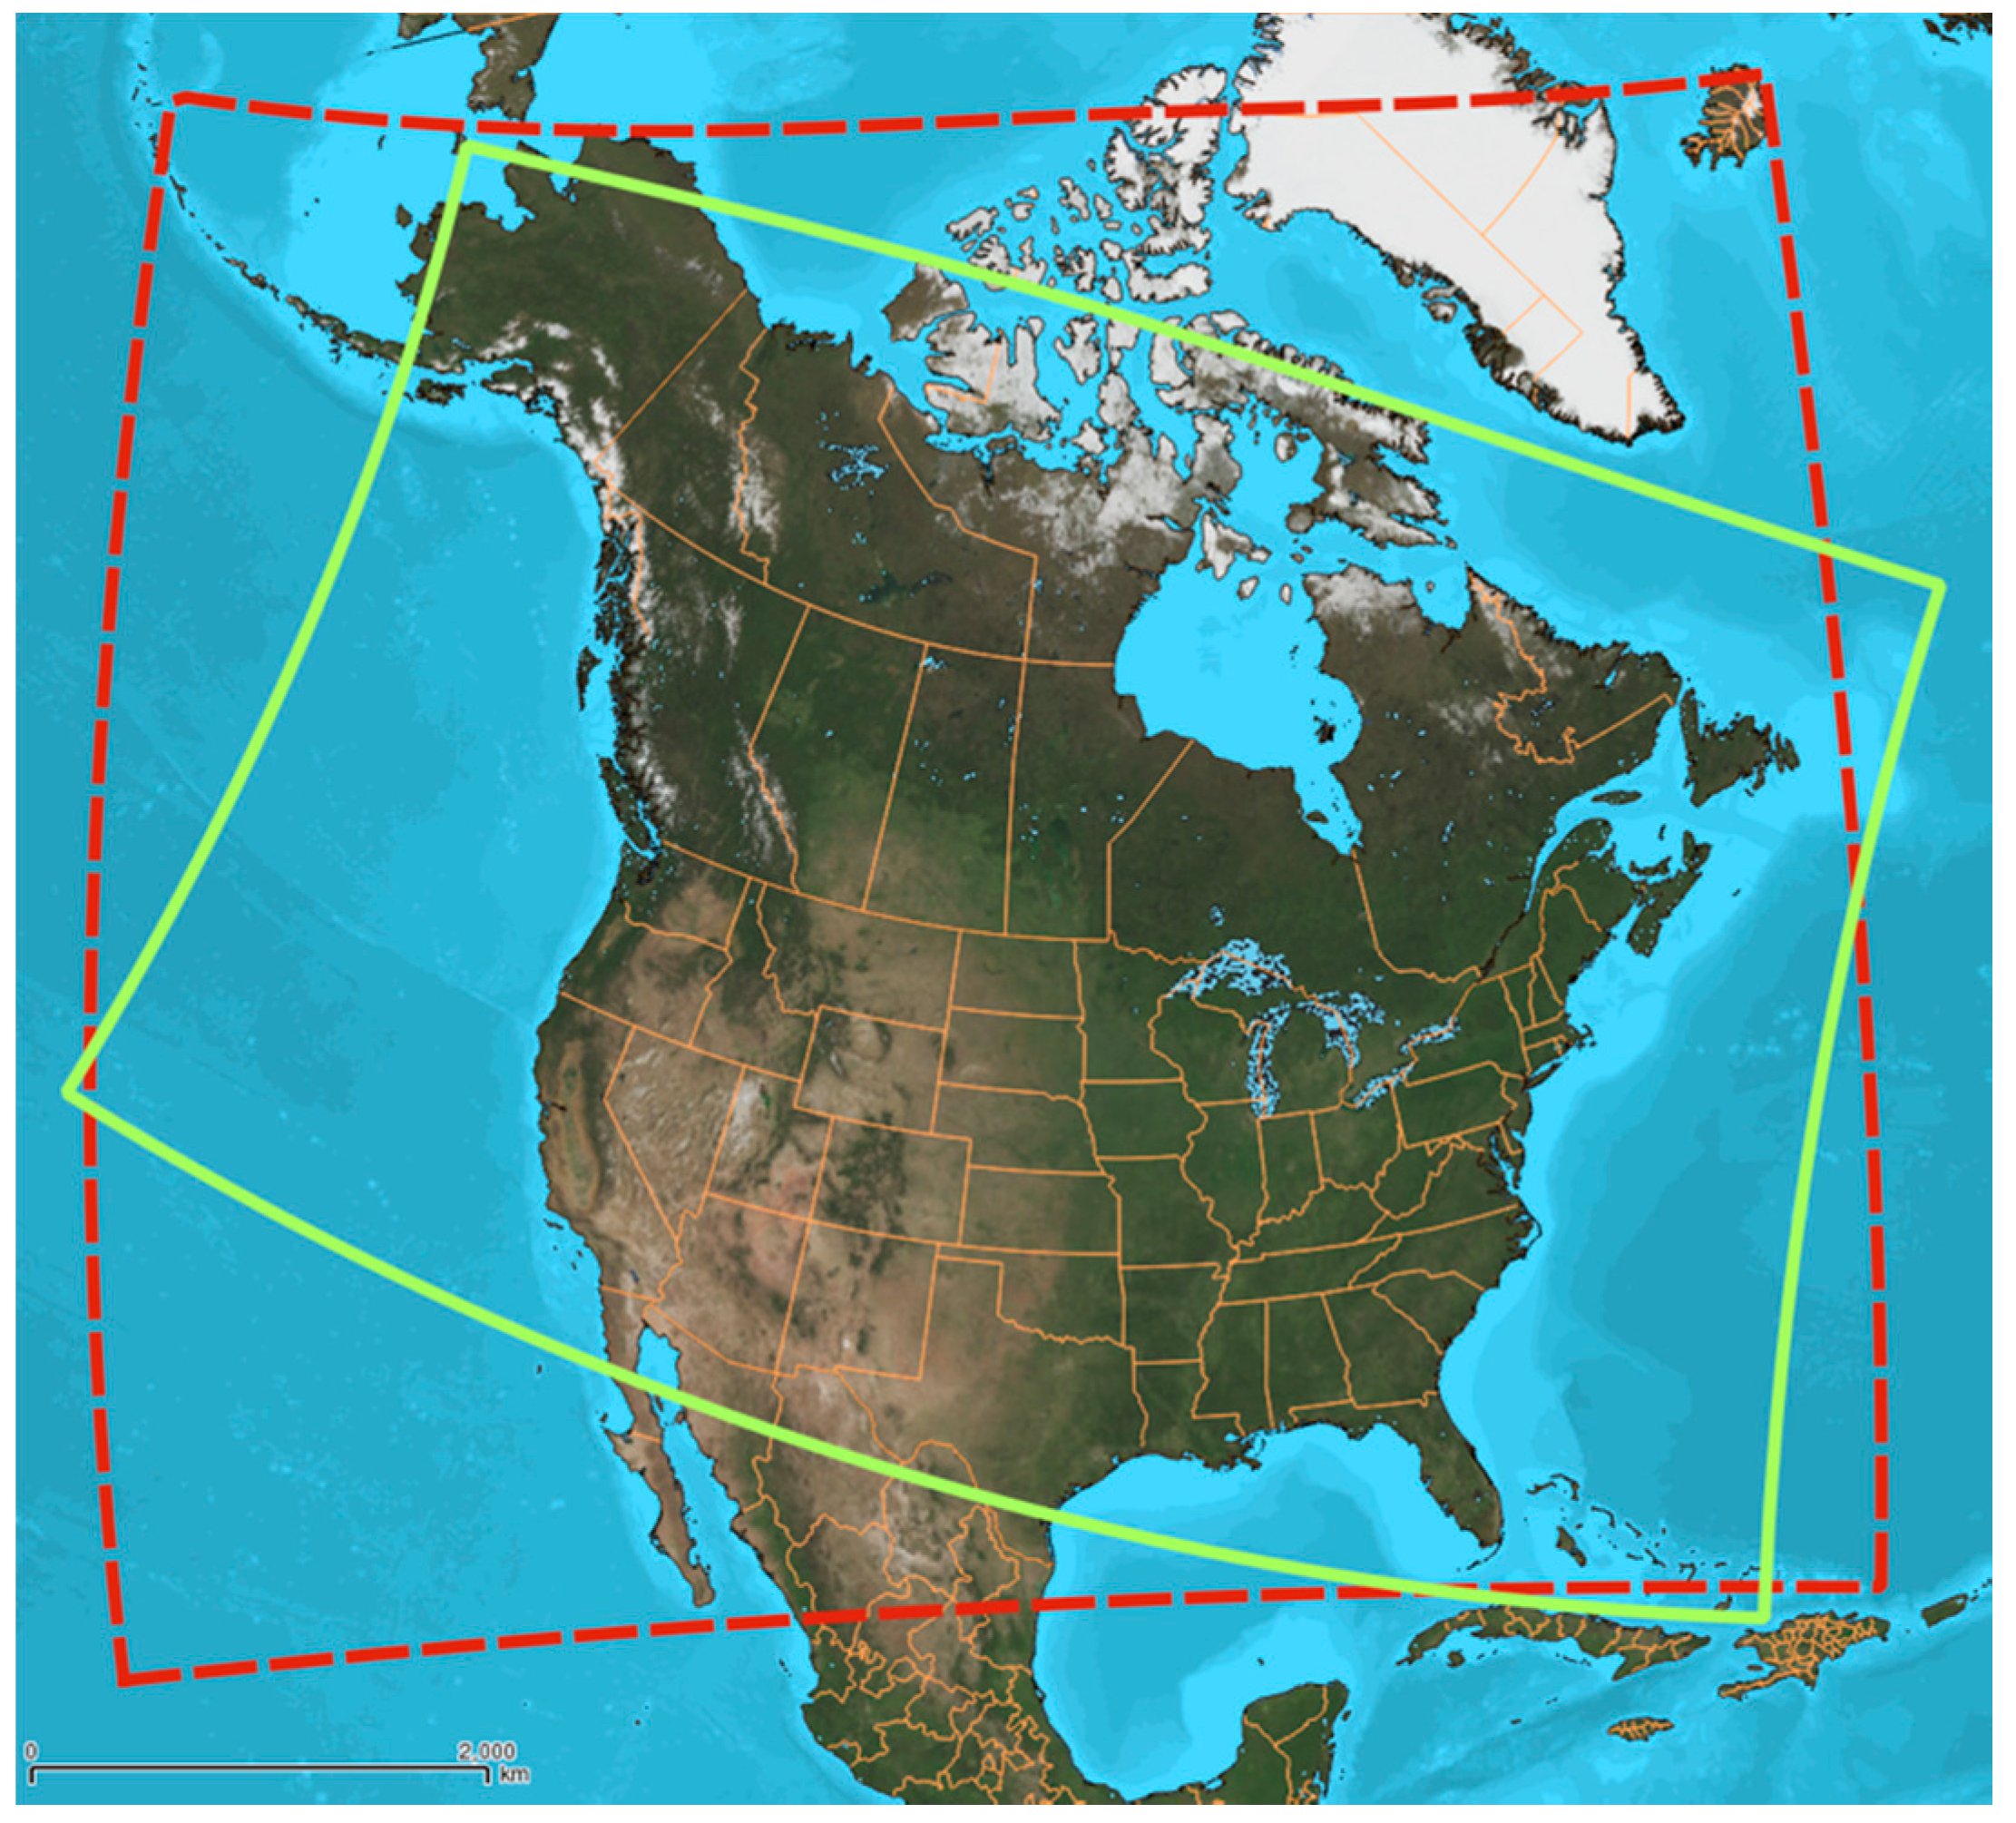
2.1. North American Wildfire AQ Forecasting System

The FireWork system was first run in an experimental mode beginning in 2013 at ECCC’s Canadian Centre for Meteorological and Environmental Prediction (CCMEP). The system became operational in April 2016. The FireWork system is identical to the ECCC operational Regional Air Quality Deterministic Prediction System (RAQDPS) [30,31,32], except for the inclusion of satellite-derived, near-real-time biomass burning emissions from natural, prescribed, and agricultural fires [27]. The on-line RAQDPS modeling system relies on the GEM-MACH (Global Environmental Multi-scale-Modelling Air quality and Chemistry) model, an on-line, one-way coupled CTM (i.e., meteorology affects chemistry, but chemistry does not affect meteorology), embedded within the Global Environmental Multi-scale (GEM) model. Both the RAQDPS and FireWork systems input the same hourly anthropogenic gridded emissions fields based on processing the 2010 Canadian national Air Pollutant Emission Inventory (APEI), the 2011 U.S. National Emissions Inventory (NEI), and the 1999 Mexican emissions inventory, as well as biogenic and sea-salt emissions from natural sources [31]. Each of the three national anthropogenic inventories accounts for emissions of at least seven criteria air pollutants: SO2, NOx, VOC, CO, NH3, PM2.5, and PM10.
The calculation of the near-real-time biomass burning emissions required by FireWork starts with the Canadian Forest Service’s operational Canadian Wildland Fire Information System (CWFIS), which provides fire activity and fire danger conditions across Canada and the continental United States during the active wildfire season [33]. The primary data used by the CWFIS to capture fire activity come from satellite-based detection systems: NASA’s Moderate Resolution Imaging Spectroradiometer (MODIS) instrument, NOAA’s Advanced Very High Resolution Radiometer (NOAA/AVHRR), and Visible Infrared Imaging Radiometer Suite (VIIRS) imagery through NASA and the U.S. Forest Service Remote Sensing Applications Center [34]. During the fire season, fire activity is updated six times daily in the CWFIS, corresponding to the frequency of available satellite-based retrievals. Relevant fire information estimated by CWFIS for each fire hotspot includes fuel type, surface fuel consumption, crown fuel consumption, total fuel consumption, and forest floor fuel consumption. Estimates of daily biomass-burning emissions for individual hotspots are then obtained using fuel consumption values from the CWFIS and emission factors from the Fire Emission Production Simulator (FEPS), a component of the BlueSky Modeling Framework [26]. More detailed information about the FireWork modelling system framework and its data flow is provided in other recent publications [27,28].
In the current operational setup, the seasonal FireWork system runs twice per day at 00 UTC and 12 UTC during the North American fire season from 1 April to 31 October. FireWork simulation results provide numerical AQ forecast guidance over North America with a 48-h lead time. In 2013, 2014, and 2015, when FireWork was run as an experimental model version at CCMEP, the period from April to October was only partially covered (see Table 1). In April 2016, however, when the FireWork System became operational [35], FireWork forecasts were extended to cover the full wildfire season.
The seasonal peak for wildfire events in Canada occurs in the months of June, July, and August [2], and initially our analysis focused on this three-month period. However, due to the extreme wildfires that occurred in northern Alberta in May 2016, we decided to extend our analysis to a five-month period from May to September. In order to backfill this five-month period for the years 2013–2015 (Table 1), FireWork was rerun using the operational forecasting approach [27] with the same FireWork version that had been used each year. This required three older versions of FireWork to be run because new, updated versions of the RAQDPS had been introduced before each fire season [31,35].
Seasonal fire emissions for May 1 through September 30 were estimated for North America using the FireWork emissions system [27]. The total fire emissions of key trace gases and particulate species for each year from 2013–2016 show a significant variation in the seasonal totals (Table S1; see Supplementary Materials). Maximum emissions were observed for the 2014 season, and there was substantial spatial variability in the regional estimates (data not shown). The mean seasonal FireWork primary PM2.5 emissions for North America for 2013–2016 of 1.4 Tg/season are lower than but comparable to previous estimates of North American annual PM2.5 emissions from wildfires (1.9 and 2.2 Tg/y) [36]. For context, total U.S. anthropogenic PM2.5 emissions in 2010 were estimated to be 4.1 Tg/y [37], so fire emissions are an important source of PM2.5.
The FireWork domain covers most of Canada and the USA (including Alaska), as well as northern Mexico, with a 10 km × 10 km grid (Figure 1). A new operational version of FireWork with a new domain and new 10 km × 10 km grid (Figure 1) was introduced during the 2016 wildfire season [35]. Results presented in Section 3 are calculated on the original grid used by FireWork prior to 7 September 2016. FireWork results for the period after the grid change (approximately three weeks) were interpolated to the original grid to allow for consistent analysis. The area covered by the original FireWork domain was 33,085,648 km2.

2.2. Wildfire Emissions’ Contribution to PM2.5 Pollution

We used FireWork forecasts to analyze the contribution of fire-originated fine particulate matter (fire-PM2.5) to PM2.5 pollution over North America. In order to estimate the direct contribution of fire-PM2.5 to the total PM2.5 concentration forecasted by FireWork, the RAQDPS forecast PM2.5 concentration field valid at the same hour was subtracted from the FireWork field. This simple strategy removes the contribution of the anthropogenic sources and other natural sources considered by both the RAQDPS and FireWork, and makes it possible to isolate wildfire smoke plume locations and follow their evolution over time [27]. The analysis of forecasted wildfire smoke presented in this paper is based on the set of hourly PM2.5 concentration fields generated by this subtraction. Note that fire-PM2.5 includes contributions from both primary PM2.5 emissions and secondary aerosol formation from primary gas-phase emissions.
An essential part of characterizing the impacts of exposure to wildfire pollution is to understand both long-term (monthly to yearly) and short-term (hourly to daily) exposures. We used multi-year FireWork simulations (2013–2016) to characterize both long- and short-term wildfire pollution exposure over North America by calculating averages based on multi-year, seasonal, monthly, daily, and hourly concentrations and assessing areas affected by different concentration thresholds. Furthermore, we compared these averages with the PM2.5 CAAQS of 10 µg/m3 (annual standard) and 28 µg/m3 (daily standard) [10], and with lower thresholds of 0.2, 1, and 5 µg/m3. The 0.2 µg/m3 threshold was based on the U.S. Environmental Protection Agency (EPA) Significant Impact Level (SIL) guidance document, which defines 0.2 µg/m3 as the threshold below which any annual PM2.5 change is considered negligible [38]. Also, from our own experience with FireWork, 0.2 µg/m3 is the lowest value not susceptible to numerical noise that can be considered when analyzing the contributions of fire-PM2.5 to total forecasted PM2.5 concentrations. The 1 and 5 µg/m3 thresholds were considered to transition between the minimal 0.2 µg/m3 threshold and the 10 µg/m3 threshold.

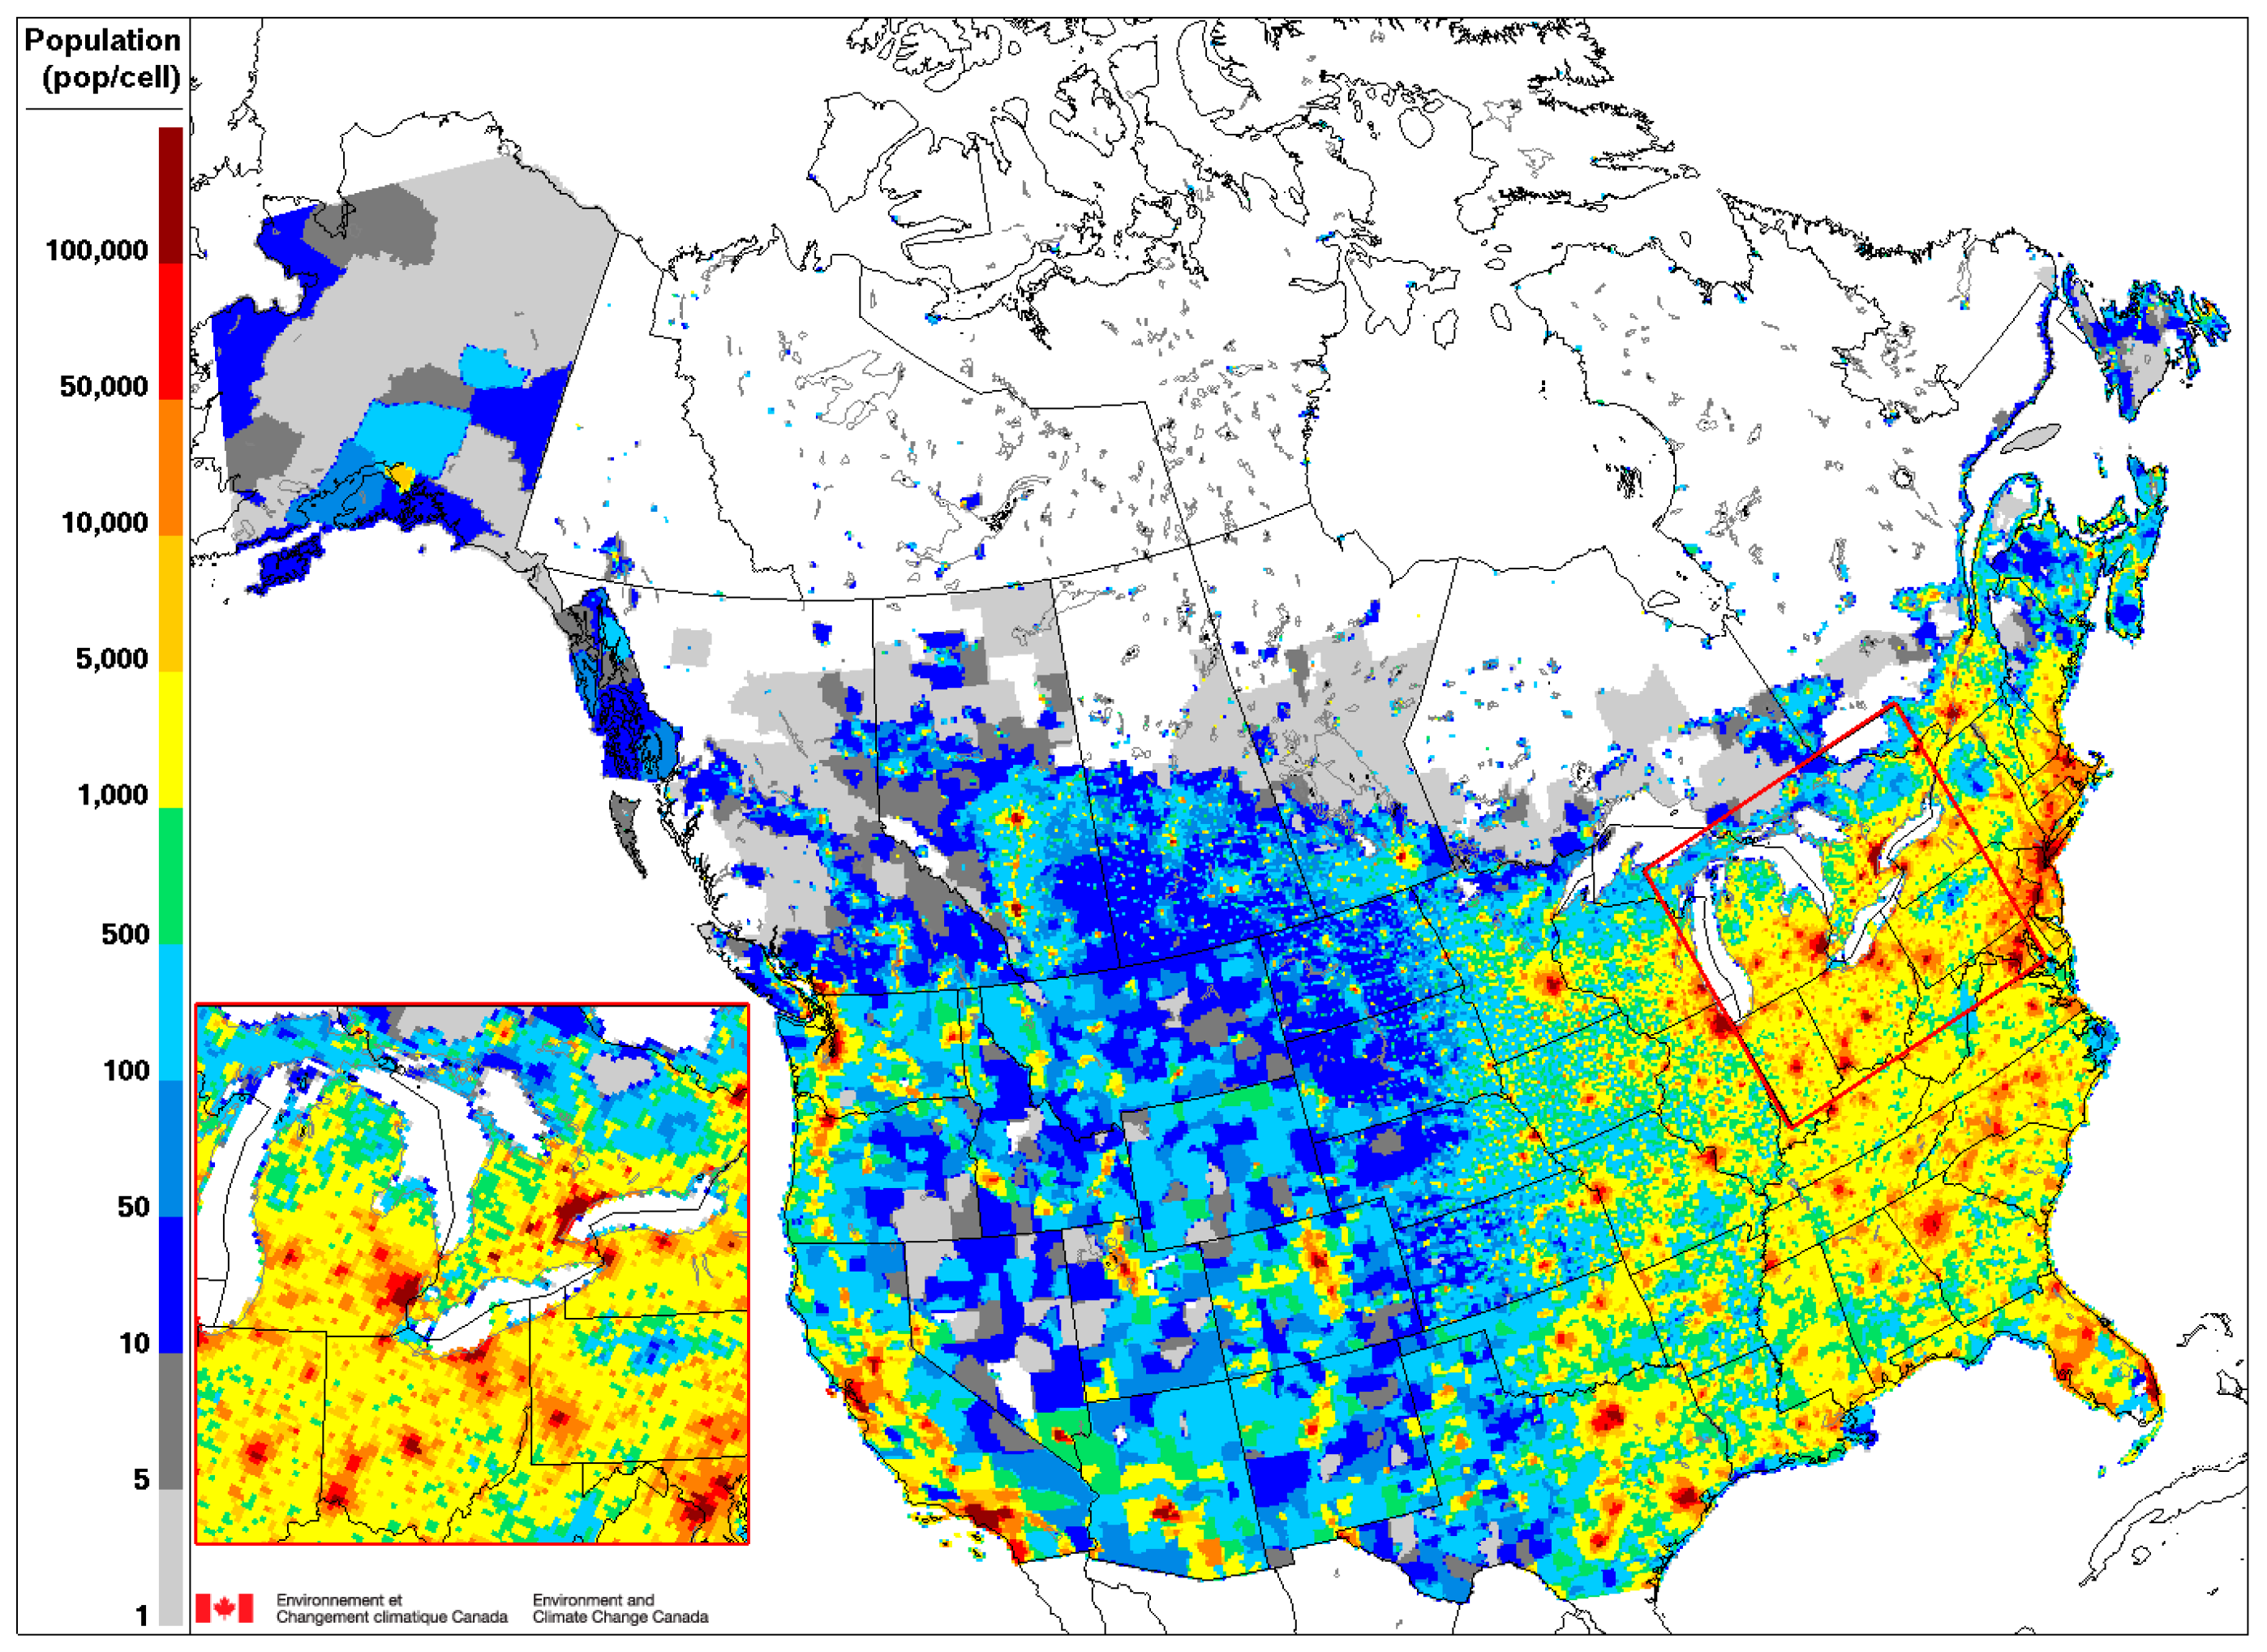
2.3. Population Exposure Estimation

Statistics on population exposure to wildfire smoke for Canada and the USA can be calculated by combining FireWork fields of direct contributions of fire-PM2.5 to total surface PM2.5 concentration with population data. We used population data from the 2016 Canadian census [39,40] and from the 2010 U.S. census [41]. For the 2016 Canadian census, we used population reported at the dissemination area (DA) level, where each DA typically has a population of 200 to 1000 people. For the 2010 U.S. census, we used population reported at the block-group level (Figure 2). Although U.S. population projections are available for 2016, they are only available at the coarser census-tract level rather than the more finely resolved block-group level (see Figure S1 in the Supplementary Materials).
A number of steps were required to estimate the population affected at different wildfire PM2.5 concentration thresholds. The first step was to determine the population for each 10 km × 10 km grid cell on the FireWork domain. To do so, 2016 Canadian population data reported by DA [39] were incorporated into a shapefile containing DA polygons [40]. The same step was performed at the sub-county level for 2010 U.S. population data [41]. The two population shapefiles were then interpolated separately to the 10 km by 10 km FireWork grid using a normalized conservative approach that preserved population within polygons. This interpolation approach divided the population value of each polygon between the grid cells wholly or partly contained within the polygon based on fractional area and assuming uniform population density within a DA or sub-county (Figure 2). The total populations contained in the older FireWork domain (Figure 1) for these two censuses were 35,148,512 in Canada and 305,744,285 in the USA.
The next step was to identify the aggregate population for the set of FireWork grid cells above a PM2.5 concentration threshold. The Canadian and U.S. populations were processed separately. For grid cells along the Canada-USA border, it was necessary to determine in which country each cell was mainly located. This was done using a mask indicating the country associated with each grid cell. The population values for the set of FireWork grid cells associated with each PM2.5 threshold were then summed together. The final step was to assess population exposure to different PM2.5 concentrations. To do this, five PM2.5 thresholds (0.2, 1, 5, 10, and 28 µg/m3) were considered and applied to monthly and seasonal (May to September) contribution of fire-PM2.5 to total surface PM2.5 concentrations.

2.4. Exposure Frequency Estimation

The temporal frequency of PM2.5 pollution exposure is another critical factor in determining health impacts from fire-PM2.5. One way to characterize this factor is to examine the number of occurrences of hourly or daily fire-PM2.5 concentrations above specific thresholds for individual grid cells. This is done by counting the number of hours or days in a wildfire season with wildfire-related PM2.5 concentrations above four different levels: 1, 5, 10 and 28 µg/m3. In this case the lowest threshold of 0.2 µg/m3 was not considered because it is less meaningful over shorter averaging periods.

3. Results

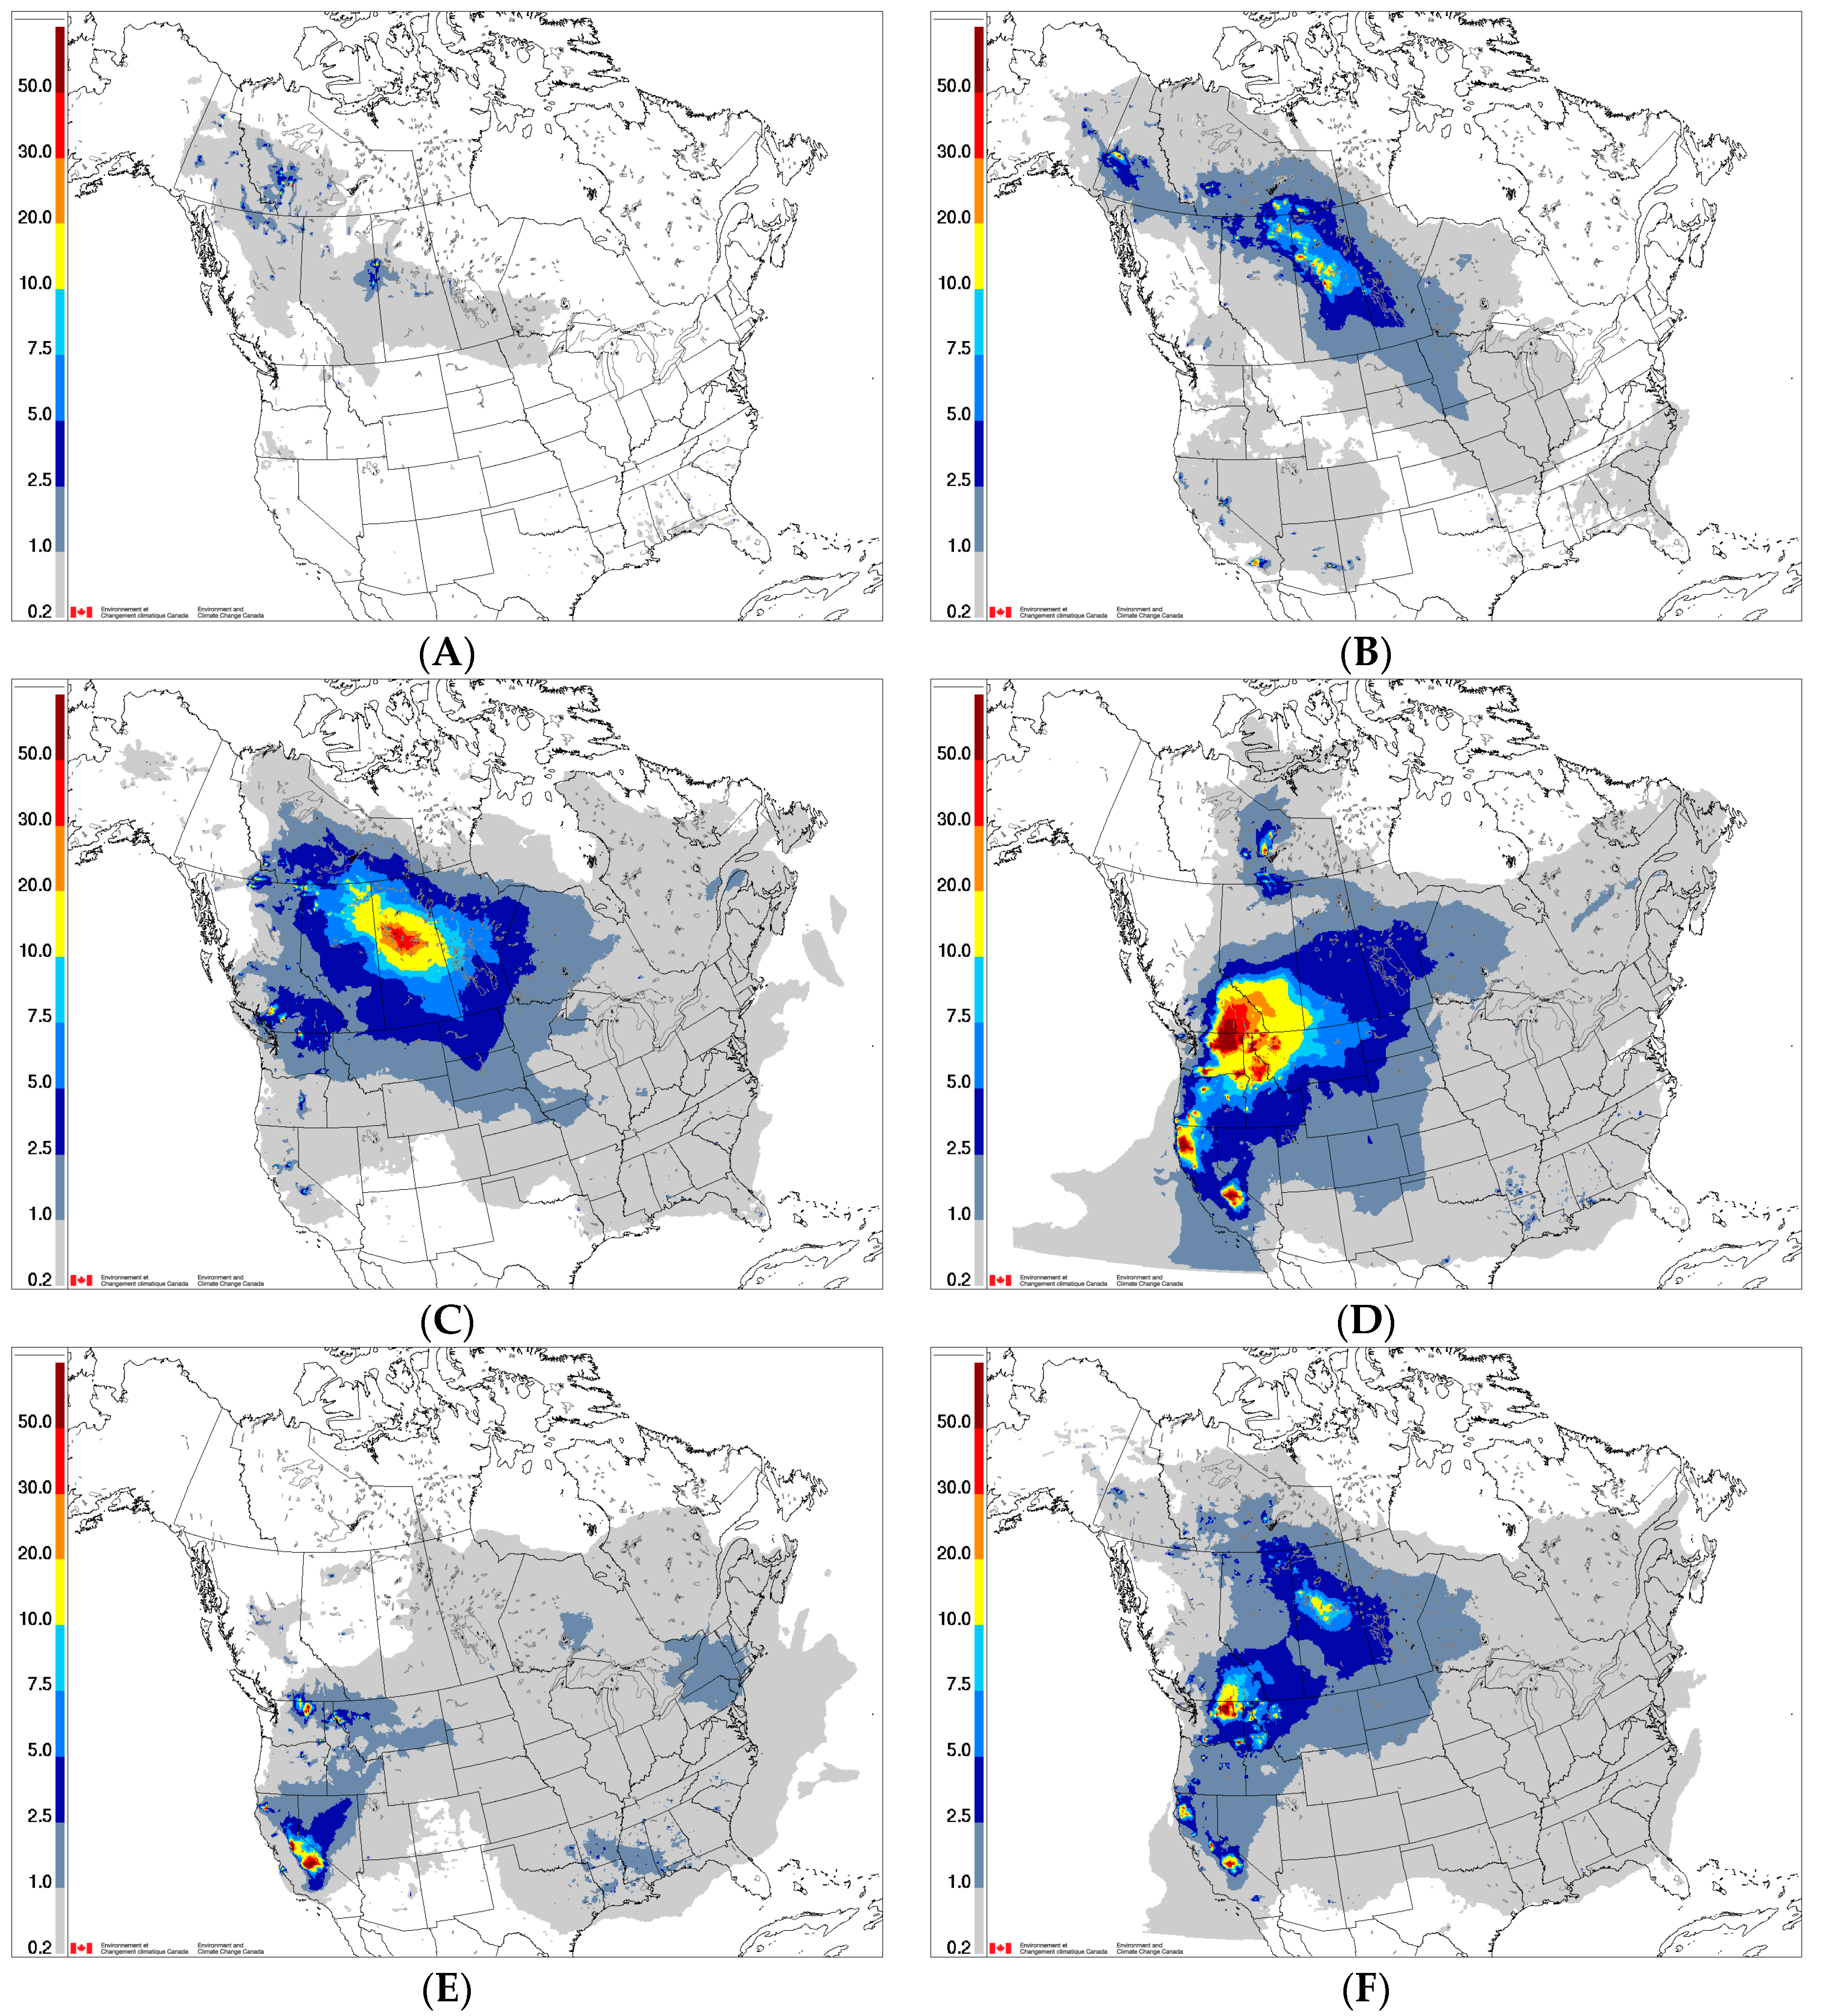
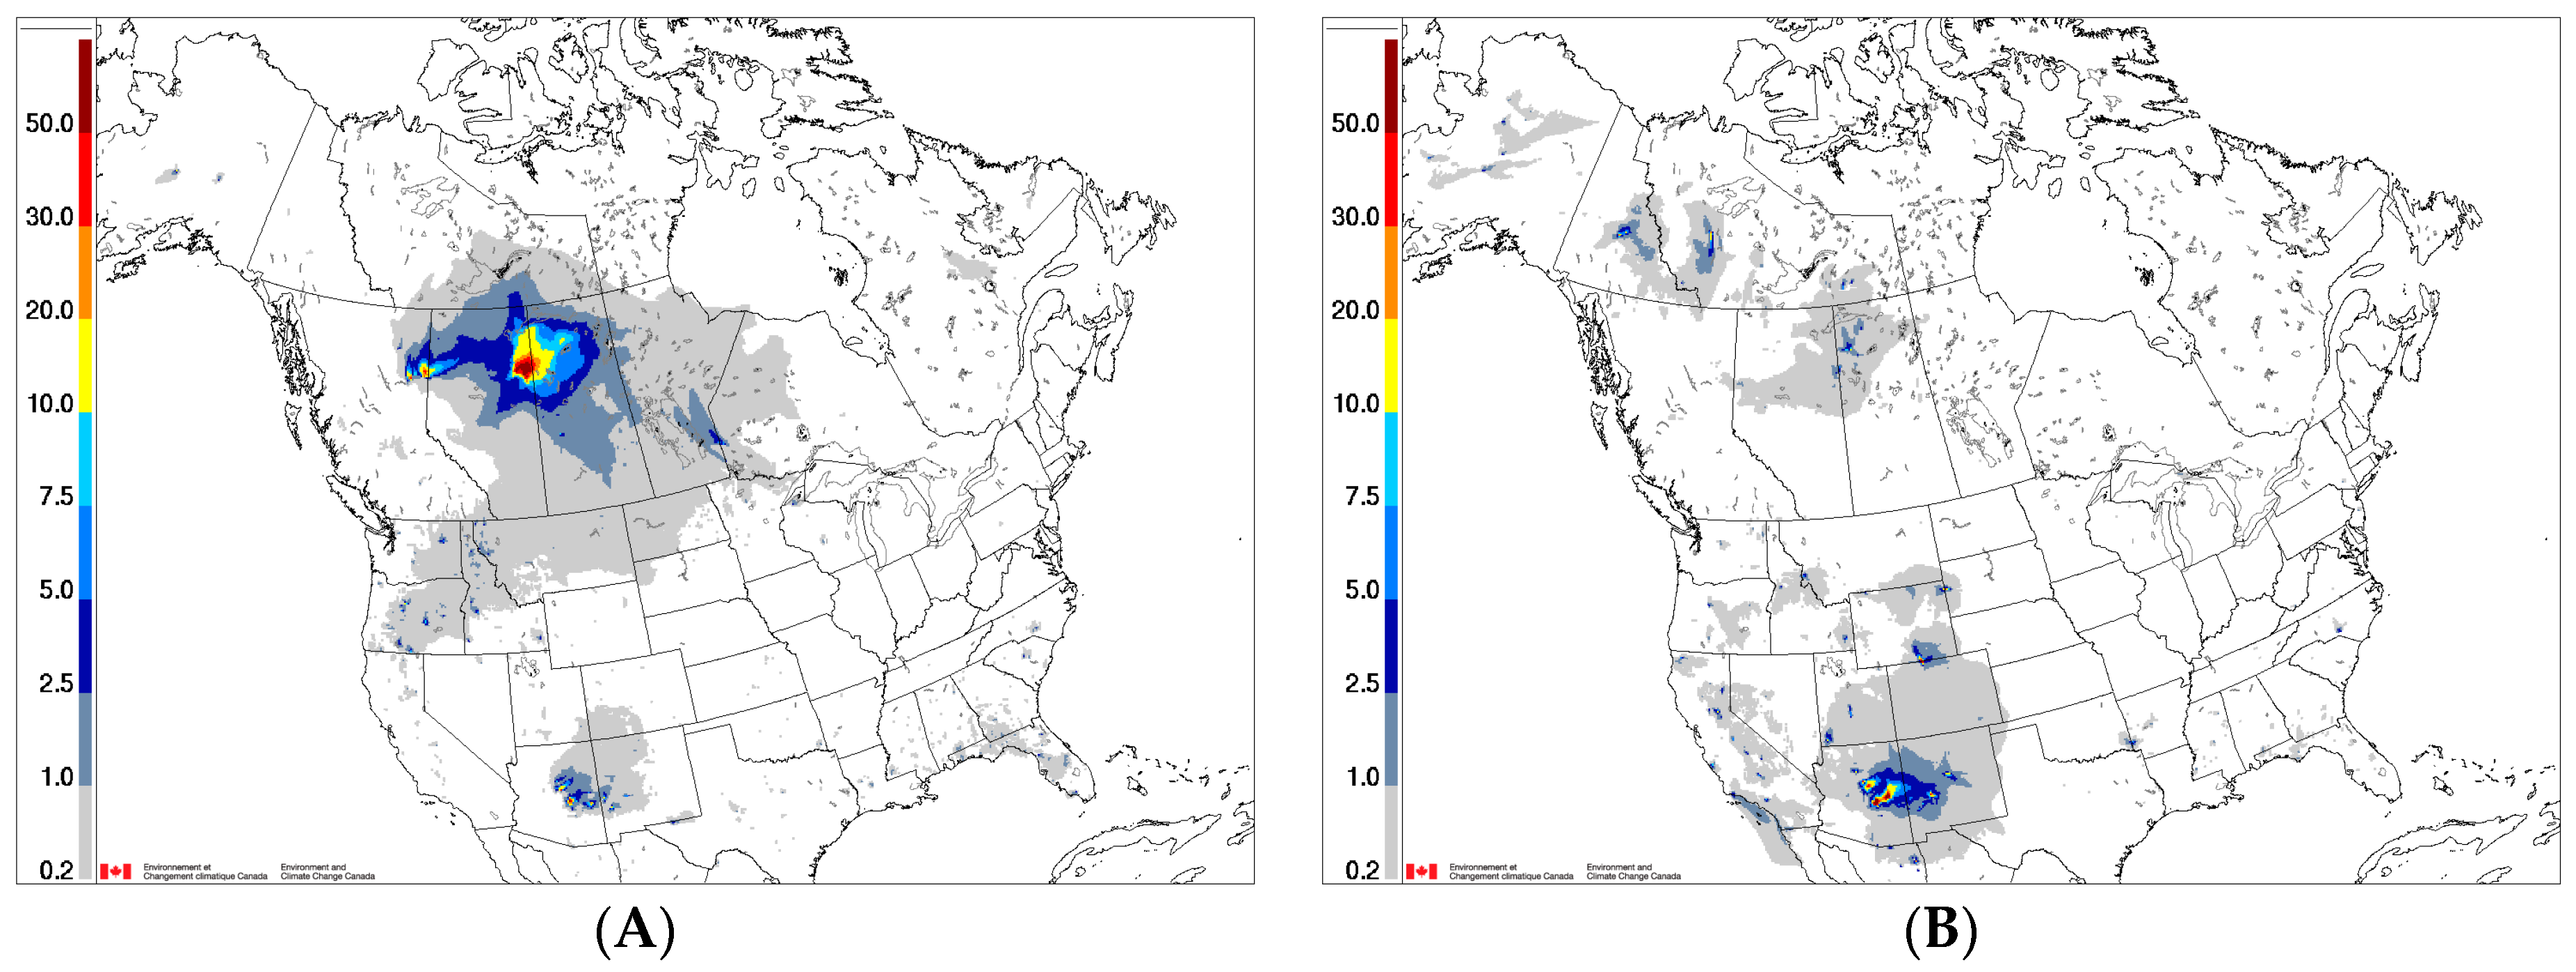
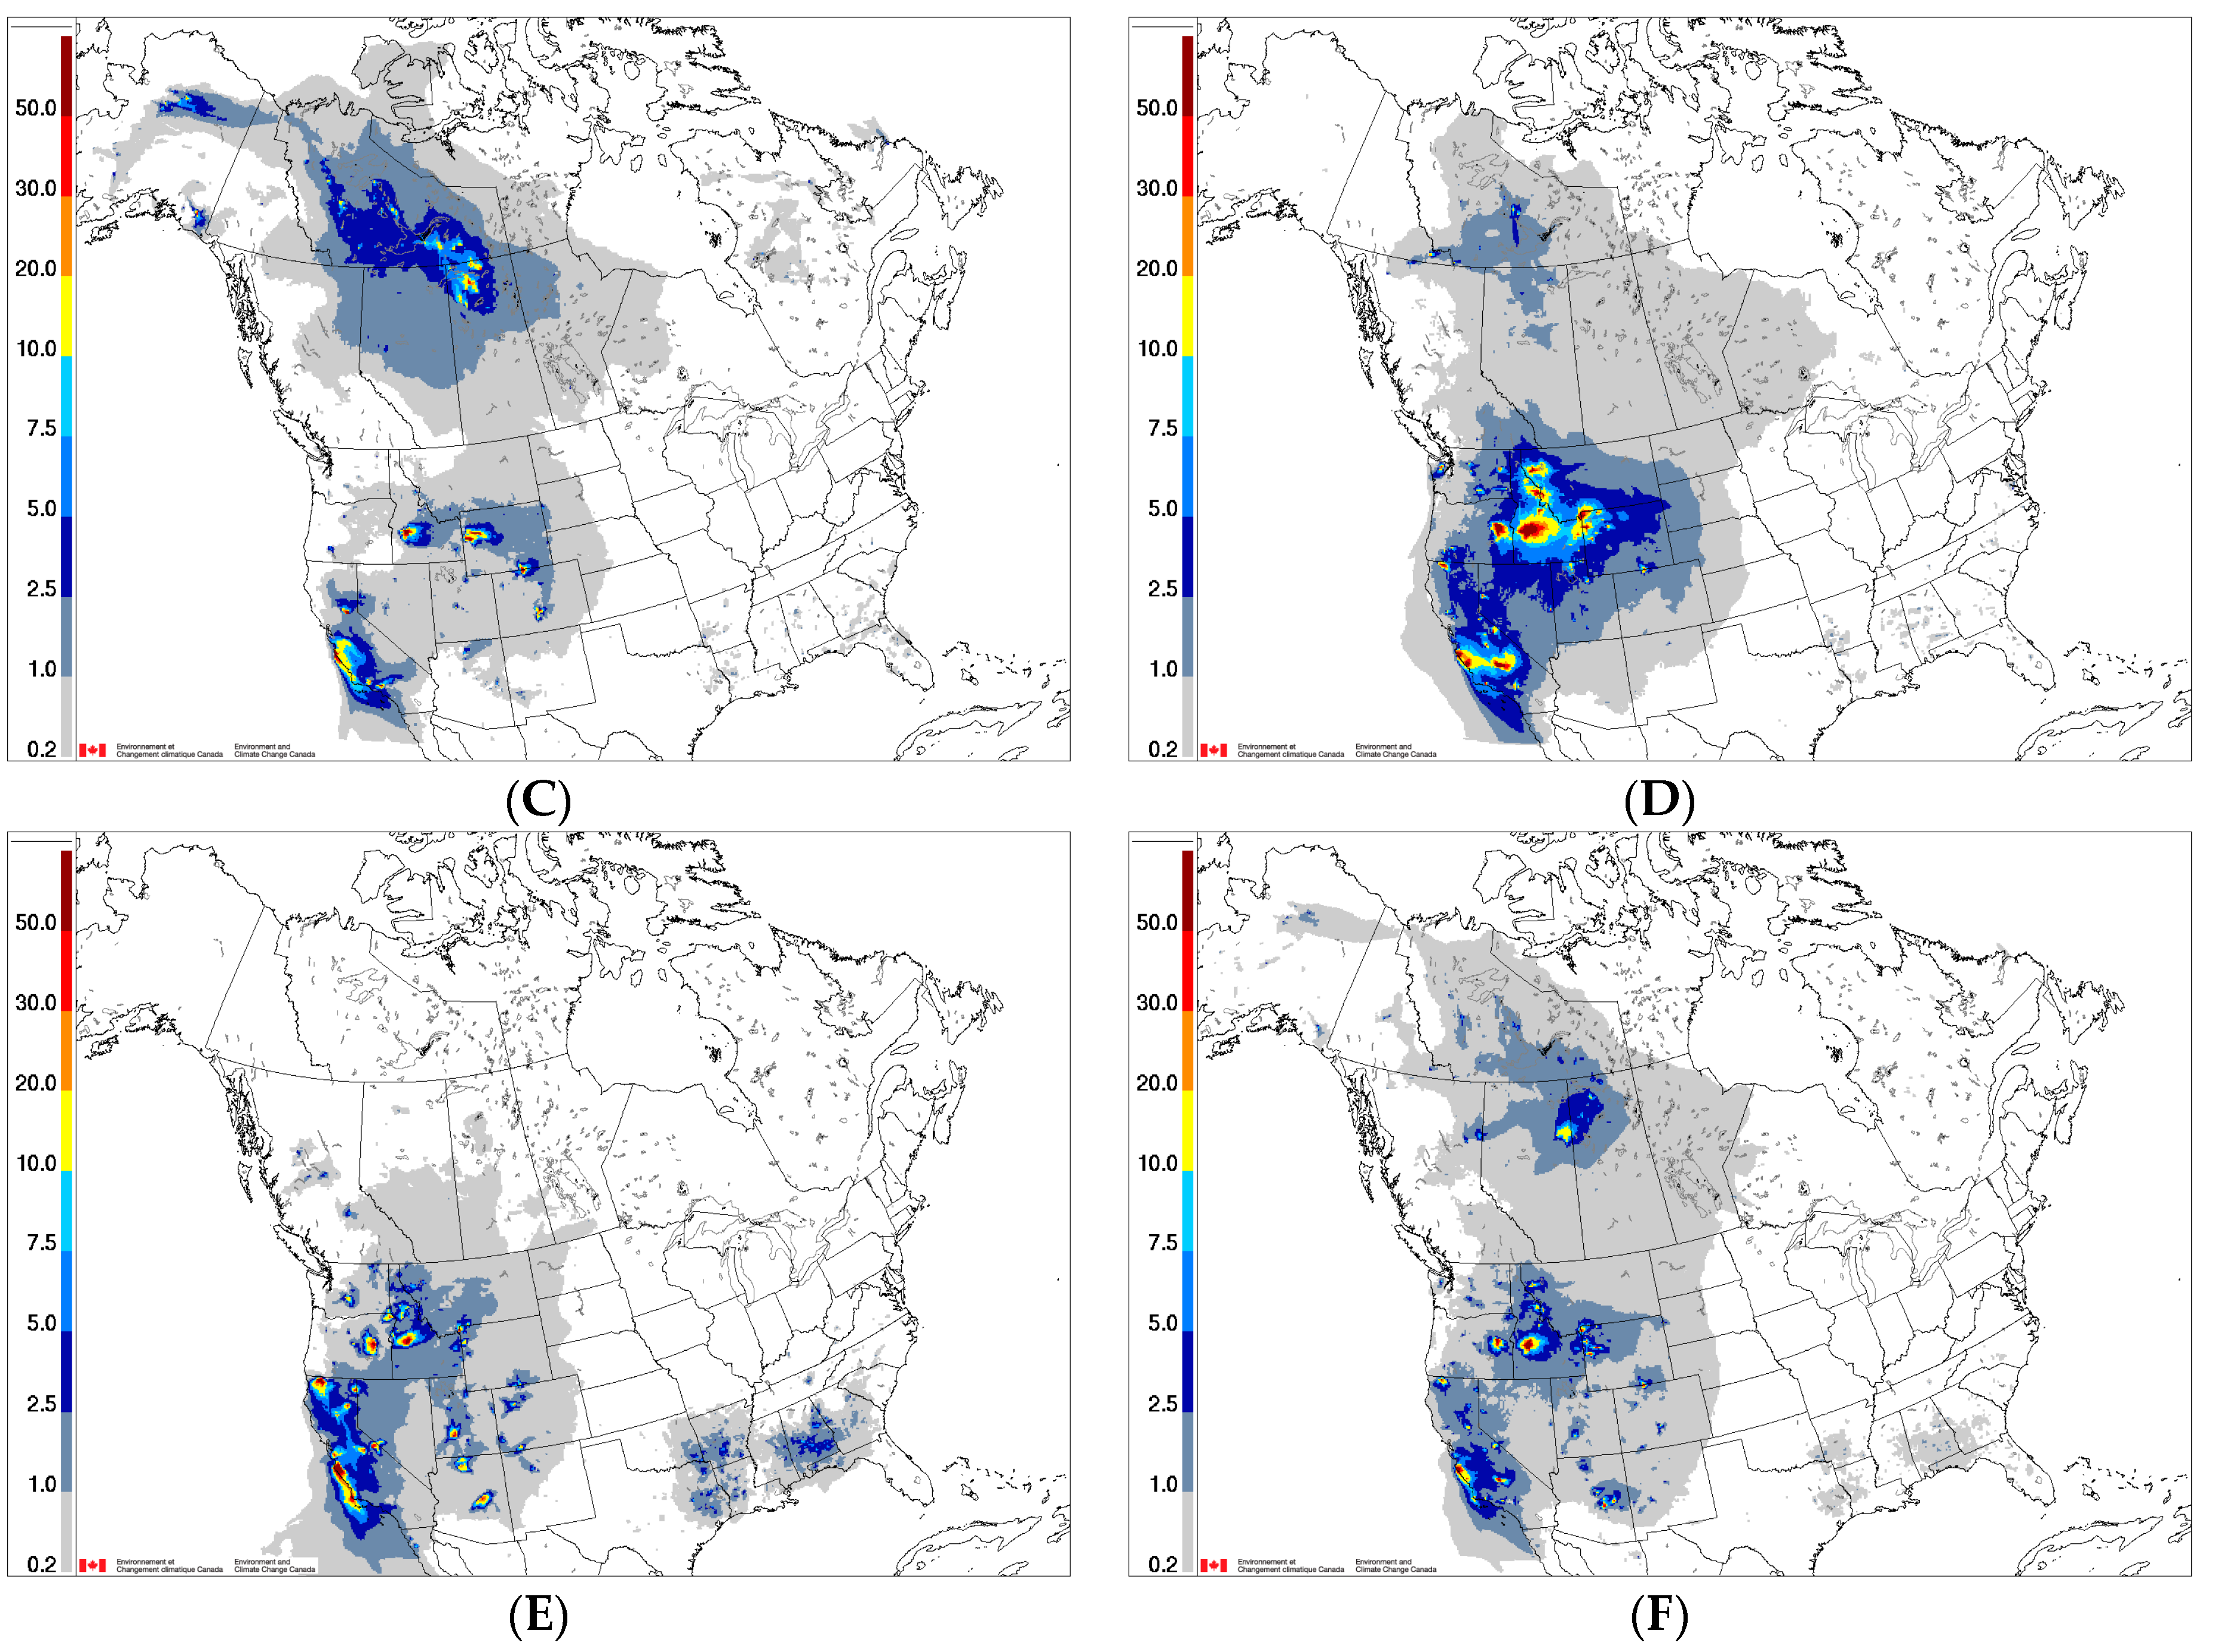
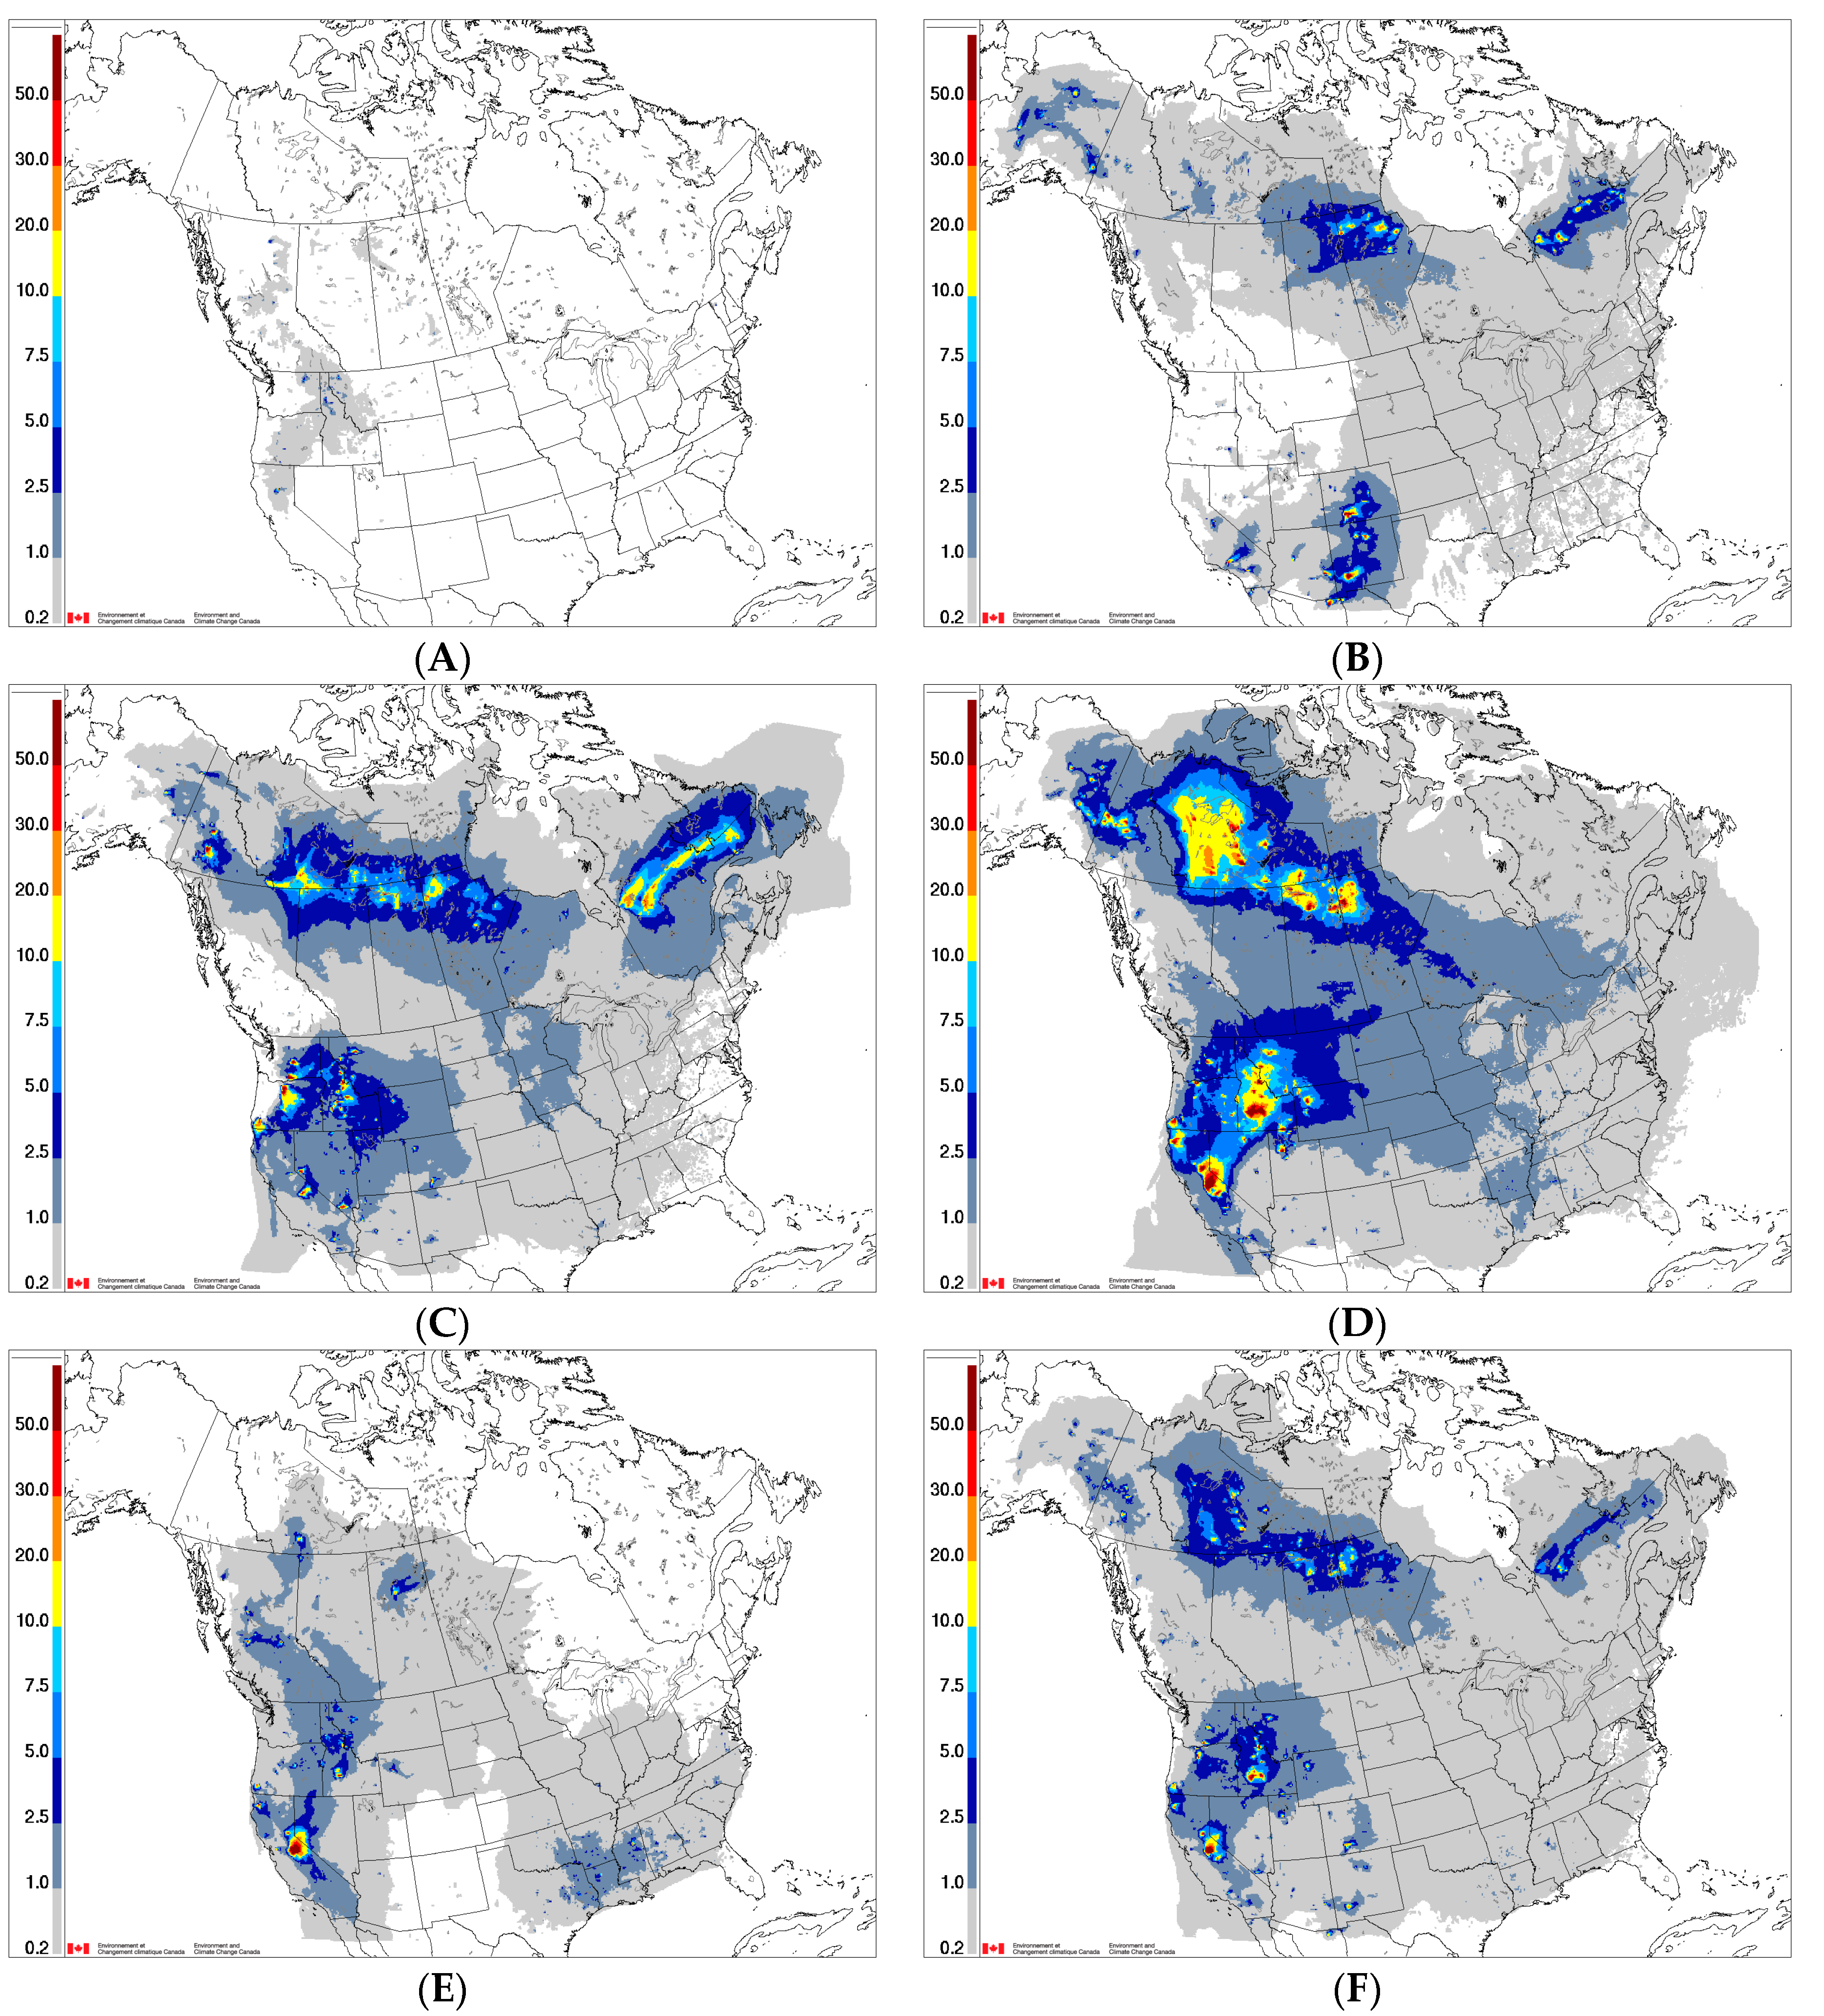
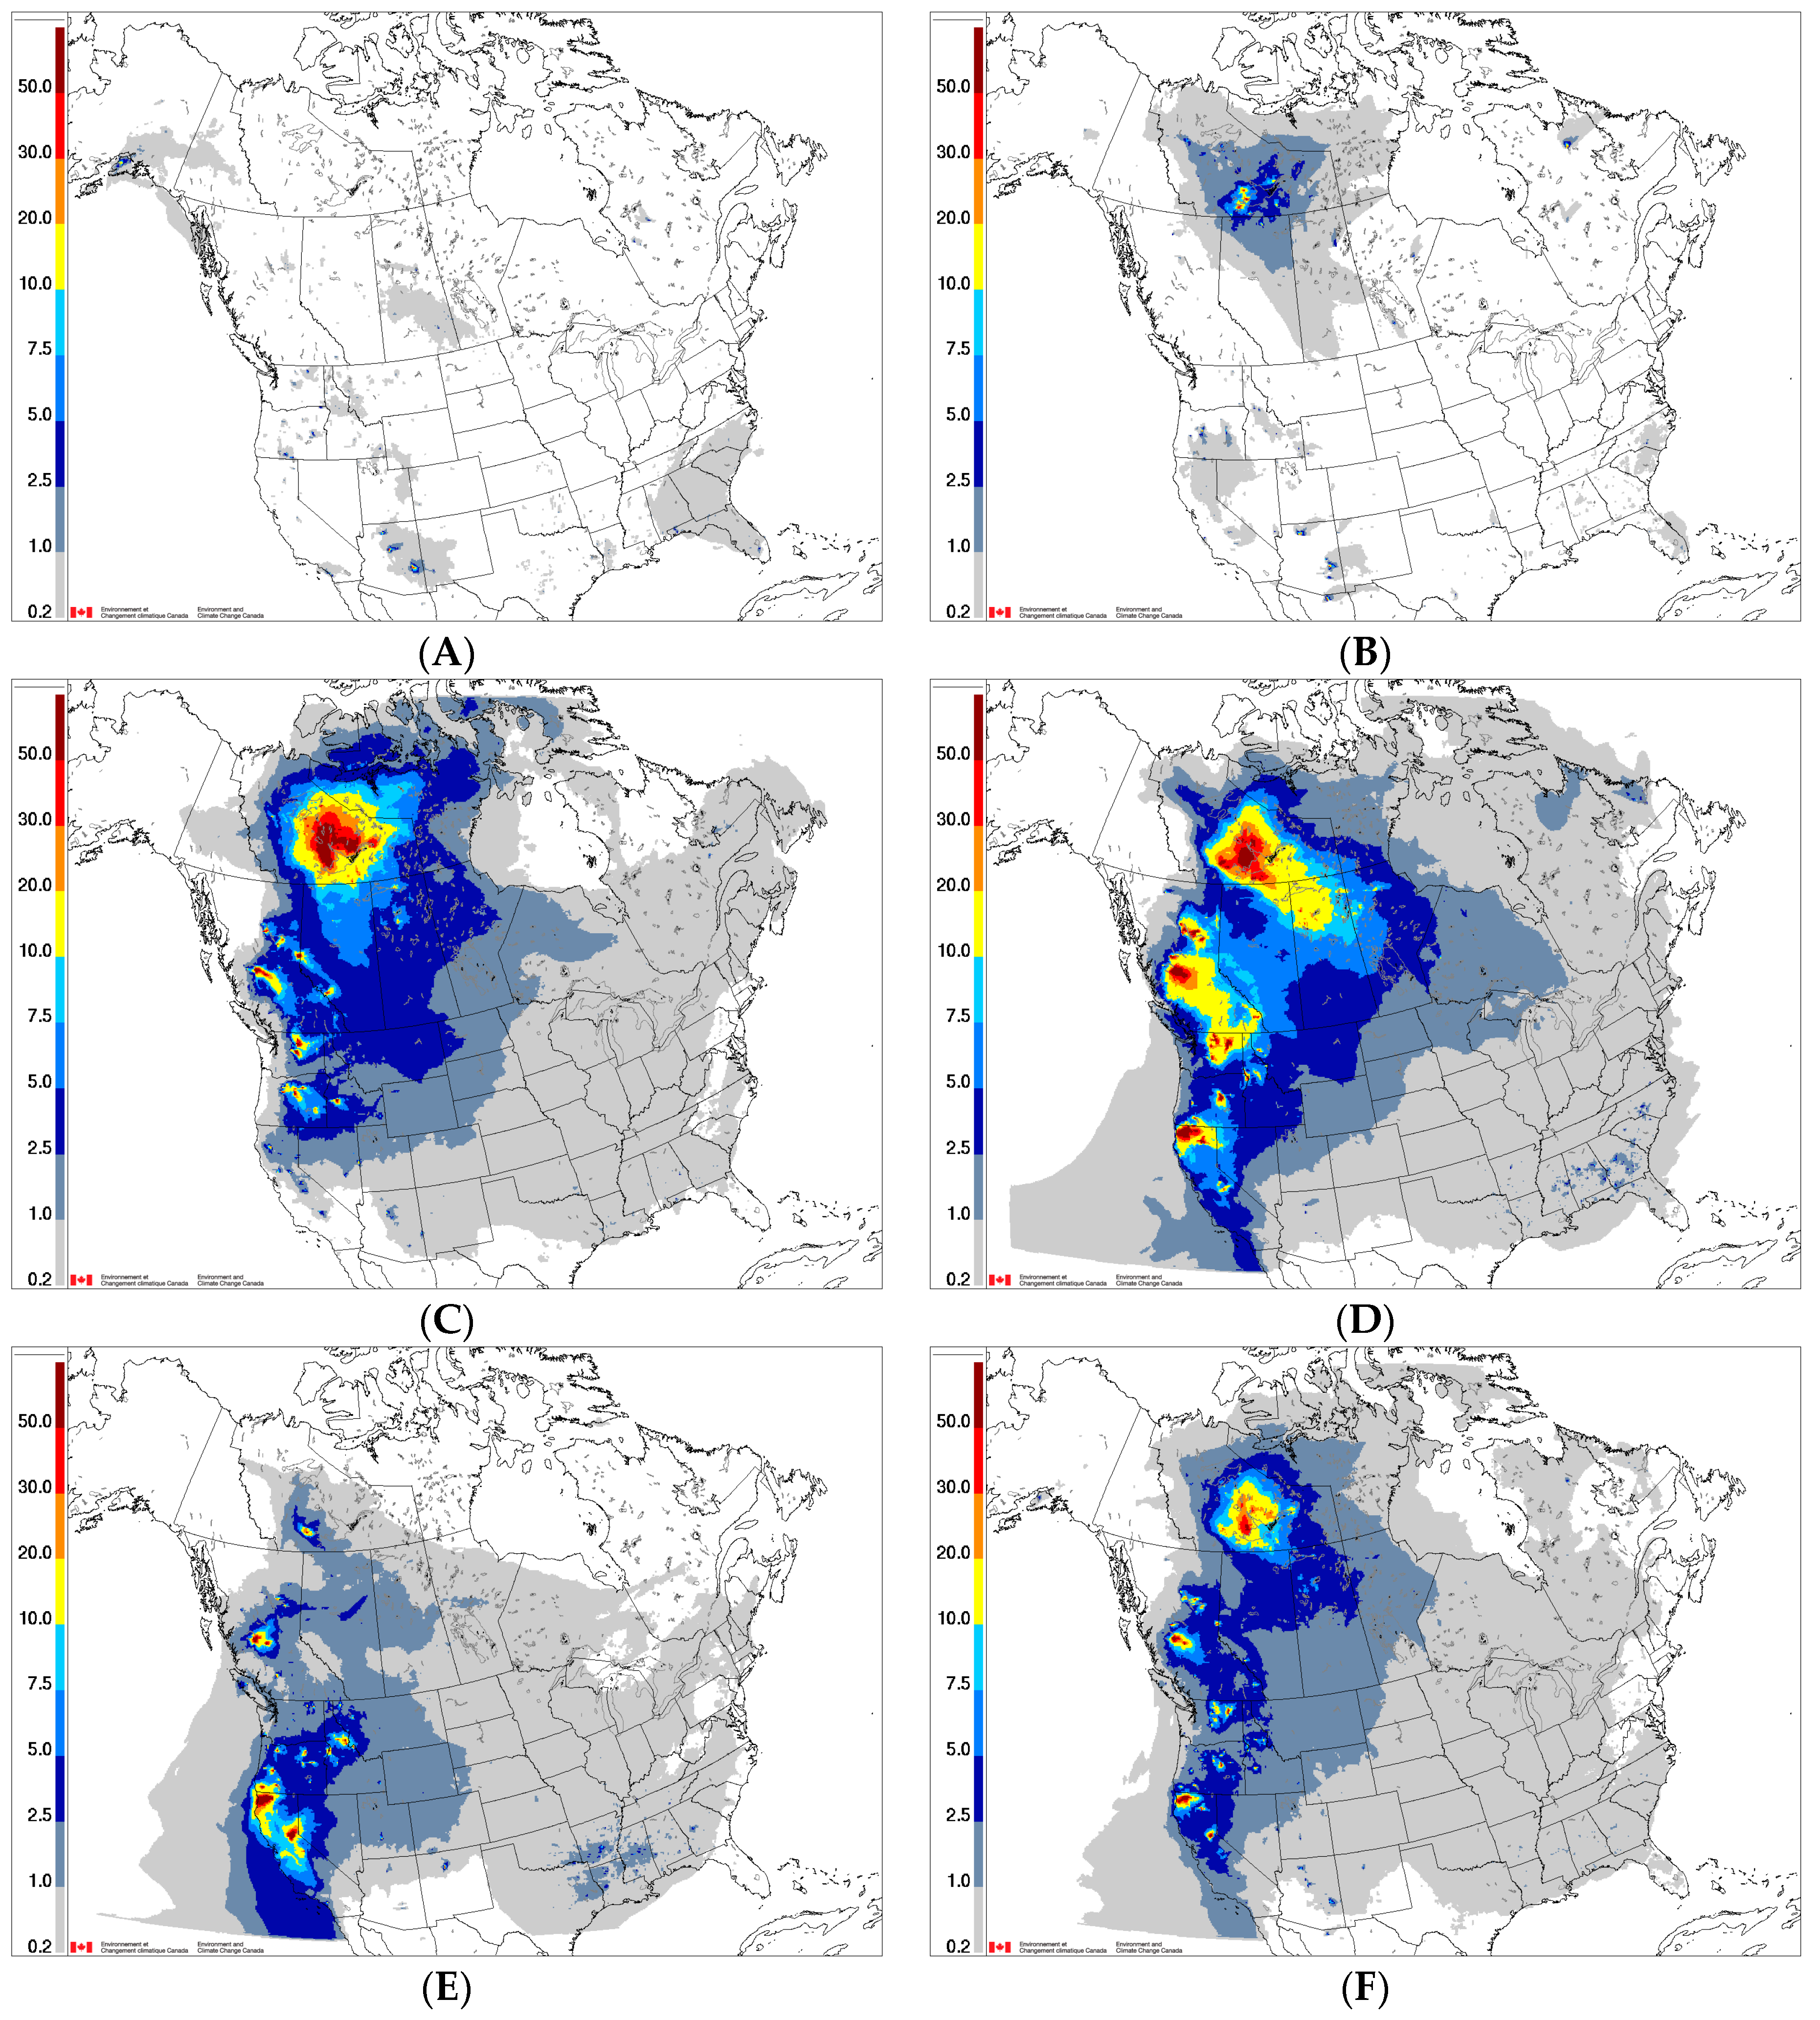
3.1. Area Affected by Wildfire Smoke

In 2013–2016, almost all areas of Canada and the USA included in the FireWork domain were affected by wildfire smoke based on a seasonal fire-PM2.5 > 0.2 µg/m3 exceedance at least once per grid cell (Figure 3, Figure 4, Figure 5 and Figure 6). Western North America was more affected by wildfire smoke than eastern North America in all four years. From a continental perspective, 2014 had the most intense wildfire season, based on the seasonal values of the area affected by wildfire pollution for PM2.5 concentration thresholds from 1 µg/m3 to 28 µg/m3 (Table 2). This year was followed by 2015 and 2013, while 2016 was the year least affected by wildfire smoke. Based on the average seasonal concentrations, the percentage areas of the FireWork domain (including land and water areas) above the 0.2 µg/m3 threshold were 52%, 49%, 44%, and 22% for the years 2013–2016, respectively (Table 2). Above the 1 µg/m3 threshold the corresponding percentage areas were 14%, 17%, 13%, and 6%, and above the 5 µg/m3 threshold the values were 0.8%, 1.9%, 1.1%, and 0.4%.
In terms of total area burned, in 2013 Canada had its seventh most intense wildfire season of the past 34 years [2], whereas the USA was 37% below its 2006–2016 average [42]. The wildfire season in 2013 effectively started in June, with maximum intensity reached in July and August. During these two months, the area for which the monthly average of fire-PM2.5 exceeded the 0.2 µg/m3 threshold covered most of North America (Figure 3). In July, an area of 194,966 km2 (the size of South Dakota) had average monthly fire-PM2.5 above 10 µg/m3 and 13,326 km2 were above 28 µg/m3 (Table 2). In August, using the same thresholds, these areas were 604,476 km2 (larger than California; close to the size of Manitoba and Texas) and 71,844 km2, respectively. August 2013 was the most active month of the year, with intense activity in northwestern and western Canada and the northwestern USA.
In 2014, Canada had its fifth most intense wildfire season of the past 34 years in terms of total area burned, while in the USA the value was 48% below its 2006–2016 average [2,42]. The extreme wildfire event in the Northwest Territories near the city of Yellowknife started in June and peaked in July (Figure 4). In July, intense wildfires began burning in British Columbia, Alberta, Washington, Oregon, California, and Idaho, bringing the total area with average monthly fire-PM2.5 > 10 µg/m3 to 541,468 km2, and > 28 µg/m3 to 146,616 km2. These fires persisted into August, making August 2014 the most extreme month of the 2013–2016 period in terms of area affected by wildfire smoke. In this month, average monthly fire-PM2.5 values above the 5, 10, and 28 µg/m3 thresholds covered 2,560,671 km2 (larger than Alaska or Nunavut), 934,005 km2 (the size of British Columbia), and 157,462 km2 (the size of Georgia), respectively (Table 2).
The 2015 season was the sixth most intense of the past 34 years for Canada in terms of area burned [2]. In the USA, it was the peak year of the 2006–2016 period, with more than 10 million acres (40,500 km2) burned, 45% above the period average [42]. The 2015 fire season was marked by two intense wildfire periods: the first from 15 June to 15 July and the second from 1 to 15 August [27] (Figure 5). In the first period, most of the wildfires occurred in northwestern Canada (Alberta and Saskatchewan), whereas in the second period most of the wildfires occurred in the western USA (Washington, Oregon, Idaho, and California). In July and August areas of 306,687 km2 and 636,671 km2 had average monthly fire-PM2.5 > 10 µg/m3, respectively, and areas of 30,776 km2 and 143,120 km2 were > 28 µg/m3 (Table 2).
The 2016 fire season included unprecedented impacts in Canada on both people and the national economy. The entire city of Fort McMurray, Alberta, with a population of nearly 90,000, was evacuated in May when it was overrun by a large, fast-moving wildfire (Figure 6). Estimated insured fire damages to Fort McMurray were 9.6 billion dollars, the costliest insured natural disaster in Canadian history [4]. Despite this disaster, 2016 was the least intense wildfire season among the four years analyzed in terms of area burned [2] and area affected by wildfire smoke across Canada (Table 2). In the USA, the 2016 area burned was 21% below its 2006–2016 average [42]. On the other hand, the early start to the wildfire season in Canada made the month of May 2016 the most affected by wildfire pollution among the four Mays assessed. For May 2016 the area with average monthly fire-PM2.5 > 10 µg/m3 and > 28 µg/m3 was 58,168 km2 and 11,955 km2 respectively (Table 2).
It is also of interest to examine the importance of fire-PM2.5 relative to other sources of PM2.5. Figure S2 shows the seasonal fire-PM2.5 contribution to total PM2.5 as a percentage for each of the four years. For 2013 to 2015, the seasonal contribution of fire-PM2.5 to total PM2.5 was 50% or more over much of northwestern North America and parts of the U.S. mountain west. In 2014 the seasonal wildfire contribution was 90% or greater for a large part of the Northwest Territories and parts of the interior of British Columbia. These results are not surprising considering that these areas have relatively few inhabitants and low anthropogenic emissions.
It is difficult to compare the monthly model forecasted fire-PM2.5 directly with PM2.5 measurements, as measurements are influenced by all PM2.5 sources, not just biomass burning emissions. As an indirect comparison, however, we note that archived near-real-time measurement from the AirNow data feed (www.airnow.gov) include at least one U.S. or Canadian AQ station located close to wildfires having monthly PM2.5 concentrations above 30, 50, and even 150 µg/m3 for each of the four years analyzed here. The most extreme month was August 2015, when 13 PM2.5 measurement stations reported mean monthly PM2.5 concentrations of 30 µg/m3 or above, including six stations in Idaho, two stations each in Oregon, Washington State, and British Columbia, and one station in Montana (see Table S2). FireWork also forecasted mean monthly fire-PM2.5 concentrations above 30 μg/m3 for two regions of California in August 2015; although no stations with available measurements were located in these regions, one nearby station in Shasta county in northern California had a mean monthly PM2.5 concentration of 24.5 μg/m3 and 100% data completeness.

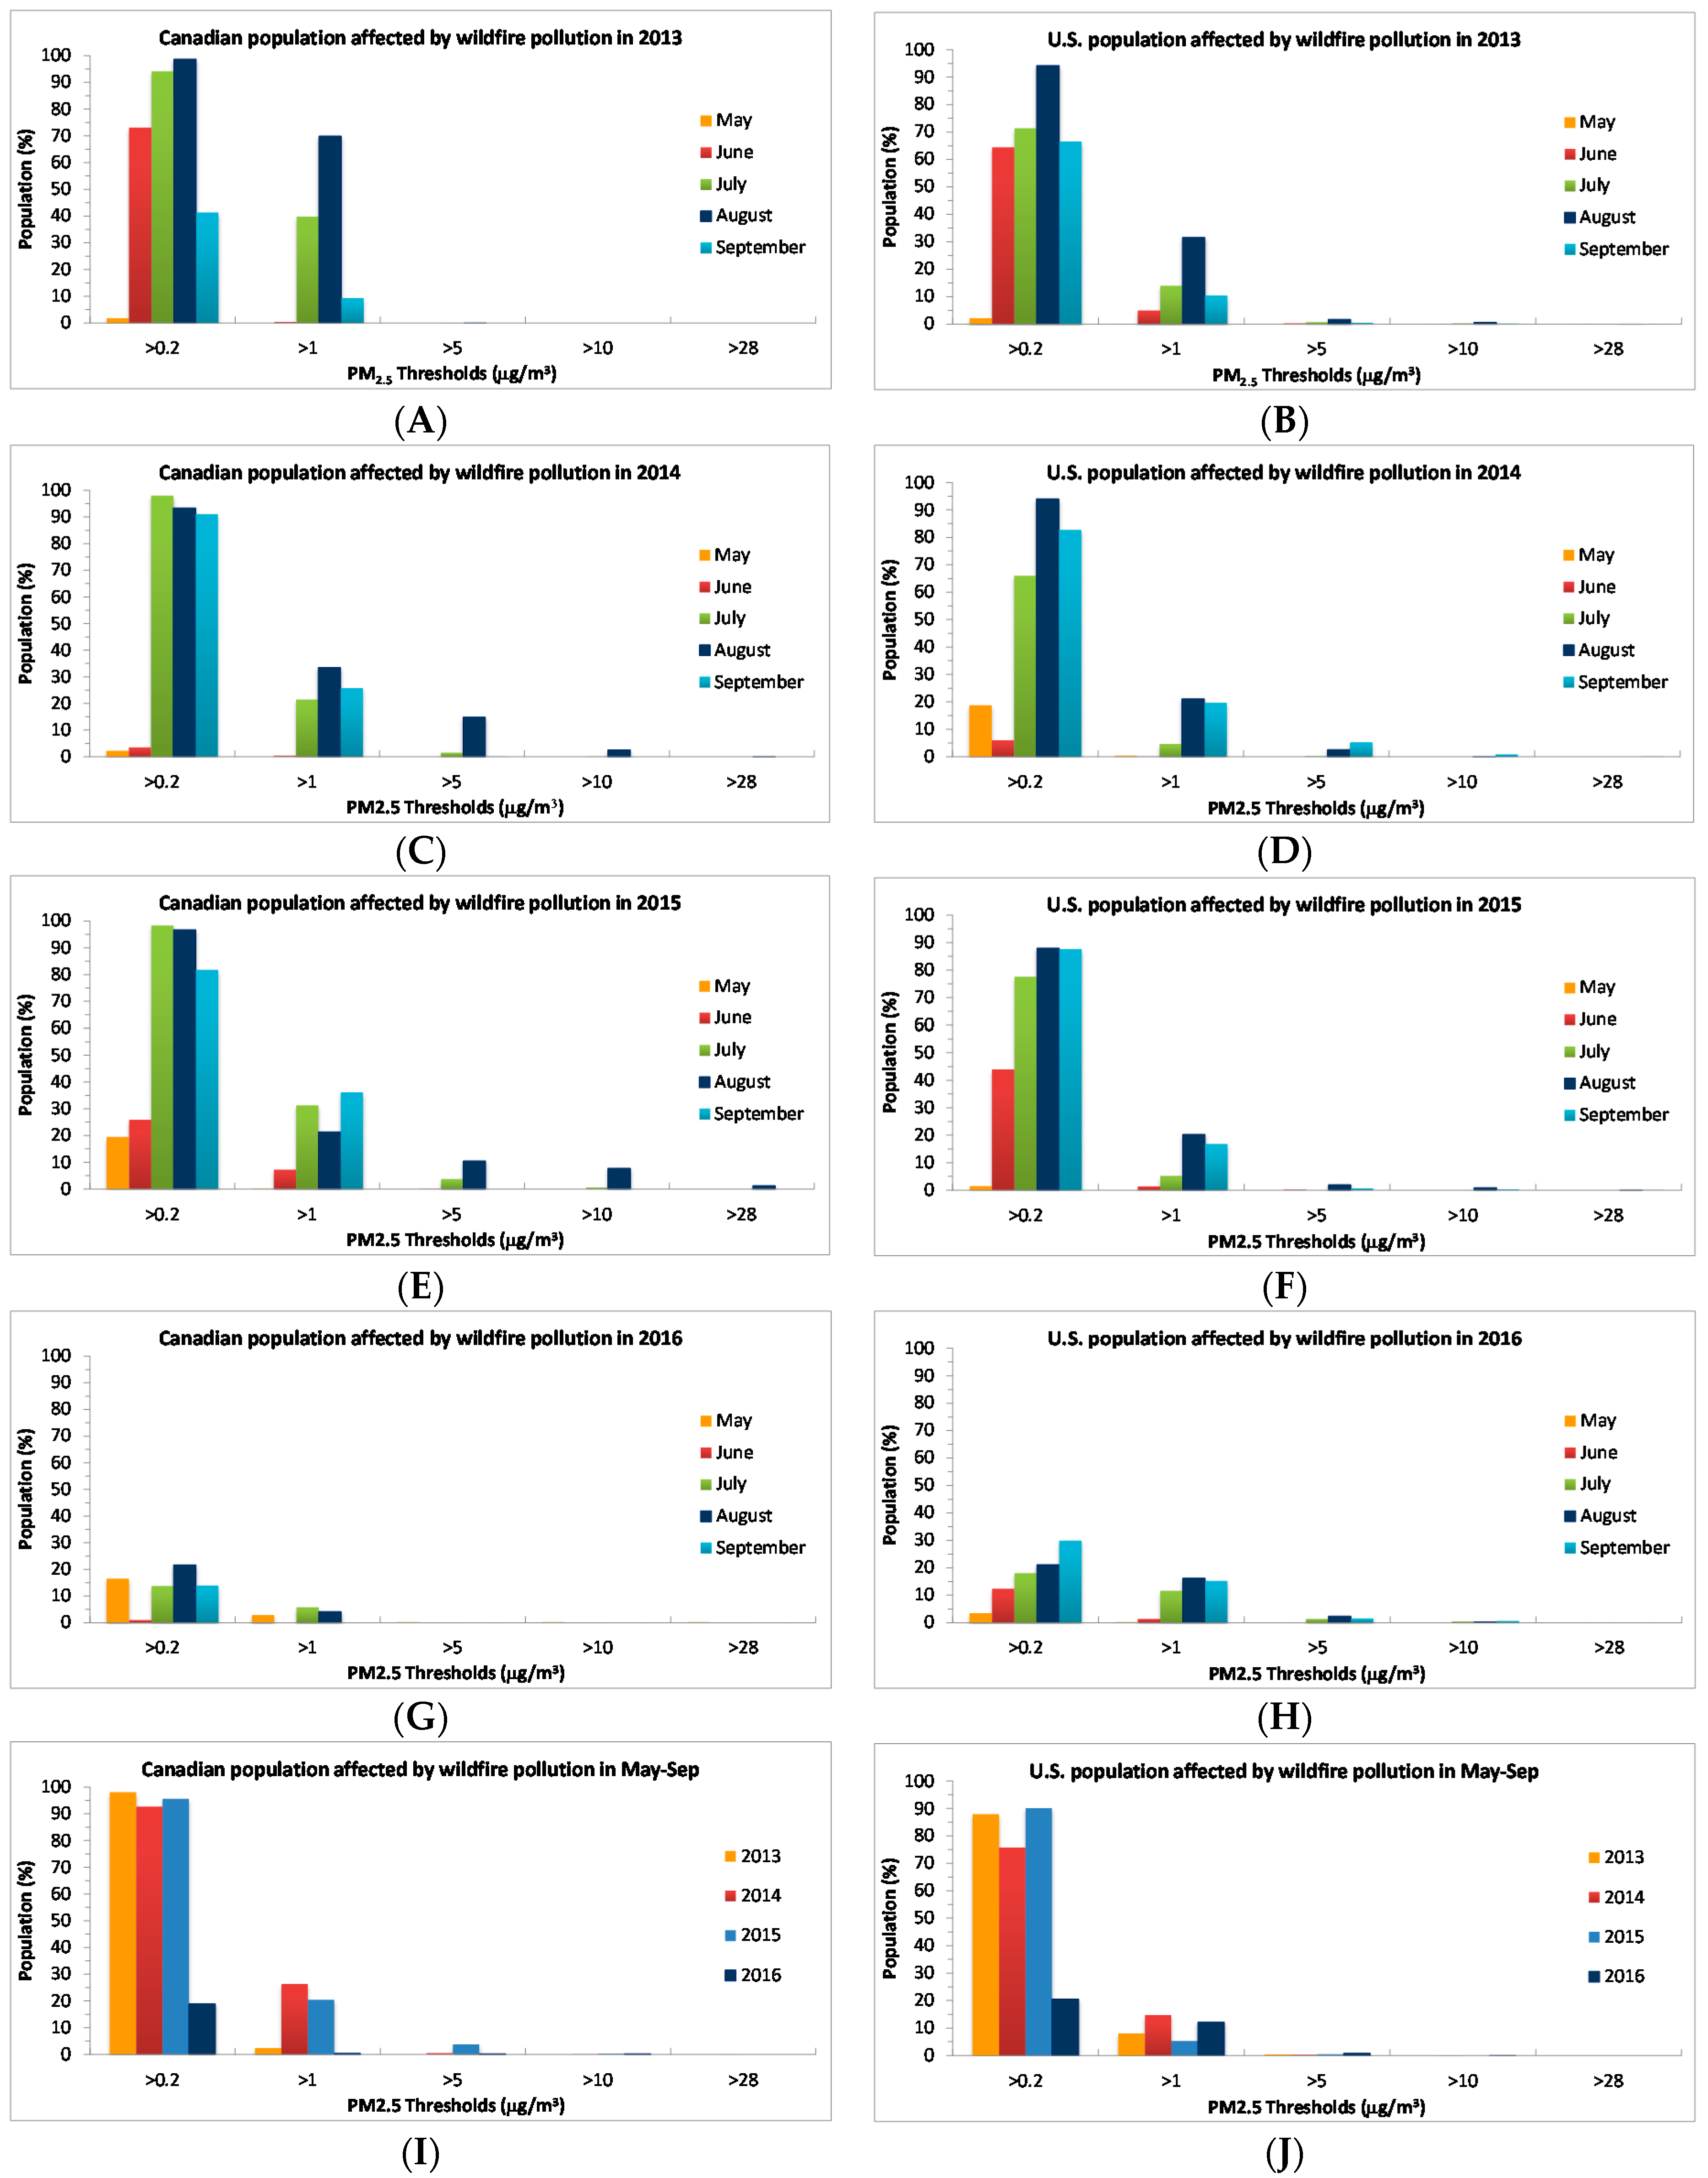
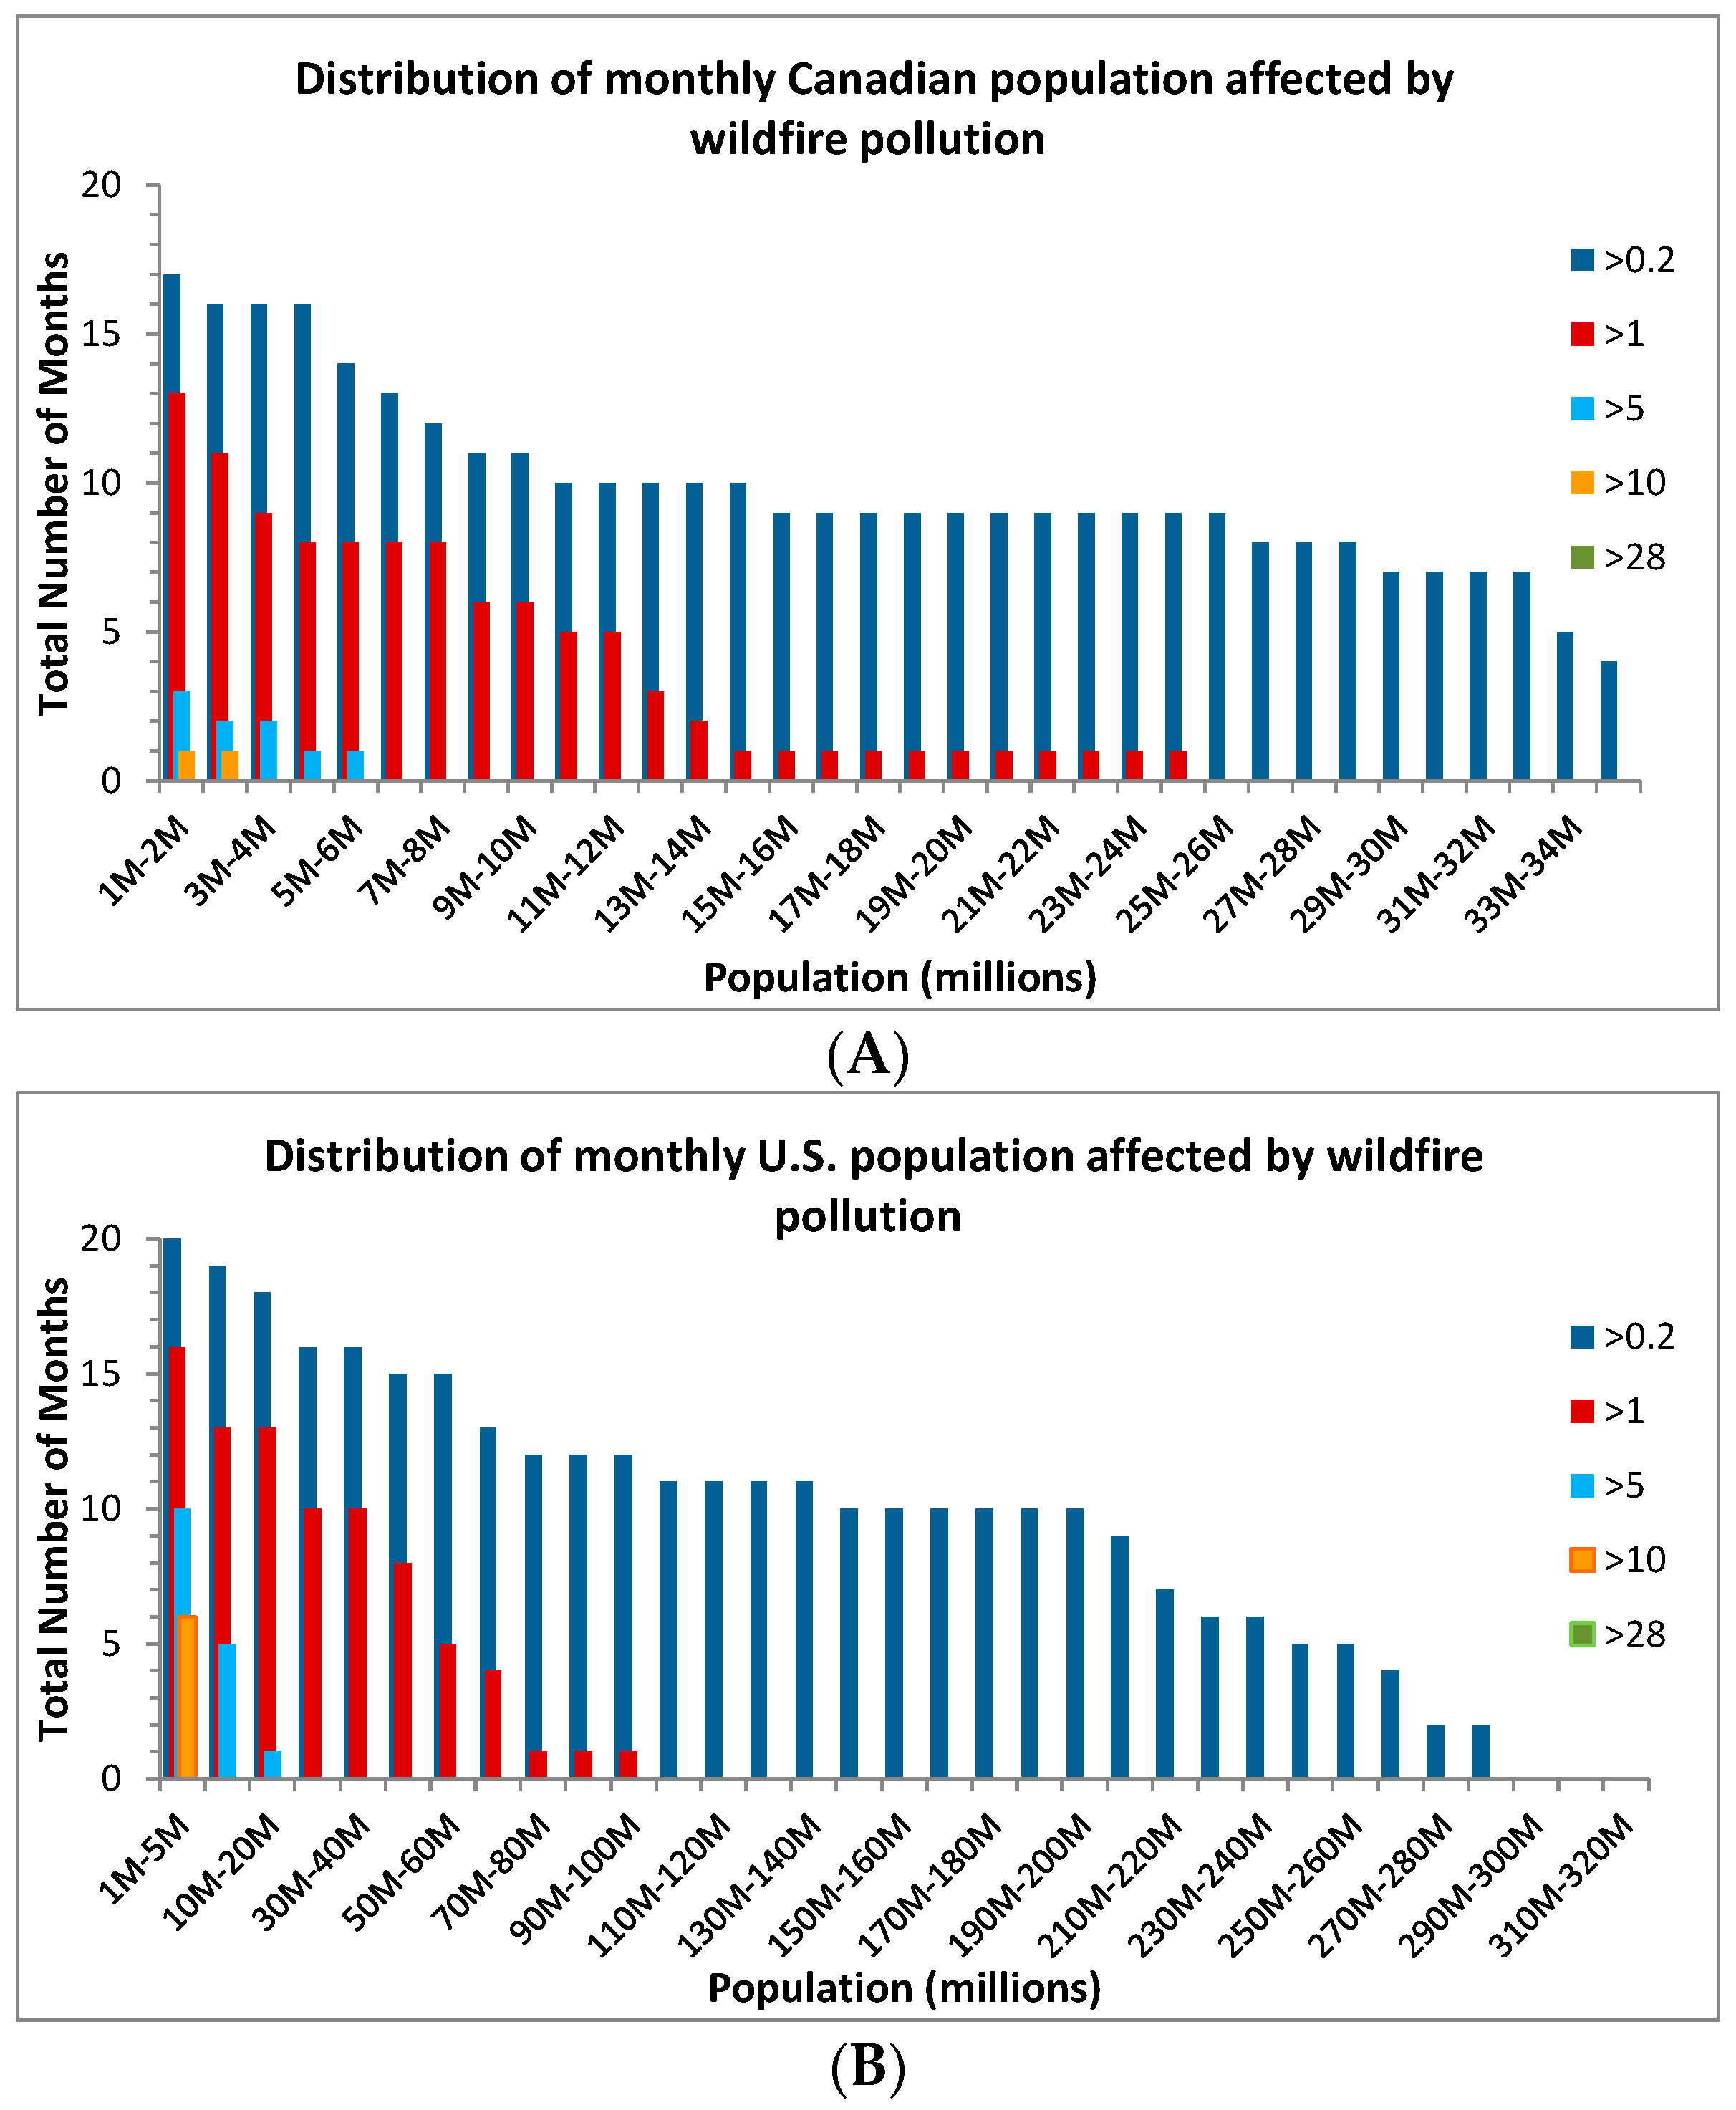
3.2. Population Exposure to Wildfire Pollution

In terms of population exposure to wildfire-related PM2.5 pollution, for 17 of the 20 months considered, more than 1 million Canadians (3% of the population) were estimated to have been affected by average monthly fire-PM2.5 > 0.2 µg/m3 (Figure 7). During the same period, more than 14 million Canadians (39% of the population) were affected by average monthly fire-PM2.5 > 0.2 µg/m3 in 10 of the 20 months, and over 32 million Canadians (90% of the population) were affected in 7 months. The months affecting the most people were July and August (Figure 8 and Table S3), with August 2015 being the worst for average monthly fire-PM2.5 > 10 µg/m3. During August 2015 the proportion of the Canadian population affected by fire-PM2.5 above thresholds of 0.2, 1, 5, 10, and 28 µg/m3 were 97%, 21%, 11%, 8%, and 1.2%, respectively. The three periods in which the most Canadians were exposed to >28 µg/m3 were: (a) August 2015 (417,171 people or 1.2% of the population) due to extreme wildfires in British Columbia and the northwestern USA; (b) May 2016 (69,909 people or 0.2% of the population) due to extreme wildfires in northern Alberta near Fort McMurray; and (c) August 2014 (27,160 people or 0.1% of the population) due to extreme wildfires in northwestern Canada. In all other months, less than 0.1% of the Canadian population was affected at this very high threshold (Table S3).
Based on the average seasonal statistics (Table S3), over 90% of the Canadian population was affected by seasonal fire-PM2.5 > 0.2 µg/m3 in 2013, 2014 and 2015. The 2016 wildfire season was much milder, with 19% of Canadian population affected by wildfire smoke above this threshold (Figure 8). The corresponding proportions for the 1 µg/m3 threshold ranged from 0.4% (2016) to 26% (2014). The population affected by concentrations above the 10 µg/m3 threshold reached its maximum in 2015, with over 100,000 people (Table S3).
In the USA, more than 200 million people (65% of the population) were exposed to average monthly fire-PM2.5 > 0.2 µg/m3 during nine of the 20 months considered (Figure 7). As well, a much greater proportion of the U.S. population was affected by wildfire pollution in 2013, 2014, and 2015 than in 2016, similar to Canada (Figure 8), and for both the USA and Canada, the proportion of the population exposed to wildfire pollution in September was larger than in June.
The total percentages of the U.S. population affected by seasonal fire-PM2.5 > 0.2 µg/m3 ranged from 21% (2016) to 90% (2015) (Figure 8 and Table S4), and the corresponding range above 1 µg/m3 was 5% (2015) to 15% (2014). Based on the four-year average seasonal statistics for population exposure to fire-PM2.5 > 0.2 µg/m3, a smaller percentage of the U.S. population (69%) than the Canadian population (76%) was exposed to pollution above this threshold (Tables S3 and S4). For concentrations > 1 µg/m3 the corresponding percentages were 10% in the USA and 12% in Canada. However, for average seasonal fire-PM2.5 > 28 µg/m3, a higher percentage of Americans than Canadian were exposed. The affected U.S. population ranged from 32,549 in 2014 to 56,442 in 2015 (Table S4), giving a four-year average exposure of 0.015% for the U.S. population compared with 0.004% for the Canadian population (Table S3).

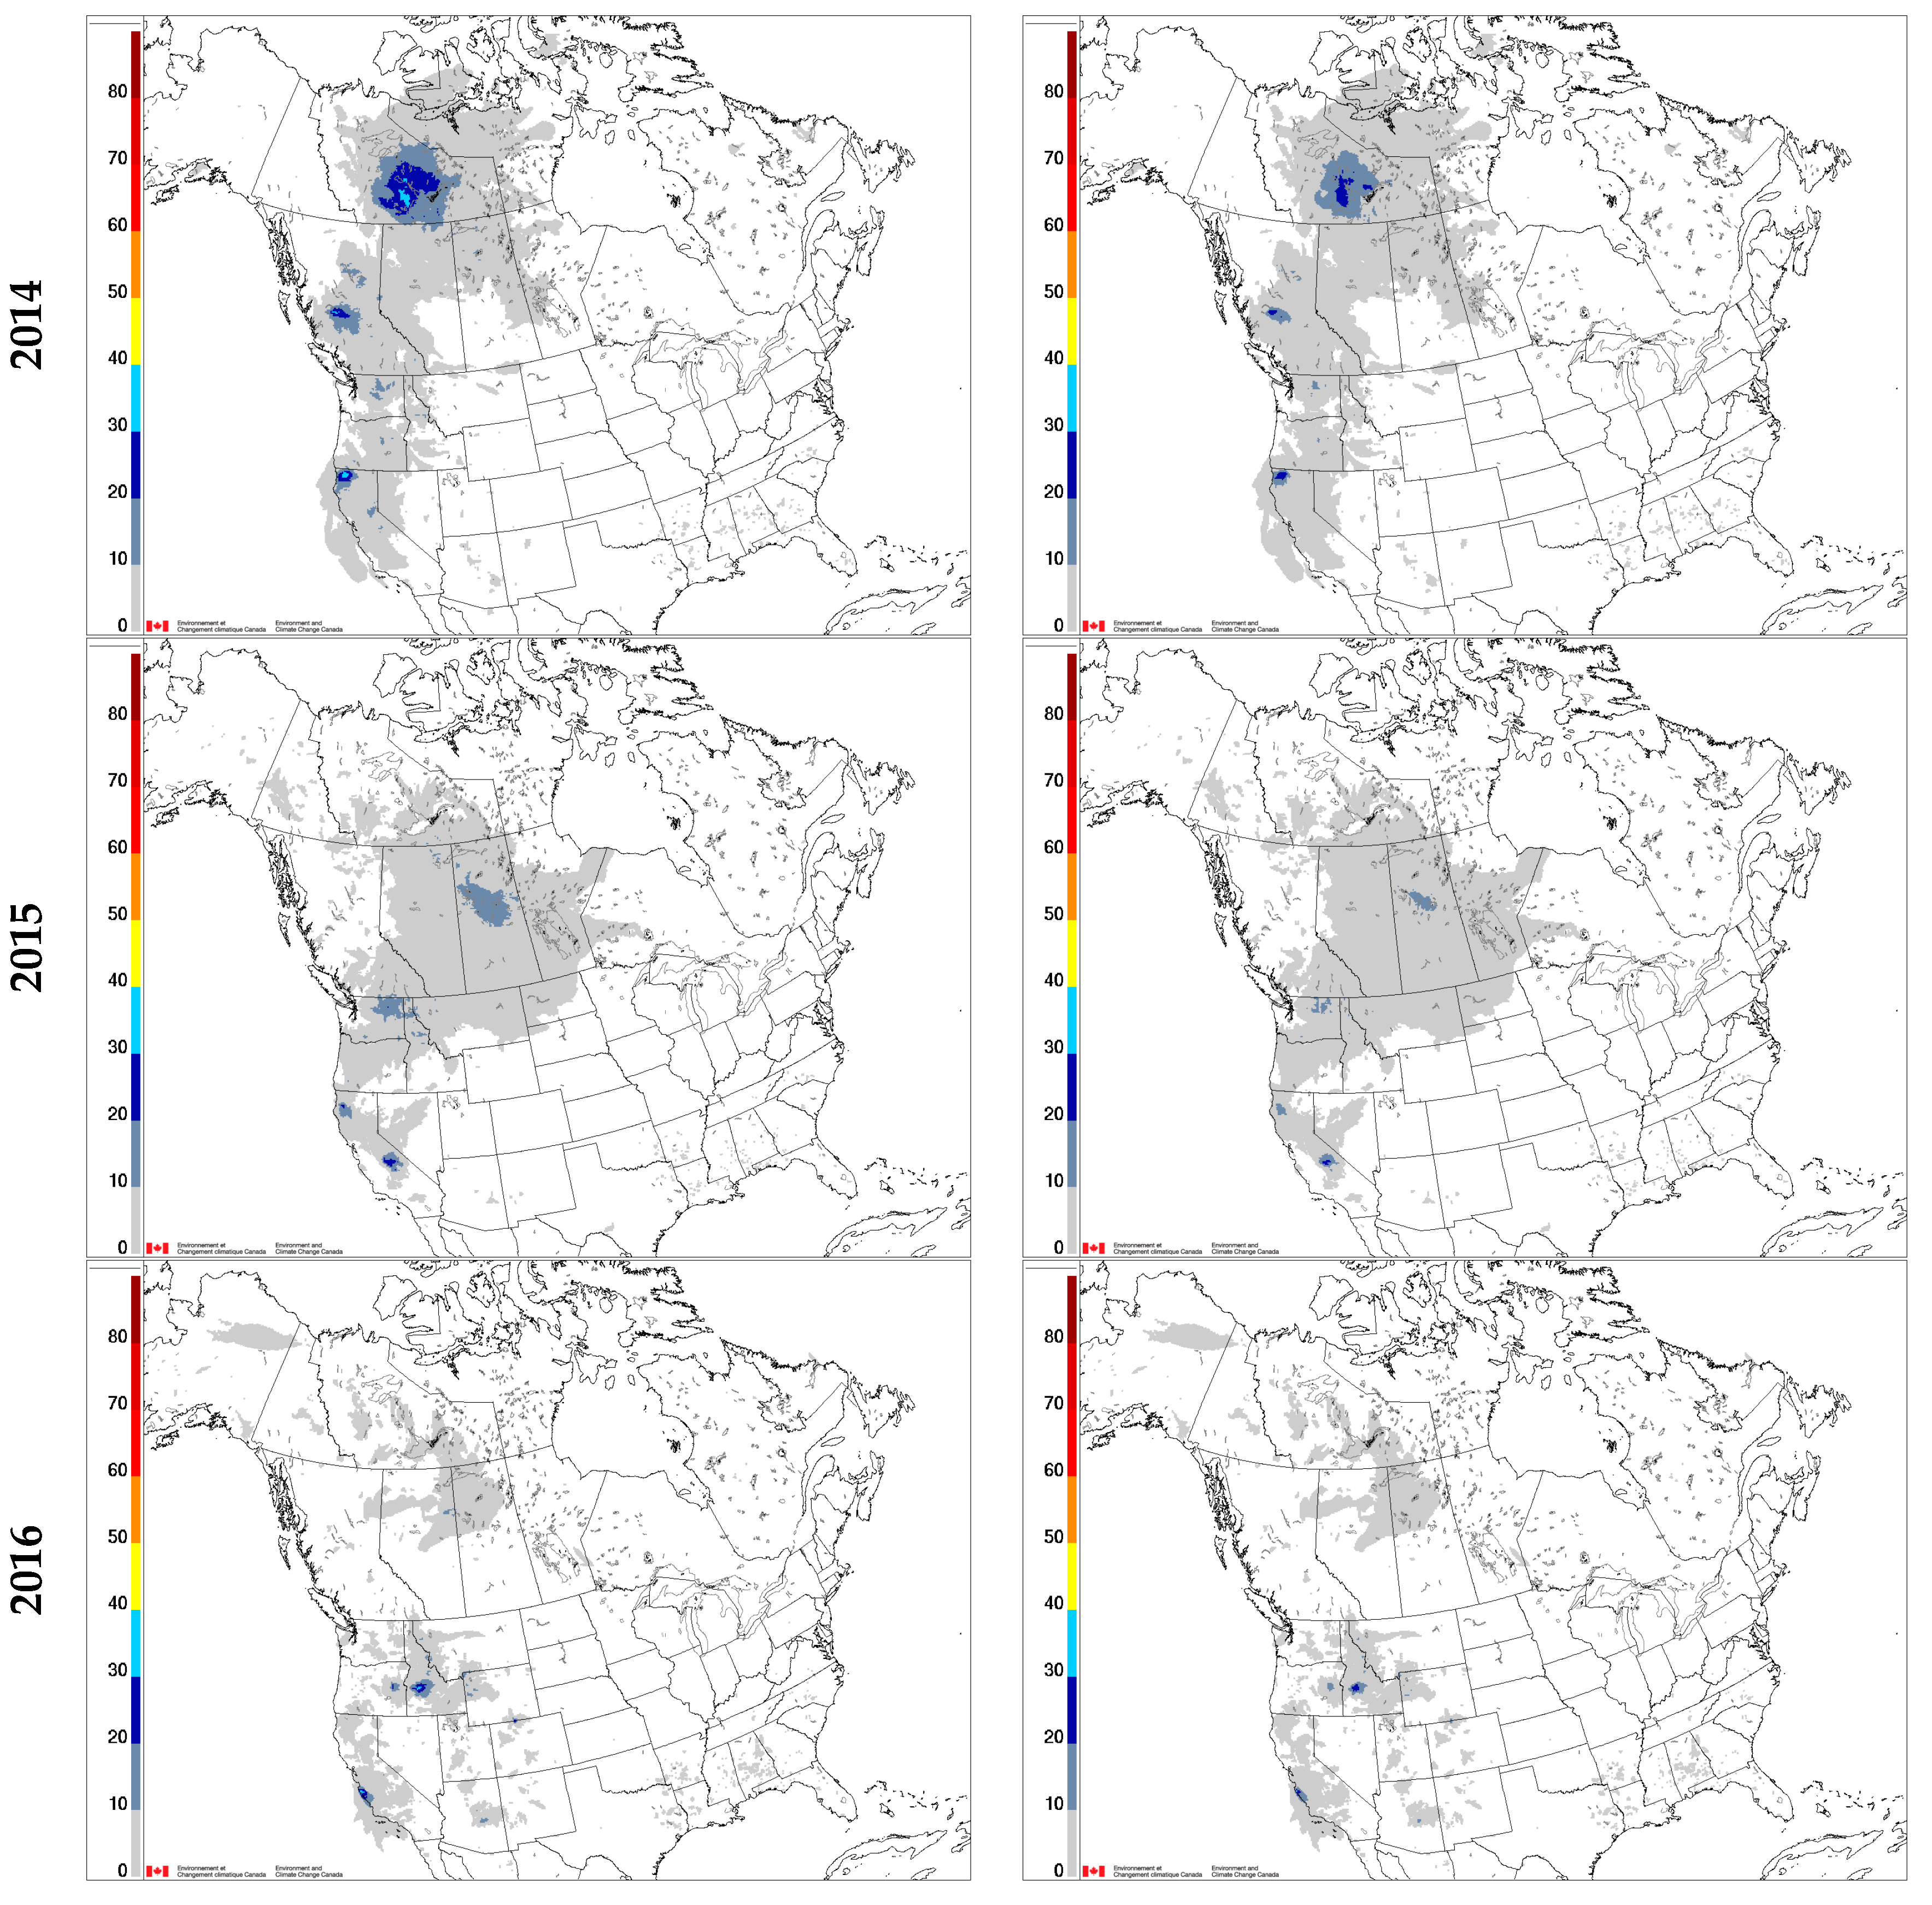
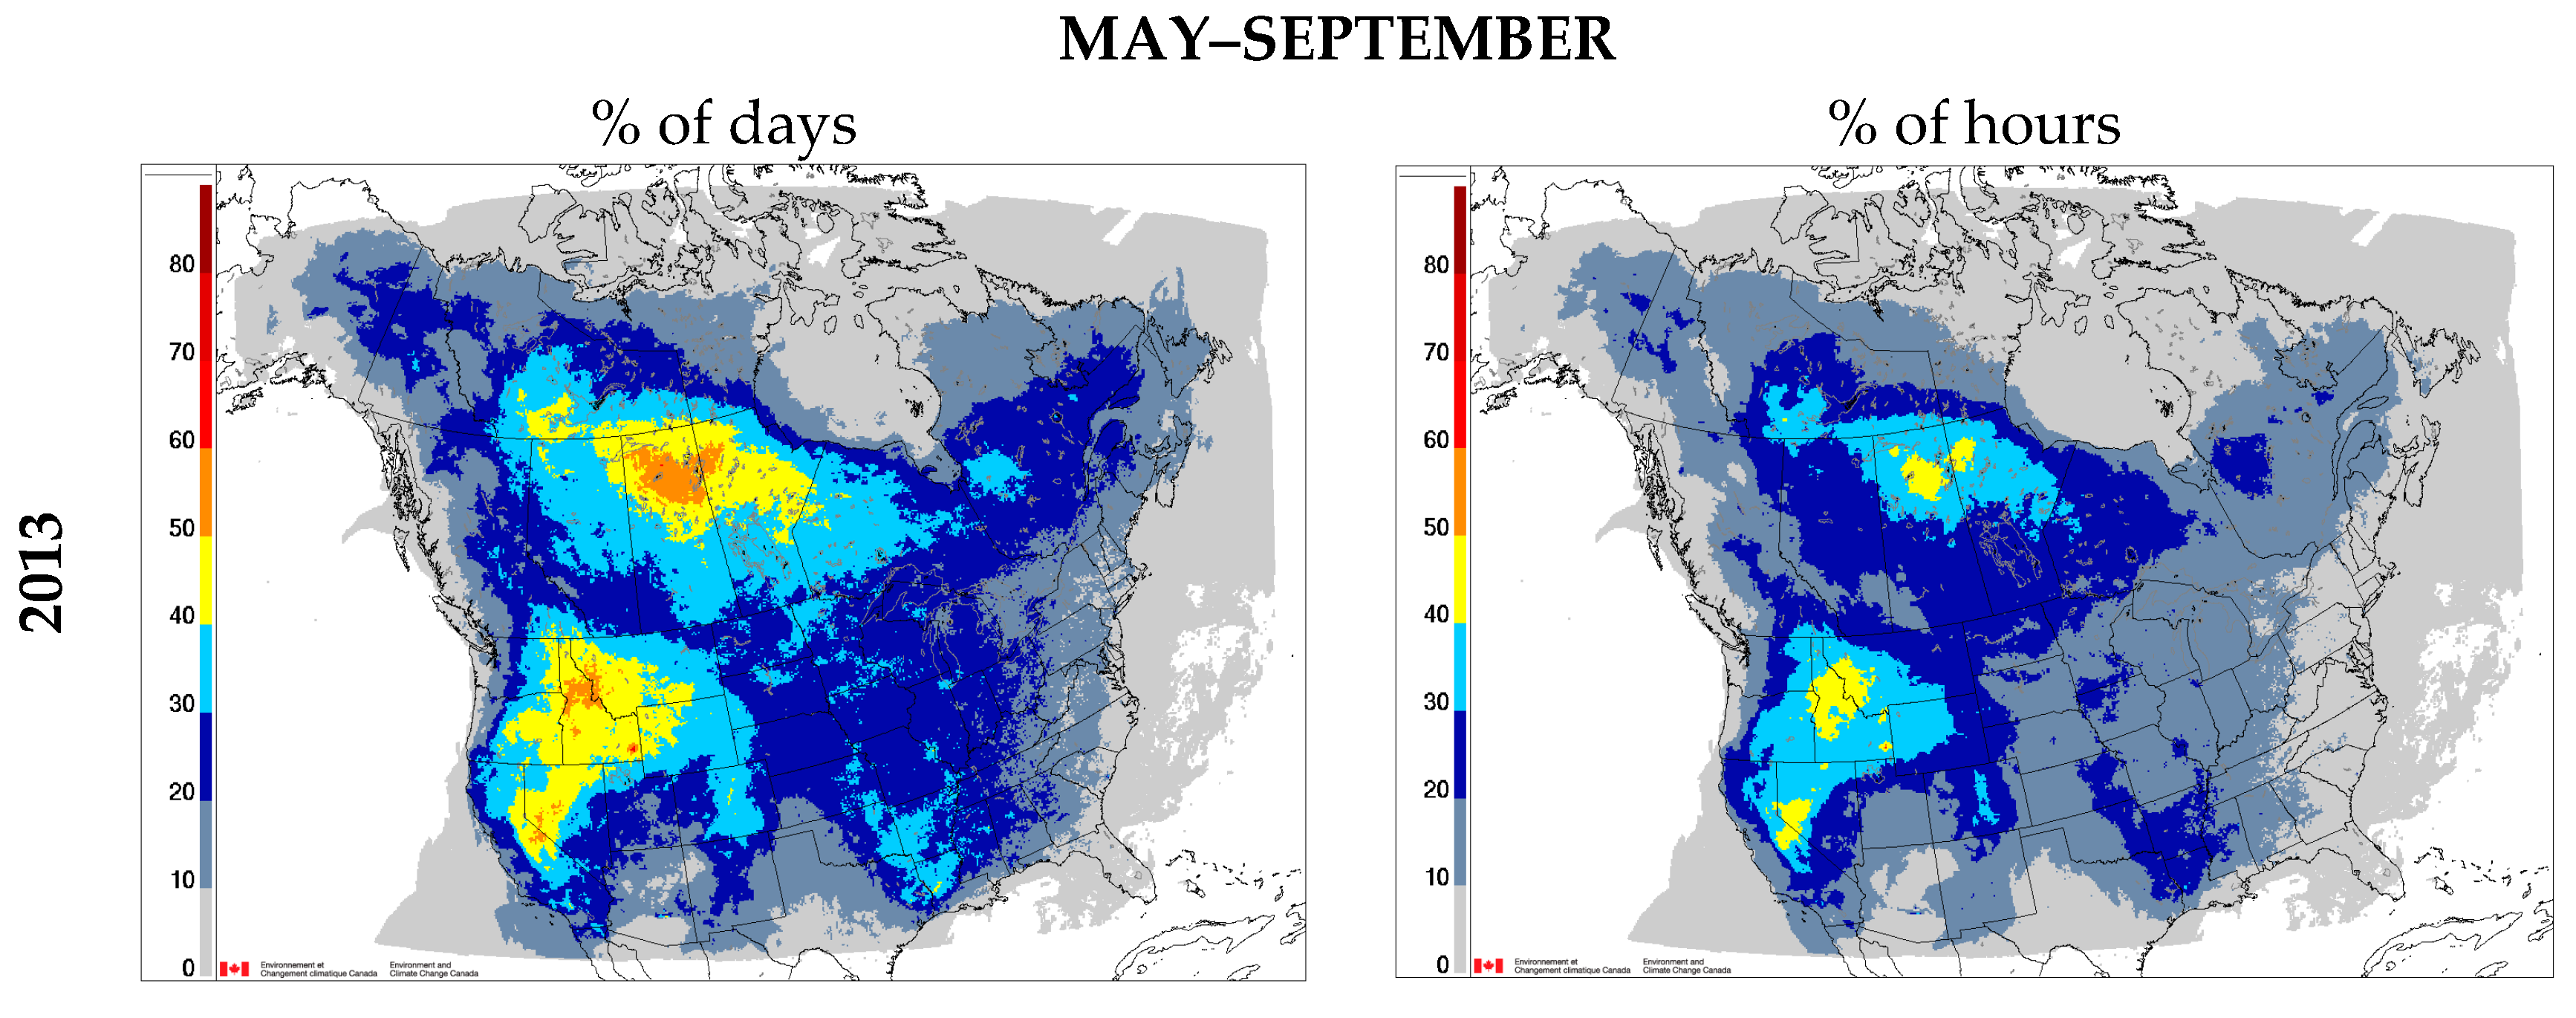
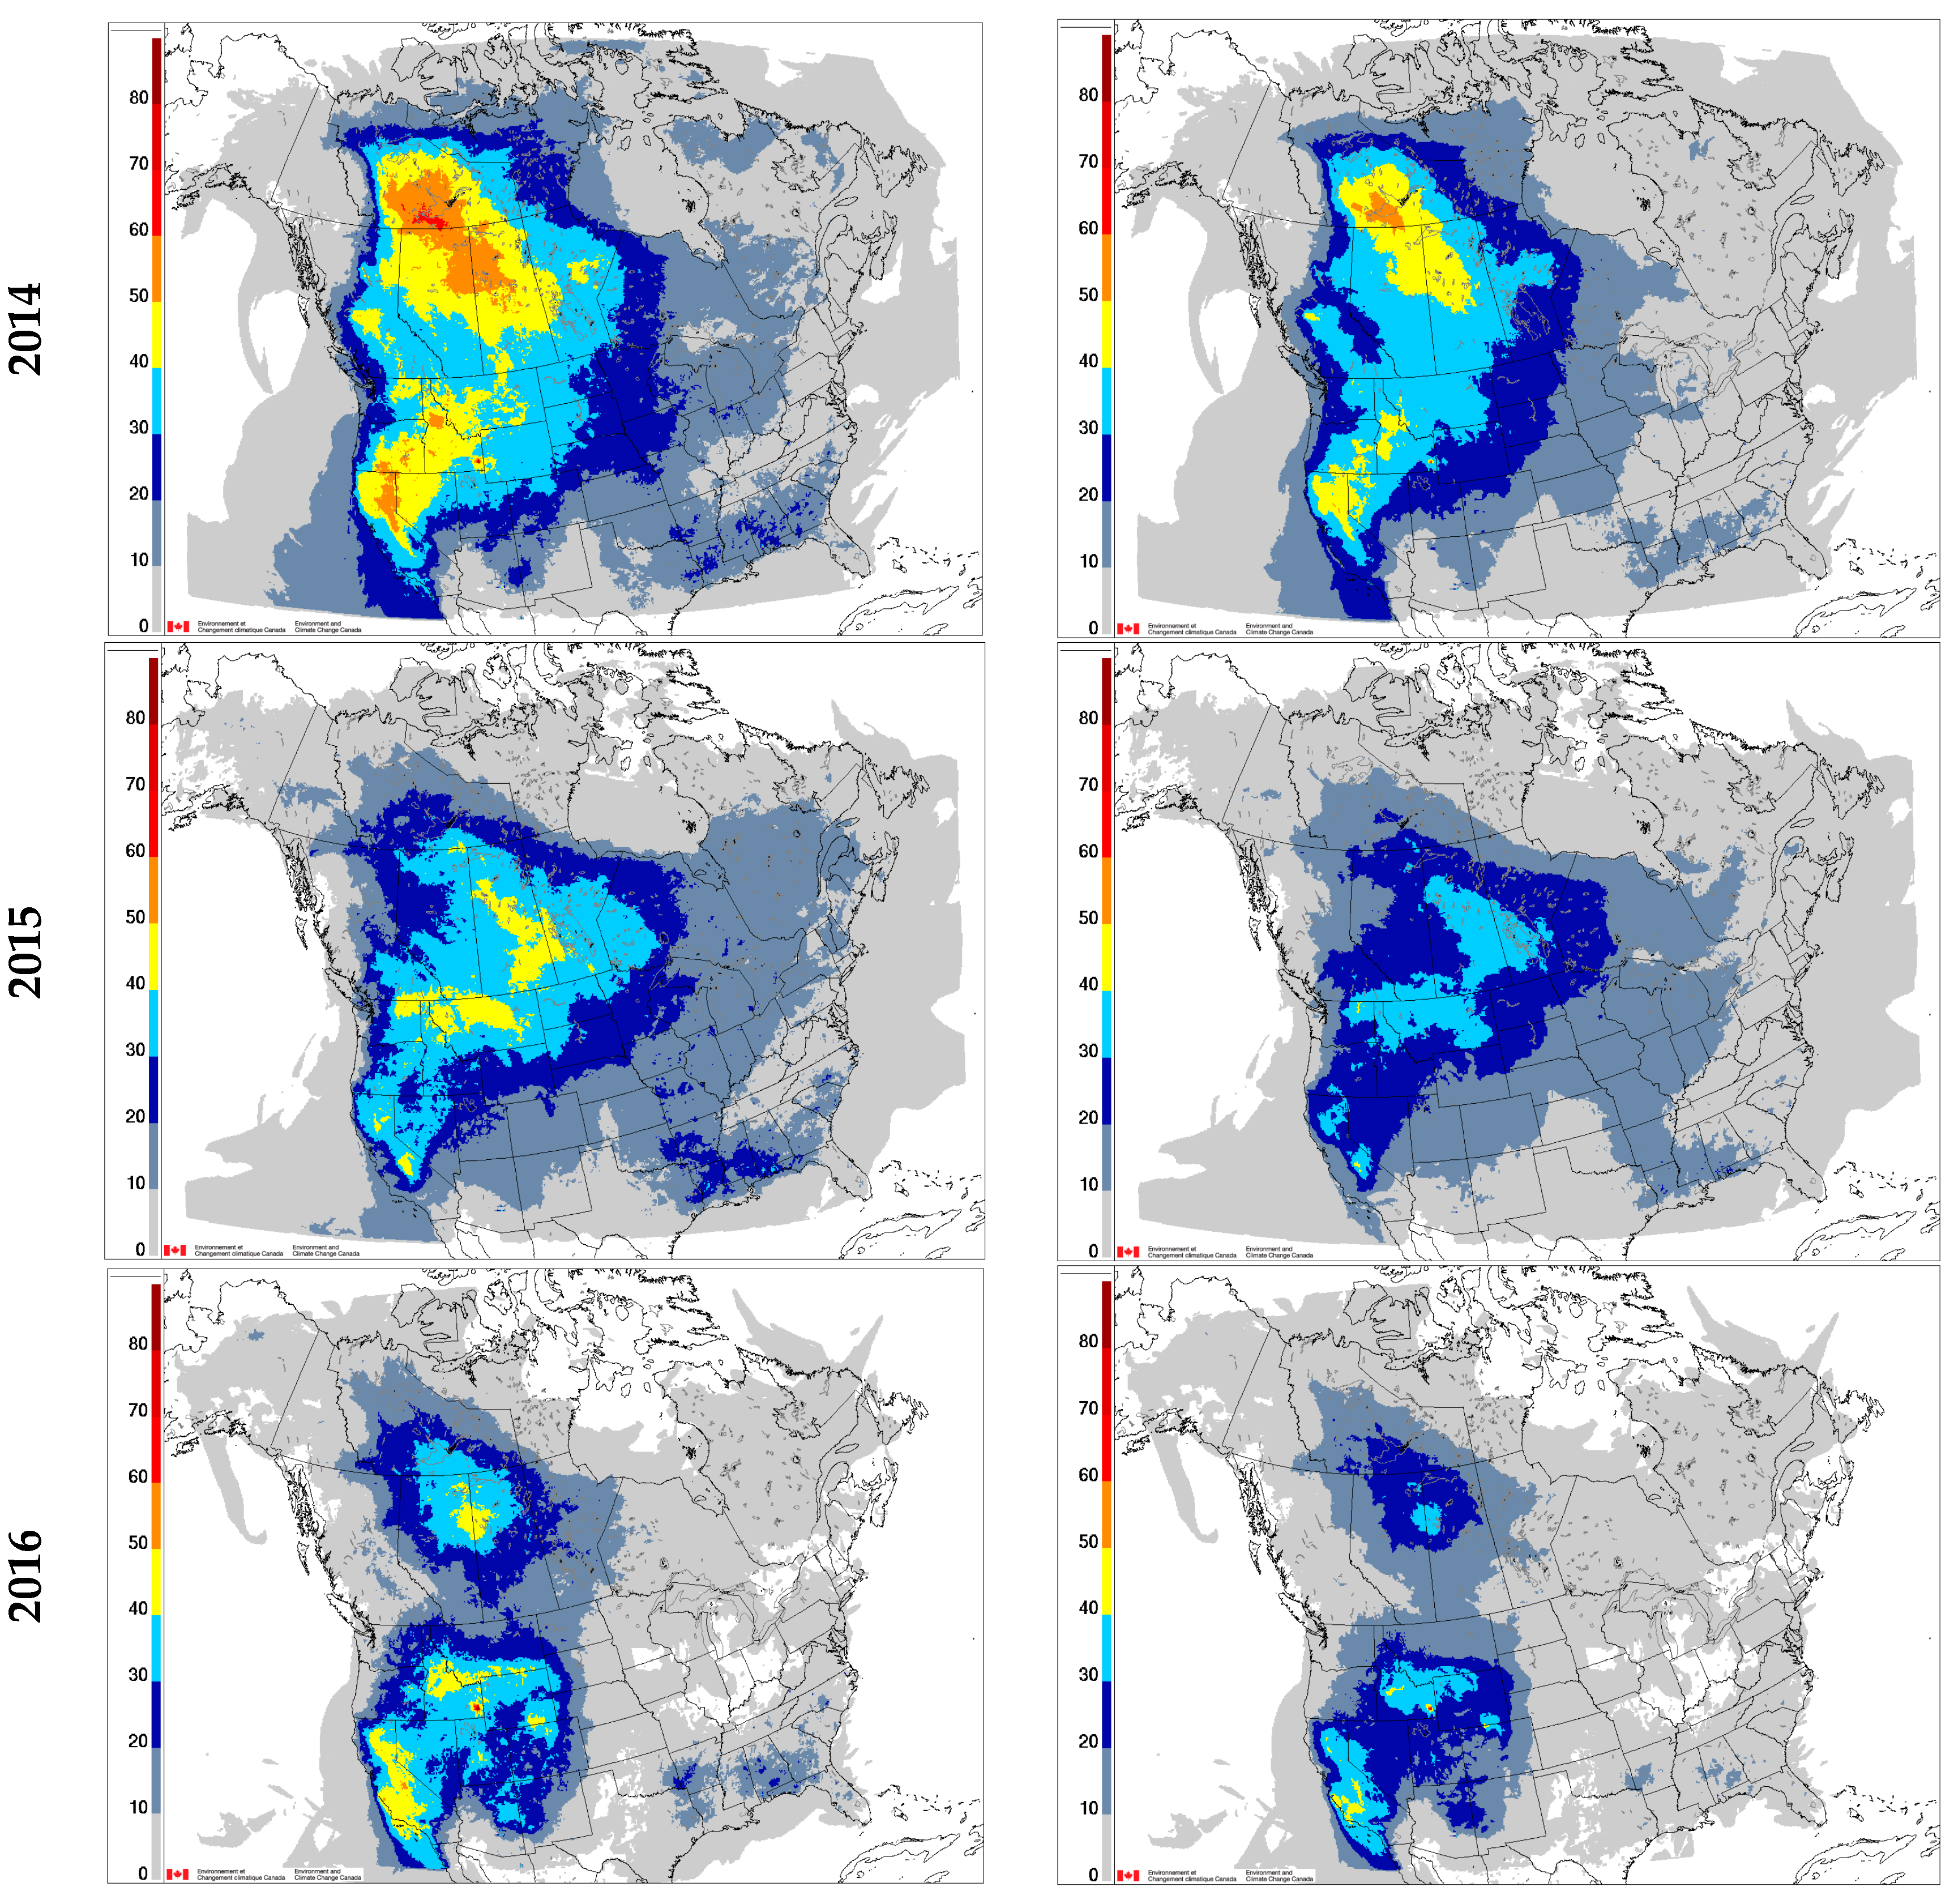
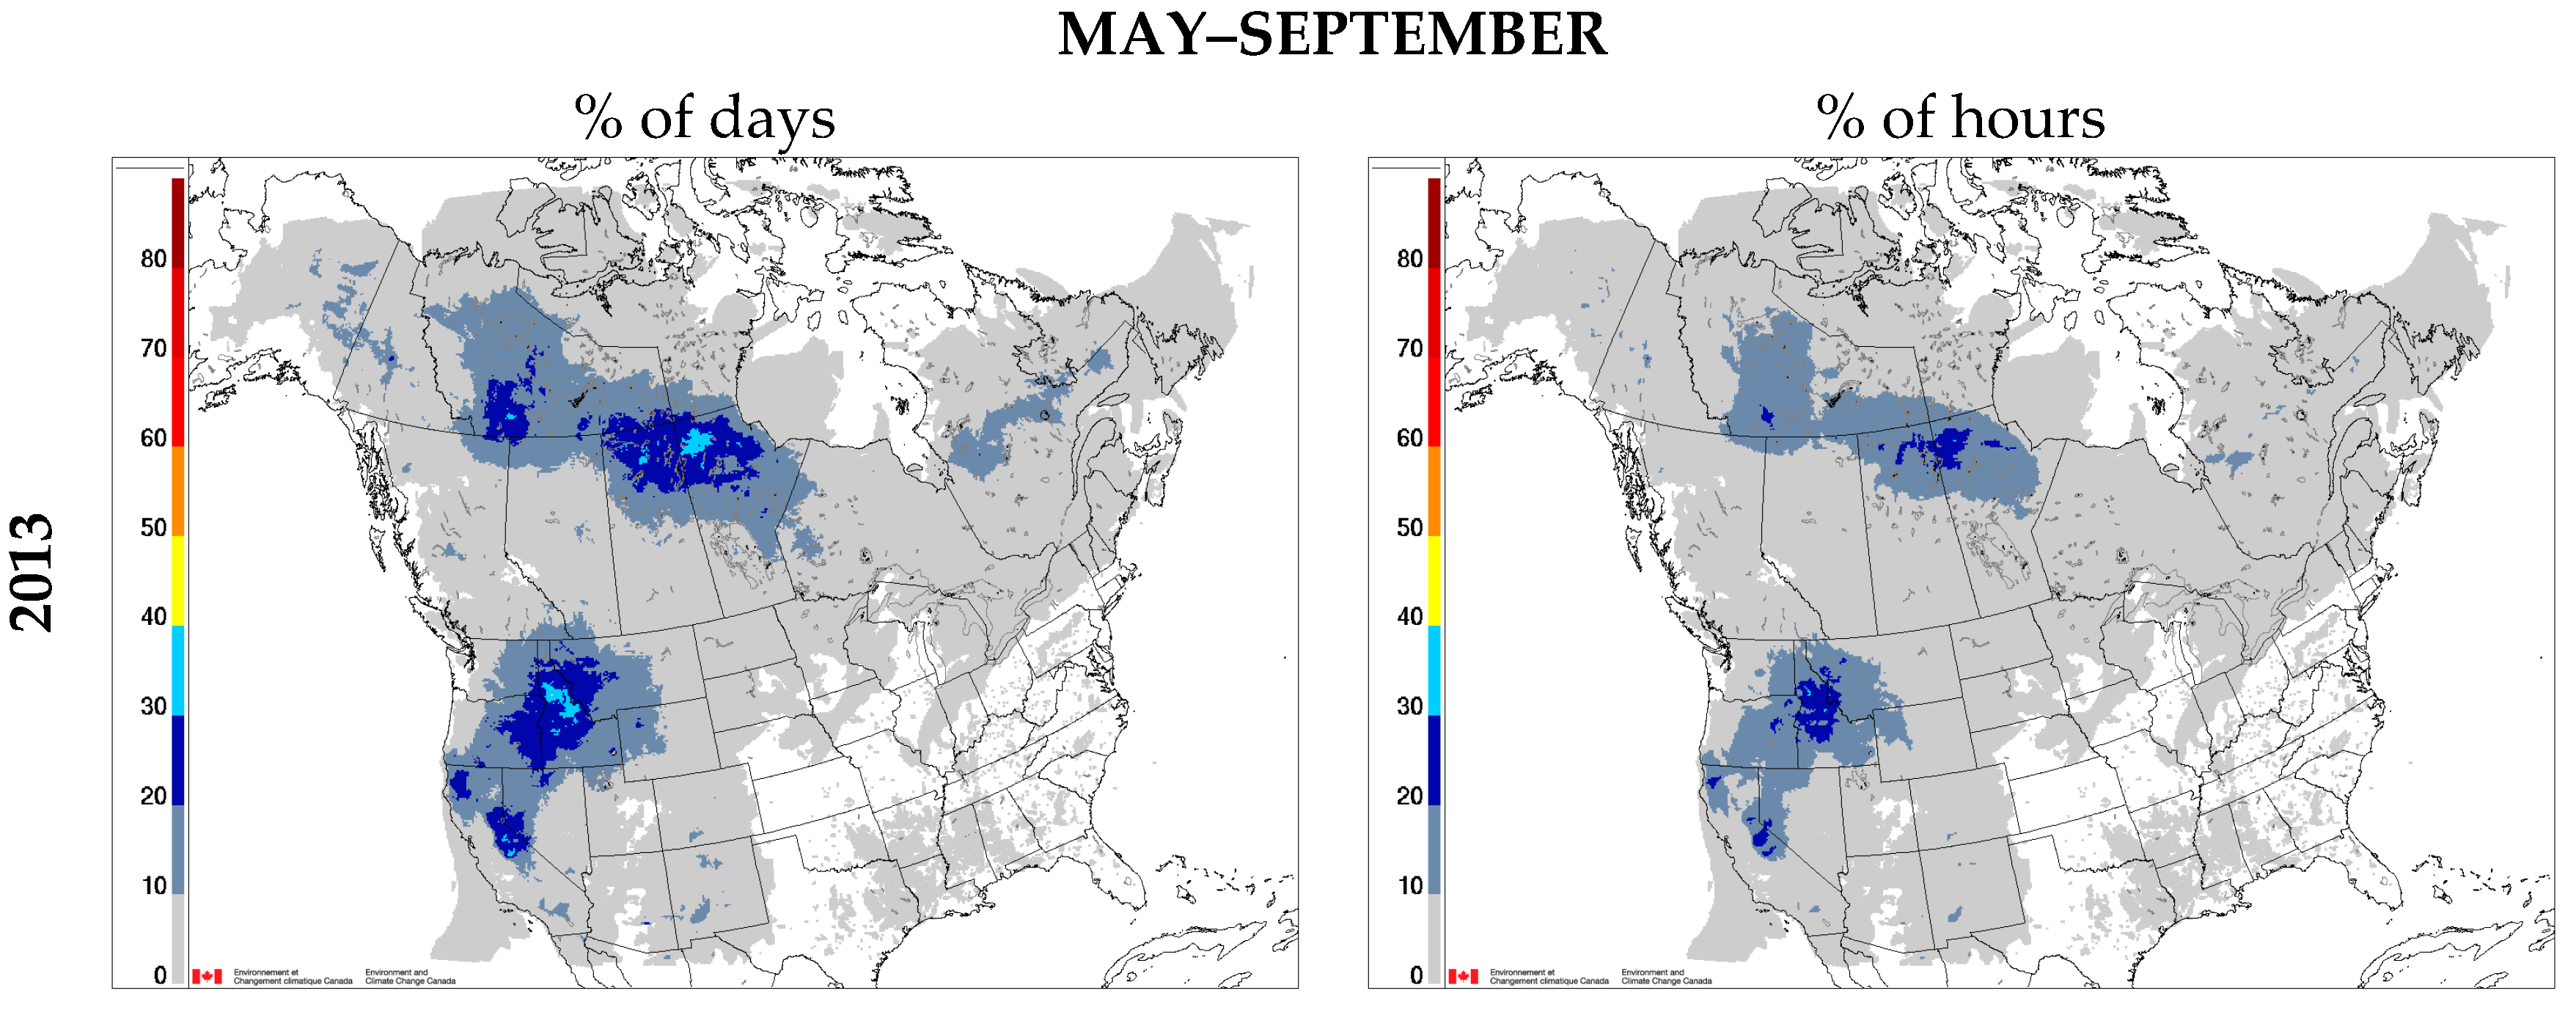
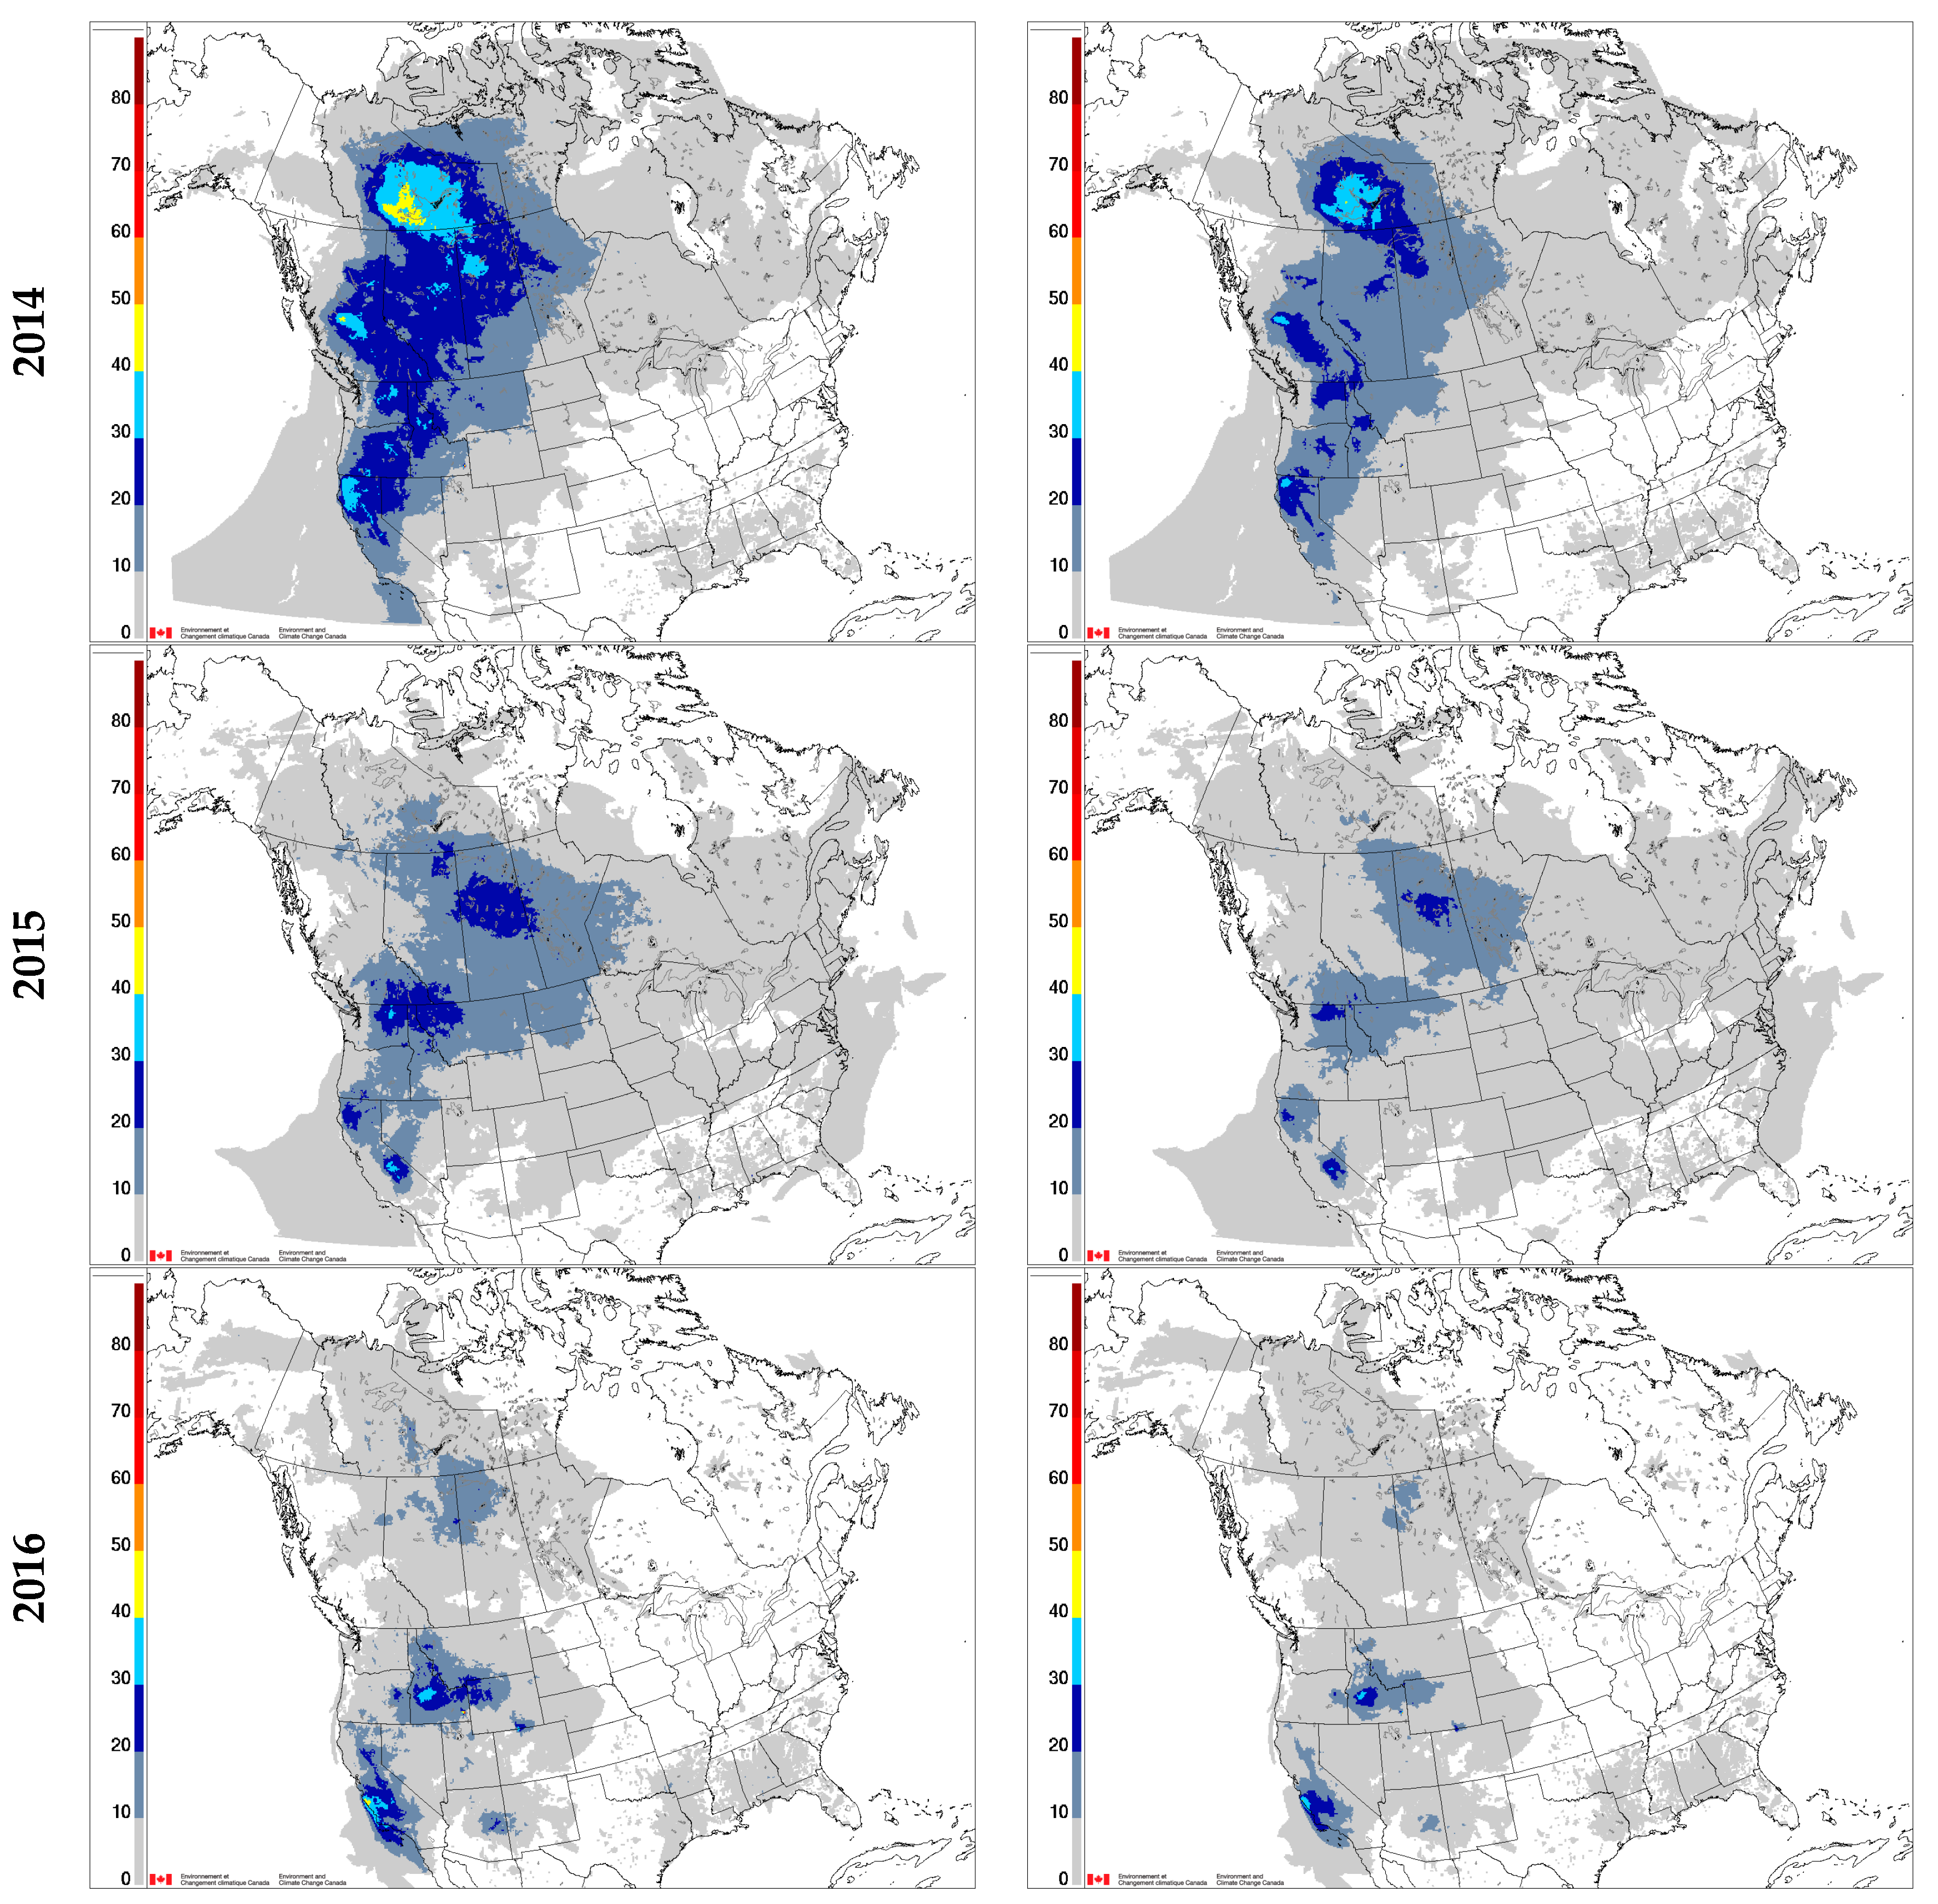
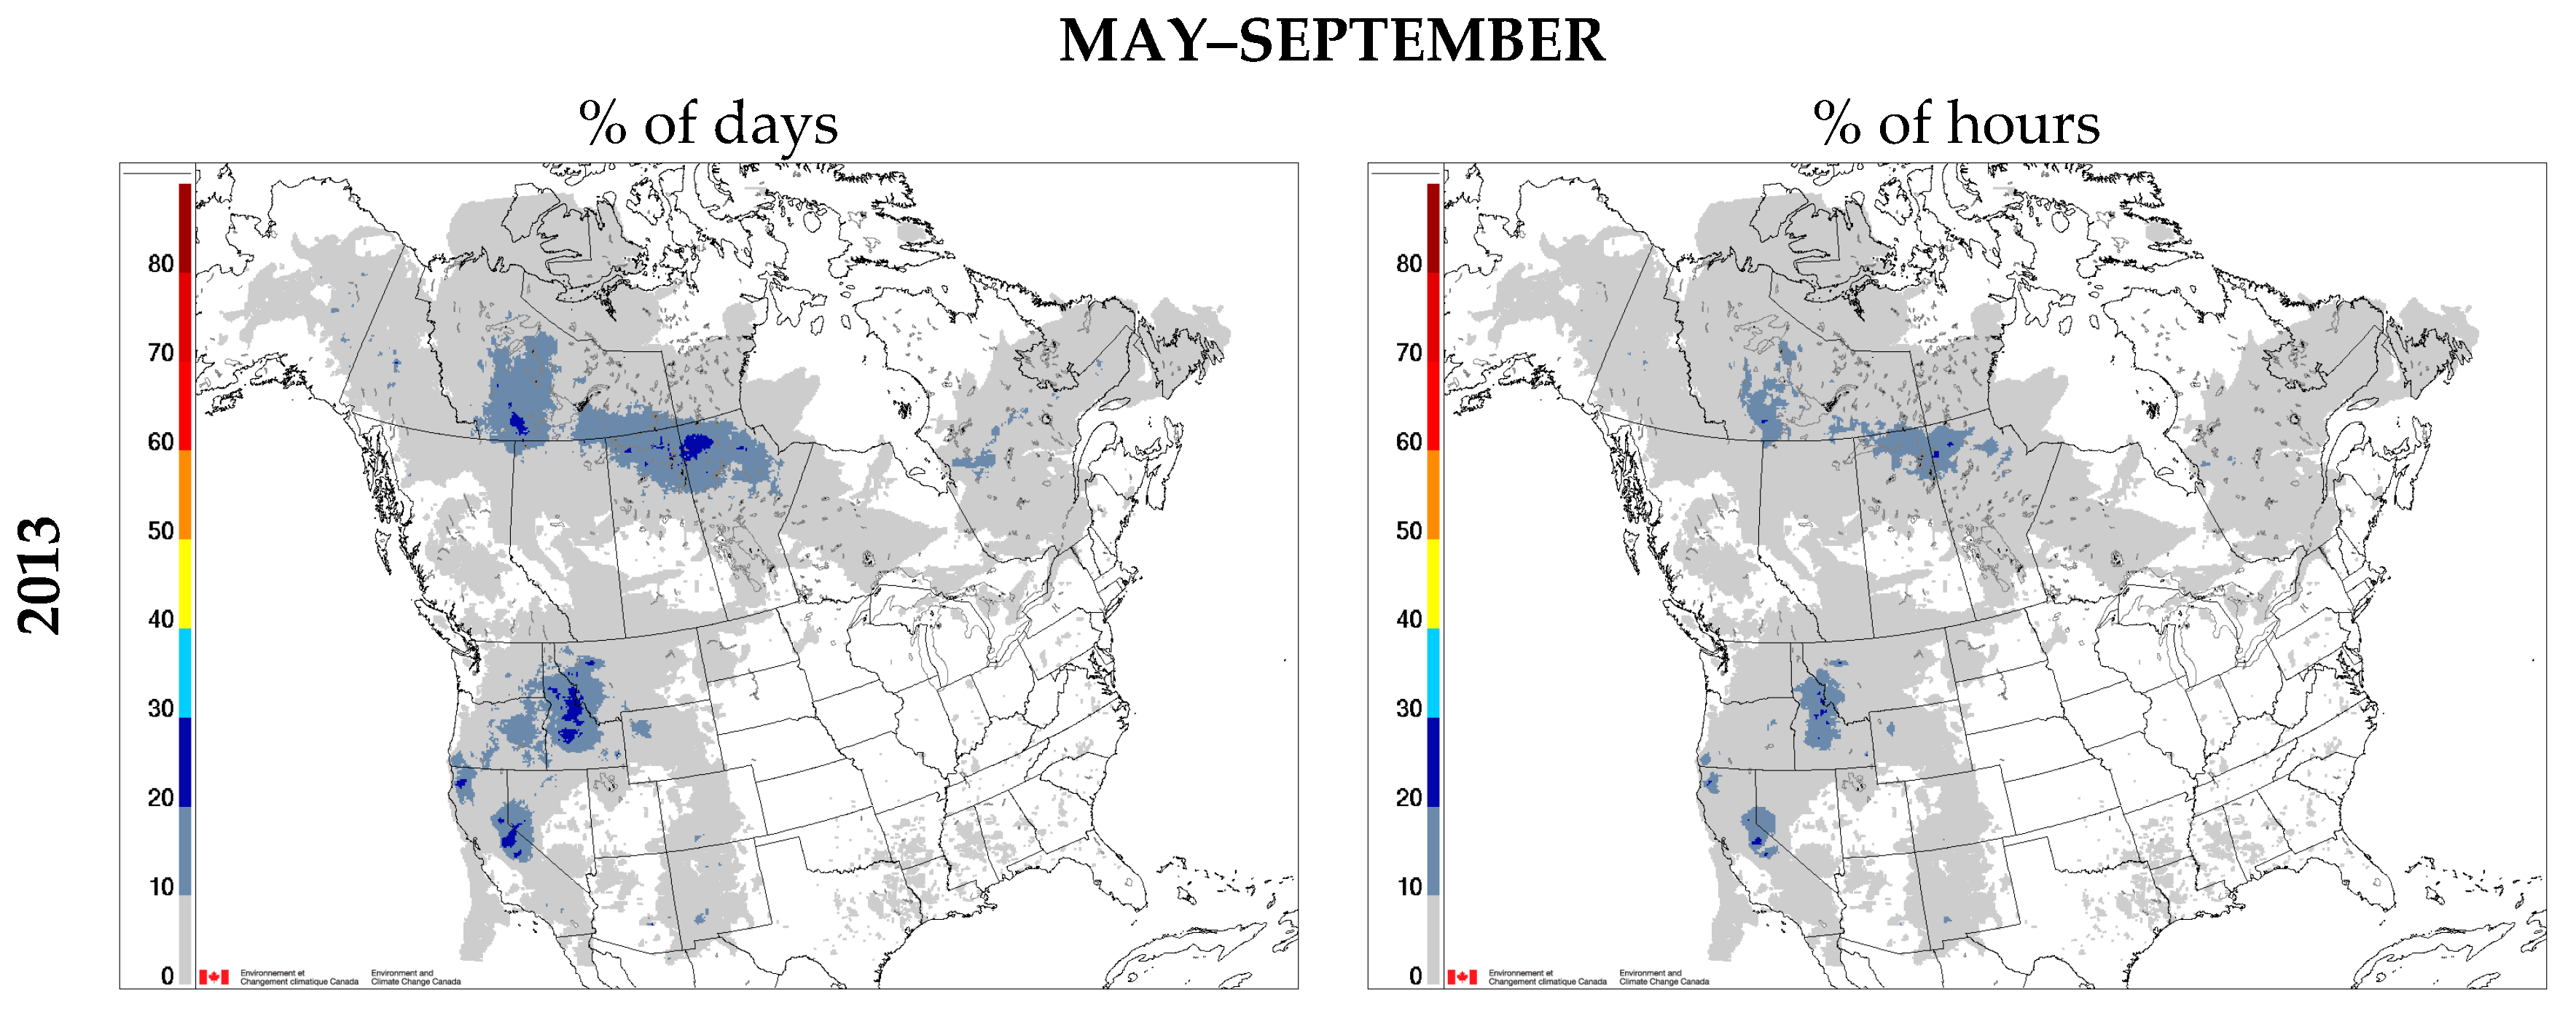
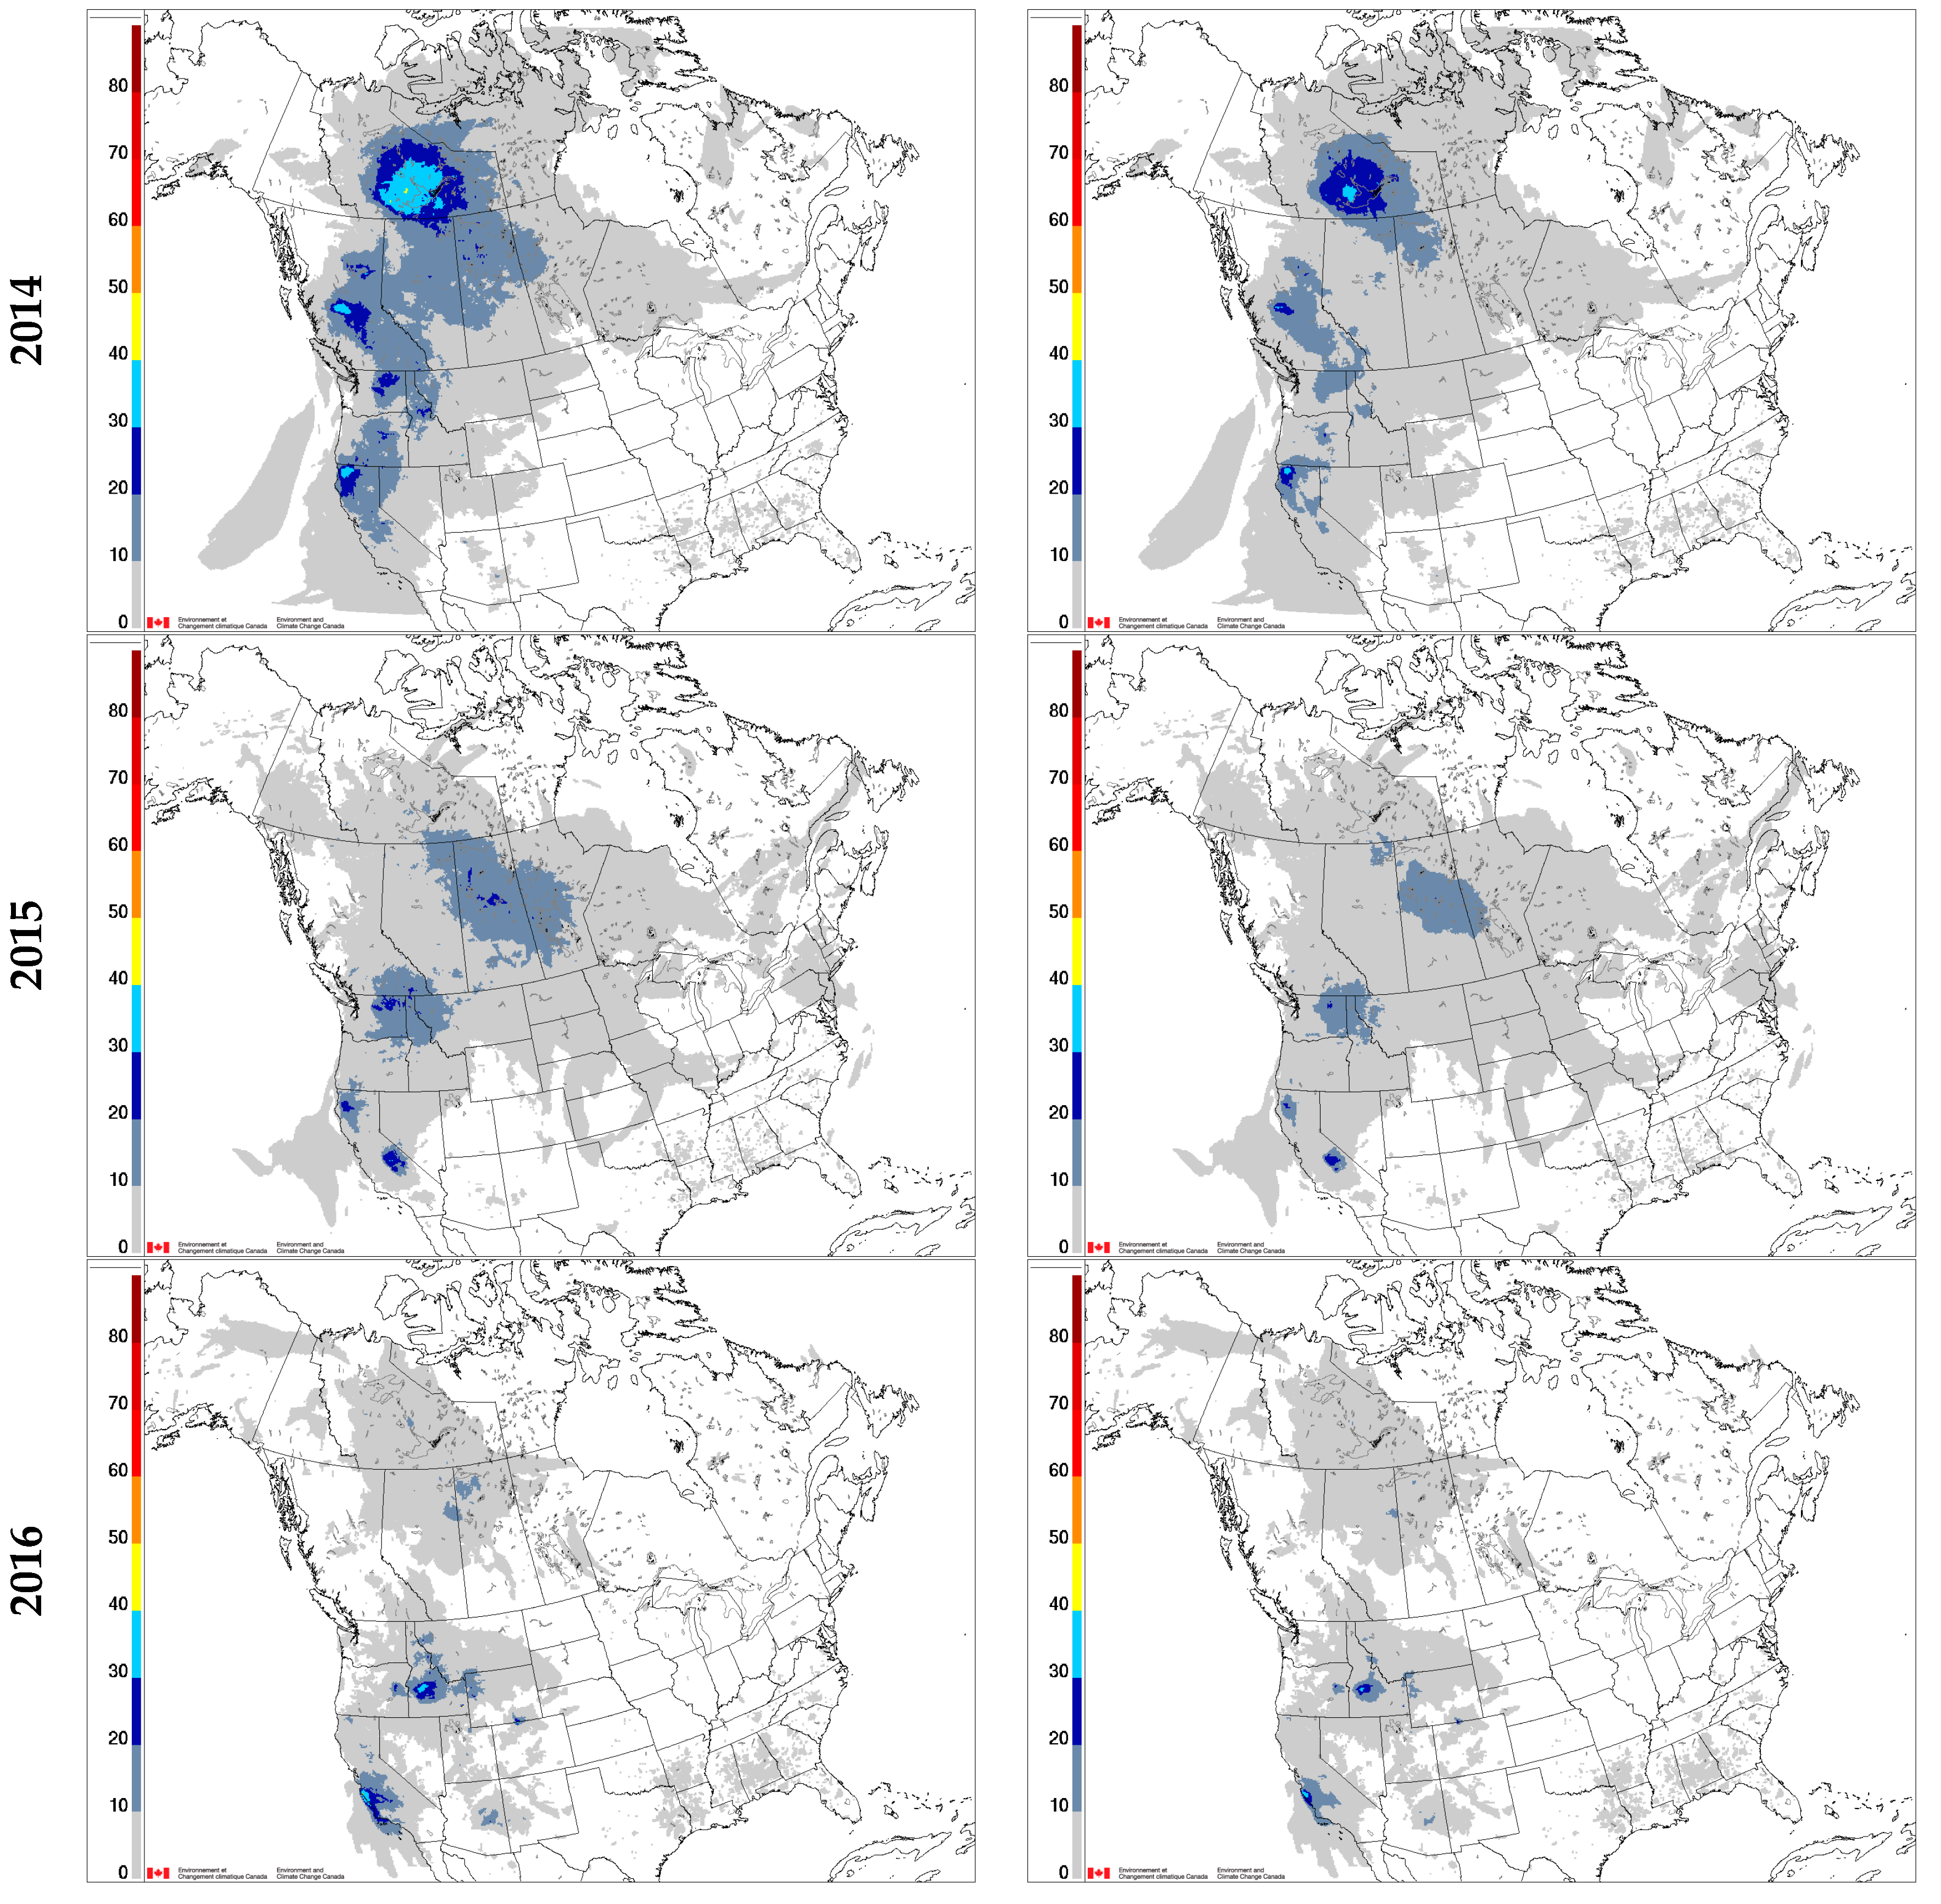
3.3. Frequency of Wildfire-Related Pollution Events

In 2013–2016 most of North America (except Alaska) was affected by wildfire smoke on at least one day (Figure 9). The land-use map for Alaska used by National Resources Canada to determine total fuel consumption was only updated in 2015. Given the direct impact of wildfire emissions estimates from input land-use in FireWork, there may be an underestimation of wildfire emissions for regions of Alaska prior to 2015. The highest daily frequency of wildfire smoke occurred in 2014, where for most of western Canada and the northwestern USA more than 30% of the days from May to September had surface fire-PM2.5 greater than 1 µg/m3 for at least one hour. In parts of Alberta, Saskatchewan and the Northwest Territories, the daily frequency was above 40%, and in part of the southern Northwest Territories it was over 60%. For hourly frequency, in 2013 the majority of Canada and the USA had more than 10% of hourly forecasted fire-PM2.5 above 1 µg/m3. Hourly frequency was slightly lower in 2014 and 2015, but in 2016, only a portion of western North America had hourly frequencies over 10% (Figure 9).
The daily frequency of forecasted fire-PM2.5 concentrations greater than 5 µg/m3 was above 10% for the majority of western Canada in 2013, 2014 and 2015 (Figure 10). The same was true for northern Quebec in 2013. In the case of the USA, regions over 10% were found only in the west over the same period. In 2016, frequencies above 10% were less common when compared with other years and were limited to areas close to the wildfires in northwestern Canada and the northwestern USA and California. Frequencies above 30% were found in 2014 in northwestern Canada, while this percentage was limited to areas very close to the wildfires in the other years. The results of the hourly frequency analysis are similar to those of the daily frequency analysis, with values of 10–20% covering large areas of northwestern Canada and the western USA, especially for 2014. Hourly frequencies over 20% were not present over Canada in 2016 and were limited to areas close to wildfires in 2013, 2014, and 2015 (Figure 10).
The spatial patterns of daily and hourly frequencies for the 10 µg/m3 concentration threshold were very similar to the patterns observed for the 5 µg/m3 threshold (Figure 11). However, 2014 was the only year with daily and hourly frequencies above 30%, in northwestern Canada. For a threshold of 28 µg/m3 (Figure 12), the frequency of days and hours with hourly forecasts above this threshold was generally below 10%.
We can also look at the number of days with elevated fire-PM2.5 from a population exposure perspective. Tables S5 and S6 provide this information for Canada and the USA, respectively. In 2014 wildfire season, more than 14% of Canadians were exposed to a daily fire-PM2.5 > 5 µg/m3 on at least 30 days (i.e., 20% or more days) and 12% of Canadians were exposed to a daily fire-PM2.5 > 10 µg/m3 on at least 15 days (Table S5). For the USA, the corresponding values in 2014 were 2% and 3%, but interestingly they were higher (3% and 4%) in 2016 (Table S6), even though in other respects 2016 had a less active fire season (e.g., Table 2).

4. Discussion

The spatial distributions of monthly and seasonal wildfire plumes illustrate the large spatial and temporal variability of wildfire occurrence in North America (Figure 3, Figure 4, Figure 5 and Figure 6). Our results also highlight how common wildfires are each summer and the large spatial extent of their influence due to long-range transport of wildfire emissions. Analyses of daily elemental and organic carbon measurements from the U.S. IMPROVE speciated PM2.5 measurement network support the analysis of the FireWork wildfire smoke forecasts presented here, indicating that smoke from wildfires contributes substantially to PM2.5 levels in the western USA [43,44,45,46].
A related finding is that wildfires can sometimes impact the same location many times during a single season (Figure 9, Figure 10, Figure 11 and Figure 12). The frequent presence of fire-PM2.5 shown here for 2013–2016, especially in western North America, has implications for regional attainment of PM2.5 regulatory objectives. Both Canadian and U.S. standards for PM2.5 allow the exclusion of days with concentrations above the national standard due to wildfire smoke. However, to invoke such an exclusion, it is necessary to demonstrate that an unmanaged emission source such as wildfires is the cause of an elevated concentration. FireWork forecasts could provide useful evidence for this purpose.
It is also relevant to compare the distribution of population in North America (Figure 2) with the distribution of wildfire smoke (Figure 3, Figure 4, Figure 5 and Figure 6). At the continental scale the majority of the North American population lives in the eastern half of the continent whereas the majority of large wildfires occur in the western half. This anticorrelation reduces the degree of population exposure to wildfire smoke. Nevertheless, 32% of the Canadian population lives west of Ontario and 41% of the U.S. population lives west of the Mississippi River, closer to western wildfires. As an example of this difference between wildfire location and population location, consider that for the 2013–2016 period (a) August 2014 was identified as the month with the greatest areal extent of average monthly fire-PM2.5 > 28 µg/m3, whereas (b) August 2015 was identified as the month with the largest U.S. population exposure to average monthly fire-PM2.5 > 28 µg/m3.
Short-term exposure to PM2.5 from wildfire smoke puts the population at an increased risk of experiencing a wide range of acute health outcomes, particulary those with chronic conditions such as asthma [47] or heart disease [48]. Long-term exposure to PM2.5 from all sources, including the contribution from wildfire smoke, increases the risk of developing chronic conditions, such as asthma or heart disease [9]. Global estimates suggest that approximately 340,000 deaths per year can be attributed to smoke from landscape fires, of which only 18% are due to short-term effects while 82% are due to the long-term effects [49]. Our results confirm that fire-PM2.5 puts the Canadian and U.S. populations at risk from both short- and long-term exposure. Although our long-term averages covered the five-month fire season rather than the entire year, we found that up to 26.4% of the Canadian population and 14.7% of the U.S. populations were affected by increases of > 1 µg/m3 in the extreme fire seasons. This likely indicates that the annual fire-PM2.5 averages were > 0.2 µg/m3 for these populations, which is defined by the U.S. EPA as a non-negligible impact [38]. Given that wildfires are becoming more frequent and intense across North America [2,42], tools such as FireWork can help to characterize their contribution to the long-term exposure most responsible for the burden of disease attributable to air pollution.
A similar wildfire pollution exposure study was recently published for the USA [23], in which fire-PM2.5 contributions were estimated for an earlier five-year period (2008–2012) using paired retrospective simulations performed with another AQ modeling system. As in this study, one simulation considered wildfire emissions and one did not, and then a post-simulation subtraction of predicted paired surface PM2.5 fields yielded the fire-PM2.5 contribution estimate. One difference between the two studies was the fire seasons sampled: the average annual U.S. area burned during their study period (2008–2012) was 11% higher than that during our study period (2013–2016) [42]. Other differences were the concentrations thresholds (in µg/m3) that they considered (0.15, 0.75, 1.5) compared with those that we considered (0.2, 1, 5, 10, 28), and the annual concentration values aggregated from 12 km × 12 km grid cells to the county level that they considered vs. the monthly and five-month values for 10 km × 10 km grid cells that we considered (i.e., higher temporal and spatial resolution). Nevertheless, a limited comparison of the two studies is possible. Based on the 2010 U.S. census (also used in this study), Rappold et al. [23] estimated that 10% of the U.S. population lived in areas where the contribution of fire-PM2.5 was > 1.5 µg/m3. We estimated that between 5.3% (in 2015) and 14.7% (in 2014) of the U.S. population lived in areas where the five-month fire-PM2.5 contribution was >1 µg/m3. Rappold et al. [23] also estimated that 10.3 million individuals in the U.S. lived in areas having 10 or more days (between 2008 and 2012) with fire-PM2.5 contribution > 35 µg/m3, and we estimated that 10.6 million individuals in the USA lived in areas having 10 or more days (for all five-month seasons between 2013 and 2016) with fire-PM2.5 > 28 µg/m3. Considering the differences between these two studies, this basic comparison suggests that the results are comparable and consistent.
This study was an “analysis of opportunity” based on the availability of four years of daily North American wildfire smoke forecasts, and further improvements are likely possible. For example, wildfires in Siberia are known to affect Alaska and western Canada, but FireWork does not currently consider wildfire emissions external to North America. In our operational on-line FireWork performance evaluation, a negative bias in PM2.5 concentration forecasts is observed for long-range wildfire pollution advection. As a consequence, the results presented here are likely to be conservative. Work is ongoing to examine potential improvements to the PM2.5 emission factors and the plume-rise parameterization used by FireWork, both of which influence PM2.5 concentration predictions. Given the horizontal grid spacing of 10 km used by FireWork, it is expected too that forecasts of near-source concentration will be underestimates due to the limitation of assuming uniform emissions within a grid cell. ECCC also has an AQ objective analysis system that combines AQ model predictions with AQ observations [50]. This system is now used with FireWork, opening the possibility of analyzing optimally-combined fields of model predictions and PM2.5 measurements instead of relying solely on model forecast fields. Finally, our results might have differed slightly had we run the same FireWork version for all four years instead of using archived FireWork versions from each year (which ensured that our analyses reflected the information available to ECCC forecasters and stakeholders at the time). However, none of these changes are likely to alter our overall conclusions about the impact of wildfires in North America.

5. Conclusions

The FireWork AQ forecast system with near-real-time wildfire emissions has been run daily for a North American domain by ECCC from 2013 to 2016 during the May–September wildfire season. A multi-year analysis for this period showed the importance of accounting for contributions from wildfire PM2.5 emissions to total PM2.5 surface concentrations (denoted here as fire-PM2.5) during the wildfire season. For both Canada and the USA, the months of July and August usually showed the maximum fire-PM2.5, although intense wildfires can also occur in September in the western USA, likely due to a longer summer season [51].
Monthly and seasonal analyses of the mean forecasted fire-PM2.5 suggested that, on average, over 76% of Canadians and 69% of Americans were at least minimally affected by wildfire smoke during the four-year study period. Comparison of average monthly fire-PM2.5 showed large year-to-year variations in both timing and spatial locations of wildfires between 2013 and 2016. Wildfire impacts are often driven by a few major wildfire events that can lead to poor air quality for several consecutive weeks near the emission sources and beyond. In August 2015 approximately 3 million Canadians and 3 million Americans were exposed to mean monthly fire-PM2.5 > 10 µg/m3.
Calculations of the number of days and hours with forecasted fire-PM2.5 above various concentration thresholds ranging from 1 µg/m3 to 28 µg/m3 for 2013–2016 showed that most wildfire events over North America occurred in the western part of the USA and in western, northern, and central Canada. During months of extreme wildfire activity, some areas in northwestern Canada and the western USA had up to 20% of days where the fire-PM2.5 was > 28 µg/m3. The eastern USA and eastern Canada had fewer days with threshold exceedances, but most of North America was affected by fire-PM2.5 > 1 µg/m3 on at least one day per year.
FireWork is a valuable prognostic tool used as guidance by AQ meteorologists to issue forecasts on a daily basis, allowing advance warnings to populations at risk to reduce their exposure. In addition, this study has shown that FireWork is also useful for retrospective analysis of past wildfire events. The statistical analyses of these forecasts over multiple years can be used by public health researchers, AQ regulators and policymakers, and others interested in wildfire impacts to understand and characterize exposure to wildfire smoke and its interannual and geographic variability.

Supplementary Materials

The following are available online at www.mdpi.com/2073-4433/8/9/179/s1.

Acknowledgments

The ECCC FireWork team is very grateful to the Natural Resources Canada team behind the Canadian Wildland Information System (CWFIS), who provided crucial assistance in the development of the FireWork system. We are particularly grateful to Kerry Anderson and Peter Englefield, who provided useful analyses and guidance on the CWFIS system. We also thank the U.S. Forest Service BlueSky team, particularly Susan O’Neill, for analyses and advice on wildfire emission estimates for the USA. We appreciate the assistance of Alexandru Lupu and Cassandra Bolduc for preparing tables presented in this article. Finally, we would like to acknowledge three anonymous reviewers for their valuable and constructive comments, which considerably improved this paper.

Author Contributions

Rodrigo Munoz-Alpizar and Radenko Pavlovic conceived the study; Rodrigo Munoz-Alpizar, Radenko Pavlovic and Sylvain Ménard backfilled missing FireWork forecasts over 2013–2015 five-month periods; Hugo Landry, Samuel Gilbert and Paul-André Beaulieu developed analysis tools; Jacinthe Racine and Annie Duhamel contributed to the results presentation; Rodrigo Munoz-Alpizar, Radenko Pavlovic, Michael D. Moran, Sarah B. Henderson, Jack Chen, Sylvie Gravel and Sylvain Ménard wrote the paper; and Didier Davignon, Sophie Cousineau, and Véronique Bouchet contributed with organizational support and scientific suggestions.

Conflicts of Interest

The authors declare no conflict of interest.

References

  1. Beverly, J.L.; Bothwell, P. Wildfire evacuations in Canada 1980–2007. Nat. Hazards 2011, 59, 571–596. [Google Scholar] [CrossRef]
  2. Canadian Interagency Forest Fire Centre. Canada Report 2016. Available online: http://www.ciffc.ca/images/stories/pdf/2016_canada_report_2017_05_15_v02.pdf (accessed on 15 May 2017).
  3. Natural Resources Canada. Cost of Fire Protection. Available online: http://www.nrcan.gc.ca/forests/climate-change/forest-change/17783 (accessed on 15 May 2017).
  4. Flannigan, M.; Tymstra, C. The Fort McMurray Wildfire: By the Numbers. Canadian Wildland Fire & Smoke Newsletter. 2016; pp. 1–2. Available online: https://sites.ualberta.ca/~wcwfs/CWFSN/newsletters/CWFSN_Fall_2016.pdf (accessed on 15 September 2017).
  5. Urbanski, P.U.; Hao, W.M.; Baker, S. Chemical composition of wildland fire emissions. Dev. Environ. Sci. 2009, 8, 79–107. [Google Scholar]
  6. Reid, C.E.; Brauer, M.; Johnston, F.H.; Jerrett, M.; Balmes, J.R.; Elliott, C.T. Critical Review of Health Impacts of Wildfire Smoke Exposure. Environ. Health Perspect. 2016, 124, 1334–1342. [Google Scholar] [CrossRef] [PubMed]
  7. Liu, J.C.; Pereira, G.; Uhl, S.A.; Bravo, M.A.; Bell, M.L. A systematic review of the physical health impacts from non-occupational exposure to wildfire smoke. Environ. Res. 2015, 136, 120–132. [Google Scholar] [CrossRef] [PubMed]
  8. Liu, J.C.; Mickley, L.J.; Sulprizio, M.P.; Dominici, F.; Yue, X.; Ebisu, K.; Anderson, G.B.; Khan, R.F.; Bravo, M.A.; Bell, M.L. Particulate air pollution from wildfires in the Western US under climate change. Clim. Chang. 2016, 138, 655–666. [Google Scholar] [CrossRef] [PubMed]
  9. Thurston, G.D.; Kipen, H.; Annesi-Maesano, I.; Balmes, J.; Brook, R.D.; Cromar, K.; de Matteis, S.; Forastiere, F.; Forsberg, B.; Frampton, M.W.; et al. A joint ERS/ATS policy statement: What constitutes an adverse health effect of air pollution? An analytical framework. Eur. Respir. J. 2017, 49, 1600419. [Google Scholar] [CrossRef] [PubMed]
  10. Canadian Council of Ministers of the Environment (CCME). Guidance Document on Achievement Determination Canadian Ambient Air Quality Standards for Fine Particulate Matter and Ozone. 2012; p. 43. Available online: http://www.ccme.ca/files/Resources/air/aqms/pn_1483_gdad_eng.pdf (accessed on 15 May 2017).
  11. Sapkota, A.; Symons, J.; Kleissl, J.; Wang, L.; Parlange, M.; Ondov, J.; Breysse, P.N.; Diette, G.B.; Eggleston, P.A.; Buckley, T.J. Impact of the 2002 Canadian forest fires on particulate matter air quality in Baltimore city. Environ. Sci. Technol. 2005, 39, 24–32. [Google Scholar] [CrossRef] [PubMed]
  12. Forster, C.; Wandinger, U.; Wotawa, G.; James, P.; Mattis, I.; Althausen, D.; Simmonds, P.; O’Doherty, S.; Jennings, I.M.; Kleefeld, C.; et al. Transport of boreal forest fire emissions from Canada to Europe. J. Geophys. Res. 2001, 106, 22887–22906. [Google Scholar] [CrossRef]
  13. Adam, M.; Pahlow, M.; Kovalev, V.A.; Ondov, J.M.; Parlange, M.B.; Nair, N. Aerosol optical characterization by nephelometer and lidar: The Baltimore Supersite experiment during the Canadian forest fire smoke intrusion. J. Geophys. Res. 2004, 109, D16. [Google Scholar] [CrossRef]
  14. Colarco, P.R.; Schoeberl, M.R.; Doddridge, B.G.; Marufu, L.T.; Torres, O.; Welton, E.J. Transport of smoke from Canadian forest fires to the surface near Washington, DC: Injection height, entrainment, and optical properties. J. Geophys. Res. 2004, 109, 1–12. [Google Scholar] [CrossRef]
  15. Spichtinger, N.; Wenig, M.; James, P.; Wagner, T.; Platt, U.; Stohl, A. Satellite detection of a continental-scale plume of nitrogen oxides from boreal forest fires. Geophys. Res. Lett. 2001, 28, 4579–4582. [Google Scholar] [CrossRef]
  16. Morris, G.A.; Hershey, S.; Thompson, A.M.; Stohl, A.; Colarco, P.R.; McMillan, W.W.; Warner, J.; Johnson, B.J.; Witte, J.C.; Kucsera, T.L.; et al. Alaskan and Canadian forest fires exacerbate ozone pollution in Houston, Texas, on 19 and 20 July. J. Geophys. Res. 2004, 111, 1–10. [Google Scholar] [CrossRef]
  17. DeBell, L.J.; Talbot, R.W.; Dibb, J.E.; Munger, J.W.; Fischer, E.V.; Frolking, S.E. A major regional air pollution event in the northeastern United States caused by extensive forest fires in Quebec, Canada. J. Geophys. Res. 2004, 109, 1–16. [Google Scholar] [CrossRef]
  18. Fiore, A.M.; Pierce, R.B.; Dickerson, R.R.; Lin, M.; Bradley, R. Detecting and attributing episodic high background ozone events. J. Air Waste Manag. Assoc. 2014, 64, 22–28. [Google Scholar]
  19. Dreessen, J.; Sullivan, J.; Delgado, R. Observations and impacts of transported Canadian wildfire smoke on ozone and aerosol air quality in the Maryland region on June 9–12. J. Air Waste Manag. Assoc. 2016, 66, 842–862. [Google Scholar] [CrossRef] [PubMed]
  20. Cottle, P.; Strawbridge, K.; McKendry, I. Long-range transport of Siberian wildfire smoke to British Columbia: Lidar observations and air quality impacts. Atmos. Environ. 2014, 90, 71–77. [Google Scholar] [CrossRef]
  21. Teakles, A.D.; So, R.; Ainslie, B.; Nissen, R.; Schiller, C.; Vingarzan, R.; McKendry, I.; Macdonald, A.M.; Jaffe, D.A.; Bertram, A.K.; et al. Impacts of the July 2012 Siberian fire plume on air quality in the Pacific Northwest. Atmos. Chem. Phys. 2017, 17, 2593–2611. [Google Scholar] [CrossRef]
  22. Centre for Disease Control. Evidence Review: Exposure Measures for Wildfire Smoke Surveillance. 31 March 2014. Available online: http://www.bccdc.ca/resource-gallery/Documents/Guidelines%20and%20Forms/Guidelines%20and%20Manuals/Health-Environment/WFSG_EvidenceReview_Smokesurveillance_FINAL_v2_edstrs.pdf (accessed on 15 May 2017).
  23. Rappold, A.G.; Reyes, J.; Pouliot, G.; Cascio, W.E.; Diaz-Sanchez, D. Community Vulnerability to Health Impacts of Wildland Fire Smoke Exposure. Environ. Sci. Technol. 2017, 51, 6674–6682. [Google Scholar] [CrossRef] [PubMed]
  24. Zhang, Y.; Bocquet, M.; Mallet, V.; Seigneur, C.; Baklanov, A. Real-time air quality forecasting, part I: History, techniques, and current status. Atmos. Environ. 2012, 60, 632–655. [Google Scholar] [CrossRef]
  25. Zhang, Y.; Bocquet, M.; Mallet, V.; Seigneur, C.; Baklanov, A. Real-time air quality forecasting, part II: State of the science, current research needs, and future prospects. Atmos. Environ. 2012, 60, 656–676. [Google Scholar] [CrossRef]
  26. Larkin, N.K.; O’Neill, S.M.; Solomon, R.; Raffuse, S.; Strand, T.; Sullivan, D.C.; Krull, C.; Rorig, M.; Peterson, J.; Ferguson, S.A. The BlueSky smoke modeling framework. Int. J. Wildland Fire 2010, 18, 906–920. [Google Scholar] [CrossRef]
  27. Pavlovic, R.; Chen, J.; Anderson, K.; Moran, M.D.; Beaulieu, P.-A.; Davignon, D.; Cousineau, S. The FireWork air quality forecast system with near-real-time biomass burning emissions: Recent developments and evaluation of performance for the 2015 North American wildfire season. J. Air Waste Manage. Assoc. 2016, 66, 819–841. [Google Scholar] [CrossRef] [PubMed]
  28. Pavlovic, R.; Chen, J.; Davignon, D.; Moran, M.D.; Beaulieu, P.A.; Landry, H.; Sassi, M.; Gilbert, S.; Munoz-Alpizar, R.; Anderson, K.; et al. FireWork—A Canadian Operational Air Quality Forecast Model With Near-Real-Time Biomass Burning Emissions. Canadian Wildland Fire & Smoke Newsletter. 2016, pp. 18–29. Available online: https://sites.ualberta.ca/~wcwfs/CWFSN/newsletters/CWFSN_Fall_2016.pdf (accessed on 15 September 2017).
  29. Yuchi, W.; Yao, J.; McLean, K.E.; Stull, R.; Pavlovic, R.; Davignon, D.; Moran, M.D.; Henderson, S.B. Blending forest fire smoke forecasts with observed data can improve their utility for public health applications. Atmos. Environ. 2016, 145, 308–317. [Google Scholar] [CrossRef]
  30. Moran, M.D.; Ménard, S.; Pavlovic, R.; Anselmo, D.; Antonopoulos, S.; Makar, P.A.; Gong, W.; Stroud, C.; Zhang, J.; Zheng, Q.; et al. Recent advances in Canada’s National Operational AQ Forecasting System. In Proceedings of the 32nd NATO/SPS ITM on Air Pollution Modelling and Its Application, Utrecht, The Netherlands, 7–11 May 2012; pp. 215–220. [Google Scholar]
  31. Moran, M.; Zheng, Q.; Zhang, J.; Pavlovic, R. RAQDPS Version 013: Upgrades to the CMC Operational Regional Air Quality Deterministic Prediction System Released in June 2015. 2015; p. 57. Available online: http://collaboration.cmc.ec.gc.ca/cmc/cmoi/product_guide/docs/lib/op_systems/doc_opchanges/Technical_Note_GEM-MACH10_v1.5.3+SET2.1.1_Emissions_9Nov2015.pdf (accessed on 15 May 2017).
  32. Im, U.; Bianconi, R.; Solazzo, E.; Kioutsioukis, I.; Badia, A.; Balzarini, A.; Baro, R.; Bellasio, R.; Brunner, D.; Chemel, C.; et al. Evaluation of operational online-coupled regional air quality models over Europe and North America in the context of AQMEII phase 2. Part I: Ozone. Atmos. Environ. 2015, 115, 404–420. [Google Scholar] [CrossRef] [Green Version]
  33. Lee, B.S.; Alexander, M.E.; Hawkes, B.C.; Lynham, T.J.; Stocks, B.J.; Englefield, P. Information systems in support of wildland fire management decision making in Canada. Comput. Electron. Agric. 2002, 37, 185–198. [Google Scholar] [CrossRef]
  34. Anderson, K.R.; Englefield, P.; Little, J.M.; Reuter, G. An approach to operational forest fire growth predictions for Canada. Int. J. Wildland Fire 2009, 18, 893–905. [Google Scholar] [CrossRef]
  35. Moran, M.; Pavlovic, R.; Chen, J. FireWork 2016: Release of the Initial Operational Version of the CMC Regional Air Quality Deterministic Prediction System with Near-Real-Time Satellite-Derived Wildfire Emissions. 2016; p. 4. Available online: http://collaboration.cmc.ec.gc.ca/cmc/CMOI/product_guide/docs/tech_notes/technote_raqdps015fw_20160428_e.pdf (accessed on 15 May 2017).
  36. Kaiser, J.W.; Heil, A.; Andreae, M.O.; Benedetti, A.; Chubarova, N.; Jones, L.; Morcrette, J.-J.; Razinger, M.; Schultz, M.G.; Suttie, M.; et al. Biomass burning emissions estimated with a global fire assimilation system based on observed fire radiative power. Biogeosciences 2012, 9, 527–554. [Google Scholar] [CrossRef] [Green Version]
  37. Xing, J.; Pleim, J.; Mathur, R.; Pouliot, G.; Hogrefe Gan, C.-M.; Wei, C. Historical gaseous and primary aerosol emissions in the United States from 1990–2010. Atmos. Chem. Phys. 2013, 13, 7531–7549. [Google Scholar] [CrossRef]
  38. EPA. Draft Guidance for Comment: Significant Impact Levels for Ozone and Fine Particle in the Prevention of Significant Deterioration Permitting Program. 2016; p. 13. Available online: https://www.epa.gov/sites/production/files/2016-08/documents/pm2_5_sils_and_ozone_draft_guidance.pdf (accessed on 15 May 2017).
  39. Statistics Canada. Dissemination Areas, Census 2016. Available online: http://www12.statcan.gc.ca/census-recensement/2016/dp-pd/hlt-fst/pd-pl/Comprehensive.cfm (accessed on 15 May 2017).
  40. Statistics Canada. Boundary Files, Census 2016. Available online: http://www12.statcan.gc.ca/census-recensement/2011/geo/bound-limit/bound-limit-eng.cfm (accessed on 15 May 2017).
  41. United States Census Bureau. Census 2010. Available online: https://www.census.gov/geo/maps-data/data/tiger-data.html (accessed on 15 May 2017).
  42. National Intergancy Fire Center. Available online: https://www.nifc.gov/fireInfo/fireInfo_stats_totalFires.html (accessed on 15 May 2017).
  43. Jaffe, D.; Hafner, W.; Chand, D.; Westerling, A.; Spracklen, D. Interannual variations in PM2.5 due to wildfires in the Western United States. Environ. Sci. Technol. 2008, 42, 2812–2818. [Google Scholar] [CrossRef] [PubMed]
  44. Mao, Y.H.; Li, Q.B.; Zhang, L.; Chen, Y.; Randerson, J.T.; Chen, D.; Liou, K.N. Biomass burning contribution to black carbon in the Western United States Mountain Ranges. Atmos. Chem. Phys. 2011, 11, 11253–11266. [Google Scholar] [CrossRef] [Green Version]
  45. Spracklen, D.V.; Logan, J.A.; Mickley, L.J.; Park, R.J.; Yevich, R.; Westerling, A.L.; Jaffe, D.A. Wildfires drive interannual variability of organic carbon aerosol in the western U.S. in summer. Geophys. Res. Lett. 2007, 34, L16816. [Google Scholar] [CrossRef]
  46. Zeng, T.; Wang, Y. Nationwide summer peaks of OC/EC ratios in the contiguous United States. Atmos. Environ. 2011, 45, 578–586. [Google Scholar] [CrossRef]
  47. Henderson, S.B.; Johnston, F.H. Measures of forest fire smoke exposure and their associations with respiratory health outcomes. Curr. Opin. Allergy Clin. Immunol. 2012, 12, 221–227. [Google Scholar] [CrossRef] [PubMed]
  48. Dennekamp, M.; Straney, L.D.; Erbas, B.; Abramson, M.J.; Keywood, M.; Smith, K.; Sim, M.R.; Glass, D.C.; Monaco, A.D.; Haikerwal, A.; et al. Forest Fire Smoke Exposures and Out-of-Hospital Cardiac Arrests in Melbourne, Australia: A Case-Crossover Study. Environ. Health Perspect. 2015, 123, 959–964. [Google Scholar] [CrossRef] [PubMed]
  49. Johnston, F.H.; Henderson, S.B.; Chen, Y.; Randerson, J.T.; Marlier, M.; DeFries, R.S.; Kinney, P.; Bowman, D.M.; Brauer, M. Estimated Global Mortality Attributable to Smoke from Landscape Fires. Environ. Health Perspect. 2012, 120, 695–701. [Google Scholar] [CrossRef] [PubMed]
  50. Robichaud, A.; Ménard, R.; Zaïtseva, Y.; Anselmo, D. Multi-pollutant surface objective analyses and mapping of air quality health index over North America. Air Qual. Atmos. Health 2016, 9, 743–759. [Google Scholar] [CrossRef] [PubMed]
  51. Jolly, W.M.; Cochrane, M.A.; Freeborn, P.H.; Holden, Z.A.; Brown, T.J.; Williamson, G.J.; Bowman, D.M. Climate-induced variations in global wildfire danger from 1979 to 2013. Nat. Commun. 2015, 6, 7537. [Google Scholar] [CrossRef] [PubMed]
Figure 1. FireWork domain boundaries before (green) and after (red) 7 September 2016. The 10 km × 10 km grid is not shown.
Atmosphere 08 00179 g001
Figure 2. Population count per FireWork grid cell (10 km × 10 km) based on the 2016 Canadian census and the 2010 U.S. census. The red box over the four southern Great Lakes marks the location of the inset.
Atmosphere 08 00179 g002
Figure 3. 2013 average monthly fire-PM2.5 contribution to total forecasted surface PM2.5 concentrations (µg/m3) for (A) May, (B) June, (C) July, (D) August, (E) September, and (F) seasonal (May–September average). Note that the color scale is non-linear and white areas indicate values < 0.2 µg/m3.
Atmosphere 08 00179 g003
Figure 4. Same as Figure 3 but for 2014.
Atmosphere 08 00179 g004
Figure 5. Same as Figure 3 but for 2015.
Atmosphere 08 00179 g005
Figure 6. Same as Figure 3 but for 2016.
Atmosphere 08 00179 g006aAtmosphere 08 00179 g006b
Figure 7. Cumulative distribution of number of months with the portions of the Canadian (A) and U.S. (B) population affected by monthly fire-PM2.5 above five PM2.5 concentration thresholds for four five-month wildfire seasons (2013–2016).
Atmosphere 08 00179 g007
Figure 8. Percentage of population in Canada (left panels: A, C, E, G, and I) and the USA (right panels: B, D, F, H, and J), affected by wildfire pollution above five PM2.5 concentration thresholds based on the average monthly and seasonal fire-PM2.5 contribution to total average monthly and seasonal surface PM2.5 concentrations for four wildfire seasons (2013–2016). The percentage of the affected population for Canada and the USA was calculated using the 2016 Canadian and the 2010 U.S. censuses, respectively. See also Tables S3 and S4.
Atmosphere 08 00179 g008
Figure 9. Percentage frequency of the number of days (left) and the number of hours (right) with forecasted 24-h moving average PM2.5 concentration above 1 µg/m3 from fire-PM2.5 contribution for the period May–September for years 2013, 2014, 2015, and 2016. White areas indicate locations that experienced no days or hours above the threshold during the period.
Atmosphere 08 00179 g009aAtmosphere 08 00179 g009b
Figure 10. Same as Figure 9 but for 5 µg/m3.
Atmosphere 08 00179 g010aAtmosphere 08 00179 g010b
Figure 11. Same as Figure 9 but for 10 µg/m3.
Atmosphere 08 00179 g011aAtmosphere 08 00179 g011b
Figure 12. Same as Figure 9 but for 28 µg/m3.
Atmosphere 08 00179 g012aAtmosphere 08 00179 g012b
Table 1. 2013–2016 experimental and operational FireWork start/end forecast periods together with additional periods for which FireWork was rerun retrospectively.
YearExperimental/Operational FireWorkAdded Periods
StartEnd
2013June 1August 31May 1‒31; Sep. 1‒31
2014June 9October 1May 1‒June 8
2015May 21October 31May 1‒20
2016April 1October 31
Table 2. FireWork domain area affected (km2 and percentages) by wildfire pollution above five PM2.5 concentration thresholds based on average monthly and seasonal fire-PM2.5 contributions to total average monthly and seasonal surface PM2.5 concentrations. For reference, the total area of North America is 24.71 million km2 and for the FireWork domain is 33.09 million km2. The numbers in parentheses correspond to the percentage of the area affected.
µg/m3>0.2>1>5>10>28
2013
May754,020(2.3%)30,662(0.1%)1377(0.0%)196(0.0%)0(0.0%)
June12,478,900(37.7%)2,532,748(7.7%)184,058(0.6%)48,991(0.1%)7378(0.0%)
July17,235,170(52.1%)7,279,618(22.0%)861,986(2.6%)194,966(0.6%)13,326(0.0%)
August20,155,062(60.9%)9,873,087(29.8%)1,783,453(5.4%)604,476(1.8%)71,844(0.2%)
September9,351,929(28.3%)2,072,752(6.3%)84,693(0.3%)39,022(0.1%)10,611(0.0%)
2014
May1,746,428(5.3%)61,310(0.2%)6507(0.0%)2137(0.0%)200(0.0%)
June3,411,109(10.3%)872,761(2.6%)57,926(0.2%)13,461(0.0%)1686(0.0%)
July16,196,537(49.0%)7,260,984(21.9%)1,562,298(4.7%)541,468(1.6%)146,616(0.4%)
August19,536,859(59.0%)8,436,851(25.5%)2,560,671(7.7%)934,005(2.8%)157,462(0.5%)
September13,305,055(40.2%)4,531,984(13.7%)444,316(1.3%)137,840(0.4%)24,680(0.1%)
2015
May2,837,325(8.6%)252,707(0.8%)12,768(0.0%)2950(0.0%)197(0.0%)
June9,375,291(28.3%)2,604,739(7.9%)291,593(0.9%)42,184(0.1%)2552(0.0%)
July14,245,102(43.1%)5,173,825(15.6%)1,033,576(3.1%)306,687(0.9%)30,776(0.1%)
August15,581,769(47.1%)5,918,077(17.9%)1,236,416(3.7%)636,671(1.9%)143,120(0.4%)
September11,999,087(36.3%)1,629,073(4.9%)102,071(0.3%)45,570(0.1%)14,173(0.0%)
2016
May3,829,030(11.6%)972,851(2.9%)167,935(0.5%)58,168(0.2%)11,955(0.0%)
June2,532,347(7.7%)334,211(1.0%)35,392(0.1%)13,575(0.0%)3599(0.0%)
July7,866,765(23.8%)2,709,907(8.2%)223,084(0.7%)57,209(0.2%)8215(0.0%)
August7,807,827(23.6%)2,839,017(8.6%)477,835(1.4%)146,340(0.4%)31,658(0.1%)
September4,914,590(14.9%)1,715,135(5.2%)204,326(0.6%)71,075(0.2%)15,620(0.0%)
Seasonal Exceedances (Area)
201317,151,407(51.8%)4,534,747(13.7%)269,933(0.8%)62,226(0.2%)9267(0.0%)
201416,335,869(49.4%)5,616,429(17.0%)625,489(1.9%)216,897(0.7%)28,417(0.1%)
201514,507,744(43.8%)4,203,396(12.7%)373,565(1.1%)90,825(0.3%)16,248(0.0%)
20167,229,006(21.8%)1,931,583(5.8%)121,897(0.4%)40,841(0.1%)9388(0.0%)

