The Madden-Julian Oscillation: A Tool for Regional Seasonal Precipitation Outlooks?


Department of Geography, Planning and Environment, East Carolina University, Greenville, NC 27858, USA
Atmosphere 2017, 8(9), 180; https://doi.org/10.3390/atmos8090180
Submission received: 15 August 2017
/
Revised: 7 September 2017
/
Accepted: 15 September 2017
/
Published: 20 September 2017
(This article belongs to the Special Issue Madden-Julian Oscillation)
Abstract
:The Madden-Julian Oscillation (MJO) is an important intraseasonal climate signal which circles the global tropics, but also impacts extratropical weather regimes. Few studies have investigated whether the MJO is a source of regional seasonal climate predictability. The present objective is to determine the extent to which the season and phase (geographic location) of MJO contribute to the frequency of global rainfall anomalies in ensuing seasons. Indices of June-July-August and December-January-February MJO activity for each phase and the El Niño/Southern Oscillation (ENSO) were correlated to three-month averages of rainfall up to a six-month lead time. Field significance was calculated and patterns of the relationships were described. In general, MJO shows some skill in regional seasonal precipitation prediction, but to a lesser extent than ENSO. However, the presence of MJO in the western Indian Ocean and near the date line did reveal a persistent and significant relationship with regional seasonal rainfall, especially over Northern Hemisphere land areas.
1. Introduction
The Madden-Julian Oscillation (MJO), broadly defined as intraseasonal climate variability in the tropics, has recently been identified as an important bridge between weather and climate [1]. Typically, the MJO is used to predict extratropical weather regimes in the gap between synoptic weather prediction and seasonal outlooks [2,3]. However, since the MJO’s center of convection and latent heat release propagate eastward over time, completing a global cycle in 30–60 days, the spatial impact can change based on individual events. A popular index of the MJO was created and divided into eight phases [4] to account for its changing geography. The distribution of rainfall and extreme events has been found to undergo significant changes over many areas of the world during active and quiescent phases of the MJO [5,6]. However, sometimes it is the accumulated effect of the MJO over a season that is more important for climate teleconnections. Zhang [1] (p. 1850) also notes that “there can be a time lag between the group MJO activities and the climate phenomena they affect,” which may include precipitation. In fact, recent work has related the activity of MJO over the Maritime Continent during boreal winter and precipitation six months later over the Caribbean [7] (see their Figure 11). It is hypothesized that if the MJO has strong pulses in a particular phase, then the convection and latent heat release can instigate a circumglobal Rossby wave train. If the forced upper-air pattern can remain quasi-stationary for a season or longer, it can, in turn, impact remote oceanic temperatures through an atmospheric bridge mechanism [8] or trigger interannual climate modes such as the North Atlantic Oscillation (NAO) or Pacific North American (PNA) pattern [9]. This leads to the potential for MJO to be an important climate predictor at the seasonal time scale. This study uses the recently developed Geographic Power Index (GPI) [7] to determine the summertime and wintertime “activity” of the MJO at locations along its circumglobal trek and relates that activity to seasonal precipitation over the globe up to a six-month lag. The study focuses on societal impacts by investigating extratropical seasonal precipitation anomalies over land. As stated by Donald et al. [6] (p. 1), “Knowledge of these tropical and extra-tropical MJO-associated weather states can significantly improve the tactical management of climate-sensitive systems such as agriculture.” Finally, the El Niño/Southern Oscillation (ENSO) is a primary predictor in seasonal climate outlooks. Therefore, a comparison is made between the seasonal prediction skill of the MJO, as measured by the GPI, and ENSO. Section 2 describes the data and methodology used. Section 3 provides the results. Discussions and conclusions are offered in Section 4 and Section 5, respectively.
2. Data and Methods
The state of the MJO is routinely monitored with the real-time multivariate MJO (RMM) index [4], which is derived from a combined empirical orthogonal function (EOF) analysis of tropical winds and outgoing longwave radiation. The RMM is divided into eight phases, representing MJO’s center of convection: 1 and 8 for the western hemisphere, 2–3 for the Indian Ocean, 4–5 for the Maritime Continent, and 6–7 for the western Pacific. The December-January-February (DJF) GPI was constructed from 1979–2017 by simply summing the RMM value for each phase separately and then normalizing the eight time series independently by their means and standard deviations. RMM values less than one, which are sometimes considered weak or non-existent MJOs, were included in the summation. However, the means and standard deviations of the eight DJF GPIs [7] resemble other climatologies of MJO that do not include these weak events [10,11]. This procedure was then repeated for June-July-August (JJA). The total number of years in each time series was 38. A large GPI value can be considered an active MJO season. More details on the methodology can be found in [7]. To be consistent with the RMM, which is multivariate, the Multivariate ENSO Index (MEI) was used to quantify ENSO [12]. The MEI was also averaged over DJF and JJA for the same years and normalized.
Seasonal precipitation for the globe at 2.5° latitude-longitude resolution from 1979–2017 was acquired from the Global Precipitation Climatology Project (GPCP) version 2.3 [13,14], a widely used satellite-gauge combined estimate of rainfall. Gauge data in GPCP comes from the Global Precipitation Climatology Centre (GPCC). To enable a more detailed depiction of seasonal precipitation over land, the GPCC 1° latitude-longitude resolution version 7 (Deutscher Wetterdienst, Offenbach, Germany) product was combined with the GPCC monitoring and real-time products to achieve the same period of record as GPCP [15]. For a sense of the interannual variability of regional precipitation from the GPCC, the coefficient of variation (standard deviation divided by mean) is displayed for the seasons DJF, March-April-May (MAM), JJA, and September-October-November (SON) over the extratropical latitudes in Figure 1. Many areas exhibit standard deviations greater than 30% of the mean rainfall, with arid and semi-arid locations reaching over 70%, indicating the usefulness of seasonal climate outlooks.
A simple Pearson correlation
(n = 38) was used to estimate the relationships between GPI, MEI and three-month averages of GPCP and GPCC precipitation at every grid box. Precipitation seasons were lagged from the climate indices in one-month increments up to a lag of six months, so that a DJF index was related to January-February-March (JFM), February-March-April (FMA), MAM, April-May-June (AMJ), May-June-July (MJJ), and JJA precipitation; and a JJA index was related to July-August-September (JAS), August-September-October (ASO), SON, October-November-December (OND), November-December-January (NDJ), and DJF precipitation. Correlations significant at the 95th percentile were counted and the point map tested for field significance [16] with the assumption that 5% of the experimental domain would be significant by accident. Thus, the number of significant grid boxes and their spatial relationship is a means to quantify the global impact of MJO on rainfall.
3. Results
3.1. MJO and Global Precipiation
Table 1 shows the percentage of the world covered by significant relationships (p < 0.05) between DJF GPI-1 through GPI-8 and lagged seasonal rainfall from JFM to JJA. Likewise, percentages computed using MEI as the predictor are also given for comparison. It is interesting to note that the largest percentages for each MJO phase are not necessarily closest to the DJF season, as is the case for MEI, which shows a reduction of impact from 29.21% in JFM to 11.05% in JJA. Secondly, while MEI is strongly field significant for all predictand seasons as expected, only MJO phases 5 and 6 show field significance, with GPI-5 peaking in spring (MAM) and GPI-6 in summer (JJA). The fact that both show significance might be expected, as they are geographically related, with phase 5 occurring when the convective phase of the MJO is exiting the Maritime Continent and phase 6 occurring when it is entering the western Pacific. None of the GPI percentages are larger than the MEI percentages.
Table 2 follows Table 1, but starts with the JJA GPI and MEI time series. The JJA MJO season appears to have a larger global impact on rainfall than the DJF season, as over half of the time the number of significant correlations is field significant above the 90th percentile (Table 2). This result is curious considering the MJO is weaker in JJA as compared to DJF [17]. However, the reason for boreal summer having a stronger teleconnection with precipitation may be due to the MJO’s location of maximum heating. During this season the MJO has a strong northward component [18,19], impacting the Asian monsoon system which, in turn, can affect the climate of the northern extratropics [20]. Also, contrary to the DJF case, GPI-5 and GPI-6 are weakly related to global rainfall. However, GPI-2 and GPI-7 have global percentages that are field significant at the 99th percentile for all six seasons. MJO convection during phase 2 is found in the western Indian Ocean, while it is near the international date line during phase 7. Finally, the JJA MEI-rainfall correlations are strongly field significant, with larger global coverage than any of the MJO indices, and unlike the DJF case (Table 1), the percentages remain consistently high at all lag times.
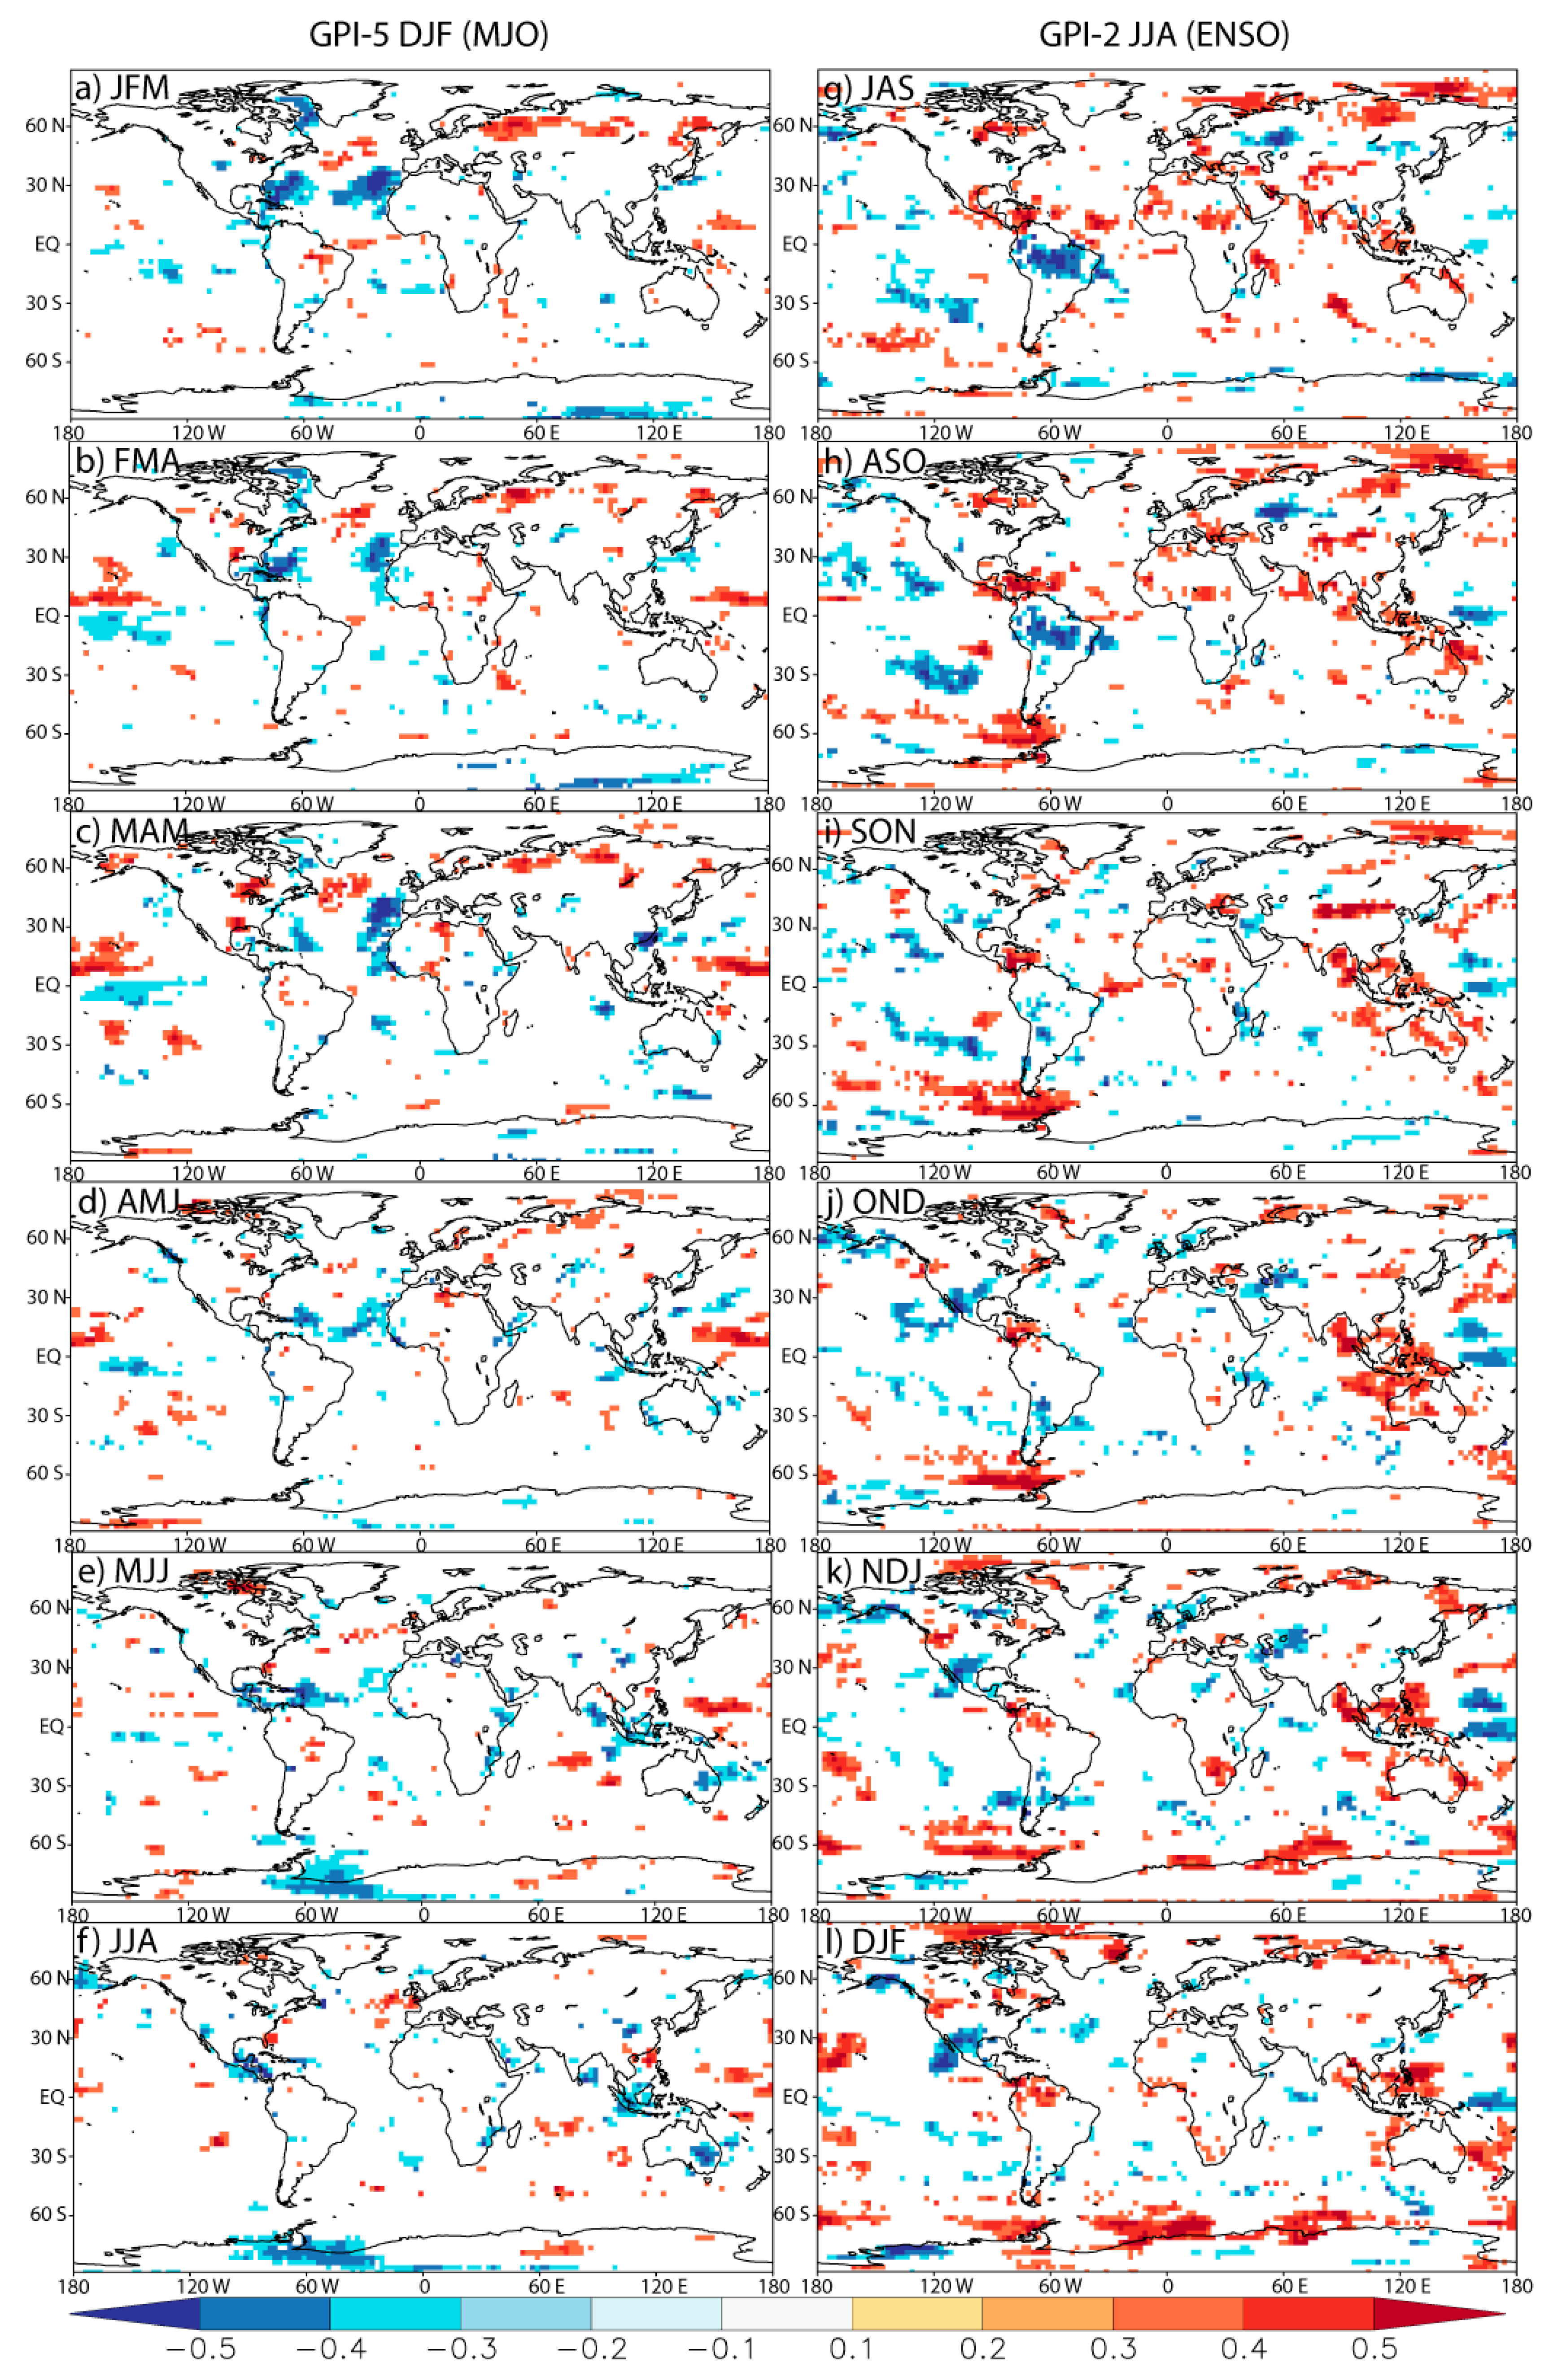
Maps of the evolution of significant GPI-precipitation correlations are shown for GPI-5 starting in winter, and GPI-2 starting in summer (Figure 2). It should be noted that the typical pattern of MJO convection [4] is not observed in either case at the initial one-month lag. This is not surprising as the MJO is transitory and even the stronger pulses of the MJO in a geographic region could be offset by long quiescent periods leading to normal seasonal rainfall. When MJO convection frequents the Maritime Continent (GPI-5 is positive) in winter, precipitation is reduced over the southeastern U.S., enhanced over the North Atlantic, and reduced from the Azores to the Cape Verde islands in the spring (Figure 2a–c), consistent with the atmospheric patterns described by [7]. At the same time, precipitation is enhanced over Russia and north of the equator in the western Pacific and reduced over the East China Sea. Correlations become more scattered from spring into summer (Figure 2d–f), as expected from the lower field significances (Table 1), but positive correlations can still be found in the Pacific and negative correlations form over the Caribbean, the Maritime Continent, and southeast Australia.
For the summer case, significant correlations between GPI-2 and precipitation are widespread in every season, as expected from Table 2. When MJO convection frequents the western Indian Ocean, precipitation is enhanced over parts of central Asia and Africa, the Caribbean, and high northern latitudes in JAS (Figure 2g). Further into the fall, MJO-precipitation relationships weaken in the tropics, apart from an increase in positive correlations in northern South America and the Maritime Continent. Following an active MJO in the western Indian Ocean, precipitation decreases in the southwest U.S. and northern Mexico from OND to DJF, while negative correlation values are consistently found around the Caspian Sea and western Pacific in all seasons. These are all areas with strong interannual variability according to GPCC (Figure 1). The lack of resemblance between the patterns identified in Figure 1 and precipitation anomalies typical in the months following ENSO [21] suggests that MJO is affecting seasonal precipitation independently. However, it is well established that ENSO and MJO are related and can affect each other at time lags [22,23,24,25]. Thus, the correlations between MEI and all eight GPI indices were calculated. No statistically significant relationship was found in the DJF season; however, JJA MEI is significantly correlated (p < 0.05) with GPI-3, GPI-4, and GPI-7. In the next section, the response in the extratropics to these two tropical climate phenomena is studied in more detail.
3.2. MJO and Extratropical Land Precipitation
As in Table 1 and Table 2, Table 3 and Table 4 show spatial percentages covered by significant (p < 0.05) correlations, but restricted to the Northern Hemisphere extratropics (30–90° N). Also, GPCC is used so the results are at a finer grid spacing (1°) and only cover land areas. Overall, the proportion of significant MJO-rainfall correlations is slightly higher when only Northern Hemisphere land is considered. However, the proportion of significant ENSO-rainfall correlations is substantially reduced. Only the DJF MEI correlated to MAM precipitation achieves field significance.
For the winter case (Table 3), the GPI-5 and GPI-6 indices are not as well related to Northern Hemisphere land precipitation as they were for the entire globe (Table 1), only reaching field significance at the 10% level in MAM, and having smaller percentages than the MEI during this season. However, GPI-7, when the active MJO is near the date line, is better related to Northern Hemisphere land precipitation, reaching field significance in MJJ and JJA with percentages of 7.84% and 9.21%, respectively, and even outperforming MEI (percentages of 6.41% and 6.78%). Figure 3 shows the land areas where GPI-7 and MEI have a significant relationship with rainfall. Similarities are apparent over the Asian continent, with both indices showing positive correlations south of 50° N between 60° E and 120° E (areas with a large coefficient of variance, Figure 1). However, GPI-7 has stronger negative correlations in western Russia, and MEI has stronger negative correlations in far eastern Russia (Figure 3). Over North America, GPI-7 shows predominantly negative correlations in JFM and FMA, while MEI shows a pattern consistent with positive rainfall anomalies across the southern tier of the U.S. during El Niño. From AMJ to JJA the MEI correlations over North America fade, while areas of positive correlation between GPI-7 and rainfall are still apparent over the northern U.S. and Canada.
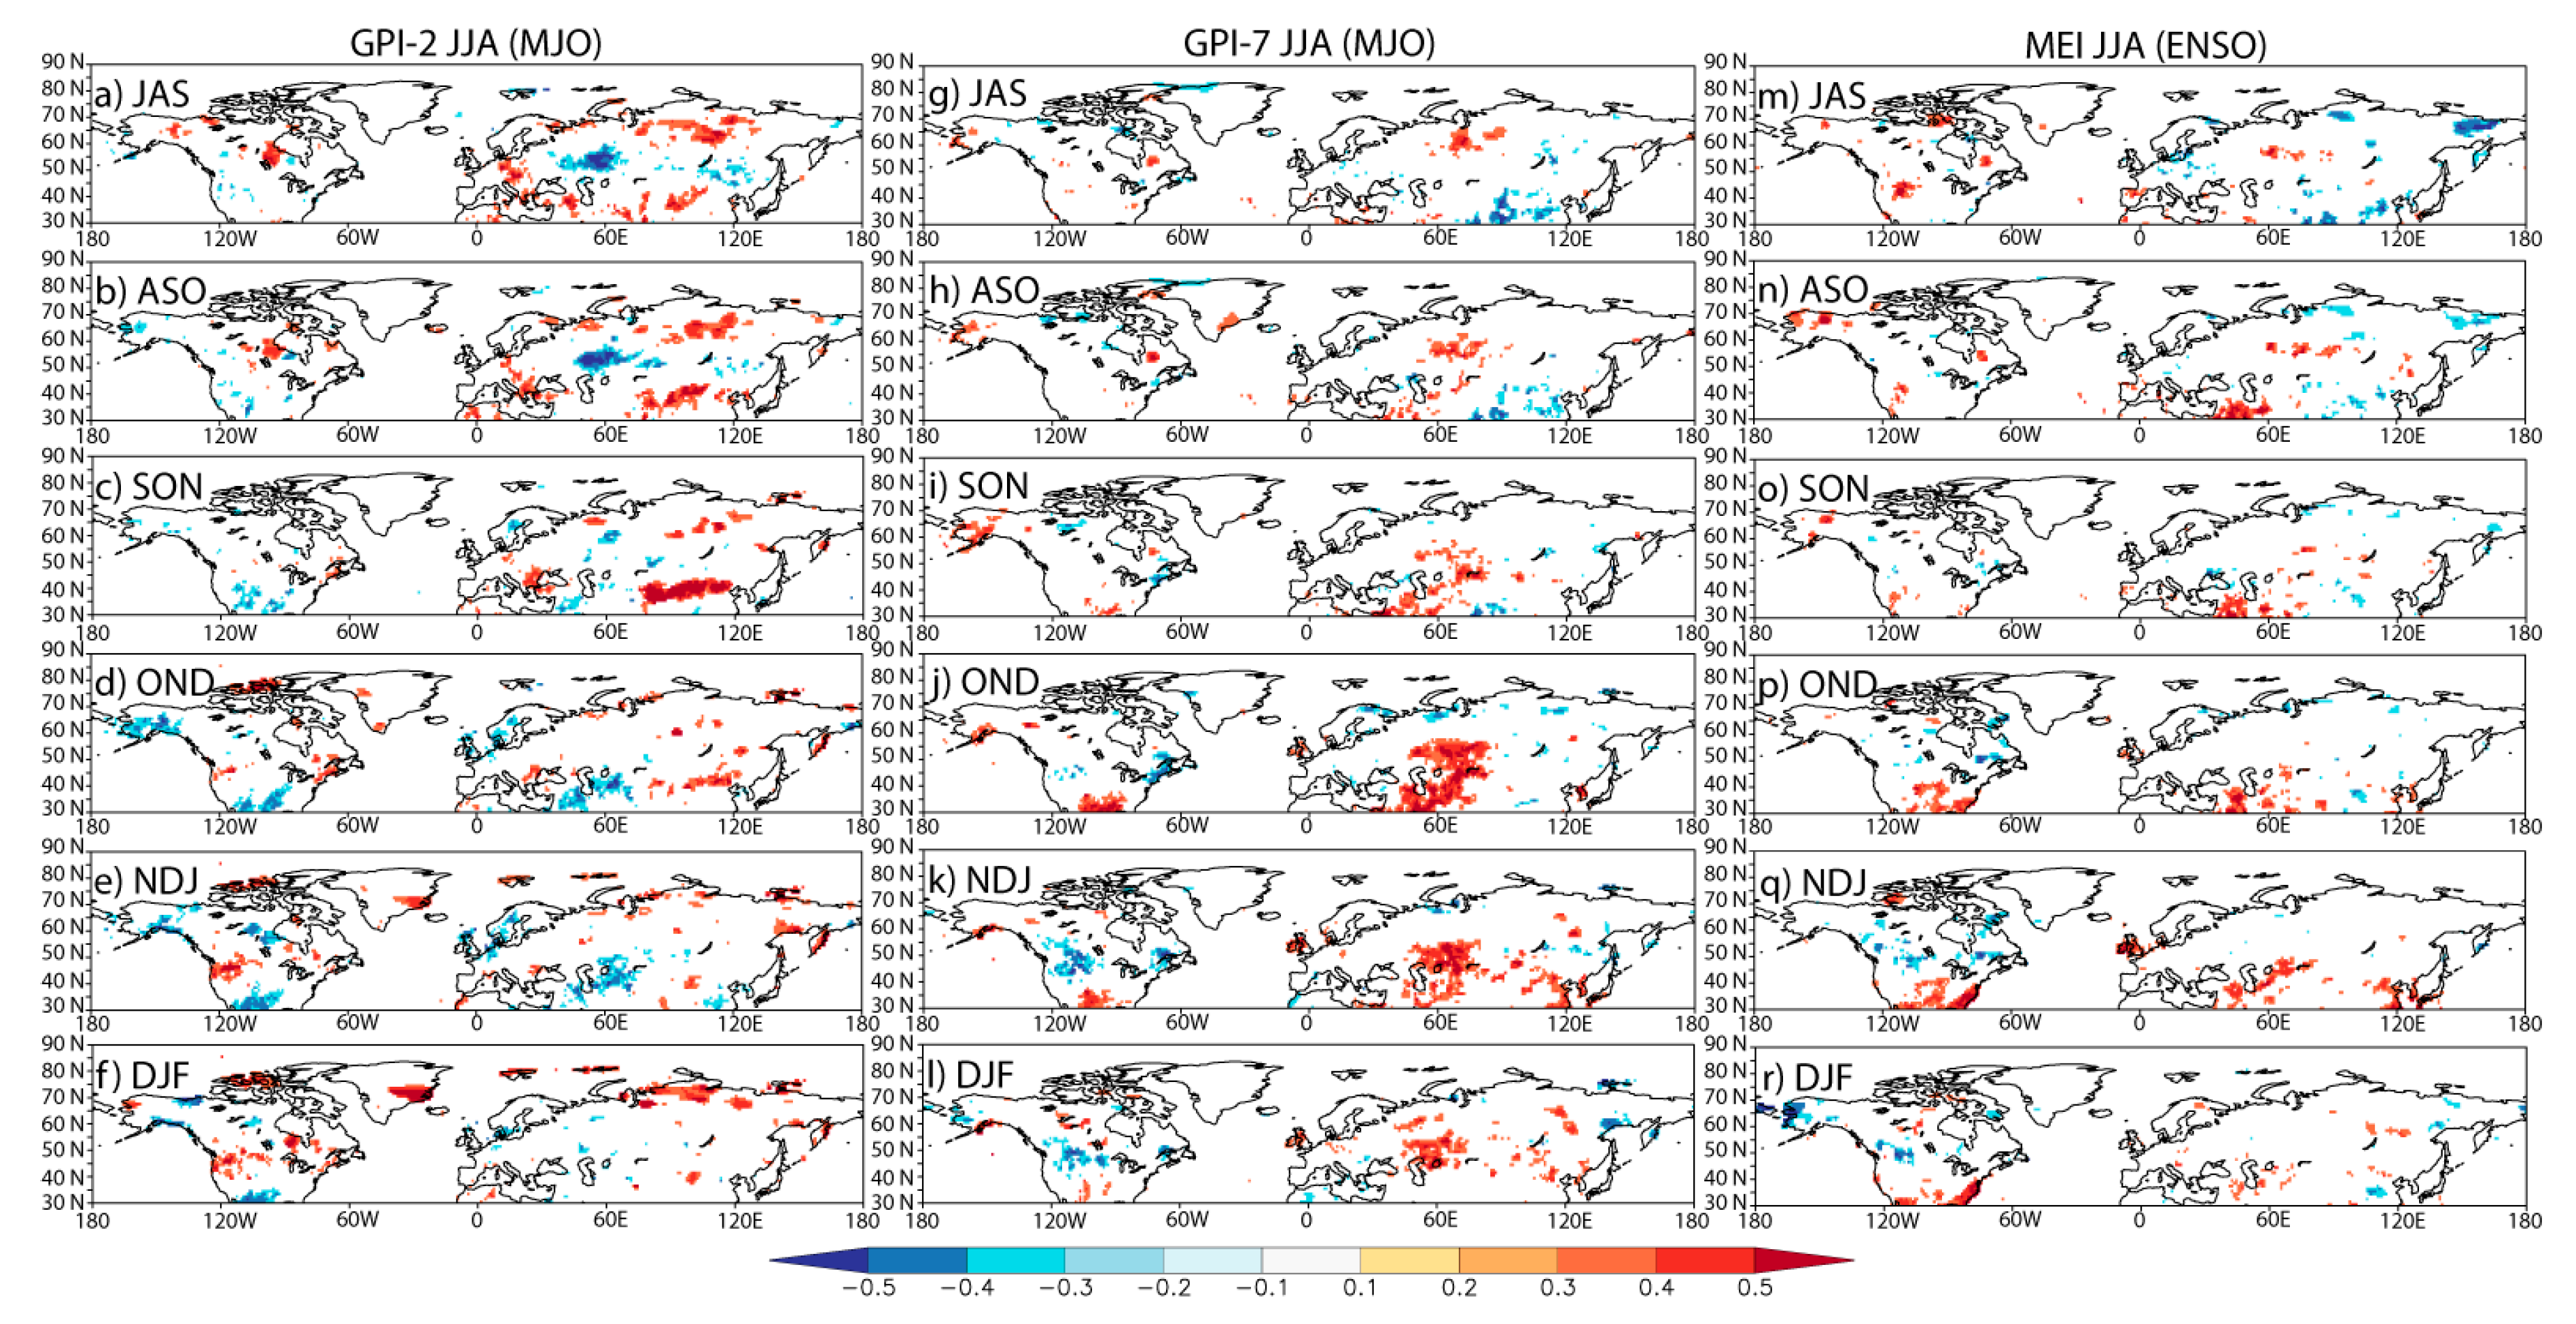
For the summer case (Table 4) only GPI-2 and GPI-7 continue to show a relationship with precipitation: GPI-2, when the active MJO is in the western Indian Ocean, for the entire suite of seasons, and GPI-7 only from OND to DJF. Interestingly, the JJA MEI-rainfall relationships do not achieve field significance in any season, and GPI-2 has consistently larger percentages. Figure 4 shows the land areas where GPI-2, GPI-7, and MEI have a significant relationship with rainfall. The GPI-2 maps (Figure 4a–f) are essentially identical to the Northern Hemisphere land portions of the global maps shown earlier in Figure 1g–l, which is not surprising considering GPCC data is used in constructing the satellite-gauge combined GPCP version 2.3 product. The GPI-7 maps (Figure 4g–l) share a striking resemblance to the MEI maps (Figure 4m–r), although GPI-7 has many more positive correlations in central Asia than MEI, especially in OND. As expected from the map analysis, JJA MEI and JJA GPI-2 are weakly correlated (−0.18, p = 0.273), but there is a significant correlation between JJA MEI and JJA GPI-7 (0.40, p = 0.013). Thus, it could be argued that ENSO, rather than an active MJO near the date line, may be the driving force behind the observed precipitation relations. In fact, when the MJO is in this region of the Pacific it can stochastically force El Niño events through the generation of westerly wind bursts [23,26].
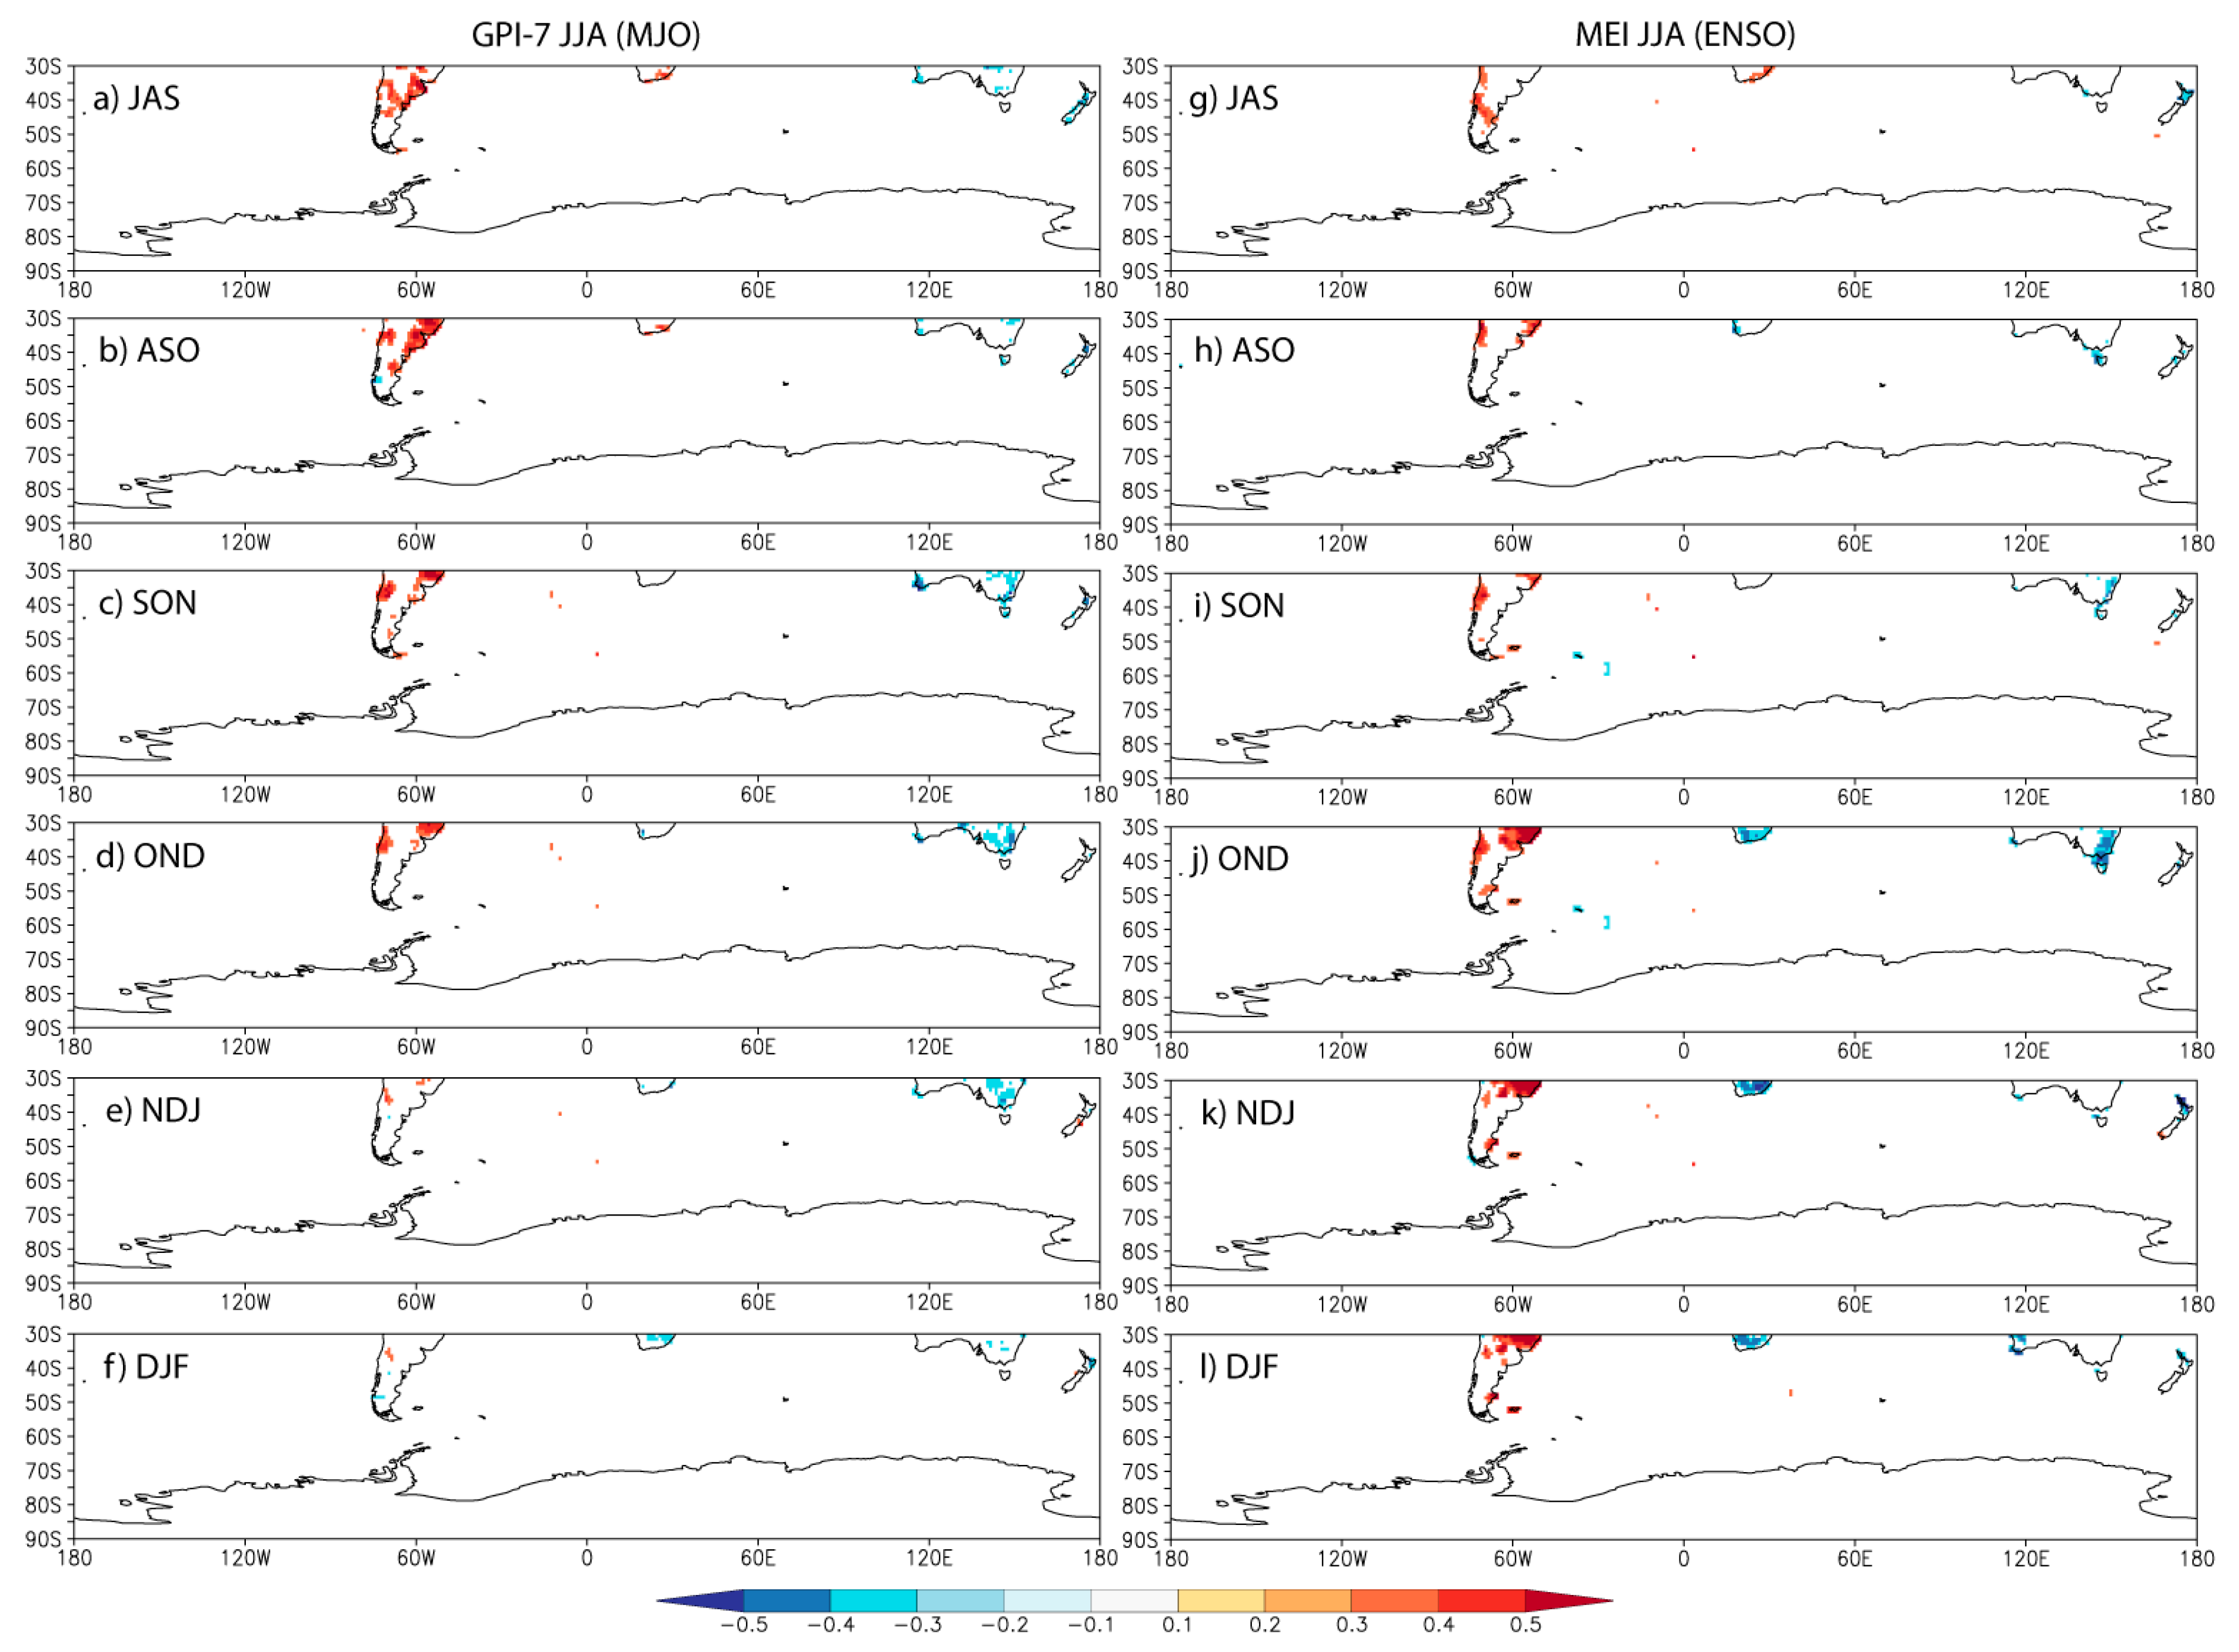
Spatial percentages covered by significant (p < 0.05) correlations were examined for a third time, but now restricted to land within the Southern Hemisphere extratropics (30–90° S). The number of relationships that achieve field significance decreases dramatically, partially due to the lack of land areas in the Southern Hemisphere. In fact, there is no power in the DJF MJO and MEI indices for predicting rainfall into the austral winter (percentages not shown). For the winter season case (JJA), only MJO activity near the date line (GPI-7) and ENSO (MEI) is related to Southern Hemisphere land precipitation in the following seasons (Table 5). In the Northern Hemisphere case, GPI-7 appeared to be related to ENSO (Figure 4) and the significant percentages were in the last three seasons (Table 4). In the Southern Hemisphere case, the significant percentages were found in the first four seasons from JAS to OND (Table 5). Figure 5a–f shows the land areas covered by significant correlations between GPI-7 and rainfall. South America is positive, Australia is negative and Africa is weakly related, switching from positive to negative values around OND. Many of these land areas have coefficient of variance values greater than 30% (Figure 1). MEI (Figure 5g–l) shows similar relationships, but the timing is different. For example, the strongest positive correlations over South America are mostly from OND to DJF. Nevertheless, it appears that the only impacts of MJO on Southern Hemisphere rainfall from austral winter to summer may be an imprint of the ENSO phenomenon.
4. Discussion
While other studies have noted a near-global impact of the MJO on rainfall [6], this is the first to quantify the relationship using field significance and compare it to ENSO, which is an already established predictor of seasonal rainfall at the global scale. It appears that the phase of the MJO is very important in determining its value as a predictor of seasonal rainfall. In a global sense, boreal winter MJO activity is only important when in phases 5 and 6, or in the Maritime Continent and western Pacific. However, all phases of the MJO except for 6 and 8 (when the MJO is in the Western Hemisphere) show some significant large-scale relationship with rainfall when the boreal summer is considered. This may be related to the MJO affecting the strength and timing of the South Asian monsoon, which is known to influence the climate of the northern extratropics. The remainder of the discussion will focus on phases 2 and 7, which were found to have the strongest relationships with global rainfall and indicated predictive skill comparable to ENSO.
Following JJA, when the MJO is active in the western Indian Ocean there is an evolution of significant seasonal rainfall anomalies in the continental Northern Hemisphere, which has a zonal banding structure. Over Asia, positive anomalies are generally found south of 40° N and north of 60° N, with negative anomalies in-between from JAS to SON. In North America, the zonal banding becomes apparent from OND to DJF, with negative anomalies around 35° N, positive anomalies near 50° N, and negative anomalies throughout much of Canada and Alaska. This pattern is quite different from the global rainfall anomalies typically experienced following an El Niño event.
A significant portion of the Northern Hemisphere land area experiences noteworthy seasonal precipitation anomalies following an active DJF MJO season in the west-central Pacific. Positive anomalies are more likely over Asia and negative anomalies are seen over North America. Unlike the western Indian Ocean MJO however, these precipitation anomalies have some resemblance to the patterns found following a DJF El Niño. This is even more the case when the JJA MJO season and JJA El Niño are compared.
5. Conclusions
Studies [5,6] continue to show that the MJO can impact the distribution of daily rainfall including precipitation extremes around the world through modulations of surface pressure and upper-air height fields. However, there is some question as to whether these intraseasonal variations in the atmosphere can have an accumulated effect on rainfall at certain locations over a season. This type of information is important for many climate end-users, such as farmers, that require long-range planning.
It was found that MJO activity in many geographic locations or phases either shows little relationship with rainfall, does not demonstrate improvement over ENSO as a predictor, or is potentially related to ENSO (e.g., phase 7). However, an active MJO in the western Indian Ocean during June-July-August can be an important predictor of precipitation over Northern Hemisphere land areas into the winter season. Furthermore, many of these regions are good candidates for the development of regression equations and seasonal outlooks of precipitation, as their standard deviations of rainfall constitute a large proportion of their means.
Finally, it is important to reiterate that individual MJO events do not directly affect remote regional precipitation anomalies six months later, but this study and others [7] are beginning to demonstrate that the interannual variability of seasonal MJO activity can trigger a chain of teleconnections that affects rainfall months later, and should motivate future work aimed at understanding the intervening oceanic and atmospheric forcing mechanisms between MJO activity and regional rainfall anomalies.
Acknowledgments
The data used are listed in the references or included in the figures. Maps were produced courtesy of the Koninklijk Nederlands Meteorologisch Instituut (KNMI) Climate Explorer program [27]. The author would like to thank three anonymous reviewers for their constructive comments.
Conflicts of Interest
The author declares no conflict of interest.
References
- Zhang, C. Madden-Julian oscillation: Bridging weather and climate. Bull. Am. Meteorol. Soc. 2013, 94, 1849–1870. [Google Scholar] [CrossRef]
- Marshall, A.G.; Hudson, D.; Wheeler, M.C.; Hendon, H.H.; Alves, O. Assessing the simulation and prediction of rainfall associated with the MJO in the POAMA seasonal forecast system. Clim. Dyn. 2011, 37, 2129–2141. [Google Scholar] [CrossRef]
- Vitart, F.; Molteni, F. Simulation of the Madden-Julian oscillation and its teleconnections in the ECMWF forecast system. Quart. J. R. Meteorol. Soc. 2010, 136, 842–855. [Google Scholar] [CrossRef]
- Wheeler, M.C.; Hendon, H.H. An all-season real-time multivariate MJO index: Development of an index for monitoring and prediction. Mon. Weather Rev. 2004, 132, 1917–1932. [Google Scholar] [CrossRef]
- Jones, C.; Waliser, D.E.; Lau, K.M.; Stern, W. Global occurrences of extreme precipitation and the Madden-Julian oscillation: Observations and predictability. J. Clim. 2004, 17, 4575–4589. [Google Scholar] [CrossRef]
- Donald, A.; Meinke, H.; Power, B.; Maia, A.D.H.N.; Wheeler, M.C.; White, N.; Stone, R.C.; Ribbe, J. Near-global impact of the Madden-Julian oscillation on rainfall. Geophys. Res. Lett. 2006, 33, L09704. [Google Scholar] [CrossRef]
- Curtis, S.; Gamble, D.W. The boreal winter Madden-Julian oscillation’s influence on summertime precipitation in the greater Caribbean. J. Geophys. Res. Atmos. 2016, 121, 7592–7605. [Google Scholar] [CrossRef]
- Alexander, M.A.; Bladé, I.; Newman, M.; Lanzante, J.R.; Lau, N.C.; Scott, J.D. The atmospheric bridge: The influence of ENSO teleconnections on air-sea interaction over the global oceans. J. Clim. 2002, 15, 2205–2231. [Google Scholar] [CrossRef]
- Branstator, G. Circumglobal teleconnections, the jet stream wave guide, and the North Atlantic Oscillation. J. Clim. 2002, 15, 1893–1910. [Google Scholar] [CrossRef]
- Lin, H.; Brunet, G.; Derome, J. Interannual variability of the Madden-Julian Oscillation and its impact on the North Atlantic Oscillation in the boreal winter. Geophys. Res. Lett. 2015, 42, 5571–5576. [Google Scholar] [CrossRef]
- Lu, W.; Hsu, P.C. Factors controlling the seasonality of the Madden-Julian Oscillation. Dyn. Atmos. Oceans 2017, 78, 106–120. [Google Scholar] [CrossRef]
- Wolter, K.; Timlin, M.S. Measuring the strength of ENSO events—How does 1997/98 rank? Weather 1998, 53, 315–324. [Google Scholar] [CrossRef]
- Adler, R.F.; Huffman, G.J.; Chang, A.; Ferraro, R.; Xie, P.; Janowiak, J.; Rudolf, B.; Schneider, U.; Curtis, S.; Bolvin, D.; et al. The version 2 Global Precipitation Climatology Project (GPCP) monthly precipitation analysis (1979–present). J. Hydrometeor. 2003, 4, 1147–1167. [Google Scholar] [CrossRef]
- GPCP V2.3 Monthly Analysis Product. Available online: eagle1.umd.edu/GPCP_ICDR/GPCP_Monthly.html (accessed on 24 July 2017).
- Becker, A.; Finger, P.; Meyer-Christoffer, A.; Rudolf, B.; Schamm, K.; Schneider, U.; Ziese, M. A description of the global land-surface precipitation data products of the Global Precipitation Climatology Centre with sample applications including centennial (trend) analysis from 1901–present. Earth Syst. Sci. Data 2013, 5, 71–99. [Google Scholar] [CrossRef]
- Livezey, R.E.; Chen, W.Y. Statistical field significances and its determination by Monte Carlo techniques. Mon. Weather Rev. 1983, 111, 46–59. [Google Scholar] [CrossRef]
- Zhang, C.; Dong, M. Seasonality in the Madden-Julian oscillation. J. Clim. 2004, 16, 3169–3180. [Google Scholar] [CrossRef]
- Lawrence, D.M.; Webster, P.J. The boreal summer intraseasonal oscillation: Relationship between northward and eastward movement of convection. J. Atmos. Sci. 2002, 59, 1593–1606. [Google Scholar] [CrossRef]
- Adames, Á.F.; Wallace, J.M.; Monteiro, J.M. Seasonality of the structure and propagation characteristics of the MJO. J. Atmos. Sci. 2016, 73, 3511–3526. [Google Scholar] [CrossRef]
- Ding, Q.; Wang, B. Circumglobal teleconnection in the Northern Hemisphere summer. J. Clim. 2005, 18, 3483–3505. [Google Scholar] [CrossRef]
- Curtis, S.; Adler, R.F. The evolution of El Niño-precipitation relationships from satellites and gauges. J. Geophys. Res. Atmos. 2003, 108, 4153. [Google Scholar] [CrossRef]
- Hendon, H.H.; Wheeler, M.C.; Zhang, C. Seasonal dependence of the MJO-ENSO relationship. J. Clim. 2007, 20, 531–543. [Google Scholar] [CrossRef]
- Seiki, A.; Takayabu, Y.N. Westerly wind bursts and their relationship with intraseasonal variations and ENSO. Part 1: Statistics. Mon. Weather Rev. 2007, 135, 3325–3345. [Google Scholar] [CrossRef]
- Tang, Y.; Yu, B. MJO and its relationship to ENSO. J. Geophys. Res. Atmos. 2008, 113, D14106. [Google Scholar] [CrossRef]
- Moon, J.Y.; Wang, B.; Ha, K.J. ENSO regulation of MJO teleconnection. Clim. Dyn. 2011, 37, 1133–1149. [Google Scholar] [CrossRef]
- Zhang, C.; Gottschalck, J. SST anomalies of ENSO and the Madden-Julian oscillation in the equatorial Pacific. J. Clim. 2002, 15, 2429–2445. [Google Scholar] [CrossRef]
- KNMI Climate Explorer. Available online: https://climexp.knmi.nl (accessed on 18 September 2017).
Figure 1.
Coefficient of variation of seasonal Global Precipitation Climatology Centre (GPCC) precipitation for the northern (panels a–d) and southern (panels e–h) extratropics. (a,e) December-January-February; (b,f) March-April-May; (c,g) June-July-August; (d,h) September-October-November.
Figure 1.
Coefficient of variation of seasonal Global Precipitation Climatology Centre (GPCC) precipitation for the northern (panels a–d) and southern (panels e–h) extratropics. (a,e) December-January-February; (b,f) March-April-May; (c,g) June-July-August; (d,h) September-October-November.
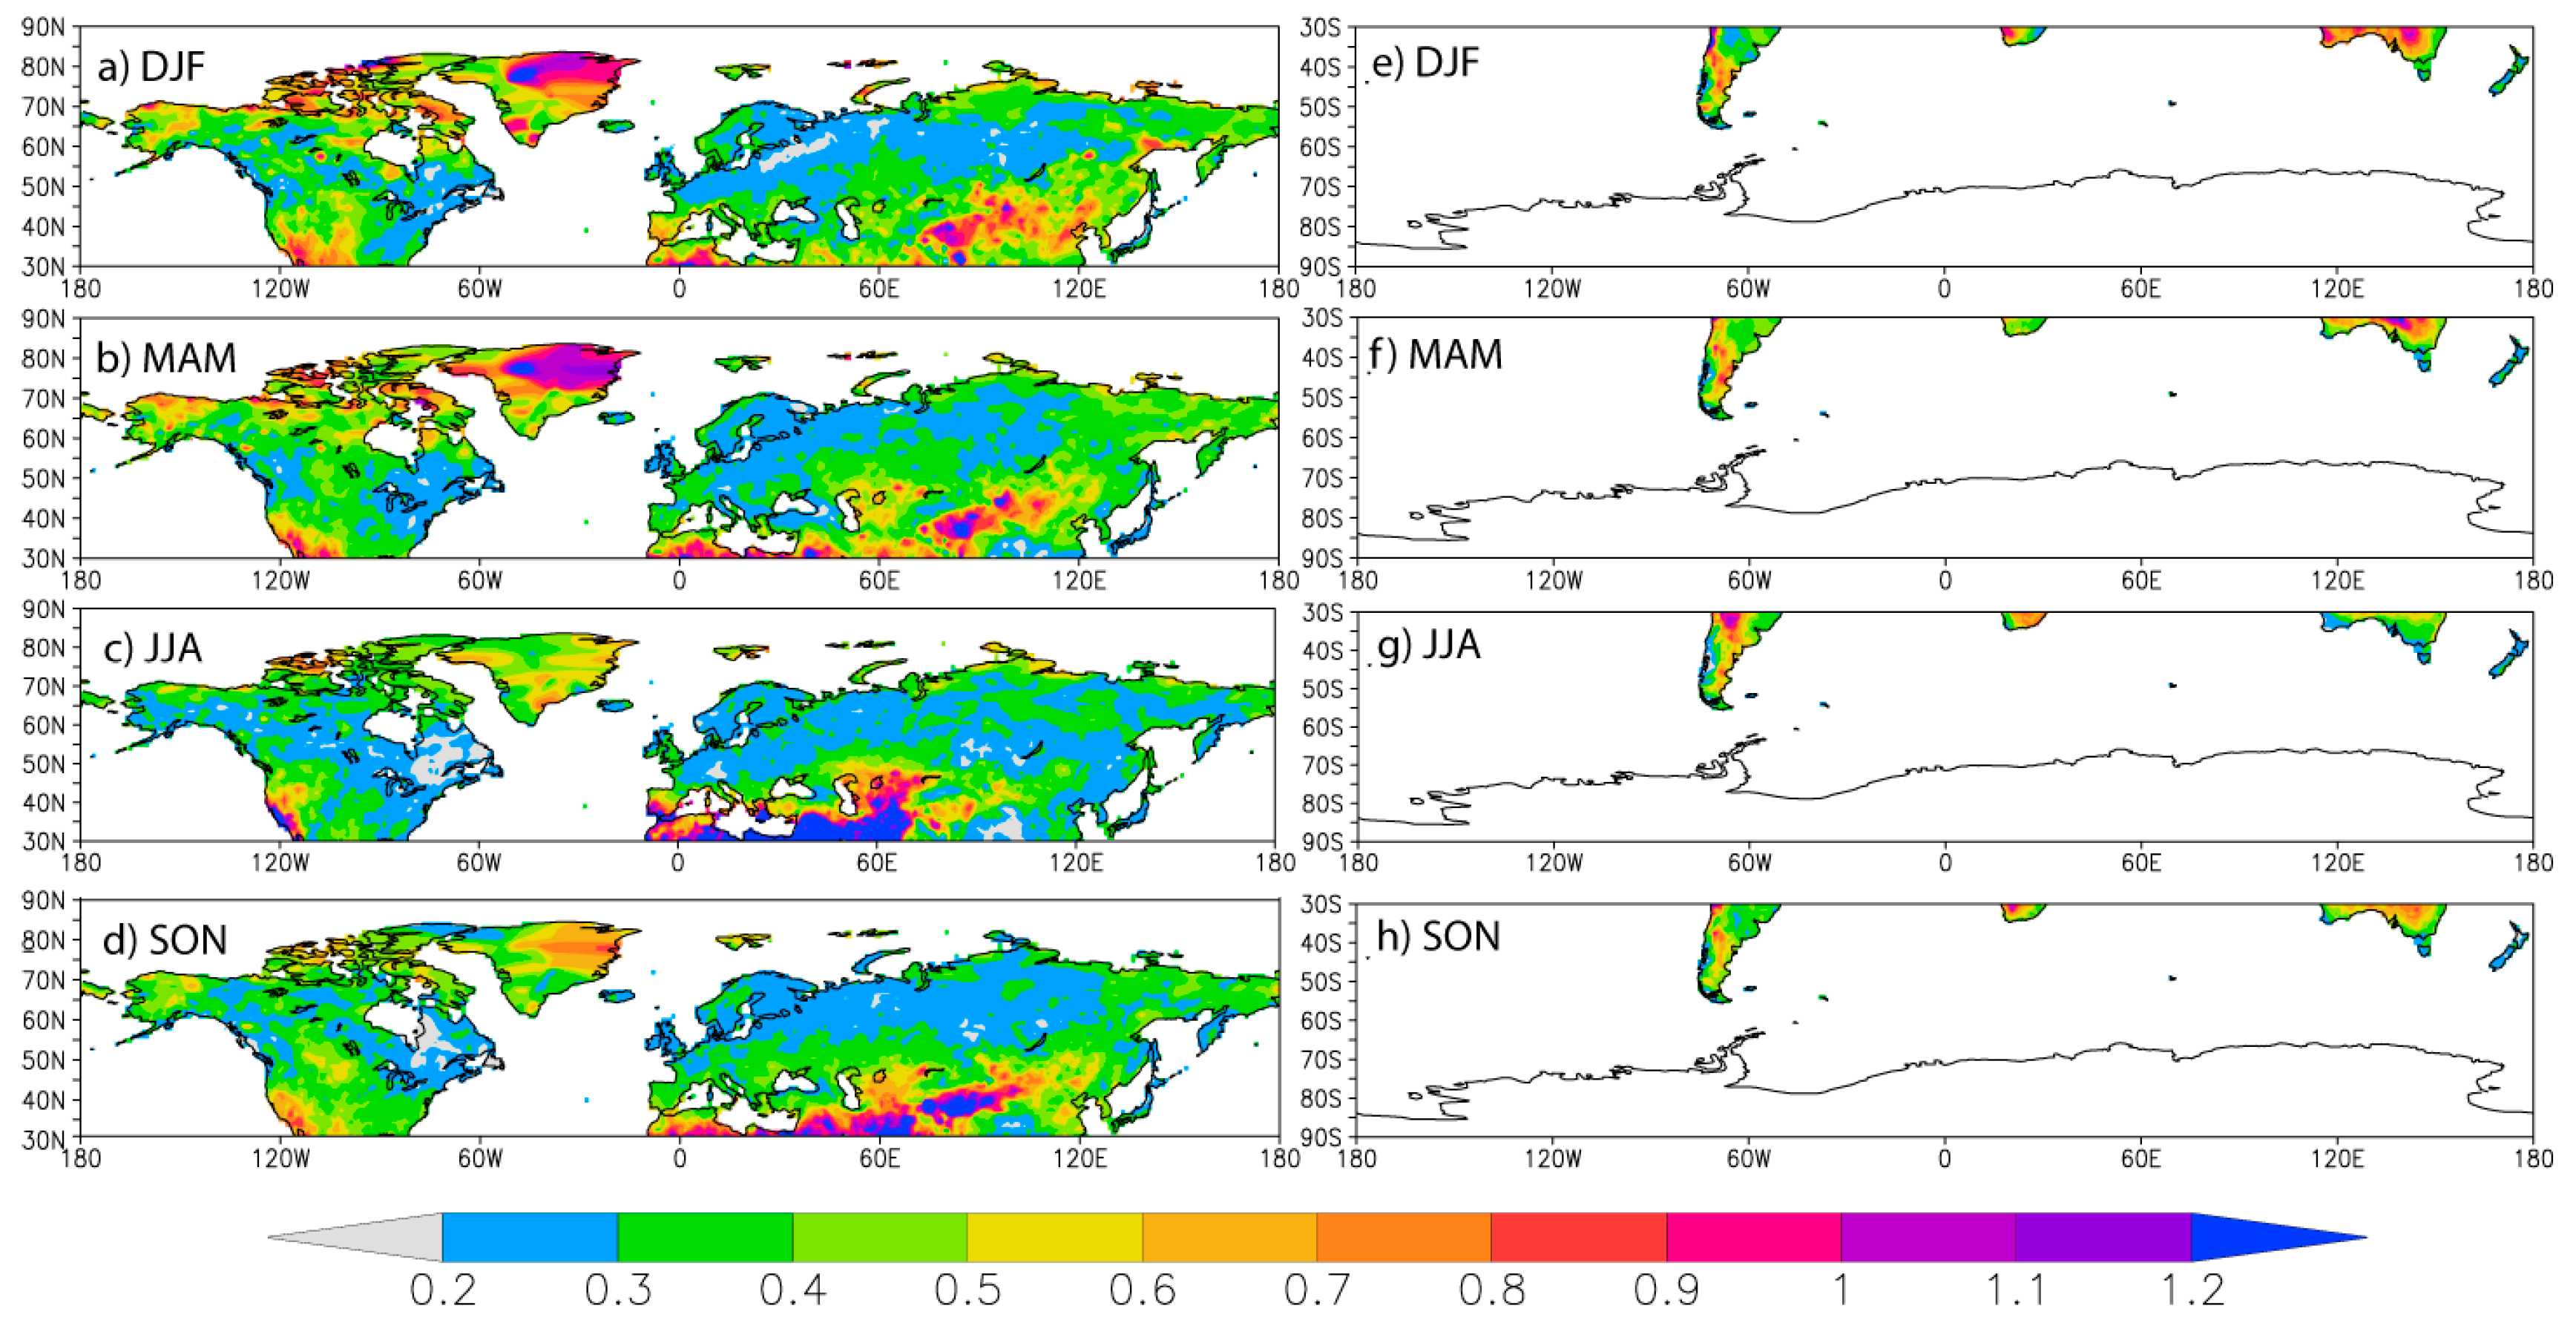
Figure 2.
Significant correlations (p < 0.05). December-January-February GPI-5 and precipitation averaged over (a) January-February-March; (b) February-March-April; (c) March-April-May; (d) April-May-June; (e) May-June-July; (f) June-July-August. June-July-August GPI-2 and precipitation averaged over (g) July-August-September; (h) August-September-October; (i) September-October-November; (j) October-November-December; (k) November-December-January; (l) December-January-February.

Figure 3.
Significant correlations (p < 0.05) over land only. December-January-February GPI-7 and precipitation averaged over (a) January-February-March; (b) February-March-April; (c) March-April-May; (d) April-May-June; (e) May-June-July; (f) June-July-August. December-January-February MEI and precipitation averaged over the same seasons (g–l).
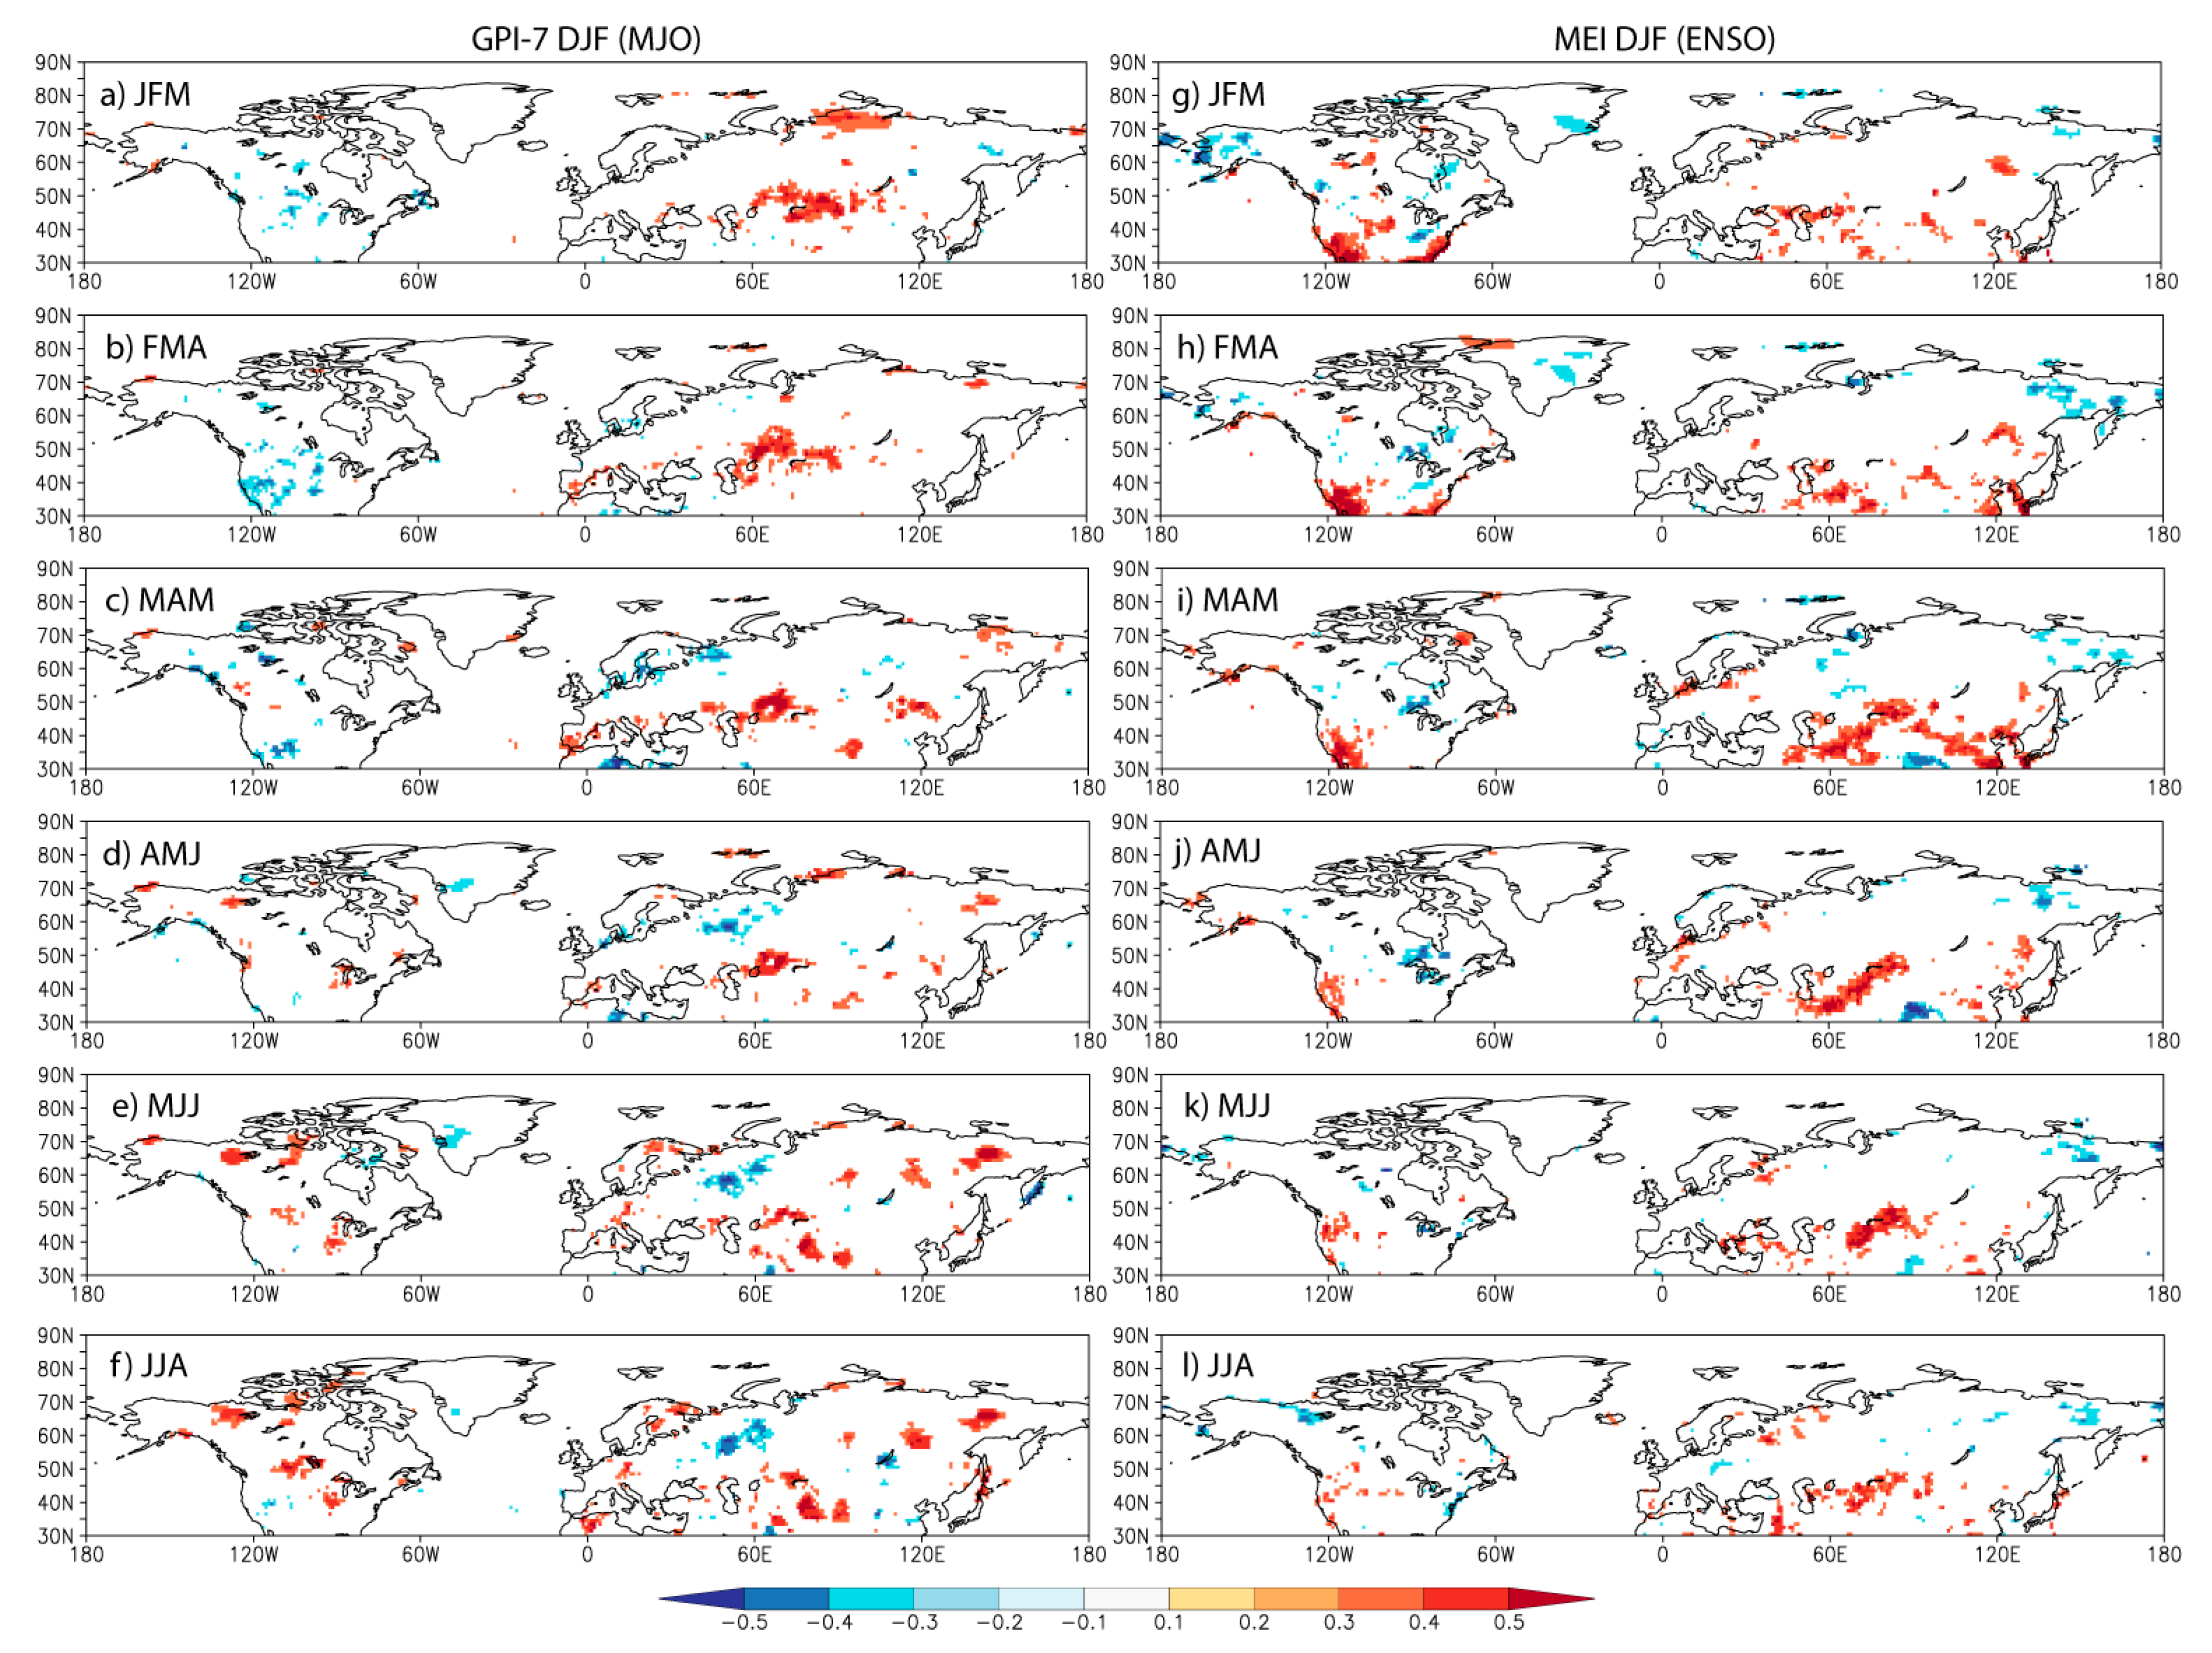
Figure 4.
Significant correlations (p < 0.05) over land only. June-July-August GPI-2 and precipitation averaged over (a) July-August-September; (b) August-September-October; (c) September-October-November; (d) October-November-December; (e) November-December-January; (f) December-January-February. June-July-August GPI-7 and precipitation averaged over the same seasons (g–l). June-July-August MEI and precipitation averaged over the same seasons (m–r).

Figure 5.
Significant correlations (p < 0.05) over land only. June-July-August GPI-7 and precipitation averaged over (a) July-August-September; (b) August-September-October; (c) September-October-November; (d) October-November-December; (e) November-December-January; (f) December-January-February. June-July-August MEI and precipitation averaged over the same seasons (g–l).


Table 1.
Percentage (%) of globe with significant correlations (p < 0.05) between a measure of December-January-February tropical climate (Madden-Julian Oscillation activity for its eight phases and El Niño/Southern Oscillation (ENSO)) and a sliding seasonal rainfall average from January-February-March to June-July-August for every 2.5° Global Precipitation Climatology (GPCP) grid box (10,368 total).
| DJF | JFM | FMA | MAM | AMJ | MJJ | JJA |
|---|---|---|---|---|---|---|
| GPI-1 | 3.23 | 3.50 | 3.58 | 3.24 | 4.22 | 4.22 |
| GPI-2 | 4.71 | 4.22 | 5.55 | 5.68 | 6.02 | 6.03 |
| GPI-3 | 5.66 | 4.77 | 4.59 | 4.90 | 5.08 | 3.55 |
| GPI-4 | 3.37 | 2.95 | 3.79 | 4.51 | 3.68 | 3.25 |
| GPI-5 | 7.69 1 | 9.03 2 | 10.68 3 | 7.79 2 | 8.68 2 | 6.88 |
| GPI-6 | 7.16 1 | 8.16 2 | 5.94 | 6.12 | 7.84 2 | 9.19 3 |
| GPI-7 | 4.59 | 5.94 | 6.25 | 5.92 | 6.07 | 6.03 |
| GPI-8 | 5.32 | 4.44 | 3.96 | 2.75 | 4.28 | 2.94 |
| MEI | 29.21 3 | 26.83 3 | 23.30 3 | 21.60 3 | 17.22 3 | 11.05 3 |
1 10% significance, 2 5% significance, 3 1% significance. DJF: December-January-February, JFM: January-February-March, FMA: February-March-April, MAM: March-April-May, AMJ: April-May-June, MJJ: May-June-July, JJA: June-July-August, GPI: Geographic Power Index, MEI: Multivariate ENSO Index.
Table 2.
Percentage (%) of globe with significant correlations (p < 0.05) between a measure of June-July-August tropical climate (Madden-Julian Oscillation activity for its eight phases and El Niño/Southern Oscillation (ENSO)) and a sliding seasonal rainfall average from July-August-September to December-January-February for every 2.5° GPCP grid box (10,368 total).
| JJA | JAS | ASO | SON | OND | NDJ | DJF |
|---|---|---|---|---|---|---|
| GPI-1 | 9.31 3 | 8.38 2 | 7.88 2 | 7.18 1 | 6.32 1 | 7.09 1 |
| GPI-2 | 13.59 3 | 14.82 3 | 13.88 3 | 14.32 3 | 15.63 3 | 14.72 3 |
| GPI-3 | 6.99 1 | 6.35 | 6.42 | 5.01 | 4.95 | 4.06 |
| GPI-4 | 9.57 2 | 8.01 2 | 7.47 1 | 5.64 | 5.72 | 5.25 |
| GPI-5 | 7.68 1 | 7.13 1 | 8.05 1 | 8.10 1 | 8.55 | 8.32 |
| GPI-6 | 6.37 | 6.83 | 5.07 | 5.32 | 4.93 | 2.80 |
| GPI-7 | 15.62 3 | 14.39 3 | 15.08 3 | 19.19 3 | 19.07 3 | 18.66 3 |
| GPI-8 | 4.64 | 5.92 | 7.35 | 9.80 | 8.14 | 6.85 |
| MEI | 23.35 3 | 24.61 3 | 24.99 3 | 25.69 3 | 26.17 3 | 24.62 3 |
1 10% significance, 2 5% significance, 3 1% significance. JAS: July-August-September, ASO: August-September-October, SON: September-October-November, OND: October-November-December, NDJ: November-December-January.
Table 3.
Percentage (%) of globe with significant correlations (p < 0.05) between a measure of December-January-February tropical climate (MJO activity for its eight phases and ENSO) and a sliding seasonal rainfall average from January-February-March to June-July-August for every 1° GPCC grid box north of 30° N.
| DJF | JFM | FMA | MAM | AMJ | MJJ | JJA |
|---|---|---|---|---|---|---|
| GPI-1 | 3.77 | 1.80 | 3.51 | 4.11 | 6.15 | 6.32 |
| GPI-2 | 2.66 | 3.26 | 5.28 | 4.57 | 5.36 | 7.04 |
| GPI-3 | 10.01 | 5.88 | 5.57 | 5.63 | 6.15 | 5.28 |
| GPI-4 | 4.79 | 6.55 | 5.96 | 5.17 | 3.87 | 4.00 |
| GPI-5 | 7.16 | 6.79 | 8.94 1 | 6.31 | 4.39 | 4.67 |
| GPI-6 | 5.78 | 6.57 | 7.88 1 | 5.84 | 5.91 | 6.21 |
| GPI-7 | 6.04 | 6.78 | 8.01 | 5.97 | 7.84 1 | 9.21 2 |
| GPI-8 | 2.96 | 3.63 | 4.10 | 4.81 | 6.10 | 5.06 |
| MEI | 9.59 | 10.28 | 13.19 2 | 8.58 | 6.41 | 6.78 |
1 10% significance, 2 5% significance.
Table 4.
Percentage (%) of globe with significant correlations (p < 0.05) between a measure of June-July-August tropical climate (MJO activity for its eight phases and ENSO) and a sliding seasonal rainfall average from July-August-September to December-January-February for every 1° GPCP grid box north of 30° N.
| JJA | JAS | ASO | SON | OND | NDJ | DJF |
|---|---|---|---|---|---|---|
| GPI-1 | 7.40 | 5.42 | 4.48 | 6.14 | 6.82 | 5.98 |
| GPI-2 | 11.54 2 | 11.99 2 | 10.12 2 | 12.50 2 | 13.62 3 | 9.47 2 |
| GPI-3 | 4.40 | 4.49 | 4.72 | 5.84 | 5.70 | 4.38 |
| GPI-4 | 5.56 | 4.08 | 3.62 | 4.92 | 3.73 | 4.59 |
| GPI-5 | 7.21 | 6.78 | 7.53 | 7.10 | 5.92 | 7.12 |
| GPI-6 | 4.36 | 8.05 | 10.61 1 | 10.01 | 6.54 | 4.98 |
| GPI-7 | 6.53 | 7.04 | 7.93 | 14.04 2 | 14.94 2 | 10.07 1 |
| GPI-8 | 5.55 | 7.55 | 6.01 | 5.42 | 5.28 | 6.22 |
| MEI | 7.34 | 6.97 | 5.34 | 7.75 | 10.83 | 6.88 |
1 10% significance, 2 5% significance, 3 1% significance.
Table 5.
Percentage (%) of globe with significant correlations (p < 0.05) between a measure of June-July-August tropical climate (MJO activity for its eight phases and ENSO) and a sliding seasonal rainfall average from July-August-September to December-January-February for every 1° GPCC grid box south of 30° S.
| JJA | JAS | ASO | SON | OND | NDJ | DJF |
|---|---|---|---|---|---|---|
| GPI-1 | 3.63 | 3.02 | 2.81 | 2.46 | 4.25 | 6.31 |
| GPI-2 | 3.80 | 2.21 | 8.77 | 9.25 | 14.64 | 7.30 |
| GPI-3 | 3.22 | 1.08 | 3.77 | 2.24 | 5.02 | 8.32 |
| GPI-4 | 3.70 | 1.61 | 0.96 | 2.49 | 7.33 | 8.58 |
| GPI-5 | 6.98 | 6.86 | 6.32 | 6.55 | 10.42 | 6.29 |
| GPI-6 | 8.56 | 3.47 | 8.32 | 6.63 | 13.89 | 7.33 |
| GPI-7 | 21.55 1 | 22.50 1 | 21.34 1 | 19.33 1 | 10.93 | 6.20 |
| GPI-8 | 6.44 | 9.39 | 9.00 | 16.65 1 | 14.18 | 6.41 |
| MEI | 12.38 | 11.37 | 14.76 | 35.18 2 | 23.89 2 | 22.18 1 |
1 10% significance, 2 5% significance.
© 2017 by the author. Licensee MDPI, Basel, Switzerland. This article is an open access article distributed under the terms and conditions of the Creative Commons Attribution (CC BY) license (http://creativecommons.org/licenses/by/4.0/).
Share and Cite
MDPI and ACS Style
Curtis, S. The Madden-Julian Oscillation: A Tool for Regional Seasonal Precipitation Outlooks? Atmosphere 2017, 8, 180. https://doi.org/10.3390/atmos8090180
AMA Style
Curtis S. The Madden-Julian Oscillation: A Tool for Regional Seasonal Precipitation Outlooks? Atmosphere. 2017; 8(9):180. https://doi.org/10.3390/atmos8090180
Chicago/Turabian StyleCurtis, Scott. 2017. "The Madden-Julian Oscillation: A Tool for Regional Seasonal Precipitation Outlooks?" Atmosphere 8, no. 9: 180. https://doi.org/10.3390/atmos8090180
Note that from the first issue of 2016, this journal uses article numbers instead of page numbers. See further details here.