Thermal Conditions in the City of Poznań (Poland) during Selected Heat Waves


Department of Climatology, Adam Mickiewicz University in Poznań, Krygowskiego 10, 61-680 Poznań, Poland
*
Author to whom correspondence should be addressed.
Atmosphere 2018, 9(1), 11; https://doi.org/10.3390/atmos9010011
Submission received: 10 November 2017
/
Revised: 7 December 2017
/
Accepted: 3 January 2018
/
Published: 7 January 2018
(This article belongs to the Special Issue Impacts of Climate Change on Human Health)
Abstract
:The aim of the study was to characterise the occurrence of hot days and heat waves in Poznań in the 1966–2015 period, as well as to describe the thermal conditions in the city during selected heat waves between 2008 and 2015. The basis of the study was the daily maximum and minimum air temperature values for Poznań–Ławica station from 1966–2015 and the daily values of air temperature from eight measuring points located in the city in various land types from 2008 to 2015. A hot day was defined as a day with Tmax above the 95th annual percentile (from 1966 to 2015), while a heat wave was assumed to be at least five consecutive hot days. The research study conducted shows the increase of Tmax, number of hot days and frequency of heat waves in Poznań over the last 50 years. Across the area of the city (differentiation of urban area types according to Urban Atlas 2012), there was a great diversity of thermal conditions during the heat waves analysed.
Keywords:
air temperature; hot days; heat waves; climate change; city; urban area types; Poznań; Poland1. Introduction
Today’s climate warming is unmistakable and visible, among other manifestations, in the increase in global average air temperature [1]. The consequence of the aforementioned changes is the increasingly frequent occurrence of hot days and heat waves [2,3,4,5,6]. The waves of 2003, 2006, 2010 and 2015 are to be highlighted amongst the recent extreme heat waves of Poland and Europe. In the future, an increase in the frequency of heat waves and their duration is expected, which will be a consequence of the increase in air temperature [7,8]. It is estimated that in the Poland of 2071–2100, the increase in air temperature in the summer may reach 2.9 °C for the average maximum air temperature and 3.4 °C for the average minimum air temperature [9].
Urban areas are particularly vulnerable to prolonged and intense heat waves [10], which is a consequence of the transformation of the environment. The small proportion of natural vegetation, numerous vertical surfaces and human activity causes significant heat in the city during the day, which is then released into the atmosphere, causing it to cool down more slowly than the surrounding areas [11]. The above factors make bioclimatic conditions more burdensome in the city than in non-urban areas. As Gabriel and Endlicher’s [12] studies in Brandenburg and Berlin show, the effects of heat are more pronounced in highly urbanised area. Numerous studies have shown an increase in the number of deaths during heat waves in large cities, including in Warsaw [13], Munich [14] and Paris [15].
In urban climate studies since the end of the 20th century, more and more investigations have been based on remote sensing data. For example, Landsat 5 TM was used by Kawashima et al. [16] to analyse relations between surface temperature and air temperature in the central part of Japan. Voogt and Oke [17] emphasised that the urban heat island observed from thermal remote sensing data is the surface urban heat island (SUHI).
An attempt at air temperature retrieval from Moderate Resolution Imaging Spectroradiometer (MODIS) data was made by Sun et al. [18] for the North China Plane. Taking into consideration land cover categories, vegetation cover, and building density Dobrovolny [19] studied the SUHI in Brno (Czech Republic). Some indicators obtained from remote sensing data were used by Schwarz et al. [20] to analyse differences between urban and agricultural areas. Ptak et al. [21] applied Lansat thermal images in an analysis of lake surface temperature in Poland. In the present study the temperature field on the area of Poznań city was characterised by using Landsat 5 and 8 TM remote sensing data.
Due to the great risk to human health and life associated with the occurrence of heat waves, particularly in highly urbanised areas, the research results presented may be useful for a wide and diverse group of readers. The implementation of this research study is well founded, especially in the face of UN projections [22] of the increase in the number of people living in cities. With this information in mind, the purpose of the article was to:
- define multiannual changes in the occurrence of hot days and heat waves in Poznań in the years 1966–2015;
- characterise thermal conditions in the city during selected heat waves in the years 2008–2015.
2. Research Area, Data and Methods
Poznań is located in western Poland in the area of the Wielkopolska Lakeland. The city’s area is 262 km2 and the population is 545,700 people. Over 58% of the city area is above 80 m a.s.l.; 7% is in the floodplain of the Warta River Valley, and the rest (35%) in upper river terrains. Within the limits of Poznań, there are natural and artificial lakes covering a total of 1.9% of the city area. Developed and urbanised land constitutes 44.6% of the city’s area (of which about 28.6% is residential areas, 30.3% of communication and 9.1% of industrial areas), while forested and wooded land constitutes 15.3% [23].
Poznań is located in a temperate transition zone between the sea and the continental climate. The average annual air temperature is 8.3 °C. On average, the coldest month is January with an average temperature of −1.6 °C, and the warmest is July with an average of 18.1 °C. The average annual rainfall is 517 mm, with the lowest observed in February (26 mm) and the highest in July (75 mm). Over the year, winds from the western sector (SW, W, NW) dominate the study area and about 5% of the day is calm. The average wind speed is 4.1 m/s and it ranges from 3.5 m/s in August to 4.8 m/s in March [24].
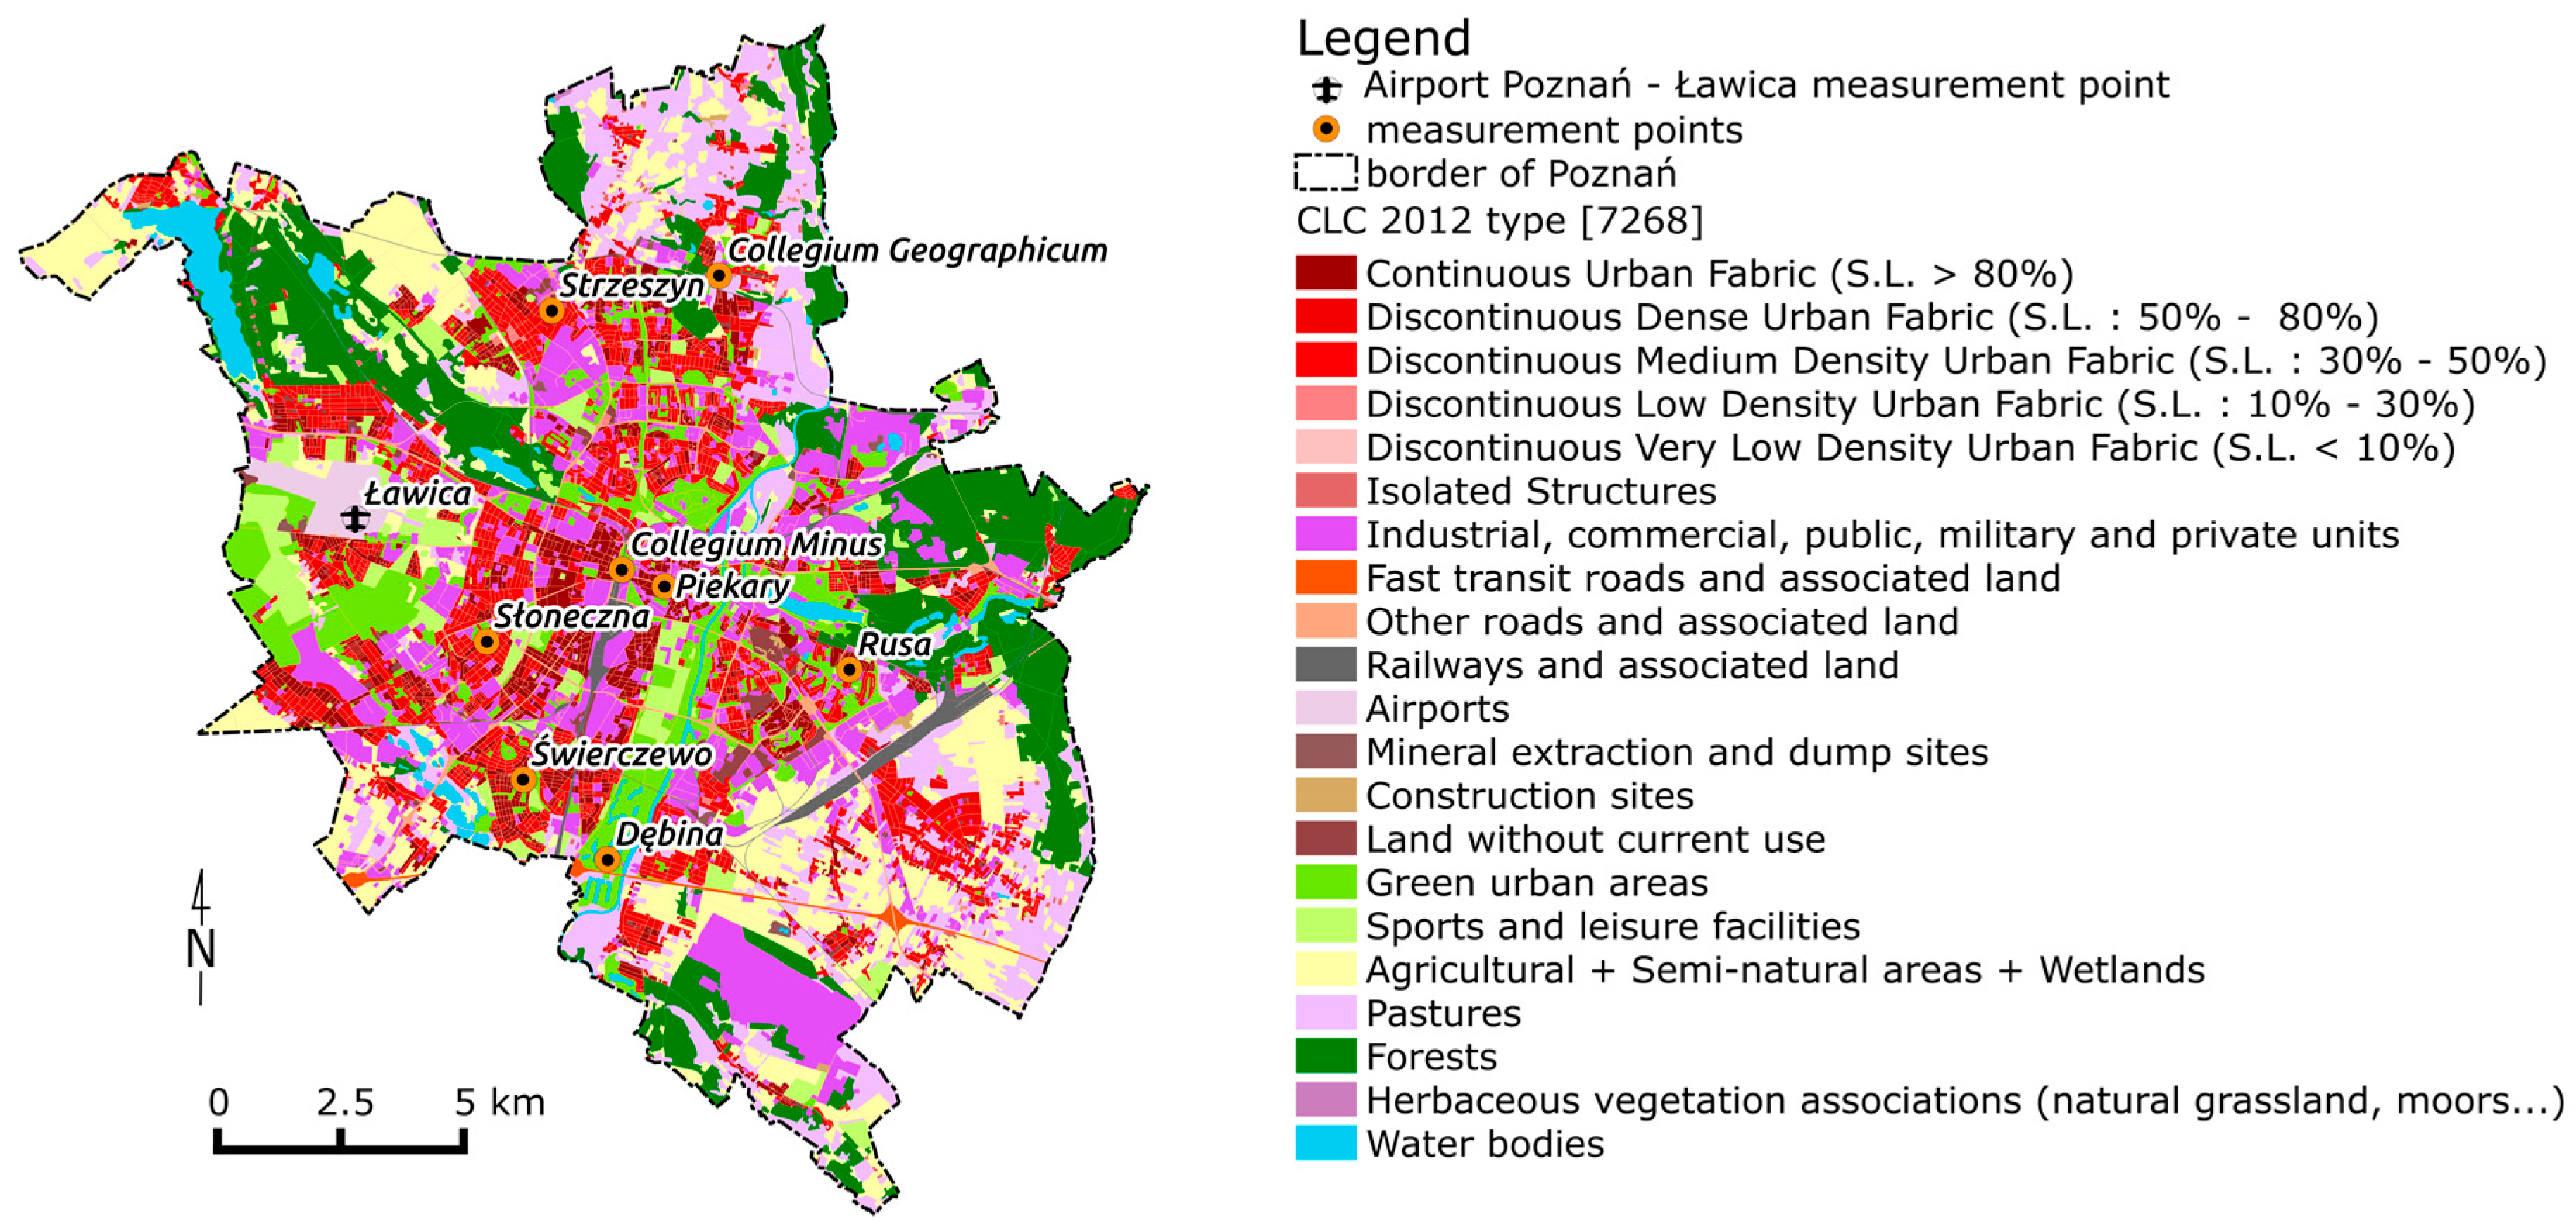
This article has used daily values of the maximum (Tmax) and minimum (Tmin) air temperature for the station in Poznań (Poznań–Ławica) from 1966 to 2015. The data were obtained from the records of the Institute of Meteorology and Water Management–National Research Institute (IMGW). In addition, daily air temperature data for the years 2008–2015 were used from eight measuring points located in the Poznań area on various types of land (Table 1, Figure 1). The analysis excluded the year 2012 due to the lack of complete data for all the measuring points. Data were obtained from the Department of Climatology of Adam Mickiewicz University in Poznań. The air temperature is measured 2 m above ground level with HOBO U23-001 recorders with 30-min resolution and 0.2 °C accuracy.
Based on the data from the Poznań–Ławica station, the average Tmax for each summer season (June–August) was calculated and the hot days and heat waves were differentiated. A hot day was defined as a day with Tmax above the 95th annual percentile (from 1966–2015), and a heat wave was assumed to be at least five consecutive hot days. The aforementioned assumption was based on the definition of an extreme weather event included in IPCC reports [1], according to which a weather phenomenon is so rare within the particular area that it lies within the range of 10th or 90th percentile of an observed probability density function or rarer. It is hence defined as an extreme weather event. The value of the 95th percentile of the air temperature was often used in previous studies on the occurrence of heat waves [25,26,27,28].
The next step was to examine changes in the above characteristics in the years 1966–2015 and determine their statistical significance. To this end, the non-parametric Mann–Kendall test was used to detect the trend in the time series. The strength of trends in temperature characteristics and the number of days in the multiannual period were determined by Sen’s non-parametric method. Sen’s method adopts a linear trend model, f (t) = Qt + B, where Q is an estimator of the linear regression coefficient (trend strength); B is a free term. The calculations were done using the MAKSESENS 1.0 application (freeware) developed by researchers from the Finnish Meteorological Institute [29].
Moreover, with the threshold values from Poznań–Ławica station, hot days and heat waves were distinguished at every measuring point in the city.
Thus, to characterise the thermal conditions in the city accurately, two satellite images were used, i.e., the image recorded by the LANDSAT-5 TM satellite on 12 July 2010 at 9:34 UTC and LANDSAT-8 OLI/TRIS on 11 August 2015 at 9:34 UTC. Both days were characterised by the heat wave occurrence. In addition, on 12 July 2010, there was clear and calm weather with a clearly marked thermal diversification of the urban surface; 11 August 2015 was thus characterised by the passage of warm weather front and less spatial thermal diversification of the city.
The image processing involved the data processing procedure described in detail by Sobrino and Raissouni [30], Jiménez-Muñoz and Sobrino [31], Walawender [32] and Majkowska et al. [33], including separate patterns for LANDSAT-5 TM and LANDSAT-8 OLI/TRIS images. The aforementioned procedure consisted of the following steps:
- conversion of the values measured by the satellite sensor (in the thermal channel) for each pixel to the energy radiation value;
- conversion of radiation values to radiation temperature using Planck’s law;
- calculation of the land surface temperature under the Stefan–Boltzmann law, taking into account the differentiation of the emissivity of different surfaces;
- conversion of the land surface temperature (LST) to the air temperature at 2 m above the surface layer (Tasl) using a linear regression model. This model is used to estimate the air temperature (Tasl) value when the LST value is known:a, b—linear regression coefficient.Tasl = a × LST + b.
Maps of the air temperature distribution were then constructed for the area analysed for the days and the air temperature course analysed along the designated profiles on 12 July 2010. This day was chosen because of the large variation in air temperature in the city area and the apparent impact of land development on the thermal conditions. Daily sea level pressure (SLP), heights of isobaric surface 500 hPa (z500 hPa) and temperatures on isobaric surface 850 hPa (T850) were used to characterise the weather conditions. The data were obtained from the collection of the National Centre for Environmental Prediction/National Centre for Atmospheric Research (NCEP/NCAR) Reanalysis [34], which are available at the Climate Research Unit resources. Based on the aforementioned data, the maps of SLP, z500 hPa and SLP, z500 hPa and T850 anomalies maps were plotted for the analysed days. In addition, weather maps and comments from the Daily Meteorological Bulletin from IMGW resources were used.
What is more, the Urban Atlas 2012 [35] database for Poland was used. For each type of land use, the average values of LST and their median, first and third quartiles as well as outliers and ranges were calculated. The aforementioned data was used to evaluate the impact of land use on the thermal conditions in the city during the hot days analysed. The following were used in the research: ESRI ArcGiS Desktop 10.5 software with Spatial Analyst, Quantum GIS 2.8 and R software (R Core Team, Vienna, Austria, 2015) and its packages: “raster” [36] and “rgdal” [37] dedicated to the spatial analysis.
3. Results
3.1. Tmax in the Summer Season in the Years 1966–2015 (Poznań–Ławica)
The average summer season (June–August) Tmax in the years 1966–2015 was 23.6 °C and ranged from 20.8 °C (1980) to 26.8 °C (1992) (Figure 2). The standard deviation for the given multiannual period was 1.4 °C. A statistically significant (p < 0.05) increase in Tmax was observed in the period analysed, which was 0.35 °C per 10 years. The aforementioned increase was significantly influenced by Tmax changes at the beginning of the 21st century, when its value in almost all summer seasons was higher than the average for the 1966–2015 period (Figure 2). In the 1966–2000 period, during 19 of the 35 summer seasons, the Tmax mean was lower than the mean from the multiannual period.
3.2. Hot Days and Heat Waves in the Years 1966–2015 (Poznań–Ławica)
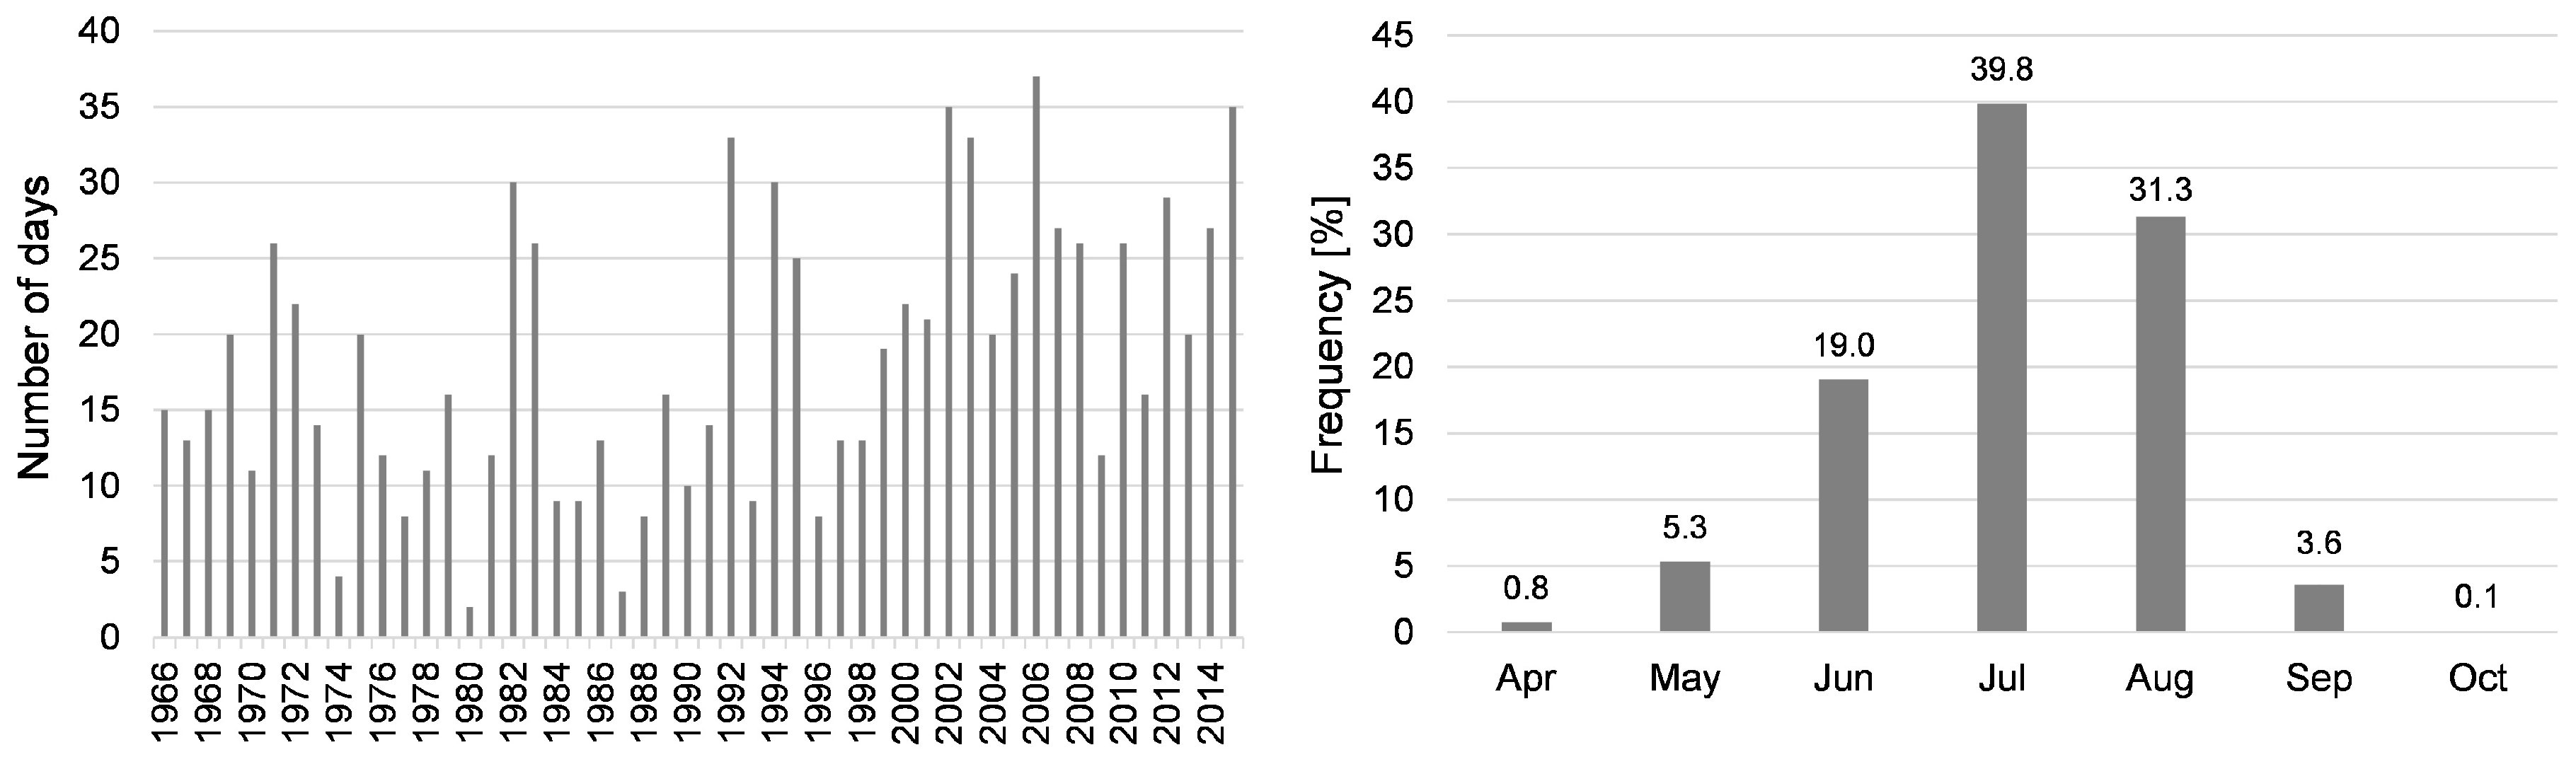
Hot days (i.e., days above the 95th annual percentile—>27.8 °C) in Poznań occurred on average 18 times a year. In individual seasons, the number varied from two days (1980) to as many as 37 days (2006), and the standard deviation was 9.1 days (Figure 3). In the period analysed, there was a statistically significant (p < 0.05) increase in the number of hot days (2.9 days/10 years). Days with Tmax > 27.8 °C were observed from April to October, although the largest number were reported in July and August, representing 39.8% and 31.3% of all hot days, respectively. In total, there were seven days in April and only one day in October.
In the analysed multiannual period, there were 42 heat waves in total, which lasted 310 days (Table 2). Five- and six-day waves were the most common and accounted for, respectively, 34.9% and 20.9% of all heat waves. The longest heat wave was recorded in 1994, which lasted 18 days (from 21 July to 7 August). Long heat waves were observed in 2015 (16 days, from 2 to 17 August), 2006 (14 days, from 18 to 31 July), 1969 and 1971 (12 days—27 July to 3 August and 24 July to 4 August, respectively). The average heat wave length in the multiannual period analysed was 7.4 days, while in the individual years it ranged from six (1996–2005) to 8.8 days (2006–2015). Heat waves occurred between May and August, although most of them (as much as 56%) occurred in July. The earliest recorded heat wave in 1979 was from 31 May to 7 June, while the latest one in 1997 occurred from 22 to 27 August.
The mean Tmax during the heat waves analysed was 30.5 °C, while Tmin was 16.2 °C (Table 2). The highest mean Tmax was found during the heat wave of 1992 (6–11 August), which was 33.9 °C, while the lowest average Tmax value, which was 28.9 °C, was seen in 1992 (24–28 July), 1997 (22–27 August) and 2001 (26–30 July). During the longest heat wave, i.e., that lasting from 21 July to 7 August, 1994, the average Tmax was 32.1 °C, while the average Tmin was 16.1 °C.
3.3. Tmax, Hot Days and Heat Waves in the City Area in 2008–2015
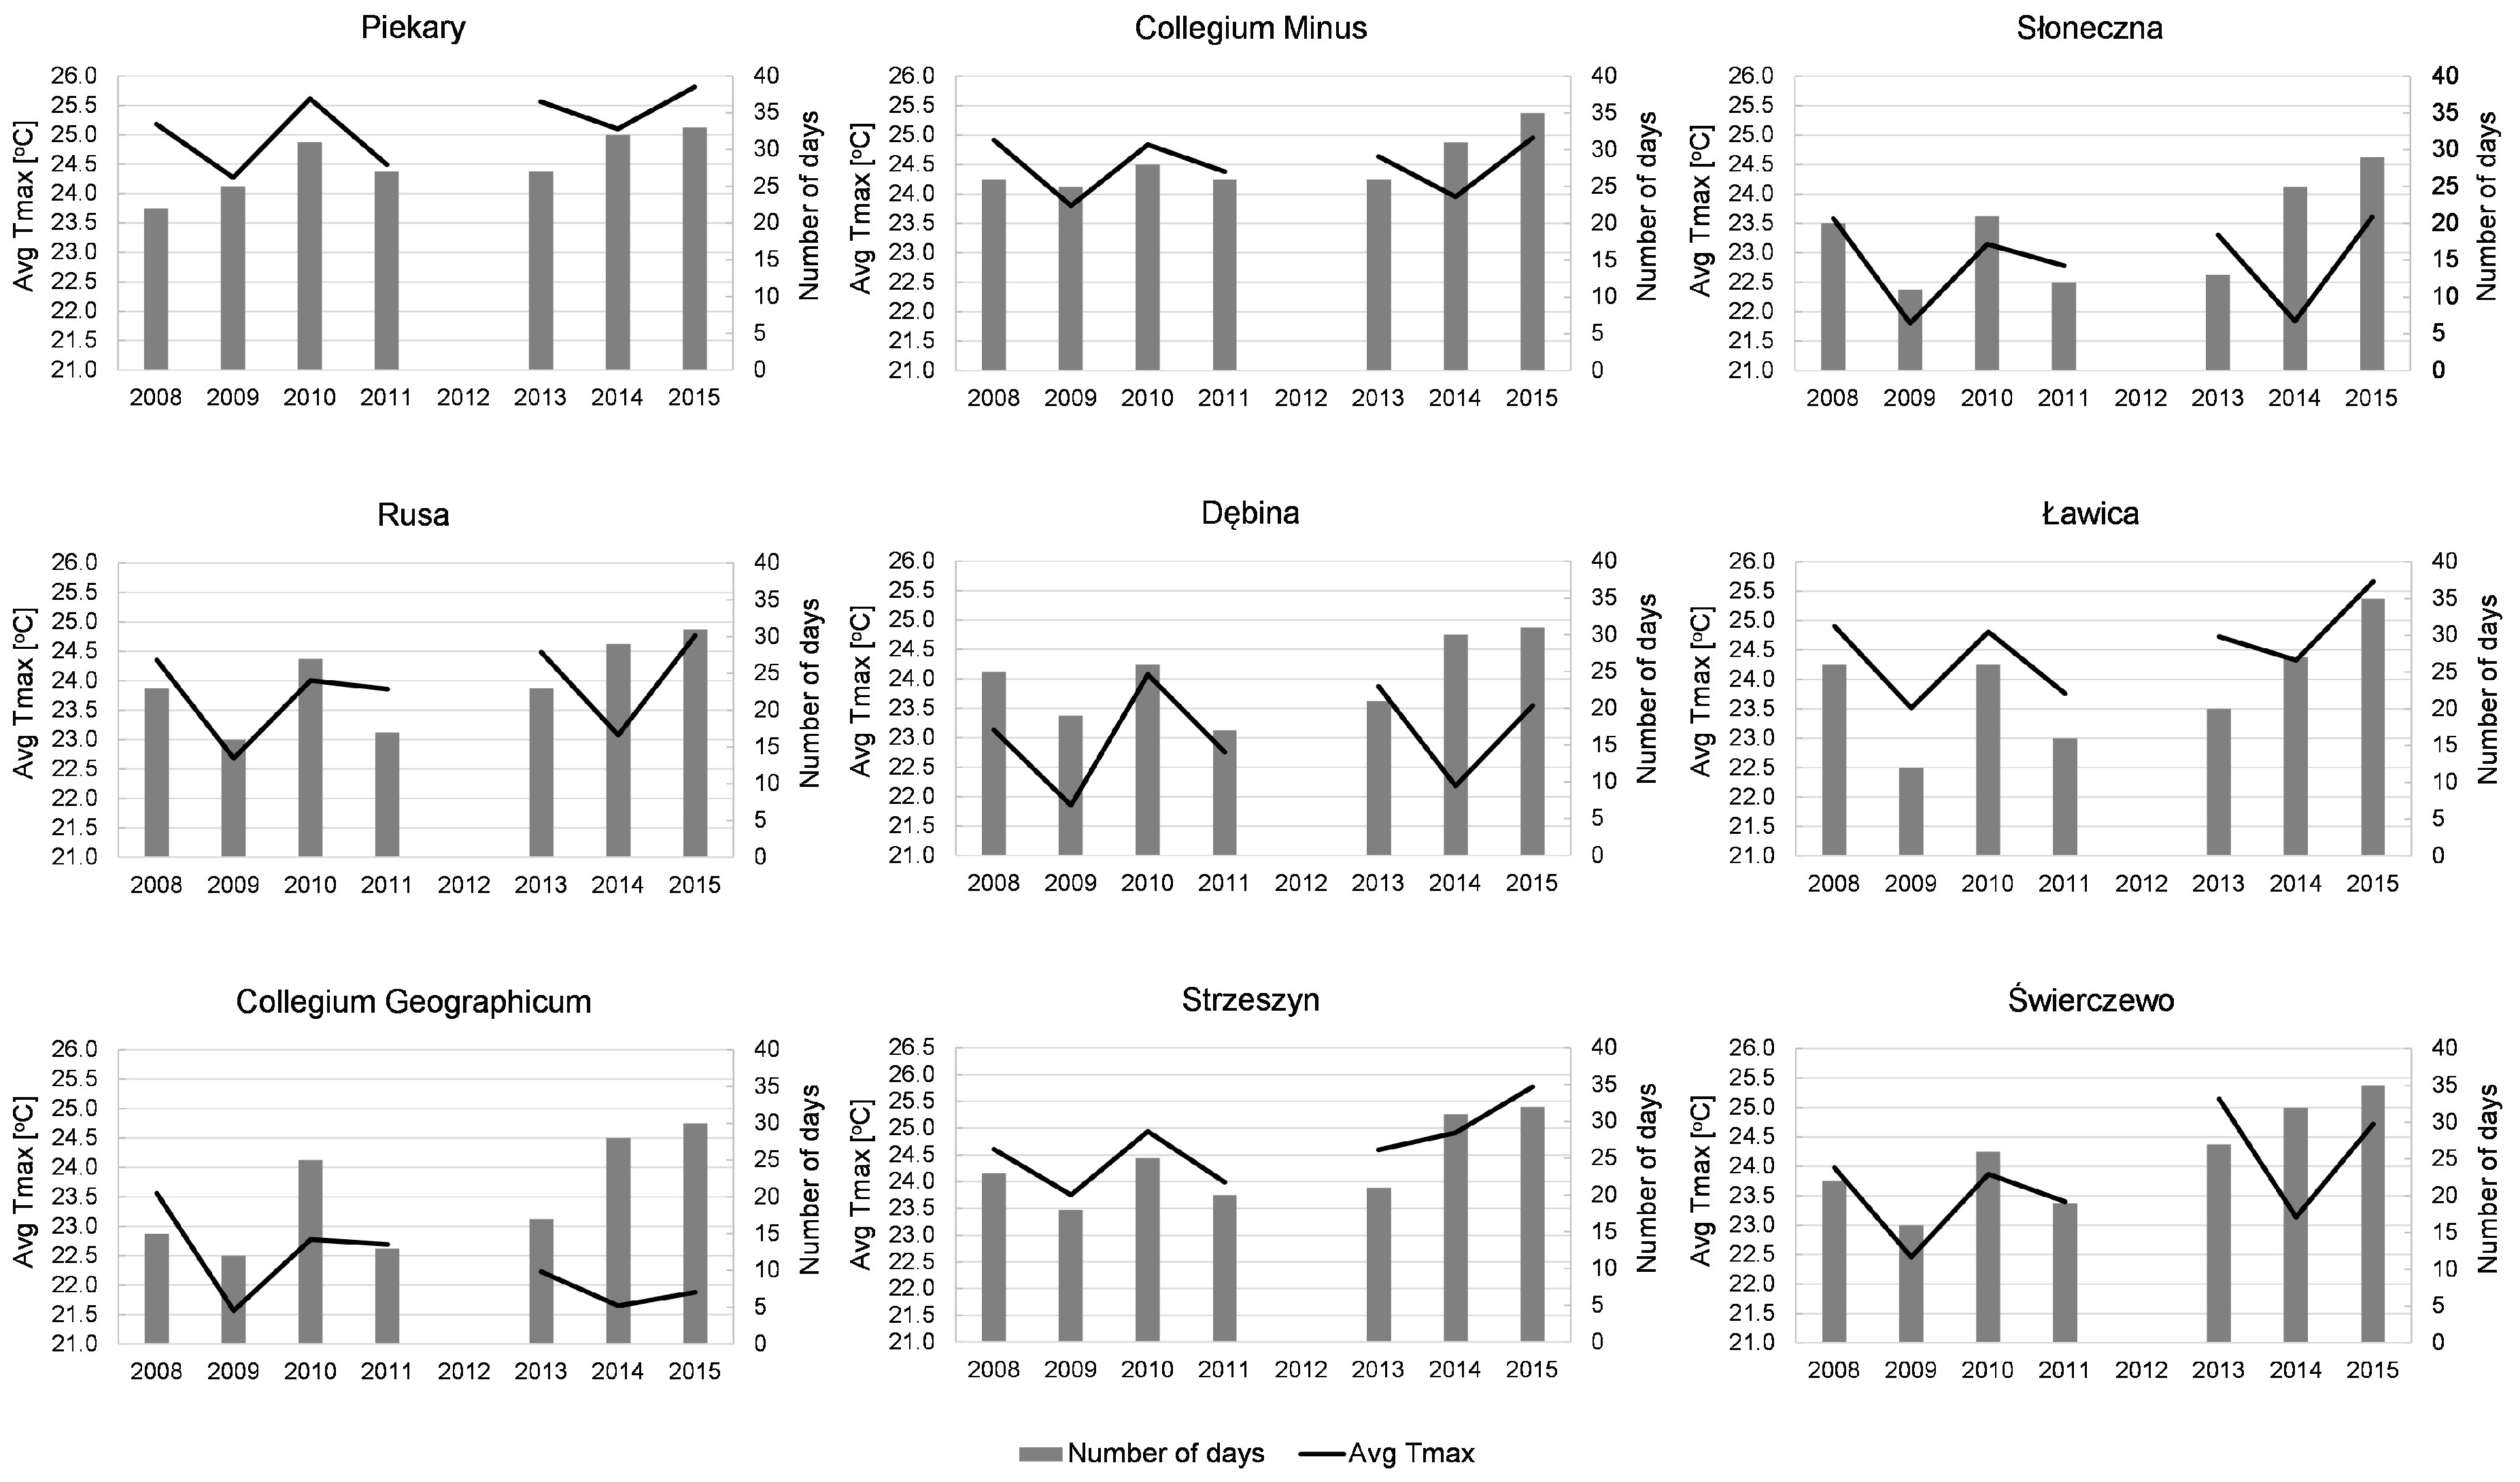
In 2008–2015, the average Tmax in the city area was 23.8 °C and changed from 22.3 °C in Collegium Geographicum to 25.1 °C in Piekary. At all points, the coldest season was recorded in 2009. The average Tmax then changed from 21.6 °C in the Collegium Geographicum to 24.3 °C in Piekary (Figure 4). Also, at the two points (Collegium Geographicum and Słoneczna), the same average Tmax as in the summer of 2009 was recorded in the 2014 season. On the other hand, at most points, the highest mean Tmax in the summer occurred in 2015 and ranged from 21.9 °C at the Collegium Geographicum up to 25.8 °C in Strzeszyn and Piekary.
In the studied years, the total number of hot days in the city ranged from 131 days at Słoneczna to 197 days in Collegium Minus and Piekary. Apart from two points (Dębina and Piekary), the least hot days were recorded in the coldest season (summer 2009) and their number ranged from 11 days at Słoneczna to 25 days in Collegium Minus and Piekary (Figure 4). In turn, the hottest days occurred in 2015, and their number changed from 29 days at Słoneczna to 35 days in Collegium Minus, Dębina and Ławica.
A total of 10 heat waves were recorded in the city, of which five heat waves occurred at every measuring point. These were the waves from 2010 (8–17 July), 2014 (4–9 July, 15–23 July, 26–30 July and 2015 (2–18 August). The start and end dates of these waves (except for the wave from 2015) were similar throughout the entire city. In turn, three heat waves occurred in the city area, but they were not recorded in the Poznań–Ławica station. These were the waves of 2008 (30 May–3 June), 2009 (29 June–4 July) and 2011 (3–8 June). Across the city, the longest heat wave was recorded in August 2015. The length of this wave ranged from 10 days (6–15 August) at Słoneczna to 17 days (2–18 August) in Dębina and Collegium Minus.
3.4. Heat Waves of 2010 and 2015
3.4.1. Tmax in the Heat Waves
The heatwave lasted from 8–17 July 2010. On 8 July, it started in Collegium Minus and Piekary, while for the rest of the area it was on 9 July. Mean Tmax during the wave ranged from 32.5 °C in Collegium Geographicum and Ławica to 33.7 °C in Dębina. At most points, the highest Tmax was found on 12 July and fluctuated from 33.1 °C at Słoneczna to 35.4 °C in Collegium Minus (Figure 5a). During the heat wave there was a marked cooling on 14 July, caused by the passage of a warm weather front. Then Tmax changed from 30.1 °C at Słoneczna to 32.9 °C in Collegium Minus.
In 2015, the start and end of the heatwave varied across the city. At six points, it began on 2 August, while at three points it only started on 6 August. The end of the heat wave was recorded between 15 and 18 August. The mean Tmax during the wave ranged from 31.9 °C in Ławica to 32.8 °C in Dębina. At all points the highest Tmax was recorded on August 8th, which ranged from 36.8 °C at Słoneczna to 38.3 °C in Świerczewo (Figure 5b).
3.4.2. Daily Air Temperature on 12 July 2010 and 15 August 2015
On 12 July 2010, the course of daily air temperature was found to be similar at all measuring points. The lowest air temperature was observed at 2–3:30 UTC, while the highest temperature was found at 13–15 UTC (Figure 6a). During the day, the air temperature differences between the individual measuring points were lower than at night. In the hours before noon, the range of air temperature fluctuations was less than 2 °C (minimum 1.7 °C at 10:30 UTC), while in the night and early morning they exceeded 5 °C (maximum 5.2 °C at 1:00 UTC). On the aforementioned day the lowest daily amplitude of the air temperature was found at Słoneczna (10.6 °C), while the highest was at Dębina (16.8 °C).
On 11 August 2015, the course of the daily air temperature was similar in all measuring points. The lowest air temperature was observed at 4–4:30 UTC, while the highest temperature was found at 13–15:30 UTC (Figure 6b). During the day, the air temperature differences between the individual measuring points were significantly lower than at night. The smallest differences (about 1.5 °C) occurred in the morning (6:30 UTC) and the afternoon (16:00 UTC), while the largest were in the evening and night hours with a maximum at 21:00 UTC (4.8 °C). On the day analysed, the lowest daily amplitude of air temperature was observed at Słoneczna (12.5 °C), while the largest were in Dębina and Collegium Geographicum (16.3 °C and 16.2 °C, respectively).
3.4.3. Air Temperature and Land Use
To obtain the air temperature on 2 m high above land surface (Tasl) conversion of the land surface temperature (LST) using a linear regression model for two, taking into consideration the days used. The regression equations for 12 July 2010 (1) and 11 August 2015 (2) are:
Tasl = 0.20234 × LST + 24.22906
Tasl = 0.3278714 × LST + 11.68150.
The coefficient of determination (R2) was 0.65 (for probability level p = 0.008467) and 0.68 (for probability level p = 0.01112), respectively, for the first and second day. It should be emphasised that the regression models used are only an attempt to quantify the dependencies (Tasl and LST) according to the limited possibilities of their verification, due to difficulties in obtaining the subsequent observations (a limited number of satellite images).
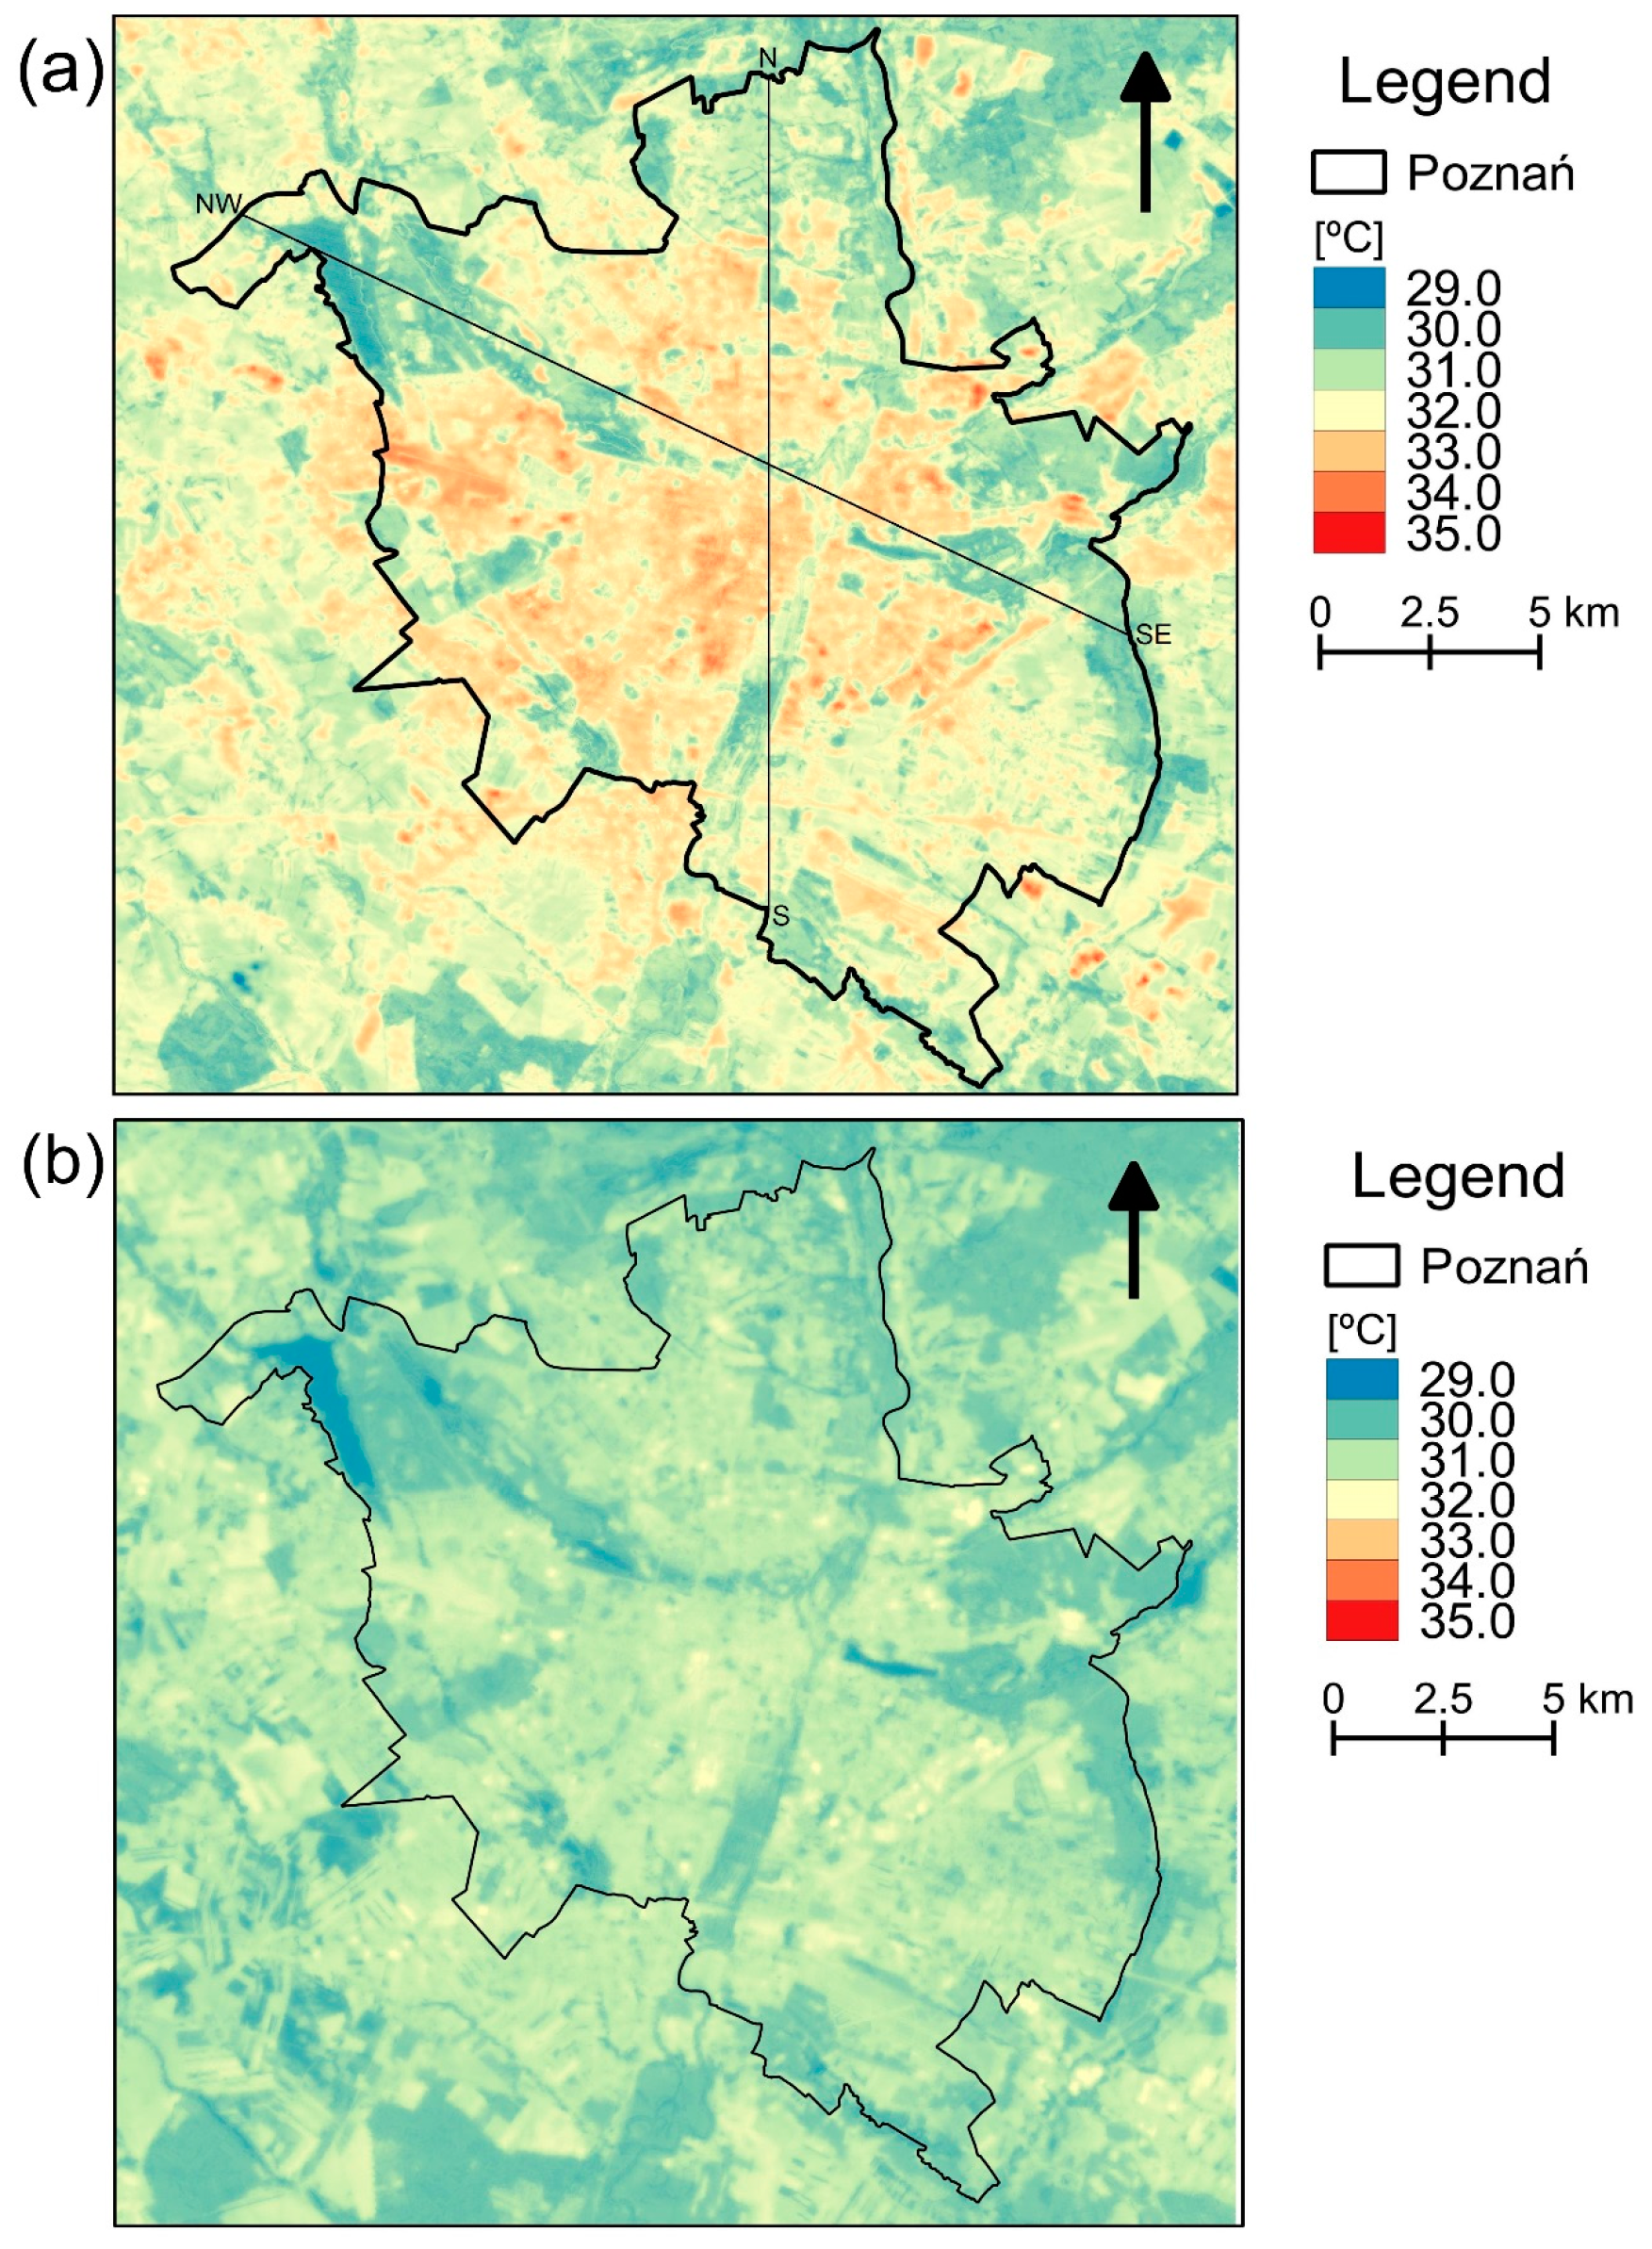
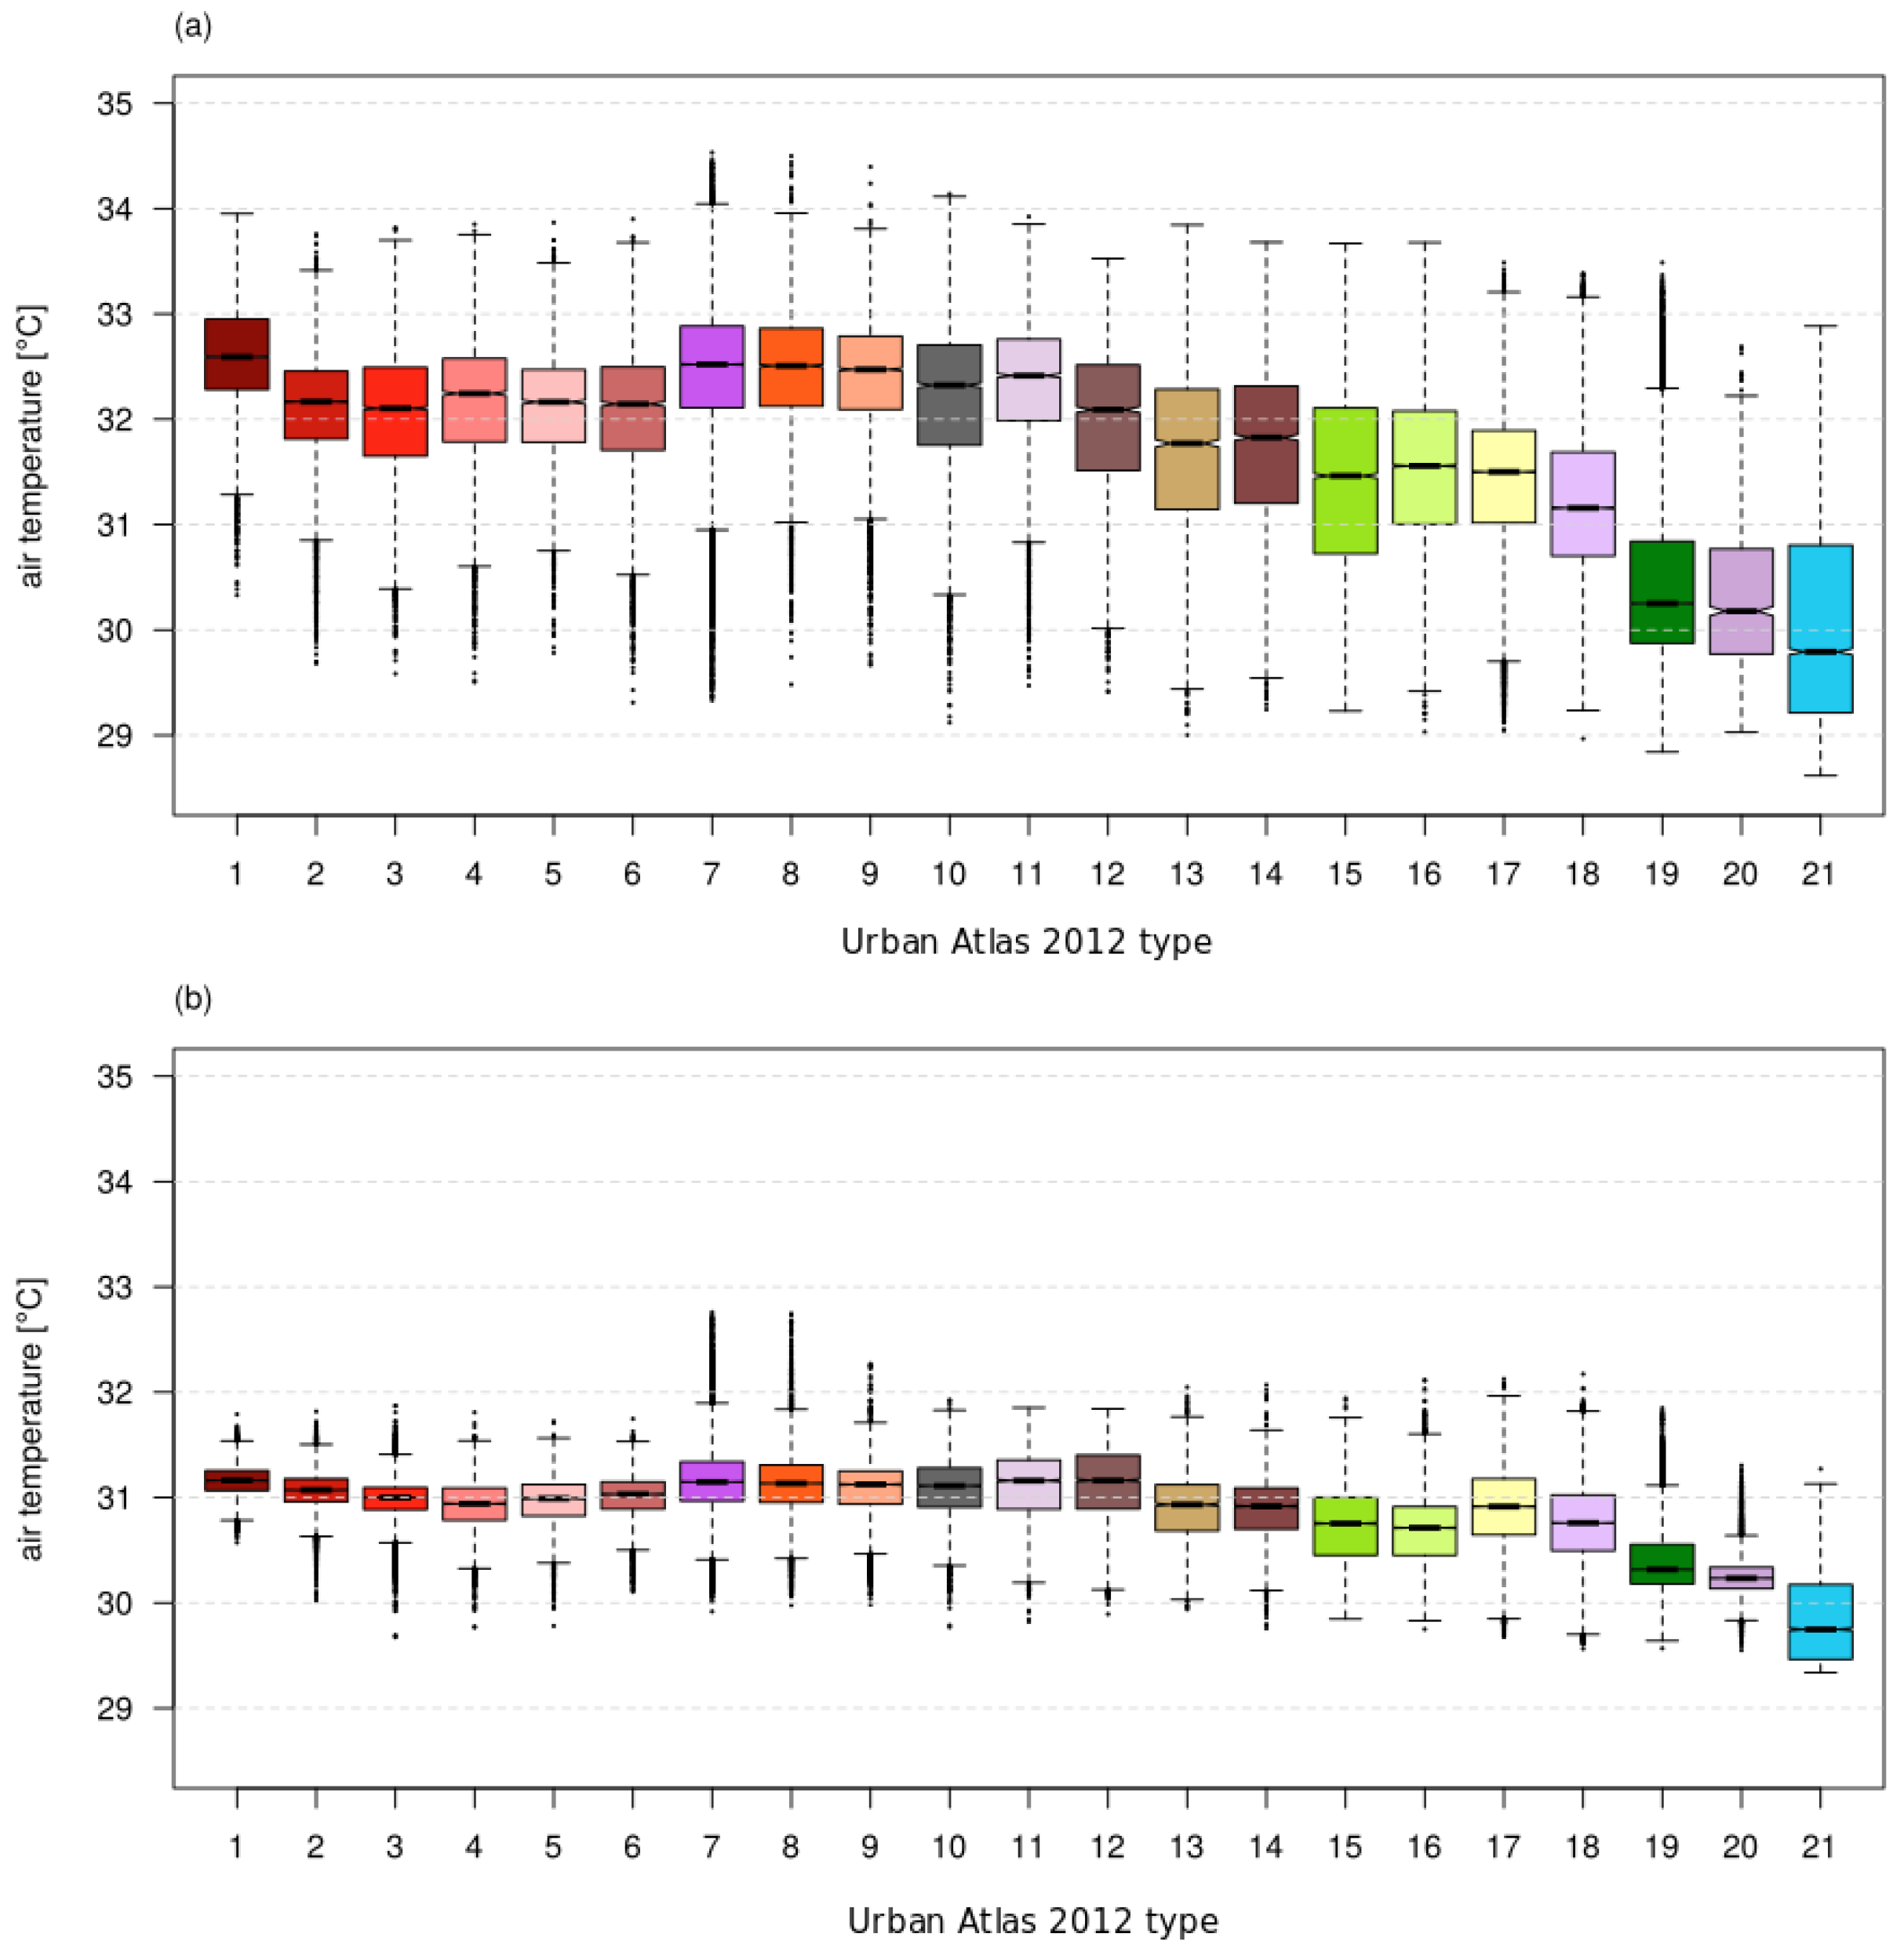
On 12 July 2010 at 9:34 UTC there was a significant diversification of the thermal conditions in the surveyed area (Figure 7a). The spatial distribution of air temperature clearly showed the impact of land development and use. The lowest mean air temperature was 29.8 °C over water bodies, and the highest 32.6 °C, within the industrial and commercial, public, military and private unit areas (Figure 8a). Among the warmest areas in the city were those with continuous urban fabric, industrial and commercial, public, military and private unit areas, fast transit roads and associated land, other roads and associated land, while among the coldest areas were water bodies, herbaceous vegetation associations and forests (Figure 8a).
On 11 August 2015 at 9:34 UTC, there was less variation in air temperature than on 12 July 2010 (Figure 7b). The impact of land development and use on the thermal conditions was significantly weaker. The lowest mean value of air temperature was 29.7 °C over water bodies and the highest, 31.2 °C, in continuous urban fabric, airports and mineral extraction and dump sites (Figure 8b).
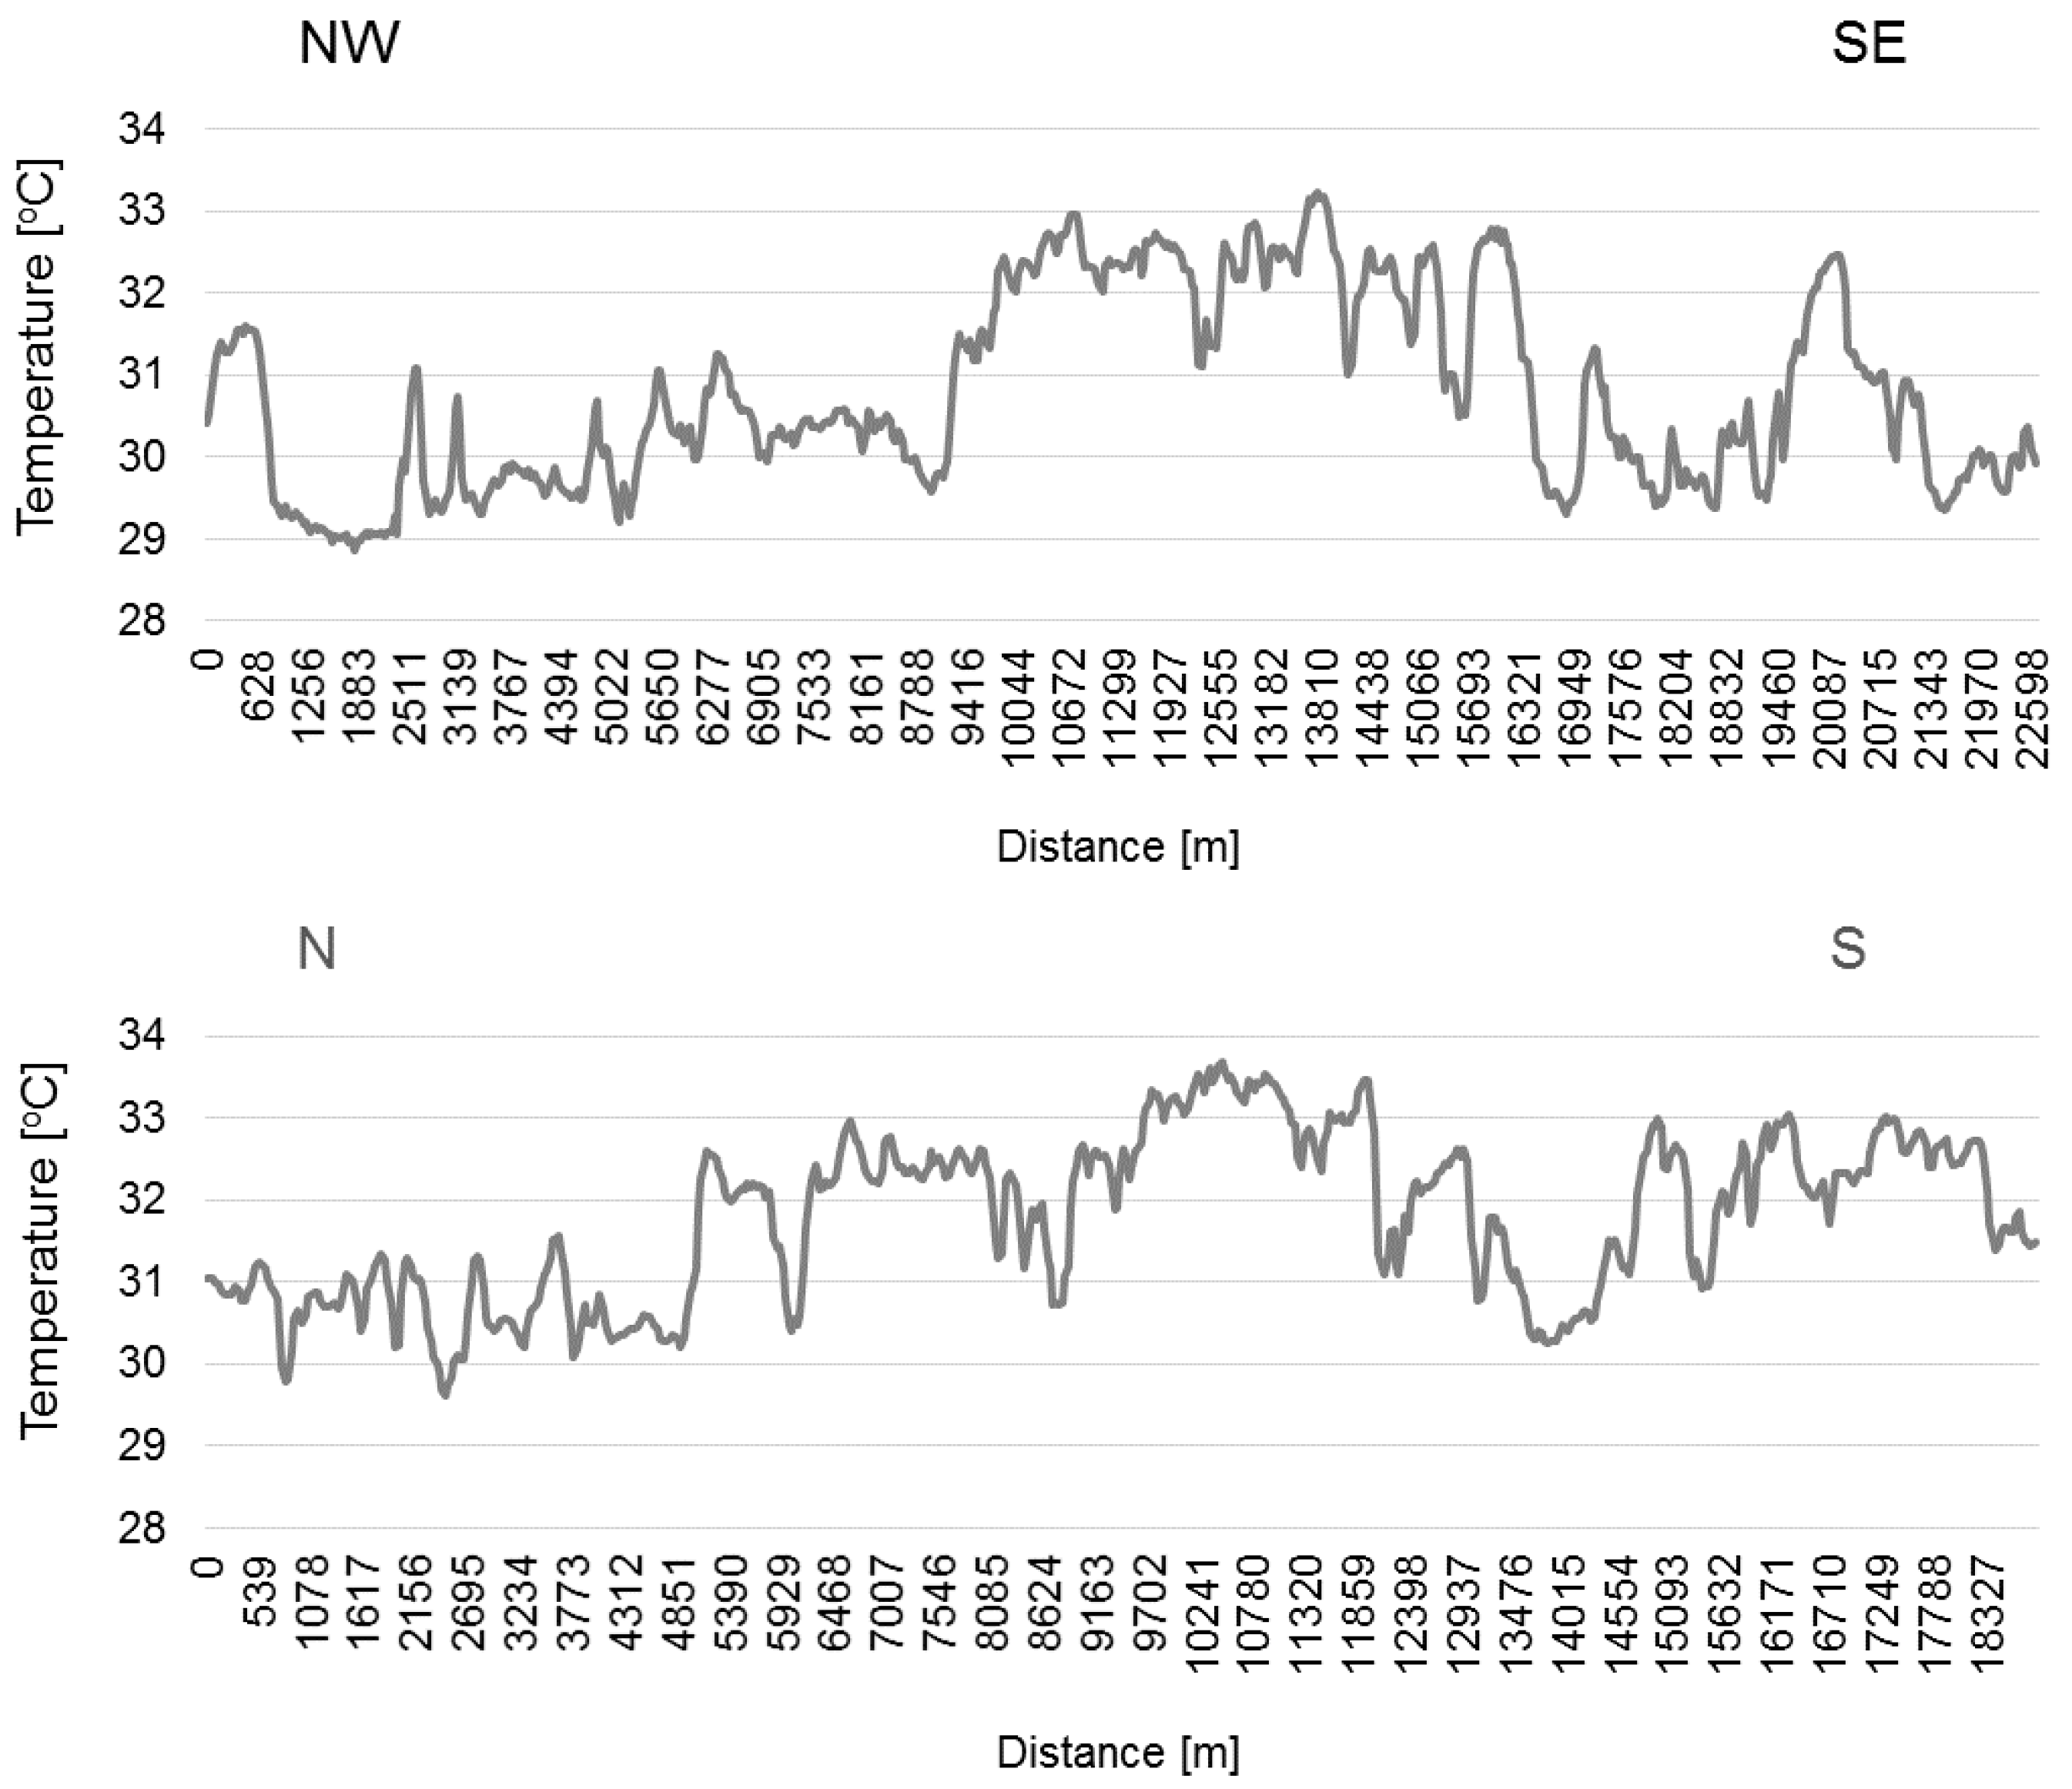
The effect of land use on thermal conditions is evident in the air temperature profile from the northwest of the city to the southeast (about 22 km) (Figure 9). Along the profile, the air temperature varied from 28.9 °C to 33.2 °C. The coldest areas were recorded in the northwestern part of the city, i.e., in the western green wedge area, where Kierskie Lake is situated; then there is a systematic increase in air temperature with a maximum in the city centre (>32.0 °C), where a slightly colder area of the Warta River is also noted.
A significant decrease in the air temperature is observed in forest areas in the eastern part of Poznań, forming the eastern green wedge. In turn, along the profile made along the north–south line (about 19 km length), the air temperature changed from 29.6 °C to 33.7 °C (Figure 9). The coldest areas were found in the northern part of the city, where farmland dominates. A significant increase in air temperature (>32.0 °C) was found in areas with low-density, compact urban development occurring in the Naramowice, Winogrady, Stare Miasto and Wilda housing estates. A clear drop in air temperature was recorded in the Warta River Valley.
3.4.4. Atmospheric Circulation on 12 July 2010 and 11 August 2015
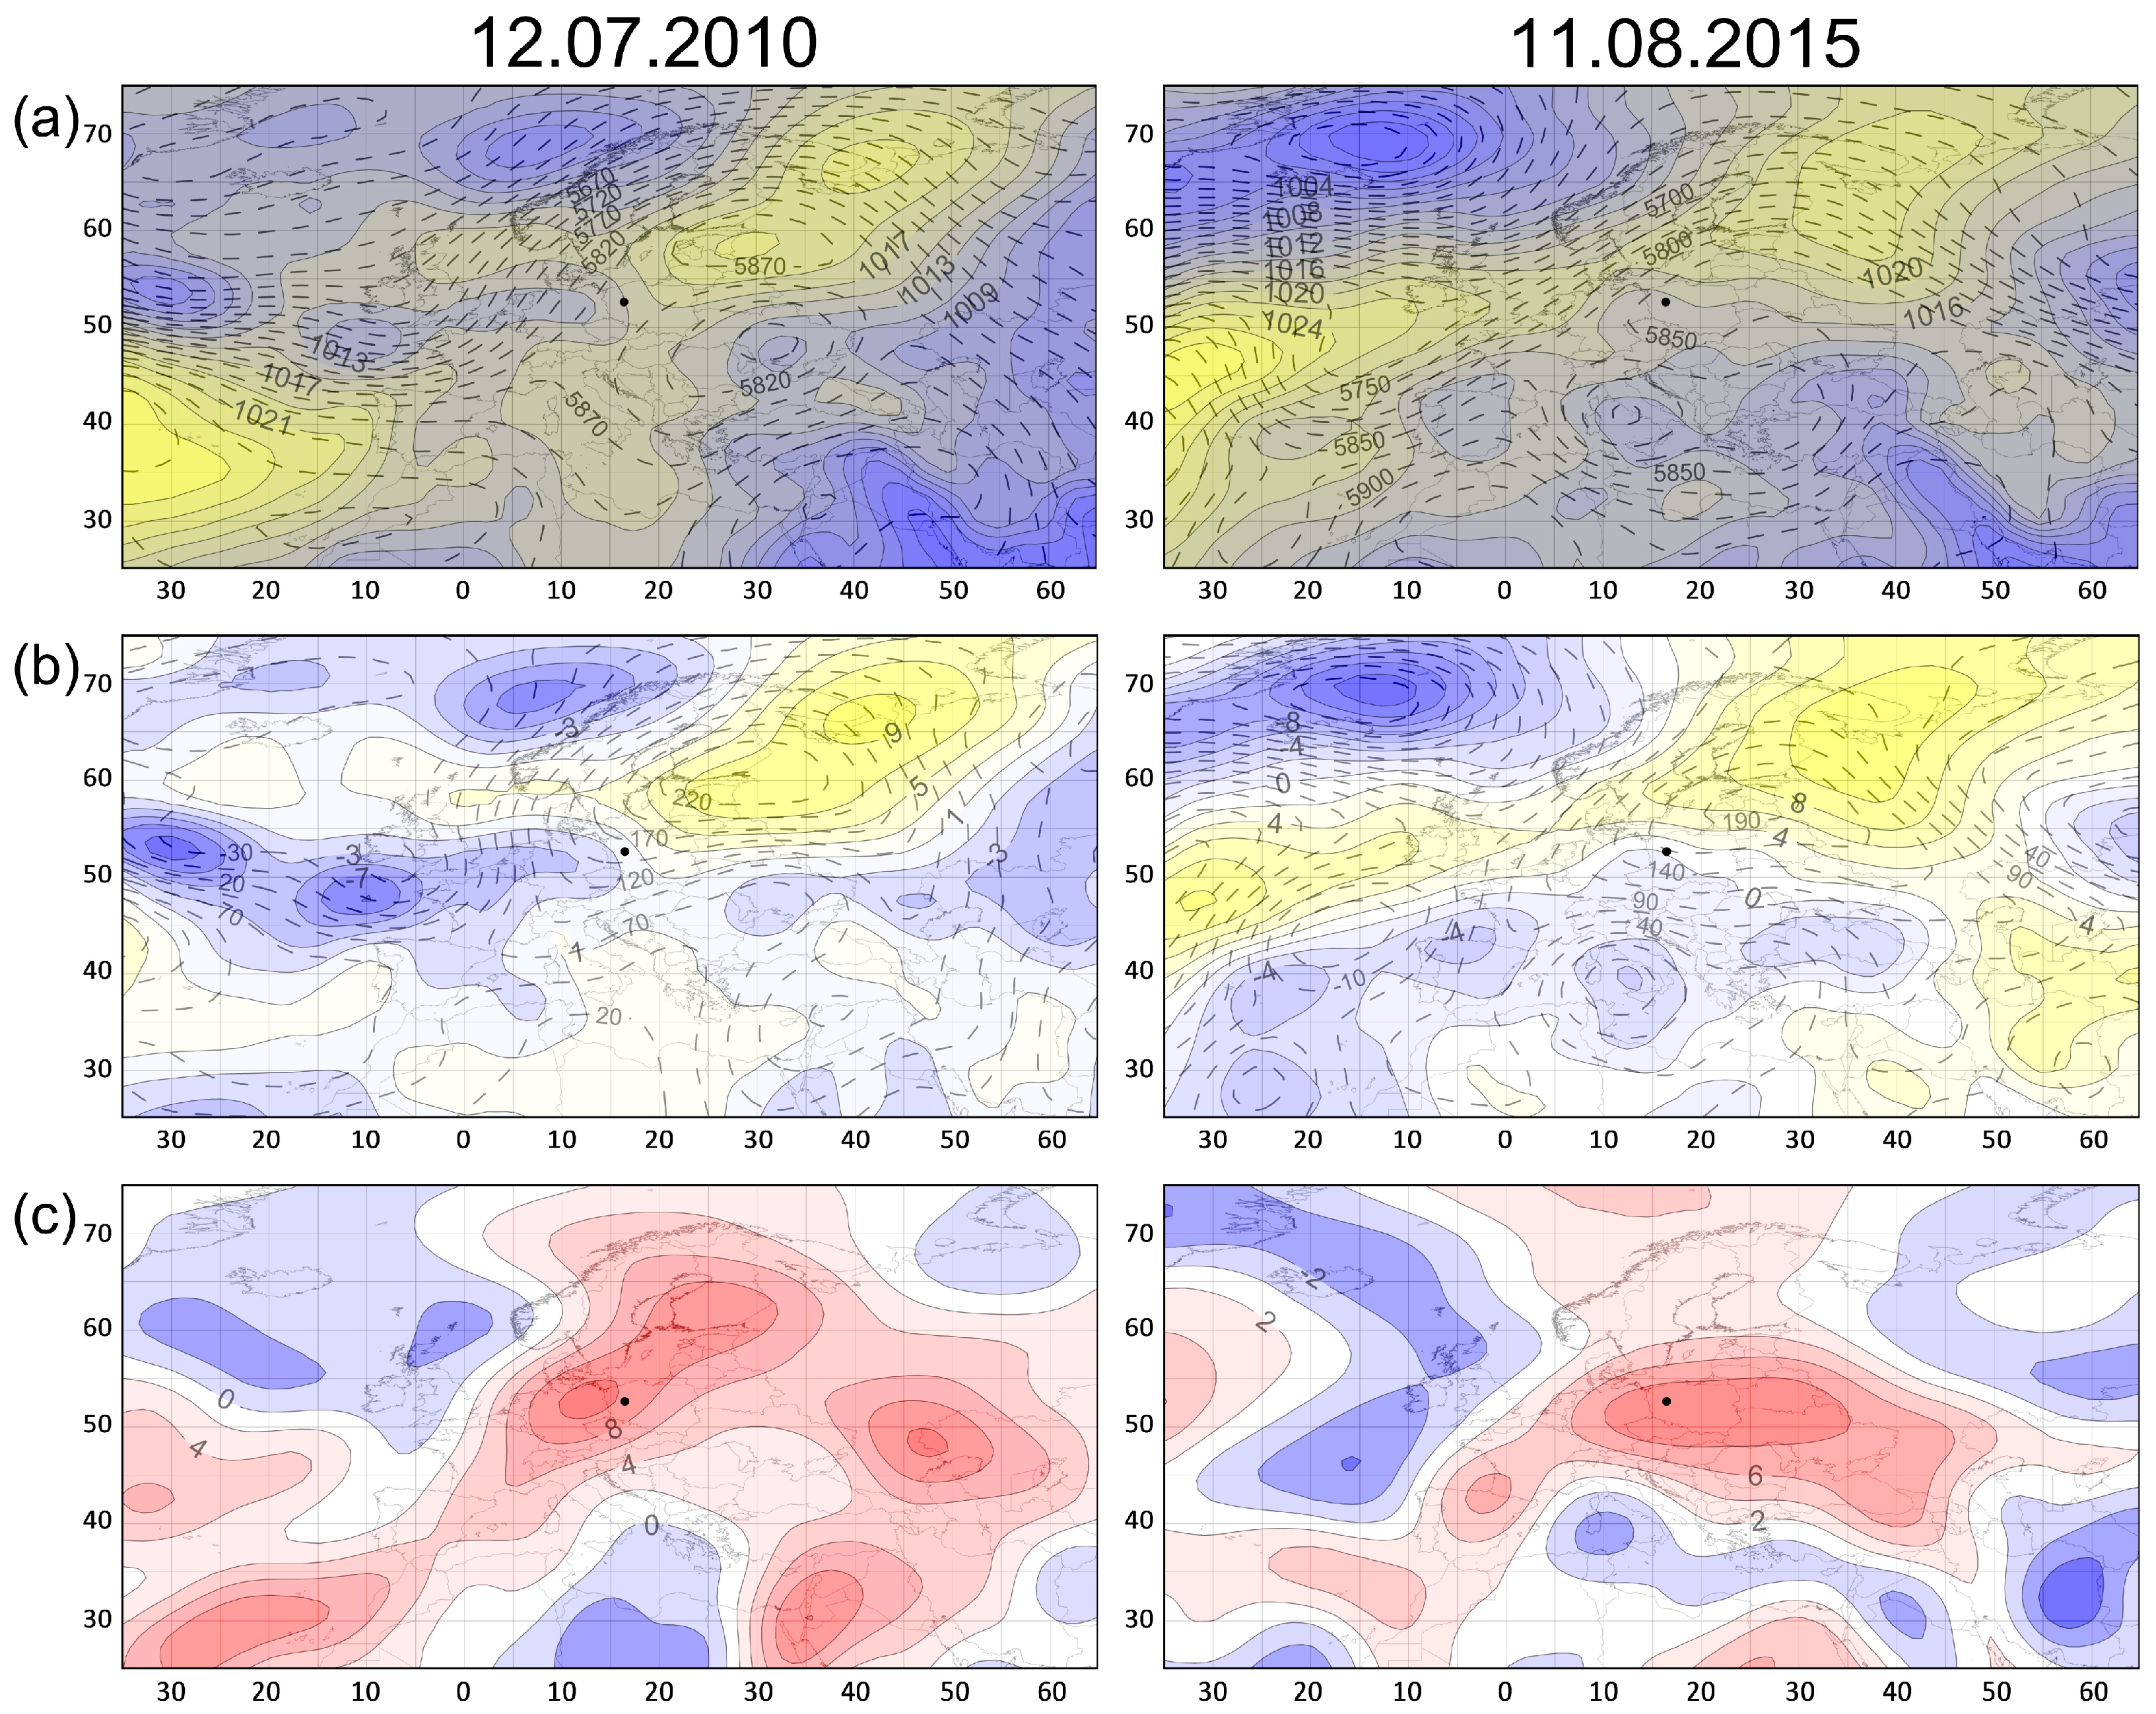
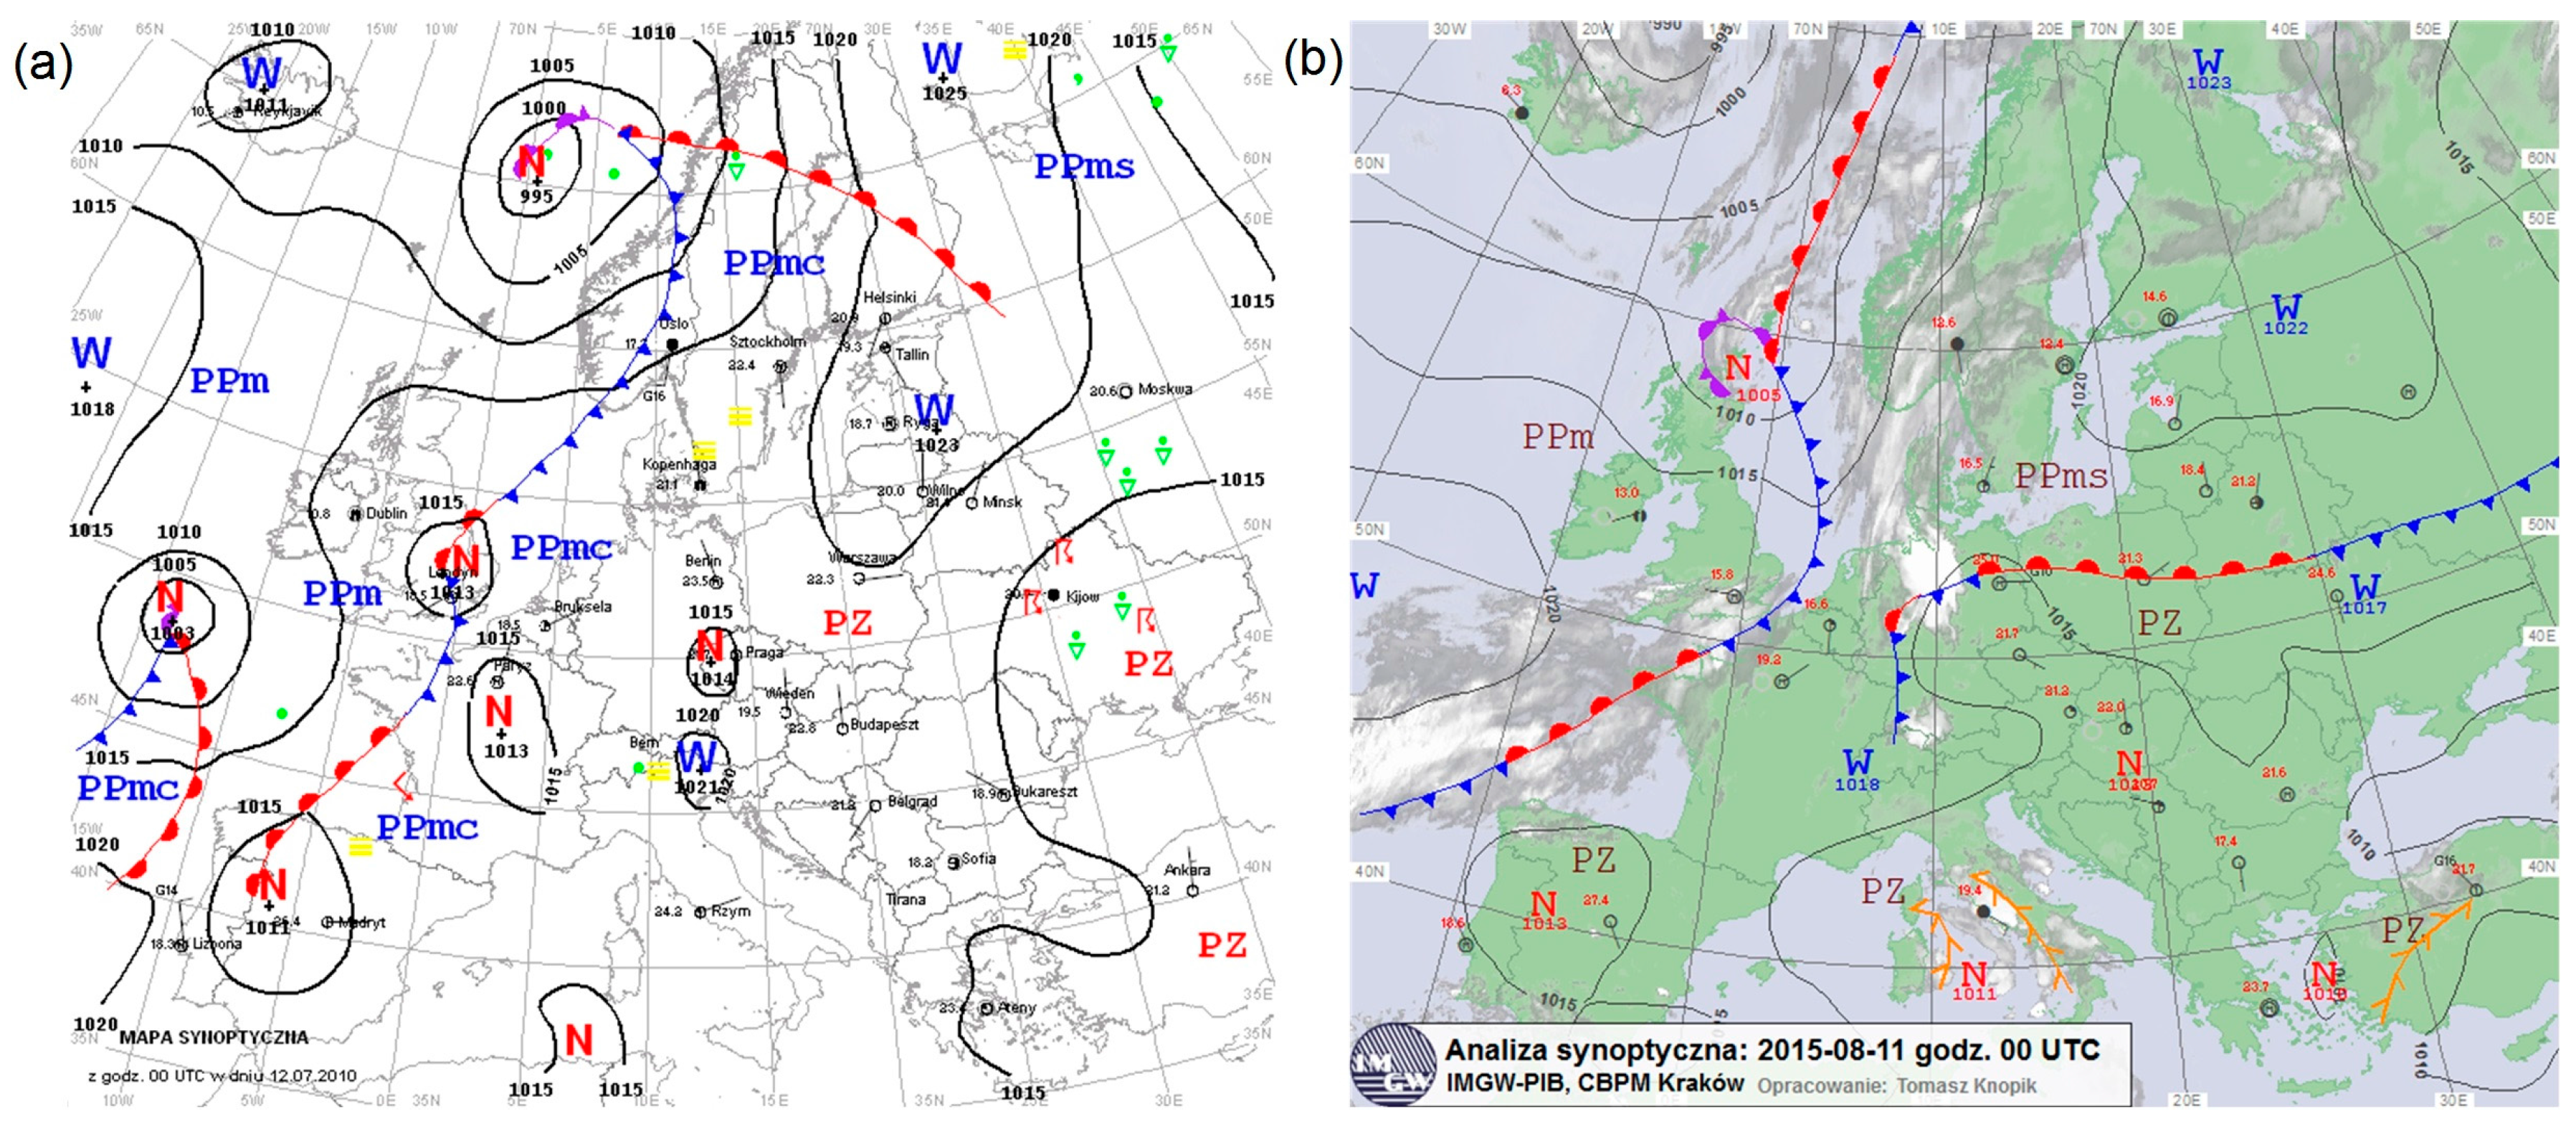
The analysis showed the different effects of land development on the thermal conditions in the city on selected days; the weather situation in Poland occurring on these days was therefore analysed. On 12 July 2010, Poland was within the weak-gradient high-pressure system, while on 11 August 2015 it was within the reach of the trough of low pressure (Figure 10). Both pressure situations provided an influx of warm air masses from the east and southeast sector. Recorded anomalies indicate the presence of warm air masses, whose temperature was higher by more than 8 °C than average in the summer. The 500 hPa isobaric surface on both days over central Poland settled over 140 m higher than average during the summer season. On 11 August, a warm weather front moved from the south to the north of the country, providing the exchange of air masses over the area. Advection of tropical air masses took place after the weather front (Figure 11). The different thermal conditions in the city during the two selected days were due to the differentiation of atmospheric circulation. On 12 July 2010, the air over the city was additionally warmed up by settling for longer over the urban area with anticyclonic weather. In turn, the passage of the weather front on the second of the days analysed resulted in significantly lower temperature values.
4. Discussion
The research showed the Tmax increase in the summer season in Poznań over the last 50 years. The results are consistent with previous studies conducted in Poznań [27,38] and other Polish cities [27,39], as well as in the rest of Europe [38,40,41].
The observed increase in Tmax translated into an increase in the number of hot days and heat waves. Of the exceptionally hot summer seasons in Poznań, one should especially mention the summers of 1992, 1994, 2006 and 2015. Similar results were also obtained in other regions of Poland [42,43,44]. As Sulikowska et al. [27] have shown, the summer of 2015 was exceptionally hot in Poland, especially in the southwest of the country.
In the city districts, there was a great diversification of thermal conditions during the summer season and during the analysed heat waves. The highest air temperature was recorded in heavily transformed areas, i.e., in the developed city centre or industrial and commercial and public areas, while natural areas such as forests and areas near water bodies were characterised by the lowest air temperature. On this basis, within the city, one may distinguish areas with favourable biometeorological conditions during heat waves, such as green wedges, where the air temperature was significantly lower than in the centre and the air temperature differences were several degrees. A similar distribution of areas with highest and lowest temperatures was determined by Majkowska et al. [33] by analysing the urban heat island in Poznań, and Walawender [32], who analysed the urban heat island in Kraków based on satellite images.
In the course of daily air temperature in Poznań, the greater difference between the individual measuring points in the early hours, which gradually decreased during the day, was clearly visible. These differences are due to numerous shadowing effects of urban space and slower heating of the artificial surfaces [11,45,46,47] and faster cooling of natural areas, especially in clear and windless weather [11].
The research conducted using satellite images showed different variations in air temperature in the city area on the days analysed. On the first day, the average air temperature differences in the studied area were 2.8 °C, while on the second day they were smaller and amounted to 1.5 °C. On the second day, there was also less variation in air temperature within the various types of land use. No significant impact of the city’s development on thermal conditions on 11 August 2015 was caused by the exchange of air masses.
This situation was a consequence of the passage of a weather front, while on 12 July 2010 the anticyclonic weather caused tropical air to hold for a few days. When stable pressure systems hold for a longer time, this leads to intensification of thermal conditions in highly transformed areas, which results in deterioration of biometeorological conditions and poses risks to human health and life. This highlights the significant role of atmospheric circulation in shaping weather conditions that can be modified by local factors. Similar results were obtained by Półrolniczak et al. [48], who demonstrated that the greatest intensity of the urban heat island is at night, especially during anti-cyclone circulation.
5. Conclusions
The results of the research conducted thus show how diverse thermal conditions occur in the city and how in particular types of land use they may be compared to those recorded at the meteorological station representing the mesoclimatic conditions (Poznań–Ławica). As the article has demonstrated, this diversity may result from the dissimilarity of a given part of the city due to the type of land development, but also it may result from meteorological conditions, i.e., barometric situation and the passage of atmospheric fronts, as well as advection or settling of the same air mass for a long time. The correct recognition of dependencies governing the occurrence of extreme phenomena in the city, such as heat waves, will hence translate into the possibility of more accurate forecasting of this phenomenon, which may consequently have a considerable social dimension.
Acknowledgements
This work was supported by the Polish National Science Centre under grant number UMO-2014/15/N/ST10/00717.
Author Contributions
Marek Półrolniczak prepared satellite images, conducted the analysis of land surface cover and its influence on LST and air temperature in the city and complemented the description of the results. Arkadiusz M. Tomczyk inspired and carried out the research as well as prepared the manuscript. Leszek Kolendowicz assisted with the results and discussion. Leszek Kolendowicz and Marek Półrolniczak have delivered temperature data from Climatology Department measurement net located in the Poznań area.
Conflicts of Interest
The authors declare no conflict of interest.
References
- IPCC. Climate Change 2013: The Physical Science Basis. Contribution of Working Group I to the Fifth Assessment Report of the Intergovernmental Panel in Climate Change; Cambridge University Press: Cambridge, UK, 2013. [Google Scholar]
- Lhotka, O.; Kyselý, J. Characterizing joint effects of spatial extent, temperature magnitude and duration of heat waves and cold spells over Central Europe. Int. J. Climatol. 2015, 35, 1232–1244. [Google Scholar] [CrossRef]
- Keggenhoff, I.; Elizbarashvili, M.; King, L. Heat Wave Events over Georgia since 1961: Climatology, Changes and Severity. Climate 2015, 3, 308–328. [Google Scholar] [CrossRef]
- Unkašević, M.; Tošić, I. Seasonal analysis of cold and heat waves in Serbia during the period 1949–2012. Theor. Appl. Climatol. 2015, 120, 29–40. [Google Scholar] [CrossRef]
- Tomczyk, A.M. Hot weather in Potsdam in the years 1896–2015. Meteorol. Atmos. Phys. 2017. [Google Scholar] [CrossRef]
- Tomczyk, A.M.; Sulikowska, A. Heat waves in lowland Germany and their circulation-related conditions. Meteorol. Atmos. Phys. 2017. [Google Scholar] [CrossRef]
- Koffi, B.; Koffi, E. Heat waves across Europe by the end of the 21st century: Multiregional climate simulations. Clim. Res. 2008, 36, 153–168. [Google Scholar] [CrossRef]
- Kyselý, J. Recent severe heat waves in central Europe: How to view them in a long-term prospect? Int. J. Climatol. 2010, 30, 89–109. [Google Scholar] [CrossRef]
- Piniewski, M.; Mezghani, A.; Szcześniak, M.; Kundzewicz, Z. Regional projections of temperature and precipitation changes: Robustness and uncertainty aspects. Meteorol. Z. 2017, 26, 223–234. [Google Scholar] [CrossRef]
- Luber, G.; McGeehin, M. Climate change and extreme heat events. Am. J. Prev. Med. 2008, 35, 429–435. [Google Scholar] [CrossRef] [PubMed]
- Błażejczyk, K.; Kuchcik, M.; Milewski, P.; Dudek, W.; Kręcisz, B.; Błażejczyk, A.; Szmyd, J.; Degórska, B.; Pałczyński, C. Urban Heat Island in Warsaw—Climatic and Urban Conditionings; Wyd. Akademickie SEDNO: Warszawa, Poland, 2014; ISBN 978-83-7963-018-9. [Google Scholar]
- Gabriel, K.M.A.; Endlicher, W.R. Urban and rural mortality rates during heat waves in Berlin and Brandenburg, Germany. Environ. Pollut. 2011, 159, 2044–2050. [Google Scholar] [CrossRef] [PubMed]
- Kuchcik, M. Mortality in Warsaw: Is there any connection with Feather and air pollution? Geogr. Pol. 2011, 74, 29–45. [Google Scholar]
- D'lppoliti, D.; Michelozzi, P.; Marino, C.; De’Donato, F.; Menne, B.; Katsouyanni, K.; Kirchmayer, U.; Analitis, A.; Medina-Ramón, M.; Paldy, A.; et al. The impact of heat waves on mortality in 9 European cities: Results from the EuroHEAT project. Environ. Health 2010, 9. [Google Scholar] [CrossRef]
- Vandentorren, S.; Suzan, R.; Medina, S.; Pascal, M.; Maulpoix, A.; Cohen, J.C.; Ledrans, M. Mortality in 13 French cities during the August 2003 heat wave. Am. J. Public Health 2004, 94, 1518–1520. [Google Scholar] [CrossRef] [PubMed]
- Kawashima, S.; Ishida, T.; Minomura, M.; Miwa, T. Relations between surface temperature and air temperature on a local scale during winter nights. J. Appl. Meteorol. Climatol. 2000, 39, 1570–1579. [Google Scholar] [CrossRef]
- Voogt, J.A.; Oke, T.R. Thermal remote sensing of urban climates. Remote Sens. Environ. 2003, 86, 370–384. [Google Scholar] [CrossRef]
- Sun, Y.J.; Wang, J.F.; Zhang, R.H.; Gillies, R.R.; Xue, Y.; Bo, Y.C. Air temperature retrieval from remote sensing data based on thermodynamics. Theor. Appl. Climatol. 2005, 80, 37–48. [Google Scholar] [CrossRef]
- Dobrovolny, P. The surface urban heat island in the city of Brno (Czech Republic) derived from land surface temperatures and selected reasons for its spatial variability. Theor. Appl. Climatol. 2013, 112, 89–98. [Google Scholar] [CrossRef]
- Schwarz, N.; Schlink, U.; Franck, U.; Grossmann, K. Relationship of land surface and air temperature and its implications for quantifying urban heat island indicators—An application for the city of Leipzig (Germany). Ecol. Indic. 2012, 18, 693–704. [Google Scholar] [CrossRef]
- Ptak, M.; Choiński, A.; Piekarczyk, J.; Pryłowski, T. Applying Landsat Satellite Thermal Images in the Analysis of Polish Lake Temperatures. Pol. J. Environ. Stud. 2017, 26, 2159–2165. [Google Scholar] [CrossRef]
- United Nations. World Population Prospects 2017. Available online: https://esa.un.org/unpd/wpp/Publications/Files/WPP2017_KeyFindings.pdf (accessed on 5 November 2017).
- Główny Urząd Statystyczny. Rocznik Statystyczny Rzeczypospolitej Polskiej 2015. Available online: https://stat.gov.pl/obszary-tematyczne/roczniki-statystyczne/roczniki-statystyczne/rocznik-statystyczny-rzeczypospolitej-polskiej-2015,2,10.html (accessed on 5 November 2017).
- Woś, A. Climate of Poland in the Second Half of the 20th Century; Wyd. Naukowe UAM: Poznań, Poland, 2010; ISBN 978-83-232-2180-7. [Google Scholar]
- Abaurrea, J.; Asín, J.; Cebrián, A.; Centelles, A. Modeling and forecasting extreme heat events in the central Ebro valley, a continental-mediterranean area. Glob. Planet Chang. 2007, 57, 43–58. [Google Scholar] [CrossRef]
- Rey, G.; Jougla, E.; Fouillet, A.; Pavillon, G.; Bessemoulin, P.; Frayssinet, P.; Clavel, J.; Hémon, D. The impact of major heat waves on all-cause and cause specific mortality in France 1971–2003. Int. Arch. Occup. Environ. Health 2007, 80, 615–626. [Google Scholar] [CrossRef] [PubMed]
- Sulikowska, A.; Wypych, A.; Woszczek, I. The 2015 summer heatwaves in Poland and their synoptic background. Badania Fizjograficzne Seria A Geografia Fizyczna 2016, 67, 205–223. [Google Scholar]
- Tomczyk, A.M.; Półrolniczak, M.; Bednorz, E. Circulation Conditions’ Effect on the Occurrence of Heat Waves in Western and Southwestern Europe. Atmosphere 2017, 8, 31. [Google Scholar] [CrossRef]
- Salmi, T.; Maiittii, A.; Anttila, P.; Ruoho-Airola, T.; Amnel, T. Detecting Trends of Annual Values of Atmospheric Pollutants by the Mann-Kendall Test and Sen’s Slope Estimates—The Excel Template Application MAKESENS; Publications on Air Quality No. 31; Finnish Meteorological Institute: Helsinki, Finland, 2002; pp. 1–35.
- Sobrino, J.A.; Raissouni, N. Toward remote sensing methods for land cover dynamic monitoring: Application to Morocco. Int. J. Remote Sens. 2000, 21, 353–366. [Google Scholar] [CrossRef]
- Jiménez-Muñoz, J.C.; Sobrino, J.A. A generalized single-channel method for retrieving land surface temperature from remote sensing data. J. Geophys. Res. 2003, 108, 4688. [Google Scholar] [CrossRef]
- Walawender, J. Application of LANDSAT satellite data and GIS techniques for estimation of thermal conditions in urban area (using an example of Krakow agglomeration). Prace Geogr. 2009, 122, 81–98. [Google Scholar]
- Majkowska, A.; Kolendowicz, L.; Półrolniczak, M.; Hauke, J.; Czernecki, B. The urban heat island in the city of Poznań as derived from Landsat 5 TM. Theor. Appl. Climatol. 2017, 128, 769–783. [Google Scholar] [CrossRef]
- Kalnay, E.; Kanamistu, M.; Kistler, R.; Collins, W.; Deaven, D.; Gandin, L.; Iredell, M.; Saha, S.; White, G.; Woollen, J.; et al. The NMC/NCAR 40-Year Reanalysis Project. Bull. Am. Meteorol. Soc. 1996, 77, 437–471. [Google Scholar] [CrossRef]
- Urban Atlas 2012. Available online: https://www.eea.europa.eu/data-and-maps/data/urban-atlas (accessed on 5 December 2017).
- Hijmans, R.J. Raster: Geographic Data Analysis and Modeling. R Package Version 2.5-8. 2016. Available online: http://CRAN.R-project.org/package=raster (accessed on 5 December 2017).
- Bivand, R.; Keitt, T.; Rowlingson, B. Rgdal: Bindings for the Geospatial Data Abstraction Library. R Package Version 1.1-10. 2016. Available online: http://CRAN.R-project.org/package=rgdal (accessed on 5 December 2017).
- Tomczyk, A.M. Circulation-related conditioning of the occurrence of heatwaves in Poznań. Prz. Geogr. 2014, 86, 41–52. [Google Scholar] [CrossRef]
- Tomczyk, A.M.; Bednorz, E. Heat waves in Central Europe and their circulation conditions. Int. J. Climatol. 2016, 36, 770–782. [Google Scholar] [CrossRef]
- Vidal, J.P.; Martin, E.; Franchisteguy, L.; Baillon, M.; Soubeyroux, J.M. A 50-year high-resolution atmospheric reanalysis over France with the Safran system. Int. J. Climatol. 2010, 30, 1627–1644. [Google Scholar] [CrossRef] [Green Version]
- Del Río, S.; Cano-Ortiz, A.; Herrero, N.; Penas, A. Recent trends in mean maximum and minimum air temperatures over Spain (1961–2006). Theor. Appl. Climatol. 2012, 109, 605–626. [Google Scholar] [CrossRef]
- Wibig, J.; Podstawczyńska, A.; Rzepa, M.; Piotrowski, P. Heatwaves in Poland—Frequency, trends and relationships with atmospheric circulation. Geogr. Pol. 2009, 82, 33–46. [Google Scholar] [CrossRef]
- Porębska, M.; Zdunek, M. Analysis of extreme temperature events in Central Europe related to high pressure blocking situations in 2001–2011. Meteorol. Z. 2013, 22, 533–540. [Google Scholar] [CrossRef]
- Wypych, A.; Sulikowska, A.; Ustrnul, Z.; Czekierda, D. Temporal Variability of Summer Temperature Extremes in Poland. Atmosphere 2017, 8, 51. [Google Scholar] [CrossRef]
- Landsberg, H.E. The Urban Climate; Academic Press: New York, NY, USA, 1981. [Google Scholar]
- Oke, T.R. The energetic basis of the urban heat island. Q. J. R. Meteorol. Soc. 1982, 108, 1–24. [Google Scholar] [CrossRef]
- Voogt, J.A. Urban heat island. In Encyclopedia of Global Environmental Change, 3rd ed.; Munn, T., Ed.; Wiley: Chichester, UK, 2002; pp. 660–666. [Google Scholar]
- Półrolniczak, M.; Kolendowicz, L.; Majkowska, A.; Czernecki, B. The influence of atmospheric circulation on the intensity of urban heat island and urban cold island in Poznań, Poland. Theor. Appl. Climatol. 2017, 127, 611–625. [Google Scholar] [CrossRef]
Figure 1.
Location of measuring points against the type of land use (Urban Atlas 2012).

Figure 2.
Average Tmax in the summer season in Poznań–Ławica in the years 1966–2015.
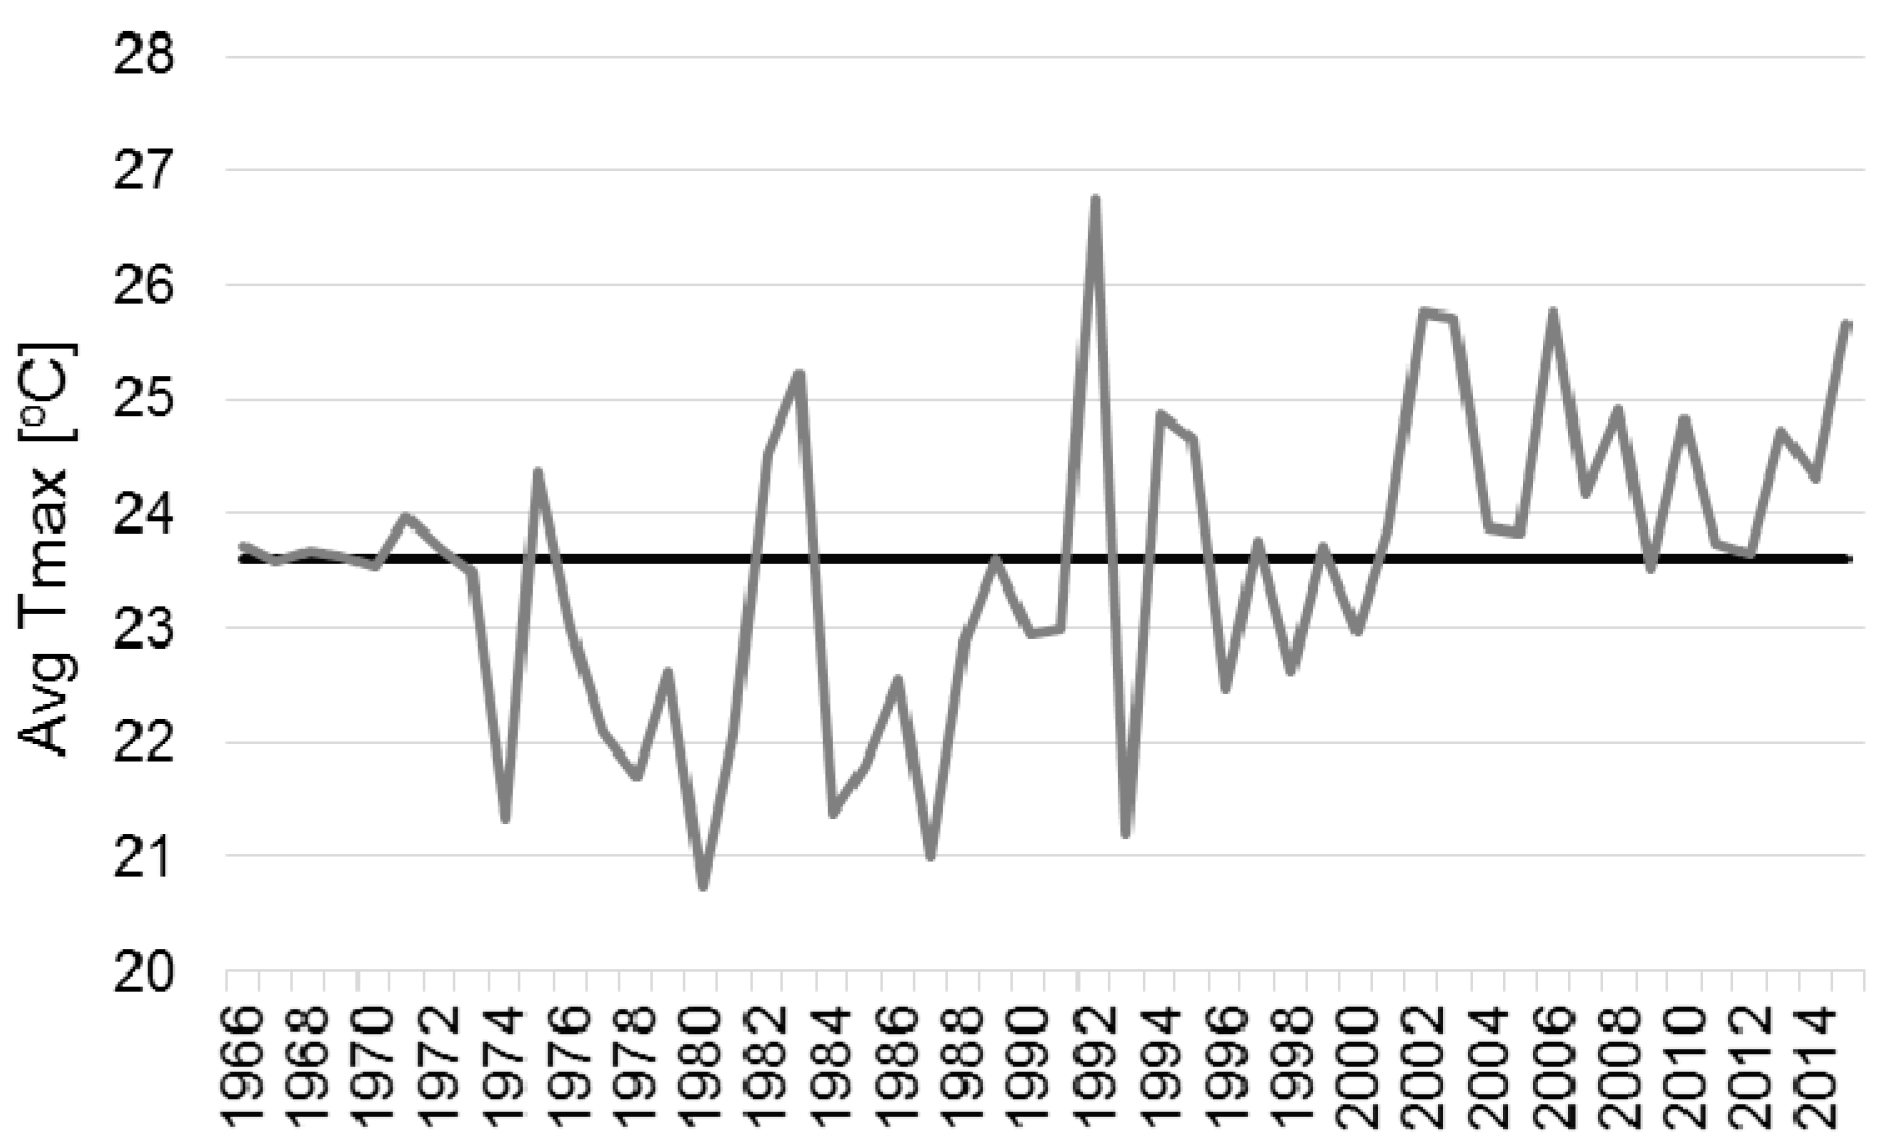
Figure 3.
Number of hot days in 1966–2015 and the frequency of hot days’ occurrence in certain months.
Figure 3.
Number of hot days in 1966–2015 and the frequency of hot days’ occurrence in certain months.

Figure 4.
Average Tmax in the summer season and the number of hot days in 2008–2015 in the city area.
Figure 4.
Average Tmax in the summer season and the number of hot days in 2008–2015 in the city area.

Figure 5.
Tmax during the heat wave of 8–17 July 2010 (a) and 2–18 August 2015 (b).
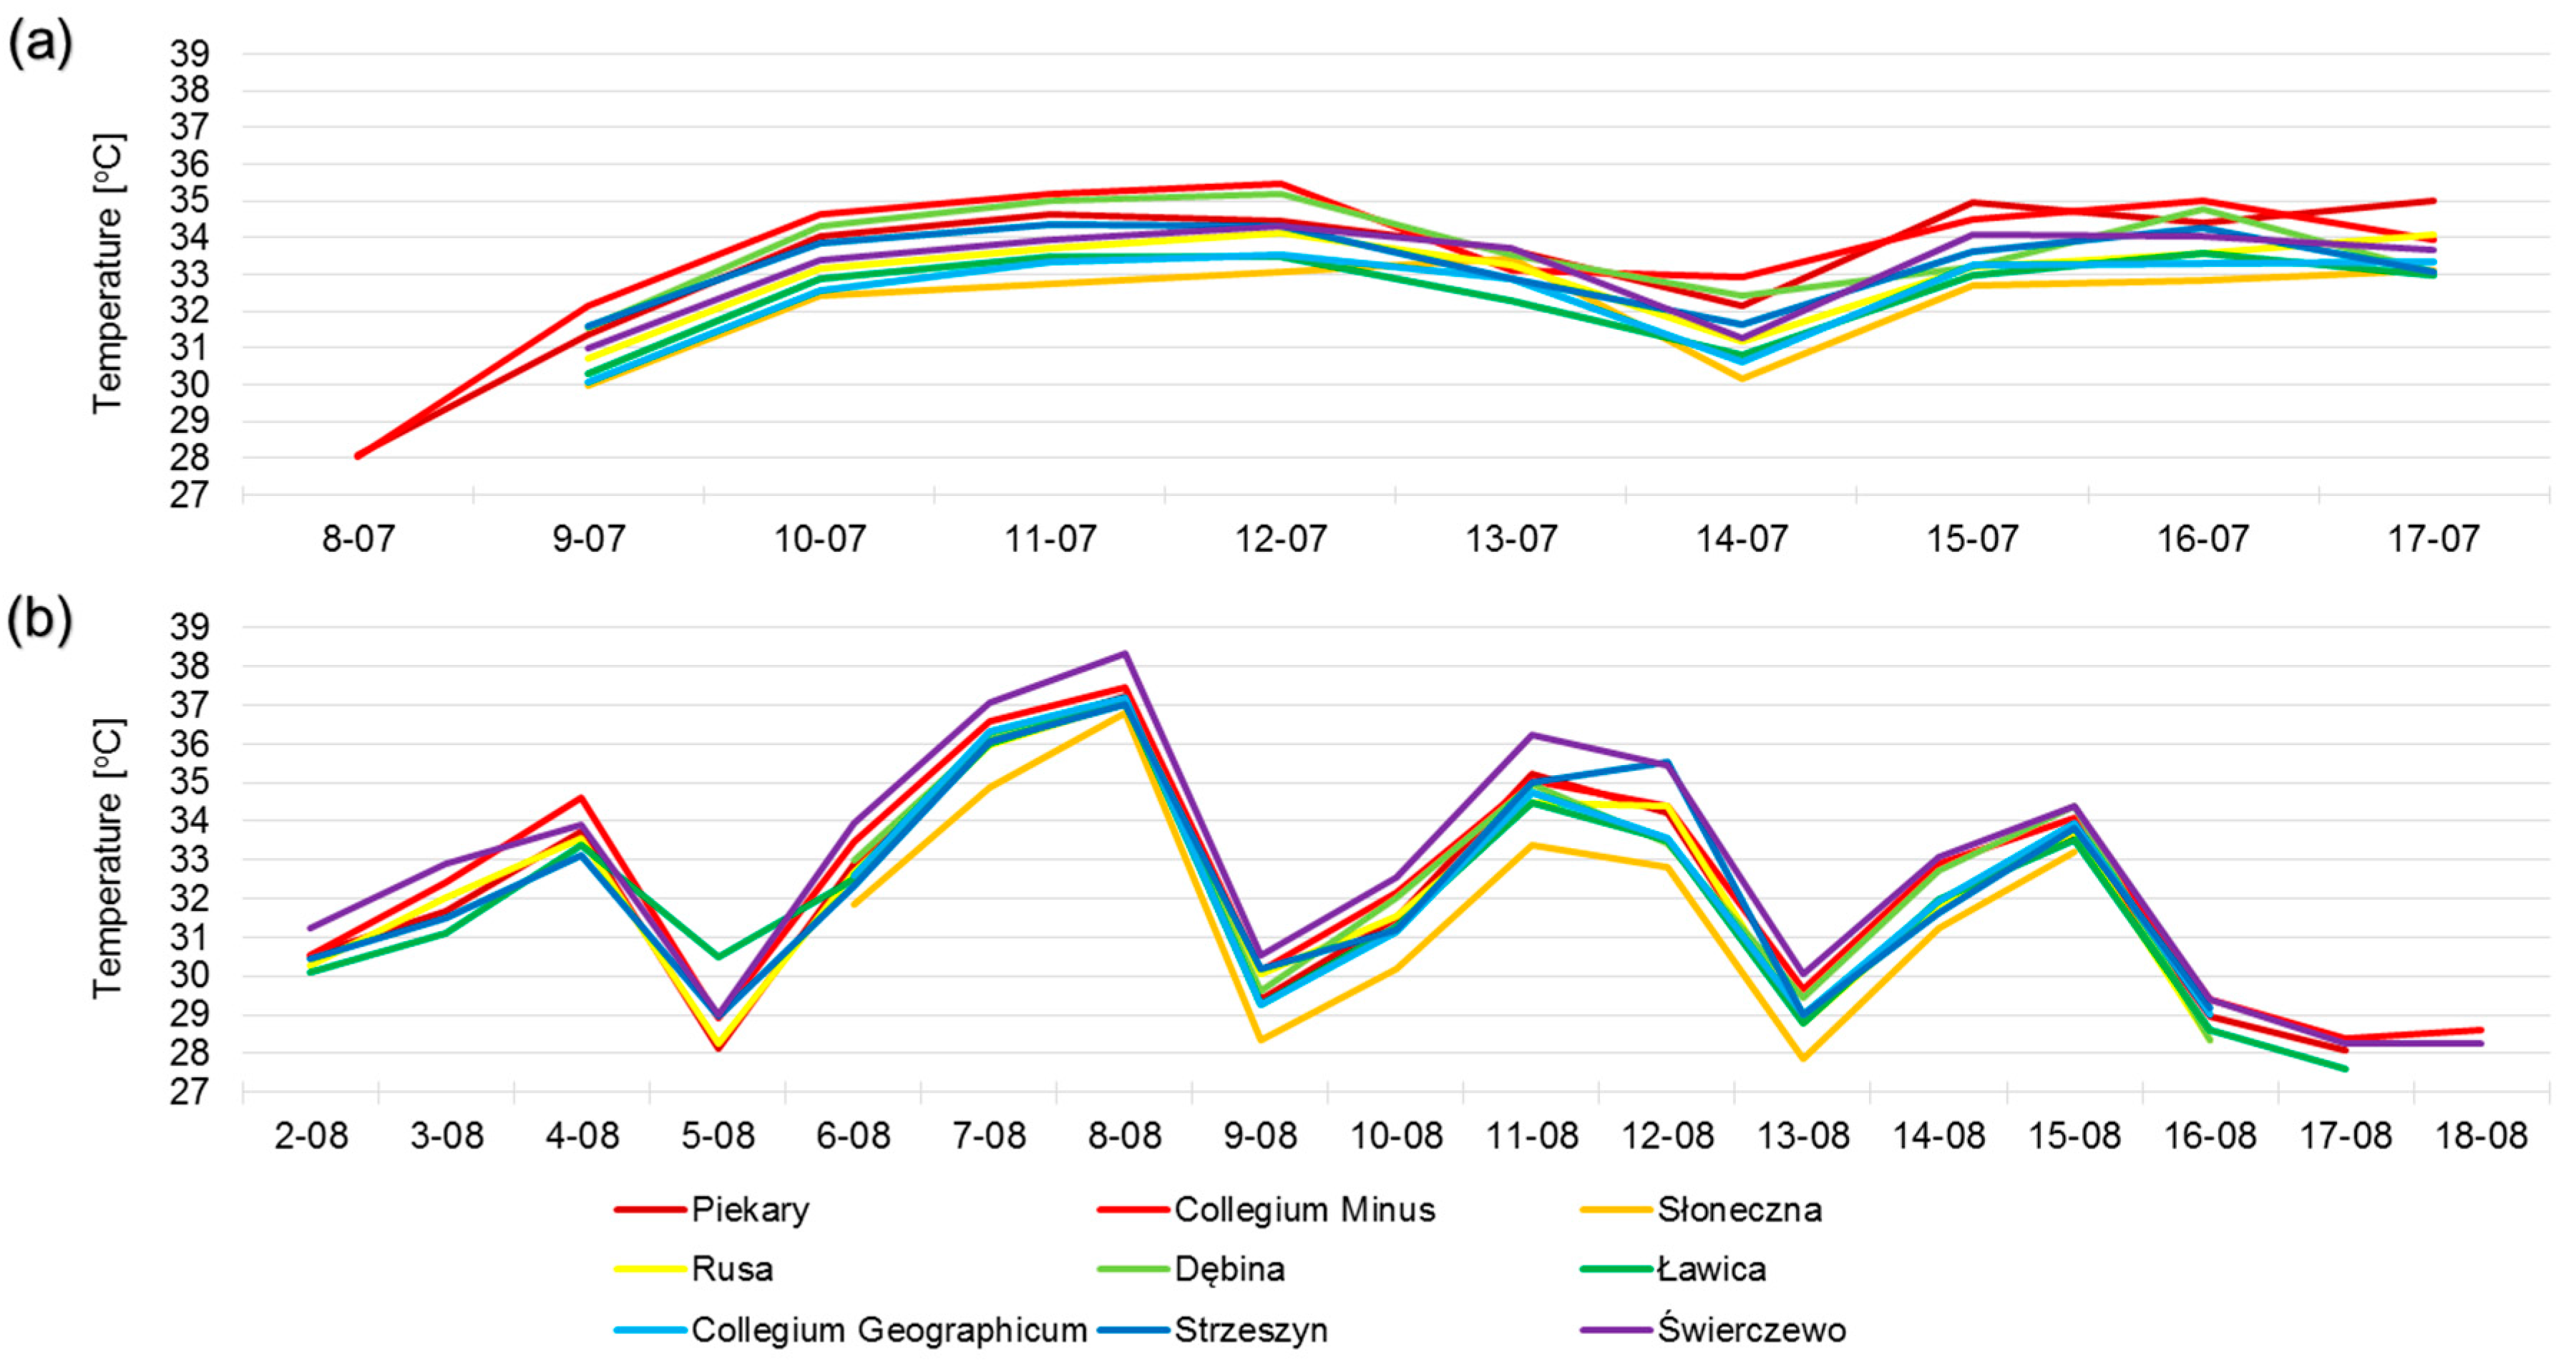
Figure 6.
Daily course of air temperature in Poznań on 12 July 2010 (a) and 11 August 2015 (b).
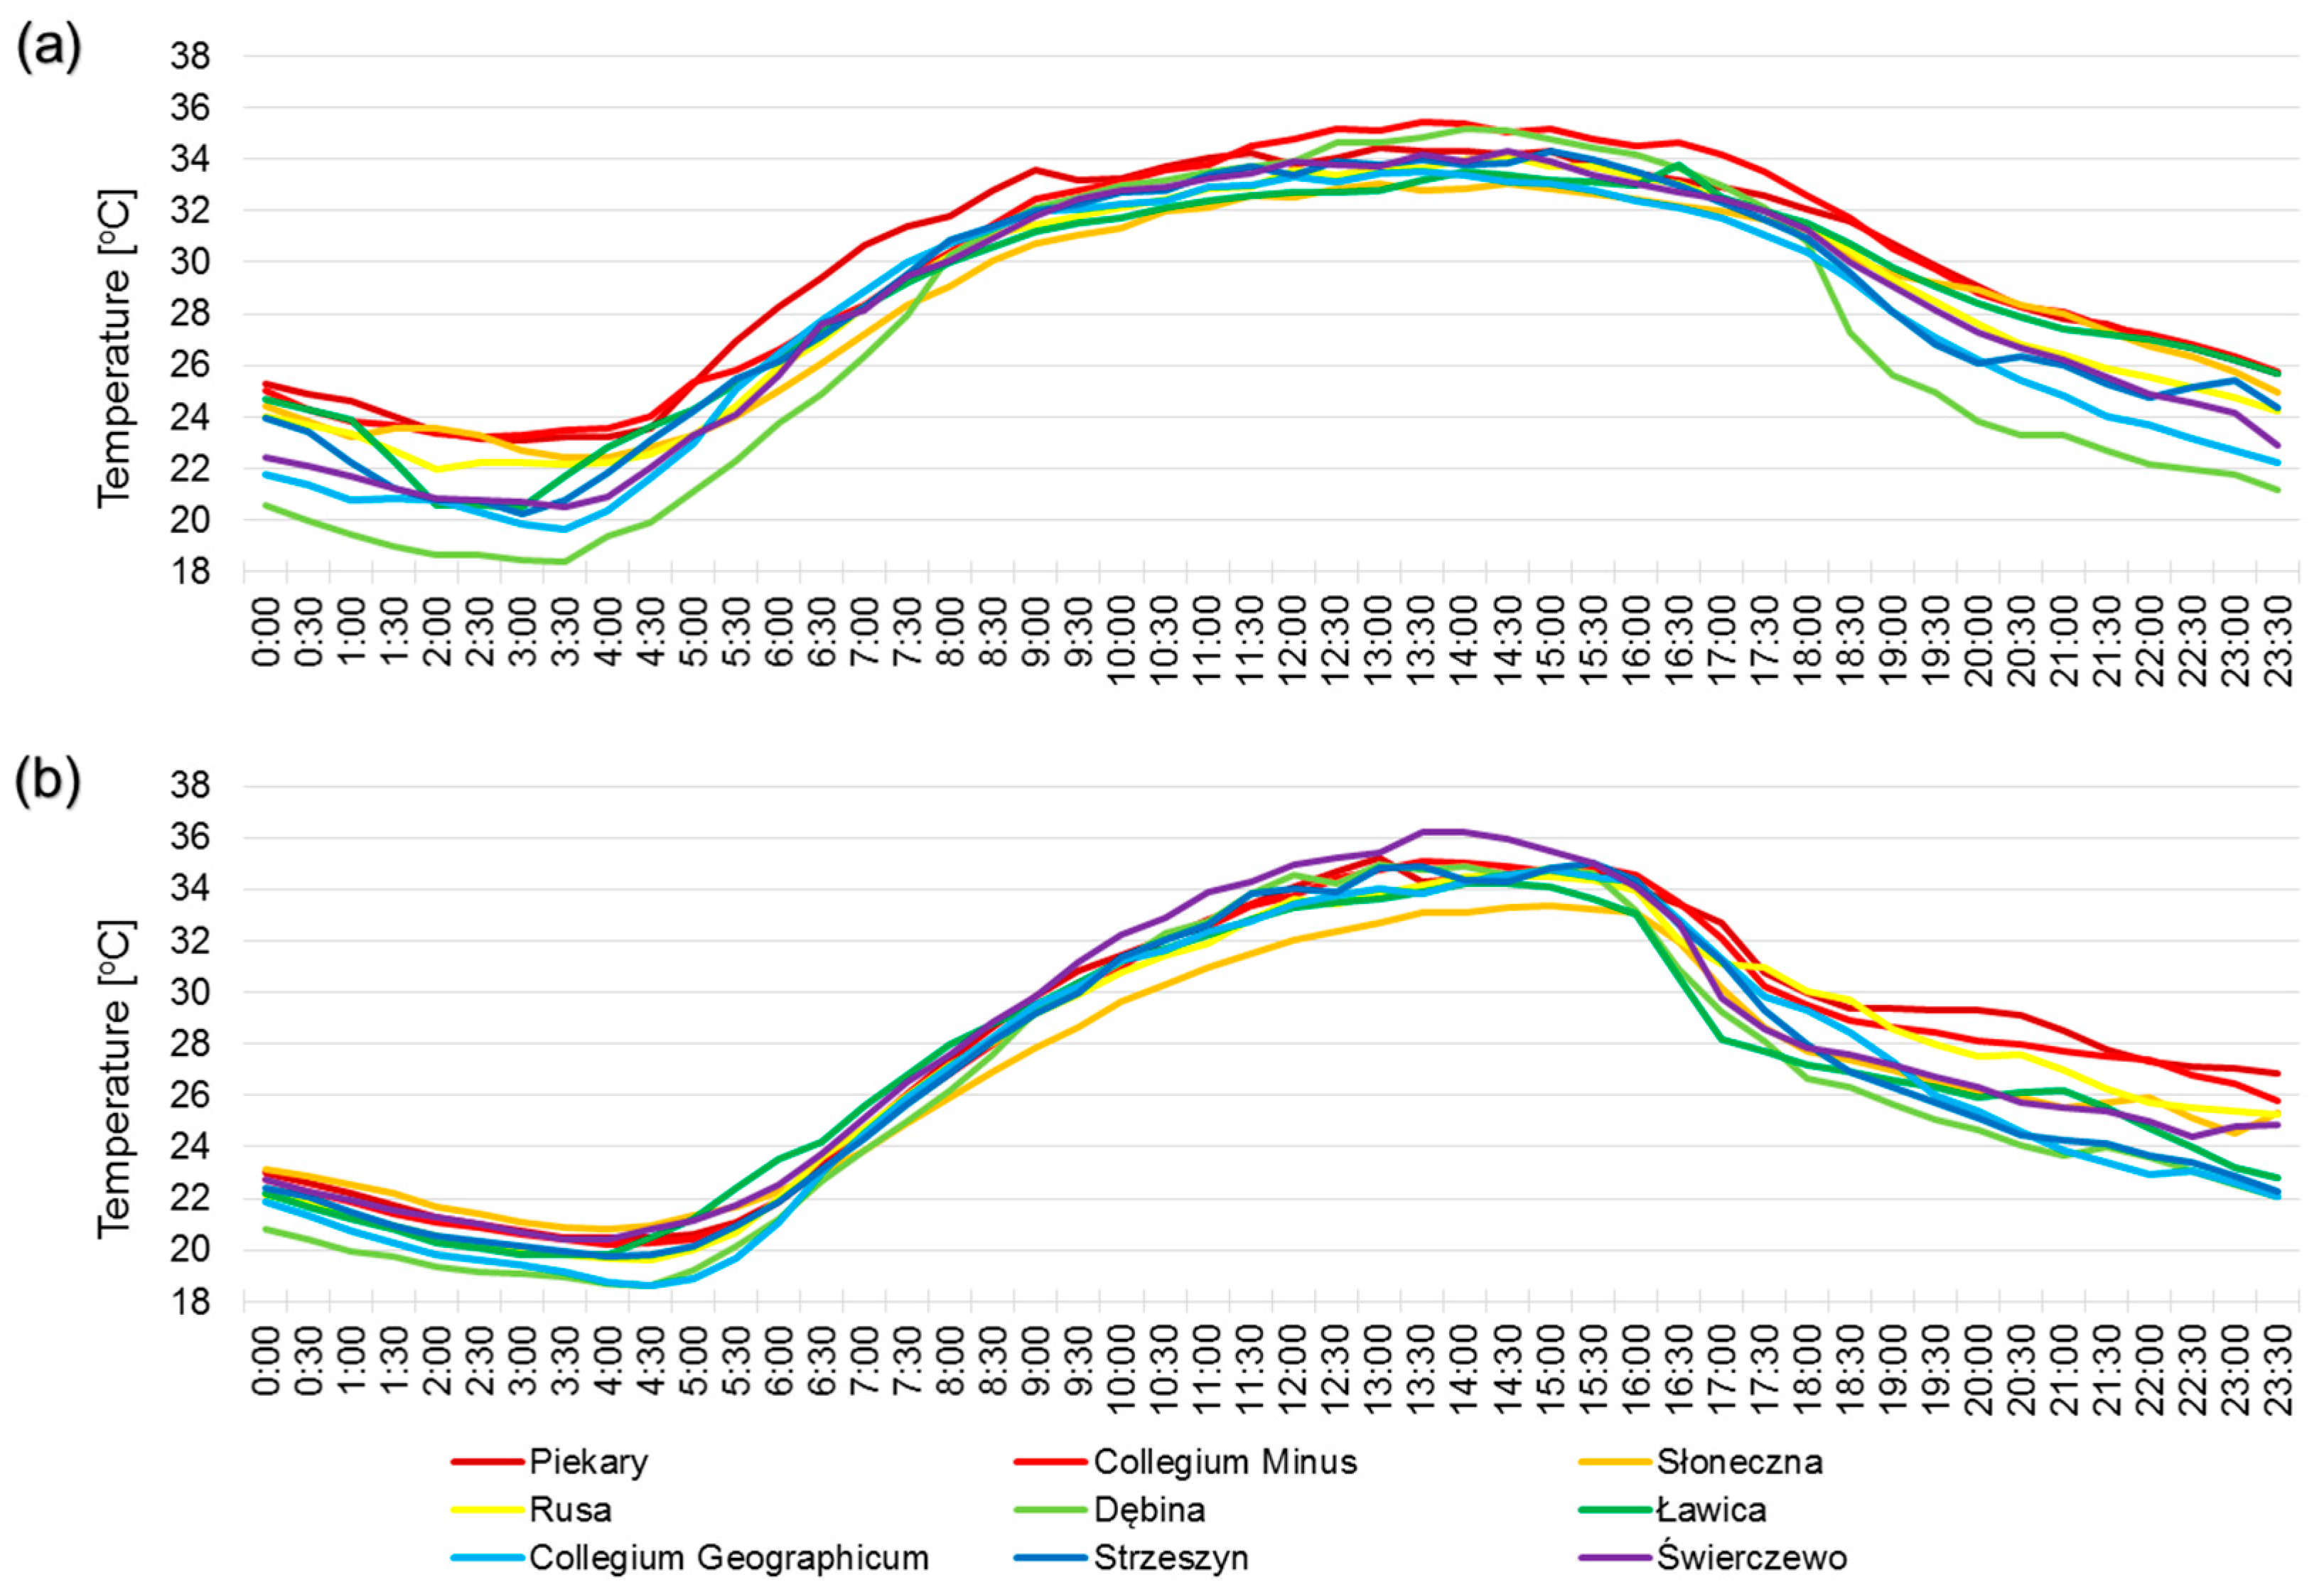
Figure 7.
Air temperature in Poznań on 12 July 2010 (a) and 11 August 2015 (b) at 9:34. Profile lines (a) used in Figure 9.
Figure 7.
Air temperature in Poznań on 12 July 2010 (a) and 11 August 2015 (b) at 9:34. Profile lines (a) used in Figure 9.

Figure 8.
Statistic of air temperature in Poznań ((a)—12 July 2010, (b)—11 August 2015) on the basis of Landsat images according to Urban Atlas 2012 types (colours and order of types according to legend in Figure 1). In the boxplot, the middle values denote medians; the box extends to the Q1 (first quartile) and Q3 (third quartile), while the whiskers show the range (99.3%). The upper whisker shows Q3 + 1.5 × IQR (the interquartile range) and the lower shows Q1 − 1.5 × IQR. The notches extend to +/−1.58 IQR/sqrt(n) and the dots represent outliers.

Figure 9.
Air temperature in NW–SE and N–S profiles on 12 July 2010 at 9:43 UTC.

Figure 10.
SLP and z500 hPa (a), SLP and z500 hPa anomalies (b) and T850 anomalies (c) on 12 July 2010 (right column) and 11 August 2015 (left column).
Figure 10.
SLP and z500 hPa (a), SLP and z500 hPa anomalies (b) and T850 anomalies (c) on 12 July 2010 (right column) and 11 August 2015 (left column).

Figure 11.
Weather situation on 12 July 2010 (a) and 11 August 2015 (b). Source: Meteorology and Water Management–National Research Institute.
Figure 11.
Weather situation on 12 July 2010 (a) and 11 August 2015 (b). Source: Meteorology and Water Management–National Research Institute.


Table 1.
Location and characteristics of measuring points in Poznań.
| Location | Latitude [N] | Longitude [E] | Distance from the City Center–Piekary (km)/Direction | Land Cover | |
|---|---|---|---|---|---|
| 1. | Piekary | 52°24′19.96′′ | 16°55′39.60′′ | 0.0/- | Industrial, commercial, public, military and private units |
| 2. | Collegium Minus | 52°24′31.13′′ | 16°54′53.22′′ | 0.9/W | Industrial, commercial, public, military and private units |
| 3. | Słoneczna | 52°23′40.27′′ | 16°52′29.69′′ | 3.9/W | Green urban areas |
| 4. | Rusa | 52°23′29.65′′ | 16°59′0.75′′ | 4.0/SE | Discontinuous Dense Urban Fabric |
| 5. | Dębina | 52°21′19.88′′ | 16°54′46.14′′ | 5.7/S | Green urban areas |
| 6. | Ławica | 52°24′59.46′′ | 16°50′4.71′′ | 6.9/W | Airports |
| 7. | Collegium Geographicum | 52°27′46.80′′ | 16°56′28.92′′ | 6.7/N | Industrial, commercial, public, military and private units |
| 8. | Strzeszyn | 52°27′15.14′′ | 16°50′50.79′′ | 7.7/NW | Discontinuous Dense Urban Fabric |
| 9. | Świerczewo | 52°22′11.90′′ | 16°53′56.11′′ | 4.5/S | Continuous urban fabric |
Table 2.
Characteristics of heat waves in 1966–2015 in Poznań–Ławica.
| Years | Number of Heat Waves | Total Duration of Heat Waves (Days) | Average Length (Days) | Average Tmax (°C) | Average Tmin (°C) |
|---|---|---|---|---|---|
| 1966–1975 | 6 | 51 | 8.5 | 30.7 | 16.8 |
| 1976–1985 | 9 | 57 | 6.3 | 30.1 | 16.2 |
| 1986–1995 | 9 | 63 | 7.0 | 30.6 | 15.0 |
| 1996–2005 | 7 | 42 | 6.0 | 29.9 | 14.5 |
| 2006–2015 | 11 | 97 | 8.8 | 31.2 | 17.7 |
| 1966–2015 | 42 | 310 | 7.4 | 30.5 | 16.2 |
© 2018 by the authors. Licensee MDPI, Basel, Switzerland. This article is an open access article distributed under the terms and conditions of the Creative Commons Attribution (CC BY) license (http://creativecommons.org/licenses/by/4.0/).
Share and Cite
MDPI and ACS Style
Półrolniczak, M.; Tomczyk, A.M.; Kolendowicz, L. Thermal Conditions in the City of Poznań (Poland) during Selected Heat Waves. Atmosphere 2018, 9, 11. https://doi.org/10.3390/atmos9010011
AMA Style
Półrolniczak M, Tomczyk AM, Kolendowicz L. Thermal Conditions in the City of Poznań (Poland) during Selected Heat Waves. Atmosphere. 2018; 9(1):11. https://doi.org/10.3390/atmos9010011
Chicago/Turabian StylePółrolniczak, Marek, Arkadiusz M. Tomczyk, and Leszek Kolendowicz. 2018. "Thermal Conditions in the City of Poznań (Poland) during Selected Heat Waves" Atmosphere 9, no. 1: 11. https://doi.org/10.3390/atmos9010011
Note that from the first issue of 2016, this journal uses article numbers instead of page numbers. See further details here.