Quantifying Impacts of Aerosol Mixing State on Nucleation-Scavenging of Black Carbon Aerosol Particles


1
Atmospheric Environment and Applied Meteorology Research Department, Meteorological Research Institute, Japan Meteorological Agency, 1-1 Nagamine, Tsukuba, Ibaraki 305-0052, Japan
2
Department of Mechanical Science and Engineering, University of Illinois at Urbana-Champaign, 1206 W. Green St., Urbana, IL 61801, USA
3
Department of Atmospheric Sciences, University of Illinois at Urbana-Champaign, 1301 W. Green St., Urbana, IL 61801, USA
*
Author to whom correspondence should be addressed.
Atmosphere 2018, 9(1), 17; https://doi.org/10.3390/atmos9010017
Submission received: 11 October 2017
/
Revised: 18 December 2017
/
Accepted: 4 January 2018
/
Published: 11 January 2018
(This article belongs to the Special Issue Morphology and Internal Mixing of Atmospheric Particles)
Abstract
:Recent observational studies suggest that nucleation-scavenging is the principal path to removing black carbon-containing aerosol from the atmosphere, thus affecting black carbon’s lifetime and radiative forcing. Modeling the process of nucleation-scavenging is challenging, since black carbon (BC) forms complex internal mixtures with other aerosol species. Here, we examined the impacts of black carbon mixing state on nucleation scavenging using the particle-resolved aerosol model PartMC-MOSAIC. This modeling approach has the unique advantage that complex aerosol mixing states can be represented on a per-particle level. For a scenario library that comprised hundreds of diverse aerosol populations, we quantified nucleation-scavenged BC mass fractions. Consistent with measurements, these vary widely, depending on the amount of BC, the amount of coating and coating material, as well as the environmental supersaturation. We quantified the error in the nucleation-scavenged black carbon mass fraction introduced when assuming an internally mixed distribution, and determined its bounds depending on environmental supersaturation and on the aerosol mixing state index . For a given value, the error decreased at higher supersaturations. For more externally mixed populations (%), the nucleation-scavenged BC mass fraction could be overestimated by more than 1000% at supersaturations of 0.1%, while for more internally mixed populations (%), the error was below 100% for the range of supersaturations (from 0.02% to 1%) investigated here. Accounting for black carbon mixing state and knowledge of the supersaturation of the environment are crucial when determining the amount of black carbon that can be incorporated into clouds.
1. Introduction
Black-carbon-containing aerosol particles are emitted from the combustion of fossil fuel, biomass, and biofuel [1,2,3,4,5]. As one of the most important types of absorbing aerosol, black carbon (BC) exerts a multitude of impacts on the climate system [5], ranging from the local to the regional and global scales. BC-containing aerosols modify the radiative budget directly by scattering and absorbing solar radiation, and indirectly by modifying cloud microphysical properties. Owing to their ability to absorb solar radiation, BC-containing aerosols can heat the surrounding atmosphere and desiccate clouds when present as interstitial aerosol [6,7,8,9] or when residing inside cloud droplets after serving as cloud condensation nuclei [10,11]. Furthermore, they modify the snow albedo [12] after being deposited on Arctic snow after long-range transport [13], and warm the atmosphere where they reside, hence altering the local stability of the atmosphere [14]. This subsequently promotes accumulation of pollutants and impacts local air quality [15].
BC is one of the short-lived climate forcers, and it has been suggested that reducing BC emissions will mitigate global warming, at least temporarily [16,17,18]. According to [5], the best estimate of BC forcing including all forcing mechanisms is with 90% uncertainty bounds from to [5]. Ref. [5] attributes this substantial uncertainty range to the lack of knowledge of cloud interactions with both black carbon and co-emitted organic carbon, which motivates this study. The climate impacts of BC are determined by its atmospheric burden as well as its spatial and temporal distributions. These, in turn, are governed by the amount of emissions, the transport, and the removal from the atmosphere. Recent measurements by [19,20] indicated that nucleation-scavenging of BC-containing aerosols is the major removal pathway of BC from the atmosphere. Nucleation-scavenging is the process of aerosol particles acting as cloud condensation nuclei (CCN), being thus incorporated into cloud droplets. This leads to their removal if the cloud precipitates. It is important to note that, in general, clouds disperse several times before they indeed precipitate, hence nucleation-scavenging does not necessarily lead directly to the removal of aerosol.
Freshly emitted BC-containing particles, which usually do not contain hygroscopic material, require a high environmental supersaturation to activate [21]. This makes them poor CCN. However, their CCN activity can increase during transport in the atmosphere [20]. The processes contributing to the increase in CCN activity includes condensation of secondary aerosol outside cloud droplets, the addition of hygroscopic mass as a result of aqueous-phase chemistry within cloud droplets, coagulation with more hygroscopic particles, and heterogeneous oxidation reactions. The processes included in this study are the formation of secondary aerosol (gas-to-particle conversion) and coagulation.
Indeed, previous measurements of nucleation-scavenged BC mass fractions cover the entire range from practically zero to 100%, and vary with the environment where the measurements were taken. Some of these studies are compiled in Table 1, which is based on the studies by [22,23]. Note that most of the studies listed reported scavenging fractions based on bulk mass measurements, and the particle size ranges may differ between the studies.
Here, we investigate the question of what role aerosol mixing state plays in determining how much black carbon is incorporated into cloud droplets. We are using the term “aerosol mixing state” here in the sense of Winkler [31], who defined it as the distribution of chemical compounds over the particle population.
The evolution of mixing state is challenging to represent in aerosol models that use sectional or modal approaches. This is owing to their inherent assumption that particles within modes or size bins have the same composition. Here, we use a particle-resolved model to simulate the evolution of an aging aerosol population. The unique advantage of this approach is that the composition of each individual particle is tracked over time, and hence there are no approximating assumptions about mixing state.
Earlier particle-resolved modeling studies by [32] showed that the CCN activity of BC-containing aerosol can increase substantially after emission, either because hygroscopic species condense on the BC-containing particles, or because the BC-containing particles coagulate with other, more hygroscopic particles. Ref. [32] further concluded that the BC mixing state is an important factor for determining the CCN activation properties of BC, and neglecting realistic mixing state information leads to significant errors in the BC mass fraction that can undergo nucleation-scavenging [32,33,34]. Building on our studies [32,33,34], in this work, we quantified the BC mass fraction that can be incorporated into cloud droplets by nucleation-scavenging for a wide range of scenarios, and determined the error that is introduced by assuming internal mixture. This approximates the assumptions made in state-of-the-art regional and global models. Our aim was to understand how this error is related to aerosol mixing state, expressed in terms of the mixing state index , and how this relationship depends on the environmental supersaturation at which the nucleation-scavenged mass fraction was evaluated.
2. Methodology
2.1. PartMC-MOSAIC: A Particle-Resolved Approach to Simulated Aerosol Dynamics and Chemistry
In this study, we applied the particle-resolved model PartMC-MOSAIC (Particle Monte Carlo [35]-Model for Simulating Aerosol Interactions and Chemistry, [36]), which simulates the composition evolution of individual particles in an aerosol population within a well-mixed volume in the atmosphere. A detailed model description of PartMC-MOSAIC is provided in [35]. Here, we give a brief summary.
The PartMC module uses a stochastic Monte Carlo sampling model to handle Brownian coagulation among particles, particle emission into the volume, and the mixing of particles with background atmosphere. PartMC is coupled to the aerosol chemistry module MOSAIC [36] to simulate gas phase chemistry (CBM-Z [37]), gas-particle partitioning, and aerosol thermodynamics. The CBM-Z gas phase mechanism includes a total of 77 gas phase species. The aerosol species treated in MOSAIC are sulfate, nitrate, ammonium, chloride, carbonate, methanesulfonic acid, sodium, calcium, “other inorganic mass” (representing species such as , metal oxides, and other unmeasured or unknown inorganic species present in aerosols), black carbon, primary organic carbon (POA), and secondary organic carbon (SOA). The formation of SOA is simulated with the SORGAM (Secondary Organic Aerosol Model) scheme [38], and includes 15 reaction products of aromatic precursors, higher alkenes, -pinene, and limonene. Aqueous-phase chemistry or the oxidation of organic aerosol and associated changes in particle composition and CCN activity are not yet included in PartMC, but will be the focus of future model development.
The PartMC-MOSAIC model output consists of the composition vector of each computational particle, i.e., we store the mass of each aerosol species that is contained in each particle. Based on this information, per-particle quantities such as the particle sizes, their critical supersaturation, and optical properties are readily computed for assumed morphologies. Information about the particle population such as the bulk mass concentration of any aerosol species, the aerosol number concentration, and the aerosol size distribution can also easily be constructed.
Using the particle-resolved approach, simulating particle growth is free of numerical diffusion in mass composition space. Importantly, we do not prescribe in any way how the chemical species are distributed amongst the particles in the population. This means that, at any given time during the simulation, the aerosol mixing state is the result of the evolution of particle compositions, rather than a part of the modeling assumptions. The simulation results from PartMC-MOSAIC can therefore serve as a benchmark for representing aerosol mixing state, and the model was used for this purpose in previous studies [32,33,34,39,40,41,42]. Assumptions are being made regarding the particle shape as we assume spherical particles to calculate coagulation rates and mass transfer rates. It would be interesting to expand the framework to account for non-spherical particles as this might impact the aerosol dynamics processes, as for example shown in [43]. However, considerable further model development is required to quantify these effects.
2.2. Setup of Idealized Urban Plume Scenarios
The basis for the analyses in this paper is a scenario library of eight urban plume scenarios described in [33,34]. These scenarios were constructed to investigate the aging process of carbonaceous aerosol from combustion sources in urban environments. The term “aging” refers to the transition from CCN-inactive to CCN-active owing to coagulation with other aerosol particles or condensation of secondary organic or inorganic aerosol material [44]. We used approximately 10,000 computational particles for each simulation, with the exact number of particles varying over the course of the simulated period. In [32], we quantified the 95% confidence intervals for the results by performing an ensemble of runs, and concluded that this particle number is sufficient to obtain accurate statistics.
While the input parameters varied between scenarios to represent a range of different aging conditions, the general setup for each scenario was the same, and followed [39]. The total simulation time was 48 h. During the first 12 h, gas and aerosol emissions entered the air parcel. Background aerosol particles were introduced over the entire simulation time owing to dilution with background air. Table 2, Table 3 and Table 4 specify the details of the initial and background conditions as well as the emissions for aerosol particles and gas phase species for the base case. We assume that all particles from a given emission source have initially the same composition, with the mass fractions listed in Table 2. For example, particles from gasoline emissions are assumed to consist of an internal mixture of 80% POA and 20% BC. The different sub-populations are initially externally mixed. After entering the simulation, the particle composition evolves as described in Section 2.1.
The following conceptual model guided this setup, summarized by Figure 1 in [39]. After the simulation starts at 6:00 a.m. LST (local solar time), the Lagrangian air parcel represents a volume of air in the polluted, well-mixed boundary layer during the daytime. After sunset, the air parcel represents the polluted air that remains in the nocturnal residual layer. This layer is decoupled from the stable surface layer, and hence we discontinue emissions after 12 h. We continue to simulate the aerosol aging for a second day of simulation without adding fresh emissions to capture the effects of a longer processing time. This corresponds to an air parcel being advected over the ocean for another day, again decoupled from the stable marine surface layer.
As shown in previous studies [44,45], the aging rate, i.e., the conversion of BC-containing particles from hydrophopic to hygroscopic, is determined by both condensation of secondary aerosol and coagulation with more hygroscopic particles. The relative importance of these two processes depends on the particular environmental conditions. For our base case scenario, condensation dominated during the daytime, while coagulation dominated during the nighttime.
To change the rate of the individual aging processes and their relative magnitudes, we obtained the other scenarios by changing the emission rate of the particles containing BC (100%, 25% and 2.5% of the base case), the background particle number concentrations (100% and 10% of the base case) and the gaseous emission rate (50% and 25% of the base case). This also created a range of BC mass concentrations, spanning a range from 0.05 to 3.6 , consistent with observations listed in the Environmental Protection Agency (EPA) Report to Congress on BC [46].
As in [34], we focus here on the aerosol state at different stages of aging, rather than the temporal evolution. As the basis for our analysis of BC scavenging, we therefore used the hourly aerosol states from all scenarios, which comprised populations covering a wide range of mixing states. These can be seen as possible populations present at cloud base, entering the cloud.
To quantify mixing state, we used the mixing state index . This concept originated from information theoric entropy measures and is detailed in [1]. In short, the mixing state index is calculated based on the mass fraction of each of the aerosol species contained in each individual particle, and the total bulk mass fractions of each of the aerosol species contained in that aerosol population. The mixing state index ranges from 0% to 100%, where 0% indicates that the aerosol population is completely externally mixed, and 100% indicates that the population is completely internally mixed. The definition of “species” for calculating the mass fractions depends on the application. Since we focus on aerosol activation, we grouped the aerosol model species according to their hygroscopicity into two surrogate species; BC and POA form one surrogate species as their hygroscopicity is very low. All other (more hygroscopic) model species form the second surrogate species. The 384 aerosol populations that form our dataset cover a range of mixing states from to (compare to Figure 2 in [34]).
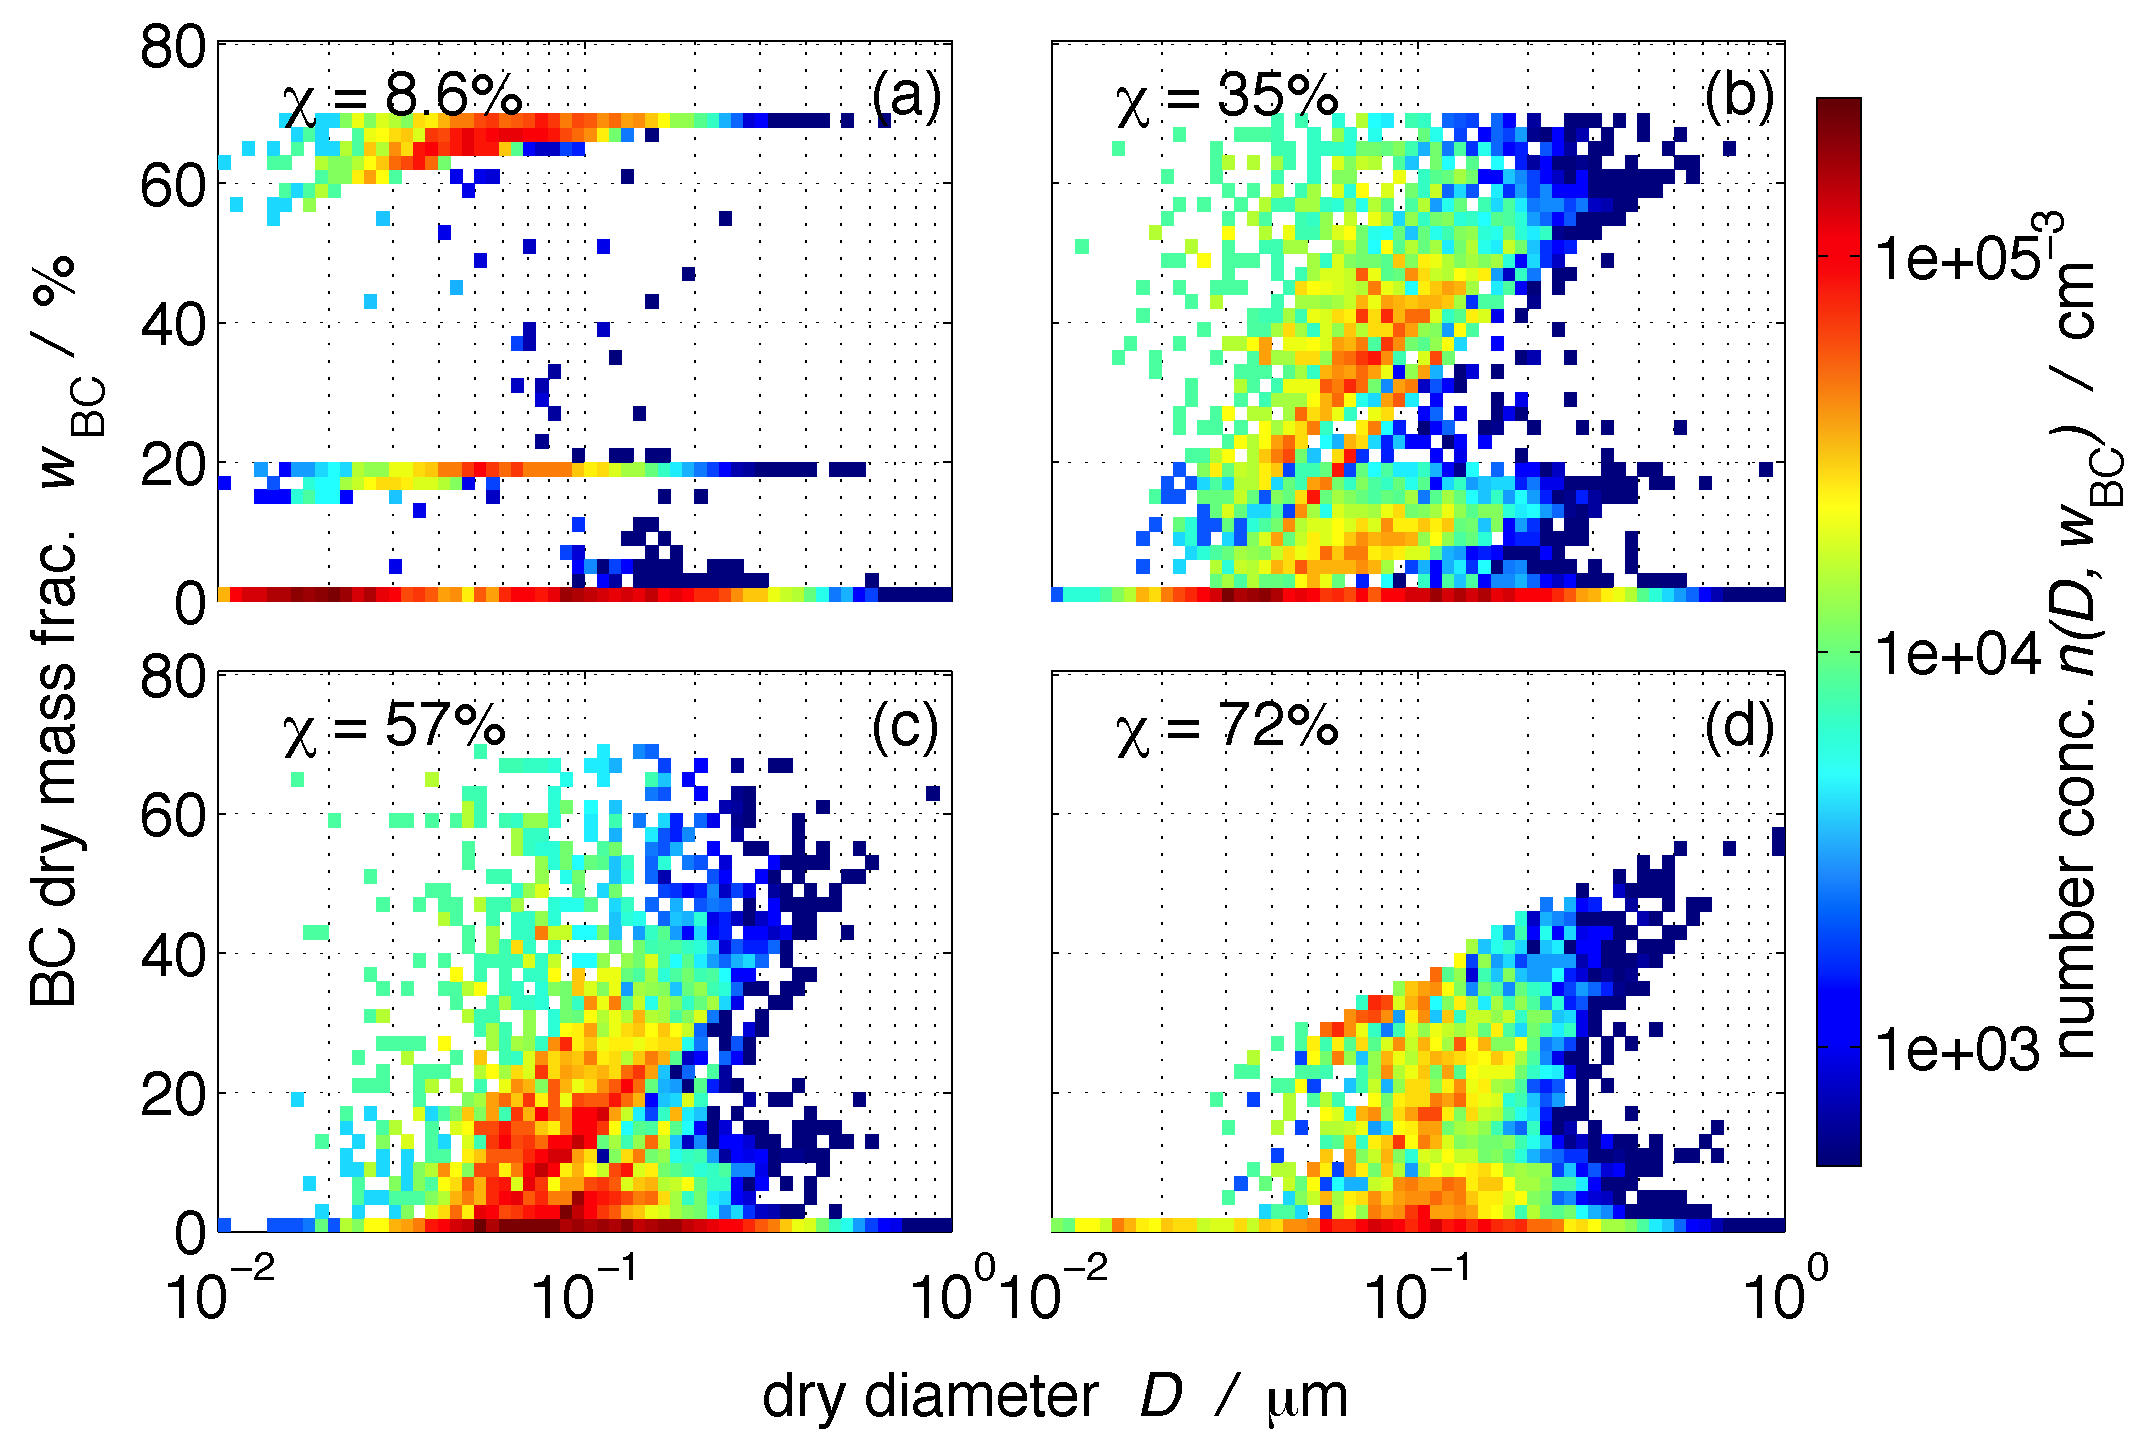
Figure 1 shows four example populations where we chose the two-dimensional number density in terms of dry diameter and BC mass fraction, , for illustration purposes. The black carbon mass fraction is defined for each individual particle i as
where and are the mass of BC contained in particle i and the total dry particle mass, respectively. The two-dimensional number concentration distribution is then defined by
where is the two-dimensional cumulative number distribution, which equals the number concentration of particles with total dry diameter less than D and black carbon dry mass fraction less than .
Figure 1a shows a population that contains very fresh carbonaceous emissions. We observe three distinct subpopulations that differed in their BC content, namely particles that originated from diesel vehicles (%), particles from gasoline vehicles (%), and particles with zero or very low BC content from meat cooking emissions and background aerosol (compare to Table 2 and Table 3). Not surprisingly, this population is characterized by a low mixing state index, %, indicating that it is very externally mixed.
Figure 1b,c show populations that experienced some aging, but fresh emissions were still introduced, which maintained the range of BC mass fractions up to 70%. The mixing state indexes for these populations were % and %, respectively. Figure 1d is an example of a population where fresh emissions had ceased to enter. The maximum BC mass fractions in this population ranged between only 20% and 50% depending on particle size because secondary aerosol formation took place while fresh BC-containing particles were not replenished. The mixing state index of this population is higher than any of the other three examples (%), meaning that the population has moved more towards an internal mixture. The diagonal features in these graphs arise when condensation of secondary aerosol material occurs on the particles. The BC mass fraction of small particles decreases faster than that of larger particles. The scatter that forms in between the main sub-populations is due to particle coagulation.
In [34], we examined the relationship between and the error incurred in CCN concentration predictions when assuming internal mixture. Here, we applied the same framework to quantify the error in predicting the BC mass fraction that can undergo nucleation-scavenging.
2.3. Framework of Error Quantification
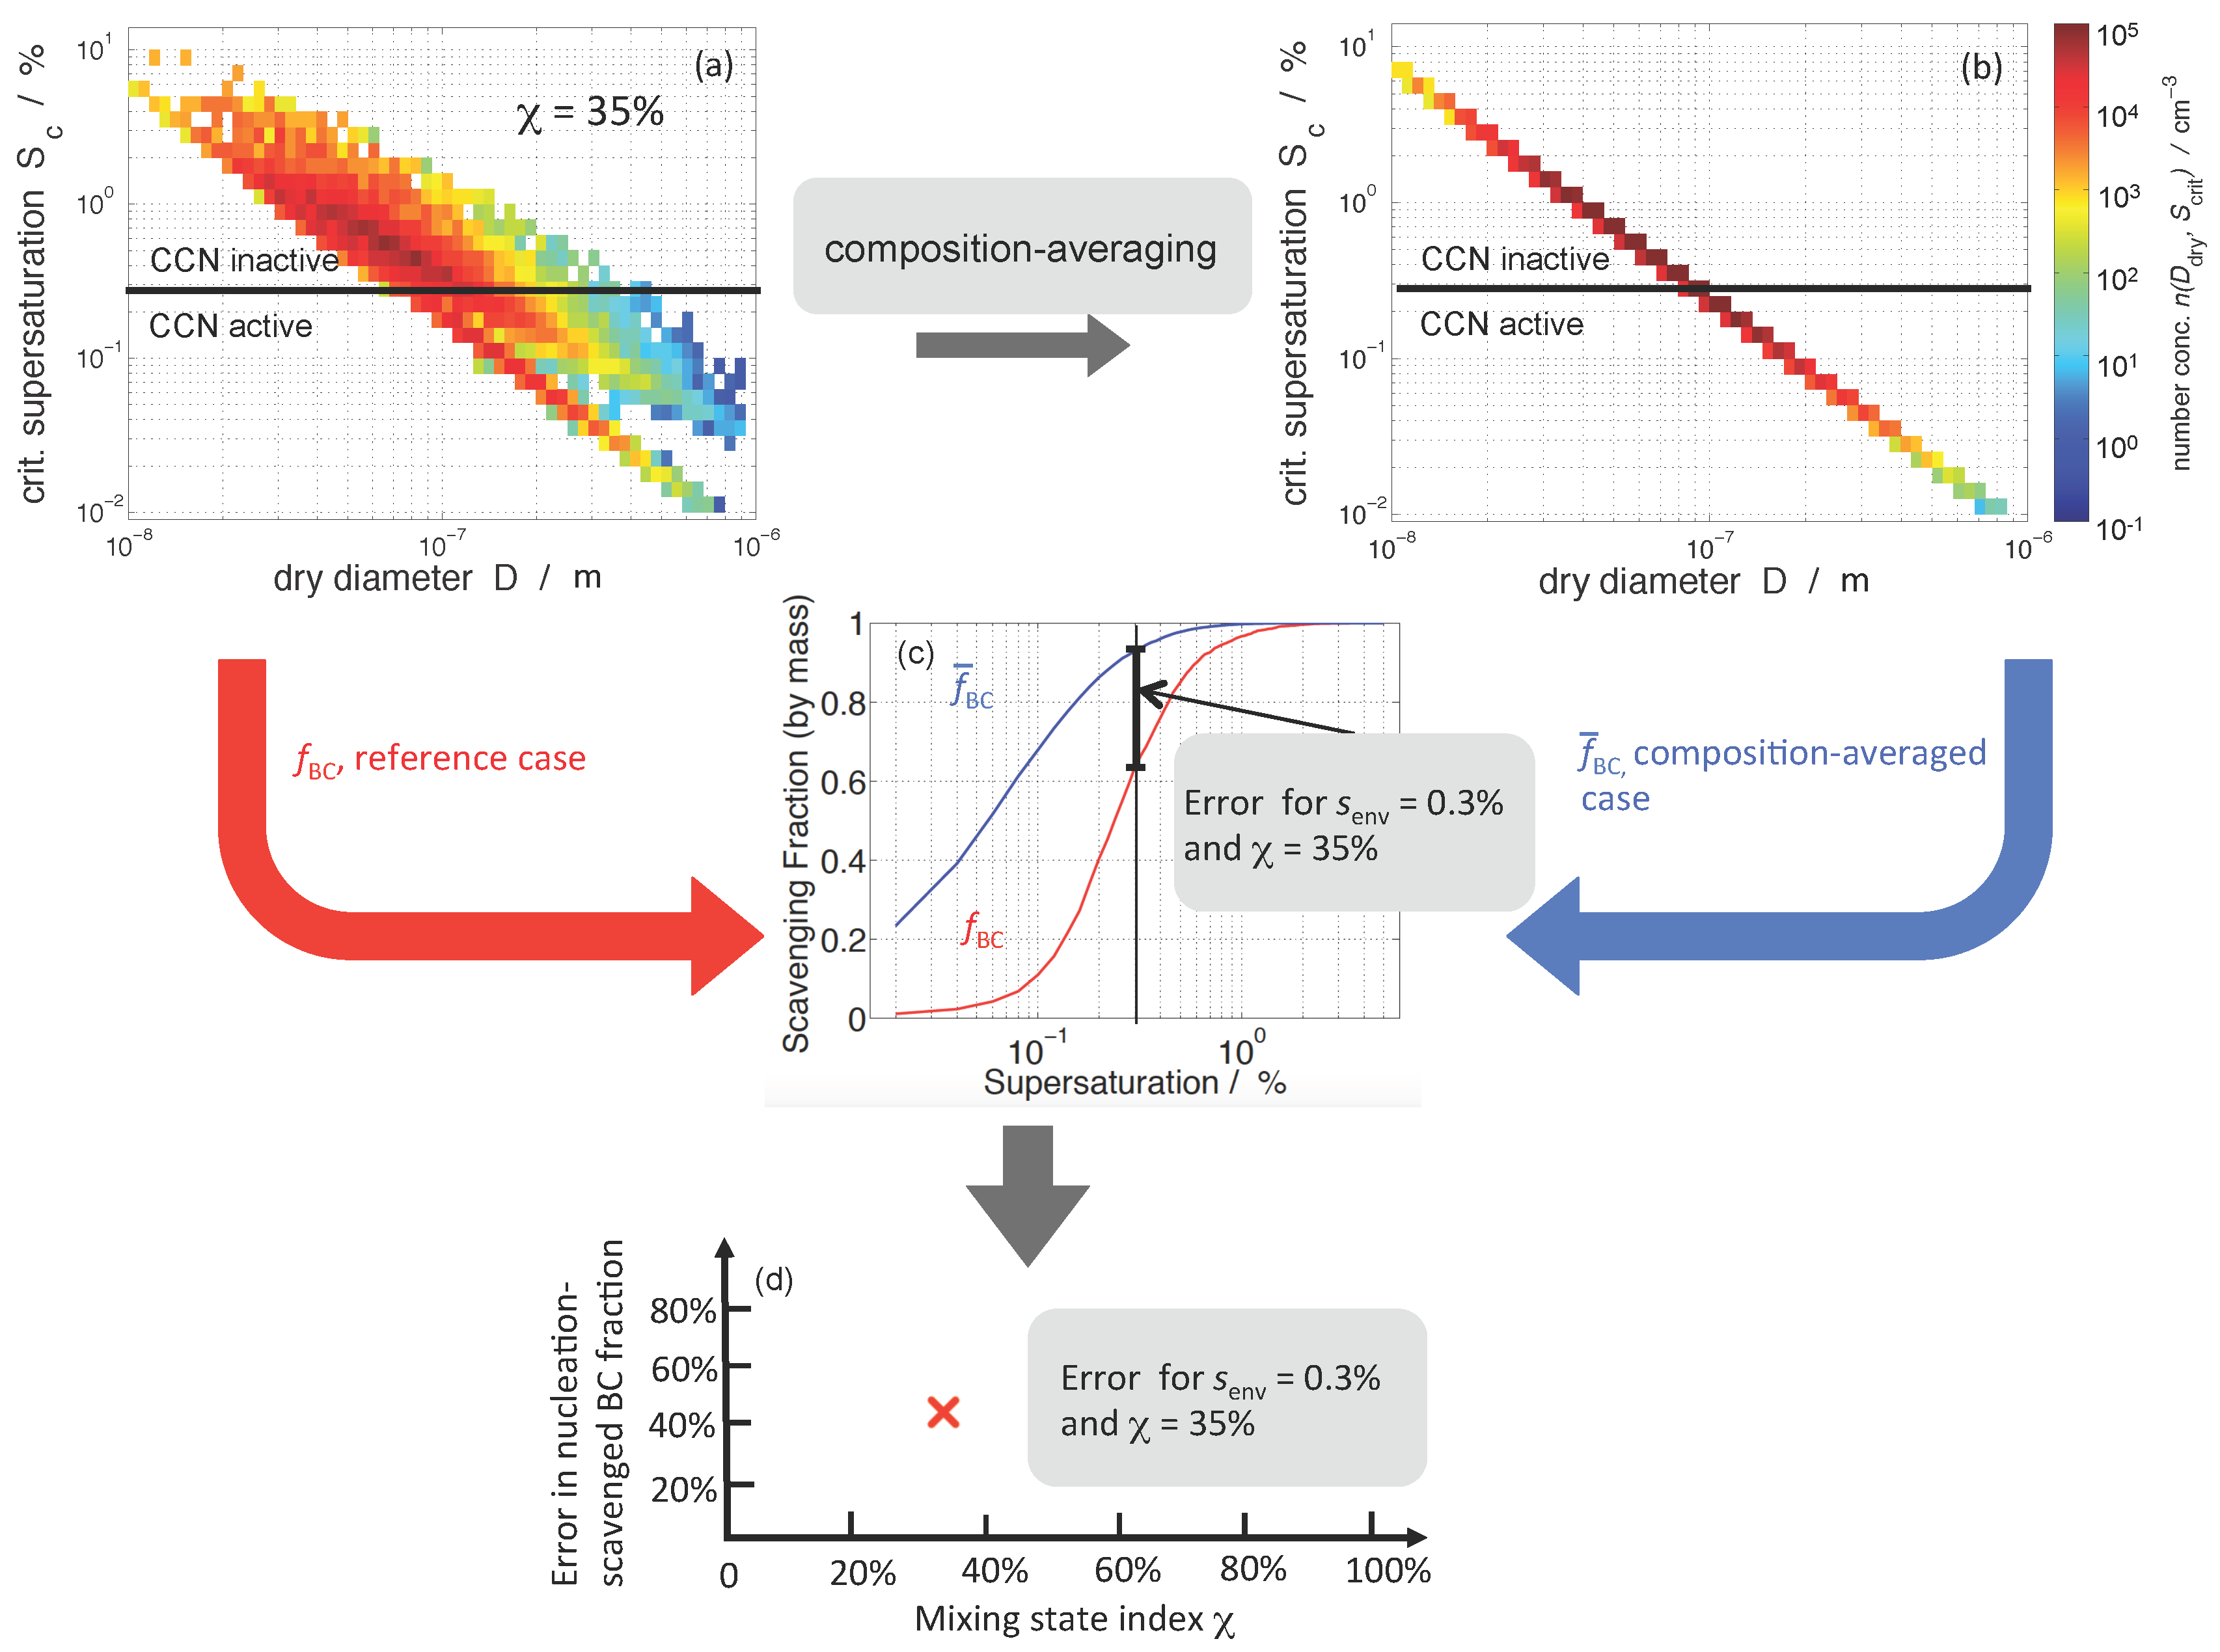
For this study, we used a similar error quantification framework to [34], but we tailored it to quantify the relationship between aerosol mixing state and the error in nucleation-scavenged mass fraction of black carbon aerosols when assuming internal mixture. Figure 2 outlines the approach. For each population, we calculated the critical supersaturations, , for each particle according to [44] using the dimensionless hygroscopicity parameter [47]. The overall for a particle is the volume-weighted average of the values of the constituent species. We assumed for all salts formed from the system. For all SOA model species, we assumed , and, for POA and BC, we assumed and , respectively [47].
Figure 2a shows the distribution density function in terms of particle dry diameter D and per-particle critical supersaturation for the same population as shown in Figure 1b. Figure 2a illustrates that both particle size and composition determine critical supersaturation; as the particle size increases, decreases, and at a given size, a range of values exist owing to differences in particle composition.
Given a certain environmental supersaturation threshold , we can separate the population into CCN active and CCN inactive particles. In Figure 2a, we used % as an example. The CCN number concentration can be readily determined by summing over all particle dry diameters D and over the supersaturation range from 0 to .
Recall that the model tracks the BC content of the individual active/non-active particles. Therefore, to determine the nucleation-scavenged BC mass fraction at a certain environmental supersaturation, we summed over the black carbon mass concentrations associated with the CCN at that particular supersaturation. This quantity is the total nucleation-scavenged BC mass concentration, . We then calculated the ratio of nucleation-scavenged BC mass concentration to the total BC mass concentration of the whole aerosol population, . This ratio is defined as the nucleation-scavenged BC mass fraction, and denoted as :
We evaluated this quantity for each aerosol population at 50 supersaturation values from to in steps of . Figure 2c shows the spectrum of (red line) that corresponds to the population shown in Figure 2a.
Figure 2b shows the aerosol population after composition averaging. The properties of the composition averaging operation are detailed in [32], Appendix B1. In brief, it assigns each particle a composition equal to the average composition of the population, and preserves the bulk aerosol mass concentrations, the number concentration, and the particle diameters, but modifies the per-particle compositions. The mixing state index of such a population is 100%. Because all particles were assigned the same composition (equal to the average composition), the spread in critical supersaturations at a given size vanishes. This alters the CCN concentration and also the amount of BC mass that is associated with those CCN. By this operation, some particles are assigned a higher critical supersaturation, while others are assigned a lower critical supersaturation compared to the original value.
The blue line in Figure 2c shows the spectrum corresponding to the composition-averaged population shown in Figure 2b. The difference in the two spectra represents the error that is incurred in by assuming internal mixture, which will depend on the supersaturation threshold at which CCN activity is evaluated.
We define the relative error in nucleation-scavenged BC mass fraction, , evaluated for the particle populations and before and after composition-averaging, respectively, and for a particular environmental supersaturation , as
where and refer to the composition-averaged and the particle-resolved populations, respectively. We calculated the relative error in nucleation-scavenged BC mass fraction for each of the 384 populations and will discuss the relationship between and in Section 3.2.
In Section 3.1, we will use a size-resolved version of to relate our results to ambient observations by [19,20]. This is calculated by sorting all particles into 150 logarithmically spaced size bins from 0.1 nm to 10 m based on their BC core diameter assuming spherical shape. The size-resolved nucleation-scavenged BC mass fraction, , is then defined as the ratio of nucleation-scavenged BC mass concentration in bin j, , to the total BC mass concentration in bin j, . This gives
Note that, as the number of size bins becomes large and their width small, the size-resolved mass-based fraction approaches the size-resolved number fraction of nucleation-scavenged BC-containing particles, which is the quantity reported by [19,20]. We have included the derivation of this fact in the Supplemental Material, as well as Figures S1 and S2 that confirm this fact.
3. Results
3.1. Size-Resolved Nucleation-Scavenged BC Mass Fraction
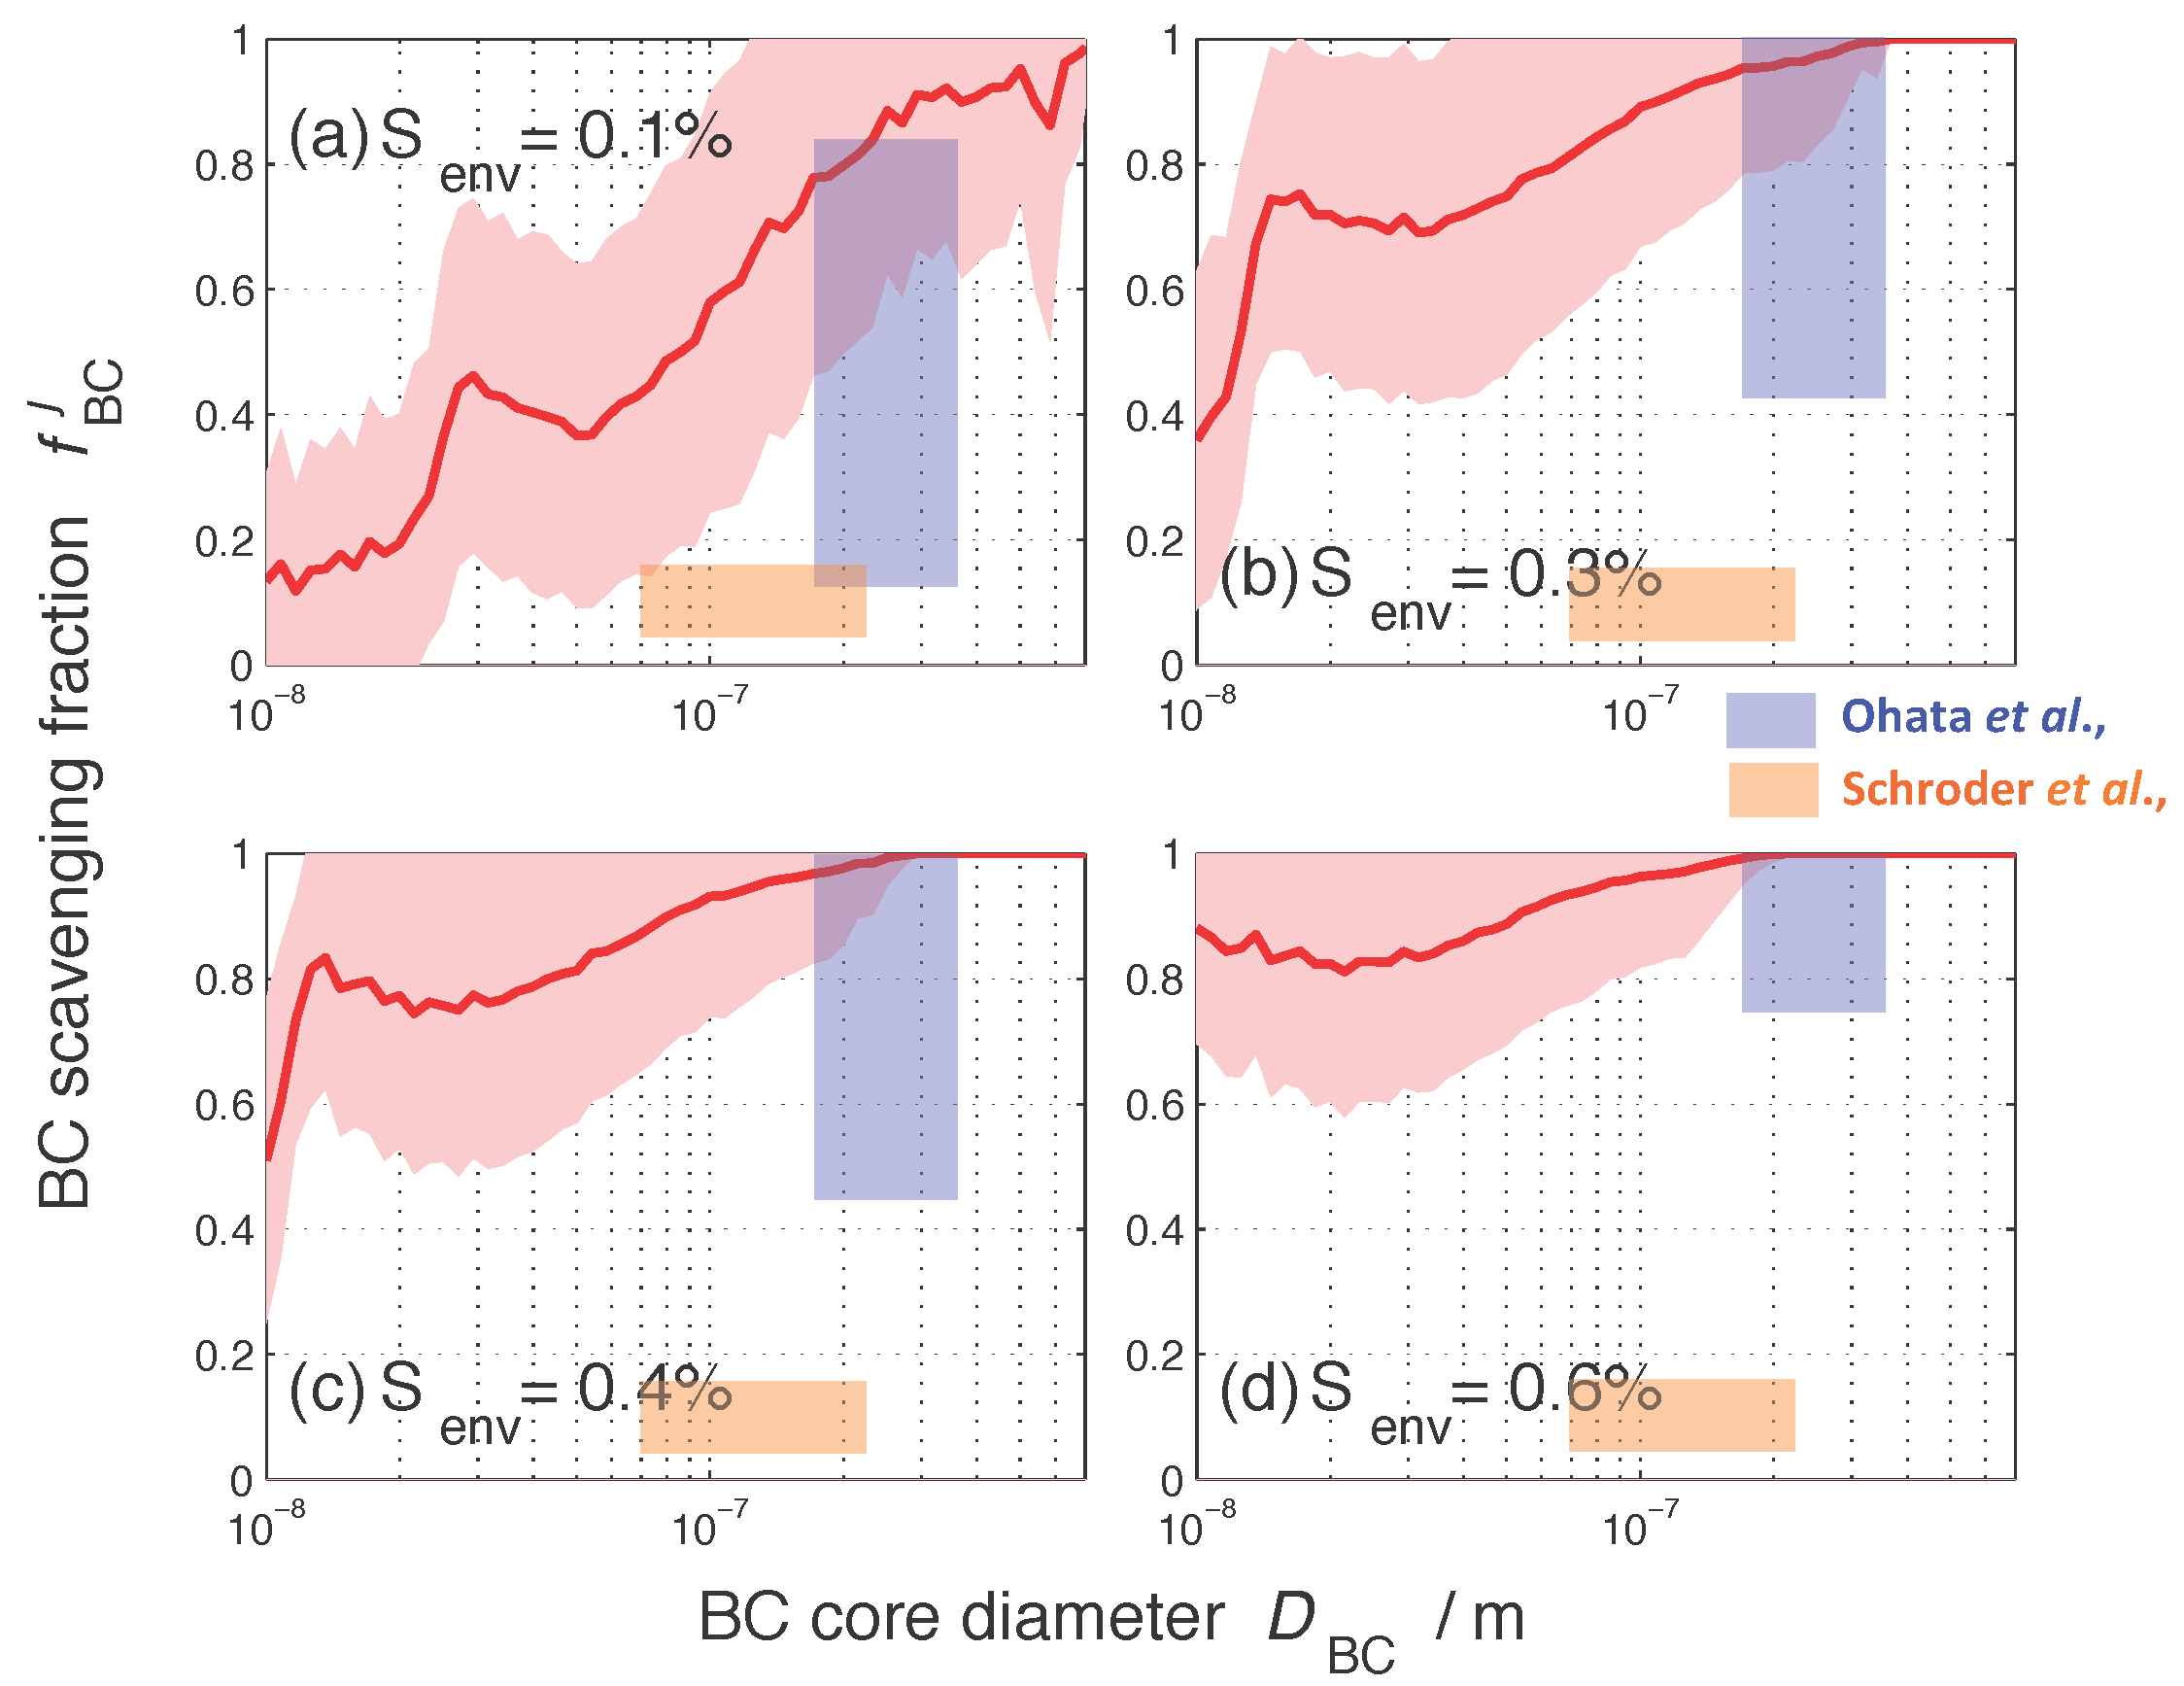
Figure 3 shows the size-resolved nucleation-scavenged BC mass fraction, , as a function of BC core diameter at four selected supersaturations, , , , and . These supersaturation values are representative of conditions ranging from stratus clouds to convective clouds. The solid red lines and the shading indicate the average of over all 384 cases and the corresponding standard deviation. We used BC core size here as an independent variable to connect our results to observational findings by [19,20]. The range of measurements by [19,20] are summarized by the blue and orange rectangles, respectively. Note that these authors report different individual datasets in their studies, which we did not replicate here, since only a qualitative comparison is possible.
For all supersaturations, the quantity tended to increase with BC core diameter, especially within the size ranges that were accessed by [19,20], as indicated by the shaded rectangles in Figure 3. For any given supersaturation, the spread of originated from mixing state differences within the 384 aerosol populations. For example, for particles of BC core diameter between 100 nm and 108 nm at a supersaturation of 0.1%, the average nucleation-scavenged BC mass fraction for all our scenarios is 58%, with a standard deviation of %. Given a certain BC core diameter, as the environmental supersaturation threshold increased, also increased. Taking again the example of BC core diameters between 100 nm and 108 nm, the average value for increased from 57% for % to 96% for %. The shape of these curves is determined by the underlying mass size distributions of the BC-containing particles, shown in the Supplemental Material, Figure S3.
The nucleation-scavenged BC mass fraction has been determined observationally by [19,20]. Ref. [20] used a single particle soot photometer (SP2) to measure the size distribution of the BC-containing particles activated to form stratocumulus cloud droplets at a marine boundary layer site in California, while [19] carried out measurements of BC in ambient particles before precipitation and in rainwater after precipitation using an SP2 in the Tokyo metropolitan area.
The PartMC-MOSAIC simulation results agree qualitatively with the two observational studies [19,20] in that increases with BC core diameter. The measurements of by [20] are significantly lower than both the measurements by [19] and our modeling results. The activated fractions of BC-containing particles were less than for BC core diameter ranging between 70 and 220 nm for the two cloud case studies reported in [20] (Figure 6a,f therein). In contrast, Ref. [19] found that the nucleation-scavenged number fraction increased from to when BC core diameter increased from 200 to 350 nm (Figure 3 therein). The discrepancy between [20] and our model results can possibly be attributed to the fact that the measurements were performed in a marine environment, while the PartMC-MOSAIC simulations represent urban environments of different pollution levels. In addition, Ref. [20] cautioned that the activation fractions reported should be considered as lower limits due to imperfect instrumental detection efficiency. In contrast, due to similar urban environments in which the simulations and the measurements by [19] took place, PartMC-MOSAIC results agree better with the observations by [19].
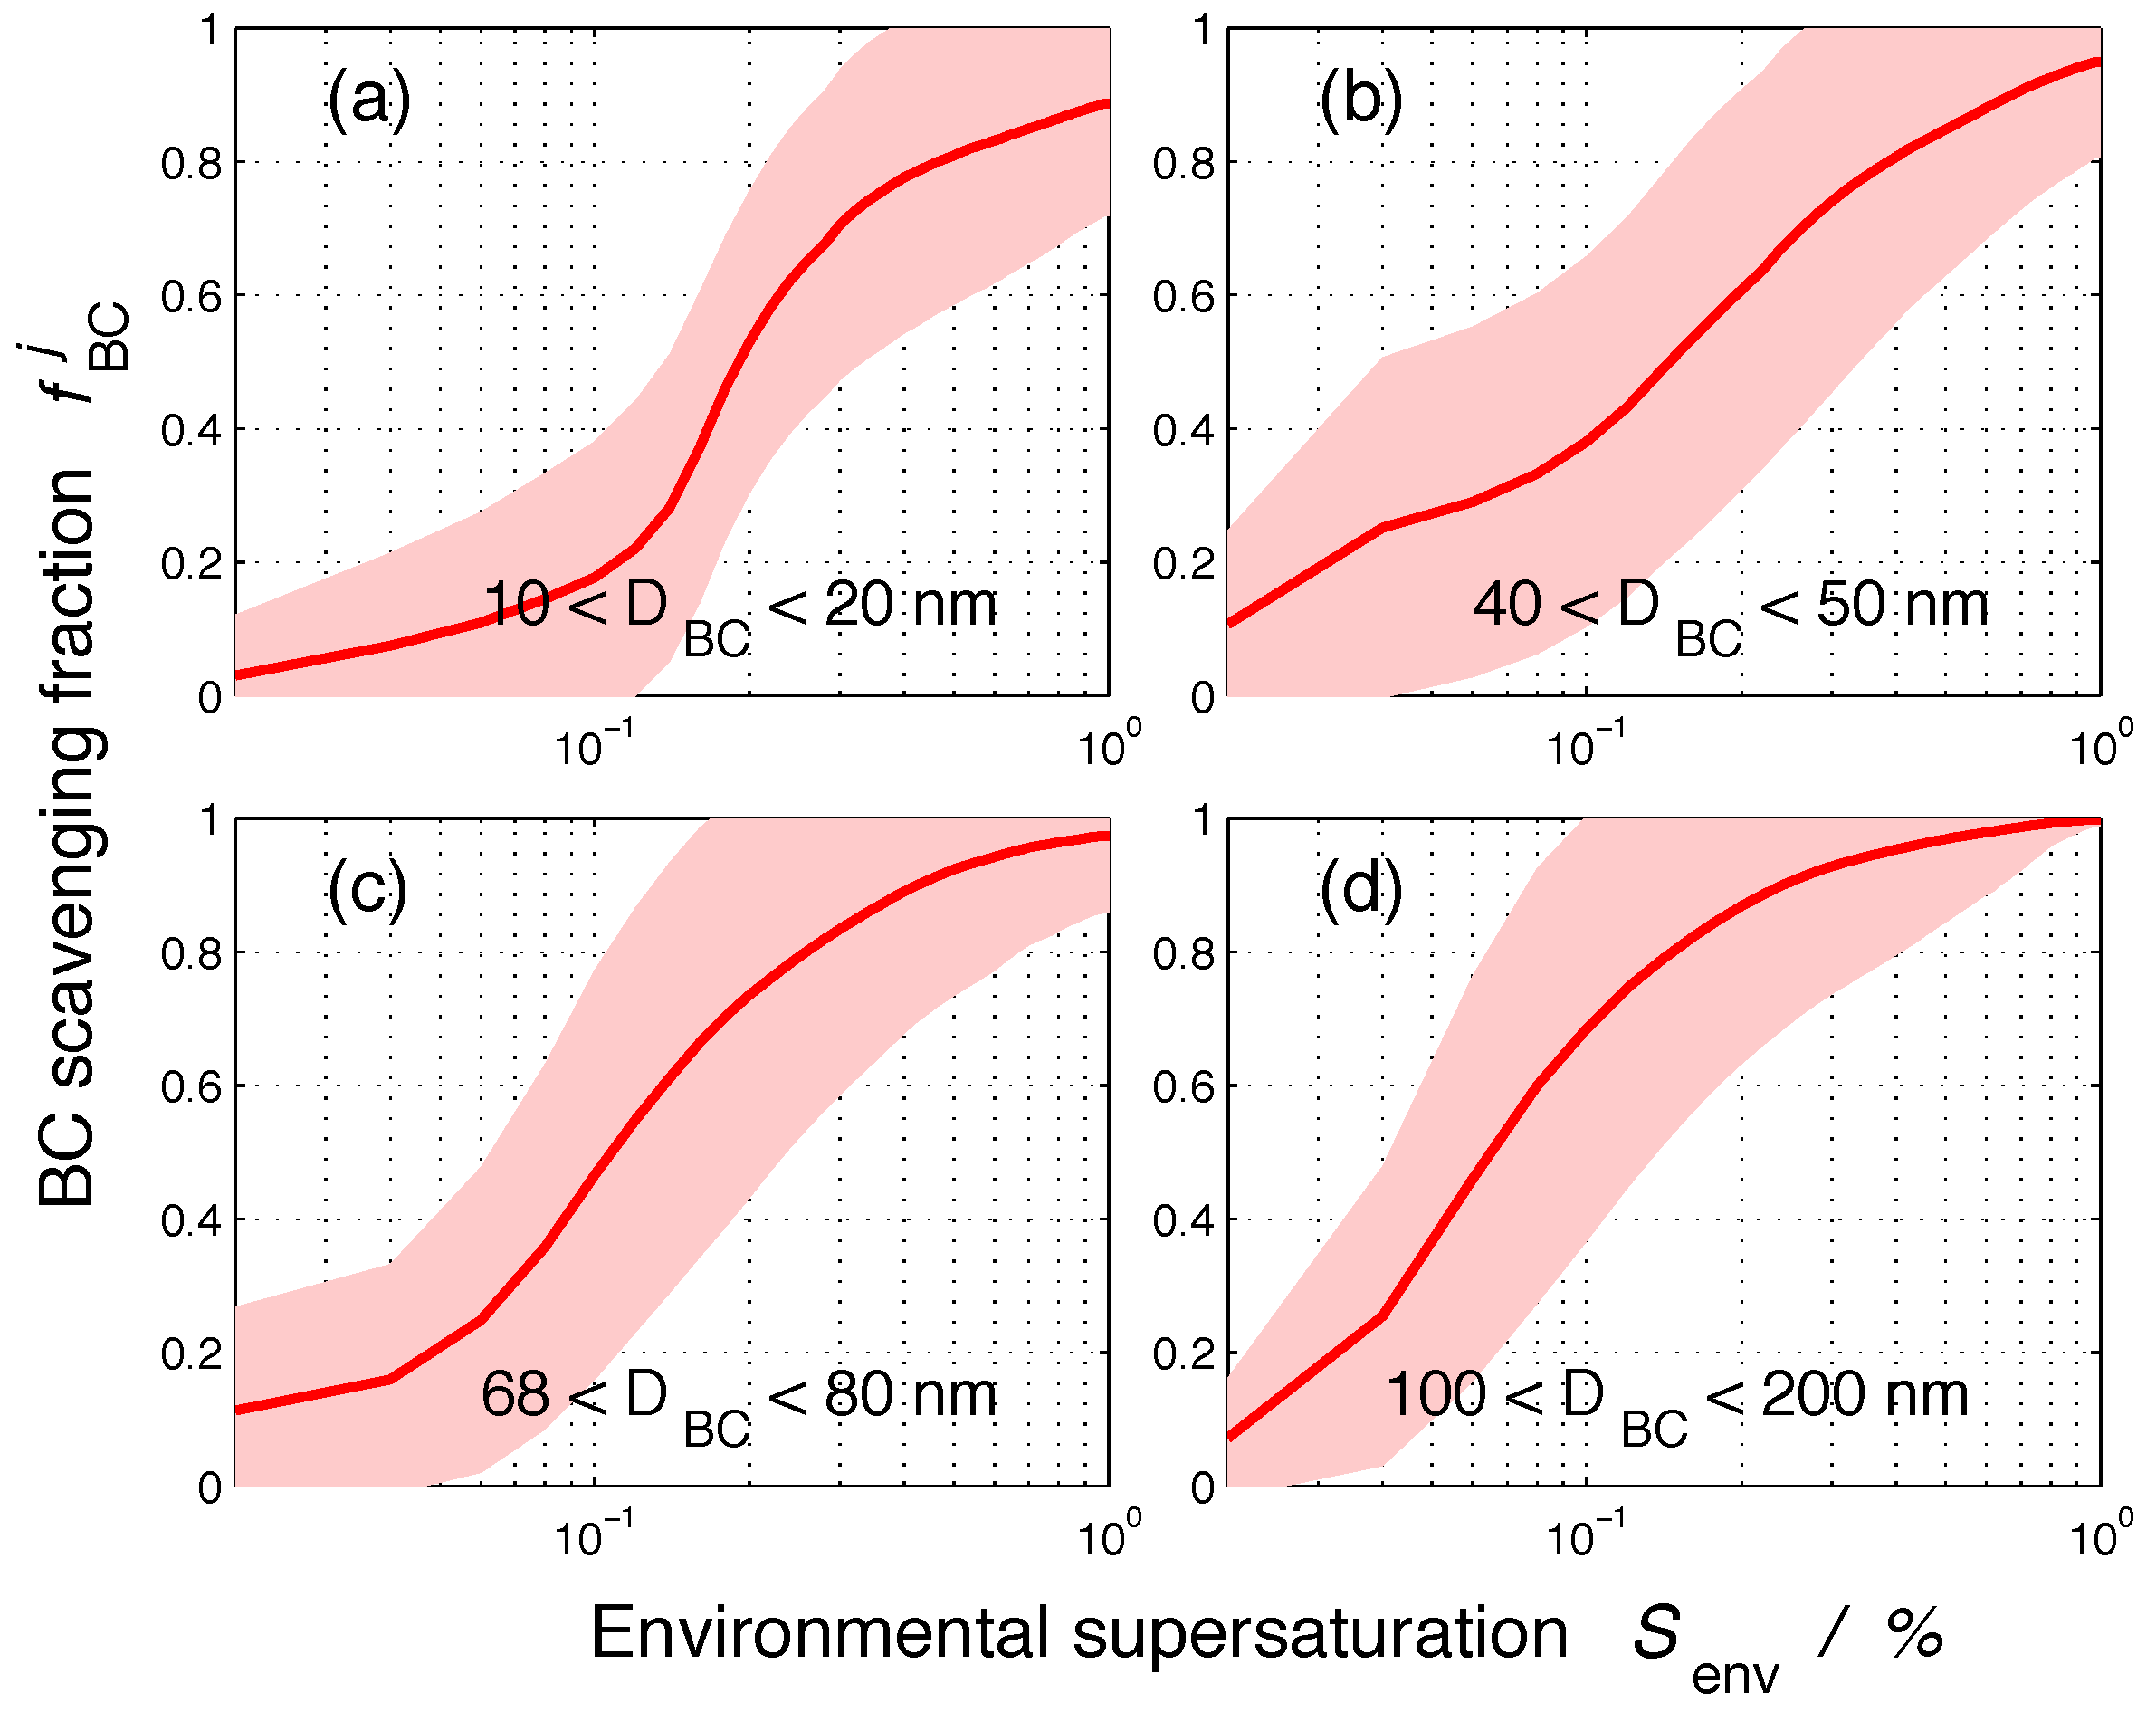
Figure 4 shows the same data as Figure 3, but displays as a function of supersaturation for selected BC core diameter ranges. From the combination of Figure 3 and Figure 4, we conclude that, for a given core size, the nucleation-scavenged BC fraction varies drastically depending on the environmental supersaturation. Moreover, for any given BC core size and environmental supersaturation, the nucleation-scavenged BC fraction spans a wide range, which reflects the fact that different amounts of coating can exist for any given core size depending on the history of the particle. This implies that the core size by itself is not a good predictor for the amount of BC that can be incorporated into cloud droplets.
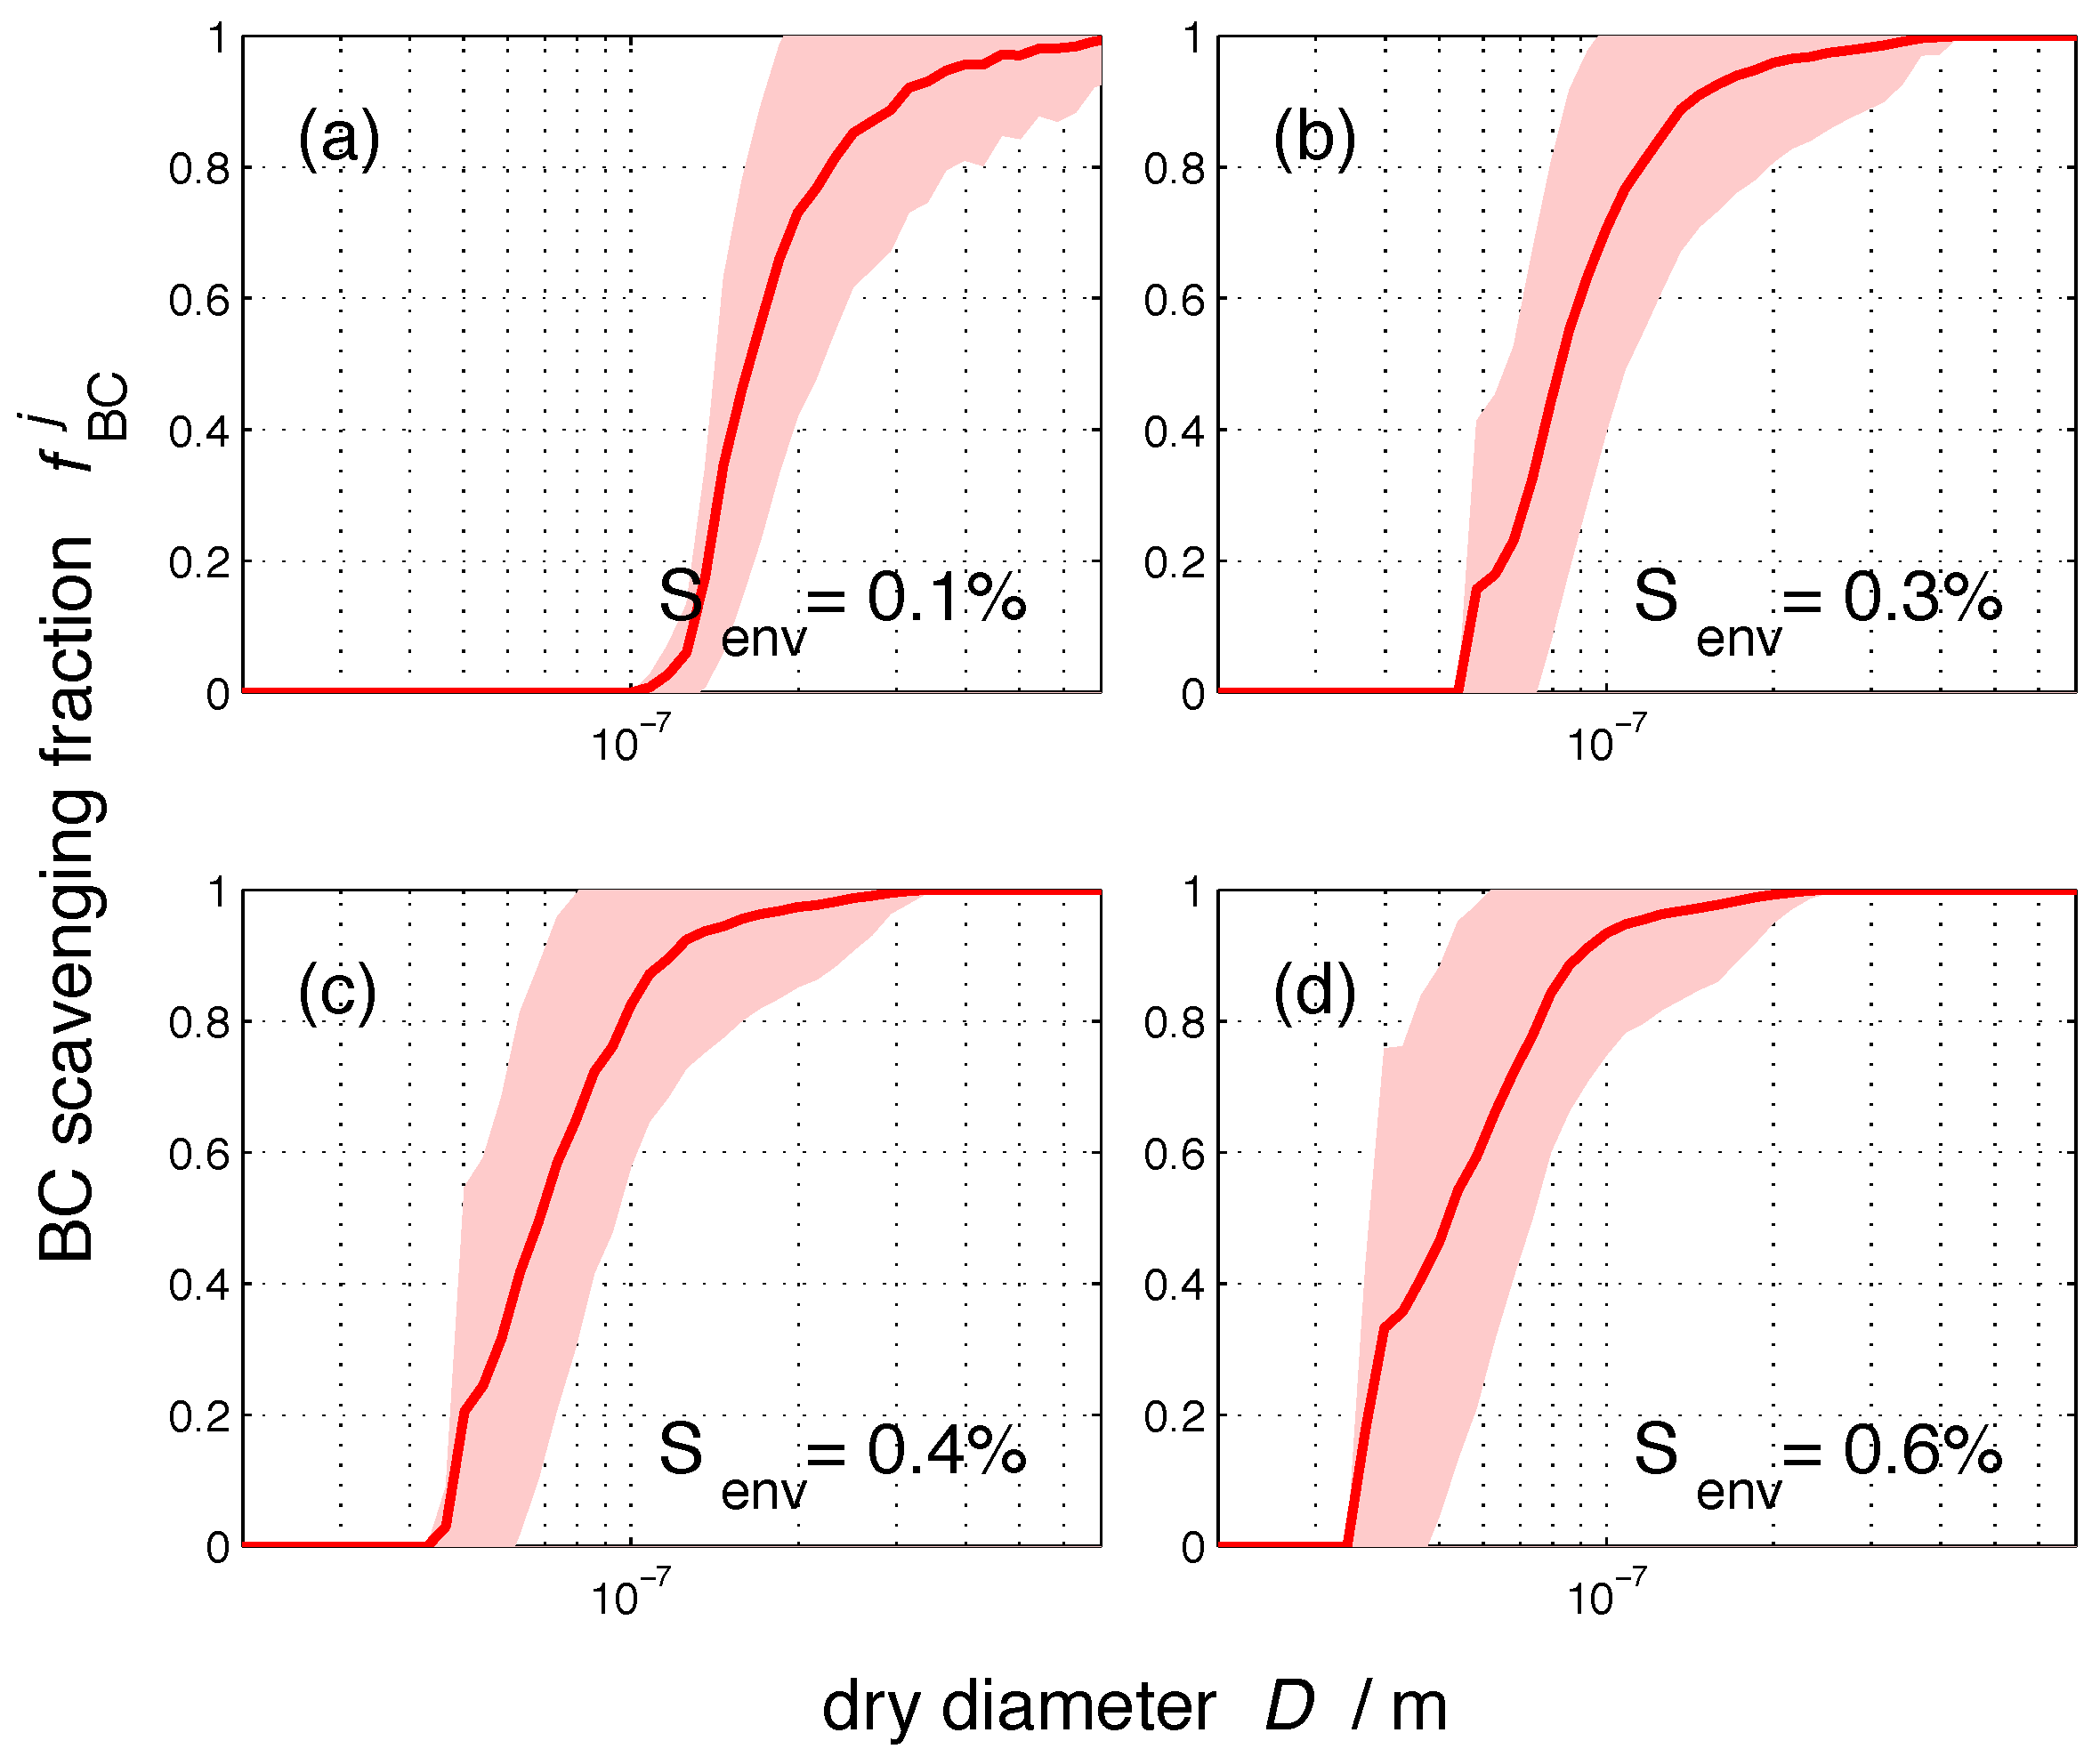
Figure 5 shows the nucleation-scavenged BC mass fraction as a function of particle dry diameter D. As before, the solid line represents the average for the 384 populations, and the color shading represents one standard deviation. For any given environmental supersaturation, the range of nucleation-scavenged BC fractions is largest when the slope of the spectrum is large. For example, for a 100-nm particle at a supersaturation of 0.3%, is on average 0.71 with a standard deviation of . This variability is introduced by the different particle compositions for any given population. The size range with the largest sensitivity to composition depends on the environmental supersaturation. Just as the core size was not a good predictor by itself for the amount of BC that can be incorporated in cloud droplets, the dry diameter alone is also not sufficient to predict .
3.2. Nucleation-Scavenged BC Mass Fraction and Aerosol Mixing State
After presenting the range of values and their dependence on BC core diameter, dry diameter, and environmental supersaturation threshold, we will now turn to quantifying the importance of mixing state in determining the nucleation-scavenged BC mass fraction (not size-resolved).
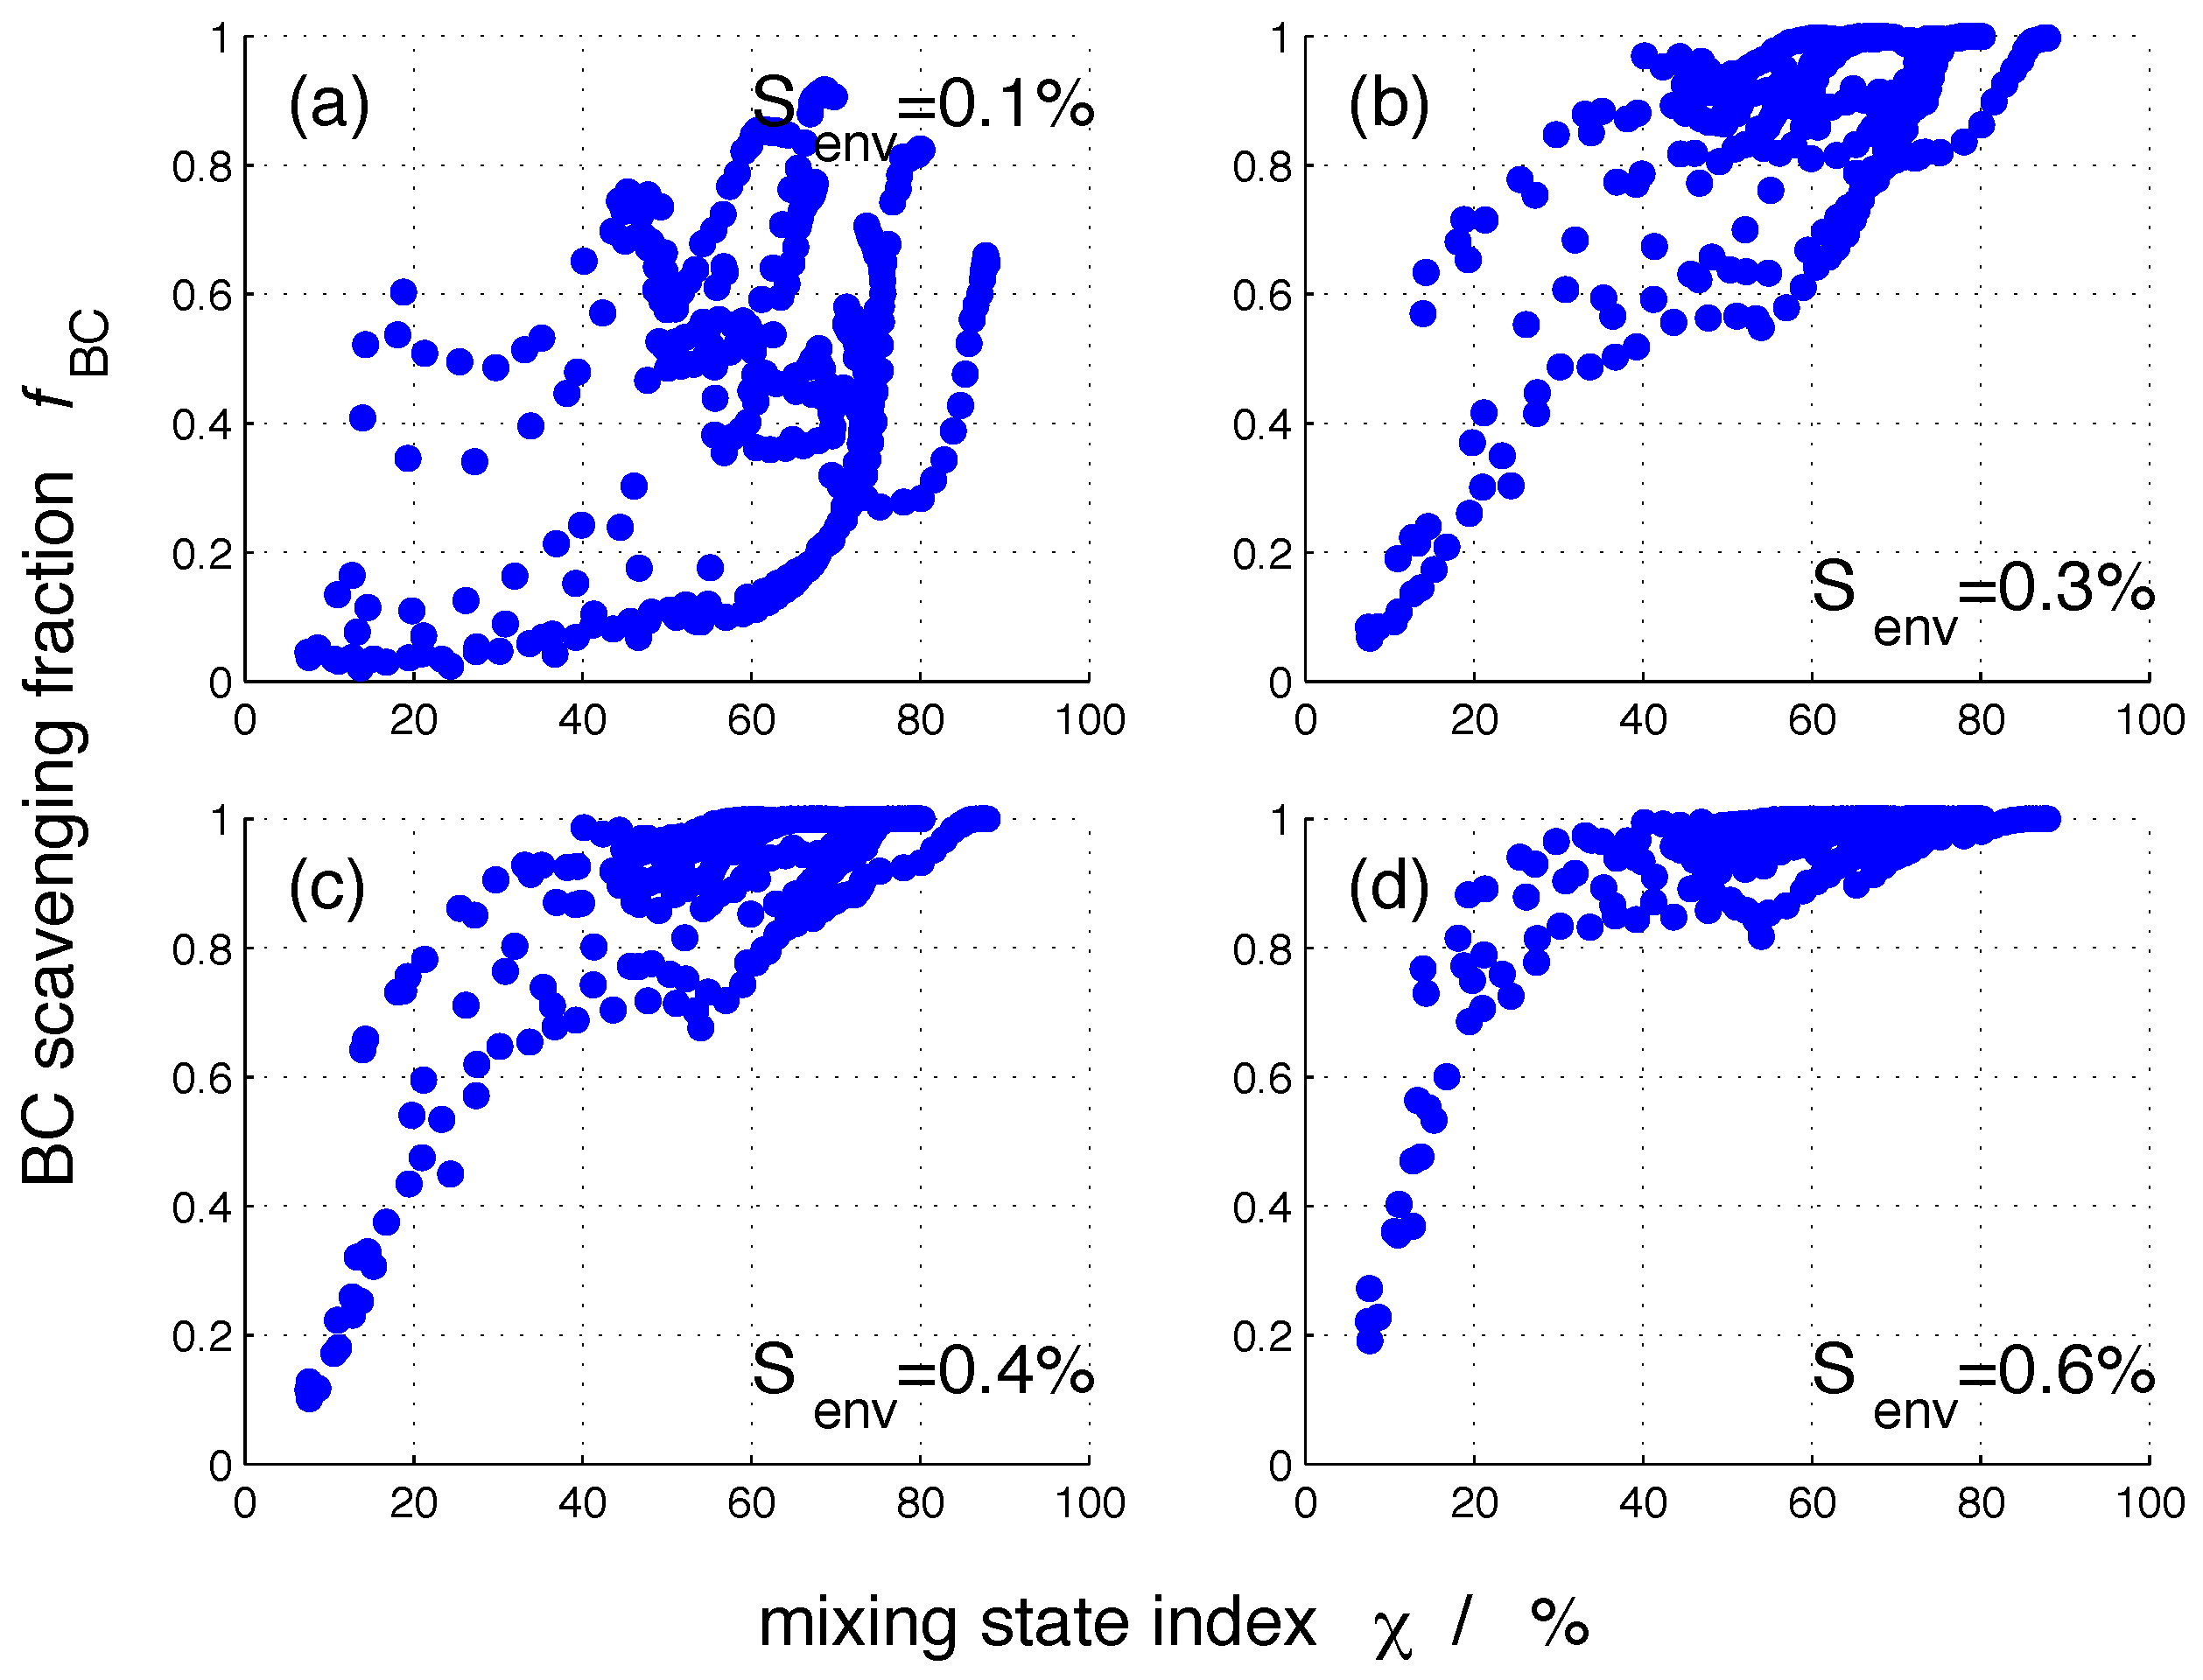
Figure 6 shows the nucleation-scavenged BC mass fraction, , for all 384 populations as a function of mixing state parameter . As expected, one value can correspond to a range of values. As the environmental supersaturation increases, low values for only occur for more externally mixed populations. For example, for of 0.1%, we find of less than 20% for values up to 70%. In contrast, for of 0.6%, reaches as low as 20% only for the population with the lowest of 8%.
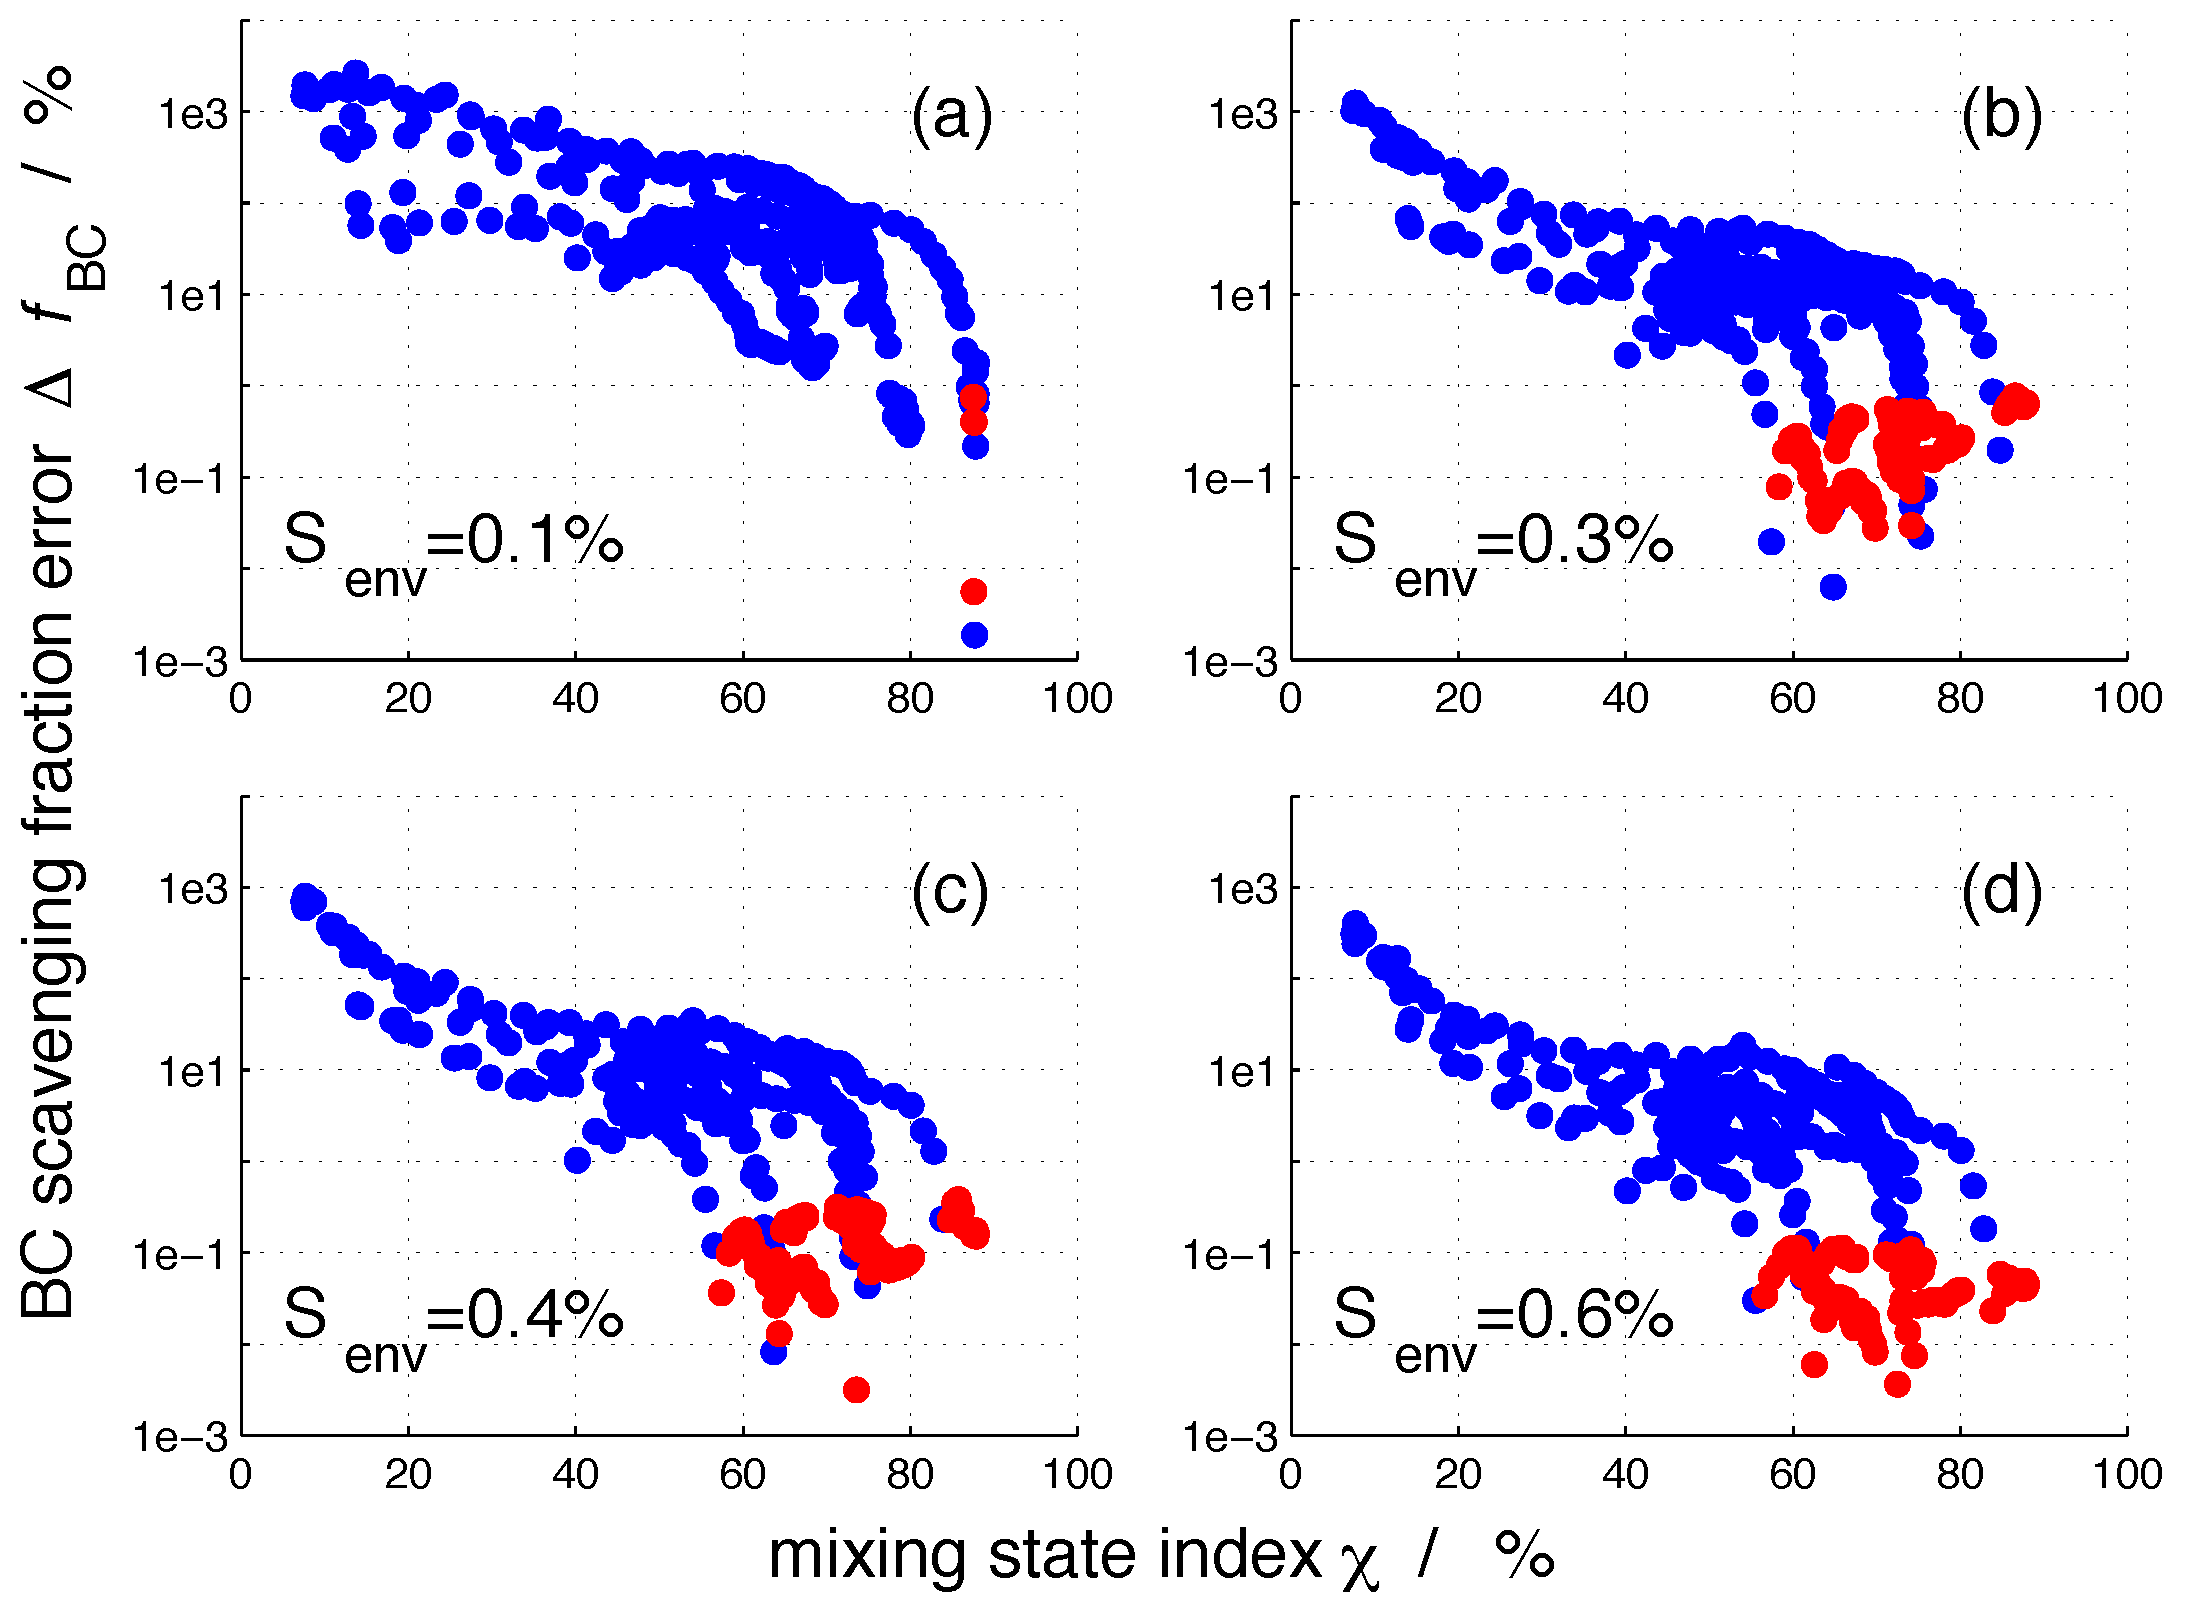
The four panels of Figure 7 show the absolute value of the error in nucleation-scavenged BC mass fraction, (Equation (4)), at four selected supersaturations (, , and ) for all 384 aerosol populations. For the sake of clarity, we used a logarithmic scale for the ordinate, and we took the absolute value of before taking its logarithmic value to avoid handling negative values, which represent an underestimation of after composition averaging. These cases are indicated by red dots in Figure 7.
The maximum values for were on the order of several thousand percent and occurred for the most externally mixed populations. For such populations, the corresponding value for was small, 10% or less. As expected, the error decreased when the aerosol population became more internally mixed. For more internally-mixed aerosol populations, particles have more similar compositions than for more externally-mixed populations. Consequently, the modifications of the composition averaging procedure are less severe. This is consistent with the previous findings regarding errors in CCN concentrations presented in [34]. For any given value, a range of existed due to the different extent of modifications to the per-particle composition by composition averaging [34].
As increased, the error decreased more quickly for larger environmental supersaturations. For example, for a low supersaturation value such as %, dropped below 10% only for populations with mixing state index larger than 84%. In constrast, for %, this was the case already for populations with around 60%. It follows that the highest errors can be expected for aerosol populations having small values at low environmental supersaturations.
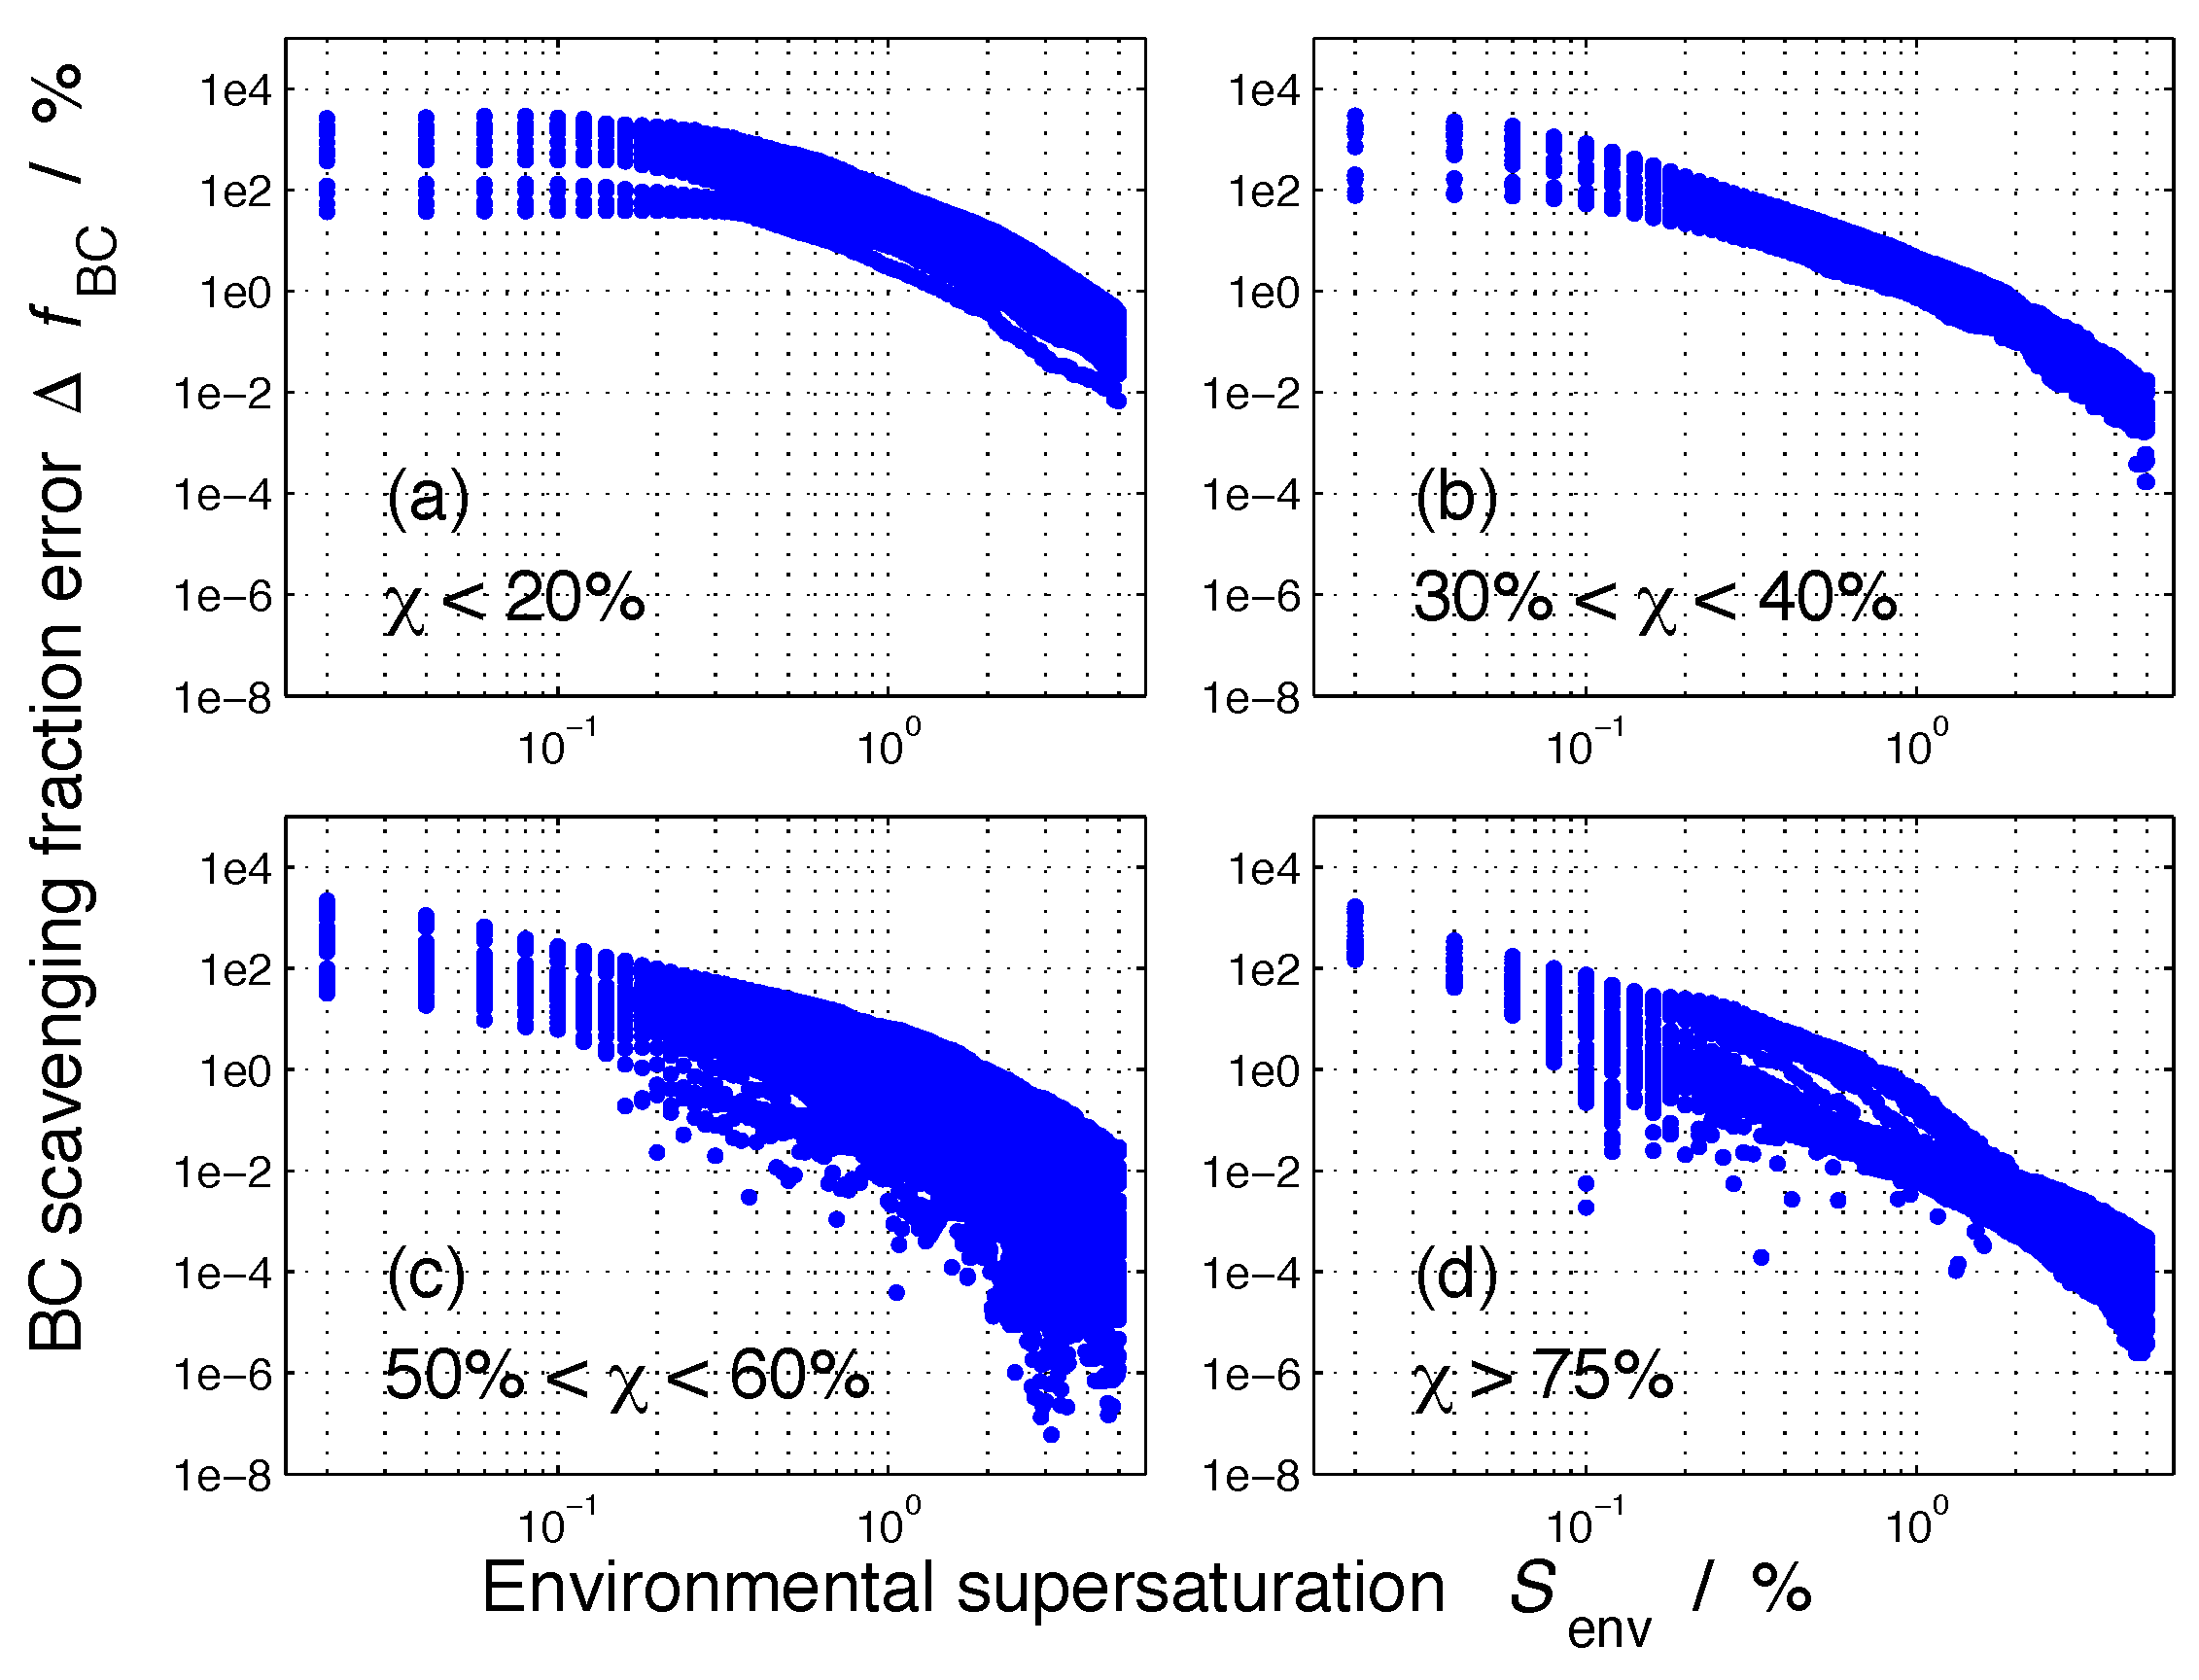
We can also display these results by showing the error as a function of supersaturation as in Figure 8. The four panels separate the populations according to their mixing state index. This figure shows that for quite internally mixed populations ( 75%), the error was larger than 100% only for supersaturations of 0.1% or lower, while for quite externally mixed populations ( 20%), the error could reach above 100% even at supersaturations of 1%.
Since we averaged the chemical composition of all the particles in the population, irrespective of the particle-size, the values presented in Figure 7 represent an upper estimate of . Figure S4 in the Supplemental Material shows the error when the composition averaging is performed within size bins, rather than for the entire population. Here, we used five size bins per decade.
For completeness, we show number-based nucleation scavenging fractions, and associated errors in the Supplemental Material (Figures S5 and S6). We conclude that the error in the nucleation-scavenged BC mass fraction, , exceeded the error of the nucleation-scavenged BC number fraction, , for more externally-mixed populations ( < ), in some cases by over an order of magnitude. For more internally-mixed populations ( > ), was comparable to , if not smaller. These results are consistent to the ones shown in [34], where the error in CCN/CN ratio was quantified, which is a similar metric to .
4. Conclusions
This study presents an analysis of the nucleation-scavenged BC mass fraction, , simulated by the particle-resolved model PartMC-MOSAIC for a wide range of environmental conditions, and quantifies the error that is introduced when calculating and assuming internal mixture. PartMC-MOSAIC simulates changes in particle composition due to coagulation and the formation of inorganic and organic secondary aerosol species. Other aging processes, such as aerosol in-cloud processing or heterogeneous reactions, were not included in this study.
The BC mass fraction that can be incorporated in cloud droplets depends on the size of the BC cores, the amount of coating of secondary aerosol, and the environmental supersaturation. In qualitative consistency with observational findings, our results show that increases for larger black carbon core sizes. However, the existence of coatings and the environmental supersaturation introduces a large variability.
To determine the error in when assuming internal mixture, we applied the framework developed in [34], and related the mixing state index [1] to the error . The error depended on both environmental supersaturation and . In general, for a given value, was smaller at higher supersaturation. As increased, decreased more quickly for higher supersaturations.
As aerosol populations become increasingly internally mixed, decreases. For example, for more externally mixed populations ( < ), could be overestimated by more than 1000% at supersaturations of , while for > , is below for the range of supersaturations (from to ) investigated here.
Since nucleation-scavenging is the principal process for removing BC-containing aerosols [19,20], capturing the evolution of BC aerosol mixing state in models is essential for determining the atmospheric lifetime, burden, vertical profile, and long-range transport of BC-containing aerosols in the atmosphere. In this regard, recent advancements in modeling aerosol mixing state could improve the understanding of the vertical variation of BC mixing state and the associated wet deposition process [48]. Meanwhile, measurements of vertical profiles of BC-containing aerosols would be valuable in evaluating regional and global models’ simulated BC spatial distributions [49]. Accounting for aerosol mixing state in evaluating the spatial and temporal distribution of BC-containing aerosols would be a benefit, if not a strict prerequisite, to further constrain the radiative forcing uncertainty of BC-containing aerosols in future studies.
Supplementary Materials
The following are available online at www.mdpi.com/2073-4433/9/1/17/s1, Figure S1: Size-resolved nucleation-scavenged BC number fraction, as a function of black carbon core diameter, at four selected supersaturation values; Figure S2: Nucleation-scavenged BC number fraction for selected size ranges as a function of supersaturation; Figure S3: BC mass size distributions as a function of BC core diameter for the nucleation-scavenged BC-containing particles, and for all BC-containing particles for selected supersaturations; Figure S4: Absolute value of the error in black carbon nucleation-scavenged mass fraction, with size-resolved composition-averaged aerosol populations and for composition-averaging of the entire population, at four selected supersaturation values as a function of mixing state index ; Figure S5: Total nucleation-scavenged BC number fraction, , as a function of aerosol mixing state index , at four selected supersaturation values; Figure S6: Error in total nucleation-scavenged BC number fraction, , as a function of aerosol mixing state index , at four selected supersaturation values.
Acknowledgments
Joseph Ching’s research was supported by the Environmental Research and Technology Development Fund (5-1605) of the Environmental Restoration and Conservation Agency (ERCA), Japan. Matthew West acknowledges an National Science Foundation Civil, Mechanical and Manufacturing Innovation (NSF CMMI) CAREER grant 1150490 and Department of Energy, Atmospheric System Research (DOE ASR) grant DE-SC0011771. Nicole Riemer was supported by an National Science Foundation, Atmospheric and Geospace Sciences NSF AGS CAREER grant 1254428.
Author Contributions
J.C., M.W., and N.R. designed the experiments, analyzed the model results, and wrote the paper. J.C. performed the model simulations.
Conflicts of Interest
The authors declare no conflict of interest. The funding sponsors had no role in the design of the study; in the collection, analyses, or interpretation of data; in the writing of the manuscript, and in the decision to publish the results.
References
- Riemer, N.; West, M. Quantifying aerosol mixing state with entropy and diversity measures. Atmos. Chem. Phys. 2013, 13, 11423–11439. [Google Scholar] [CrossRef]
- Pöschl, U. Atmospheric Aerosols: Ccomposition, Transformation, Climate and Health Effects. Angew. Chem. Int. Ed. 2005, 44, 7520–7540. [Google Scholar] [CrossRef] [PubMed]
- Hansen, A.D.; Bodhaine, B.A.; Dutton, E.G.; Schnell, R.C. Aerosol black carbon measurement at the South Pole: Initial results 1986–1987. Geophys. Res. Lett. 1988, 15, 1193–1196. [Google Scholar] [CrossRef]
- Hansen, J.; Nazarenko, L. Soot climate forcing via snow and ice albedos. PNAS 2004, 101, 423–428. [Google Scholar] [CrossRef] [PubMed]
- Bond, T.C.; Doherty, S.J.; Fahey, D.W.; Forester, P.M.; Berntsen, T.; DeAngelo, B.J.; Flanner, M.G.; Ghan, S.; Kärcher, B.; Koch, D.; et al. Bounding the role of black carbon in the climate system: A scientific assessment. J. Geophys. Res. 2013, 118, 5380–5552. [Google Scholar] [Green Version]
- Hansen, J.; Sato, M.; Ruedy, R. Radiative forcing and climate response. J. Geophys. Res. Atmos. 1997, 102, 6831–6864. [Google Scholar] [CrossRef]
- Ackerman, A.S.; Toon, O.B.; Stevens, D.E.; Heymsfield, A.J.; Ramanathan, V.; Welton, E.J. Reduction of tropical cloudiness by soot. Science 2000, 288, 1042–1047. [Google Scholar] [CrossRef] [PubMed]
- Koch, D.; Schulz, M.; Kinne, S.; McNaughton, C.; Spackman, J.R.; Balkanski, Y.; Bauer, S.; Berntsen, T.; Bond, T.C.; Boucher, O.; et al. Evaluation of black carbon estimations in global aerosol models. Atmos. Chem. Phys. 2009, 9, 9001–9026. [Google Scholar] [CrossRef]
- Koch, D.; Genio, A.D.D. Black carbon semi-direct effects on cloud cover: Review and synthesis. Atmos. Chem. Phys. 2010, 10, 7685–7696. [Google Scholar] [CrossRef] [Green Version]
- Chylek, P.; Hallett, J. Enhanced absorption of solar radiation by cloud droplets containing soot particles in their surface. Q. J. R. Meteorol. Soc. 1992, 118, 167–172. [Google Scholar] [CrossRef]
- Wendisch, M.; Mertens, S.; Ruggaber, A.; Nakajima, T. Vertical profiles of aerosol and radiation and the influence of a temperature inversion: Measurements and radiative transfer calculations. J. Appl. Meteorol. 1996, 35, 1703–1715. [Google Scholar] [CrossRef]
- Flanner, M.G.; Zender, C.S.; Randerson, J.T.; Rasch, P.J. Present day climate forcing and response from black carbon in snow. J. Geophys. Res. 2007, 112. [Google Scholar] [CrossRef]
- Samset, B.H.; Myhre, G.; Herber, A.; Kondo, Y.; Li, S.M.; Moteki, N.; Koike, M.; Oshima, N.; Schwarz, J.P.; Balkanski, Y.; et al. Modelled black carbon radiative forcing and atmospheric lifetime in AeroCom Phase II constrained by aircraft observations. Atmos. Chem. Phys. 2014, 14, 12465–12477. [Google Scholar] [CrossRef]
- Wilcox, E.M.; Thomas, R.M.; Praveen, P.S.; Pistone, K.; Bender, F.A.M.; Ramanathan, V. Black carbon solar absorption suppresses turbulence in the atmospheric boundary layer. Proc. Natl. Acad. Sci. USA 2015, 113, 11794–11799. [Google Scholar] [CrossRef] [PubMed]
- Ding, A.; Huang, X.; Nie, W.; Sun, J.; Kerminen, V.M.; Petäjä, T.; Su, H.; Cheng, Y.; Yang, X.Q.; Wang, M.; et al. Enhanced haze pollution by black carbon in megacities in China. Geophys. Res. Lett. 2016, 43, 2873–2879. [Google Scholar] [CrossRef]
- Chen, W.; Lee, Y.H.; Adams, P.J.; Nenes, A.; Seinfeld, J.H. Will black carbon mitigation dampen aerosol indirect forcing? Geophys. Res. Lett. 2010, 37, L09801. [Google Scholar] [CrossRef]
- Bond, T.C.; Sun, H. Can reducing black carbon emissions counteract global warming? Environ. Sci. Technol. 2005, 39, 5921–5926. [Google Scholar] [CrossRef] [PubMed]
- Jacobson, M.Z. Short-term effects of controlling fossil-fuel soot, biofuel soot and gases, and methane on climate, Arctic ice, and air pollution health. J. Geophys. Res. 2010, 115. [Google Scholar] [CrossRef]
- Ohata, S.; Moteki, N.; Mori, T.; Koike, M.; Kondo, Y. A key process controlling the wet removal of aerosols: New observational evidence. Sci. Rep. 2016, 6, 34113. [Google Scholar] [CrossRef] [PubMed]
- Schroder, J.C.; Hanna, S.J.; Modini, R.L.; Corrigan, A.L.; Kreidenwies, S.M.; Macdonald, A.M.; Noone, K.J.; Russell, L.M.; Leaitch, W.R.; Bertram, A.K. Size-resolved observations of refractory black carbon particles in cloud droplets at a marine boundary layer site. Atmos. Chem. Phys. 2015, 15, 1367–1383. [Google Scholar] [CrossRef]
- Weingartner, E.; Burtscher, H.; Baltensperger, H. Hygroscopic properties of carbon and diesel soot particles. Atmos. Environ. 1997, 31, 2311–2327. [Google Scholar] [CrossRef]
- Hitzenberger, R.; Berner, A.; Giebl, H.; Drobesch, K.; Kasper-Giebl, A.; Loeflund, M.; Urban, H.; Puxbaum, H. Black carbon (BC) in alpine aerosols and cloud water—Concentrations and scavenging efficiencies. Atmos. Environ. 2001, 35, 5135–5141. [Google Scholar] [CrossRef]
- Cozic, J.; Verheggen, B.; Mertes, S.; Connolly, P.; Bower, K.; Petzold, A.; Baltensperger, U.; Weingartner, E. Scavenging of black carbon in mixed phase clouds at the high alpine site Jungfraujoch. Atmos. Chem. Phys. 2007, 7, 1797–1807. [Google Scholar] [CrossRef]
- Hallberg, A.; Ogren, J.; Noone, K.; Heintzenberg, J.; Berner, A.; Solly, I.; Kruisz, C.; Reischl, G.; Fuzzi, S.; Facchini, M.; et al. Phase partitioning for different aerosol species in fog. Tellus B 1992, 44, 545–555. [Google Scholar] [CrossRef]
- Hallberg, A.; Noone, K.; Ogren, J.; Svenningsson, I.; Flossmann, A.; Wiedensohler, A.; Hansson, H.C.; Heintzenberg, J.; Anderson, T.; Arends, B.; et al. Phase partitioning of aerosol particles in clouds at Kleiner Feldberg. J. Atmos. Chem. 1994, 19, 107–127. [Google Scholar] [CrossRef]
- Sellegri, K.; Laj, P.; Dupuy, R.; Legrand, M.; Preunkert, S.; Putaud, J.P. Size-dependent scavenging efficiencies of multicomponent atmospheric aerosols in clouds. J. Geophys. Res. Atmos. 2003, 108. [Google Scholar] [CrossRef]
- Kasper-Giebl, A.; Koch, A.; Hitzenberger, R.; Puxbaum, H. Scavenging efficiency of ‘aerosol carbon’ and sulfate in supercooled clouds at Mt. Sonnblick (3106 m asl, Austria). J. Atmos. Chem. 2000, 35, 33–46. [Google Scholar] [CrossRef]
- Gieray, R.; Wieser, P.; Engelhardt, T.; Swietlicki, E.; Hansson, H.C.; Mentes, B.; Orsini, D.; Martinsson, B.; Svenningsson, B.; Noone, K.; et al. Phase partitioning of aerosol constituents in cloud based on single-particle and bulk analysis. Atmos. Environ. 1997, 31, 2491–2502. [Google Scholar] [CrossRef]
- Hitzenberger, R.; Berner, A.; Kromp, R.; Kasper-Giebl, A.; Limbeck, A.; Tscherwenka, W.; Puxbaum, H. Black carbon and other species at a high-elevation European site (Mount Sonnblick, 3106 m, Austria): Concentrations and scavenging efficiencies. J. Geophys. Res. Atmos. 2000, 105, 24637–24645. [Google Scholar] [CrossRef]
- Heintzenberg, J.; Leck, C. Seasonal variation of the atmospheric aerosol near the top of the marine boundary layer over Spitsbergen related to the Arctic sulphur cycle. Tellus B Chem. Phys. Meteorol. 1994, 46, 52–67. [Google Scholar] [CrossRef]
- Winkler, P. The growth of atmosphierc aerosol particles as a function of the relative humidity—II. an improved concept of mixed nuclei. Aerosol Sci. 1973, 4, 373–387. [Google Scholar] [CrossRef]
- Ching, J.; Riemer, N.; West, M. Impacts of black carbon mixing state on black carbon nucleation scavenging: Insights from a particle-resolved model. J. Geophys. Res. Atmos. 2012, 117. [Google Scholar] [CrossRef]
- Ching, J.; Riemer, N.; West, M. Impacts of black carbon particles mixing state on cloud microphysical properties: Sensitivity to environmental conditions. J. Geophys. Res. Atmos. 2016, 121, 5990–6013. [Google Scholar] [CrossRef]
- Ching, J.; Fast, J.; West, M.; Riemer, N. Metrics to quantify the importance of mixing state for CCN activity. Atmos. Chem. Phys. 2017, 17, 7445–7458. [Google Scholar] [CrossRef]
- Riemer, N.; West, M.; Zaveri, R.; Easter, R. Simulating the evolution of soot mixing state with a particle-resolved aerosol model. J. Geophys. Res. Atmos. 2009, 114, D09202. [Google Scholar] [CrossRef]
- Zaveri, R.A.; Easter, R.C.; Fast, J.D.; Peters, L.K. Model for Simulating Aerosol Interactions and Chemistry (MOSAIC). J. Geophys. Res. Atmos. 2008, 113, D13204. [Google Scholar] [CrossRef]
- Zaveri, R.A.; Peters, L.K. A new lumped structure photochemical mechanism for large-scale applications. J. Geophys. Res. Atmos. 1999, 104, 30387–30415. [Google Scholar] [CrossRef]
- Schell, B.; Ackermann, I.J.; Binkowski, F.S.; Ebel, A. Modeling the formation of secondary organic aerosol within a comprehensive air quality model system. J. Geophys. Res. 2001, 106, 28275–28293. [Google Scholar] [CrossRef]
- Zaveri, R.; Barnard, J.; Easter, R.; Riemer, N.; West, M. Particle-resolved simulation of aerosol size, composition, mixing state, and the associated optical and cloud condensation nuclei activation properties in an evolving urban plume. J. Geophys. Res. Atmos. 2010, 115, D17210. [Google Scholar] [CrossRef]
- Kaiser, J.; Hendricks, J.; Righi, M.; Riemer, N.; Zaveri, R.A.; Metzger, S.; Aquila, V. The MESSy aerosol submodel MADE3 (v2. 0b): Description and a box model test. Geosci. Model Dev. 2014, 7, 1137–1157. [Google Scholar] [CrossRef] [Green Version]
- Fierce, L.; Bond, T.C.; Bauer, S.E.; Mena, F.; Riemer, N. Black carbon absorption at the global scale is affected by particle-scale diversity in composition. Nat. Commun. 2016, 7, 12361. [Google Scholar] [CrossRef] [PubMed]
- Fierce, L.; Riemer, N.; Bond, T.C. Toward reduced representation of mixing state for simulating aerosol effects on climate. Bull. Am. Meteorol. Soc. 2017, 98, 971–980. [Google Scholar] [CrossRef]
- Tian, J.; Brem, B.; West, M.; Bond, T.; Rood, M.; Riemer, N. Simulating aerosol chamber experiments with the particle-resolved aerosol model PartMC. Aerosol Sci. Technol. 2017, 51, 856–867. [Google Scholar] [CrossRef]
- Riemer, N.; West, M.; Zaveri, R.; Easter, R. Estimating black carbon aging time-scales with a particle-resolved aerosol model. J. Aerosol Sci. 2010, 41, 143–158. [Google Scholar] [CrossRef]
- Fierce, L.; Riemer, N.; Bond, T.C. Explaining variance in black carbon’s aging timescale. Atmos. Chem. Phys. 2015, 15, 3173–3191. [Google Scholar] [CrossRef]
- United States Environmental Protection Agency. Report to Congress on Black Carbon; Technical Report EPA-450/R-12-001; United States Environmental Protection Agency: Washington, DC, USA, 2012.
- Petters, M.D.; Kreidenweis, S.M. A single parameter representation of hygroscopic growth and cloud condensation nucleus activity. Atmos. Chem. Phys. 2007, 7, 1961–1971. [Google Scholar] [CrossRef]
- Curtis, J.H.; Riemer, N.; West, M. A single-column particle-resolved model for simulating the vertical distribution of aerosol mixing state: WRF-PartMC-MOSAIC-SCM v1.0. Geosci. Model Dev. 2017, 10, 4057–4079. [Google Scholar] [CrossRef]
- Oshima, N.; Kondo, Y.; Moteki, N.; Takegawa, N.; Koike, M.; Kita, K.; Matsui, H.; Kajino, M.; Nakamura, H.; Jung, J.; et al. Wet removal of black carbon in Asian outflow: Aerosol Radiative Forcing in East Asia (A-FORCE) aircraft campaign. J. Geophys. Res. 2012, 117. [Google Scholar] [CrossRef]
Figure 1.
Number concentration in two-dimensional space of dry diameter and black carbon mass fraction, , for four example populations that differ in mixing state index .
Figure 1.
Number concentration in two-dimensional space of dry diameter and black carbon mass fraction, , for four example populations that differ in mixing state index .

Figure 2.
Conceptual framework for error quantification; see Section 2.3 for details. (a) / for the reference case; (b) after composition averaging; (c) resulting nucleation-scavenged black carbon mass fractions; (d) error in nucleation-scavenged BC fraction as a function of mixing state.
Figure 2.
Conceptual framework for error quantification; see Section 2.3 for details. (a) / for the reference case; (b) after composition averaging; (c) resulting nucleation-scavenged black carbon mass fractions; (d) error in nucleation-scavenged BC fraction as a function of mixing state.

Figure 3.
The size-resolved nucleation-scavenged black carbon (BC) mass fraction, , as a function of black carbon core diameter, , at four selected supersaturation values: 0.1%, 0.3%, 0.4%, and 0.6%. The solid line represents the average over the 384 populations, and the color shading indicates one standard deviation. The orange and blue shaded boxes indicate the values that were obtained from field studies by [19,20], respectively.

Figure 4.
The nucleation-scavenged BC mass fraction, , for selected size ranges as a function of supersaturation. The solid line represents the average over the 384 populations, and the color shading indicates one standard deviation.
Figure 4.
The nucleation-scavenged BC mass fraction, , for selected size ranges as a function of supersaturation. The solid line represents the average over the 384 populations, and the color shading indicates one standard deviation.

Figure 5.
The size-resolved nucleation-scavenged BC mass fraction, , as a function of dry diameter, D, at four selected supersaturation values: 0.1%, 0.3%, 0.4%, and 0.6%. The solid line represents the average over the 384 populations, and the color shading indicates one standard deviation.
Figure 5.
The size-resolved nucleation-scavenged BC mass fraction, , as a function of dry diameter, D, at four selected supersaturation values: 0.1%, 0.3%, 0.4%, and 0.6%. The solid line represents the average over the 384 populations, and the color shading indicates one standard deviation.

Figure 6.
Nucleation-scavenged BC mass fraction, , for the 384 aerosol populations for selected supersaturations as a function of mixing state index . The definition of mixing state index is described in Section 2.2.
Figure 6.
Nucleation-scavenged BC mass fraction, , for the 384 aerosol populations for selected supersaturations as a function of mixing state index . The definition of mixing state index is described in Section 2.2.

Figure 7.
The absolute value of the error in nucleation-scavenged black carbon mass fraction, , for the 384 aerosol populations for selected supersaturations as a function of mixing state index . The definition of the error in the BC nucleation-scavenging fraction is given by Equation (4). The definition of mixing state index is described in Section 2.2. The red dots indicate cases where is negative, and the blue dots represent cases where is positive.

Figure 8.
The absolute value of the error in nucleation-scavenged black carbon mass fraction, , for the 384 aerosol populations for selected ranges of mixing state index, , as a function of environmental supersaturation, .
Figure 8.
The absolute value of the error in nucleation-scavenged black carbon mass fraction, , for the 384 aerosol populations for selected ranges of mixing state index, , as a function of environmental supersaturation, .


Table 1.
Nucleation-scavenged black carbon (BC) mass fraction measurements from previous campaigns. This table is adapted from [22,23].
| Sampling Site | Citations | Environment | Average Scavenged BC Mass Fraction |
|---|---|---|---|
| Po Valley, Italy | [24] | Urban | 0.06 |
| Kleiner Feldberg, Germany | [25] | Rural | 0.15 |
| Puy de Dome, France | [26] | Mid altitude (1465 m) | 0.33 |
| Mt. Sonnblick, Austria | [27] | Mid altitude (3106 m) | 0.45 |
| Rax, Austria | [22] | Mid altitude (1644 m) | 0.54 |
| Great Dun Fell, UK | [28] | Rural-Coastal | 0.57 |
| Jungfraujoch, Switzerland | [23] | High altitude (3850 m) | 0.61 |
| Mt. Sonnblick, Austria | [29] | High altitude (3106 m) | 0.74 |
| Spitzbergen, Norway | [30] | Arctic | 0.80 |
| Mt. Soledad, La Jolla, USA | [20] | Marine-Coastal | 0.01–0.1 |
| Tokyo, Japan | [19] | Urban | 0.1–1.0 |
Table 2.
Size distribution and composition of aerosol emissions prescribed in simulations. BC stands for black carbon and POA stands for primary organic carbon.
Table 2.
Size distribution and composition of aerosol emissions prescribed in simulations. BC stands for black carbon and POA stands for primary organic carbon.
| Emission | Emission Strength () | Mean Diameter (m) | Geometric Standard Deviation | Composition by Mass |
|---|---|---|---|---|
| Meat cooking | 0.0864 | 1.9 | POA | |
| Diesel vehicles | 0.05 | 1.7 | POA, BC | |
| Gasoline vehicles | 0.05 | 1.7 | POA, BC |
Table 3.
Size distribution and composition of initial conditions and background aerosols prescribed in simulations.
Table 3.
Size distribution and composition of initial conditions and background aerosols prescribed in simulations.
| Initial/Background | Number Concentration () | Mean Diameter (m) | Geometric Standard Deviation | Composition by Mass |
|---|---|---|---|---|
| Aitken mode | 0.02 | 1.45 | ||
| SOA | ||||
| BC | ||||
| Accumulation mode | 0.116 | 1.65 | ||
| SOA | ||||
| BC |
Table 4.
Initial conditions and background mixing ratios (second column) and twelve-hour average emission (third column) prescribed in simulations of gaseous species for the ten environmental scenarios.
Table 4.
Initial conditions and background mixing ratios (second column) and twelve-hour average emission (third column) prescribed in simulations of gaseous species for the ten environmental scenarios.
| Chemical Species | Mixing Ratio (ppbv) | Emission Flux () |
|---|---|---|
| Nitrogen oxide | 0.1 | 15.9 |
| Nitrogen dioxide | 1.0 | 0.84 |
| Nitric acid | 1.0 | - |
| Ozone | 50.0 | - |
| Hydrogen peroxide | 1.1 | - |
| Carbon monoxide | 80 | 291.3 |
| Sulfur dioxide | 0.8 | 2.51 |
| Ammonia | 0.5 | 6.11 |
| Hydrogen chloride | 0.7 | - |
| Methane | 2200 | - |
| Ethane | 1.0 | - |
| Formaldehyde | 1.2 | 1.68 |
| Methanol | 0.12 | 0.28 |
| Methyl hydrogen peroxide | 0.5 | - |
| Acetaldehyde | 1.0 | 0.68 |
| Paraffin carbon | 2.0 | 96.0 |
| Acetone | 1.0 | 1.23 |
| Ethene | 0.2 | 7.28 |
| Terminal olefin carbons | 2.43 | |
| Internal olefin carbons | 2.43 | |
| Toluene | 0.1 | 4.04 |
| Xylene | 0.1 | 2.41 |
| Lumped organic nitrate | 0.1 | - |
| Peroxyacetyl nitrate | 0.8 | - |
| Higher organic acid | 0.2 | - |
| Higher organic peroxide | - | |
| Isoprene | 0.5 | 0.23 |
| Alcohols | - | 3.45 |
© 2018 by the authors. Licensee MDPI, Basel, Switzerland. This article is an open access article distributed under the terms and conditions of the Creative Commons Attribution (CC BY) license (http://creativecommons.org/licenses/by/4.0/).
Share and Cite
MDPI and ACS Style
Ching, J.; West, M.; Riemer, N. Quantifying Impacts of Aerosol Mixing State on Nucleation-Scavenging of Black Carbon Aerosol Particles. Atmosphere 2018, 9, 17. https://doi.org/10.3390/atmos9010017
AMA Style
Ching J, West M, Riemer N. Quantifying Impacts of Aerosol Mixing State on Nucleation-Scavenging of Black Carbon Aerosol Particles. Atmosphere. 2018; 9(1):17. https://doi.org/10.3390/atmos9010017
Chicago/Turabian StyleChing, Joseph, Matthew West, and Nicole Riemer. 2018. "Quantifying Impacts of Aerosol Mixing State on Nucleation-Scavenging of Black Carbon Aerosol Particles" Atmosphere 9, no. 1: 17. https://doi.org/10.3390/atmos9010017
Note that from the first issue of 2016, this journal uses article numbers instead of page numbers. See further details here.