Influence of Common Assumptions Regarding Aerosol Composition and Mixing State on Predicted CCN Concentration


1
Department of Atmospheric Sciences, Texas A&M University, College Station, TX 77843, USA
2
Cooperative Institute for Research in Environmental Science (CIRES), University of Colorado, Boulder, CO 80309, USA
3
NOAA Earth System Research Laboratory, Boulder, CO 80305, USA
*
Author to whom correspondence should be addressed.
Atmosphere 2018, 9(2), 54; https://doi.org/10.3390/atmos9020054
Submission received: 26 October 2017
/
Revised: 5 February 2018
/
Accepted: 6 February 2018
/
Published: 8 February 2018
(This article belongs to the Special Issue Morphology and Internal Mixing of Atmospheric Particles)
Abstract
:A 4-year record of aerosol size and hygroscopic growth factor distributions measured at the Department of Energy’s Southern Great Plains (SGP) site in Oklahoma, U.S. were used to estimate supersaturation (S)-dependent cloud condensation nuclei concentrations (NCCN). Baseline or reference NCCN(S) spectra were estimated using κ-Köhler Theory without any averaging of the measured distributions by creating matrices of size- and hygroscopicity-dependent number concentration (N) and then integrating for S > critical supersaturation (Sc) calculated for the same size and hygroscopicity pairs. Those estimates were first compared with directly measured NCCN at the same site. Subsequently, NCCN was calculated using the same dataset but with an array of simplified treatments in which the aerosol was assumed to be either an internal or an external mixture and the hygroscopicity either assumed or based on averages derived from the growth factor distributions. The CCN spectra calculated using the simplified treatments were compared with those calculated using the baseline approach to evaluate the error introduced with commonly used approximations.
1. Introduction
Indirect forcing by aerosols involves complex interactions between the aerosol and clouds that affect the droplet number concentration, albedo, precipitation efficiency, and lifetime of clouds and the chemical processing and scavenging of aerosol particles. Mediating this interaction are cloud condensation nuclei (CCN), which are those particles that activate to form droplets at a given supersaturation (S), known as the critical supersaturation (Sc). In part because of the high temporal and spatial variability of aerosol and clouds, climate model predictions of indirect forcing have a high uncertainty. Estimates of CCN concentration (NCCN) using detailed size-dependent aerosol chemical composition are computationally intensive and simplifications used to minimize computation introduce additional uncertainty.
Methods of determining aerosol activation have evolved to consider complex aerosol composition and structure. Particle Sc can be determined for inorganic species using Köhler Theory, provided the physico-chemical properties of the solutes are known [1]. However, atmospheric aerosols frequently contain a significant amount of organic material as well [2,3]. Compared with soluble inorganic particles, those composed entirely of organic species have higher Sc and are often comparatively inefficient in droplet formation [4,5]. But the solubility and surface tension-reducing properties of the organic component can sometimes have significant influence on Sc [6,7,8,9,10,11,12,13]. Extended Köhler Theory can predict CCN concentration of a multi-component aerosol reasonably well from a description of its size distribution and chemical composition [9,10,14,15,16]. Introduction of a single hygroscopicity parameter by Petters and Kreidenweis [17] has simplified description and comparison of hygroscopicity and CCN activity for particles composed of single or multiple inorganic and organic species [18].
CCN concentration is also dependent upon aerosol mixing state. Previous closure studies have shown that assumption of an internal mixture generally results in an overestimate of the CCN concentration and assumption of an external mixture in an underestimate [19,20,21,22,23,24,25,26,27,28,29,30,31,32,33,34]. However, assumption of either mixing state leads to reasonable results for aged aerosols [35]. While inclusion of mixing state [36,37,38,39,40] and chemical composition [37,38,41,42,43,44] can increase the accuracy with which CCN concentration can be estimated, both can be highly variable with time and with particle size, and are often unavailable with current measurement techniques and not easily incorporated into aerosol descriptions used in models. Moreover, chemical composition and mixing state are greatly simplified in large scale models, with simple categorizations such as inorganic/organic and internal/external mixture. Supporting such treatment, several studies have shown that NCCN is most sensitive to the aerosol size distribution [45,46], and the assumption of internal mixing has resulted in fairly accurate predictions [42,47,48,49,50,51,52]. Ervens et al. [35,53] reported that description of the mixing state is relatively more important than that of the size-resolved chemical composition. Other studies suggest detailed information of size distribution, chemical composition, and mixing state is important for achieving closure among aerosol and CCN measurements [38,43,44,54,55,56,57,58].
Here we use size-resolved aerosol concentration and subsaturated hygroscopicity measurements to estimate CCN concentration using an array of assumptions for composition and mixing state. The data were collected by the U.S. Department of Energy’s (DOE) Atmospheric Radiation Measurement (ARM) program at the Southern Great Plains (SGP) site in rural Oklahoma. The study evaluates NCCN estimation methods of varying degrees of complexity with respect to size, chemical composition, and mixing state. Baseline CCN spectra (NCCN vs. S) were first derived by using (i) each combined set of size and hygroscopicity distributions and (ii) κ-Köhler Theory to create pairs of matrices describing (i) N and (ii) Sc, respectively, as a function of particle dry diameter, Dd, and hygroscopic growth factor, GF. The NCCN(S) for each measurement set was calculated by integrating the N matrix over all elements for which S > Sc. Those results were compared with direct measurements of NCCN made at the site to confirm that the calculated spectra were reasonably accurate. The objective was not to perform a rigorous closure analysis with consideration of measurement uncertainties but rather to simply evaluate the consistency of the datasets. Spectra calculated using a number of alternate approaches and assumptions were then compared to those from the baseline approach and the results were used to consider the scatter and bias introduced with simplifications commonly employed in large scale models.
2. Experiments
2.1. Site Description and Measurements
The data were recorded at the Southern Great Plains (SGP) central facility (CF1) (36°36′18.0″ N, 97°29′6.0″ W), located in a mixed land use area of cattle pastures and agricultural fields (mainly wheat, hay and corn) near Lamont, OK, USA. The climate at the site is continental with hot and humid summers and cool winters. The site is impacted by air masses originating from several regions, with accompanying diversity in aerosol concentration and properties. The chemical composition of the aerosol found at the site is complex and highly variable with time (evident in Figures S1 and S2) and with particle size. The size dependence of aerosol composition as reflected in that of GF was described by Mahish and Collins [59]. Table 1 lists the routine aerosol measurements at the site that were used for the analysis presented here. All datasets used for this analysis are available for download from the ARM archive. Data from the scanning mobility particle sizer (SMPS)/hygroscopicity tandem differential mobility analyzer (HTDMA) system were used for most of the analyses described here. That instrument sequentially measures a size distribution and then a set of hygroscopic growth factor distributions at 7 dry particle sizes every ~45 min. Nafion tube bundles are used to dry the sample flow prior to entering the upstream DMA and to humidify it to 90% RH between the two DMAs when measuring hygroscopicity. The sheath and excess flows are recirculated using a variable speed blower. The sample flow rate is controlled by varying the amount of dilution flow that is introduced upstream of the 3.0 L min−1 TSI 3762 condensation particle counter (CPC). Details of the SMPS/HTDMA system and processing of the data it generates are available in the Tandem Differential Mobility Analyzer/Aerodynamic Particle Sizer handbook posted on the ARM archive site [60] and in the work of Gasparini et al. [61]. As noted above, the calculated CCN spectra were compared with direct measurements at the site made with a DMT CCN-100 counter (CCNc) [62]. The CCNc cycles through 7 fixed supersaturations every half hour. A description of the instrument and data processing is available in the Aerosol Observing System (AOS) handbook [63]. Non-refractory chemical composition and black carbon content measured with an Aerosol Chemical Speciation Monitor [64] and a Particle Soot Absorption Photometer [65] were used in the selection of a representative hygroscopicity of the organic component for use in some of the calculations. Details of those instruments are available in the ACSM [66] and AOS [63] handbooks.
2.2. Screening and Time Interval Selection
Data from each instrument were validated separately and periods having erroneous data or no data were excluded from analysis. Data from time periods during which instrument problems or failure was evident or when one of the following occurred were not used:
- The total particle concentration (NCN) calculated by integrating the SMPS size distribution differed significantly from that directly measured with the CPC
- The NCCN measured with the CCNc exceeded the NCN measured by the CPC, possibly due to malfunction of the CCNc
- The sample flow entering the upstream (1st) DMA had an RH > 30%, or
- The sample flow entering the downstream (2nd) DMA had an RH < 85%.
The categorized data quality during the period of analysis is shown in Figure 1.
2.3. Use of Κ-Köhler Theory
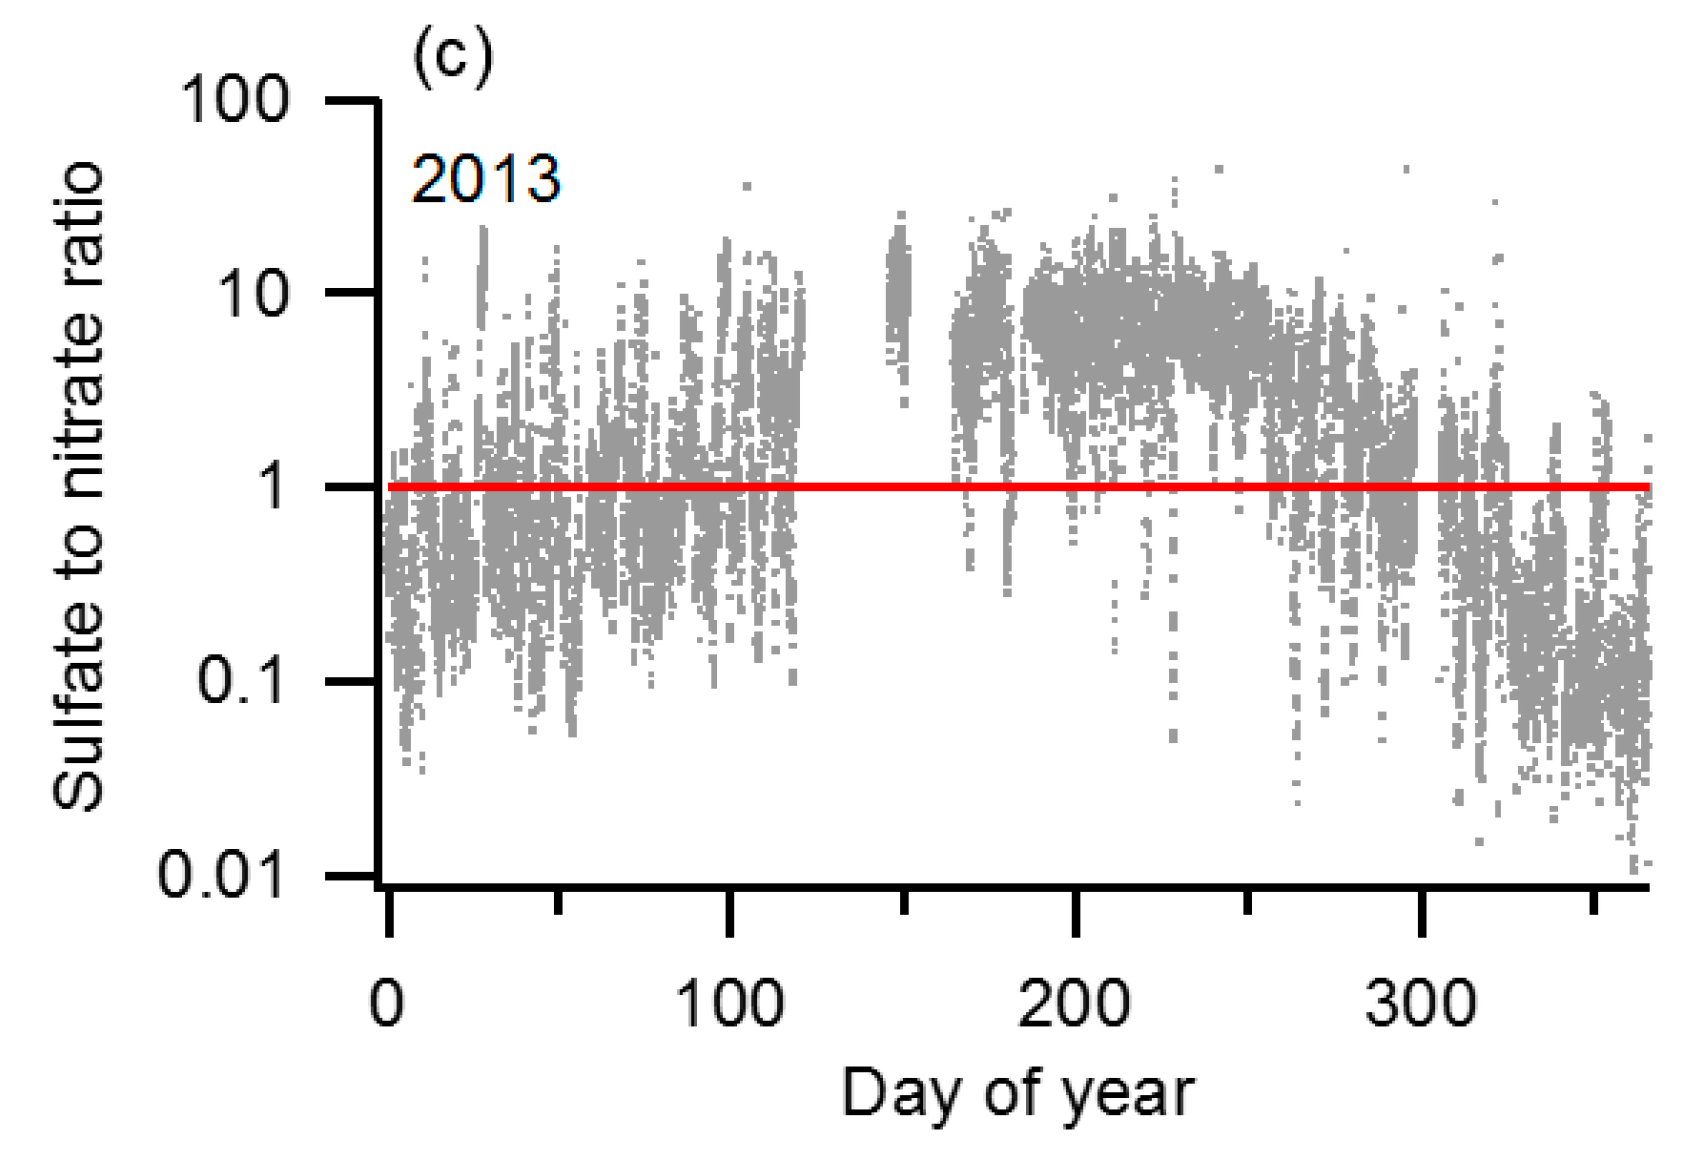
For each of the approaches used to estimate NCCN, the calculation of Sc from measured particle size and measured or assumed hygroscopicity employed κ-Köhler Theory [17]. The κ values of aerosol constituents were assumed to be the same in the aqueous particles as measured in the HTDMA at 90% RH and in the more dilute solutions at the point of activation to form cloud droplets. This has the same effect as assuming that the water activity coefficient in the solutions is constant and that all soluble species are fully dissolved at the RH in the HTMDA. A more accurate treatment for which activity coefficients or κ are calculated as a function of RH (and solution concentration) is not justified because size-resolved composition measurements are not available and the bulk submicron measurements made with the ACSM show the aerosol composition is complex and varies considerably during the year. Specifically, there is a strong seasonality in the soluble inorganic content, with sulfate dominant from roughly April through October and nitrate dominant from November through March, as is evident in the sulfate:nitrate ratio shown in Figure 2. Thus, the choice of soluble inorganic component(s) needed to model the extent and effect of variation in κ between 90% RH and at Sc would vary by month over the 4-year period of this analysis, as well as over shorter periods of days or even hours accompanying changes in the origin and processing of the sampled aerosol. Furthermore, any attempt to estimate RH-dependent changes in κ would require consideration of the influence of the significant organic content at the site. As shown in Table 2, averaged throughout the year organics contribute over 50% to the total submicron mass concentration.
For all CCN concentration estimate approaches for which the HTDMA data were used, GF was related to κ using the following expression from Petters and Kreidenweis [17].
where Mw and are the molecular weight and liquid density of water, respectively. The solution surface tension, σsol, was assumed to be that of pure water, 0.072 J m−2. Because it is assumed that κ values were the same for the more concentrated and the more dilute aqueous solutions in the HTDMA and at activation, respectively, it is not necessary to know the contributions of different aerosol components to the overall hygroscopicity for the internal mixture calculations. But for assumed external mixtures the hygroscopicity of two or more particle types must be determined or assumed. For this analysis, particle types assumed to be present in external mixtures were (i) particles composed of soluble inorganics; (ii) particles composed of soluble organics; and (iii) particles composed of insoluble (and non-hygroscopic) components. The hygroscopicity parameter of the soluble inorganic particles, κinorg, was assumed to be 0.6, which is similar to that of ammonium sulfate and ammonium nitrate. As aerosol organic components at the SGP site are not well characterized, direct derivation of κorg is not possible. Here, κorg was estimated using the mixing rule [17].
For these calculations the total particle volume concentration (Voverall) was determined from the measured size distribution. The submicron average hygroscopicity parameter (κoverall) was calculated from the measured size and hygroscopicity distributions as the volume concentration-weighted average κ. The mass concentration of non-refractory organics (morgNR) was measured by the ACSM and that of black carbon, BC, was estimated as the ratio of measured submicron particle light absorbance (babsBC) and an assumed absorption efficiency at 0.55 µm wavelength of 7.5 m2 g−1 [67]. The density, ρ, of non-refractory organics and BC were both assumed to be 1.3 g cm−3 [68].
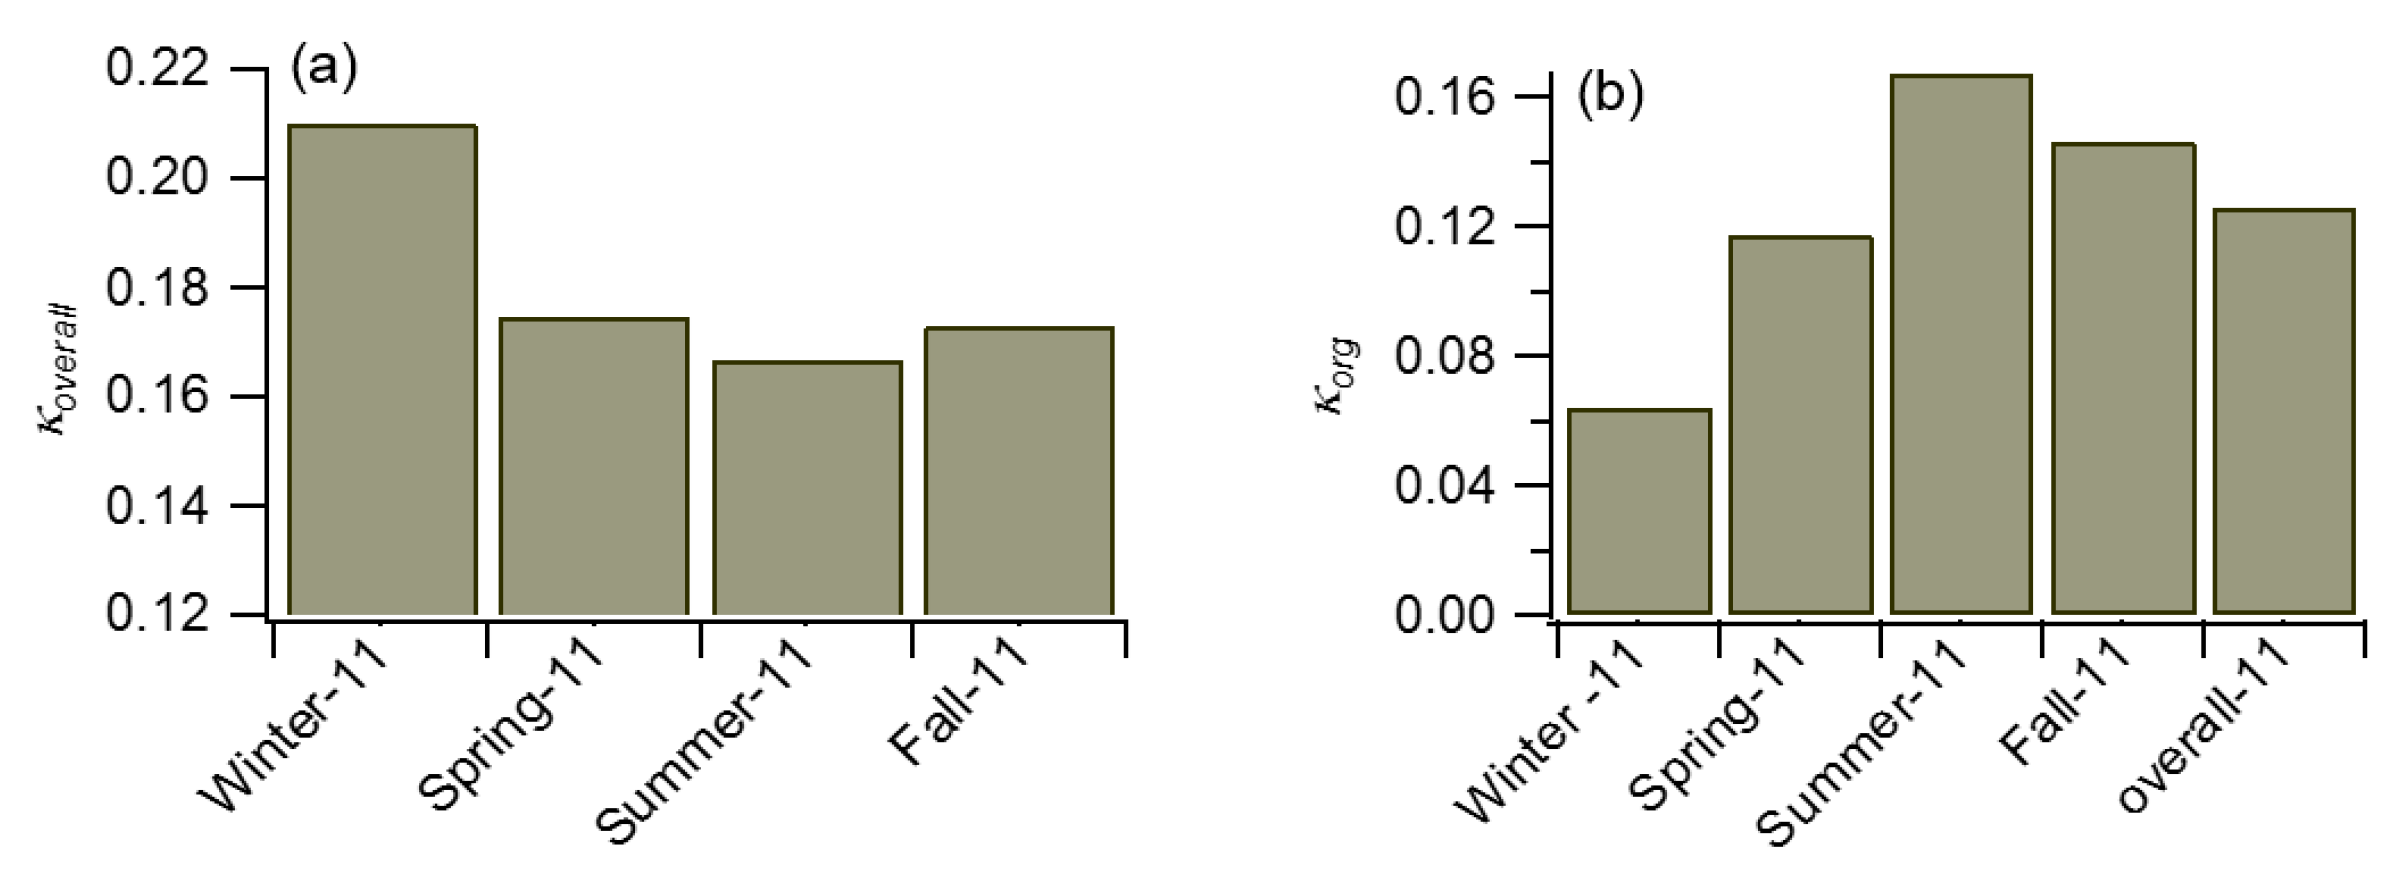
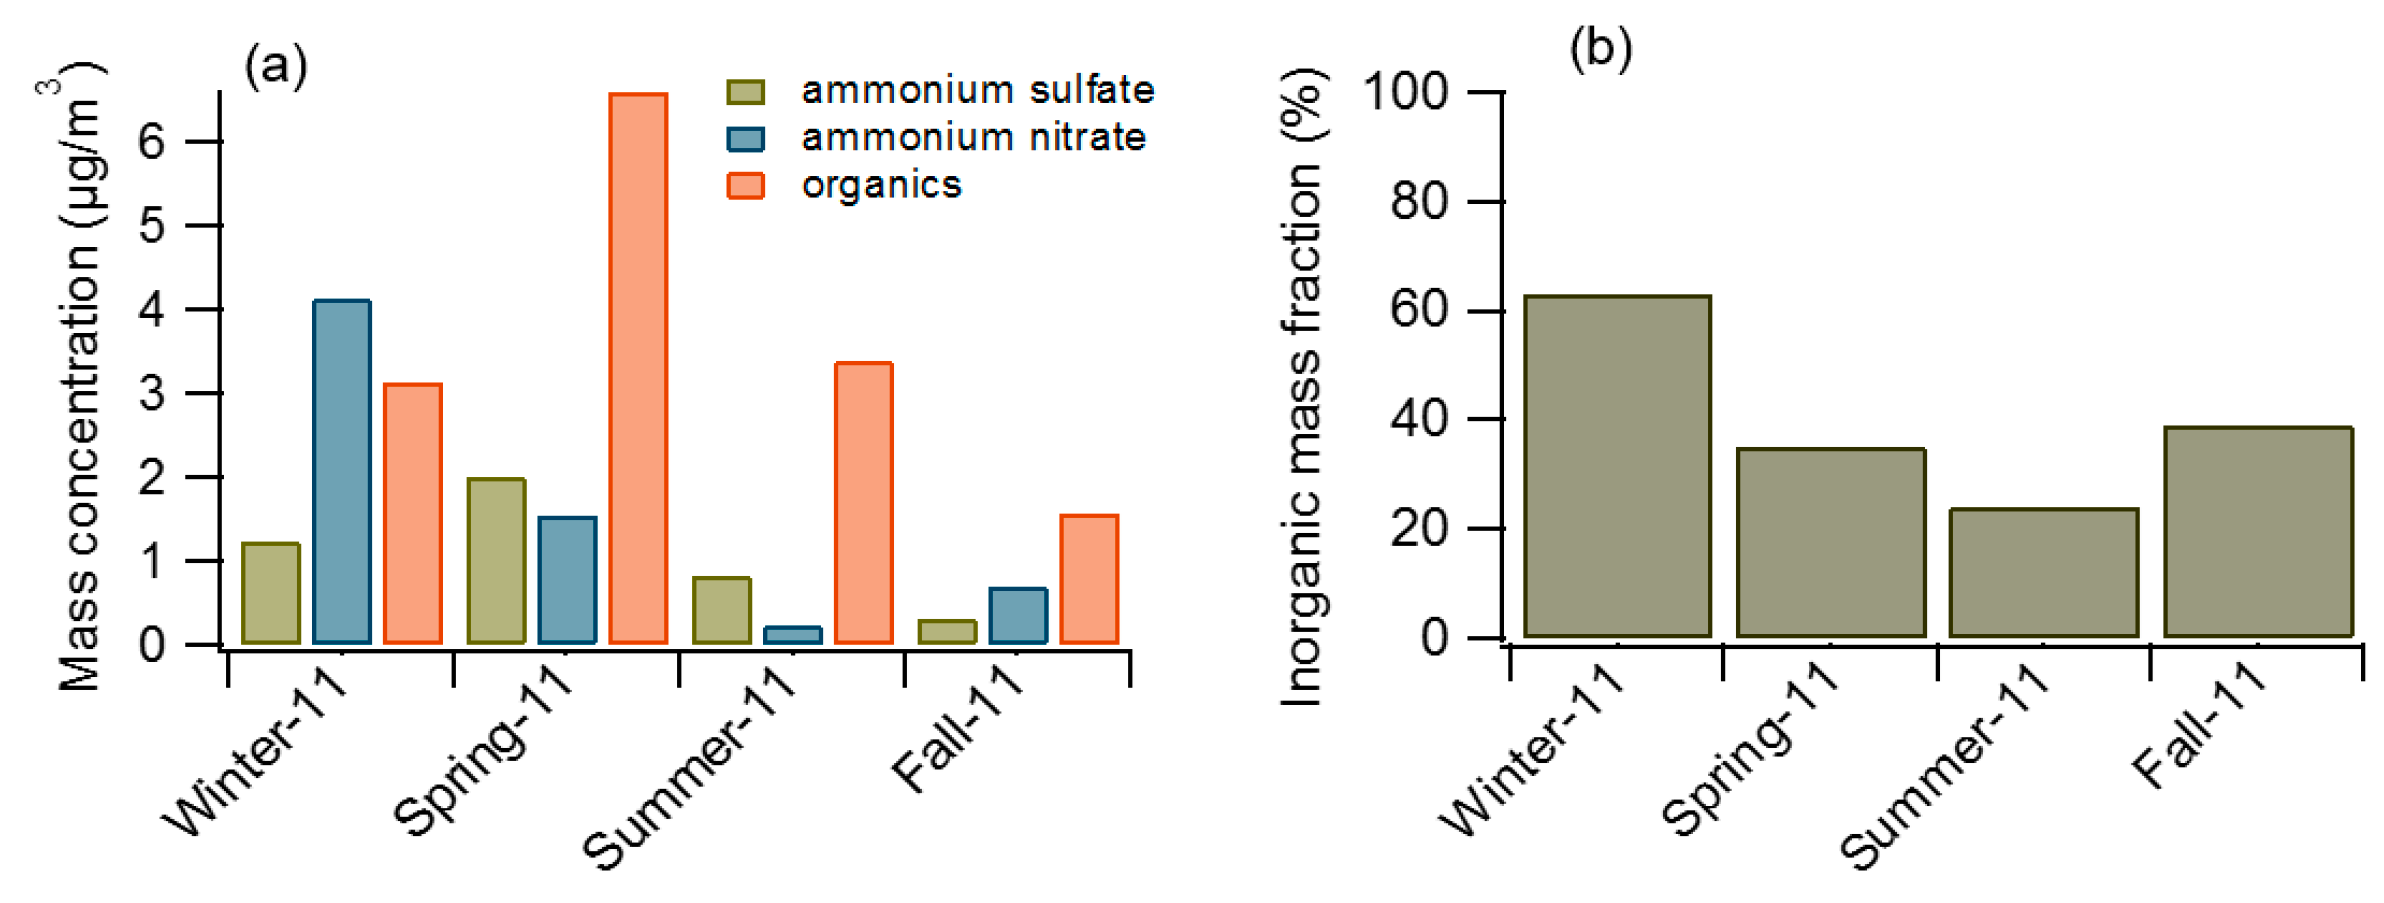
The resulting seasonal profiles of κoverall and κorg in 2011 are shown in Figure 3. Unlike the κorg profile, κoverall was highest in the winter and lowest in the summer. The high wintertime κoverall is a result of high concentrations of inorganic compounds, especially nitrate, while the relatively low summertime κoverall is caused by higher organic mass concentrations, as shown in Figure 4. Positive Matrix Factorization (PMF) analysis used for the Organic Aerosol Component (OACOMP) ARM Value Added Product (VAP) [69] indicates that less-hygroscopic biomass burning organic aerosol (BBOA) was prevalent from February through April in 2011, thus lowering κorg in winter and spring. Aged SOA (MO-OOA), which is moderately hygroscopic, was more abundant in summer, and thus raised κorg. The κorg in the spring and fall lies between that of the winter and summer. The 2011 average of 0.1 was used for this study, while the sensitivity of the results to the selected value was assessed by repeating the calculations for the seasonal minimum (κorg = 0.06, winter) and maximum (κorg = 0.16, summer).
2.4. Description of Models Used for Estimating NCCN
To simplify both the comparison of the varied approaches used to estimate NCCN and the comparison of the results, a common framework will be used to describe all of the approaches even though more straightforward descriptions would suffice for many of them. For all approaches a CCN spectrum, NCCN(S), was calculated for each size distribution measured by the SMPS. For the simplest approaches, the HTDMA data were not considered and a fixed hygroscopicity parameter was assumed. For all others the GF distributions were interpolated and extrapolated to each of the 90 size bins in the size distribution measurements and then converted to κ distributions using Equation (1). The differences among the approaches arise from the use and (any) averaging of the κ distributions, as summarized in Figure 5.
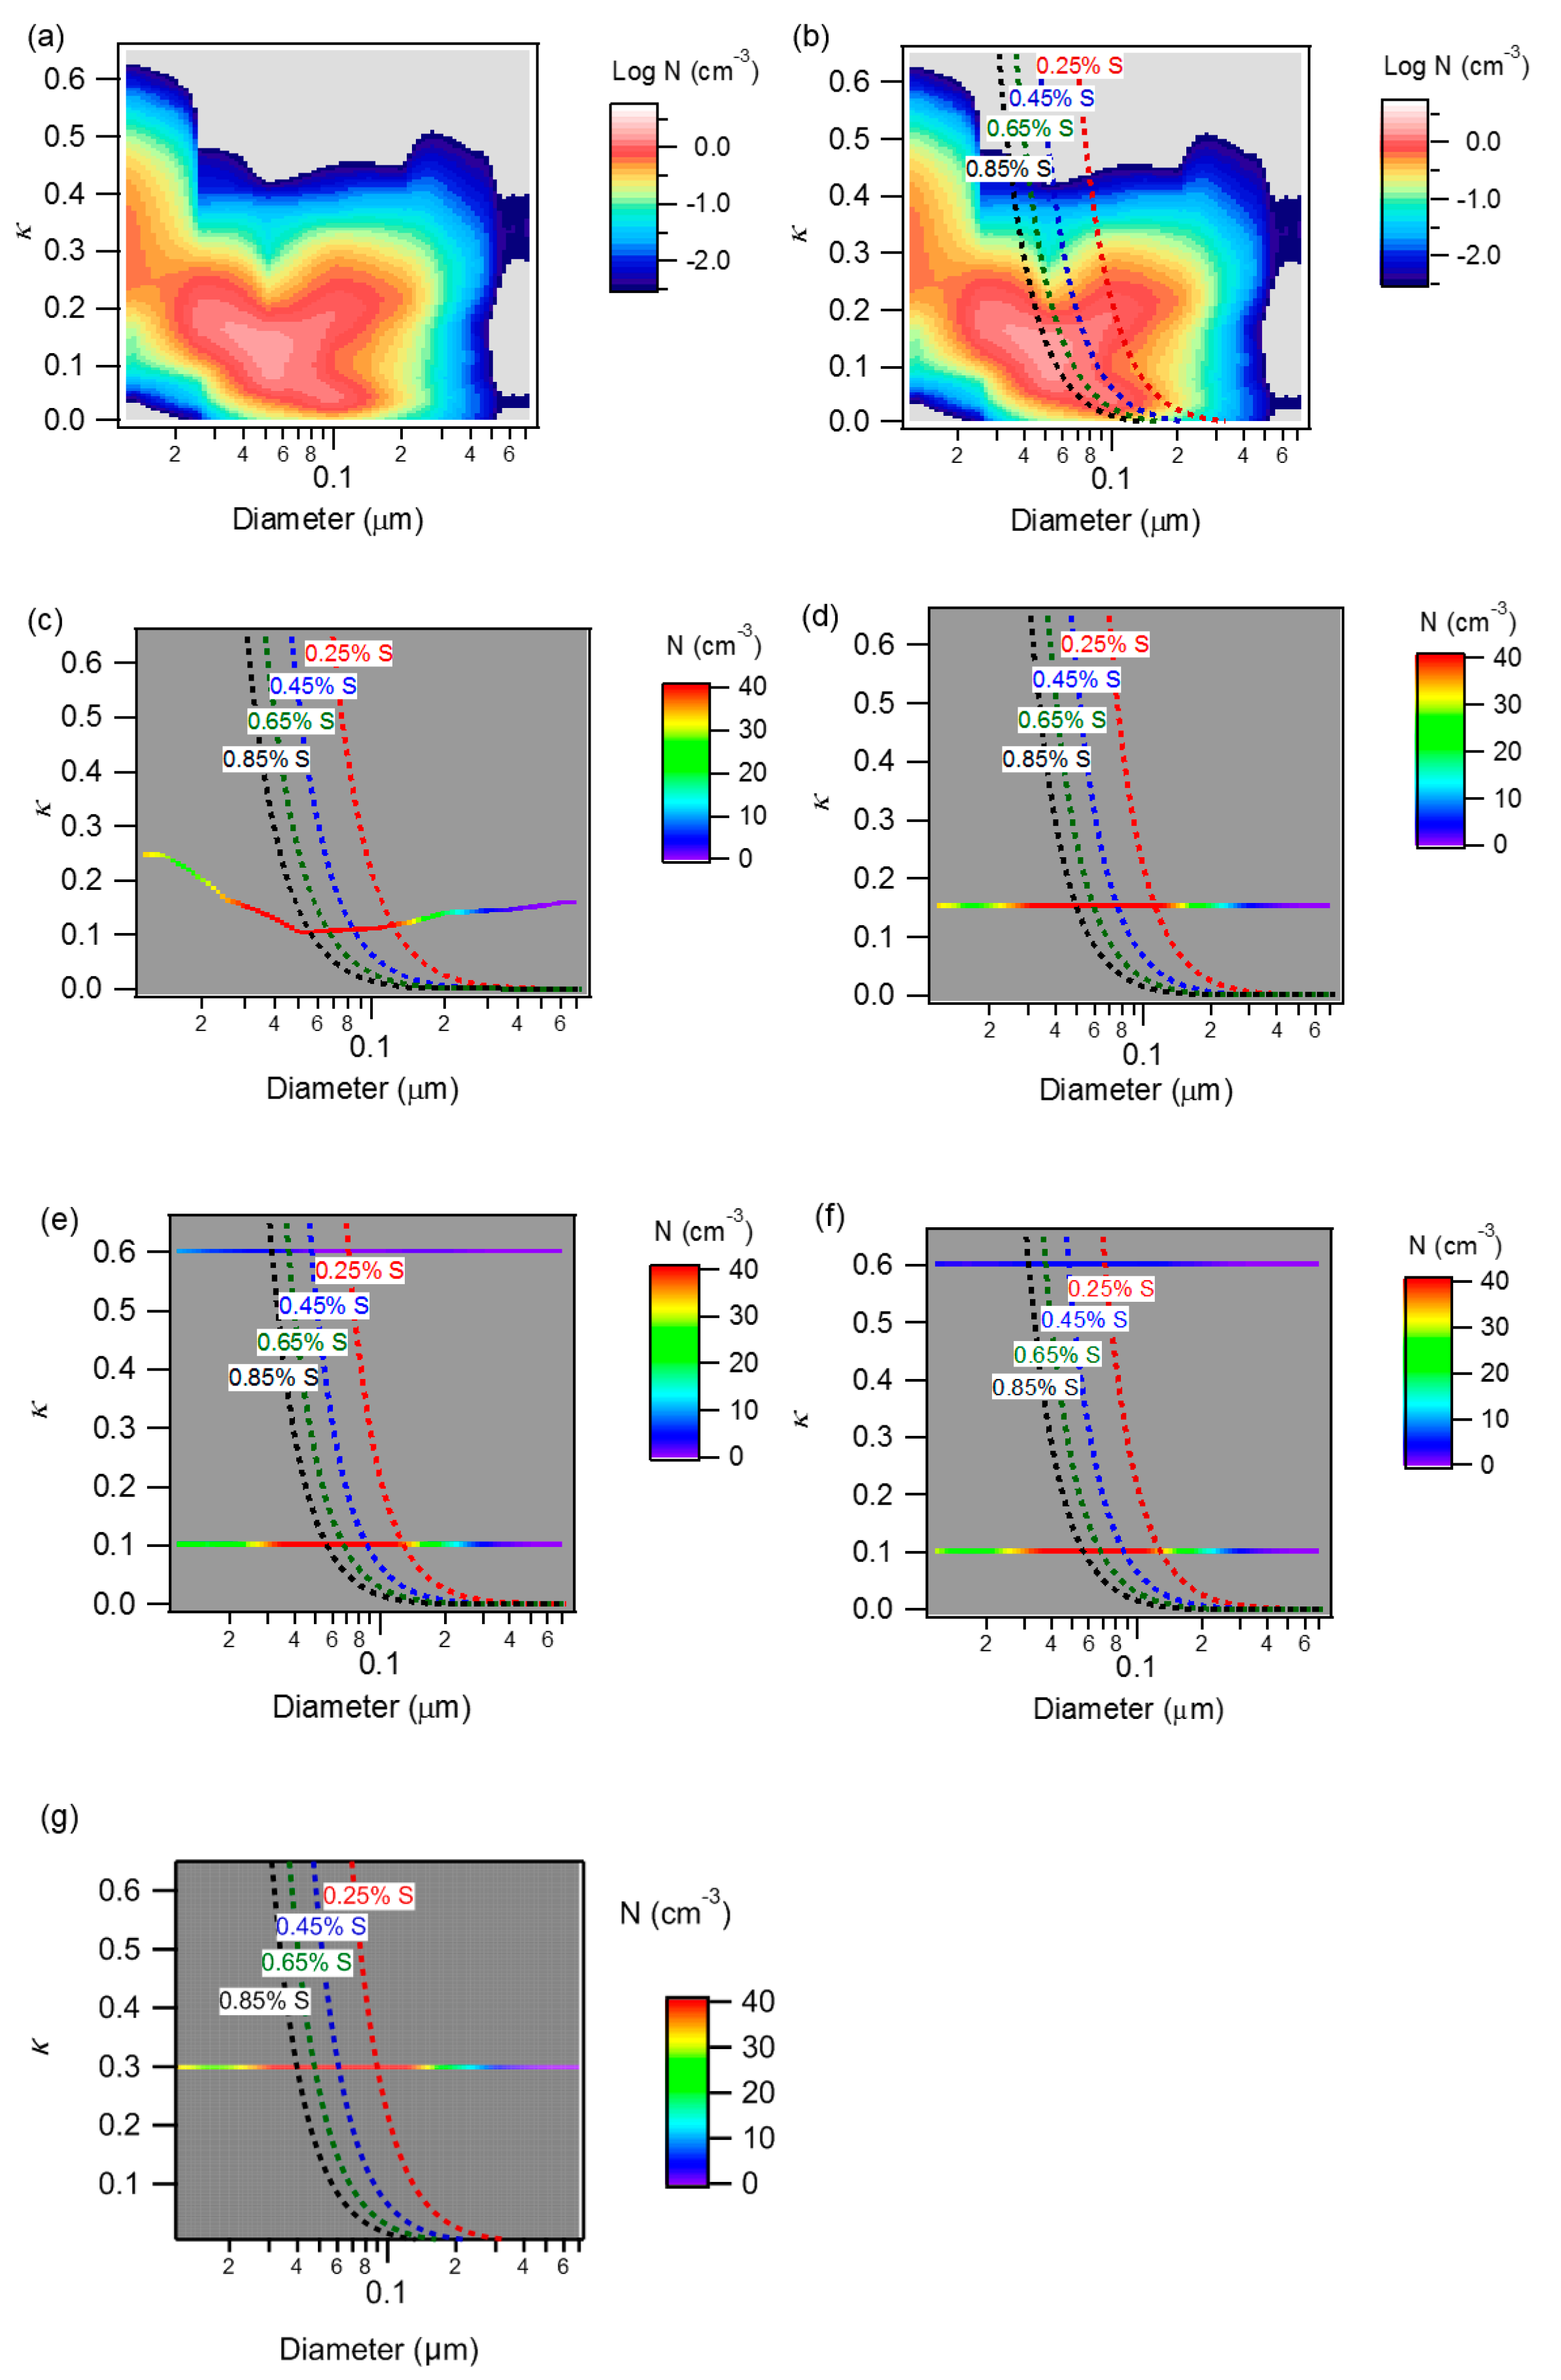
As a baseline for comparison with estimates from other approaches and with direct measurements, NCCN was calculated using the full GF distributions without any averaging. Because all of the information in the GF distributions is retained, these estimates are expected to be more accurate than those from any of the other approaches, all of which rely on averaged or assumed hygroscopicity. For each measurement sequence the interpolated κ distributions were combined with the size distribution to create a matrix of number concentrations as a function of Dd and κ, such as that shown graphically in Figure 6a. A Köhler curve relating equilibrium S to droplet diameter, D, was calculated for each (Dd, κ) pair using Equation (3) below. The Sc for each pair was calculated as the maximum value of equilibrium S along the curve.
As with calculations using Equation (1), σsol was assumed to be that of water, 0.072 J m−2. The result can be viewed as a matrix with elements of Sc and the same Dd and κ arrays as used in the number concentration matrix described above. NCCN was estimated for a prescribed S by integrating the number concentration N(Dd, κ) for which S > Sc. This is presented graphically in Figure 6b, with NCCN calculated by summing the N elements (whole or part) above and to the right of one of the four curves, each of which connects the elements having the same Sc. The resulting NCCN estimates were first compared with direct measurements made with the CCNc and then with the results of the other estimate approaches outlined below.
For all other NCCN estimates the aerosol was assumed to be either an internal mixture or an external mixture, as is generally required for regional and global scale climate models. The goals here were to assess the error introduced when making these simplifying assumptions and to identify the approach(es) most suitable for an aerosol similar to that found at SGP.
To treat the aerosol as an internal mixture the Dd-dependent κ distributions described above were replaced with a single κ value that is either dependent on Dd (κ = κ(Dd)) or the same for all Dd (κ ≠ κ(Dd)). The former comes simply from the number concentration-weighted average of the κ distributions at each Dd, with the result depicted in Figure 6c in the same manner as for the baseline approach matrix. For approaches for which κ is assumed to be size independent, it was calculated either as the average of κ(Dd) (Figure 6d) or, neglecting the hygroscopicity measurements, as that of particles composed of 20%, 50%, or pure soluble inorganics (~ammonium sulfate, AS) by volume (κ = 0.12, 0.30, and 0.60, respectively, with only κ = 0.30 shown in Figure 6g for clarity).
External mixtures were assumed to be comprised of two of the three particle types considered: insoluble, κ = 0.0, organic, κorg = 0.1, and inorganic, κinorg = 0.6. As with the assumed internal mixture approaches, both size dependent and size independent scenarios were considered. For both, independent size distributions of the different particle types were calculated from the average κ(= f(Dd) or ≠ f(Dd)) using Equations (4) and (5) below.
Case 1: for
Case 2: for
The results for κ(Dd) and κ(≠ Dd) are depicted graphically in Figure 6e,f, respectively, where the lower and higher horizontal lines represent the organic and inorganic particle types, respectively. As with the other approaches, NCCN was calculated by summing N elements above and to the right of the constant Sc curves. Contributions from the inorganic and organic particle types can also be calculated separately and then added to determine the total NCCN (i.e., NCCN = NCCN.inorg + NCCN.org).
3. Results and Discussion
3.1. Comparison between Measured and Baseline NCCN Estimate
The concentration measured by the CCNc was compared to that calculated using the baseline approach for all available data from 2009–2012. The results for May 2011 are shown in Figure 7 and for all of 2011 in Figure S3.
The calculated NCCN tracks that measured throughout the period considered. The deviation between the two is quantified as the Normalized Root Mean Square Error (NRMSE)
where xi is the measured NCCN at a given S, yi the estimated NCCN at the same S, and n the number of concentration pairs compared. The average NRMSE between the measured and calculated concentrations for May 2011 and for each of the four years analyzed are summarized in Table 3. The measured NCCN at 0.25% S during 2012 was very noisy and was excluded from the analysis.
In addition to measurement error, some possible reasons for deviations between the measured and calculated concentrations are (i) differences in assumed and actual properties of aerosol chemical species; (ii) interactions among components not captured by κ-Köhler Theory; (iii) the presence of low solubility organics that dissolve under the dilute conditions with S ~ Sc but not in the more concentrated solution in the HTDMA at 90% RH; (iv) the presence of particles that contain slowly dissolving compounds or that are in an amorphous/glassy state for which hygroscopic growth and activation timescales may be comparable to or greater than the HTDMA and CCNc residence times; and (v) the presence of surface tension-reducing species, which influence Sc much more than GF. But as noted above, the primary goal here was not to assess closure but to confirm that the baseline spectra calculated from the size and GF distributions were reasonably accurate and were suitable to serve as the reference for comparison with the results from the simplified treatments of composition and mixing state.
3.2. Comparison of NCCN Calculated from Different Approaches
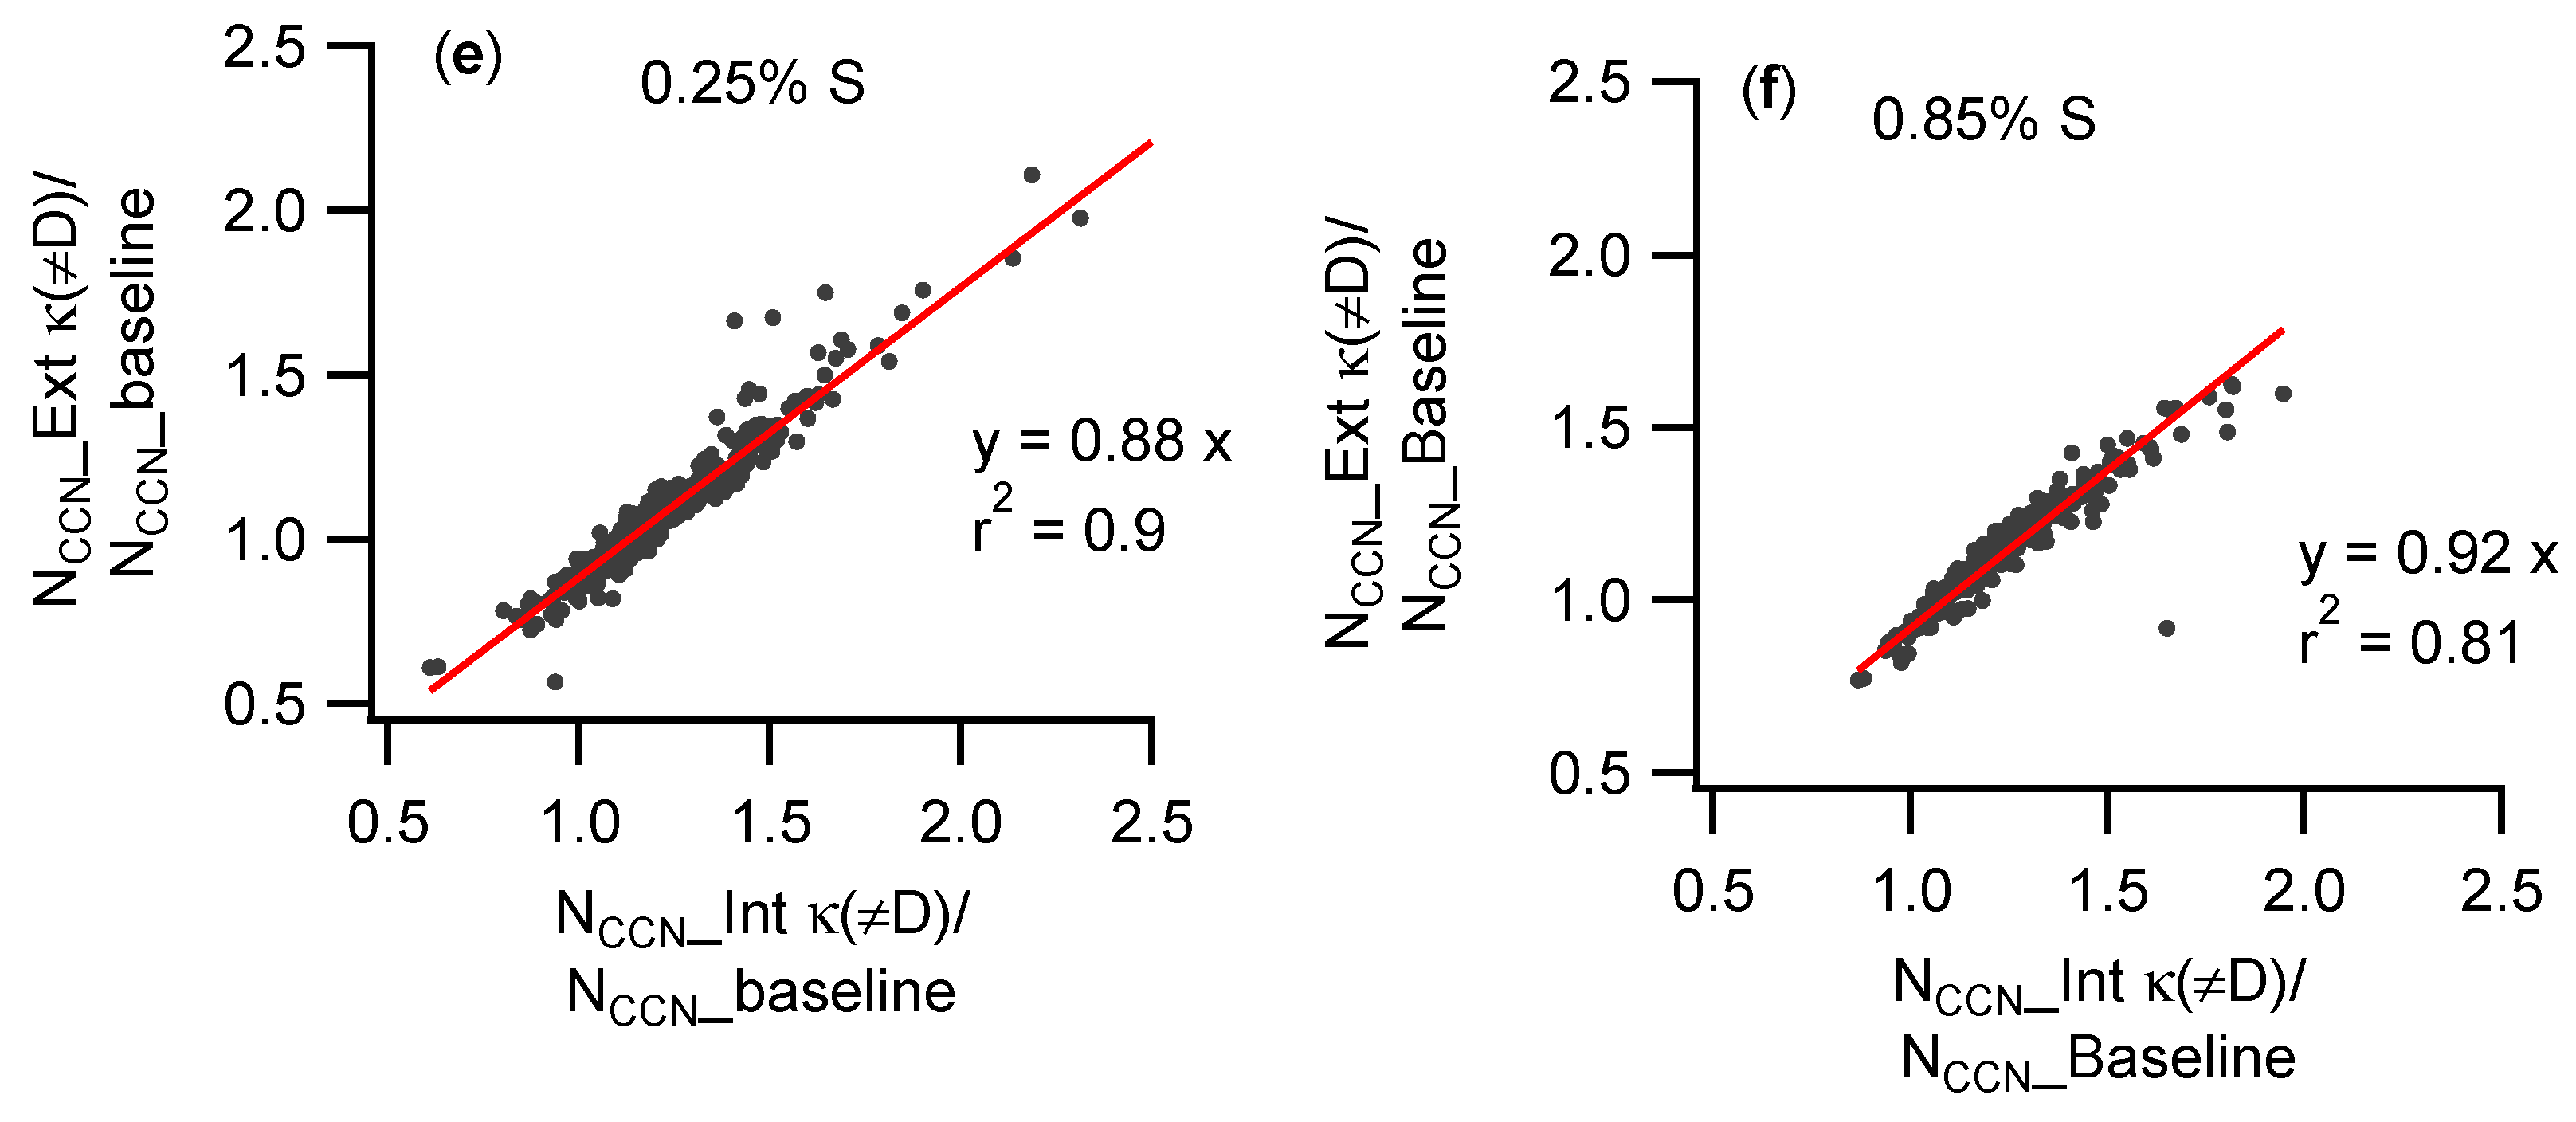
Estimates of NCCN assuming the aerosol is an internal or external mixture relative to those of the baseline approach for which no assumption about mixing state is made are presented in Figure 8 and Figure 9 for 0.25% and 0.85%, respectively, and in Figures S4 and S5 for 0.45% and 0.65% S, respectively. Deviations from the 1:1 lines are interpreted as error introduced by the averaging or approximations required for all but the baseline calculations. Best fits through the data were assumed to be linear and were forced through the origin to facilitate interpretation of the results and simply because of the apparent linear correlations with minimal offset in the figures. Table 4 summarizes the slope () and goodness of fit (r2) for each of the approaches with respect to the baseline estimate. Values of m above (below) 1 indicate that the simplified treatment results in NCCN greater (less) than that from the baseline estimate for a given S. Treating the aerosol as an internal mixture with size dependent hygroscopicity resulted in the best agreement with the baseline estimates, with the average m closest to 1.0 and the highest r2 (Table 4). Though there is considerably more scatter in the results for the internal and external mixtures with κ(≠ Dd) than in those with κ(Dd), the deviations are found to be tightly correlated. The relationships between the results for the assumed internal and external mixtures with κ(≠ Dd) are shown in Figure 10e,f. The strong correlation in NCCN(S) obtained for those assumed internal and external mixtures could be interpreted as reflecting a general lack of sensitivity to the mixing state as has been reported in some closure studies. But, at least for these data, both estimates simply differ in the same direction from what is believed to be the most accurate estimate. For both mixing state assumptions, the estimated NCCN with κ(≠ Dd) is higher than that with κ(Dd), as the κ averaged over the complete size range is typically higher than the κ(D) over the ~0.05–0.20 μm size range that dominates NCCN.
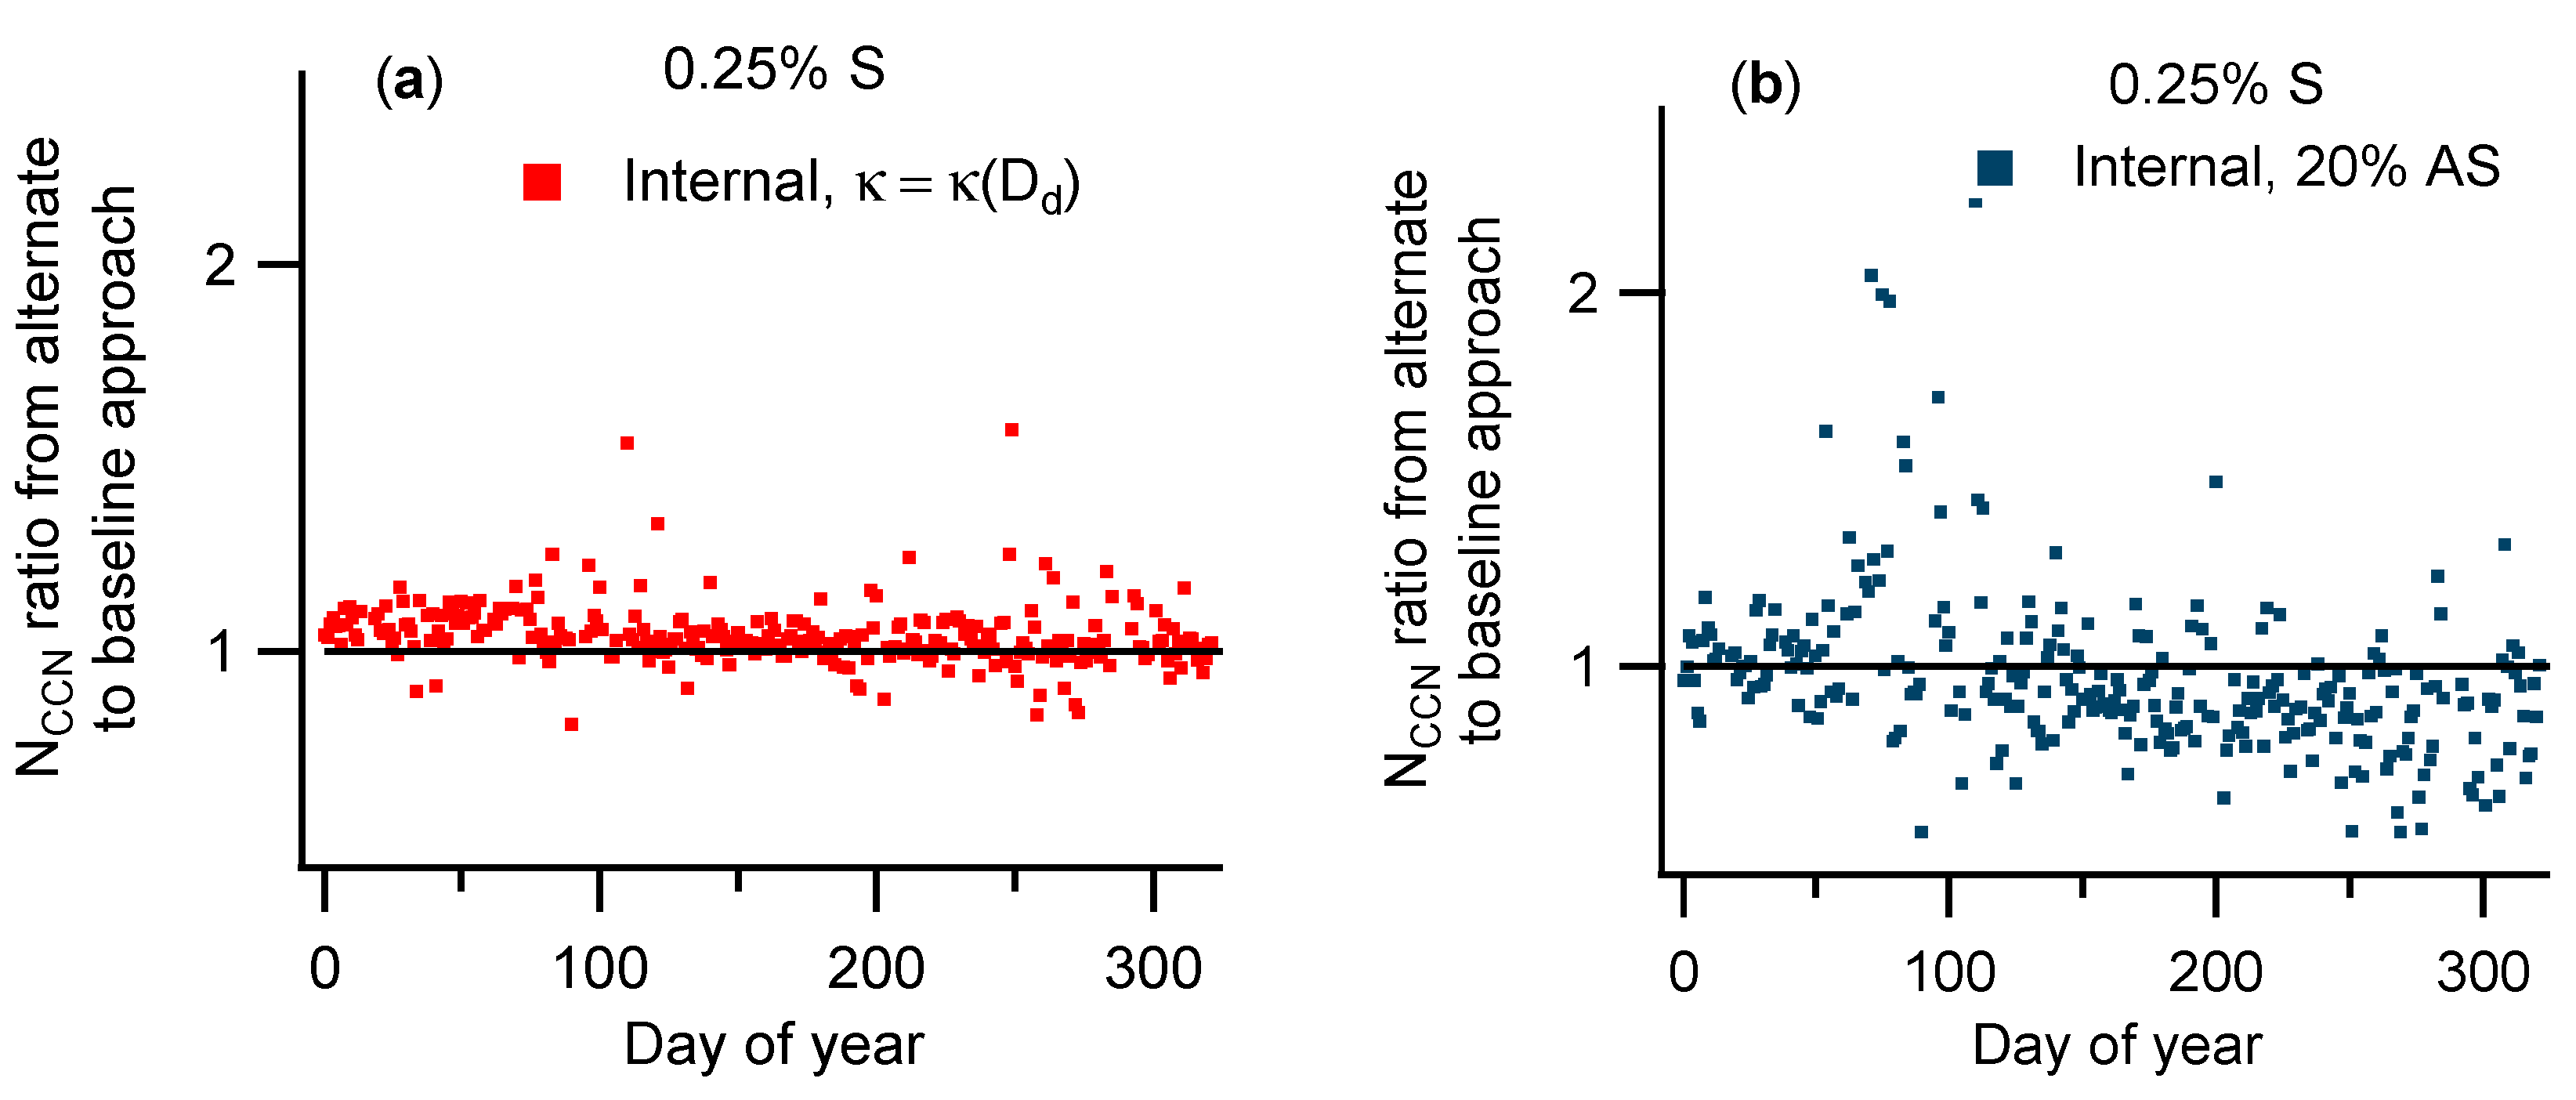
A correction of 1/m could be applied to results using any of the simplified treatments to increase accuracy. Of course, that sort of annual average correction would not reduce error that arises from variability in aerosol characteristics on seasonal or shorter time scales and is reflected in the r2 values. For example, assuming the aerosol has a fixed κ of 0.12 (20% AS) results in average best fit slopes between 1.00 and 1.06, indicating that, on average, an error of only a few percent would be introduced if both the composition and hygroscopicity were not considered at all in the calculations. However, that represents the average of comparably large negative and positive errors for individual measurements or days, as is shown in Figure 11 that compares the 2011 daily averages of the results from the internal mixture with κ(Dd) and the fixed 20% AS treatments relative to the baseline calculations. And as is shown in Figure 10, similar deviations from the 1.0 line are evident in the results for which the hygroscopicity was considered, but not its size dependence. Furthermore, the utility of any of the simplifying approaches is limited if not applicable over a wide range in S. The S dependence of the best fit slopes quantified as the fractional change over the full range in S considered is included in the 6th column in Table 4. That S dependence is much lower for the two cases for which the size dependence of κ is considered than for any of the others, which is expected because the change in NCCN with S largely reflects inclusion or exclusion of particles within a rather narrow slice of the full size range.
The results for the assumed external mixtures were found to be quite sensitive to the κorg used. Specifically, substituting the seasonal minimum (0.06) for the annual average (0.10) of the estimated κorg results in an average decrease in NCCN of 8% when the size dependence of κ is considered and an increase of 10% when it is not. Similarly, use of the seasonal maximum of 0.16 results in an average decrease of 1% with κ(Dd) and increase of 15% with κ(≠ Dd). (The results for SGP are likely especially sensitive to the assumed value because it is similar to that average κ of 0.12 that was found to result in reasonable estimates averaged throughout the year). For any measurement a change in κorg will cause a change in partitioning between the three particle types, with the net influence on NCCN depending on the coupling of that change and the shape of the size distribution. Because the approach used allows for at most two particle types, an increase in κorg that crosses the average κ of the aerosol will cause a shift in the assumed mixture from consisting of organic and inorganic (κ = 0.6) particles to organic and insoluble (κ = 0.0) particles, with a resulting increase in NCCN due to the increased hygroscopicity of the organic particles, a decrease due to the loss of the inorganic particles, and a net change that could be positive or negative. To evaluate the sensitivity of the calculated NCCN to the choice in κinorg, the analysis was repeated using values of 0.64 and 0.67 (instead of 0.6). The average change in NCCN was about 0.6% when size-dependence is considered and about 1.0% when it is not.
4. Summary and Conclusions
Size distributions and hygroscopic growth factor distributions measured from 2009 to 2012 at the SGP ARM site were used to estimate CCN concentrations over a range in supersaturation. An initial estimate of NCCN that served as a basis for comparison used all of the information in the combined distributions without any averaging. For those estimates, matrices of N(Dd, κ) and Sc(Dd, κ) were calculated from the measured distributions and from κ-Köhler Theory, respectively, and NCCN(S) was calculated by integrating all of the N elements for which the corresponding Sc element < S. Comparisons of those estimates with direct measurements from a collocated CCN counter show that this baseline approach can reasonably predict NCCN over a range of S.
The baseline spectra were then compared with those calculated using the same dataset but with aerosol treatments that are more commonly used for more efficient computation or simply because size-dependent composition or hygroscopicity distributions are not available. These included approximating the aerosol as an internal mixture with fixed inorganic volume fraction, as an internal mixture with size-dependent or size-independent hygroscopicity, and as an external mixture with size-dependent or size-independent hygroscopicity. Bias and variance relative to the baseline estimates were described with best fit slopes, m, and coefficients of determination, r2, respectively, with both calculated from the thousands of NCCN pairs over the period of analysis.
Though the results presented here are most directly applicable for the aerosol at SGP, that aerosol is quite diverse, with a range in sources, origins, and atmospheric processing prior to sampling. Thus, at least the overall ~10% uncertainty range accompanying assumption of either internal or external mixtures reported here is likely relevant for NCCN prediction in other regions as well and can provide some guidance for interpretation of model results. And for prediction of NCCN for an aerosol known to be similar to that at SGP the bias and scatter associated with each of the simplified treatments can be weighed together with computational cost for selection of the most appropriate approximation(s). Ongoing work is aimed at applying these results to improve the accuracy with which CCN spectra at SGP and other ARM sites can be predicted in the absence of direct measurements.
Supplementary Materials
The following are available online at https://www.mdpi.com/2073-4433/9/2/54/s1.
Acknowledgments
This research was supported by the office of biological and environmental research of the U.S. Department of Energy under grant DE-SC0016051 as part of the Atmospheric Radiation Measurement (ARM) climate research facility, an Office of Science scientific user facility. Data were obtained from the ARM climate research facility. All CCN concentration, chemical composition, size distribution, and hygroscopic growth factor distribution data used in our analysis were downloaded from the DOE ARM data archive at http://www.archive.arm.gov/. Spreadsheets containing many of the derived products are available at http://people.tamu.edu/~dcollins/Predicted_CCN_paper/. Other products can be obtained by contacting Don Collins ([email protected]).
Author Contributions
M.M., A.J., and D.R.C. conceived of the analysis and contributed to the data processing and use. M.M. wrote the paper with assistance from D.R.C. A.J. edited the paper and assisted with revision.
Conflicts of Interest
The authors declare no conflict of interest.
References
- Köhler, H. The nucleus in and the growth of hygroscopic droplets. Trans. Faraday Soc. 1936, 32, 1152–1161. [Google Scholar] [CrossRef]
- Hallquist, M.; Wenger, J.C.; Baltensperger, U.; Rudich, Y.; Simpson, D.; Claeys, M.; Dommen, J.; Donahue, N.M.; George, C.; Goldstein, A.H.; et al. The formation, properties and impact of secondary organic aerosol: Current and emerging issues. Atmos. Chem. Phys. 2009, 9, 5155–5236. [Google Scholar] [CrossRef] [Green Version]
- Pennington, M.R.; Bzdek, B.R.; Depalma, J.W.; Smith, J.N.; Kortelainen, A.-M.; Ruiz, L.H.; Petäjä, T.; Kulmala, M.; Worsnop, D.R.; Johnston, M.V. Identification and quantification of particle growth channels during new particle formation. Atmos. Chem. Phys. 2013, 13, 10215–10225. [Google Scholar] [CrossRef] [Green Version]
- Abbatt, J.; Broekhuizen, K.; Pradeepkumar, P. Cloud condensation nucleus activity of internally mixed ammonium sulfate/organic acid aerosol particles. Atmos. Environ. 2005, 39, 4767–4778. [Google Scholar] [CrossRef]
- Prenni, A.J.; Petters, M.D.; Kreidenweis, S.M.; Demott, P.J.; Ziemann, P.J. Cloud droplet activation of secondary organic aerosol. J. Geophys. Res. 2007, 112. [Google Scholar] [CrossRef]
- Bigg, E. Discrepancy between observation and prediction of concentrations of cloud condensation nuclei. Atmos. Res. 1986, 20, 81–86. [Google Scholar] [CrossRef]
- Chan, M.N.; Kreidenweis, S.M.; Chan, C.K. Measurements of the Hygroscopic and Deliquescence Properties of Organic Compounds of Different Solubilities in Water and Their Relationship with Cloud Condensation Nuclei Activities. Environ. Sci. Technol. 2008, 42, 3602–3608. [Google Scholar] [CrossRef] [PubMed]
- Raymond, T.M. Cloud activation of single-component organic aerosol particles. J. Geophys. Res. 2002, 107. [Google Scholar] [CrossRef]
- Raymond, T.M. Formation of cloud droplets by multicomponent organic particles. J. Geophys. Res. 2003, 108. [Google Scholar] [CrossRef]
- Roberts, G.C. Sensitivity of CCN spectra on chemical and physical properties of aerosol: A case study from the Amazon Basin. J. Geophys. Res. 2002, 107. [Google Scholar] [CrossRef]
- Smith, J.N.; Dunn, M.J.; Vanreken, T.M.; Iida, K.; Stolzenburg, M.R.; Mcmurry, P.H.; Huey, L.G. Chemical composition of atmospheric nanoparticles formed from nucleation in Tecamac, Mexico: Evidence for an important role for organic species in nanoparticle growth. Geophys. Res. Lett. 2008, 35. [Google Scholar] [CrossRef]
- Yli-Juuti, T.; Nieminen, T.; Hirsikko, A.; Aalto, P.P.; Asmi, E.; Hõrrak, U.; Manninen, H.E.; Patokoski, J.; Maso, M.D.; Petäjä, T.; et al. Growth rates of nucleation mode particles in Hyytiälä during 2003−2009: Variation with particle size, season, data analysis method and ambient conditions. Atmos. Chem. Phys. 2011, 11, 12865–12886. [Google Scholar] [CrossRef] [Green Version]
- Ruehl, C.R.; Davis, J.F.; Wilson, K.R. An interfacial mechanism for cloud droplet formation on organic aerosols. Science 2016, 351, 1447–1450. [Google Scholar] [CrossRef] [PubMed]
- Bilde, M.; Svenningsson, B. CCN activation of slightly soluble organics: The importance of small amounts of inorganic salt and particle phase. Tellus 2004, 56, 128–134. [Google Scholar] [CrossRef]
- Hartz, K.E.H.; Tischuk, J.E.; Chan, M.N.; Chan, C.K.; Donahue, N.M.; Pandis, S.N. Cloud condensation nuclei activation of limited solubility organic aerosol. Atmos. Environ. 2006, 40, 605–617. [Google Scholar] [CrossRef]
- Svenningsson, B.; Rissler, J.; Swietlicki, E.; Mircea, M.; Bilde, M.; Facchini, M.C.; Decesari, S.; Fuzzi, S.; Zhou, J.; Mønster, J.; Rosenørn, T. Hygroscopic growth and critical supersaturations for mixed aerosol particles of inorganic and organic compounds of atmospheric relevance. Atmos. Chem. Phys. 2006, 6, 1937–1952. [Google Scholar] [CrossRef]
- Petters, M.D.; Kreidenweis, S.M. A single parameter representation of hygroscopic growth and cloud condensation nucleus activity. Atmos. Chem. Phys. 2007, 7, 1961–1971. [Google Scholar] [CrossRef]
- Moore, R.H.; Bahreini, R.; Brock, C.A.; Froyd, K.D.; Cozic, J.; Holloway, J.S.; Middlebrook, A.M.; Murphy, D.M.; Nenes, A. Hygroscopicity and composition of Alaskan Arctic CCN during April 2008. Atmos. Chem. Phys. 2011, 11, 11807–11825. [Google Scholar] [CrossRef]
- Bougiatioti, A.; Fountoukis, C.; Kalivitis, N.; Pandis, S.N.; Nenes, A.; Mihalopoulos, N. Cloud condensation nuclei measurements in the marine boundary layer of the Eastern Mediterranean: CCN closure and droplet growth kinetics. Atmos. Chem. Phys. 2009, 9, 7053–7066. [Google Scholar] [CrossRef]
- Chang, R.Y.-W.; Slowik, J.G.; Shantz, N.C.; Vlasenko, A.; Liggio, J.; Sjostedt, S.J.; Leaitch, W.R.; Abbatt, J.P.D. The hygroscopicity parameter (κ) of ambient organic aerosol at a field site subject to biogenic and anthropogenic influences: Relationship to degree of aerosol oxidation. Atmos. Chem. Phys. 2010, 10, 5047–5064. [Google Scholar] [CrossRef]
- Chuang, P.Y.; Collins, D.R.; Pawlowska, H.; Snider, J.R.; Jonsson, H.H.; Brenguier, J.L.; Flagan, R.C.; Seinfeld, J.H. CCN measurements during ACE-2 and their relationship to cloud microphysical properties. Tellus 2000, 52, 843–867. [Google Scholar] [CrossRef]
- Covert, D.S.; Gras, J.L.; Wiedensohler, A.; Stratmann, F. Comparison of directly measured CCN with CCN modeled from the number-size distribution in the marine boundary layer during ACE 1 at Cape Grim, Tasmania. J. Geophys. Res. Atmos. 1998, 103, 16597–16608. [Google Scholar] [CrossRef]
- Furutani, H.; Dallosto, M.; Roberts, G.; Prather, K. Assessment of the relative importance of atmospheric aging on CCN activity derived from field observations. Atmos. Environ. 2008, 42, 3130–3142. [Google Scholar] [CrossRef]
- Gácita, M.S.; Longo, K.M.; Freire, J.L.M.; Freitas, S.R.; Martin, S.T. Impact of mixing state and hygroscopicity on CCN activity of biomass burning aerosol in Amazonia. Atmos. Chem. Phys. 2017, 17, 2373–2392. [Google Scholar] [CrossRef]
- Kammermann, L.; Gysel, M.; Weingartner, E.; Herich, H.; Cziczo, D.J.; Holst, T.; Svenningsson, B.; Arneth, A.; Baltensperger, U. Subarctic atmospheric aerosol composition: 3. Measured and modeled properties of cloud condensation nuclei. J. Geophys. Res. 2010, 115. [Google Scholar] [CrossRef]
- Kuwata, M.; Kondo, Y.; Miyazaki, Y.; Komazaki, Y.; Kim, J.H.; Yum, S.S.; Tanimoto, H.; Matsueda, H. Cloud condensation nuclei activity at Jeju Island, Korea in spring 2005. Atmos. Chem. Phys. 2008, 8, 2933–2948. [Google Scholar] [CrossRef]
- Mircea, M.; Facchini, M.C.; Decesari, S.; Fuzzi, S.; Charlson, R.J. The influence of the organic aerosol component on CCN supersaturation spectra for different aerosol types. Tellus 2002, 54, 74–81. [Google Scholar] [CrossRef]
- Moore, R.H.; Cerully, K.; Bahreini, R.; Brock, C.A.; Middlebrook, A.M.; Nenes, A. Hygroscopicity and composition of California CCN during summer 2010. J. Geophys. Res. Atmos. 2012, 117. [Google Scholar] [CrossRef]
- Rissler, J.; Vestin, A.; Swietlicki, E.; Fisch, G.; Zhou, J.; Artaxo, P.; Andreae, M.O. Size distribution and hygroscopic properties of aerosol particles from dry-season biomass burning in Amazonia. Atmos. Chem. Phys. 2006, 6, 471–491. [Google Scholar] [CrossRef]
- Roberts, G.C.; Day, D.A.; Russell, L.M.; Dunlea, E.J.; Jimenez, J.L.; Tomlinson, J.M.; Collins, D.R.; Shinozuka, Y.; Clarke, A.D. Characterization of particle cloud droplet activity and composition in the free troposphere and the boundary layer during INTEX-B. Atmos. Chem. Phys. 2010, 10, 6627–6644. [Google Scholar] [CrossRef] [Green Version]
- Roberts, G.; Mauger, G.; Hadley, O.; Ramanathan, V. North American and Asian aerosols over the eastern Pacific Ocean and their role in regulating cloud condensation nuclei. J. Geophys. Res. 2006, 111. [Google Scholar] [CrossRef]
- Rose, D.; Nowak, A.; Achtert, P.; Wiedensohler, A.; Hu, M.; Shao, M.; Zhang, Y.; Andreae, M.O.; Pöschl, U. Cloud condensation nuclei in polluted air and biomass burning smoke near the mega-city Guangzhou, China—Part 1: Size-resolved measurements and implications for the modeling of aerosol particle hygroscopicity and CCN activity. Atmos. Chem. Phys. 2010, 10, 3365–3383. [Google Scholar] [CrossRef]
- Shantz, N.C.; Leaitch, W.R.; Phinney, L.; Mozurkewich, M.; Toom-Sauntry, D. The effect of organic compounds on the growth rate of cloud droplets in marine and forest settings. Atmos. Chem. Phys. 2008, 8, 5869–5887. [Google Scholar] [CrossRef]
- Wang, J.; Cubison, M.J.; Aiken, A.C.; Jimenez, J.L.; Collins, D.R. The importance of aerosol mixing state and size-resolved composition on CCN concentration and the variation of the importance with atmospheric aging of aerosols. Atmos. Chem. Phys. 2010, 10, 7267–7283. [Google Scholar] [CrossRef]
- Ervens, B.; Cubison, M.J.; Andrews, E.; Feingold, G.; Ogren, J.A.; Jimenez, J.L.; Quinn, P.K.; Bates, T.S.; Wang, J.; Zhang, Q.; et al. CCN predictions using simplified assumptions of organic aerosol composition and mixing state: A synthesis from six different locations. Atmos. Chem. Phys. 2010, 10, 4795–4807. [Google Scholar] [CrossRef]
- Broekhuizen, K.; Chang, R.-W.; Leaitch, W.R.; Li, S.-M.; Abbatt, J.P.D. Closure between measured and modeled cloud condensation nuclei (CCN) using size-resolved aerosol compositions in downtown Toronto. Atmos. Chem. Phys. 2006, 6, 2513–2524. [Google Scholar] [CrossRef]
- Cubison, M.J.; Ervens, B.; Feingold, G.; Docherty, K.S.; Ulbrich, I.M.; Shields, L.; Prather, K.; Hering, S.; Jimenez, J.L. The influence of chemical composition and mixing state of Los Angeles urban aerosol on CCN number and cloud properties. Atmos. Chem. Phys. 2008, 8, 5649–5667. [Google Scholar] [CrossRef]
- Lance, S.; Nenes, A.; Mazzoleni, C.; Dubey, M.K.; Gates, H.; Varutbangkul, V.; Rissman, T.A.; Murphy, S.M.; Sorooshian, A.; Flagan, R.C.; et al. Cloud condensation nuclei activity, closure, and droplet growth kinetics of Houston aerosol during the Gulf of Mexico Atmospheric Composition and Climate Study (GoMACCS). J. Geophys. Res. 2009, 114. [Google Scholar] [CrossRef]
- Padró, L.T.; Moore, R.H.; Zhang, X.; Rastogi, N.; Weber, R.J.; Nenes, A. Mixing state and compositional effects on CCN activity and droplet growth kinetics of size-resolved CCN in an urban environment. Atmos. Chem. Phys. 2012, 12, 10239–10255. [Google Scholar] [CrossRef] [Green Version]
- Zaveri, R.A.; Barnard, J.C.; Easter, R.C.; Riemer, N.; West, M. Particle-resolved simulation of aerosol size, composition, mixing state, and the associated optical and cloud condensation nuclei activation properties in an evolving urban plume. J. Geophys. Res. 2010, 115. [Google Scholar] [CrossRef]
- Bhattu, D.; Tripathi, S.N. CCN closure study: Effects of aerosol chemical composition and mixing state. J. Geophys. Res. Atmos. 2015, 120, 766–783. [Google Scholar] [CrossRef]
- Gunthe, S.S.; King, S.M.; Rose, D.; Chen, Q.; Roldin, P.; Farmer, D.K.; Jimenez, J.L.; Artaxo, P.; Andreae, M.O.; Martin, S.T.; et al. Cloud condensation nuclei in pristine tropical rainforest air of Amazonia: Size-resolved measurements and modeling of atmospheric aerosol composition and CCN activity. Atmos. Chem. Phys. 2009, 9, 7551–7575. [Google Scholar] [CrossRef] [Green Version]
- Medina, J.; Nenes, A.; Sotiropoulou, R.-E.P.; Cottrell, L.D.; Ziemba, L.D.; Beckman, P.J.; Griffin, R.J. Cloud condensation nuclei closure during the International Consortium for Atmospheric Research on Transport and Transformation 2004 campaign: Effects of size-resolved composition. J. Geophys. Res. 2007, 112. [Google Scholar] [CrossRef]
- Stroud, C.A.; Nenes, A.; Jimenez, J.L.; Decarlo, P.F.; Huffman, J.A.; Bruintjes, R.; Nemitz, E.; Delia, A.E.; Toohey, D.W.; Guenther, A.B.; et al. Cloud Activating Properties of Aerosol Observed during CELTIC. J. Atmos. Sci. 2007, 64, 441–459. [Google Scholar] [CrossRef]
- Conant, W.C.; Vanreken, T.M.; Rissman, T.A.; Varutbangkul, V.; Jonsson, H.H.; Nenes, A.; Jimenez, J.L.; Delia, A.E.; Bahreini, R.; Roberts, G.C.; et al. Aerosol-cloud drop concentration closure in warm cumulus. J. Geophys. Res. Atmos. 2004, 109. [Google Scholar] [CrossRef] [Green Version]
- Dusek, U.; Frank, G.P.; Hildebrandt, L.; Curtius, J.; Schneider, J.; Walter, S.; Chand, D.; Drewnick, F.; Hings, S.; Jung, D.; et al. Size Matters More Than Chemistry for Cloud-Nucleating Ability of Aerosol Particles. Science 2006, 312, 1375–1378. [Google Scholar] [CrossRef] [PubMed]
- Cantrell, W.; Shaw, G.; Cass, G.R.; Chowdhury, Z.; Hughes, L.S.; Prather, K.A.; Guazzotti, S.A.; Coffee, K.R. Closure between aerosol particles and cloud condensation nuclei at Kaashidhoo Climate Observatory. J. Geophys. Res. Atmos. 2001, 106, 28711–28718. [Google Scholar] [CrossRef]
- Chang, R.-W.; Liu, P.; Leaitch, W.; Abbatt, J. Comparison between measured and predicted CCN concentrations at Egbert, Ontario: Focus on the organic aerosol fraction at a semi-rural site. Atmos. Environ. 2007, 41, 8172–8182. [Google Scholar] [CrossRef]
- Liu, P.S.K.; Leaitch, W.R.; Banic, C.M.; Li, S.-M.; Ngo, D.; Megaw, W.J. Aerosol observations at Chebogue Point during the 1993 North Atlantic Regional Experiment: Relationships among cloud condensation nuclei, size distribution, and chemistry. J. Geophys. Res. Atmos. 1996, 101, 28971–28990. [Google Scholar] [CrossRef]
- Rissler, J.; Swietlicki, E.; Zhou, J.; Roberts, G.; Andreae, M.O.; Gatti, L.V.; Artaxo, P. Physical properties of the sub-micrometer aerosol over the Amazon rain forest during the wet-to-dry season transition—Comparison of modeled and measured CCN concentrations. Atmos. Chem. Phys. 2004, 4, 2119–2143. [Google Scholar] [CrossRef]
- Vanreken, T.M. Toward aerosol/cloud condensation nuclei (CCN) closure during CRYSTAL-FACE. J. Geophys. Res. 2003, 108. [Google Scholar] [CrossRef]
- Wang, J.; Lee, Y.-N.; Daum, P.H.; Jayne, J.; Alexander, M.L. Effects of aerosol organics on cloud condensation nucleus (CCN) concentration and first indirect aerosol effect. Atmos. Chem. Phys. 2008, 8, 6325–6339. [Google Scholar] [CrossRef]
- Ervens, B.; Cubison, M.; Andrews, E.; Feingold, G.; Ogren, J.A.; Jimenez, J.L.; Decarlo, P.; Nenes, A. Prediction of cloud condensation nucleus number concentration using measurements of aerosol size distributions and composition and light scattering enhancement due to humidity. J. Geophys. Res. 2007, 112. [Google Scholar] [CrossRef]
- Almeida, G.P.; Brito, J.; Morales, C.A.; Andrade, M.F.; Artaxo, P. Measured and modelled cloud condensation nuclei (CCN) concentration in São Paulo, Brazil: The importance of aerosol size-resolved chemical composition on CCN concentration prediction. Atmos. Chem. Phys. 2014, 14, 7559–7572. [Google Scholar] [CrossRef] [Green Version]
- Asa-Awuku, A.; Moore, R.H.; Nenes, A.; Bahreini, R.; Holloway, J.S.; Brock, C.A.; Middlebrook, A.M.; Ryerson, T.B.; Jimenez, J.L.; Decarlo, P.F.; et al. Airborne cloud condensation nuclei measurements during the 2006 Texas Air Quality Study. J. Geophys. Res. 2011, 116. [Google Scholar] [CrossRef]
- Che, H.C.; Zhang, X.Y.; Wang, Y.Q.; Zhang, L.; Shen, X.J.; Zhang, Y.M.; Ma, Q.L.; Sun, J.Y.; Zhang, Y.W.; Wang, T.T. Characterization and parameterization of aerosol cloud condensation nuclei activation under different pollution conditions. Sci. Rep. 2016, 6. [Google Scholar] [CrossRef] [PubMed]
- Mircea, M.; Facchini, M.C.; Decesari, S.; Cavalli, F.; Emblico, L.; Fuzzi, S.; Vestin, A.; Rissler, J.; Swietlicki, E.; Frank, G.; et al. Importance of the organic aerosol fraction for modeling aerosol hygroscopic growth and activation: A case study in the Amazon Basin. Atmos. Chem. Phys. 2005, 5, 3111–3126. [Google Scholar] [CrossRef]
- Quinn, P.K.; Bates, T.S.; Coffman, D.J.; Covert, D.S. Influence of particle size and chemistry on the cloud nucleating properties of aerosols. Atmos. Chem. Phys. 2008, 8, 1029–1042. [Google Scholar] [CrossRef]
- Mahish, M.; Collins, D. Analysis of a Multi-Year Record of Size-Resolved Hygroscopicity Measurements from a Rural Site in the U.S. Aerosol Air Qual. Res. 2017, 17, 1389–1400. [Google Scholar] [CrossRef]
- Collins, D. Tandem Differential Mobility Analyzer/Aerodynamic Particle Sizer (APS) Handbook; No. DOE/SC-ARM-TR-090; U.S. Department of Energy: Washington, DC, USA, 2010.
- Gasparini, R.; Li, R.; Collins, D.R. Integration of size distributions and size-resolved hygroscopicity measured during the Houston Supersite for compositional categorization of the aerosol. Atmos. Environ. 2004, 38, 3285–3303. [Google Scholar] [CrossRef]
- Roberts, G.; Nenes, A. A Continuous-Flow Streamwise Thermal-Gradient CCN Chamber for Atmospheric Measurements. Aerosol Sci. Technol. 2005, 39, 206–221. [Google Scholar] [CrossRef]
- Jefferson, A. Aerosol Observing System (AOS) Handbook; Technical Report ARM-TR-014; U.S. Department of Energy: Washington, DC, USA, 2011.
- Ng, N.L.; Herndon, S.C.; Trimborn, A.; Canagaratna, M.R.; Croteau, P.L.; Onasch, T.B. An Aerosol Chemical Speciation Monitor (ACSM) for Routine Monitoring of the Composition and Mass Concentrations of Ambient Aerosol. Aerosol Sci. Technol. 2011, 45, 780–794. [Google Scholar] [CrossRef]
- Bond, T.C.; Anderson, T.L.; Campbell, D. Calibration and intercomparison of filter-based measurements of visible light absorption by aerosols. Aerosol Sci. Technol. 1999, 30, 582–600. [Google Scholar] [CrossRef]
- Watson, T.B. Aerosol Chemical Speciation Monitor (ACSM) Instrument Handbook; No. DOE/SC-ARM-TR-196; U.S. Department of Energy: Washington, DC, USA, 2017.
- Yang, M.; Howell, S.G.; Zhuang, J.; Huebert, B.J. Attribution of aerosol light absorption to black carbon, brown carbon, and dust in China—Interpretations of atmospheric measurements during EAST-AIRE. Atmos. Chem. Phys. 2009, 9, 2035–2050. [Google Scholar] [CrossRef]
- Nakao, S.; Tang, P.; Tang, X.; Clark, C.H.; Qi, L.; Seo, E.; Asa-Awuku, A.; Cocker, D. Density and elemental ratios of secondary organic aerosol: Application of a density prediction method. Atmos. Environ. 2013, 68, 273–277. [Google Scholar] [CrossRef]
- Fast, J.; Zhang, Q.; Tilp, A.; Shippert, T.; Parworth, C.; Mei, F. Organic Aerosol Component (OACOMP) Value-Added Product; No. DOE/SC-ARM-TR-131; U.S. Department of Energy: Washington, DC, USA, 2013.
Figure 1.
Data quality during the analysis period. Periods during which data are available and no significant problems were identified are colored green, those during which confidence in at least some subset of the data is low are yellow, and those during which data are unavailable or thought to be erroneous are red. Data used to generate this graph are available at the site identified in the Acknowledgments section below.
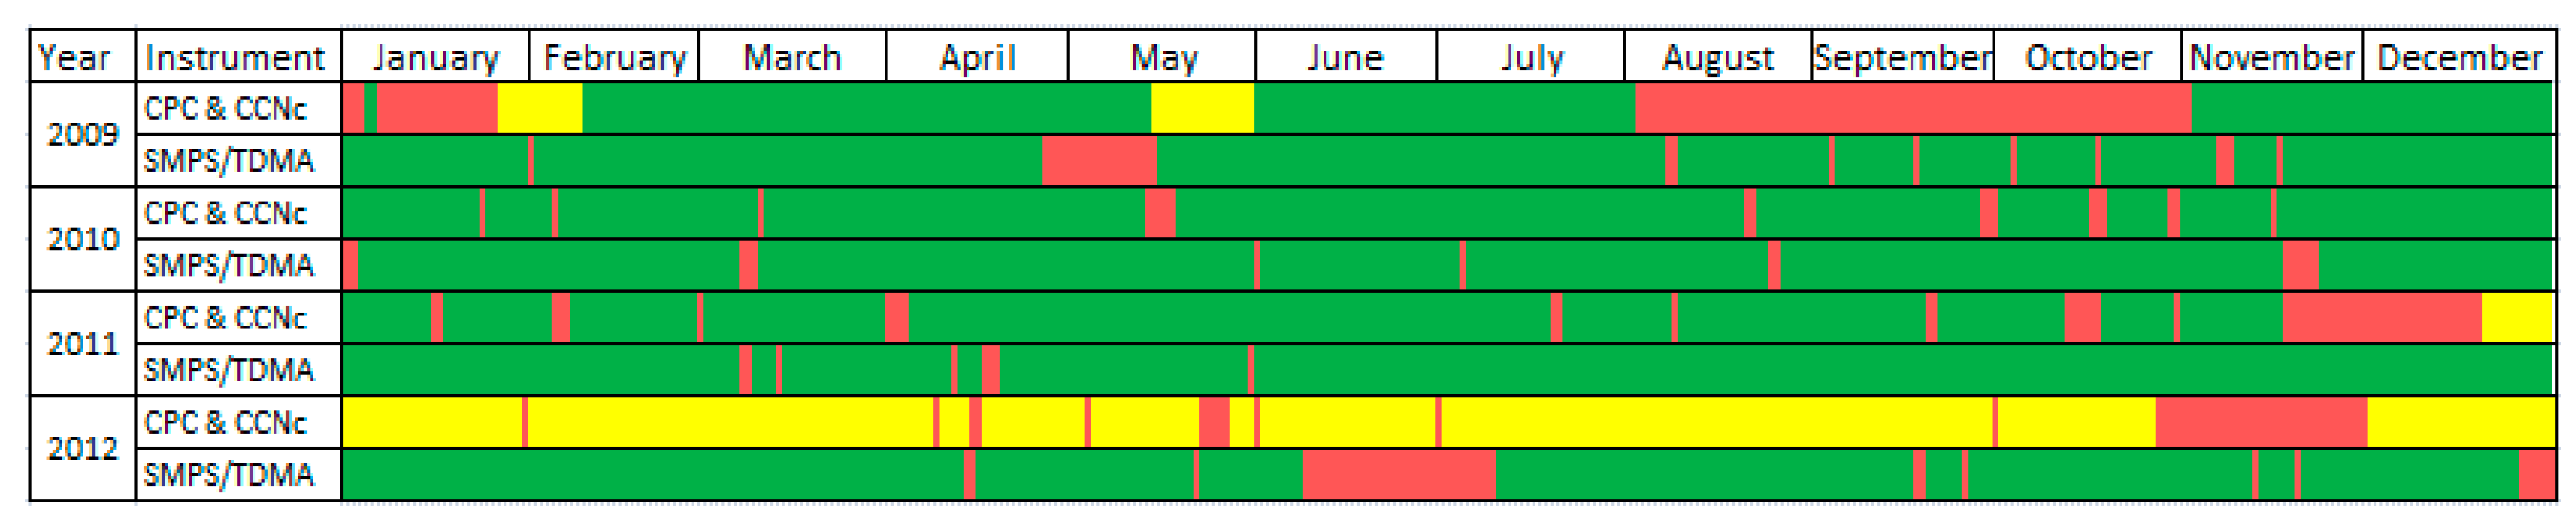
Figure 2.
Sulfate to nitrate equivalent concentration ratio based on ACSM chemical composition data from (a) 2011, (b) 2012, and (c) 2013. Equivalent concentration = , where the equivalence factor for sulfate and nitrate are 0.5 and 1, respectively.
Figure 2.
Sulfate to nitrate equivalent concentration ratio based on ACSM chemical composition data from (a) 2011, (b) 2012, and (c) 2013. Equivalent concentration = , where the equivalence factor for sulfate and nitrate are 0.5 and 1, respectively.
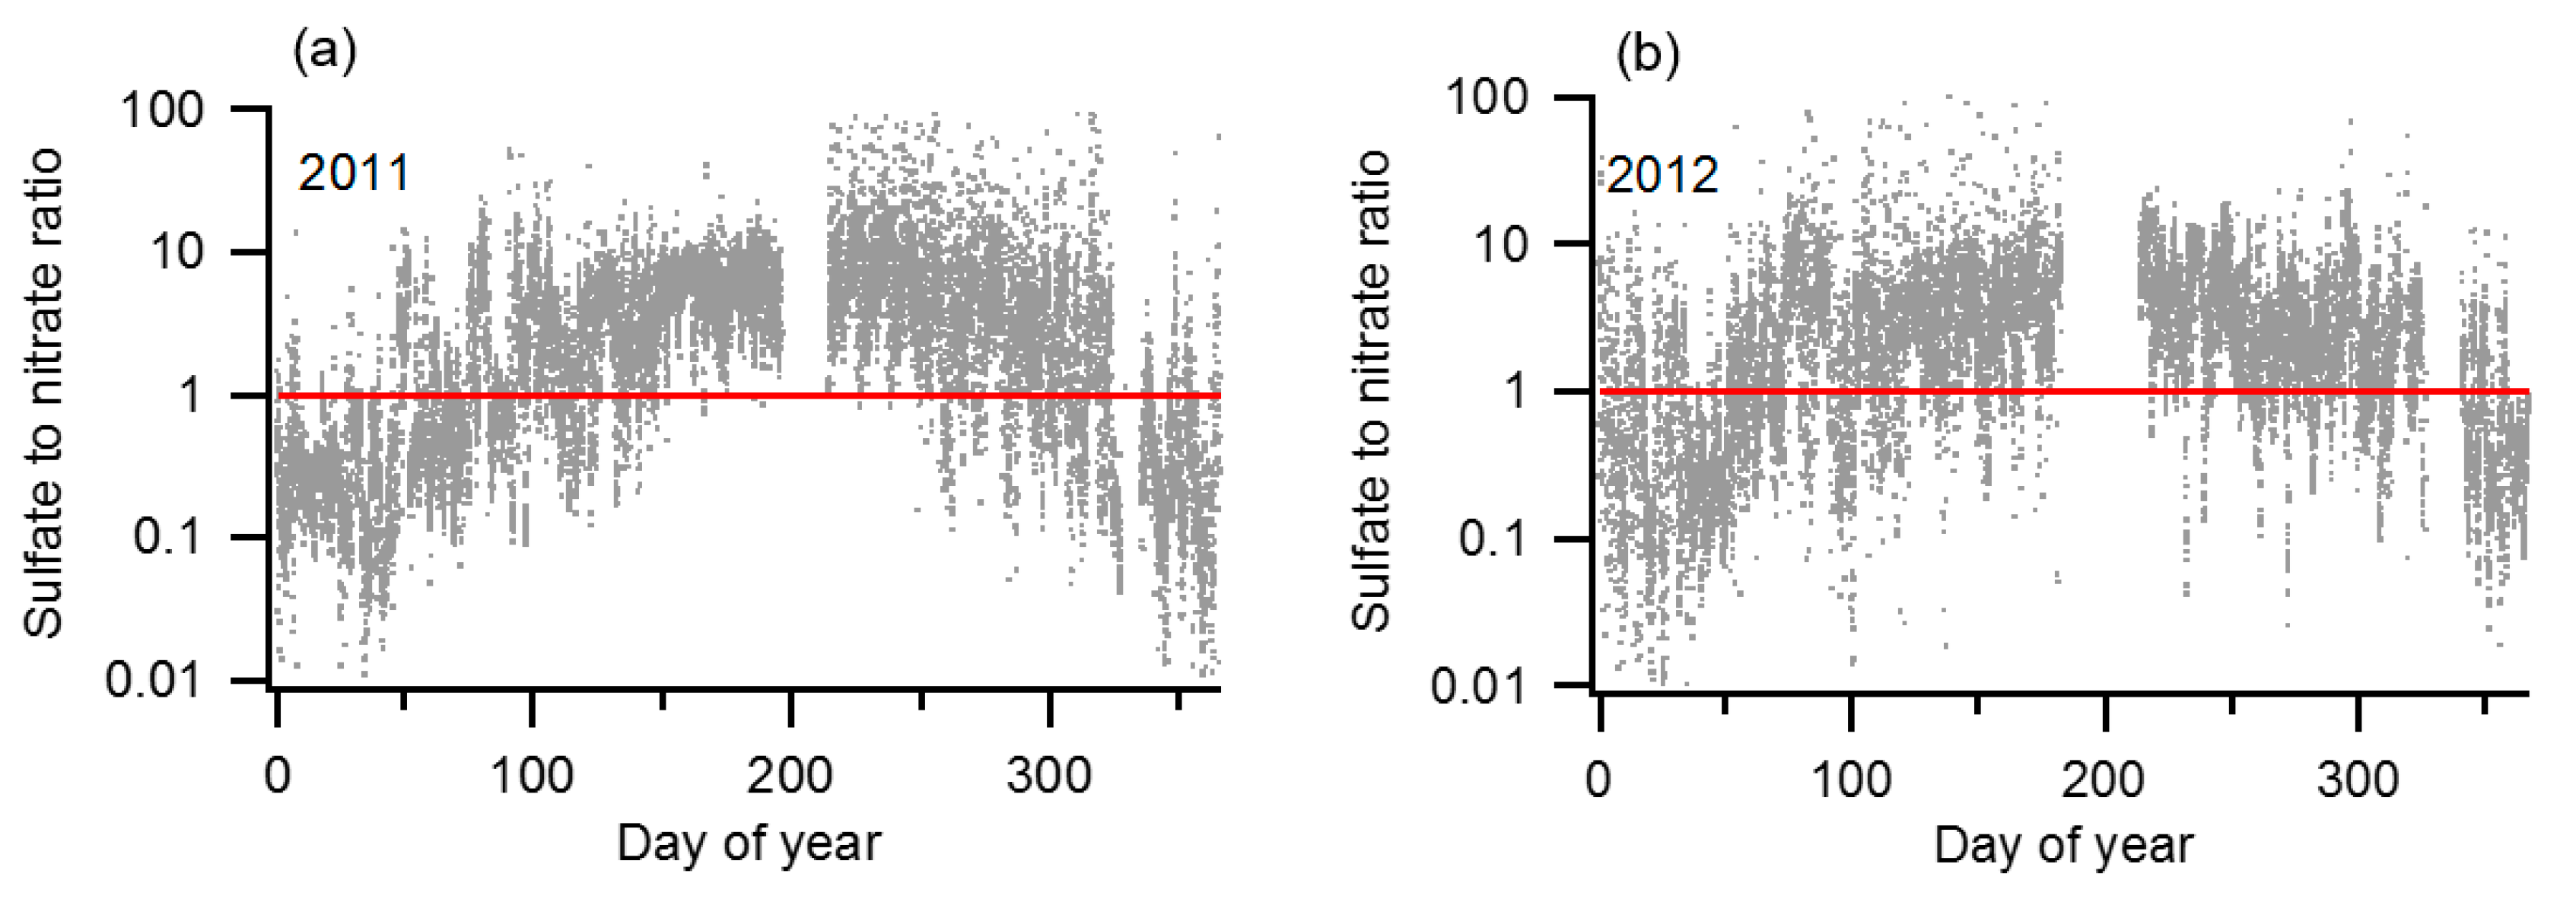

Figure 3.
Seasonal profile of (a) κoverall (left) and (b) κorg (right) in 2011.

Figure 4.
Seasonal average of (a) organic and inorganic mass concentration and (b) the inorganic mass fraction (%) in 2011.
Figure 4.
Seasonal average of (a) organic and inorganic mass concentration and (b) the inorganic mass fraction (%) in 2011.

Figure 5.
Overview of the NCCN calculation approaches.
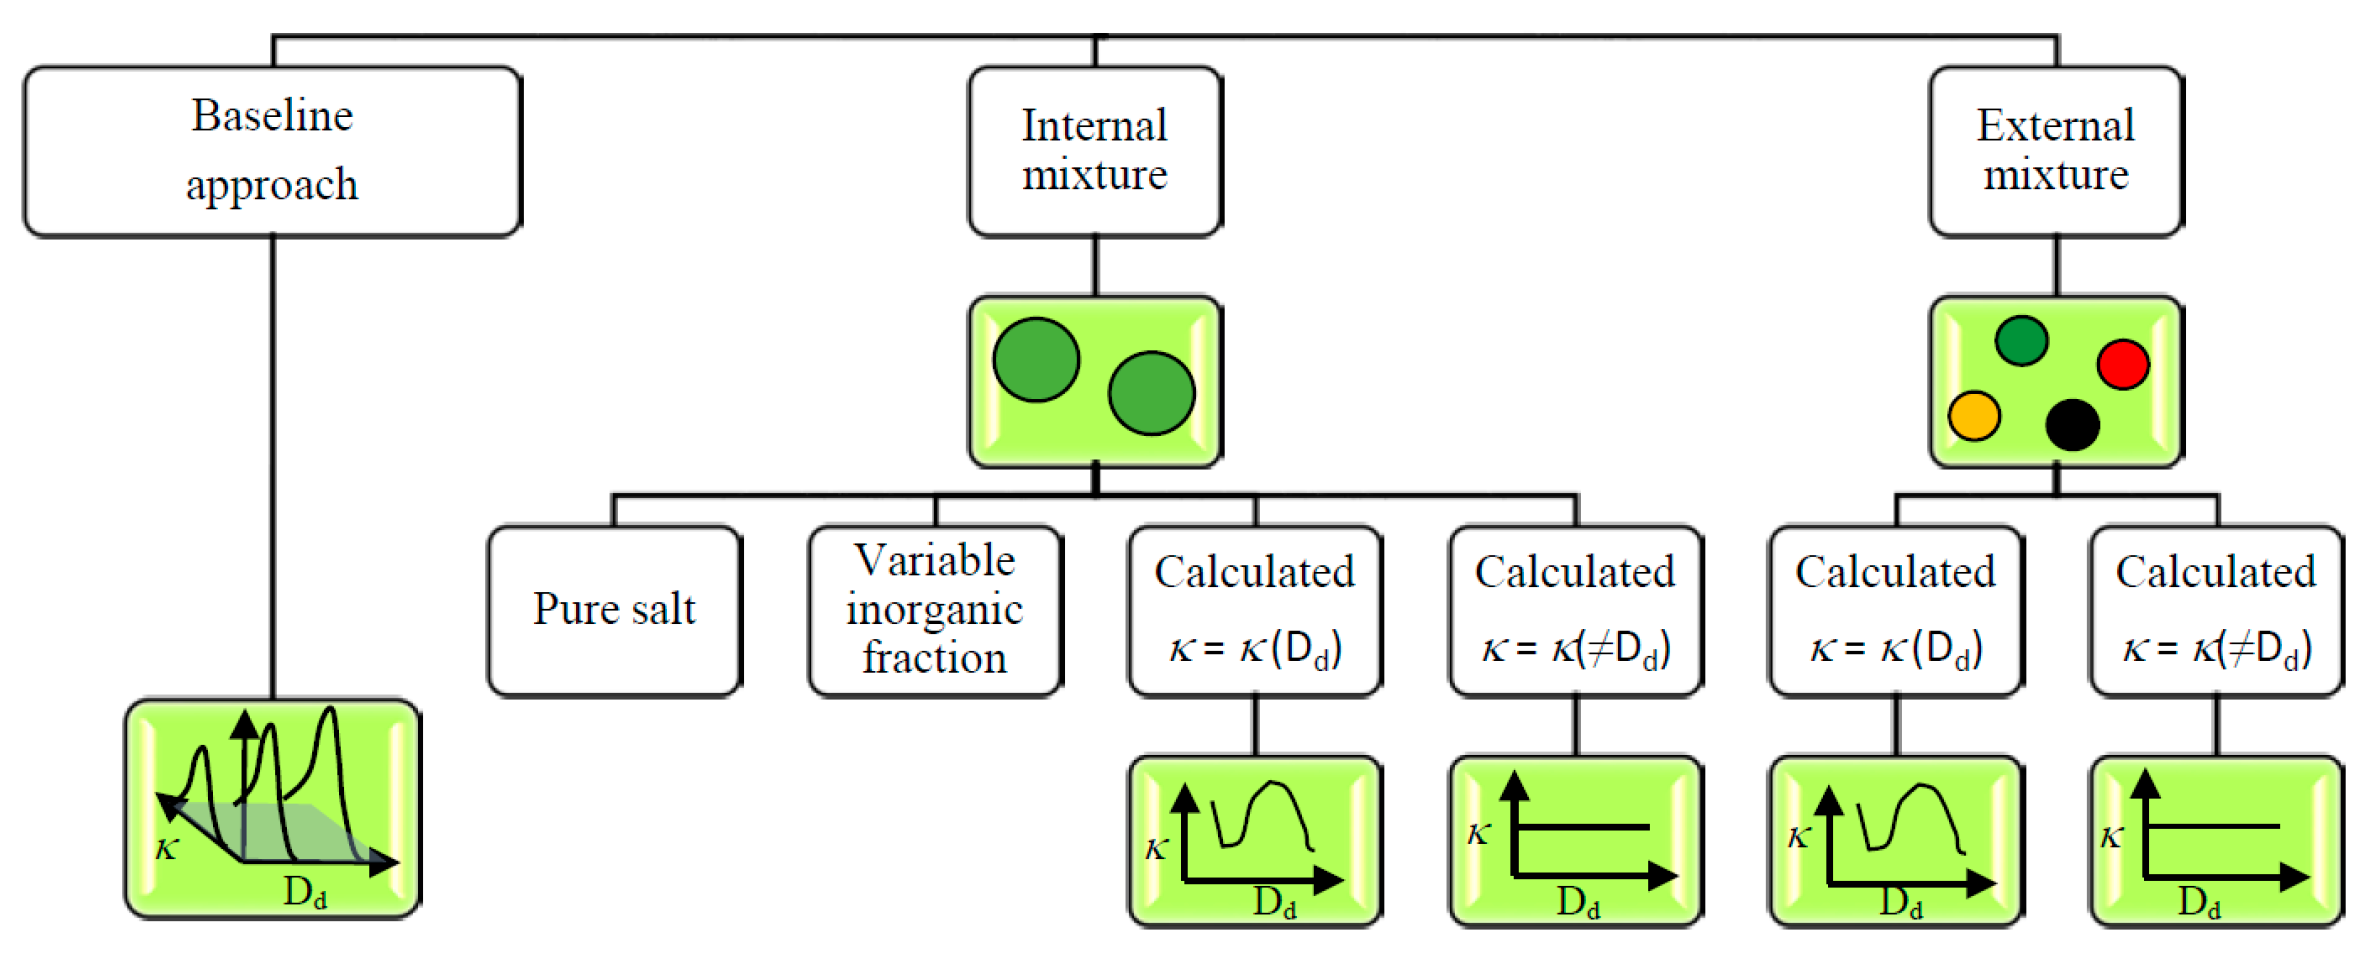
Figure 6.
A graphical illustration of the approaches used to estimate NCCN. (a) Number concentration matrix calculated from a set of measured size and GF distributions. The size distribution is partitioned among the κ bins according to the GF distributions interpolated to each Dp without any averaging or assumptions about mixing state or composition. The same matrix is shown in (b); with lines of constant Sc added. As with all of the estimation techniques, NCCN(S) is estimated by summing the concentration elements (whole or part) above and to the right of the constant Sc (= S) lines; The graphs in (c–g) are from the same set of size and GF distributions as those used for (a,b); but with various assumptions for mixing state and composition that collapse the κ distribution at each bin in the size distribution to one or two values; (c) internal mixture with κ(Dd); (d) internal mixture with κ(≠ Dd); (e) external mixture with κ(Dd); (f) external mixture with κ(≠ Dd); and (g) internal mixture with an assumed inorganic volume fraction of 0.5.

Figure 7.
Comparison between measured and estimated NCCN (cm−3) for May 2011 at 0.25% (a,b); 0.45% (c,d); 0.65% (e,f); and 0.85% S (g,h). The dotted lines in the scatter plots represent +/− 20% relative to the 1:1 line.
Figure 7.
Comparison between measured and estimated NCCN (cm−3) for May 2011 at 0.25% (a,b); 0.45% (c,d); 0.65% (e,f); and 0.85% S (g,h). The dotted lines in the scatter plots represent +/− 20% relative to the 1:1 line.
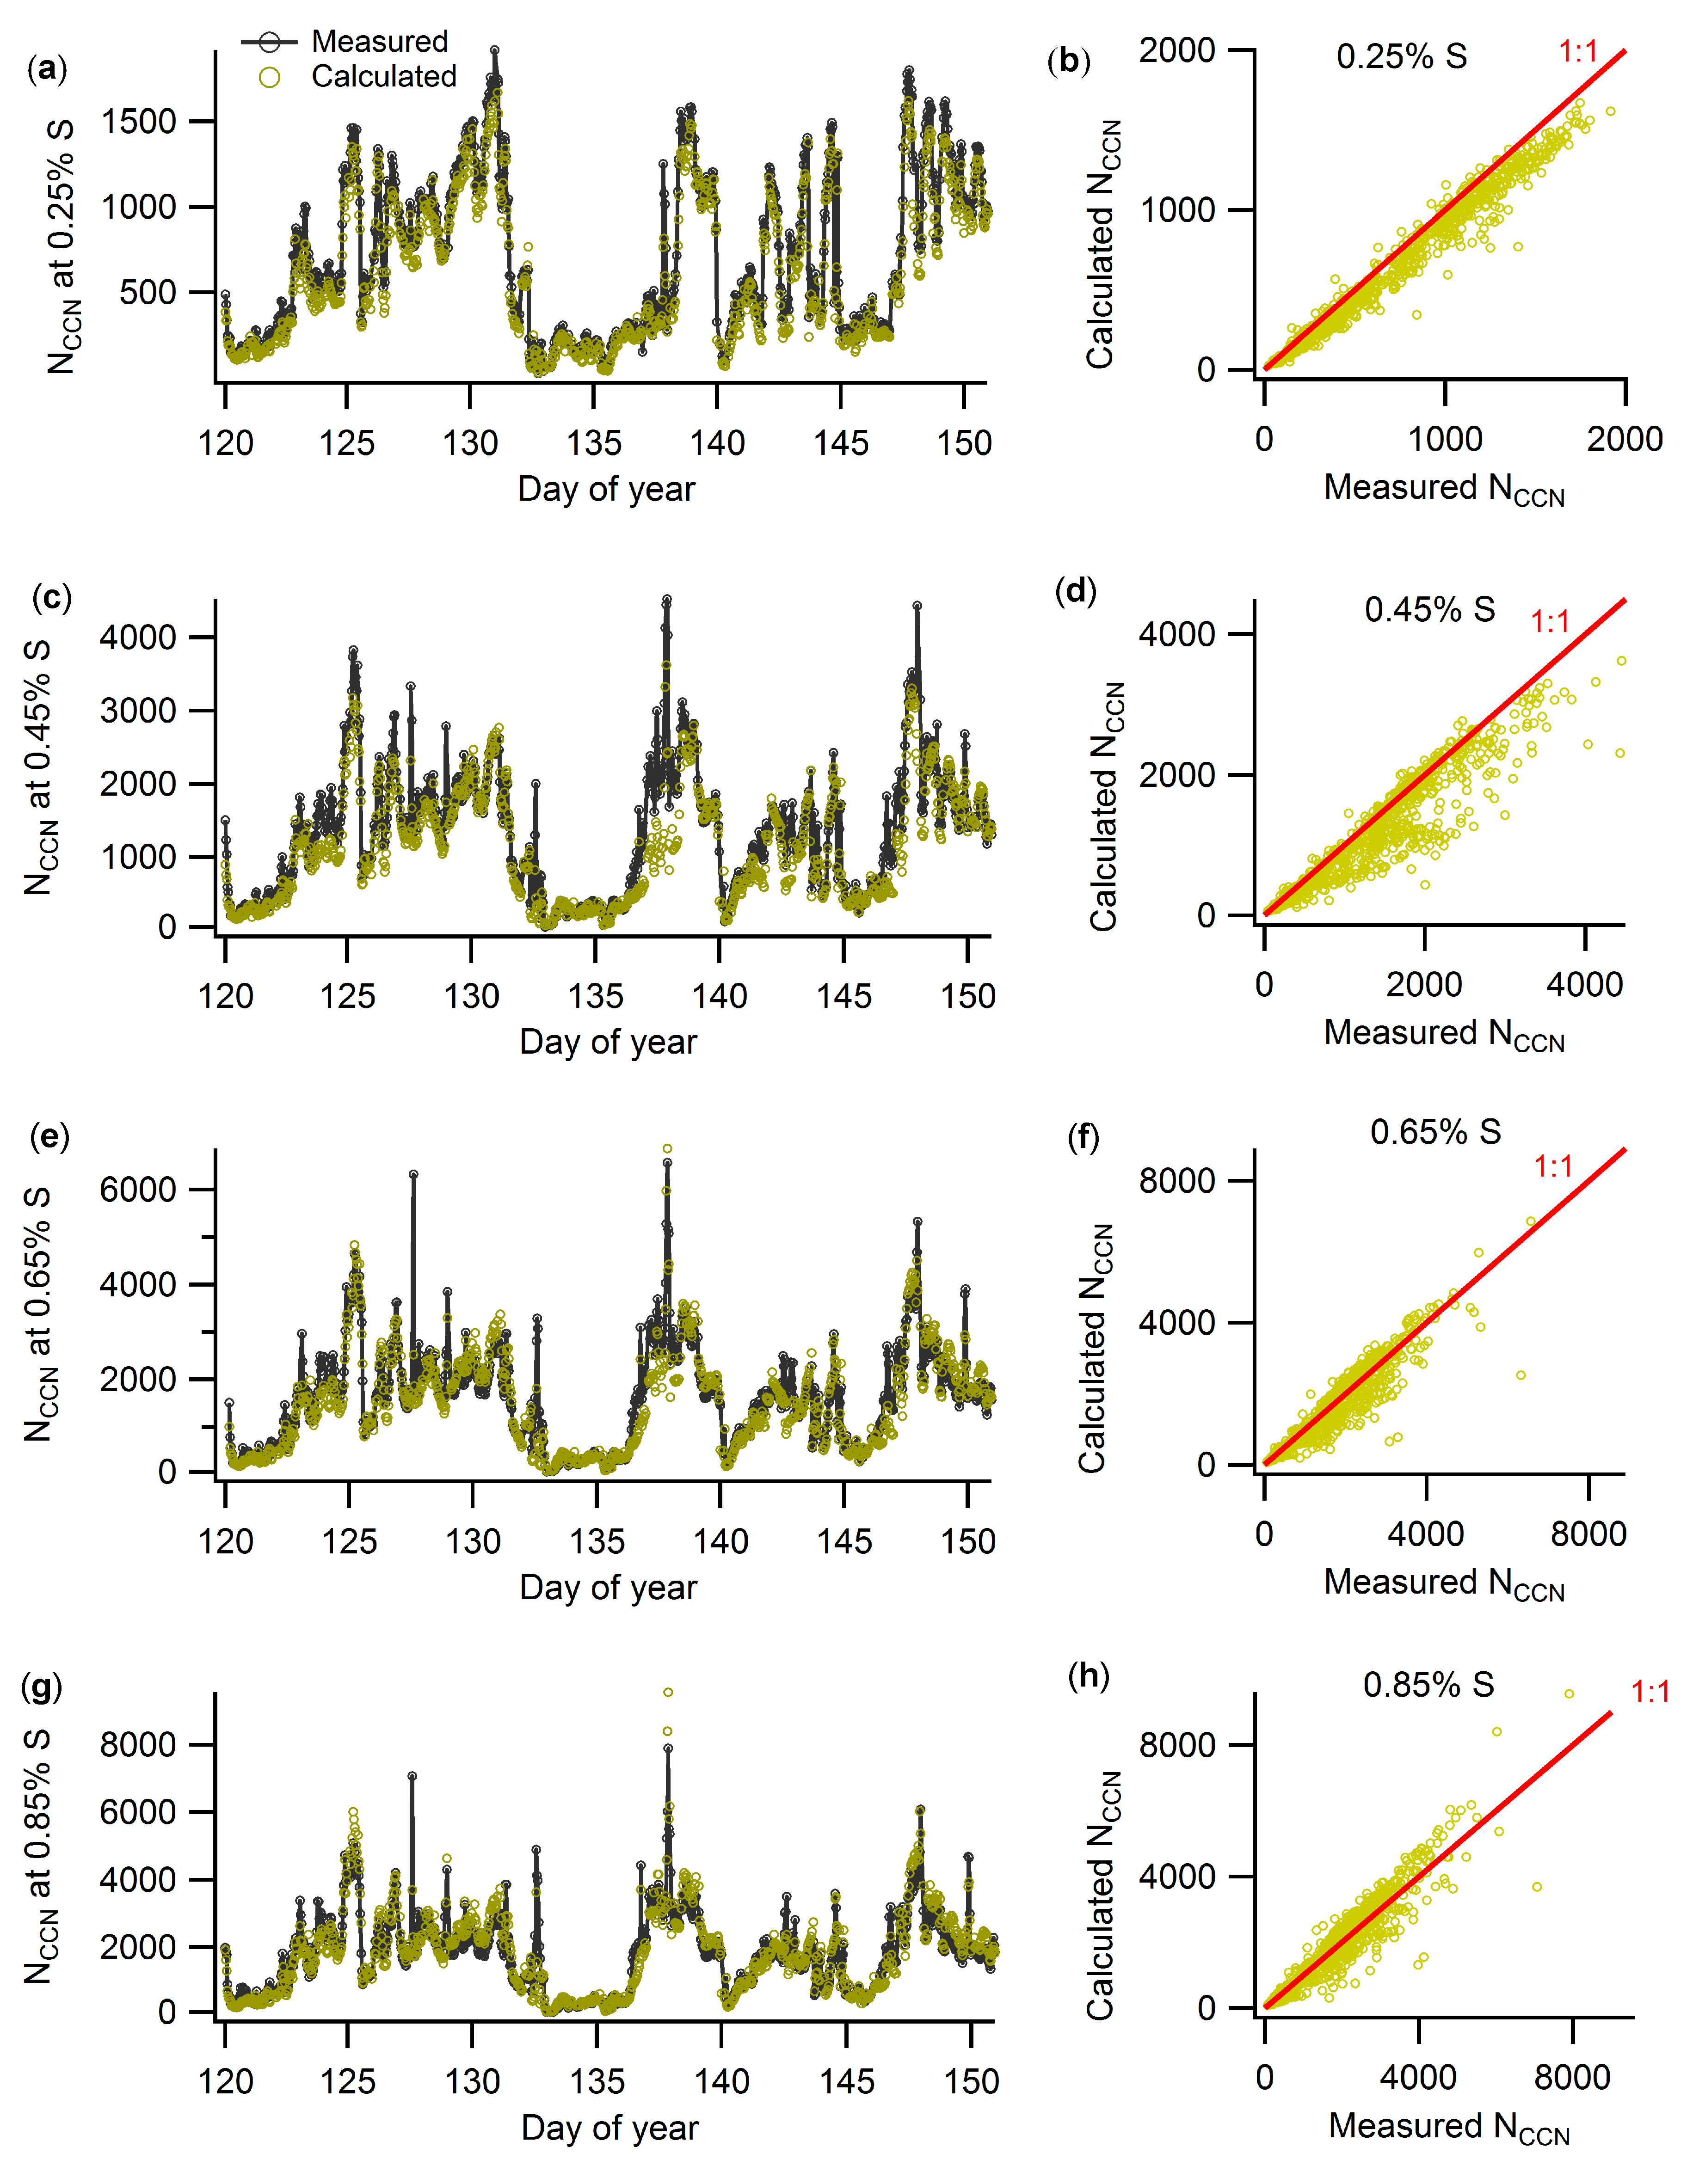
Figure 8.
NCCN estimated from simplified approaches vs. that from the baseline approach at 0.25% S for all 2011 data.
Figure 8.
NCCN estimated from simplified approaches vs. that from the baseline approach at 0.25% S for all 2011 data.
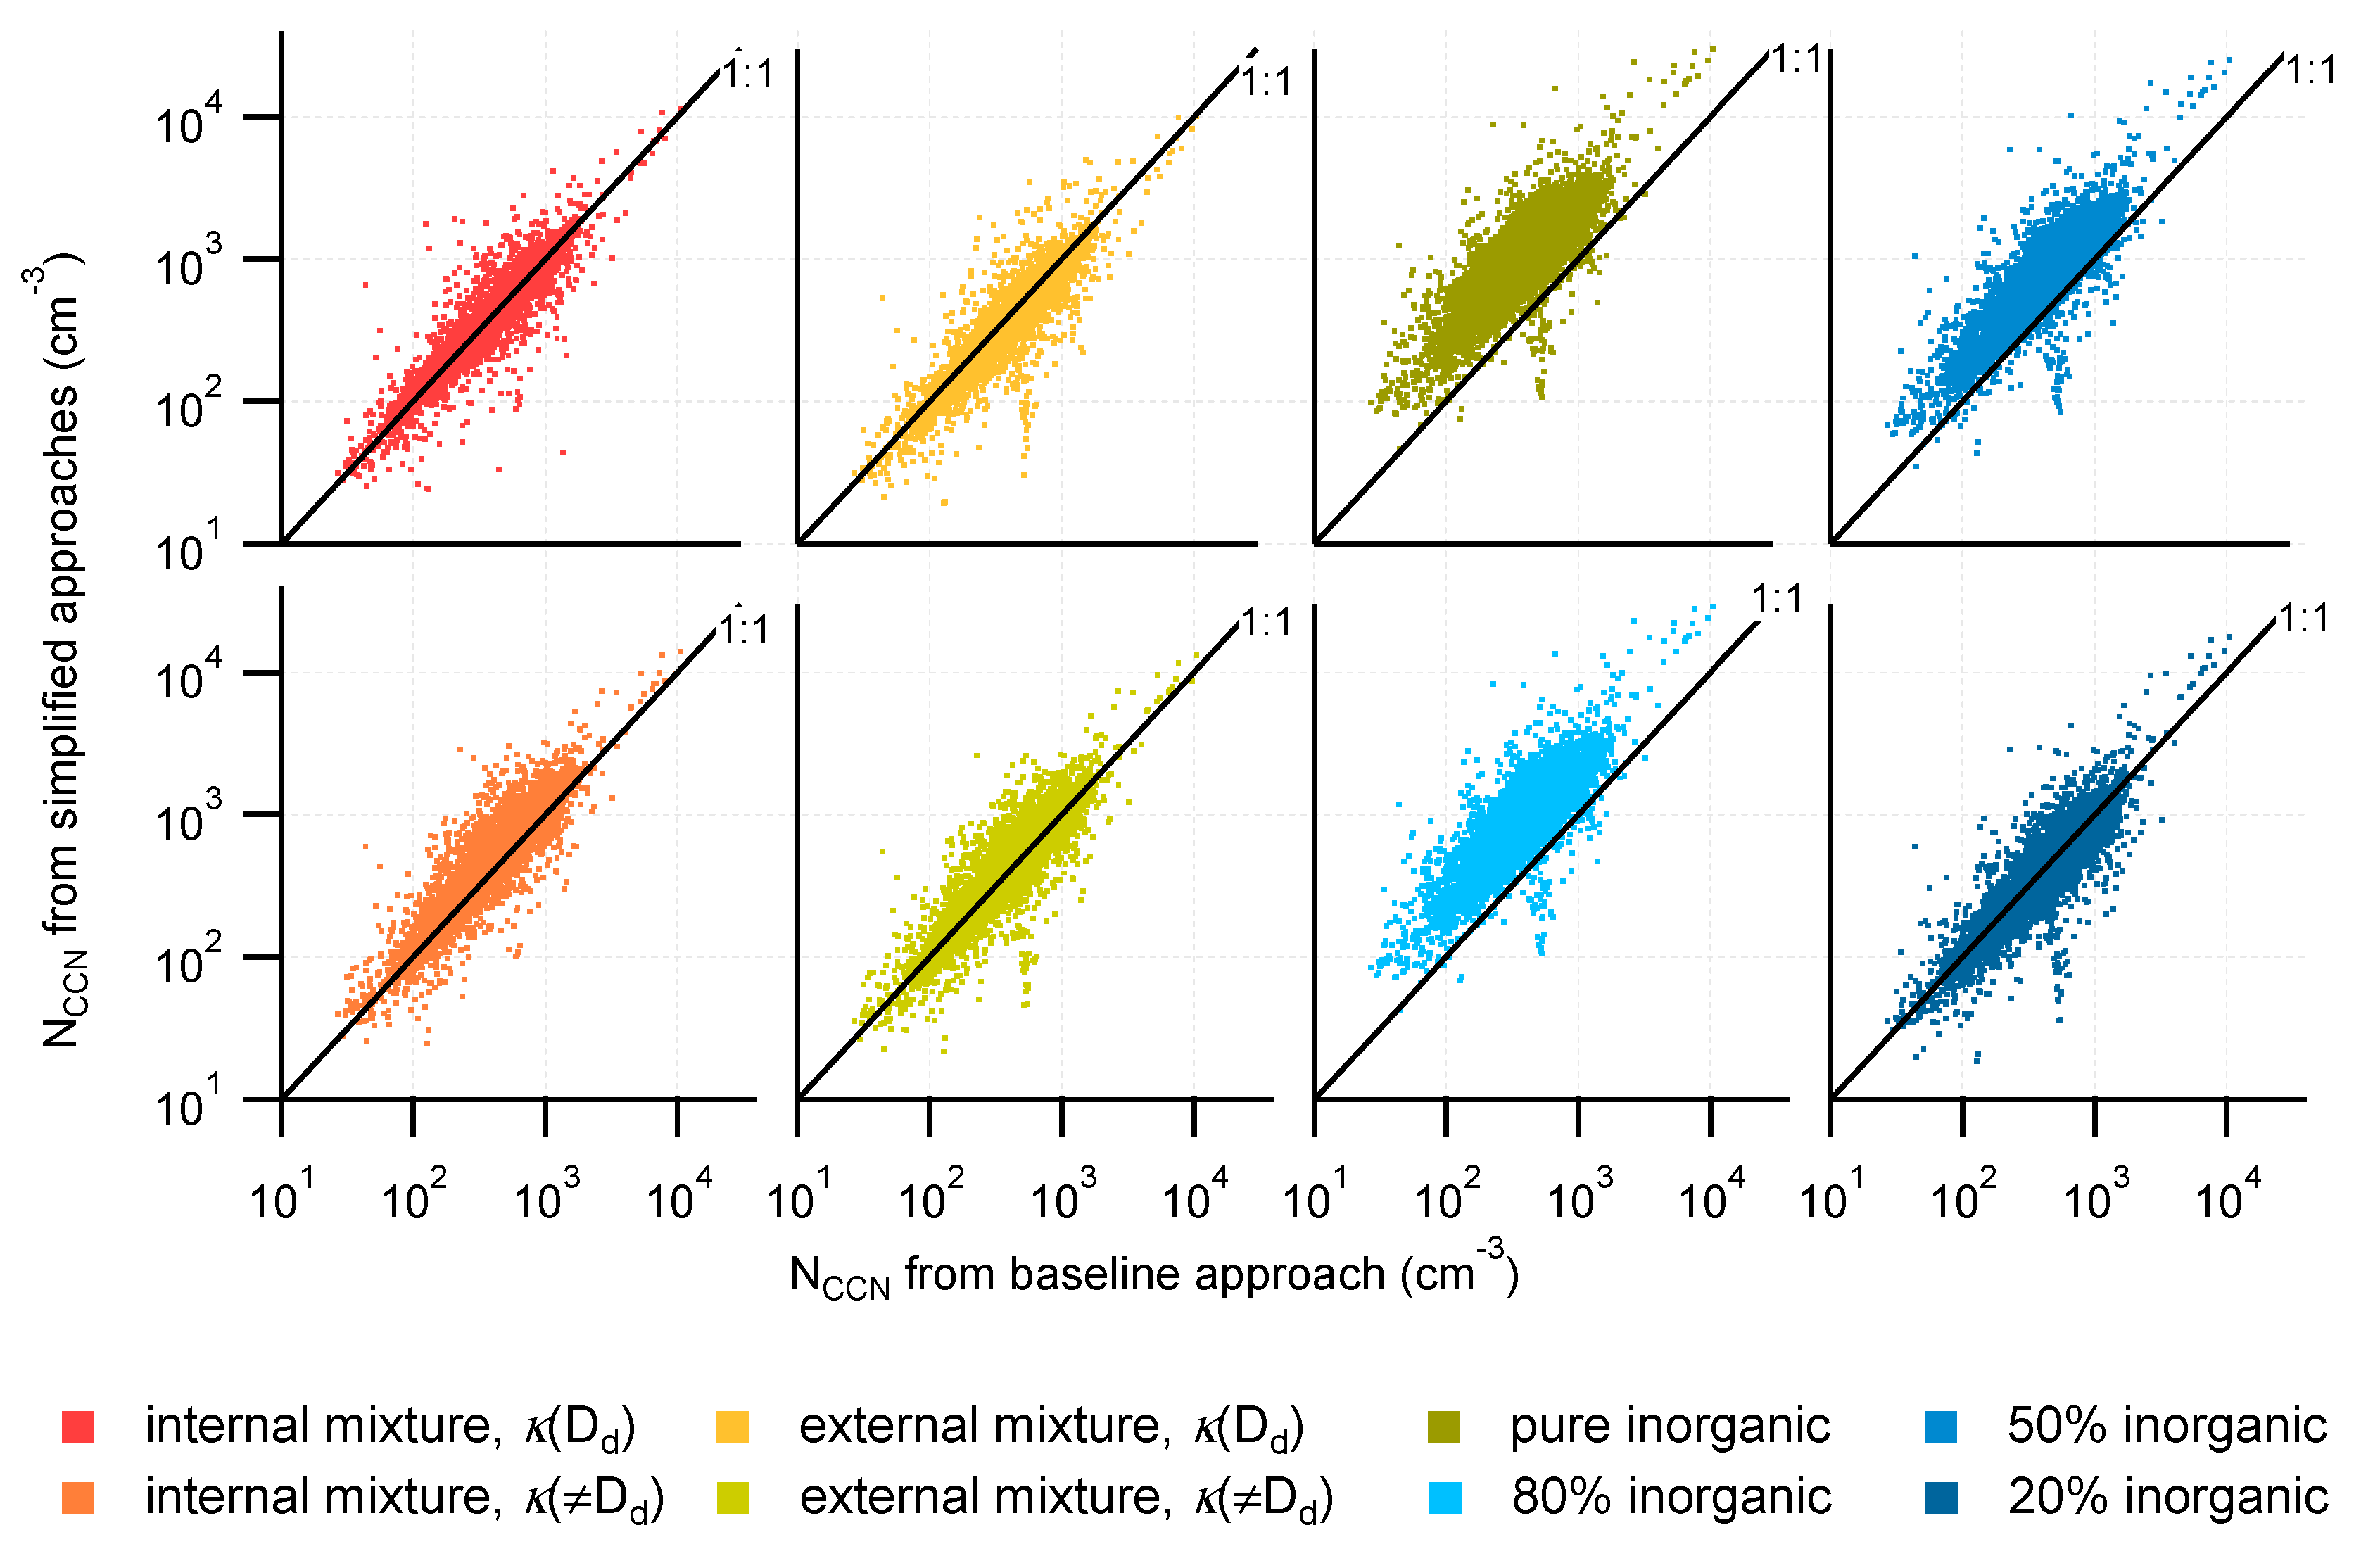
Figure 9.
NCCN estimated from simplified approaches vs. that from the baseline approach at 0.85% S for all 2011 data.
Figure 9.
NCCN estimated from simplified approaches vs. that from the baseline approach at 0.85% S for all 2011 data.
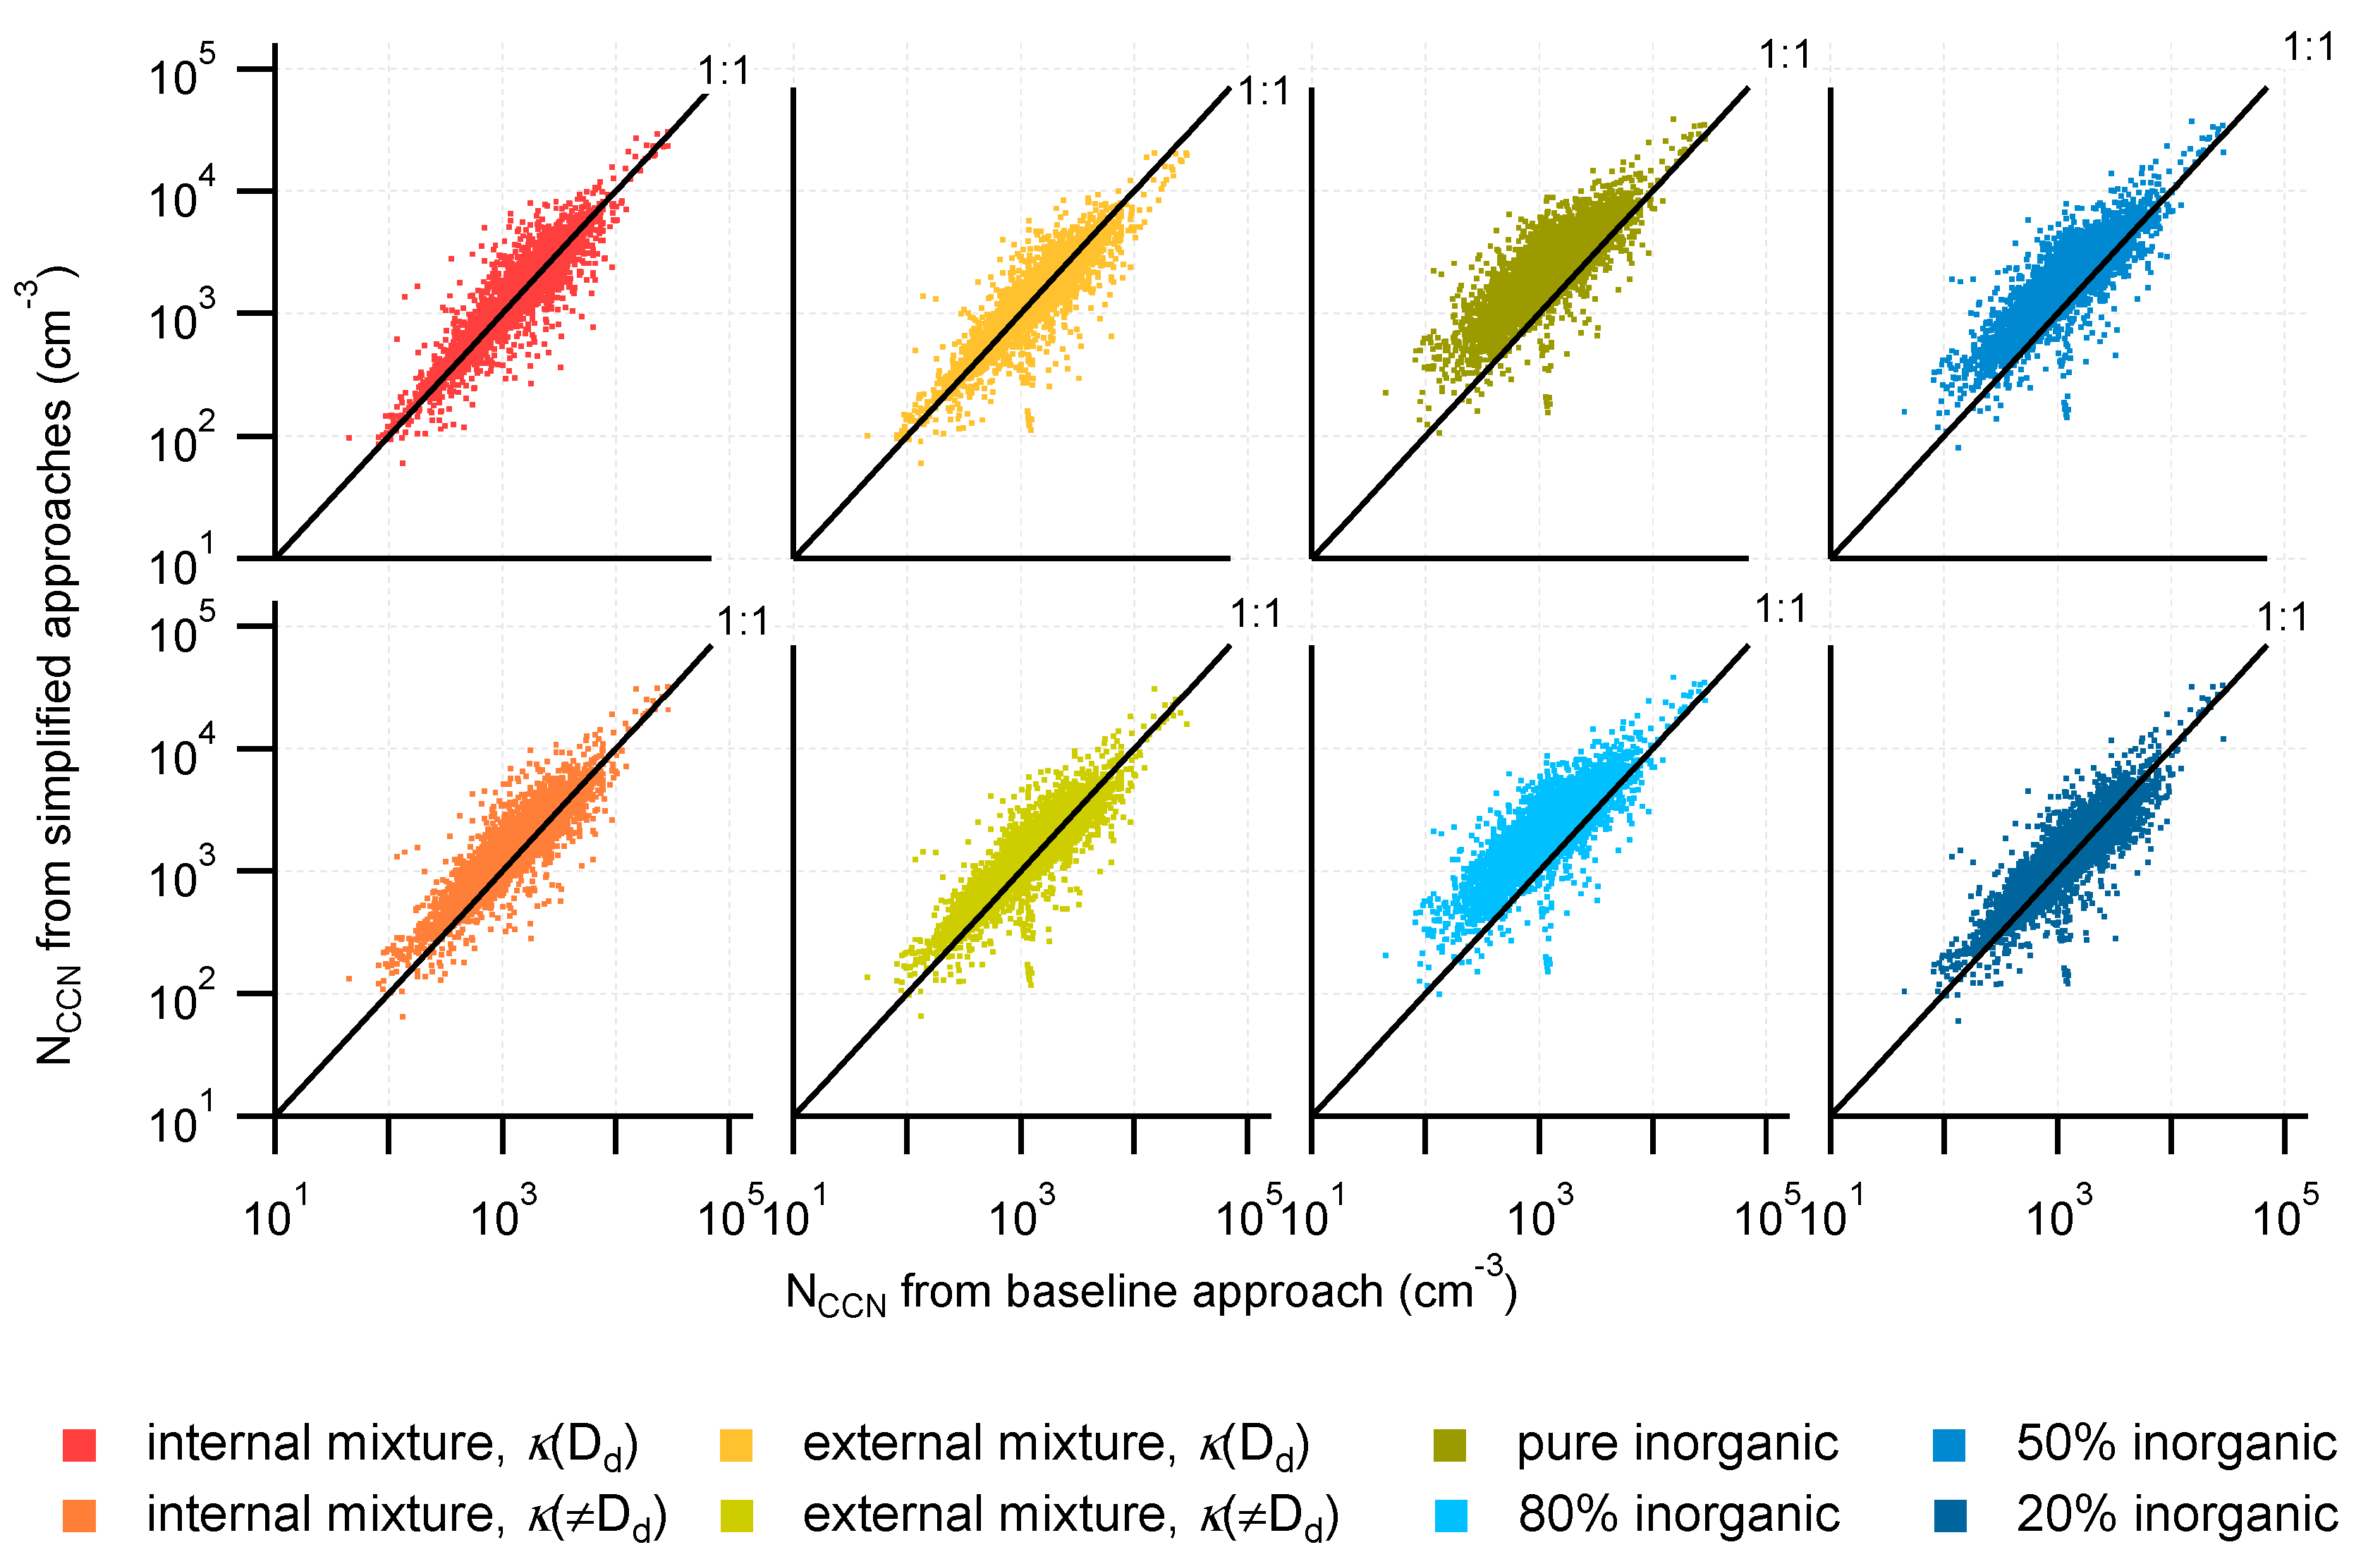
Figure 10.
(a–d) Time series for 2011 of estimated NCCN relative to that from the baseline approach: (a) internal mixture, κ κ(D) at 0.25% S; (b) external mixture, κ κ(D) at 0.25% S (c) internal mixture, κ κ(D) at 0.85% S; and (d) external mixture, κ κ(D) at 0.85% S; (e) Scatter plot of NCCN ratio from (a,b); (f) scatter plot of NCCN ratio from (c,d).
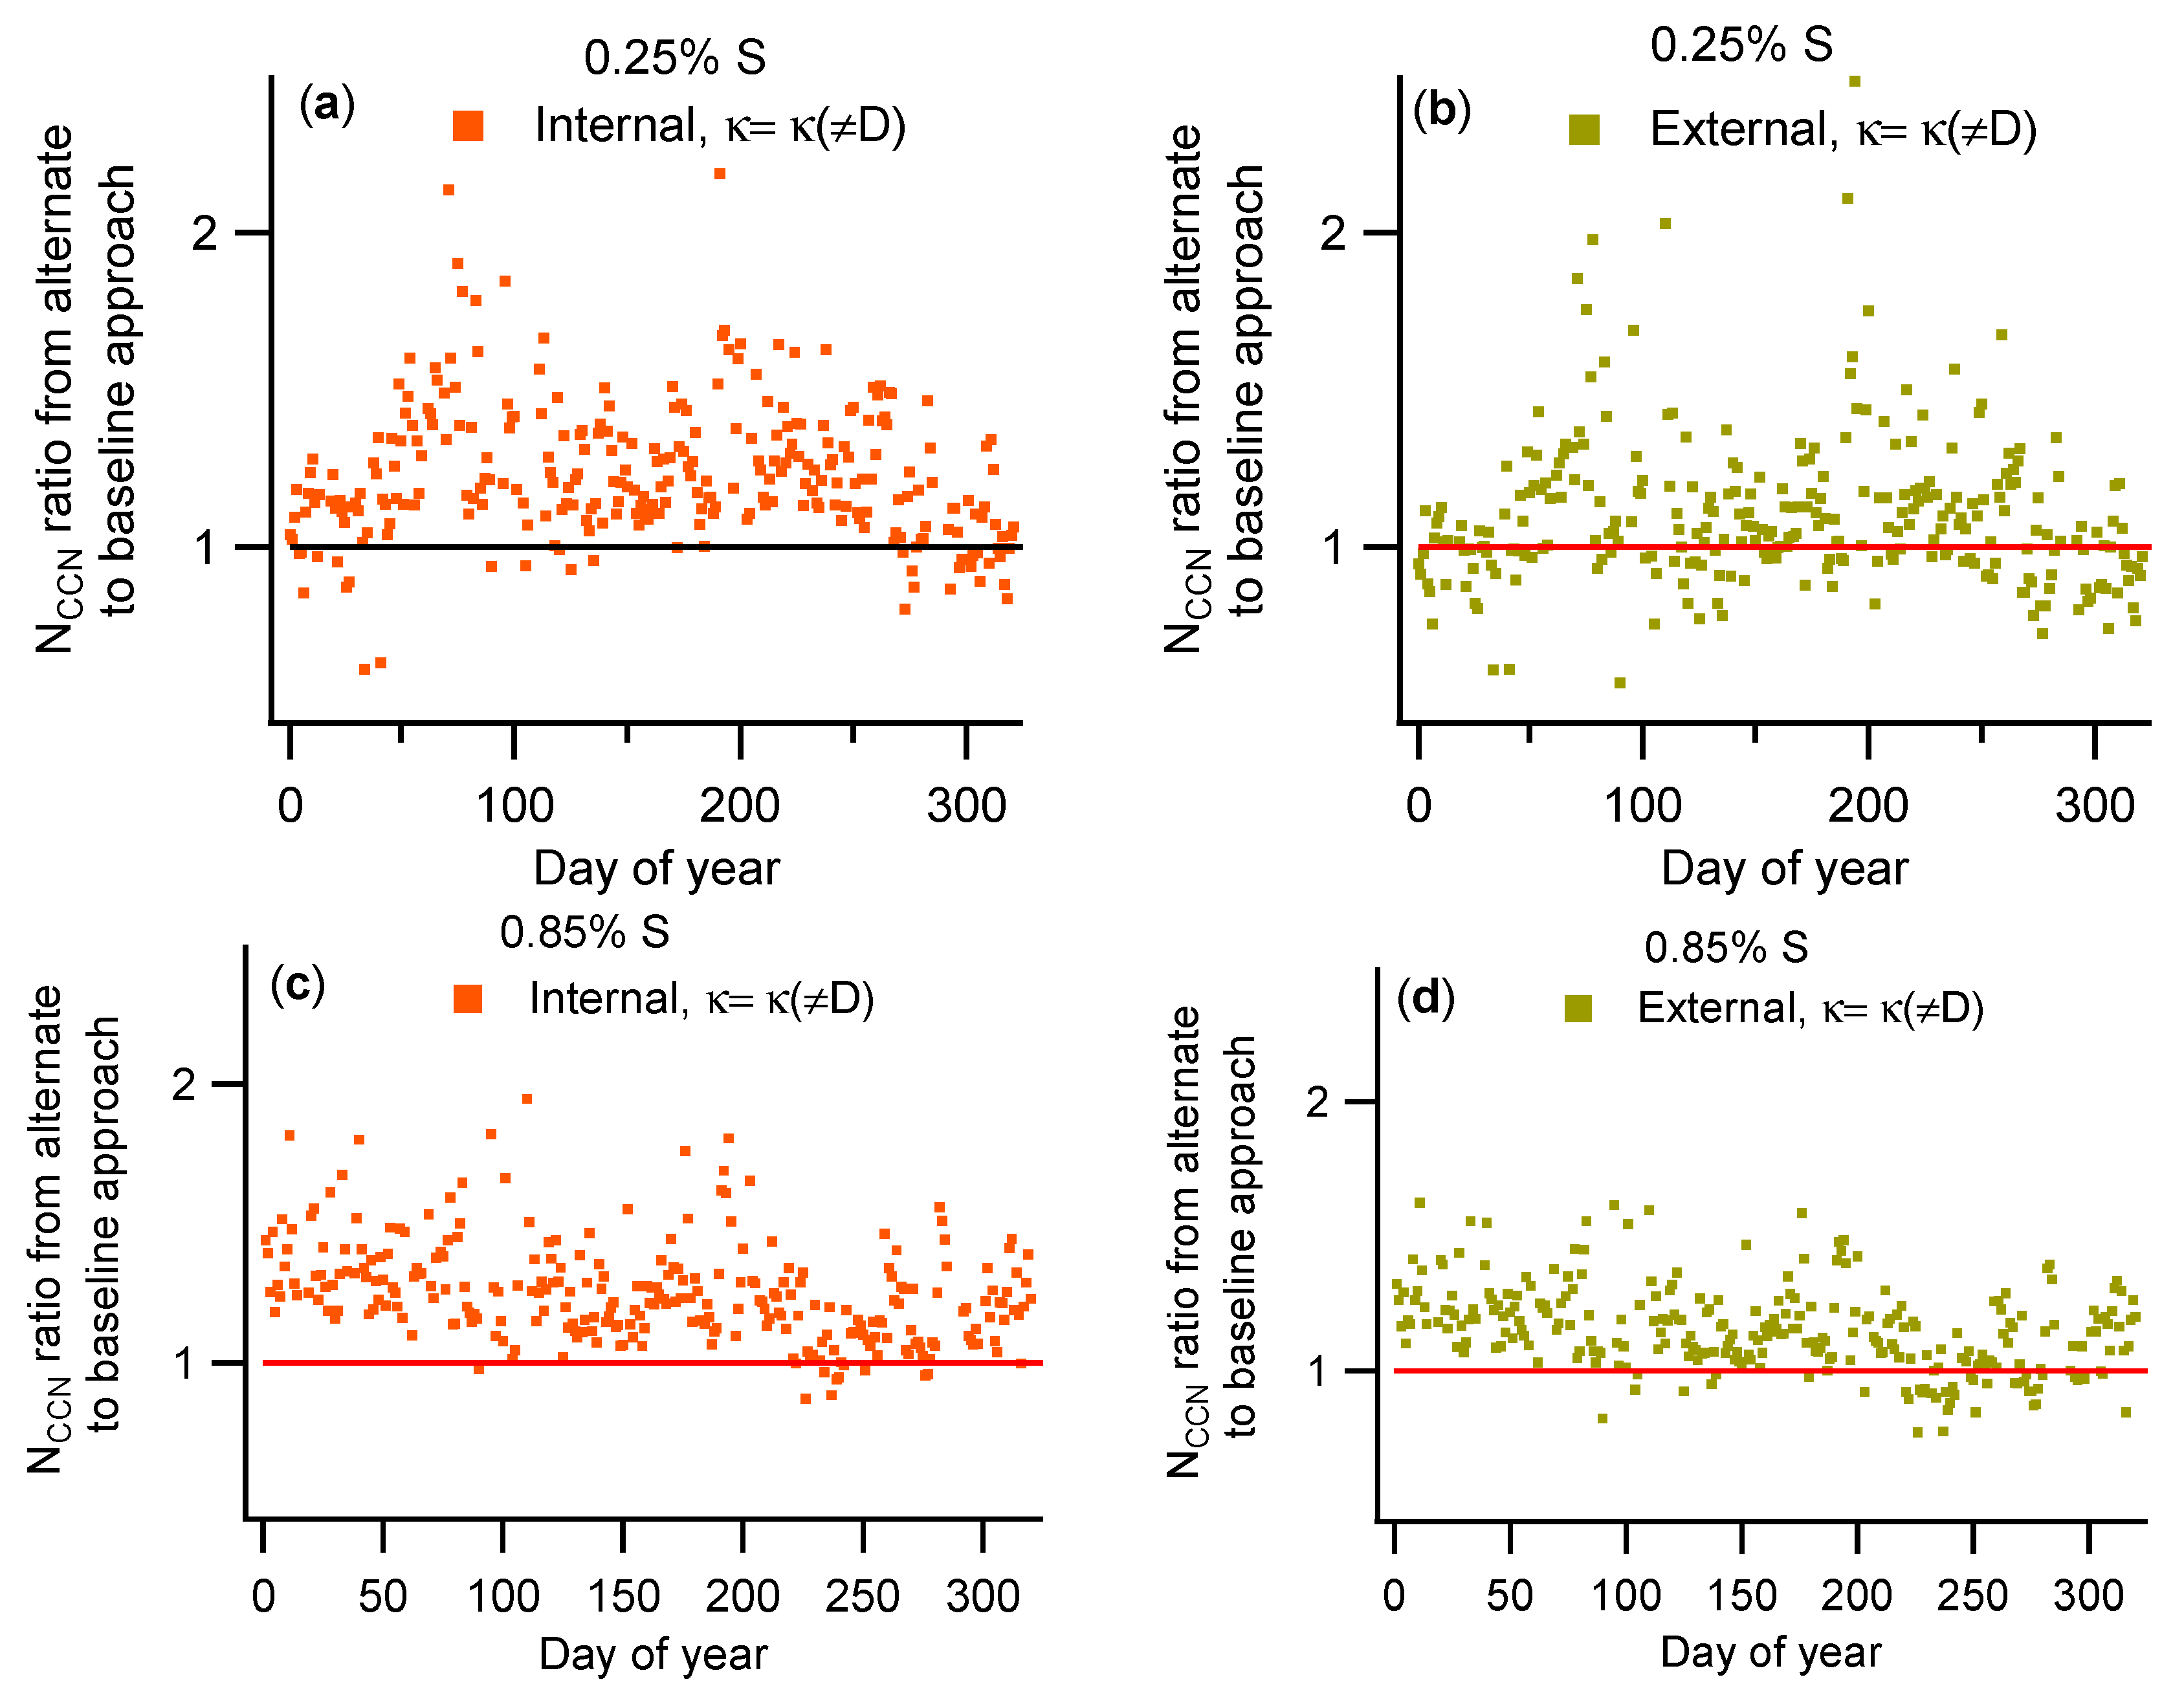

Figure 11.
Time series for 2011 of estimated NCCN relative to that from the baseline approach: (a) internal mixture, κ = κ(D) at 0.25% S; (b) internal mixture, 20% AS at 0.25% S (c) internal mixture, κ = κ(D) at 0.85% S; and (d) internal mixture, 20% AS at 0.85% S.
Figure 11.
Time series for 2011 of estimated NCCN relative to that from the baseline approach: (a) internal mixture, κ = κ(D) at 0.25% S; (b) internal mixture, 20% AS at 0.25% S (c) internal mixture, κ = κ(D) at 0.85% S; and (d) internal mixture, 20% AS at 0.85% S.


Table 1.
List of instruments, measured quantities, manufacturer, and year installed.
| Instrument | Measurement | Manufacturer/Model | Installation Date |
|---|---|---|---|
| Scanning Mobility Particle Sizer (SMPS; part of the “TDMA” system) | Size distribution from 0.012 to 0.74 µm dry diameter (Dd) | Fabricated, Texas A&M University, TX, U.S. | 2005 |
| Hygroscopic Tandem Differential Mobility Analyzer (HTDMA; part of the “TDMA” system) | Hygroscopic growth factor distributions of 0.013, 0.025, 0.05, 0.1, 0.2, 0.4, and 0.6µm Dd particles at 90% RH | Fabricated, Texas A&M University, TX, U.S. | 2005 |
| Cloud Condensation Nuclei counter (CCNc) | CCN concentration at a fixed set of supersaturations | CCN-100 Droplet Measurement Technologies, Longmont, CO, U.S. | 2009 |
| Condensation Particle Counter (CPC) | Concentration of Dd > 0.01 µm particles | Model 3010 TSI, Inc., Shoreview, MN, U.S. | 1996 |
| Aerosol Chemical Speciation Monitor (ACSM) | Sub 1-μm chemical composition (organics, sulfate, nitrate, ammonium, and chloride) | Aerodyne Research, Inc., Billerica, MA, U.S. | 2010 |
| Particle Soot Absorption Photometer (PSAP) | Sub 1-μm absorption coefficient (used to infer black carbon concentration) | Radiance Research, Seattle, WA, U.S. | 1992 |
Table 2.
Mass concentration fraction from ACSM measurements at SGP.
| Year | Mass Concentration Fraction (%) | ||
|---|---|---|---|
| Total Organics | Ammonium Sulfate | Ammonium Nitrate | |
| 2011 | 57 | 17 | 26 |
| 2012 | 56 | 18 | 26 |
| 2013 | 56 | 24 | 20 |
Table 3.
NRMSE between measured and estimated NCCN at 4 different S from 2009–2012 and for May 2011.
Table 3.
NRMSE between measured and estimated NCCN at 4 different S from 2009–2012 and for May 2011.
| Year/Month | NRMSE @ % S | |||
|---|---|---|---|---|
| 0.25 | 0.45 | 0.65 | 0.85 | |
| 2009 | 0.53 | 0.36 | 0.35 | 0.35 |
| 2010 | 0.22 | 0.29 | 0.27 | 0.25 |
| May 2011 | 0.17 | 0.22 | 0.21 | 0.21 |
| 2011 | 0.29 | 0.29 | 0.26 | 0.26 |
| 2012 | - | 0.33 | 0.38 | 0.36 |
Table 4.
Fit parameters of NCCN estimate approaches for 2011 data
| Model | Slope (m) @ % S | Correlation Coefficient (r2) @ % S | |||||||
|---|---|---|---|---|---|---|---|---|---|
| 0.25 | 0.45 | 0.65 | 0.85 | 0.25 | 0.45 | 0.65 | 0.85 | ||
| Baseline | 1 | 1 | 1 | 1 | 0 | 1 | 1 | 1 | 1 |
| Internal, κ = κ(Dd) | 1.01 | 1.02 | 1.01 | 1.01 | 0.002 | 0.87 | 0.87 | 0.85 | 0.84 |
| Internal, κ = κ( Dd) | 1.21 | 1.18 | 1.13 | 1.10 | 0.095 | 0.82 | 0.81 | 0.80 | 0.80 |
| External, κ = κ(Dd) | 0.90 | 0.92 | 0.90 | 0.90 | 0.009 | 0.81 | 0.81 | 0.78 | 0.77 |
| External, κ = κ( Dd) | 1.06 | 1.07 | 1.02 | 1.00 | 0.061 | 0.80 | 0.80 | 0.79 | 0.77 |
| Internal, pure AS | 2.37 | 1.82 | 1.57 | 1.43 | 0.400 | 0.67 | 0.69 | 0.68 | 0.67 |
| Internal, 50% AS | 1.76 | 1.50 | 1.33 | 1.26 | 0.285 | 0.72 | 0.75 | 0.76 | 0.74 |
| Internal, 20% AS | 1.05 | 1.05 | 1.03 | 0.99 | 0.057 | 0.72 | 0.78 | 0.77 | 0.76 |
© 2018 by the authors. Licensee MDPI, Basel, Switzerland. This article is an open access article distributed under the terms and conditions of the Creative Commons Attribution (CC BY) license (http://creativecommons.org/licenses/by/4.0/).
Share and Cite
MDPI and ACS Style
Mahish, M.; Jefferson, A.; Collins, D.R. Influence of Common Assumptions Regarding Aerosol Composition and Mixing State on Predicted CCN Concentration. Atmosphere 2018, 9, 54. https://doi.org/10.3390/atmos9020054
AMA Style
Mahish M, Jefferson A, Collins DR. Influence of Common Assumptions Regarding Aerosol Composition and Mixing State on Predicted CCN Concentration. Atmosphere. 2018; 9(2):54. https://doi.org/10.3390/atmos9020054
Chicago/Turabian StyleMahish, Manasi, Anne Jefferson, and Don R. Collins. 2018. "Influence of Common Assumptions Regarding Aerosol Composition and Mixing State on Predicted CCN Concentration" Atmosphere 9, no. 2: 54. https://doi.org/10.3390/atmos9020054
Note that from the first issue of 2016, this journal uses article numbers instead of page numbers. See further details here.