1. Introduction
Particular Matters (PM) are classified by the United States Environmental Protection Agency (U.S. EPA) as one of the six pollutants harmful to public health and the environment. The most frequent causes for premature death attributable to air pollution are represented by heart disease and stroke and are accountable for 80% of premature death cases [
1]. Moreover, air pollution has been identified as the main cause of several other pathological conditions such as respiratory and cardiovascular diseases and cancer [
2], with either long- or short-term health effects. A lifelong exposure increment in the PM
10 mass concentration of 10 μg m
−3 results in a 22% increasing of adenocarcinomas [
3].
The International Agency for Research on Cancer (IARC) has grouped air pollutants, classifying particulate matter (PM), a specific element of air pollution mixtures, as carcinogenic [
4]. PM pollution, which derivates from a large set of natural and anthropogenic sources [
5], is a serious environmental problem principally caused by the presence of toxic compounds i.e., PAHs and trace metals in the atmosphere. Scientific lines of evidence prove that several metals (even according to their oxidation state) can play different active roles in the emergence of PM biological effects; then, the interactions between metals and biologic systems seem to be of primary importance [
6]. In order to avoid, prevent or reduce harmful effects of metals the Directive 2008/50/EC [
7] of the European Parliament (Italian transposition of Directive: D.Lgs. 155/2010), establishes annual target values for the concentration of As (6 ng m
−3), Cd (5 ng m
−3) Ni (20 ng m
−3) and Pb (500 ng m
−3) (revealed in PM
10) in ambient air.
Arsenic (As) is correlated to a large number of disorders in cardiovascular, hematopoietic, respiratory, immune, integumentary, nervous, renal, endocrine, hepatic, reproductive and development systems. Furthermore, available literature evidently demonstrates that the fetal exposure to arsenic induces epigenetic effects and causes higher pathological sensitivity in elder adults. The main emissions of As come from metal smelters and combustion of fuels [
8].
Short-term effects of Cadmium (Cd) involve respiratory inflammation, while long-term exposure to Cd causes injures to liver, lung, bones, immune system, blood and nervous system. Current evidences suggest that inhalation of Cd causes genomic susceptibility through intricate and multicomponent mechanisms. DNA mismatch repair mechanism (MMR) and induction of apoptosis appear to be the most important factors for Cd toxicity [
9]. The principal origins of Cd are anthropogenic, such as smelting and refining of non-ferrous metals, iron and steel production and cement production, fossil fuel combustion and municipal waste incineration. The main natural source of Cd is volcanic activity [
10].
Prolonged exposure to Nickel (Ni) can produce dermatitis and disorders in the respiratory system. Ni is emitted from the combustion of fuel oil (e.g., from heating or power generation purposes), Ni mining, incineration of waste and sewage sludge, steel manufacture, electroplating and coal combustion. High concentrations of Ni have been observed in Saharan dust, too [
11].
Lead (Pb), underrepresented in the Earth’s crust, determinates pathological effects in the nervous and vascular systems and in the porphyrin and heme synthesis [
12]. Pb is emitted from fossil-fuel combustion, waste incineration and during the production of non-ferrous metals, iron, steel and cement.
Copper (Cu) represents an important micronutrient, implicated in different physiological mechanisms, but it can be toxic when in excess, causing many different chronic effects, such as liver damage. Menkes syndrome and Wilson disease are genetic pathologies related to serious Cu deficiency and toxicity [
13].
Prolonged exposure to Chromium (Cr (VI)) determinates impairment in the blood homeostasis due to oxidative stress in the body, affecting iron (Fe) metabolism and promoting renal damage [
14]. Cr can be both of natural origin (particulate matter from shale, clay and other types of soil produced by wind erosion) than of anthropogenic origin (fuel ignition, chrome plating or steel production) [
15].
Manganese (Mn) is reported to be essential for the development of the brain, being the concentrations in human brain higher in adults (approximately 0.25 mg g
−1 wet weight) than in infants, proving that brain functions depend on the concentration of this metal [
16]. When its concentration excessively increases in the brain, particularly in the basal ganglia, this causes neurotoxicity and neurodegenerative dysfunctions comparable to Parkinson’s disease [
17]. Mn has mainly natural origins such as wind erosion that produces and spreads the metal, while in contrast the anthropogenic origins of manganese include metallurgical activities, production of batteries and fossil fuels combustion [
18].
Vanadium (V) affects human health through respiratory and digestive systems inflammation and interfering with cholesterol synthesis [
19].
Zinc (Zn) is a widespread component of Earth’s crust, due to its importance for plants, animals and microorganisms; anyway, high concentrations of the metal lead to anemia and to low levels of low density cholesterol, together with copper and iron intake decreasing [
20].
Antimony is found naturally in the environment at very low levels, the most likely exposure pathway to higher background levels of antimony is inhalation. Chronic inhalation can result in respiratory effects, inflammation of the lungs, chronic bronchitis and chronic emphysema [
21].
Bioavailability of metals in PM is deeply influenced by chemical-physical properties like hydro-solubility, dimensional distribution and inclusion in aerosol particles. Considering the importance of metals as a risk for human health, a cautious control has to be performed.
This study is aimed to the investigation of temporal variation in mass concentration of heavy metal components included in airborne particulate matter (PM
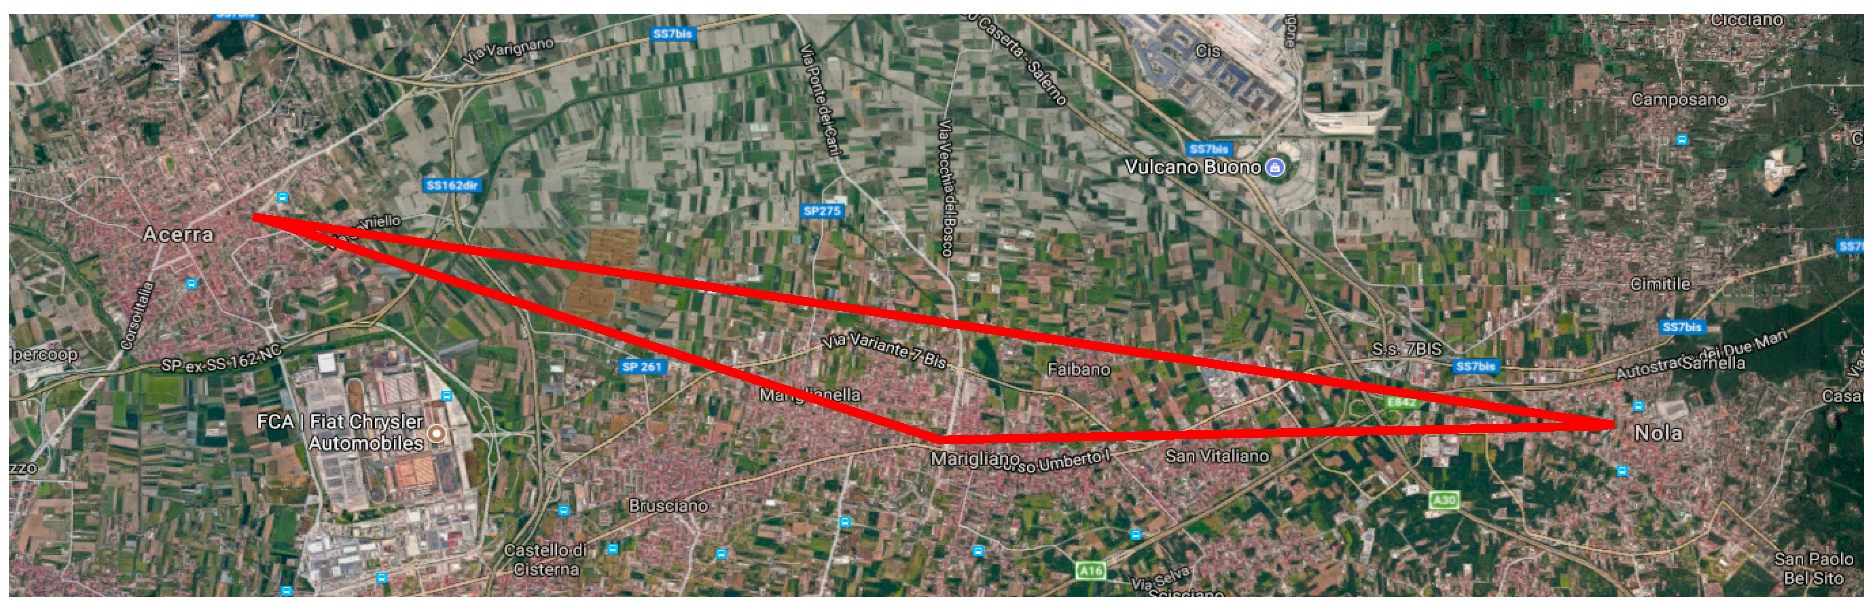
10) collected in a site of a typical urban-industrial city of Southern Italy (Acerra). Acerra is located in “
triangle of death”, term introduced by Senior and Mazza [
22] for the identification of an area delimited by three towns: Nola, Marigliano and Acerra (
Figure 1) characterized by the presence of the landfill of hazardous wastes and influenced by illegal waste dumping and burning practices [
23]. The composition of landfilled wastes results in different kinds of substances, especially of toxic residues derived from final stages of the industrial processes and therefore containing metals as copper, arsenic, antimony, etc. Human health is deeply affected by environmental pollution of waste dumping and burning through either short- or long-term effects. Therefore air quality monitoring becomes an important environmental issue.
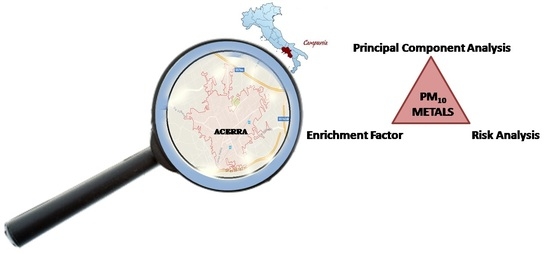
Moreover, the aim of the study is to identify possible sources of heavy metals associated with the atmospheric aerosols using the enrichment factors (EnFs) and principal component analysis (PCA) and to estimate a health risk related to inhalation of airborne PM10 metals via an environmental-sanitary risk assessment.
2. Materials and Methods
2.1. PM Sampling
PM sampling was performed in a site located in Acerra (Italy). The city belongs to Campania Region (Southern Italy) and has an area of 54.71 km2, with a population of 59,830 inhabitants (31 December 2016—ISTAT).
The study area (45°27′55.63″ N, 9°11′11.46″ E) is an urban-industrial site characterized by the presence of high vehicular traffic density, several industries (i.e., plastic material stamping, pigment production, foundries, etc.) and by the presence of the regional waste incinerator.
The geology and morphology of the whole area have been influenced particularly by Mount Vesuvio volcanic activity and by tectonic activities during upper Pleistocene–Holocene; moreover, Rubeolo and Sebeto paleo-fluvial systems contributed to conditioning these aspects [
24].
The climate in Acerra is temperate: mean monthly values of relative humidity during the sampling campaigns ranged between 35% and 65%, while those of temperature between 6 °C in winter and 32 °C during summer.
2.2. Sampling and Mass Determination
PM10 samples were collected by Low Volume PM10 Samplers (Skypost, TCR Tecora, Italy) with a flow rate of 2.3 m3 h−1. Samples were collected during year 2013 by the Regional Environmental Protection Agency (ARPA Campania): 116 filters were collected during winter (20 February–18 March 2013), spring (10 April–21 June 2013), summer (22 June–2 September 2013) and autumn (22 September–2 October 2013).
Samplings were prolonged for twenty-four hours following European Legislation UNI EN-12341 procedures (Standard gravimetric measurement method for the determination of the PM
10 or PM
2.5 mass concentration of suspended particulate matter) [
25]. PM
10 was collected on pre-fired (500 °C for 4 h) high purity quartz fiber filters (Frisinette APS, 47 mm). Samples considered not valid were mostly due to technical problems with the samplers. The filters were conditioned, either before and after sampling procedures, for 48 h at 20 ± 1 °C and 50 ± 5% relative humidity, before weighing in a Sartorius SE 2-F microbalance. Successively, the filters were packed in Petri dishes and stored in a cool and dark place waiting to be analyzed (storage was never prolonged for more than one week).
2.3. Metal Determination
The analysis of the considered metals (Al, As, Cd, Co, Cr, Fe, Mn, Ni, Pb, Cu, Sb, V and Zn) in PM
10 was conducted according with the European standard method (UNI EN 14902:2006, Standard method for the measurement of Pb, Cd, As and Ni in the PM
10 fraction of suspended particulate matter) [
26]. Initially, the samples were extracted by microwave-assisted digestion (Milestone MLS 1200 MEGA, FKV) in closed PTFE vessel by adding HNO
3 (70%
w/
v grade ultrex II Ultrapure Reagent) and H
2O
2 (30%
w/
v Carlo Erba) (8:2 mL). The digestion program consisted in 3 heating steps. In the first step (20 min), microwave power was increased from 100 W to 1200 W and the temperature in the vessel climbed from room temperature to approximately 220 °C; in the second step (25 min) power was maintained at 1200 W and the temperature was fixed at 220 °C. In the third step (15 min) the power was reduced to 0 W and the temperature was decreased to room temperature. After cooling down, the extracted solutions were diluted with deionized water (until 50 mL) and then filtered through a 45 mm nylon filter in order to remove any remaining insoluble particle.
After digestion, the metals selected for the determination in each sample were quantified by Inductively Coupled Plasma Mass Spectrometry (ICP-MS Agilent 7900); in order to avoid matrix interferences the collision reaction cell was set up in hydrogen mode. Mass resolution and isotope selection were optimized for each element to ensure resolution of spectral interferences and maximize sensitivity.
Quantification was performed following with modifications the multi-element calibration standard method previously reported by us [
27]. The range adopted was 5–250 μg/L (seven point calibration); the correlation coefficients (
R2) for the calibration curves were all greater than 0.997.
Precision and accuracy of the analytical method were checked following procedure already reported in literature [
27]. Limits of detection (LODs) of metals were in the range of 0.04–0.80 μg/L (
Table 1). Recoveries percent of metals from spike method (
n = 3) ranged from 85% to 104% (
Table 1).
2.4. Statistical Analysis
One way ANOVA, based on the
F-test, has been used to detect significant differences among seasons. In particular, the Tukey test was used to assess both the accumulation of first order errors of the test and the test power [
28]. Significance was:
p < 0.05.
In order to assess the extent of contribution of anthropogenic emissions to atmospheric elemental levels, the Enrichment Factor (EnF) was evaluated. EnF values were calculated as reported in Equation (1). The chemical composition of the upper continental crust was taken from Wedepohl [
29].
where X was the element under consideration both in aerosol PM
10 (X PM
10) and upper continental crust (X UCC), Ref was a reference element that is typically crustal (Al, Fe or others): it should be noted that the same element is used both in PM
10 (Ref PM
10) and in continental crust (Ref UCC). Aluminum (Al) was used as the reference metal in the present study.
Furthermore, principal component analysis (PCA) and statistical elaborations were applied in order to identify the main source of pollution. The aim of PCA is to split out the matrix of individual species into groups of data, defined as factors, combined on the base of comparable features, that correspond to same origin or transport route. The factors have been selected by Varimax rotation method and the number of factors was selected in order to ensure that they could explain the highest maximum total variance of the data. In the present study, the data set of metal concentrations was investigated by PCA and statistical correlation coefficients (i) to assess correlations between metals or origins of the trace metals and (ii) to assess the impact of the different sources in the production of the mass in the site. Factor analysis is usually applied for large sample population ranging from 50 to 200: in this analysis the samples were 116 and the condition was therefore satisfied [
30]. Data analysis was performed with XLSTAT 2016 software.
2.5. Risk Analysis
The quantitative assessment of the cancer risk (CR) was carried out for adults and children living in Acerra. The chemical components considered for the evaluation of the scenario included: Al, As, Cd, Co, Cr, Mn, Ni and V.
Exposure has been expressed in terms of a lifetime average daily dose (LADD) and allowed to determinate the corresponding Cancer Risk (CR) of metals, considering two groups, represented by adults and children. The LADD (Equation (2)), is the amount of intake per kg of body weight per day of a chemical suspected of having adverse health effects when absorbed into the body over a long period of time.
The Equations (2) and (3) used for estimating LADD are as follows:
where LADD is determined though the combination of the concentration (C) of metals on PM
10, that is assumed as the same at the point of exposure (mg m
−3) and E (mg Kg
−1 day
−1) (Equation (2)). E has been obtained by following Equation (3) where IR (m
3 h
−1) is the air inhalation rate, ET is exposure time (24 h day
−1), EF is exposure frequency (350 day years
−1), ED (years) is the exposure duration (for ED the most conservative assumption is used, that exposure duration is equal to life expectancy), BW (Kg) is the body weight, ATc (years) is the average time for carcinogens and ATn (years) is the average time for non-carcinogens (Equation (3)). Parameters used in Equation (3) are summarized in
Table 2.
CR represents the increased probability of occurrence of tumor diseases above the general average due to impact of compounds suspected of having carcinogenic effects. CR for carcinogenic chemicals considers risk range from 10−4 (risk of developing cancer over a human lifetime is 1 in 10,000) to 10−6 (risk of developing cancer over a human lifetime is 1 in 1,000,000). Values below 10−6 for individual chemicals and pathways determinate negligible cancer risks. Generally a cumulative cancer risk exceeding 10−4 is not tolerated and the maximum acceptable value is of 10−5.
For carcinogenic chemicals, the Cancer Risk (CR) was determined as reported in Equation (4) [
31,
32,
33,
34]:
where CR is the probability of cancer occurring in the exposed population over a 70-year lifetime; it is determined through a combination of LADD (lifetime average daily dose) (mg kg
−1 day
−1) and CSF (cancer slope factor) (mg kg
−1 day
−1). The carcinogenic risks were defined as the incremental probability of an individual to experience cancer, over a lifetime, as a consequence of exposure to a specific potential carcinogen (i.e., incremental or excess individual lifetime cancer risk). CSF has been calculated as reported in the following Equation (5):
IUR (Inhalation Unit Risk) is a reference value reported in USEPA database. IUR and RfC (Reference Concentration) are reported in
Table 3.
Regarding non-carcinogenic chemicals, we calculated the Target Hazard Quotient (THQ) following the procedure reported in Equation (6):
THQ considers that there is a level of exposure (i.e., RfDi) below which it is improbable for even sensitive populations to experience adverse health effects. When the exposure level (ADI) overcomes the value indicated as 1, there may be concern for potential non-cancer effects; higher values of THQ (>1) suggest the higher levels of concern.
RfDi (mg kg
−1 day
−1) represents the inhalation dose that is believed to be without effect and was defined as in the Equation (7):
The product of IR and ET lead to 21.6 m3 for adults and to 16.8 m3 for children.
ADI (mg kg
−1 day
−1) is the estimated dose the receptor (assumed to be an adult in the following representative equation) receives from air exposure and was calculated according to the following Equation (8):
3. Results and Discussion
3.1. PM10 Mass Concentrations
Summary data of PM
10 mass concentrations determined in urban-industrial-site in Acerra are reported in
Table 4. The average 24 h concentration obtained did not show significant (
p < 0.05) seasonal variation although not statistically relevant seasonal variations can be underlined and are considered to be linked to emission and dispersion patterns which are strongly seasonal (heatings, emission, height of PBL).
The mean concentrations were comparable to other urban sites in Campania (South Italy) such as Naples [
27] or to other urban Italian sites [
35].
In all the seasons (except in autumn) exceedances of daily concentrations (National Standard level for PM
10 corresponding to 50 μg m
−3) were observed: six cases in winter and five both during spring and summer. The highest concentration values occurred in winter (123.00 μg m
−3) and in summer (117.00 μg m
−3). The generally higher concentration of aerosols observed during winter can be attributed to the lower dispersion rate of pollutants [
36]. The summer peaks of PM
10 concentrations have been supposed to derive from higher number of illegal waste burning as well as wildfires and agriculture legal burning.
3.2. Metal Levels Concentrations
The summary data (mean, minimum and maximum values) of seasonal variations in the elemental levels (Al, As, Cd, Co, Cr, Cu, Fe, Mn, Ni, Pb, Cu, Sb, V and Zn) during the study period are reported in
Table 5. The analyzed metals represented about 8% of the PM
10 concentrations. On the base of their average concentration, Fe and Al (principal Earth crust elements) were dominant. Particularly, their sum represented about 50% of all the trace collected elements.
The distribution and relative concentration of metals (Al, Fe, Cu, Cd, Cr, Ni, Sb, V and Zn) did not exhibit significant seasonal variations (p < 0.05). The only exception is represented by As and Co that showed statistically significant higher (p < 0.01) concentration during winter, in comparison to spring and summer. Ni average levels exhibit similar values in autumn and winter (17.9 ng m−3 and 16.7 ng m−3 respectively) whereas concentrations were lower in spring and summer (11.0 ng m−3 and 10.2 ng m−3, respectively), so two patterns are present.
None of the metals (Pb, Ni, As and Cd), classified by IARC as carcinogenic in humans (group 1) exceeded on average the annual EU’s limits (500, 20, 6 and 5 ng m−3 respectively). In particular it is significant to emphasize that the concentration of Pb was several order of magnitude lower than its limit value in all the samples; on the other hand, Ni and Cd were found to be in single samples over their year target values several times in all the seasons. Furthermore, As exceeded its target value only once during spring.
3.3. Measurement Uncertainty
The uncertainties associated with the concentration measures are those associated with measures carried out by ARPAC. ARPAC, as an environmental agency, participates in national intercomparisons among laboratories. In ICO 28 intercomparison, carried out in Terni in 2014, the uncertainties reported for the standard metals are as follows for monthly data: for As 12%, Cd 12%, for Ni 25%, for Pb 18%, while for the other metals are as follows for: Al 25%, Co 25%, Cr 25%, Fe 26%, Mn 25%, Sb 28%, V 25% and Zn 20%. These values are estimated computing uncertainty in volume (2.9%), uncertainty due to standard reference materials (NIST 1648A), uncertainity due to technical procedure. For PM
10 concentration the uncertainties range between 2.5 and 3.5 μg m
−3 for measured values ranging between 6.4 and 71.3 μg m
−3, in a similar range to most of the data analysed in this study. As usual for every filter lot a preliminary assessment of the metals concentration is performed in order to check the values reported by the producers. The ranges of the measured values are coherent with most recently analytical data on metals published by ARPAC (
www.arpacampania.it).
3.4. Enrichment Factor
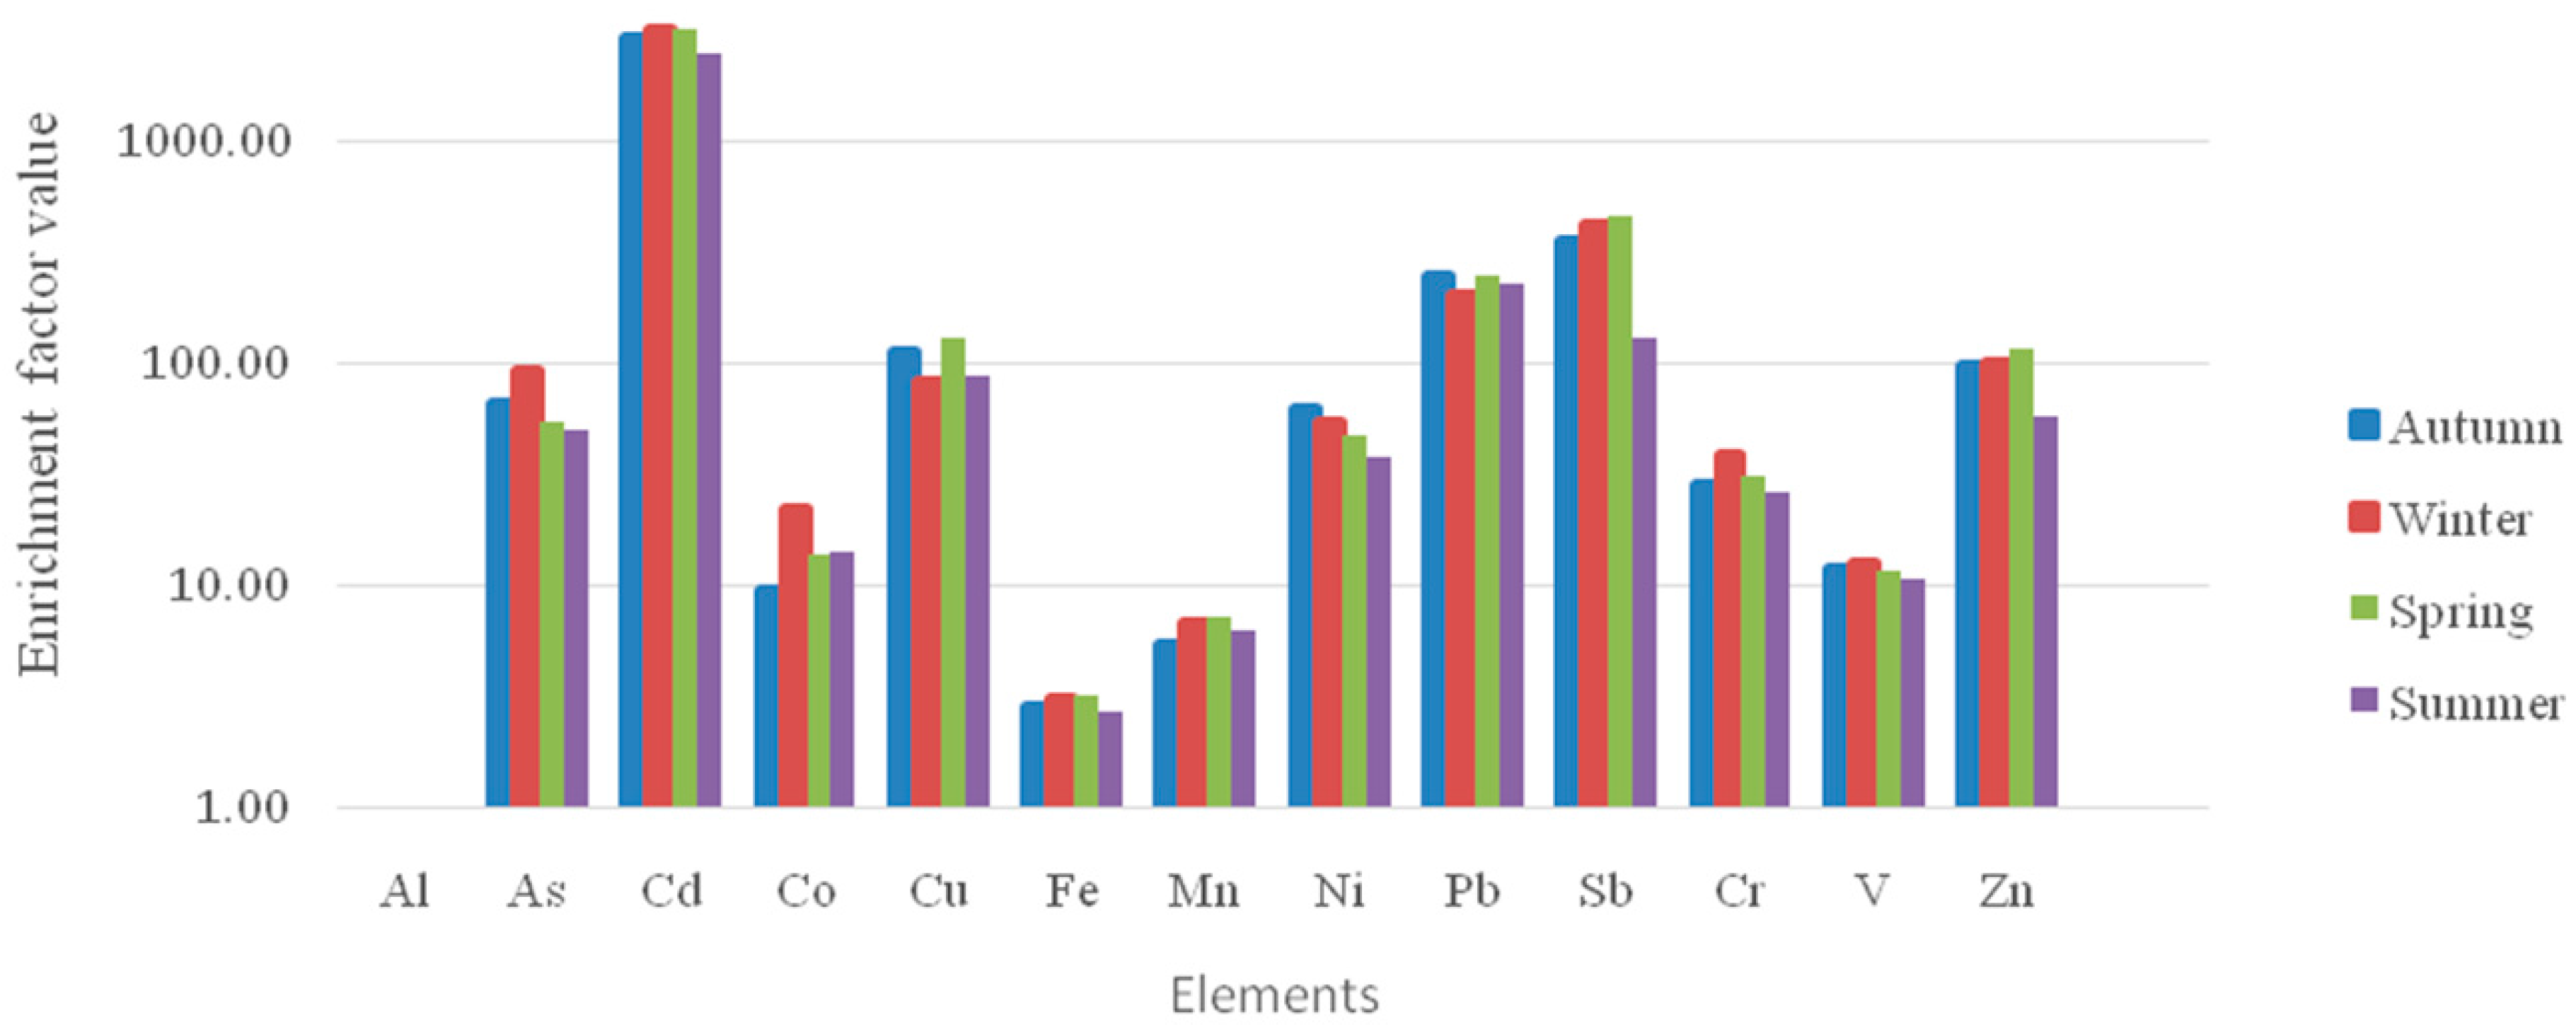
The EnFs are calculated to evaluate the degree of enrichment of a single element compared to the relative abundance of that element in a crustal material. Aluminum (Al) was used as reference metal in the present study. Values lower than 10 for EnF show that the investigated element has crustal origin; on the other hand, EnF values > 10 suggest that the element concentration was affected by a relevant anthropogenic source. EnF values between 10 < EnF < 100 suggest a moderate enrichment, whereas when the value is >100 it can be deemed highly enriched [
37]. The results for EnF values are reported in
Figure 2.
Cd exhibited the highest EnF value (>1000). Its EnF contribution is comparable in each season; Cd mainly derives from coal combustion, but alternative possible origins are pigment, plastic, steel productions and municipal waste incineration [
38]. Pb and Sb showed for all the seasons a high EnF (>100), while Zn and Cu presented values near to 100. The high enrichment of these elements suggests that their dominant sources were anthropogenic and a variety of pollution emissions contributed to their presence in PM
10. Sb origins from vehicular emission. In particular, antimony sulphide is often used to enhance frictional properties and to reduce vibrations in vehicle brake pads [
39]. Pb and Zn are traditionally described in literature as important markers for vehicle emissions [
40]. Pb is found as a trace element in different fuels, while is not allowed as additive component in petrol fuels. Moreover, Zn is considered the main constituent of road dust due to the aggregation of particles emitted from tires, motor oil and vehicle brakes. Vehicle emissions (diesel combustion and brakes) and smelting furnace burning are believed to be main emission sources for Cu [
41].
EnF values between 10 and 100 were showed by As, Ni and Cr. As is often linked in literature to the use of fossil fuel (traffic, domestic heating, natural gas, etc.). Ni is often described as a trace element in petroleum but it is also derived from the burning of lubricant oil [
42], then the above mentioned differences between the concentrations registered during the autumn/winter and spring/summer semesters should be correlated to heating. Cr shows many anthropogenic sources, in particular coal burning and waste incineration [
43]. Co showed EnF values near to 10 that can be attributed to industrial activities. Low EnF values of Fe and Mn highlighted their main crustal origin.
3.5. Principal Component Analysis
PCA is a technique that reduces the number of dimensions, summarizing a set of multivariate data in few linear combinations of the variables (called principal components) without a significant loss of information, with the aim of accurately identify the various sources that participate to the production of fine particulate matter. Results of PCA can be plotted to simplify the interpretation of the positive and negative correlations among variables (in this case the elements determined in PM10).
PCA factors were identified using Varimax rotation with Kaiser normalization. Eingenvalue > 1 was necessary for selecting of the factors; factor score of 0.5 was selected as the lowest level of significance. Four principal factors named F1 (oil combustion), F2 (industrial emission), F3 (crustal origin) and F4 (vehicle emission) were obtained, which accounted for 69.08% of total variance.
Table 6 reports the PCA results used to identify common sources of heavy metals in daily PM
10 during sampling periods.
The first factor (F1), that accounts for 21.09% of the variance, was characterized by V, Ni and to a smaller extent by Cr: this data indicates oil combustion and resuspended road dust from urban areas with high traffic densities as well as domestic heating [
44]. The second factor (F2) was responsible for 12.54% of the variance and was dominated by Cd, Zn and Co. This factor can be associated to steel industrial sources. The third factor (F3) accounted for 21.98% and had high loadings of Al, Fe and to a smaller extent of Pb. It represents crustal origin [
45]. The fourth factor (F4) with 13.47% variance, was dominated by Sb and As and can be associated with vehicle emission [
5].
3.6. Risk Analysis
In the Risk analysis we considered the concentration (C) of metals on PM
10 as the same at the point of exposure (mg m
−3) and the parameter used for the quantification of the individual exposure rates were highly conservative. Although uncertainties occur in risk assessment, the risk assessment application has found usefulness in providing a quantitative and consistent framework for systematically evaluating environmental health risks and decisions for their control. Risk estimates have typically treated such uncertainties conservatively through the assumptions and default positions mandated by policy makers. The typical assumption used in EPA risk assessments is based on the use of EPA default values. These are generally adequate to assess the population risk. The desire for caution or prudence in risk management, which we call conservatism, may arise directly from political considerations as well as from concerns regarding uncertainty and variability about the nature and magnitude of the hazard. Conservatism based on variability is consistent with policy that is based on protecting individuals suffering the greatest potential risk [
46].
Our study allowed the determination of cumulative risk values (CR) for carcinogenic elements; results are reported in
Table 7. CR values, that in a cumulative fashion have not to overcome the 10
−4 threshold (considered not tolerated), ranged for single metals from 7.40 × 10
−6 and 1.19 × 10
−6 for an adult, while from 7.17 × 10
−7 and 1.85 × 10
−6 for a child. The CR for single species were therefore comparable for adults and children; even if considering the propagation of the error calculated for each metal considered the CR value for single species not exceeded 10
−6, hence the propagation of uncertainties to the derived quantities like CR was not relevant. It should be evidenced that adult risks are generally higher than those for children, but this doesn’t become a significant difference because concentration detected for single species were always below the legal limit. When we considered the cumulative carcinogenic risks for adults and children we found values all ascribable to an acceptable level of risk of the exposed population.
The CR values (THQ) from non-carcinogenic elements for each receptor (adult or child) are reported in
Table 8.
The values ranged from 0.04 to 0.30 for adults, while from 0.13 and 0.86 for children. The non-carcinogenic risk, THQ, resulted <1 for each single metal, compliant with the European guidelines for adults and children in the total PM10. The highest THQ values for both adult and child were reported for Mn and V. If, on the other hand, it is considered the propagation of the uncertainties for each single metal, the THQ resulted >1 only for Mn and V in children. Therefore, for greater safety for children, increased control for these metals (Mn and V) could be suggested to allow authorities to prevent the potential risk for the health.
4. Conclusions
Seasonal variations in mass concentrations, metals determination, potential emission sources and risk analysis of PM10 at Acerra city (Southern Italy) were investigated in this study. The data were obtained using filter samples collected from February to October 2013. Mean concentrations of PM10 didn’t exhibit significant (p < 0.05) seasonal variation, but in all the seasons (except in autumn) exceedances (six in winter and five in spring and summer) of daily concentrations were observed (National Standard level for PM10 corresponding to 50 μg m−3). Airborne PM was analyzed for these heavy metals: Al, As, Cd, Co, Cr, Cu, Fe, Mn, Ni, Pb, Sb, V and Zn which represented about 8% of the PM10 concentrations. None of the metals classified by IARC as carcinogenic in humans (group 1) (Pb, Ni, As and Cd), exceeded on average the annual EU’s limits (500, 20, 6 and 5 ng m−3 respectively). However it is significant to evidence that Ni and Cd were found over their daily target values several times in all seasons while the concentration of Pb was several order of magnitude lower than its limit value in all the samples. The collected data allow us to affirm that air particulate matter doesn’t represent, for its composition of regulated metals, a specific threat for human health. Furthermore, the distribution and the relative concentration of the metals (Al, Fe, Cu, Cd, Cr, Ni, Sb V and Zn) did not exhibit statistically significant seasonal variations (p < 0.05).
Analysis of enrichment factors (EnF) of heavy metals showed high enrichment for Cd (>1000), Sb, Pb (>100), As, Cu and Zn (near 100). The values in the range of 10 to 100 for EnF related to As, Cr and Ni have been associated with the use of fossil fuel (traffic, domestic heating, natural gas, etc.). Pb and Sb showed for all the seasons a high EnF (>100), while values near 100 were represented by Zn and Cu. The high EnF determined for these substances indicates that their prevalent origins were anthropogenic and a large set of pollutants emitted accounted to their presence in PM10. Lower values of EnF (<10) suggested that Fe and Mn have a crustal origin.
In the principal component analysis (PCA), the sources which accounted for 69.08% of total variance were: oil combustion, vehicle emission, crustal origin and industrial emission. Obtained results suggested a predominant anthropogenic source for the heavy metals in PM10. Indeed, PCA analysis identified oil combustion, vehicle and industrial emissions as major sources at the sampling site (47.1% of total variance). The results are comparable to other Italian industrial sites characterized by the presence of high vehicular traffic density; the species that showed higher EnF are related to specific industrial plants.
Furthermore, both for carcinogenic and non-carcinogenic metals and for both children and adults, the exposure to airborne PM10 in the site selected in Acerra resulted in risk values of one order of magnitude lower than those reported in European guidelines; in particular, even when we considered the cumulative carcinogenic risks for adults and children we found values all ascribable to an acceptable level of risk of the exposed population. Only in the case of Mn and V, metals belonging to non-carcinogenic group, considering the propagation of uncertainties we found a value related to an effective level of concern for potential non cancer effects. The hazard quotient proved to be higher for a child than for an adult and the carcinogenic risk was higher for adults than for children. The low PM metals risk in the urban industrial site was in agreement with the ongoing lowering trend of metals in Italy and Europe.
A general insight on the whole study suggest that the metal species in the air particulate matter PM10 do not seem to raise concerns about the health risk of the resident population. Moreover, it has to be underlined that the total CR and THQ value via inhalation exposure for adult and child may overestimate the hazards they pose to humans. It’s not considered, indeed, the concept of bioaccessibility of metals that is essential to a comprehensive health risk assessment. Notwithstanding the uncertainties and constraints of this study, data may be the starter point to design a biomonitoring plan. The results provided by the present study contribute to a better understanding of the potential risks associated with human exposure to toxic elements in aerosol of a specific suburban area, representing useful data to be considered for air quality evaluation. Anyway, these results, are referred only to metal species in PM10, and are not sufficient to definitely assess the effective risk of population, which is more realistically determined through biomagnification studies. It is necessary to integrate and cross these results obtained with those of other organic contaminants (i.e., dioxins, PCBs), present not only in the air, but also in the other environmental matrices as well as in food, therefore evidencing the need to evaluate all the possible routes of exposure pathways (ingestion, dermal contact and inhalation). These integrations will allow the scientific ascertain of the actual risk linked to an area characterized by the presence of landfilled hazardous wastes and influenced by illegal waste dumping and burning practices.

 ,
, 
