Article

Spatiotemporal Characteristics of Air Pollutants (PM10, PM2.5, SO2, NO2, O3, and CO) in the Inland Basin City of Chengdu, Southwest China

1
Faculty of Geosciences and Environmental Engineering, Southwest Jiaotong University, Chengdu 611756, Sichuan, China
2
Institute of Mountain in Hazards and Environment, Chinese Academy of Sciences, Chengdu 610041, Sichuan, China
*
Authors to whom correspondence should be addressed.
Atmosphere 2018, 9(2), 74; https://doi.org/10.3390/atmos9020074
Submission received: 4 October 2017 / Revised: 13 February 2018 / Accepted: 13 February 2018 / Published: 16 February 2018
(This article belongs to the Section Air Quality)

Abstract

:
Most cities in China are experiencing severe air pollution due to rapid economic development and accelerated urbanization. Long-term air pollution data with high temporal and spatial resolutions are needed to support research into physical and chemical processes that affect air quality, and the corresponding health risks. For the first time, data on PM10, PM2.5, SO2, NO2, O3 and CO concentrations in 23 ambient air quality automatic monitoring stations and routine meteorological were collected between January 2014 and December 2016 to determine the spatial and temporal variation in these pollutants and influencing factors in Chengdu. The annual mean concentrations of PM2.5 and PM10 exceeded the standard of Chinese Ambient Air Quality and World Health Organization guidelines standards at all of the stations. The concentrations of PM10, PM2.5, SO2 and CO decreased from 2014 to 2016, and the NO2 level was stable, whereas the O3 level increased markedly during this period. The air pollution characteristics in Chengdu showed simultaneously high PM concentrations and O3. High PM concentrations were mainly observed in the middle region of Chengdu and may have been due to the joint effects of industrial and vehicle emissions. Ozone pollution was mainly due to vehicle emissions in the downtown area, and industry had a more important effect on O3 in the northern area with fewer vehicles. The concentrations of PM10, PM2.5, NO2 and CO were highest in winter and lowest in summer; the highest SO2 concentration was also observed in winter and was lowest in autumn, whereas the O3 concentration peaked in summer. Haze pollution can easily form under the weather conditions of static wind, low temperature and relative humidity, and high surface pressure inside Chengdu. In contrast, severe ozone pollution is often associated with high temperature.

Graphical Abstract

1. Introduction

During the past 30 years, the rapid urbanization and industrialization in China have greatly affected the ecological environment, and the problem of urban air pollution has become a major focus in recent years [1,2,3,4]. Southern China is one of the three areas affected most severely by acid rain, after Western Europe and North America [5,6]. The total sulfur dioxide (SO2) emissions in China have been decreasing continuously since 2006 [7], but SO2 emissions are still extremely high in some areas [8]. In addition, haze covers one-quarter of the country’s land area and affects 600 million people [9]. In general, air pollution has been improved greatly in recent years, but haze pollution is still a severe environmental problem at present, and is harmful to human health [10,11,12]. Great attention has been paid to particulate matter (PM) pollution, including PM2.5 (particles with aerodynamic diameter ≤ 2.5 µm) and PM10 (≤10 µm), but the levels of other pollutants are also growing rapidly, particularly ozone (O3). According to national monitoring data, O3 pollution has begun to appear in the summer and has tended to replace PM2.5 as the major pollutant in major Chinese cities [13,14]. The combination of winter pollution (PM) and summer pollution (ozone) indicates that China is facing a complex air pollution problem.
Research on air pollution in China included the mechanism of haze formation [15,16], the influence of meteorological and topographic factors on air quality [17,18], temporal and spatial air pollution patterns [19,20], and the long distance transmission of pollutants [21,22,23]. However, most of these studies are concentrated in the economically developed areas, e.g., the Beijing–Tianjin–Hebei region [24], the Pearl River Delta [25], and the Yangtze River Delta [26], and are dominated by single pollutants (PM or O3) and short periods (1–2 years of heavy pollution) of study. Few investigations have considered the spatial and temporal variations in various pollutants [27,28].
Chengdu is an important economic center in southwest China and the only mega-city in the west. The area is located on a plain of less than 5000 km2, with a population of more than 15 million people, as well as 4 million vehicles and a large number of production and service activities [29]. The emission of air pollutants continues at a high level in this area and, due to its unique basin topography, the Chengdu area has been greatly affected by regional haze pollution. Monitoring data over the past three years have shown that O3 concentrations are increasing year by year, and air pollution is getting worse. However, most previous studies have only considered PM. For example, Liao et al. [17] analyzed the high levels of PM2.5 pollution in Chengdu during the winter of 2013, as well as its transmission routes and sources. Huang et al. [30] studied the influence of the meteorological conditions and urban spatial morphology on PM2.5 in Chengdu. Zhang et al. [31] analyzed the seasonal pollution characteristics and sources of PM2.5 in the urban area by collecting PM2.5 samples during typical seasons (2009–2010 years) in Chengdu City. Yang et al. [32] analyzed the factors that influence PM2.5 in Chengdu and suggested prevention and control strategies. Few studies have considered the characteristics and causes of the multiple pollutants in air pollution in Chengdu, which may be related to the lack of air quality monitoring data, as only PM10, SO2, and NO2 were measured on a regular basis before 30 March 2012. Data on other pollutants such as the hourly and daily concentrations of PM10, PM2.5, SO2, NO2, O3 and carbon monoxide (CO) until January 2013 have been released to the public, but the published data only covered eight monitoring sites controlled by the state [33]. Six air pollution parameters (PM10, PM2.5, SO2, NO2, O3 and CO) were monitored more comprehensively in real time after January 2015.
Given the rapid change in air pollution, it is necessary to determine the characteristic temporal and spatial changes in pollutants as well as their relationships with meteorological conditions, and to evaluate the changes in air quality to formulate preventative and control measures. In the present study, we conducted continuous monitoring at multiple sites for three years in order to: (1) evaluate the exceeding standard levels and concentrations variations in pollutants in Chengdu; (2) determine the temporal and spatial characteristics of the concentrations of air pollutants; and (3) analyze the relationships between pollutants and meteorological factors.

2. Materials and Methods
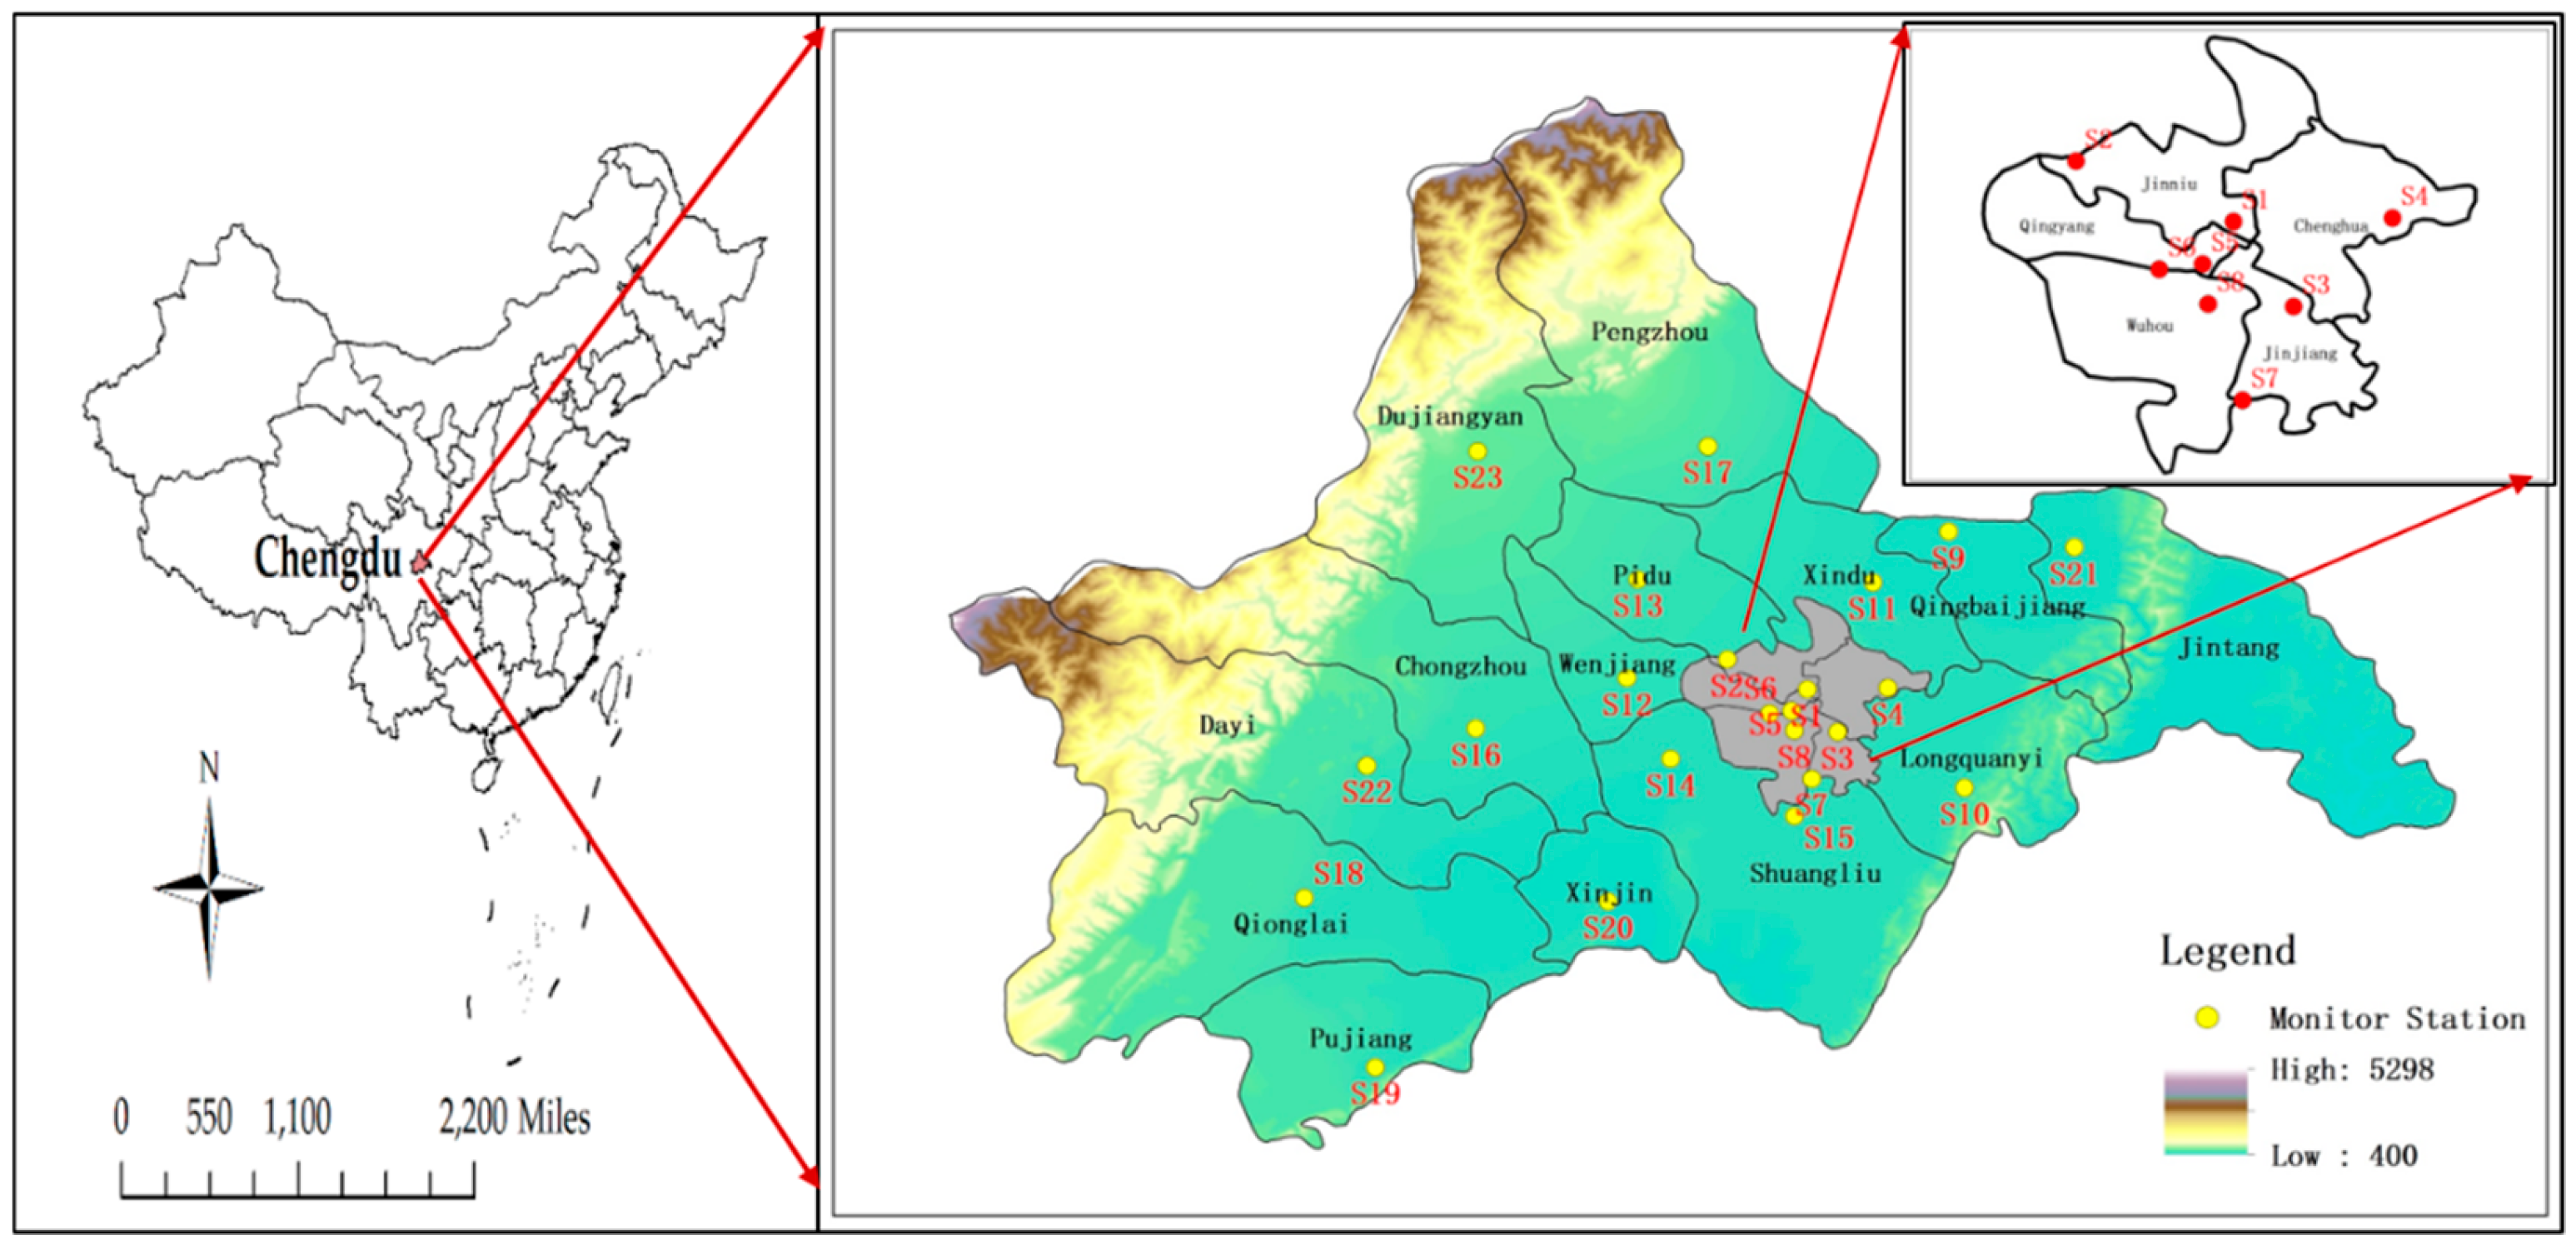
2.1. Study Area

Chengdu is the largest city in southwest China, located in the western Sichuan basin on the Chengdu plain hinterland (Figure 1) between 102.9° E to 104.88° E and 30.08° N to 31.43° N, with a total area of 14,605 km2. There are significant differences in the topography of the city: the northwest is high, the southeast is low, and the difference in height between the east and west is 4966 m. The typical climatic characteristics of the basin are high humidity (annual average relative humidity of 79–84%) and low wind speed (perennial ground wind speed of 0.9–1.4 m/s); this is one of the rare static wind areas in China. Rainfall is abundant in this area but is distributed unevenly among the seasons, with less rain in the winter and spring compared with summer and autumn, and more than 90% of the annual rainfall is concentrated during June–September. The annual average temperature is about 16 °C and the average number of sunshine hours is less than 1500 h. During 2016, the resident population of Chengdu was 15.918 million, the GDP was 1217.02 billion yuan, and the urbanization rate was 70.6%.
Furthermore, Chengdu has a jurisdiction of over 11 districts, four cities, and four counties. Five districts (Jinjiang, Qingyang, Jinniu, Wuhou and Chenghua) constitute the central city of Chengdu. There are six other districts (Qingbaijiang, Xindu, Pidu, Wenjiang, Longquanyi and Shuangliu) and four cities (Dujiangyan, Qionglai, Chongzhou and Pengzhou), and four counties (Dayi, Jintang, Xinjin and Pujiang) contain satellite cities.

2.2. Sites, Instruments and Observations

The daily average concentrations of air pollutants (PM10, PM2.5, SO2, NO2, O3 and CO) were obtained from 23 automatic ambient air quality monitoring stations in Chengdu (Figure 1). There were eight monitoring stations in the main city, and each satellite city had a monitoring station (except Shuangliu District, which had two). All of the monitoring sites were urban stations, and most sites were located in residential and commercial mixed areas, where the surrounding areas were mostly residential and office areas with roads, and there were no obvious sources of industrial air pollution, so they reflected the environment well in different areas of the city. The heights of the 23 monitoring sites varied, with some on the ground (eight sites) and others on the tops of buildings (15 sites), where the sampling point to ground height ranged from 5 m to 20 m. All sites are in an elevation range between 416 and 683 m.
The instruments used for measuring the concentrations of PM10, PM2.5, SO2, NO2, O3 and CO were continuous automatic analysis instruments produced by Thermo Fisher Scientific Inc. (Waltham, MA, USA) and Teledyne API Inc. (San Diego, CA, USA). The PM monitor was used to measure the concentrations of both PM10 and PM2.5 in ambient air based on light scattering and β-ray attenuation. The SO2 analyzer employed pulse fluorescence detection to determine the SO2 concentration in the ambient air. The NO2 analyzer used chemiluminescence detection to measure the concentration of NO2 in the ambient air. The O3 analyzer utilized ultraviolet spectrophotometry to detect the O3 concentration in the ambient air. The CO analyzer used the gas filter-related infrared absorption method to measure low CO concentrations according to Beer–Lambert’s law by comparing the absorption of infrared energy in the sample and a reference gas. The analytical methods used by all of the instruments and the other performance indicators (e.g., measurement range, minimum detection limit, zero drift and span drift) complied with the technical standards for automated ambient air quality monitoring in China. The ambient air quality automatic monitoring stations were subjected to quality control checks according to Chinese ambient air quality monitoring standards and the validity of the monitoring data was guaranteed.
The observation period was 1 January 2014 to 31 December 2016, a total of 1096 days. A valid annual average of air pollutants at each site was required to be based on at least 324 (88%) valid daily averages in one year; a valid monthly average was required to be based on at least 27 valid daily averages in one month (at least 25 valid daily average concentrations in February); a valid daily averages of air pollutants at each site was required to be based on at least 20 valid hourly averages in one day. O3 daily average concentrations refer to the daily maximum 8-h mean value in this study, and a valid 8-h running average was required to be based on at least 6 h of concentrations every 8 h. Daily city-wide concentrations were calculated if at least 17 of the 23 sites had valid daily averages; the city-wide annual averages were determined by averaging these concentrations if at least 90% (329 observations) of the city-wide daily averages were valid. All sites met these criteria, and the daily missing data rate of pollutant records for each monitoring site was very low during the study period. It should be explained that sites S19–S22 did not monitor O3 and CO and S23 did not monitor O3 between January and December in 2014. Table 1 provides more information on the ambient air quality monitoring stations. Meteorological data from the national basic meteorological station (Wenjiang Station, which is 4 km away from S12) were used for comparisons of the pollutants at S12. The daily meteorological dataset of the station was used in the analysis, including the daily average wind speed (marked as AWs), daily maximum wind speed (MWs), daily mean temperature (T), relative humidity (RH), surface pressure (P), the daily amount of precipitation (R) and sunshine hours (S).

2.3. Methods

The meteorological factors affecting the daily variation in pollutant concentrations were evaluated by Pearson correlation analyses with a two-tailed Student’s t-test. The coefficient of variance was used to assess the homogeneity of the annual average concentrations of different pollutants. Spatial distributions of PM10, PM2.5, SO2, NO2, O3 and CO were obtained by the Inverse Distance Weighted interpolation method. Due to the skewness of the daily data, non-parametric statistics were used, e.g., the single-sample K–S test and Mann–Whitney test. Seasonal average statistics were defined for the winter (December–February), spring (March–May), summer (June–August) and autumn (September–November).
Statistics on the exceeding standard of pollutants were according to the Chinese Ambient Air Quality Standards (CAAQS) and the WHO guidelines (Table 2), respectively.

3. Results and Discussion

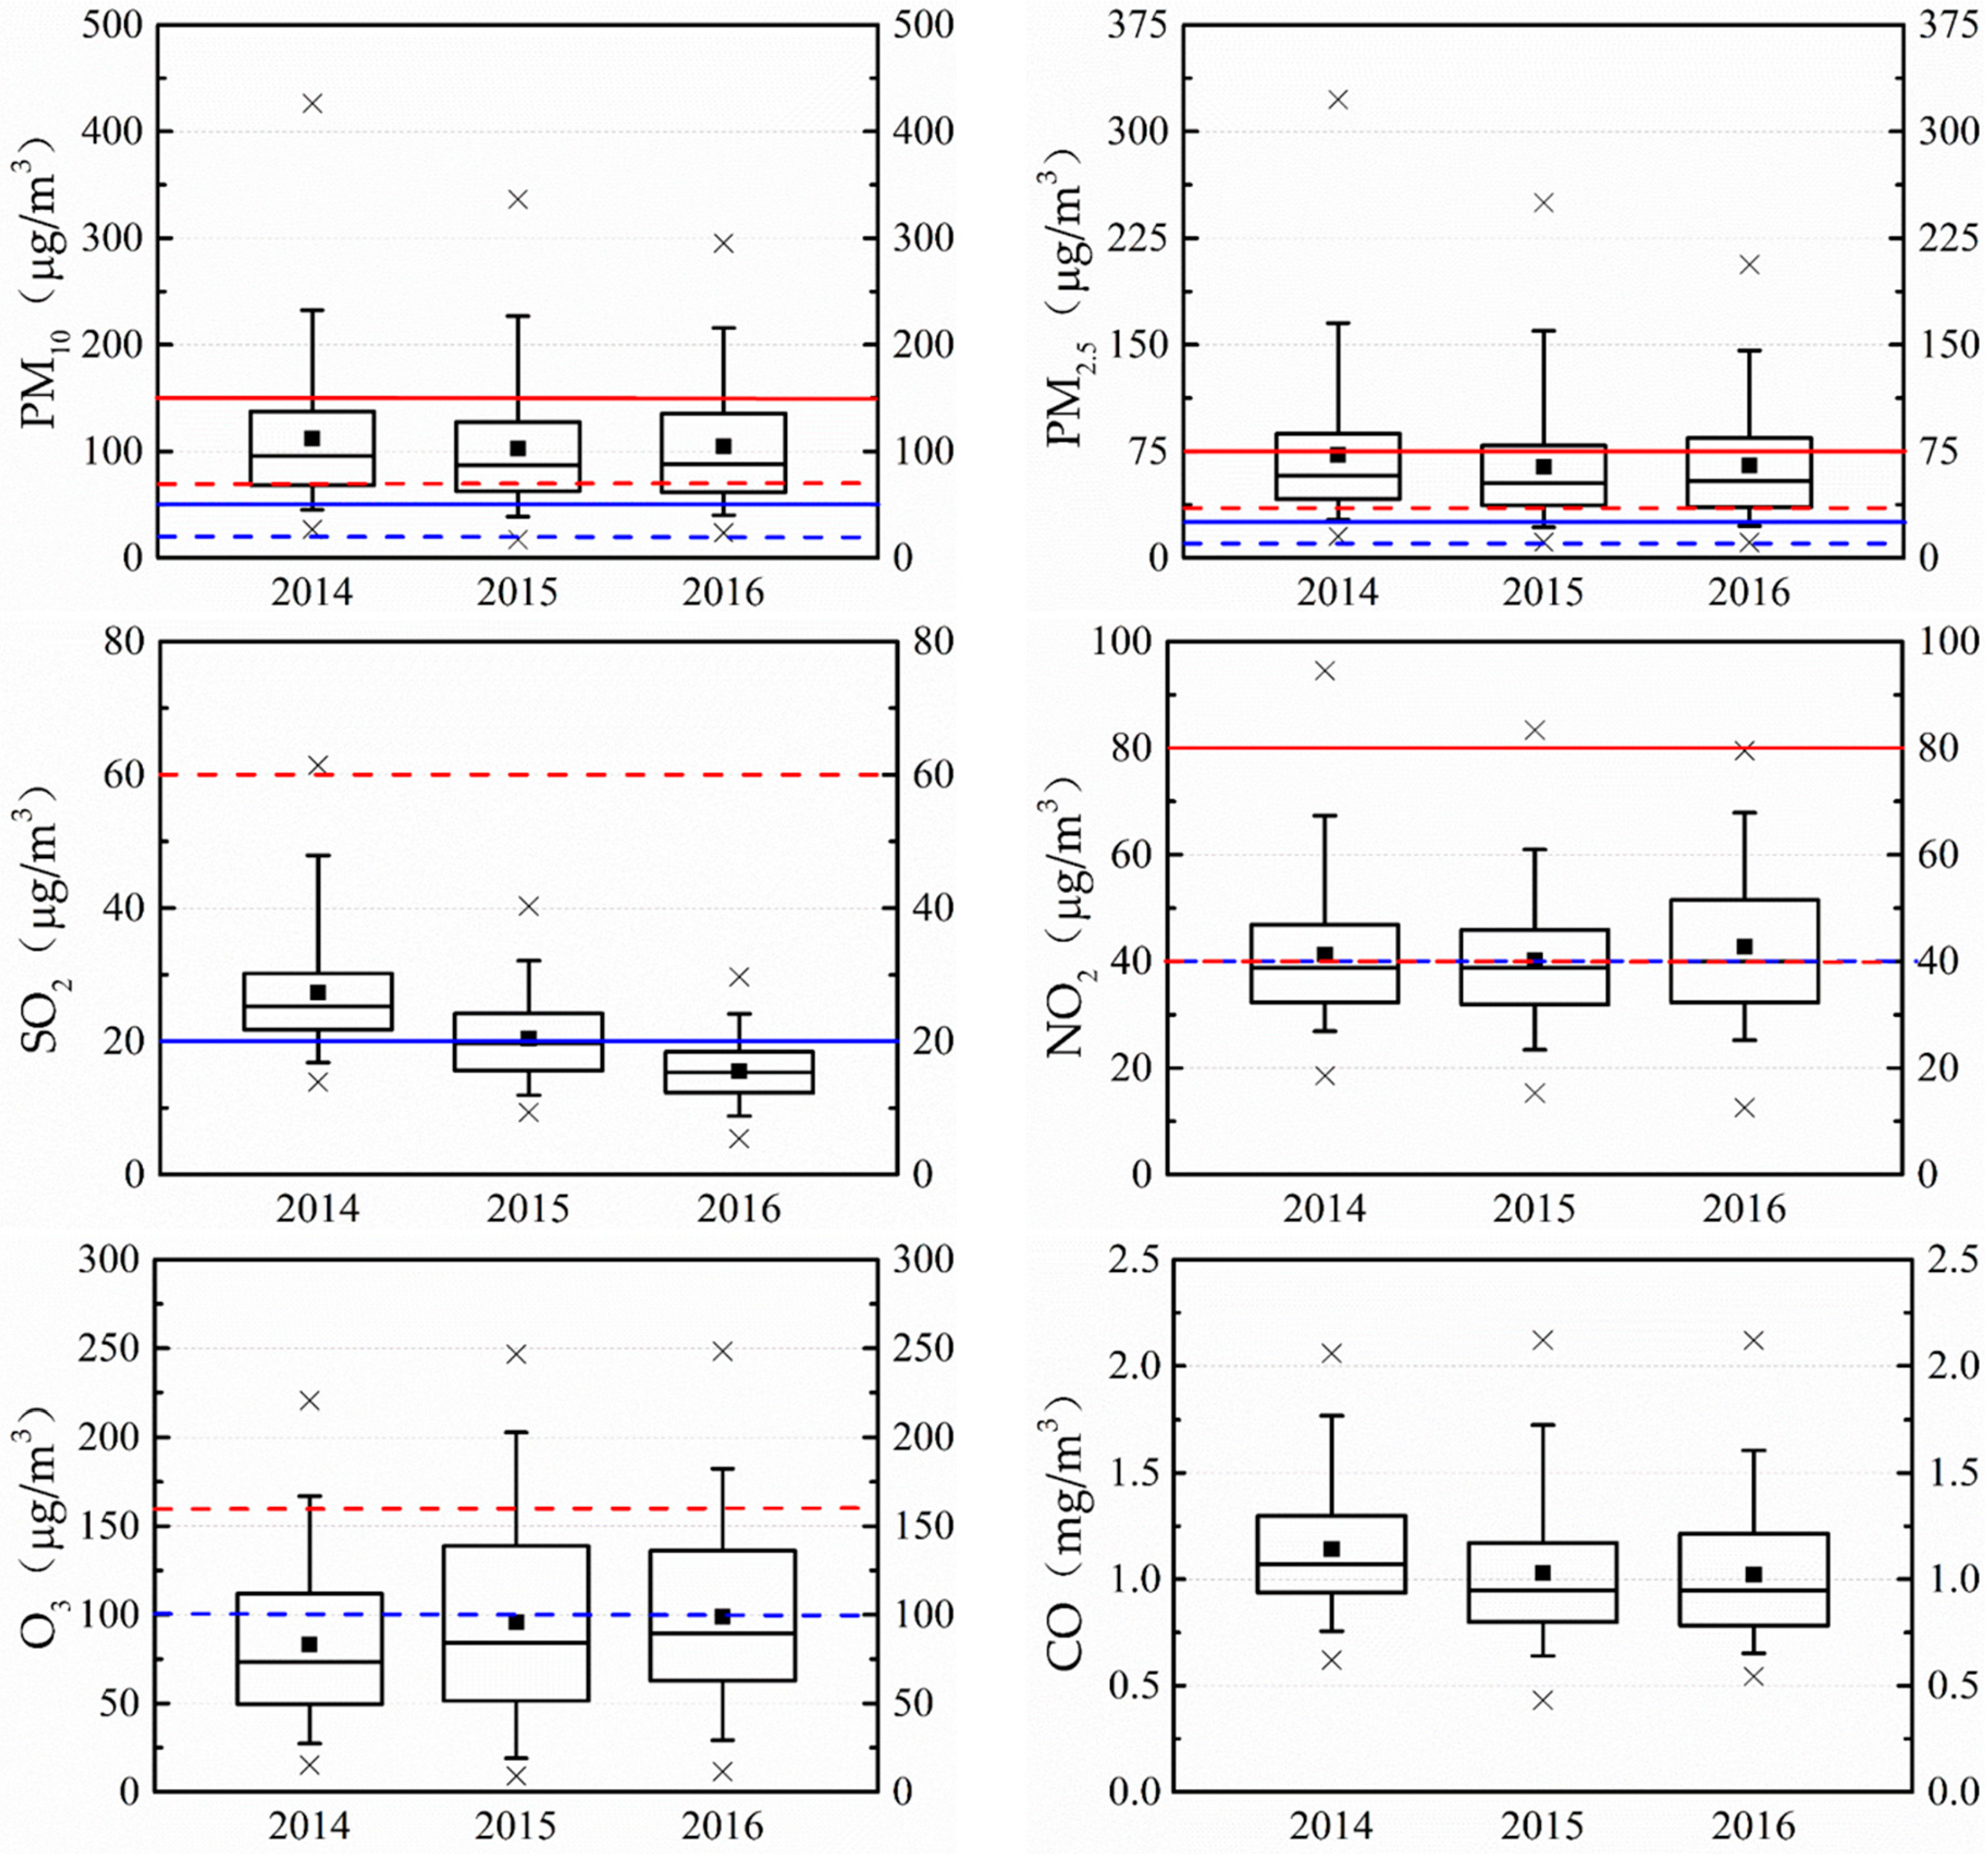
3.1. Air Pollutants Exceeding Standard Levels

Based on the data obtained from 23 monitoring stations in Chengdu City during the study period, we determined the air pollutants (PM10, PM2.5, SO2, NO2, O3 and CO) annual and daily average concentrations city-wide and each station and evaluated the air pollutants exceeding the standard levels.
Figure 2 shows the city-wide annual and daily averaged concentrations of PM10, PM2.5, SO2, NO2, O3 and CO over the entire study period, respectively. Specific descriptions are also provided in Figure S1 and Tables S1 and S2, respectively. The average annual concentrations of PM2.5 and PM10 exceeded the standard for three consecutive years (2014–2016), and were 1.5–2 times those of the CAAQS standards (70 and 35 µg/m3, respectively), and 5–7 times those of the WHO (20 and 10 µg/m3, respectively). In addition, the NO2 annual concentrations were exceeded in 2014 and 2016, which were close to the standards. SO2 was much lower than the standard. The daily average concentrations of PM2.5 was at the “exceedance” level for 337 (30.8%) days during the total study period (1096 days) according to the CAAQS standard, which was the highest of all the pollutants. PM10, O3 and NO2 were at the exceedance level for 207 (18.9%) days, 131 (12.0%) days, and nine (0.8%) days, respectively. SO2 and CO were not at the “exceedance” levels. If we consider the WHO guidelines, PM2.5, PM10, SO2 and O3 exceedance days reached 1025 (93.5%) days, 972 (88.7%) days, 539 (49.2%) days and 410 (37.4%) days, respectively, an increase of 2, 3.7, 538 and 2.1 times compared with the CAAQS standard. Over the entire study period, the daily average concentrations of PM10, PM2.5, SO2, NO2, O3 and CO ranged between 17–426 µg/m3, 11–323 µg/m3, 5–61 µg/m3, 13–95 µg/m3, 9–248 µg/m3 and 0.432–2.121 mg/m3, respectively, and the means and standard deviations were 106 ± 17 µg/m3, 67 ± 14 µg/m3, 21 ± 3 µg/m3, 41 ± 3 µg/m3, 91 ± 10 µg/m3 and 1.065 ± 0.075 mg/m3, respectively.
Annual and daily air pollutant concentrations across the 23 sites are summarized in Tables S1 and S2. The annual average PM10, PM2.5, SO2, NO2, O3 and CO concentrations over the entire study period ranged from 77 (S23) to 137 (S8) µg/m3, 42 (S23) to 89 (S9) µg/m3, 9 (S19) to 50 (S11) µg/m3, 20 (S23) to 69 (S1) µg/m3, 66 (S8) to 118 (S13) µg/m3 and 0.722 (S23) to 1.487 (S9) mg/m3, respectively. Obviously, the annual average concentration of PM10 and PM2.5 at all sites exceeded the standard stipulated by CAAQS and WHO during the study period. The exceeded standard rate of NO2 annual concentration also reached 45% (31 observations). In addition, the exceeded CAAQS (WHO) frequency of PM10, PM2.5, SO2, NO2, and O3 annual concentration at all sites ranged among 9.3–27.7% (66.1–94.5%), 14.8–43.9% (65.5–95.8%), non–excessive (7.8–75.4%), 0–18.0% (no standard), and 4.1–19.6% (31.8–45.8%), respectively. For daily average concentration, the stations with the most exceedance days of PM10 included S13 and S2 and PM2.5 at S13. PM10 exceedance days in S2 reached 299 (27.7%) days; if referring to WHO guidelines, “exceedance” days within the valid monitoring days were 981 (92.0%) days in S13. Standard “exceedance” days of PM2.5 daily concentrations at S13 reached 471 (43.9%) (CAAQS) and 1028 (95.8%) (WHO), respectively. S13 was the most seriously polluted site of all the sites due to O3, and exceedance days reached 209 (19.6%) (CAAQS) and 487 (45.7%) (WHO). According to the WHO, the most affected site regarding SO2 pollution was S9, where exceedance days reached 807 (75.4%). S1 had the highest number of NO2 exceedance days of all the sites, reaching 194 (18.0%).
In terms of the annual and daily concentrations of air pollutants exceeding the standards, PM2.5 and PM10 were two major pollutants in Chengdu during the study period, similar to most cities in China (e.g., Beijing, Wuhan, and Xi’an) [34,35,36,37]. It should be noted that only O3 exceedance days significantly increased during the study period. The CAAQS SO2 standard seems more controversial, as the difference between the two standards (CAAQS and WHO) is too large, and the assessment results are also quite different. Therefore, we strongly recommend a revision and update of CAAQS standards for SO2. In addition, the coefficient variance of PM10, PM2.5, SO2, NO2, O3 and CO were 13.4%, 14.2%, 42.8%, 30.8%, 15.6% and 16.8%, respectively. These findings suggested that the daily concentrations of PM10, PM2.5, O3, and CO were more uniform than SO2 and NO2.

3.2. Temporal and Spatial Variations in the Air Pollutants

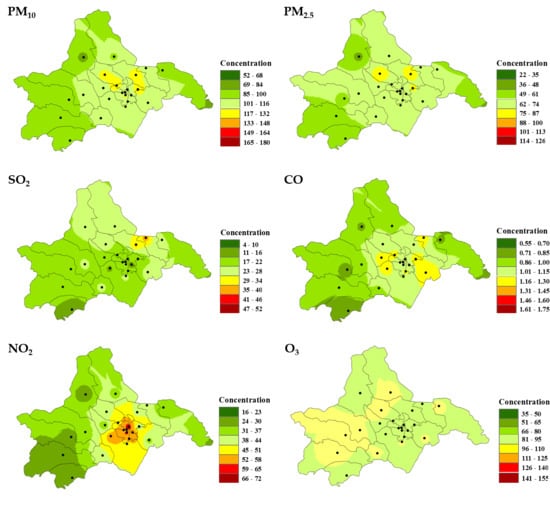
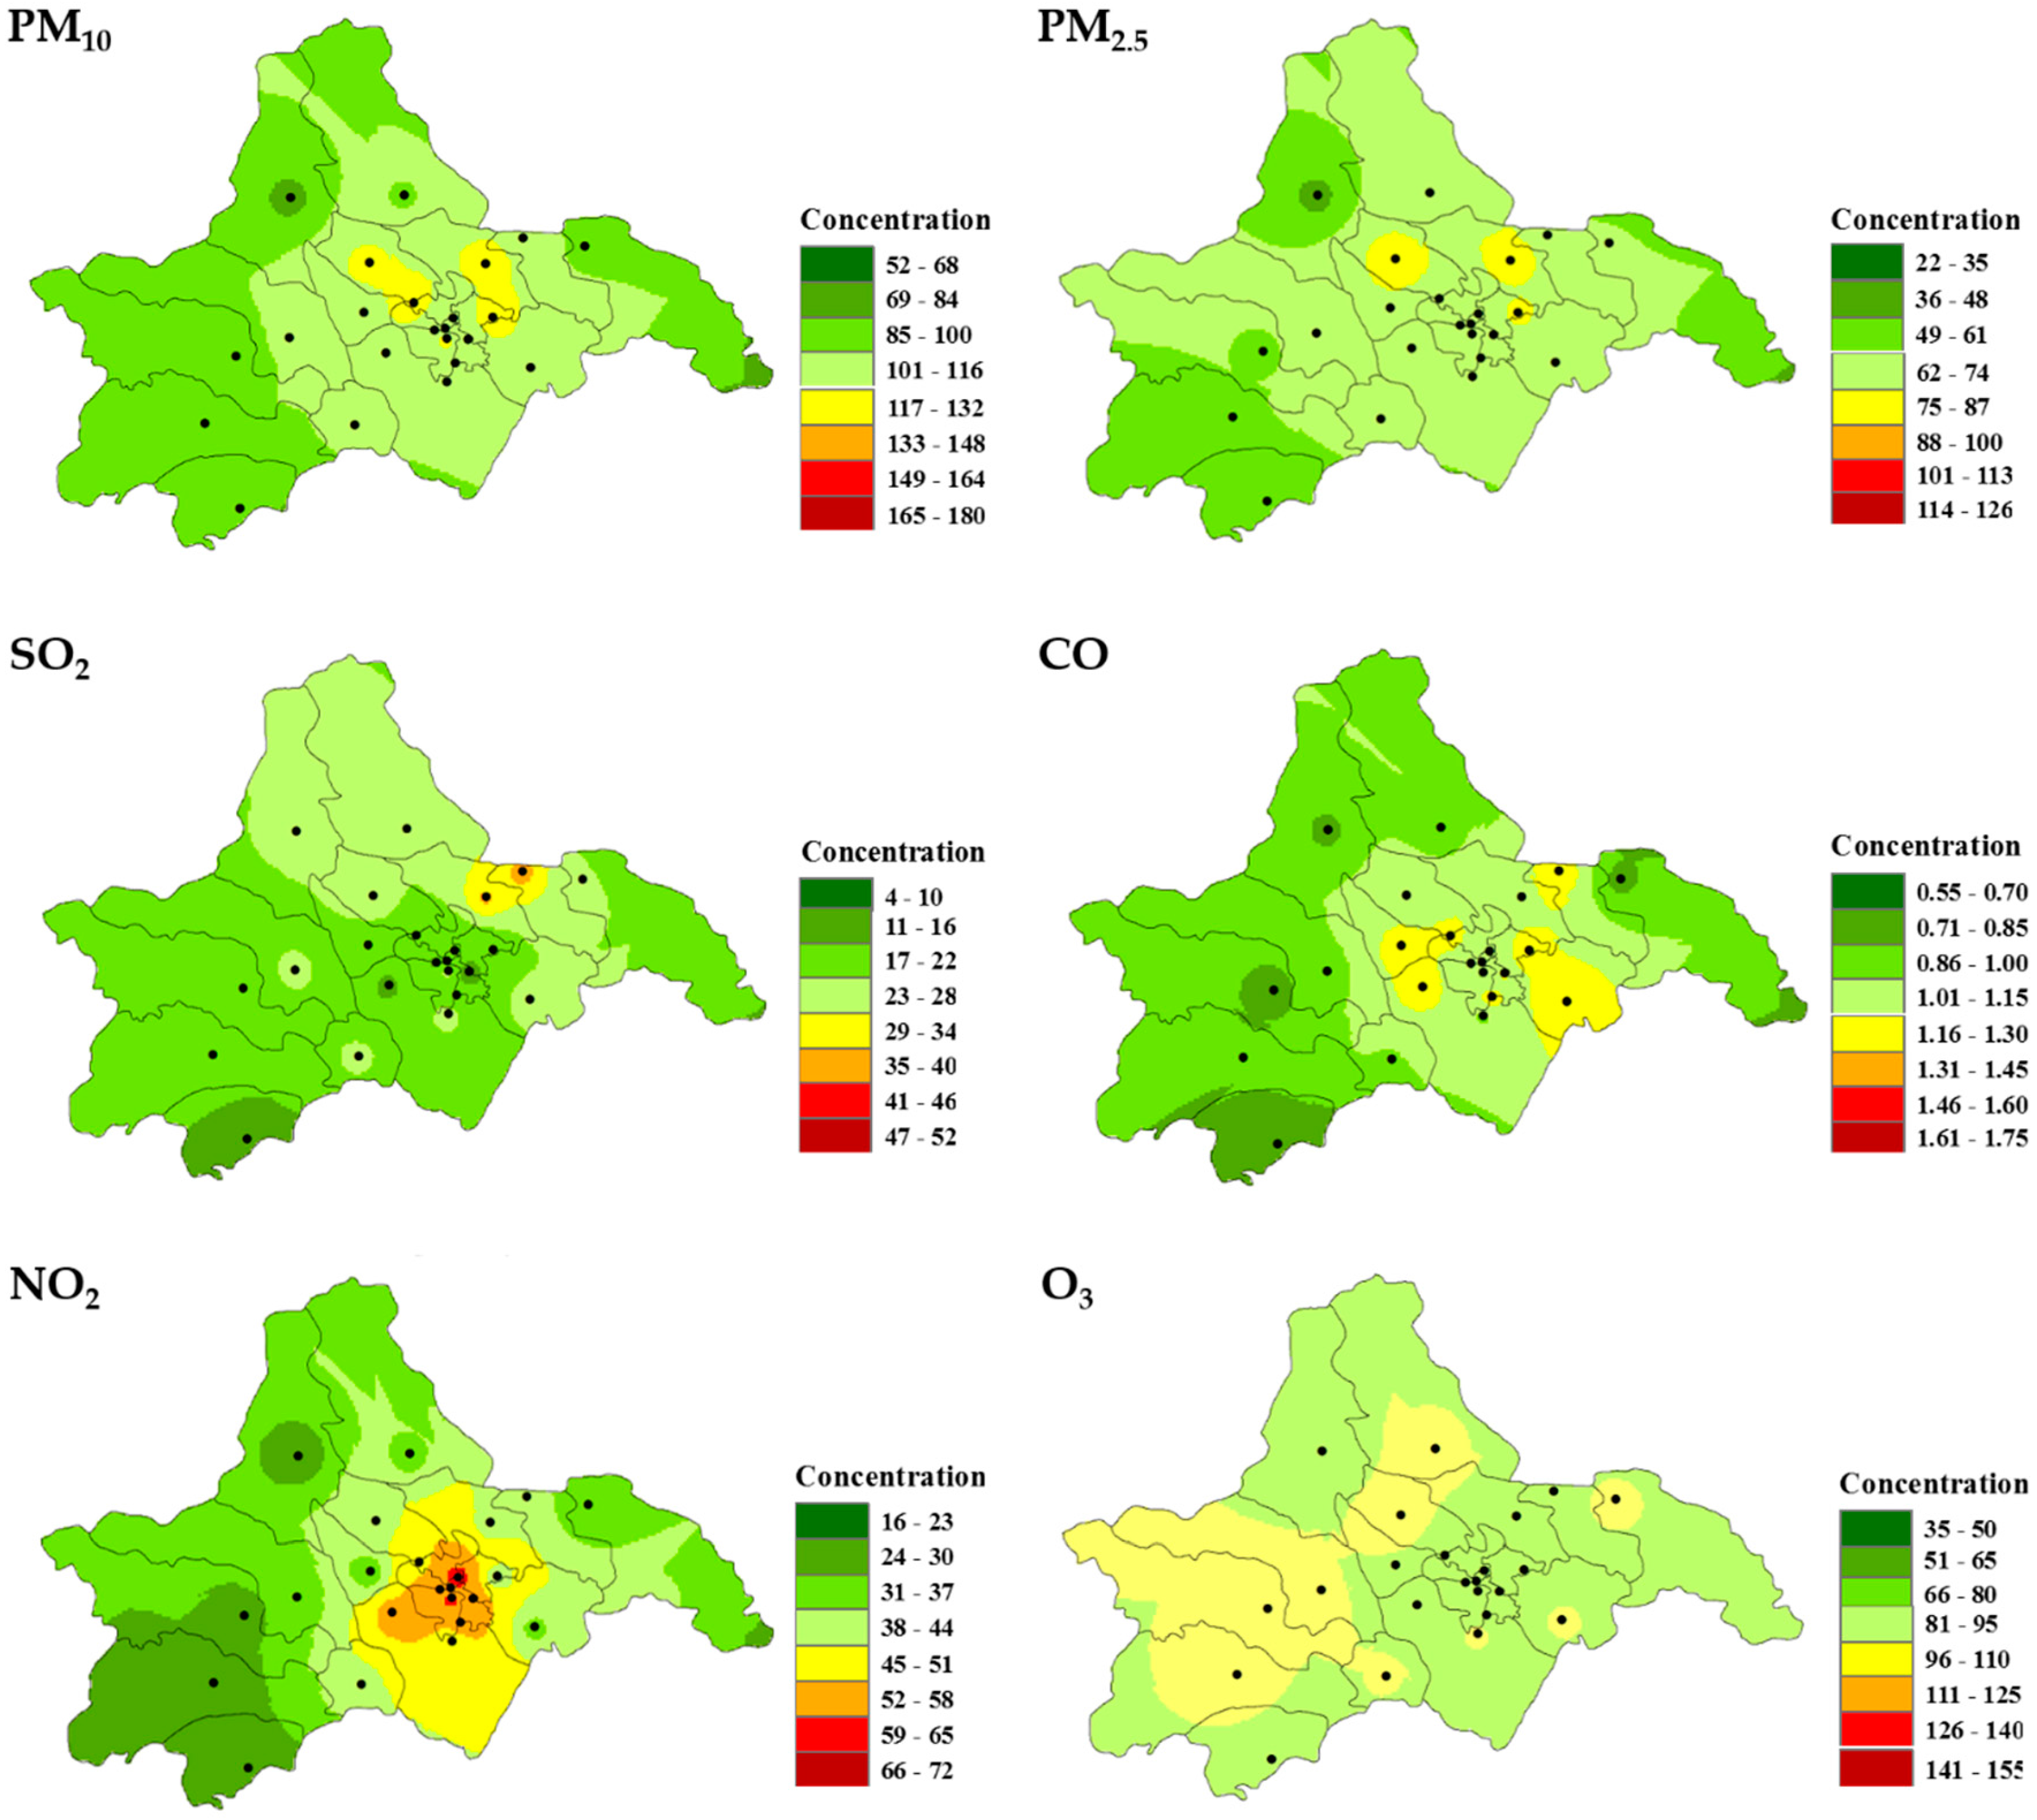
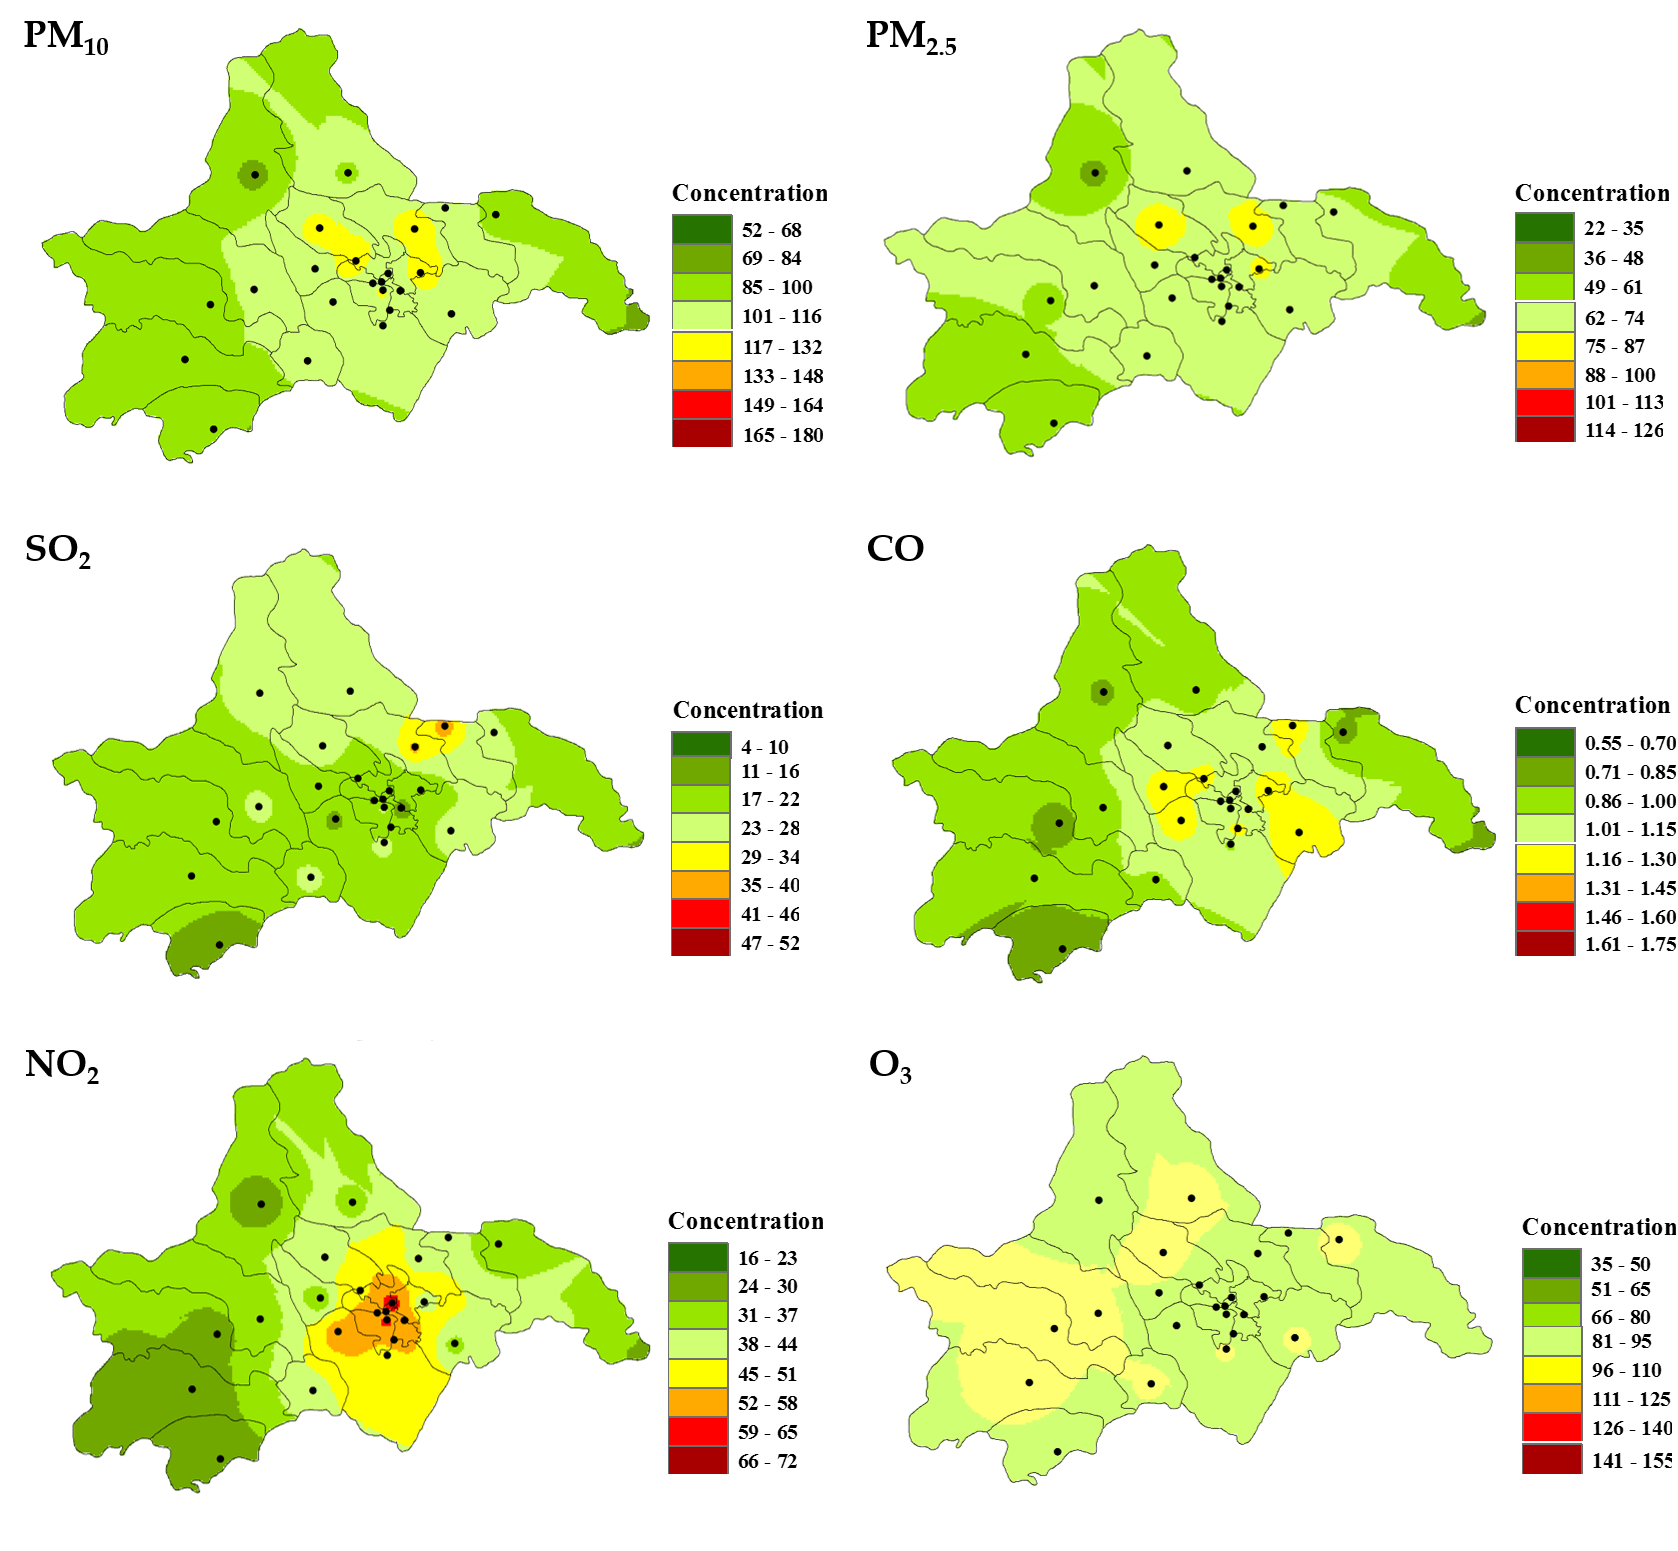
3.2.1. Spatial Pattern and Inter-Annual Variation in Air Pollutants

Spatial and temporal variations in these air pollutants have not been previously reported in Chengdu. The spatial patterns of six pollutants (PM2.5, PM10, SO2, CO, NO2 and O3) in the past three years are shown in Figure 3. Additionally, interannual variations of the pollutants concentrations during 2014–2016 are also shown in Figure S2 and Table S1. In terms of the spatial distributions of the air pollutants, the concentrations of PM in the middle of Chengdu, especially areas S2, S4, S8, S9, S11–S14, and S20, were usually higher than those in other regions. The PM10 concentration in S14 (126 µg/m3) was the highest among the sites and PM2.5 was the highest in S13 (81 µg/m3), while the S23 site had the lowest PM10 and PM2.5 concentrations of 80 µg/m3 and 45 µg/m3, respectively. In general, the spatial distributions of particulate matter pollutants are mainly influenced by local sources. From the interannual variation in particulate matter, the city-wide mean concentrations of PM2.5 slightly decreased from 73 ± 10 µg/m3 in 2014 to 65 ± 8 µg/m3 in 2016, which reflected a non-significant decrease in PM2.5 concentration over the past years. The interannual variation of PM10 was in accordance with that of PM2.5. The averaged PM10 concentration decreased slightly from 112 ± 16 µg/m3 in 2014 to 105 ± 12 µg/m3 in 2016. Although the PM concentrations as a whole did not display a significant reduction, they showed marked spatial heterogeneity. For example, 15 (4) of 23 sites had a synchronous decrease (increase) in PM10 and PM2.5 concentrations. The decrease in both PM10 and PM2.5 concentrations in the middle region of Chengdu (i.e., S3–S10) was the most significant; the decrements averaged 22 ± 5 µg/m3 (ranged 11 to 26 µg/m3) and 17 ± 3 µg/m3 (ranged 14 to 25 µg/m3), respectively, whereas the average PM in western parts of Chengdu such as S16, S19–S20, and S22 increased and S16 showed the greatest increase in PM10 (21 µg/m3, 22.3%) and PM2.5 (8 µg/m3, 12.5%) concentrations.
Higher concentrations of SO2 were generally observed at sites located in the northern region of Chengdu due to the presence of a large number of industries (such as in S11, S13 and S17) and power plants (such as in S9) (Figure 2). It is noteworthy that the overall SO2 concentration significantly decreased in recent years, and the mean SO2 concentrations decreased from 28 ± 10 µg/m3 to 16 ± 4 µg/m3 during the period 2014–2016 (Figure S2, Table S1). The main source of SO2 was coal-fired boilers (especially coal-fired power plants) in Chengdu. The total industrial SO2 emissions decreased considerably after the phasing out of small and less efficient coal-fired power generation units and steel plants, the installation of flue gas desulfurization systems in thermal power units, the implementation of strict emissions standards for industrial boilers, the change in fuel from coal to natural gas, and restrictions on the building of new cement plants, ceramics factories, and glassworks. In addition, most sintering processes adopted electrostatic precipitators for PM removal and fabric filters were more widely used in steel-making, iron-making, and cement production processes, which sharply reduced the emissions of SO2 [38,39,40].
The average CO concentration was higher in the middle region of Chengdu, especially areas S9, S10 and S14, which are closely linked with a large population and polluting activities in the region such as a large number of cars and industrial enterprises. The CO concentration exhibited a moderate decrease from 2014 to 2016, unlike the marked decrease in SO2. The mean concentrations of CO decreased from 1.143 ± 0.211 mg/m3 to 1.021 ± 0.136 mg/m3. The predominant anthropogenic CO originated from the combustion of biomass and fossil fuels. The energy consumption structure in Chengdu has changed significantly in recent years, which could decrease the emission of CO [41]. For example, straw recycling is now conducted instead of open burning of fuels, and residents are prohibited from using coal and encouraged to replace it with natural gas, which has led to less CO being released (http://www.cdstats.chengdu.gov.cn/).
In general, the spatial distribution of NO2 and O3 concentration is opposite: areas with high (low) NO2 concentrations tend to have lower (higher) O3 concentrations (especially in central Chengdu). The spatial distribution characteristics of O3 and NO2 concentrations reflect the complex non-linear relationship in O3 formation with NO2. The mean concentrations of NO2 and O3 displayed opposite inter-annual variation to other gaseous pollutants, which increased from 41 ± 14 µg/m3 and 83 ± 10 µg/m3 in 2014 to 43 ± 12 µg/m3 and 98 ± 11 µg/m3 in 2016, respectively (Figure 3, Table S1). It is well documented that industrial activities and vehicle emissions are major contributors to NO2 in China [42]. In Chengdu, the number of automobiles linearly increased from 2.13 million in 2013 to 4 million in 2016, with a striking growth rate of 29.3% each year (http://www.cdstats.chengdu.gov.cn/). However, the NO2 emissions per automobile decreased slightly following the upgrade of oil product quality standards [43]. In addition, many factories were obliged to employ low-NO2 burner technologies and import denitrification facilities after the implementation of emission standards for coal-fired power plants. Recently, an updated standard (GB13223-2011) with more stringent emission limits (100 mg/Nm3) has been proposed, demanding that all newly built plants and most of the in-use plants must install advanced SCR or SNCR devices to reduce NO2 emissions [44]. Thus, the contribution of vehicle emissions was probably counteracted by controlling the NO2 emissions, thereby leading to the non-significant increase in NO2 concentration in ambient air.
O3 is a secondary pollutant that is generally formed in the atmosphere through photochemical pathways of NOx and volatile organic compounds (VOCs). Recently, a marked increase in overall O3 was observed, although the NO2 concentration remained steady. This may be attributed to the considerable increase in VOCs emission in some industrialized areas, leading to an elevation in O3 through reaction with NOx. For example, a petrochemical project with an annual output of 0.8 million metric tons of ethylene started operation in 2014; it is located in the territory of Pengzhou City (S17) in the north of Chengdu. The prevailing wind direction in most parts of Chengdu is NE and NNE. In addition, vehicle emission is also the main source of non-methane volatile organic compounds (NMVOCs). The study found that the relative contribution of NMVOCs emitted by vehicles reached 52–69% in Beijing [45]. A significant increase in NMVOCs, which can react with NOx, leads to an increase in O3 concentration, although the NO2 concentration increased slightly in recent years. In addition, the increase in NO2 concentration in the center of Chengdu (e.g., S1, S3, S5–S8 and S14) is probably due to the titration reaction of NO and O3, at the same time resulting in a decrease in O3 concentration in this region.

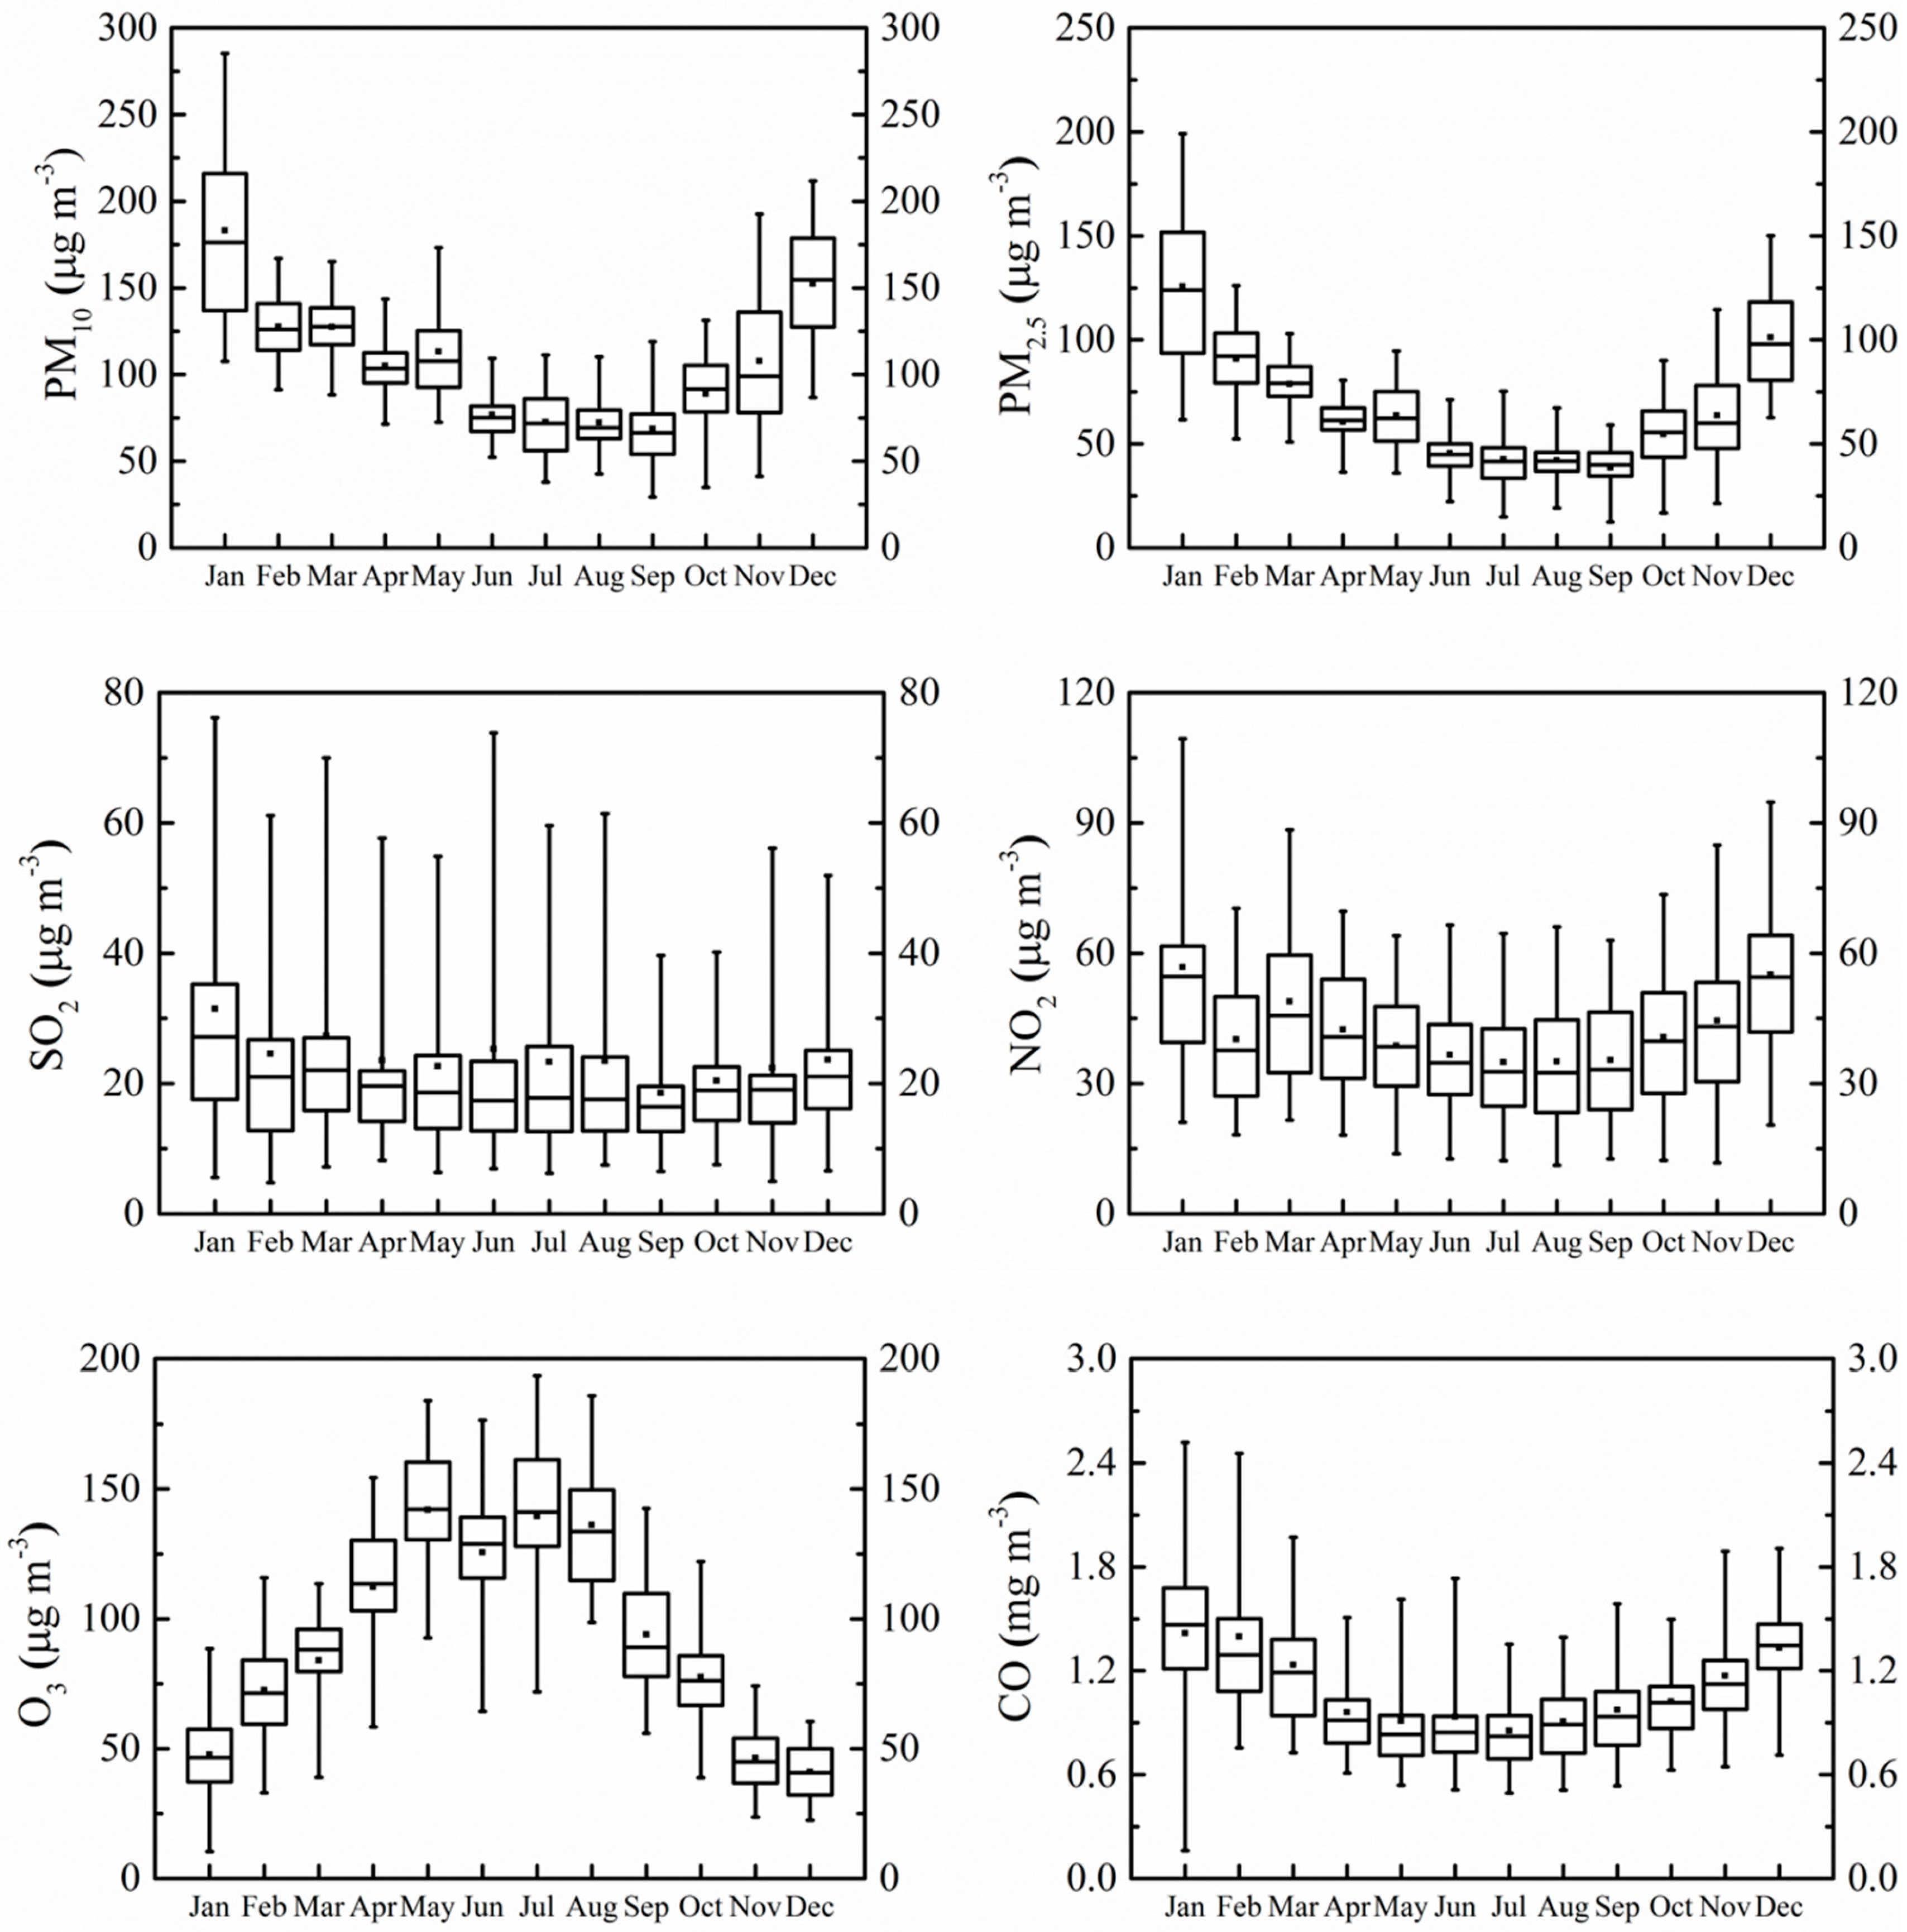
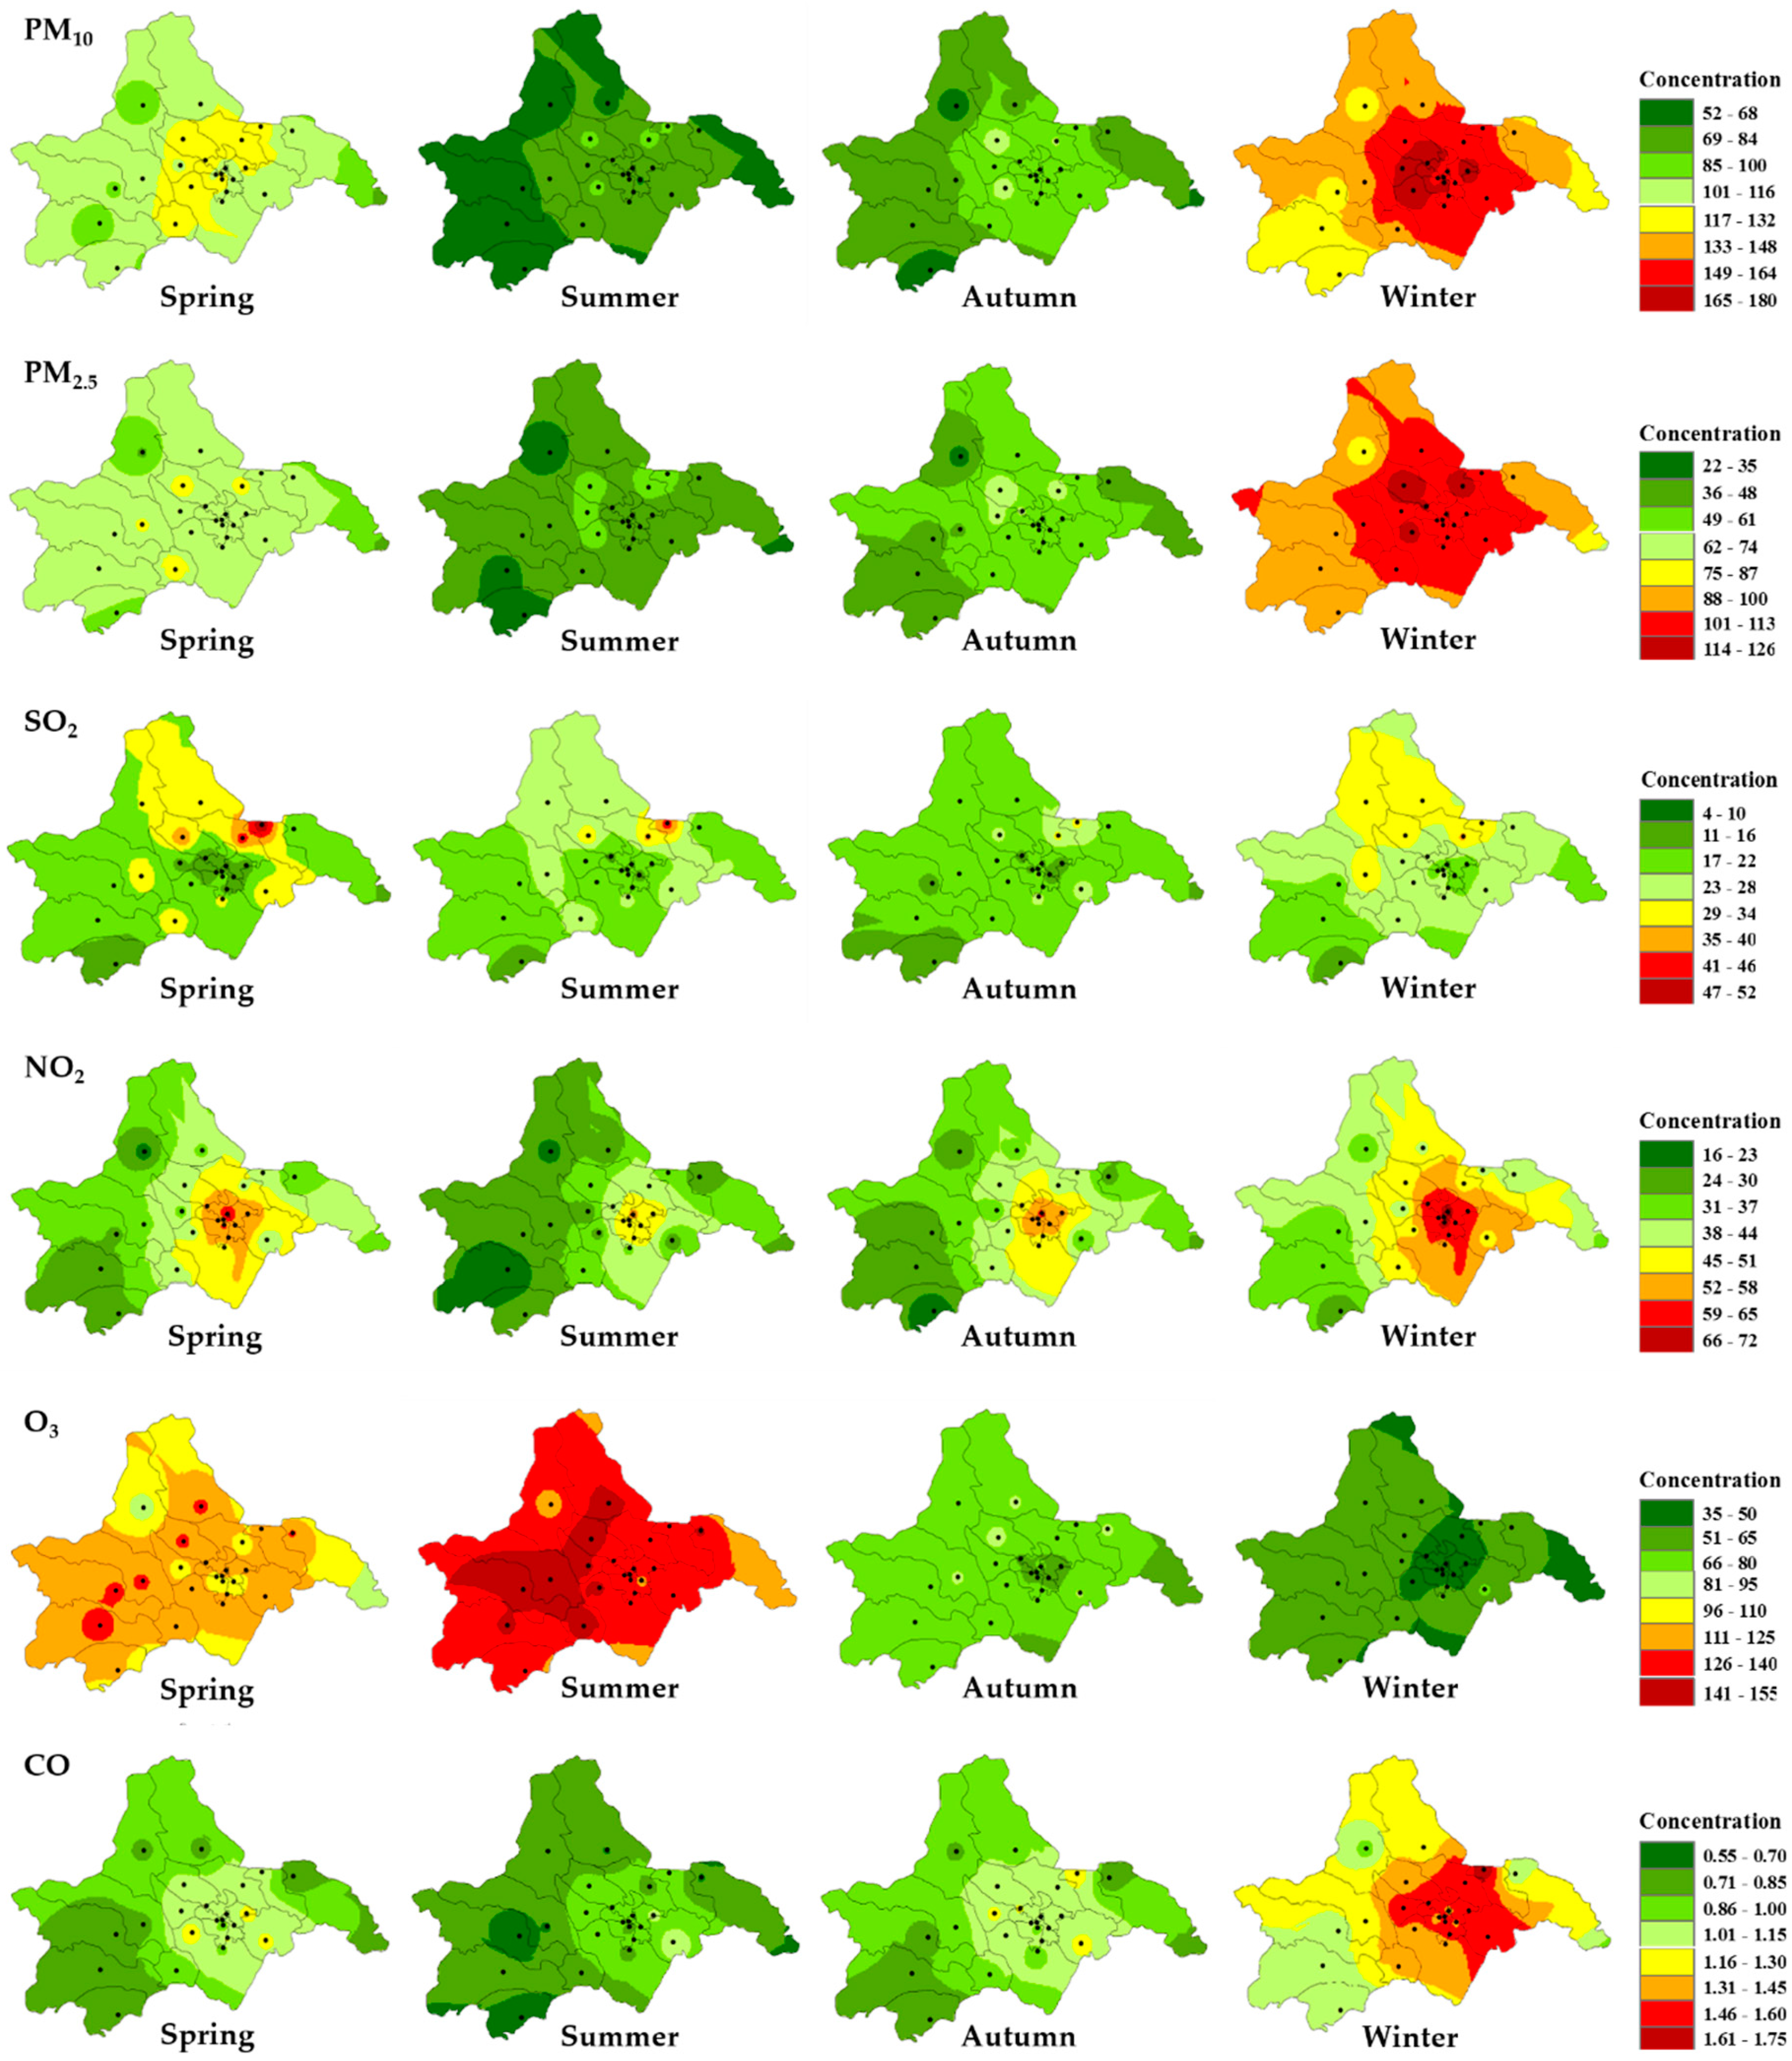
3.2.2. Seasonal Variation in Air Pollutants

To evaluate air pollution events in Chengdu, spatial patterns of six pollutants (PM10, PM2.5, SO2, NO2, O3 and CO) in four seasons are shown in Figure 4 (the seasonal averages at all sites are shown in Table S3). In addition, monthly trends at the sites are shown in Figure 5. All sites showed considerable seasonal variation in PM10, PM2.5, NO2, O3 and CO levels, with the exception of SO2.
The average PM2.5 concentration exhibited great temporal variability, with the highest value in winter and the lowest value in summer; the spring value was slightly higher than that in autumn. The elevated PM2.5 concentrations in winter were the result of stationary sources (e.g., industries) and mobile sources (e.g., vehicles), unlike the northern cities in China, where the elevated PM2.5 concentrations in winter were the result of coal combustion and biomass burning for residential heating (as most southern cities such as Chengdu did not have central heating in winter) [46]. In addition, less precipitation, lower temperature and boundary layer height, and weaker winds in winter may further exacerbate ambient pollution [47,48]. Secondary sulfate and nitrate tended to accumulate in winter due to lower boundary layer height and precipitation, and higher humidity [31,48]. The PM2.5 concentrations in winter peaked in regions S14 and S2, and industrial sources could play significant roles in PM2.5 accumulation due to the presence of more factories [49]. In addition, biomass burning (e.g., open burning of straw) probably led to elevated PM2.5 in spring and autumn [32].
The PM10 concentration followed the order: winter (153 ± 18 µg/m3) > spring (114 ± 11 µg/m3) > autumn (87 ± 14 µg/m3) > summer (73 ± 11 µg/m3), similar to the seasonal variation in PM2.5. Apart from the combined impacts of industrial sources and unfavorable weather conditions on air pollution dilution and dispersion in winter, this will also be severely affected in spring by dust from the north. Researchers studied the input of dust in Chengdu in March 2013 and found that the concentrations of PM10 and PM2.5 rapidly increased and the ratio of PM2.5 to PM10 was only 0.28 [46,50].
CO and NO2 also exhibited similar seasonal variations, with the highest concentrations in winter and the lowest in summer. These seasonal variations reflect the effects of meteorological conditions and emissions. For example, stagnant meteorological conditions characterized by slow winds and shallow mixing layers occur more frequently in winter, trapping the pollutants near the surface and leading to high concentrations [51]. In addition, fossil fuel combustion sources such as residential coal and biomass combustion for heating also contributed to the formation of high pollution in winter [52,53]. In contrast, solar radiation, strong turbulent eddies, increased photochemical activity and precipitation scavenging diluted the pollutants released at the surface and caused lower CO and NO2 concentrations in summer [54]. CO originated from biomass burning, including open crop straw burning, which often occurs in autumn and is the main reason for the higher CO concentration in autumn than in spring. The NO2 concentrations in S1 were the highest among the sites every season. Mean NO2 concentrations were 65 µg/m3 (spring), 56 µg/m3 (summer), 60 µg/m3 (autumn), and 71 µg/m3 (winter), which were 56.1%, 67.4%, 55.3%, and 47.8% higher than mean values in corresponding seasons among the remaining sites in Chengdu.
However, the concentration of O3 displayed the opposite seasonal variation, with the highest value in summer (136 ± 9 µg/m3) and the lowest value (53 ± 9 µg/m3) in winter. Weak sunlight in winter could inhibit the formation of O3 as the formation rate of O3 depends on the intensity of solar radiation [55]. In contrast, high temperature and strong solar radiation tended to generate large numbers of OH radicals, resulting in the formation of O3 through the reaction of VOCs and OH radicals [56]. However, no marked increase in O3 was observed in winter, suggesting slow photochemical activity in winter [57].
SO2 concentrations showed weak seasonal variability: winter (25 ± 6 µg/m3) > spring (22 ± 7 µg/m3) > summer (20 ± 8 µg/m3) > autumn (19 ± 5 µg/m3); the summer and autumn concentrations were approximately the same. The main source of gas-phase SO2 was from the combustion of all sulfur-containing fuels (oil, coal, and diesel). Furthermore, a smaller variability in monthly average SO2 was noted during autumn, which was indicative of lower near-surface anthropogenic sources and boundary layer height evolution.

3.3. Effects of Meteorological Factors on the Air Pollutants

Unlike long-term changes or annual and diurnal variations, daily fluctuations in air pollutant concentrations may primarily depend on synoptic-scale weather conditions, especially on polluted days, assuming that the pollutant emissions remained almost constant each day for most of the study period. To quantitatively investigate the relationships between daily fluctuations in air pollutant concentrations and meteorological factors in exceedance days (according to the CAAQS standard), the correlation coefficients between the PM10, PM2.5, and O3 concentrations and meteorological factors were calculated and are shown in Table 3 (NO2 samples were too small to be statistically significant). The single-sample K–S test demonstrated that all sample data obeyed a normal distribution at the significance level of 0.01.
Of these meteorological factors, T, P, and RH were the most closely correlated with PM10 and PM2.5, and only T was significantly positively correlated with O3. Significant positive or negative correlations are a reflection of the physical response mechanisms. For example, the significant negative correlations with T (p < 0.01) and positive correlations with P (p < 0.05) suggest that the PM concentrations increase with decreasing temperature and increasing surface pressure because particles often accumulated in the atmosphere and were not dispersed rapidly when the temperature decreased and atmospheric pressure increased, and this was one of the causes of hazy weather. For RH (p < 0.05), the significant positive correlations with PM10 and PM2.5 were associated with windless, cloudy, and weak sunshine days, which encouraged the accumulation and chemical reaction of pollutants [58]. We also observed that there were significant negative correlations between S, Ws, R, and PM2.5, but no close correlation with PM10. This suggests that the reliance of PM2.5 on meteorological factors such as sunshine duration, wind speed, and precipitation was more significant than that for PM10 during the period where the standard was exceeded, which may be related to the different physical characteristics, sources, and composition of the two pollutants. For example, secondary aerosols are important sources of PM2.5 in Chengdu, which is more sensitive to meteorological factors. In contrast, the O3 concentration was only significantly positively correlated with T (p < 0.05), as higher temperatures can promote photochemical reactions and generate abundant O3 [59,60]. Moreover, the correlations between O3 and S and RH were not significant, which suggests that the links between O3, sunshine duration, and relative humidity on a daily time scale were weak on exceedance days. This may be due to the limited fluctuation of sunshine duration and relative humidity in the short-term steady state, leading to a decrease in this correlation. In general, long sunshine duration and low relative humidity usually play an important role and have a direct influence on chemical kinetic rates and the mechanistic pathways of O3 production.

4. Conclusions

Based on the daily air pollutant concentrations from 23 air quality monitoring stations and meteorological datasets during 2014–2016, the air pollution characteristics and influencing factors during 2014–2016 in the inland basin city Chengdu were analyzed in this study. The main conclusions are as follows:
(1)
Heavy air pollution was induced mainly by high PM or ozone concentrations in Chengdu. The annual mean concentrations of PM2.5 and PM10 exceeded the standards of CAAQS and WHO at all of the stations.
(2)
Air pollution was regional in Chengdu, and daily mean CO, NO2, PM2.5, and PM10 inside the middle area (e.g., S1–S8) were much higher than other regions, while daily maximum 8-h average surface O3 concentrations and SO2 were lower inside the middle area. Furthermore, the PM10, PM2.5, SO2, and CO concentrations decreased from 2014 to 2016; the NO2 level basically stable, whereas the O3 level increased markedly during this period.
(3)
PM2.5, PM10, SO2, CO, and NO2 displayed the highest levels in winter and the lowest level in summer (SO2 lowest in autumn), indicating the combined impact of industrial sources and unfavorable weather conditions on air pollution dilution and dispersion. However, the O3 concentration peaked in summer, which was associated with the strong solar radiation.
(4)
Meteorological conditions are important factors that affect the concentrations of air pollutants in excessive standard days. Haze pollution can be formed easily under the weather conditions of static wind, low temperature, high relative humidity, and high surface pressure inside Chengdu. In contrast, severe ozone pollution is often associated with high temperature.
(5)
The results indicate that air pollution in Chengdu is caused by multiple pollutants, and the air pollution shows great divergence in different regions and different seasons. Region-oriented air pollution management plans are suggested. This study also calls for future studies to investigate the associations between air quality and meteorological conditions, emissions in different regions, transport and transformation of pollutants in both intra- and inter-regional contexts, to further improve the understanding of the physical and chemical processes that affect air quality in Chengdu. In addition, we strongly recommend a revision and update of CAAQS standards for SO2, as the difference between the CAAQS and WHO is too large, and the assessment results are also quite different.

Supplementary Materials

The following are available online at https://www.mdpi.com/2073-4433/9/2/74/s1.

Acknowledgments

The study is supported by Natural Science Foundation of China (41371539). The authors also would like to thank Chengdu Environmental Monitoring Center Station (CDEMC) and China Meteorological Data Service Center (CMDC) due to providing air quality and meteorological data used in this study.

Author Contributions

Guang Wu and Yuku Wang conceived and designed the experiments; Kuang Xiao performed the experiments; Kuang Xiao and Bin Fu analyzed the data; Yuanyuan Zhu contributed reagents/materials/analysis tools; Kuang Xiao wrote the paper.

Conflicts of Interest

The authors declare no conflict of interest.

References

  1. Chen, Y.; Xie, S.D.; Luo, B. Composition and pollution characteristics of fine particles in Chengdu from 2012 to 2013. Aeta Sci. Circumstantiae 2016, 36, 1021–1030. [Google Scholar]
  2. Chan, C.K.; Yao, X.H. Air pollution in mega cities in China. Atmos. Environ. 2008, 42, 1–42. [Google Scholar] [CrossRef]
  3. Kan, H.; Chen, R.; Tong, S. Ambient air pollution, climate change, and population health in China. Environ. Int. 2012, 42, 10–19. [Google Scholar] [CrossRef] [PubMed]
  4. Zhang, Q.; He, K.B.; Huo, H. Policy: Cleaning China’s air. Nature 2012, 484, 161–162. [Google Scholar] [PubMed]
  5. Alcorn, T. China’s skies: A complex recipe for pollution with no quick fix. Lancet 2013, 381, 1973–1974. [Google Scholar] [CrossRef]
  6. He, K.B.; Huo, H.; Zhang, Q. Urban air pollution in China: Current status, characteristics, and progress. Annu. Rev. Environ. Resour. 2002, 27, 397–431. [Google Scholar]
  7. Wang, W.X.; Wang, T. On the origin and the trend of acid precipitation in China. Water Air Soil Pollut. 1995, 85, 2295–2300. [Google Scholar] [CrossRef]
  8. National Bureau of Statistics of China. China statistical yearbook. 2013. Available online: http://data.stats.gov.cn/workspace/index?m=hgnd (accessed on 8 July 2017).
  9. Kurokawal, J.; Ohara, T.; Morikawa, S.; Hanayama, S. Emissions of air pollutants and greenhouse gases over Asian regions during 2000–2008: Regional emission inventory in Asia (REAS) version 2. Atmos. Chem. Phys. Discuss. 2013, 13, 10049–10123. [Google Scholar] [CrossRef]
  10. National Development and Reform Commission. Crucial situations of energy saving and emission reduction, and huge potentials of industrial development. 2013. Available online: http://www.sdpc.gov.cn/jjxsfx/t20130710_549549.htm (accessed on 8 July 2017).
  11. Dominici, F.; Peng, R.D.; Bell, M.L.; Pham, L.; McDermott, A.; Zeger, S.L.; Samet, J.M. Fine particulate air pollution and hospital admission for cardiovascular and respiratory diseases. J. Am. Med. Assoc. 2006, 295, 1127–1134. [Google Scholar] [CrossRef] [PubMed]
  12. Valavanidis, A.; Fiotakis, K.; Vlachogianni, T. Airborne particulate matter and human health: Toxicological assessment and importance of size and composition of particles for oxidative damage and carcinogenic mechanisms. J. Environ. Sci. Health Part C 2008, 26, 339–362. [Google Scholar] [CrossRef] [PubMed]
  13. Peng, R.D.; Bell, M.L.; Geyh, A.S.; McDermott, A.; Zeqer, S.L.; Samet, J.M.; Dominici, F. Emergency admissions for cardiovascular and respiratory diseases and the chemical composition of fine particle air pollution. Environ. Health Perspect. 2009, 117, 957–963. [Google Scholar] [CrossRef] [PubMed]
  14. Ministry of Environmental Protection of the People’s Republic. China statistical yearbook on environment. 2017. Available online: http:// zls.mep.gov.cn/hjtj/nb/2016tjnb/ (accessed on 8 July 2017).
  15. Gao, W.K.; Tang, G.Q.; Xin, J.Y.; Wang, L.L.; Wang, Y.S. Spatial-temporal variations of ozone during severe photochemical pollution over the Beijing-Tianjin-Hebei region. Res. Environ. Sci. 2016, 29, 654–663. [Google Scholar]
  16. Zhao, X.J.; Zhao, P.S.; Xu, J.; Meng, W. Analysis of a winter regional haze event and its formation mechanism in the North China Plain. Atmos. Chem. Phys. 2013, 13, 5685–5696. [Google Scholar] [CrossRef]
  17. Wang, Y.S.; Yao, L.; Wang, L.L.; Liu, Z.R.; Ji, D.S.; Tang, G.Q.; Zhang, J.K.; Sun, Y.; Hu, B.; Xin, J.Y. Mechanism for the formation of the January 2013 heavy haze pollution episode over central and eastern China. Sci. China Earth Sci. 2014, 57, 14–25. [Google Scholar] [CrossRef]
  18. Liao, T.; Wang, S.; Ai, J.; Gui, K.; Duan, B.; Zhao, Q.; Zhang, X.; Jiang, W.; Sun, Y. Heavy pollution episodes, transport pathways and potential sources of PM2.5 during the winter of 2013 in Chengdu (China). Sci. Total Environ. 2017, 584–585, 1056–1065. [Google Scholar] [CrossRef] [PubMed]
  19. Zhang, Z.Y.; Zhang, X.L.; Gong, D.Y.; Quan, W.J.; Zhao, X.J.; Ma, Z.Q.; Kim, S.J. Evolution of surface O3 and PM2.5 concentrations and their relationships with meteorological conditions over the last decade in Beijing. Atmos. Environ. 2015, 108, 67–75. [Google Scholar] [CrossRef]
  20. Alghamdi, M.A.; Khoder, M.; Harrison, R.M.; Hyvärinen, A.P.; Huaaein, T.; Jeelani, H.A.; Abdelmaksoud, A.S.; Golnil, M.H.; Shabbaj, I.I.; Almehmadi, F.M.; et al. Temporal variations of O3 and NOx in the urban background atmosphere of the coastal city Jeddah, Saudi Arabia. Atmos. Environ. 2014, 94, 205–214. [Google Scholar] [CrossRef]
  21. Xu, L.; Batterman, S.; Chen, F.; Li, J.; Zhong, X.; Feng, Y.; Rao, Q.; Chen, F. Spatiotemporal characteristics of PM2.5 and PM10 at urban and corresponding background sites in 23 cities in China. Sci. Total Environ. 2017, 599–600, 2074–2084. [Google Scholar] [CrossRef] [PubMed]
  22. Xue, W.B.; Fu, F.; Wang, J.N.; Wang, Y.S. Numerical study on the characteristics of regional transport of PM2.5 in China. China Environ. Sci. 2014, 34, 1361–1368. [Google Scholar]
  23. Zhang, Z.G.; Gao, Q.X.; Han, X.Q.; Zheng, X.J. The Study of pollutant transport between the cities in north China. Res. Environ. Sci. 2004, 17, 14–20. [Google Scholar]
  24. Wang, Y.Q.; Zhang, X.Y.; Arimoto, R. The contribution from distant dust sources to the atmospheric particulate matter loadings at Xian, China during spring. Sci. Total Environ. 2006, 368, 875–883. [Google Scholar] [CrossRef] [PubMed]
  25. Zhou, L.; Wu, J.J.; Jia, D.J.; Liang, N.; Zhang, F.Y.; Ni, Y.; Liu, M. Investigation of temporal-spatial characteristics and underlying risk factors of PM2.5 pollution in Beijing-Tianjin-Hebei Area. Res. Environ. Sci. 2016, 29, 483–493. [Google Scholar]
  26. Xu, W.J.; He, F.F.; Li, H.X.; Zhong, L.J. Spatial and temporal variations of PM2.5 in the Pearl River Delta. Res. Environ. Sci. 2014, 27, 951–957. [Google Scholar]
  27. Hu, Z.M.; Wang, J.; Tao, Z.K.; Chen, Z.L. Pollution level and health risk assessment of heavy metals in PM2.5, Shanghai. Acta Sci. Circumstantiae 2013, 33, 3399–3406. [Google Scholar]
  28. Li, R.; Cui, L.L.; Li, J.L.; Zhao, A.; Fu, H.; Wu, Y.; Zhang, L.; Kong, L.; Chen, J. Spatial and temporal variation of particulate matter and gaseous pollutants in China during 2014–2016. Atmos. Environ. 2017, 161, 235–246. [Google Scholar] [CrossRef]
  29. Wang, Y.G.; Ying, Q.; Hu, J.L.; Zhang, H.L. Spatial and temporal variations of six criteria air pollutants in 31 provincial capital cities in China during 2013–2014. Environ. Int. 2014, 73, 413–422. [Google Scholar] [CrossRef] [PubMed]
  30. Chengdu Statistics Bureau. 2017. Chengdu statistics yearbook. 2016. Available online: http://www. cdstats.chengdu.gov.cn/uploadfiles/020703/2017%E3%80%81%E5%8C%BA%E5%B8%82%E5%8E%BF.pdf (accessed on 9 July 2017).
  31. Huang, W.; Long, E.S. The relationship between PM2.5 and meteorological conditions in Chengdu and the impact of urban spatial morphology. Environ. Monit. China 2014, 30, 93–99. [Google Scholar]
  32. Zhang, Z.S.; Tao, J.; Xie, S.D.; Zhou, L.D.; Song, D.L.; Zhang, P.; Cao, J.J.; Luo, L. Seasonal variations and source apportionment of PM2.5 at urban area of Chengdu. Acta Sci. Circumstantiae 2013, 33, 2947–2952. [Google Scholar]
  33. Yang, C.; Yu, J.; Yu, Y.; Jing, L.R.; Qian, M.; Deng, J. Analysis of the impact factors of PM2.5 in Chengdu and its prevention strategies. J. Southwest Univ. Natly. (Nat. Sci. Ed.) 2016, 42, 626–631. [Google Scholar]
  34. Qiao, X.; Jaffe, D.; Tang, Y.; Bresnahan, M.; Song, J. Evaluation of air quality in Chengdu, Sichuan Basin, China: Are China’s air quality standards sufficient yet? Environ. Monit. Assess. 2015, 187, 250. [Google Scholar] [CrossRef] [PubMed]
  35. Wang, S.L.; Chai, F.H.; Gao, J. Study on Long- term Strategies and Countermeasures of PM2.5 Pollution Control in China. Environ. Sustain. Dev. 2013, 4, 10–13. [Google Scholar]
  36. Zhang, G.; Chen, Y.Z.; Liu, H.F.; Yang, X.; Zhao, Y.X. Characterization of the PM2.5 Pollution in Beijing. Ecol. Environ. Sci. 2014, 23, 1946–1952. [Google Scholar]
  37. Huang, Y.L.; Liu, C.; Zeng, K.F.; Ding, L.; Cheng, S.G. Spatio-temporal Distribution of PM2.5 in Wuhan and Its Relationship with Meteorological Conditions in 2013–2014. Ecol. Environ. Sci. 2015, 24, 1330–1335. [Google Scholar]
  38. Li, H.X.; Shi, X.M. Temporal and Spatial Distribution, Meteorological Factors of PM2.5 in Xi’an City. Ecol. Environ. Sci. 2016, 25, 266–271. [Google Scholar]
  39. Wang, K.; Tian, H.Z.; Hua, S.B.; Zhu, C.Y.; Gao, J.J.; Xue, Y.F.; Hao, J.M. A comprehensive emission inventory of multiple air pollutants from iron and steel industry in China: Temporal trends and spatial variation characteristics. Sci. Total Environ. 2016, 559, 7–14. [Google Scholar] [CrossRef] [PubMed]
  40. Wang, Q.; Zhuang, G.; Huang, K.; Liu, T.; Lin, Y.; Deng, C.; Fu, Q.; Fu, J.S.; Chen, J.; Zhang, W. Evolution of particulate sulfate and nitrate along the Asian dust pathway: Secondary transformation and primary pollutants via long-range transport. Atmos. Res. 2016, 169, 86–95. [Google Scholar] [CrossRef]
  41. Hua, S.B.; Tian, H.Z.; Wang, K.; Zhu, C.Y.; Gao, J.J.; Ma, Y.L.; Xue, Y.; Wang, Y.; Duan, S.; Zhou, J. Atmospheric emission inventory of hazardous air pollutants from China’s cement plants: Temporal trends, spatial variation characteristics and scenario projections. Atmos. Environ. 2016, 128, 1–9. [Google Scholar] [CrossRef]
  42. Lindner, S.; Liu, Z.; Guan, D.; Geng, Y.; Li, X. CO2 emissions from China’s power sector at the provincial level: Consumption versus production perspectives. Renew. Sustain. Energy Rev. 2013, 19, 164–172. [Google Scholar] [CrossRef]
  43. Streets, D.G.; Bond, T.; Carmichael, G.; Fernandes, S.; Fu, Q.; He, D.; Klimont, Z.; Nelson, S.; Tsai, N.; Wang, M.Q. An inventory of gaseous and primary aerosol emissions in Asia in the year 2000. J. Geophys. Res. Atmos. 2003, 108. [Google Scholar] [CrossRef]
  44. Li, Y.; Meng, J.; Liu, J.F.; Xu, Y.; Guan, D.B.; Tao, W.; Huang, Y.; Tao, S. Interprovincial reliance for improving air quality in China: A case study on black carbon aerosol. Environ. Sci. Technol. 2016, 50, 4118–4126. [Google Scholar] [CrossRef] [PubMed] [Green Version]
  45. Tian, H.Z.; Liu, K.Y.; Hao, J.M.; Wang, Y.; Gao, J.J.; Qiu, P.P.; Zhu, C.Y. Nitrogen oxides Emissions from thermal power plants in China: Current status and future predictions. Environ. Sci. Technol. 2013, 47, 11350–11357. [Google Scholar] [CrossRef] [PubMed]
  46. Wang, M.; Shao, M.; Chen, W.; Yuan, B.; Lu, S.; Zhang, Q.; Zeng, L.; Wang, Q. A temporally and spatially resolved validation of emission inventories by measurements of ambient volatile organic compounds in Beijing, China. Atmos. Chem. Phys. 2014, 14, 5871–5891. [Google Scholar] [CrossRef] [Green Version]
  47. Xu, R.G.; Tang, G.Q.; Wang, Y.S.; Tie, X.X. Analysis of a long-term measurement of air pollutants (2007–2011) in North China Plain (NCP); Impact of emission reduction during the Beijing Olympic Games. Chemosphere 2016, 159, 647–658. [Google Scholar] [CrossRef] [PubMed]
  48. Xu, W.; Wu, Q.; Liu, X.; Tang, A.; Dore, A.J.; Heal, M.R. Characteristics of ammonia, acid gases, and PM2.5 for three typical land-use types in the NCP. Environ. Sci. Pollut. Res. 2016, 23, 1158–1172. [Google Scholar] [CrossRef] [PubMed]
  49. Tao, J.; Gao, J.; Zhang, L.; Zhang, R.; Che, H.; Zhang, Z.; Lin, Z.; Jing, J.; Cao, J.; Hsu, S.-C. PM2.5 pollution in a megacity of southwest China: Source apportionment and implication. Atmos. Chem. Phys. 2014, 14, 8679–8699. [Google Scholar] [CrossRef]
  50. Wang, S.L.; Chai, F.H.; Zhou, L.D.; Wang, Q.L. Source Analysis of Air Inhalational Particles in Chengdu City. Sci. Geogr. Sin. 2006, 26, 717–721. [Google Scholar]
  51. Tai, A.P.; Mickley, L.J.; Jacob, D.J. Correlations between fine particulate matter (PM2.5) and meteorological variables in the United States: Implications for the sensitivity of PM2.5 to climate change. Atmos. Environ. 2010, 44, 3976–3984. [Google Scholar] [CrossRef]
  52. Zhang, Q.; Streets, D.G.; Carmichael, G.R.; He, K.B.; Huo, H.; Kannari, A.; Klimont, Z.; Park, I.S.; Reddy, S.; Fu, J.S.; et al. Asian emissions in 2006 for the NASA INTEX-B mission. Atmos. Chem. Phys. 2009, 9, 5131–5153. [Google Scholar] [CrossRef] [Green Version]
  53. Zhao, Y.; Nielsen, C.P.; Lei, Y.; McElroy, M.B.; Hao, J. Quantifying the uncertainties of a bottom-up emission inventory of anthropogenic atmospheric pollutants in China. Atmos. Chem. Phys. 2011, 11, 2295–2308. [Google Scholar] [CrossRef] [Green Version]
  54. Antony Chen, L.W.; Doddridge, B.G.; Dickerson, R.R.; Chow, J.C.; Mueller, P.K.; Quinn, J.; Butler, W.A. Seasonal variations in elemental carbon aerosol carbon monoxide and sulfur dioxide: Implications for sources. Geophys. Res. Lett. 2001, 28, 1711–1714. [Google Scholar] [CrossRef]
  55. Zhao, S.; Yu, Y.; Yin, D.; He, J.; Liu, N.; Qu, J.; Xiao, J. Annual and diurnal variations of gaseous and particulate pollutants in 31 provincial capital cities based on in situ air quality monitoring data from China National Environmental Monitoring Center. Environ. Int. 2016, 86, 92–106. [Google Scholar] [CrossRef] [PubMed]
  56. Ou, J.; Zheng, J.; Li, R.; Huang, X.; Zhong, Z.; Zhong, L.; Lin, H. Speciated OVOC and VOC emission inventories and their implications for reactivity-based ozone control strategy in the Pearl River Delta region, China. Sci. Total Environ. 2015, 530, 393–402. [Google Scholar] [CrossRef] [PubMed]
  57. Boynard, A.; Clerbaux, C.; Clarisse, L.; Safieddine, S.; Pommier, M.; Van Damme, M.; Bauduin, S.; Oudot, C.; Hadji-Lazaro, J.; Hurtmans, D. First simultaneous space measurements of atmospheric pollutants in the boundary layer from IASI: A case study in the NCP. Geophys. Res. Lett. 2014, 41, 645–651. [Google Scholar] [CrossRef]
  58. Csavina, J.; Field, J.; Felix, O.; Corral-Avitia, A.Y.; Sáez, A.E.; Betterton, E.A. Effect of wind speed and relative humidity on atmospheric dust concentrations in semi-arid climates. Sci. Total Environ. 2014, 487, 82–90. [Google Scholar] [CrossRef] [PubMed]
  59. Pudasainee, D.; Sapkota, B.; Shrestha, M.L.; Kaga, A.; Kondo, A.; Inoue, Y. Ground level ozone concentrations and its association with NOx and meteorological parameters in Kathmandu valley, Nepal. Atmos. Environ. 2006, 40, 8081–8087. [Google Scholar] [CrossRef]
  60. Han, S.; Bian, H.; Feng, Y.; Liu, A.; Li, X.; Zeng, F.; Zhang, X. Analysis of the relationship between O3, NO and NO2 in Tianjin, China. Aerosol. Aerosol Air Qual. Res. 2011, 11, 128–139. [Google Scholar]
Figure 1. Terrain and locations of the 23 automatic ambient air monitoring stations in Chengdu. The upper right corner of the map shows the central city of Chengdu, and the red dots represent the position of the air monitoring stations.
Atmosphere 09 00074 g001
Figure 2. The city-wide average annual and daily concentrations of PM10, PM2.5, SO2, NO2, O3 and CO in Chengdu during the study period. The horizontal solid lines indicate the median and the filled squares indicate the mean (i.e., annual average concentrations), and range where the top and bottom of the box indicate the 75th and 25th percentiles, respectively. The top and bottom whiskers indicated the 95th and 5th percentiles, and the forks indicated the maximum and minimum values, respectively. The red solid and dotted lines represent the daily and annual limits specified by CAAQS (Chinese Ambient Air Quality Standards), the blue solid and dotted lines represent the daily and annual limits specified by the WHO.
Atmosphere 09 00074 g002
Figure 3. Spatial distributions of mean PM10, PM2.5, SO2, CO, NO2 and O3 concentrations during 2014 and 2016. The units for PM10, PM2.5, SO2, NO2, and O3 are µg m−3, whereas that for CO is mg m−3.
Atmosphere 09 00074 g003
Figure 4. Seasonal variation in air pollutants in Chengdu during 2014–2016. The units for PM10, PM2.5, SO2, NO2 and O3 are µg m−3, whereas that for CO is mg m−3.
Atmosphere 09 00074 g004
Figure 5. Monthly variations in PM10, PM2.5, SO2, NO2, O3, and CO. The horizontal solid lines indicate the median and the filled squares indicate the mean, and range where the top and bottom of the box indicate the 75th and 25th percentiles, respectively. The top and bottom whiskers indicated the maximum and minimum values, respectively.
Atmosphere 09 00074 g005
Table 1. Basic details of the 23 ambient air automatic monitoring stations in Chengdu.
SiteLatitudeLongitudeAMSL 1SRH 2SettingsAdministrativeValidity Data Rates (%) 3
Code(°N)(°E)(m)(m)DivisionsPM10PM2.5SO2NO2O3CO
S130.685104.07365095GroundJinniu District98.998.998.898.198.398.8
S230.7236103.972851615RoofJinniu District98.498.498.298.497.398.7
S330.6306104.11224875GroundJinjiang District99.899.399.899.399.399.7
S430.6872104.175652615RoofChenghua District99.598.999.899.598.999.7
S530.6578104.053945615RoofQingyang District98.799.198.898.398.499.2
S630.6544104.02614506GroundQingyang District99.098.699.599.698.699.5
S730.5706104.079457815RoofWuhou District99.398.699.199.398.499.0
S830.6322104.057547512RoofWuhou District95.694.594.791.294.495.0
S930.8875104.252547515RoofQingbaijiang District97.697.497.797.097.097.9
S1030.5589104.27255277GroundLongquanyi District97.498.598.598.397.498.8
S1130.8225104.156744920RoofXindu District96.096.097.997.797.398.7
S1230.7489103.8653610RoofWenjiang District97.196.897.997.496.497.6
S1330.8631103.874455618RoofPidu District97.397.995.997.497.298.6
S1430.5958103.90144978GroundShuangliu District94.494.496.396.295.795.1
S1530.5225104.05784719RoofShuangliu District96.798.197.697.697.099.0
S1630.6347103.65475336GroundChongzhou City97.797.998.298.597.498.4
S1730.9969103.948165415RoofPengzhou City97.998.198.298.197.298.2
S1830.4175103.438350014RoofQionglai City98.798.797.699.298.198.5
S1930.2006103.527851810RoofPujiang County98.797.498.498.598.698.2
S2030.4133103.821741617RoofXinjin County97.096.597.297.296.296.9
S2130.8672104.411447819RoofJintang County97.797.897.097.696.998.2
S2230.5867103.6254715RoofDayi County98.999.099.599.699.299.7
S2330.9908103.657568320RoofDujiangyan City99.999.999.999.999.799.7
1 Above mean sea level; 2 Sampling relative altitude; 3 The O3 observation period of S19–S23 was the same as that of the CO observation period of S19–S22: January 2015 to December 2016 (i.e., 731 days).
Table 2. Air pollutant standards for urban areas set by China and the World Health Organization (WHO) (the units for PM10, PM2.5, SO2, NO2 and O3 are µg m−3, whereas that for CO is mg m−3).
ItemsAverage TimeChina’s NAAQS-2012 1WHO 2 Guideline
PM10Daily15050
Annual7020
PM2.5Daily7525
Annual3510
SO2Daily15020
Annual60-
NO2Daily80-
Annual4040
O38-h160100
CODaily4-
1 MEP (2012a); 2 WHO (2005).
Table 3. Analysis of the relationships between air pollutants and meteorological factors based on Pearson’s correlation coefficients. The correlations are expressed as Pearson’s correlation coefficient, where “*” and “**” denote significant correlations at p < 0.05 and p < 0.01 (two-tailed), respectively. AWs, MWs, S, T, RH, R, and P denote the daily average wind speed, daily maximum wind speed, sunshine duration, daily mean temperature, relative humidity, daily precipitation amount, and surface pressure, respectively.
Items AWsMWsSTRHRP
(m/s)(m/s)(h)(°C)(%)(mm)(hPa)
PM10r−0.096−0.029−0.104−0.248 **0.145 *−0.1200.175 *
p0.1830.6840.1490.0000.0430.0930.014
PM2.5r−0.119 *−0.131 *−0.176 **−0.324 **0.136 *−0.111 *0.206 **
p0.0250.0130.0010.0000.0100.0360.000
O3r−0.029−0.0990.1610.197 *−0.174−0.117−0.156
p0.7650.3080.0950.0400.2240.2240.105

