Article

Spatiotemporal Distribution of Satellite-Retrieved Ground-Level PM2.5 and Near Real-Time Daily Retrieval Algorithm Development in Sichuan Basin, China

1
Key Laboratory of Wetland Ecology and Environment, Northeast Institute of Geography and Agroecology, Chinese Academy of Sciences, Changchun 130102, China
2
Center for Spatial Information Science and Systems, George Mason University, Fairfax, VA 22030, USA
3
Faculty of Geosciences and Environmental Engineering, Southwest Jiaotong University, Chengdu 610031, China
*
Authors to whom correspondence should be addressed.
Atmosphere 2018, 9(2), 78; https://doi.org/10.3390/atmos9020078
Submission received: 18 November 2017 / Revised: 17 February 2018 / Accepted: 19 February 2018 / Published: 22 February 2018
(This article belongs to the Section Air Quality)

Abstract

:
Satellite-based monitoring can retrieve ground-level PM2.5 concentrations with higher-resolution and continuous spatial coverage to assist in making management strategies and estimating health exposures. The Sichuan Basin has a complex terrain and several city clusters that differ from other regions in China: it has an enclosed air basin with a unique planetary boundary layer dynamic which accumulates air pollution. The spatiotemporal distribution of 1-km resolution Aerosol Optical Depth (AOD) in the Sichuan Basin was retrieved using the improved dark pixel method and Moderate Resolution Imaging Spectroradiometer (MODIS) data in this study. The retrieved seasonal AOD reached its highest values in spring and had the lowest values in autumn. The higher correlation (r = 0.84, N = 171) between the ground-based Lidar AOD and 1-km resolution MODIS AOD indicated that the high-resolution MODIS AOD could be used to retrieve the ground-level PM2.5 concentration. The Lidar-measured annual average extinction coefficient increased linearly with the Planetary Boundary Layer Height (PBLH) in the range of 100~670 m, but exponentially decreased between the heights of 670~1800 m. Both the correlation and the variation tendency of simulated PBLH from the Weather Research and Forecasting (WRF) model & Shin-Hong (SHIN)/California Meteorological (CALMET) model (WRF_SHIN/CALMET) were closer to the Lidar observation than that of three other Planetary Boundary Layer (PBL) schemes (the Grenier-Bretherton-McCaa (GBM) scheme, the Total Energy-Mass Flux (TEMF) scheme and the University of Washington (UW) scheme), which suggested that the simulated the Planetary Boundary Layer Height (PBLH) could be used in the vertical correction of retrieval PM2.5. Four seasonal fitting functions were also obtained for further humidity correction. The correlation coefficient between the aerosol extinction coefficient and the fitted surface-level PM2.5 concentration at the benchmark station of Southwest Jiao-tong University was enhanced significantly from 0.62 to 0.76 after vertical and humidity corrections during a whole year. During the evaluation of the retrieved ground-level PM2.5 with observed values from three cities, Yibin (YB), Dazhou (DZ), and Deyang (DY), our algorithm performed well, resulting in higher correlation coefficients of 0.78 (N = 177), 0.77 (N = 178), and 0.81 (N = 181), respectively.

Graphical Abstract

1. Introduction

Aerosols are an essential part of atmospheric chemistry and physics, the biosphere, climate, and even human health [1,2]. The climate impact of aerosols is performed as climate forcing, which can be further divided into direct and indirect effects [3]. Moreover, epidemiological studies have also demonstrated that ambient fine particles can seriously deteriorate public health, especially for respiratory and cardiovascular diseases [4,5].
With the rapid economic development and urbanization in China, a huge amount of energy consumption and the increased use of motor vehicles have led to the frequent occurrence of serious regional haze pollution. Most of the pollution events are compound secondary pollution, which are caused by fine particles. Previous studies have shown that three primary conditions form regional haze events: the presence of massive emission sources, more static weather conditions, and complex terrain that is unsuitable for pollution diffusion [6]. The spatial distribution of haze pollution in China are further divided into several regions based on emission and pollution characteristics, i.e., the region of Beijing-Tianjin-Tangshan, the region of the Yangtze River Delta, the region of the Pearl River Delta, the region of Northeastern China, and the region of the Sichuan Basin [7].
Unlike the geomorphology of the plains and deltas in other regions, the Sichuan Basin is surrounded by mountains and is located in the leeward slope of the Qinghai-Tibet Plateau. The atmospheric layer is stable and it is easy to form an inversion layer. Thus, widespread and long continuous fog and haze pollution frequently occurs over this region. However, there are only limited ground-based monitoring stations located in Sichuan Province, and cannot reflect the spatial and temporal distribution of particulate concentrations during the polluted period, while the remote sensing retrieved particulate concentrations can provide more information to overcome these monitoring deficiencies. Considering the hygroscopicity of particulate matter and vertical distribution, AOD can be reasonably converted to the ground-level particulate concentration via the usage of the boundary layer height and the hygroscopic growth factor. Over recent years, satellite remote sensing retrieved ground level particulate matter concentration has been studied over the world. Hoff and Christopher [8] systematic reviewed the related 30 studies that had addressed on the usage of MODIS or Multi-angle Imaging SpectroRadiometer (MISR) AOD to assess ground-based particulate concentrations during 2001 to 2007. Gupta et al. [9] obtained a simple linear relationship between the daily mean MODIS AOD and particulate matter mass, and their correlation coefficient was 0.96 over 26 locations in the world. Donkelaar [10] also found significant agreement between satellite-derived and ground-based measured values outside North America and Europe (r = 0.9; n = 210). Nicolantonio [11] showed that the correlation coefficient of MODIS AOD and PM concentration was 0.87 by employing the mixing height and relative humidity from the MM5 (Mesoscale Model Version 5) in Northern Italy. The relationship between ground-level PM2.5 concentrations and the average of MODIS and MISR AOD was further invested in North America (r = 0.89) and elsewhere (r = 0.91) [12]. Significant spatial variation of annual mean ground-level PM2.5 concentration with remote-sensed PM2.5 from MODIS (r = 0.83) and MISR (r = 0.76) over North America was also reported in Donkelaar [13]. A similar study also reviewed that the MODIS (r = 0.82) and MISR (r = 0.85) had overall comparable correlations to the ground-level PM2.5 concentration in Xi’an, Shaanxi Province [14]. Recently, the major research trends in PM2.5 inversion are focused on the usage of high resolution retrievals [15] and/or how spatial resolution impacts AOD/PM2.5 relationship [16] and the development of mixed effect models with incorporated land use parameters [17,18]. Donkelaar [17] applied a Geographically Weighted Regression (GWR) to estimate that inversion of the PM2.5 concentration were highly consistent (r = 0.9) with PM2.5 concentrations from monitors. Ma also predicted PM2.5 concentrations using the GWR model with different meteorological parameters (e.g., boundary level height, temperature, and relative humility) and land use information with Terra MODIS, Aqua MODIS, and MISR AOD data in China (r ranged from 0.73 to 0.84). Lyapustin [19] developed a Multi-Angle Implementation of Atmospheric Correction (MAIAC) algorithm for MODIS to retrieve AOD at 1 km resolution. Chudnovsky [15] showed that the higher spatial resolution of satellite image was essential to improving PM2.5—AOD agreement, namely the correlation between PM2.5 and AOD decreased significantly when AOD resolution coarsened. The authors also innovatively revealed that higher spatial resolution was essential to detect spatial heterogeneity in aerosol loadings and in ground-level PM concentrations at a sub-10 km scale, especially for the urban area. This spatial variability of retrieval PM2.5 concentrations within the urban domain was depending on the regional pollution levels and wind speed. It is possible that the wind speed affected on the boundary layer structure, and indirectly affected ground-level PM2.5 concentrations. Therefore, this paper will consider the PBLH correction factor to eliminate this possible effect.
The atmospheric boundary layer is an important indicator for the diffusion of air pollution in the vertical direction [20]. AOD is described as the integral of extinction coefficients from the ground surface to the top of atmosphere. The extinction coefficient is obtained exactly from numerical equation solving [21], for example, it can be calculated by Mie scattering theory for spherical particles [22] and/or be calculated with the T-matrix method [23] and Discrete Dipole Approximate (DDA) method for non-spherical particles [24]. Thus, the first scientific question is to fix the effect of the boundary layer height on satellite remotely retrieved PM2.5 concentration. Koelemeijer [25] demonstrated that the correlation coefficient between the PM2.5 concentration and AOD could be effectively improved from 0.3 to 0.6 by the adaption of boundary layer height and relative humidity extracted from the European Centre for Medium-Range Weather Forecasts (ECWMF) data in Europe. A correlation coefficient was also reported as 0.84 between the PM2.5 concentration from Tapered Element Oscillating Microbalance (TEOM) and AOD from ground-based sun photometer observations while considering the Lidar-derived boundary layer height correction [26]. Wang [27] indicated that the correlation between surface level aerosol extinction and AOD was improved as a result of vertical correction, with the coefficient of determination R2 increasing from 0.35 to 0.56. As above-mentioned, the boundary layer height used for vertical correction was mainly obtained from ground-based Lidar and numerical simulation. At the same time, the exported boundary layer height from the large-scale models (in degrees, e.g., ECWMF) was not enough to satisfy the higher inversion resolution (in kilometers) of satellites over the complex terrain areas. However, to our knowledge, no study had systematically compared the effects of boundary layer height from different data sources (such as the model simulation and ground-based observation) on the retrieved ground-level particulate concentrations. This will be investigated in this study.
Relative humidity is another important factor to be corrected during the particulate matter inversion from satellites as the hygroscopic properties of water-soluble substances can increase the extinction coefficient of particles [28]. Several humidity correction methods have been developed to retrieve particulate matter concentration from satellite data such as the empirical regression model [29], the semi-empirical regression model [30], the land-use regression model [31], the multiple regression model [32], the geographically weighted regression model [33], and neural network modeling [34]. In the above-mentioned studies, a hygroscopic growth factor was obtained directly from the empirical formula or regression methods. However, no studies have focused on the establishment of a relationship between the extinction coefficient and the relative humidity, which would offer a new hygroscopic growth factor to correct the humidity effect in the retrieval algorithm.
The results presented in this paper focused on comparing the effects of boundary layer height from different data sources on the retrieved ground-level particulate concentrations, and in deriving seasonal hygroscopic growth factors to correct the humidity effect from the exponential fitting method. Finally, a near real-time version of the retrieval algorithm with open-source code was introduced with uncertainty analysis.

2. Methodology

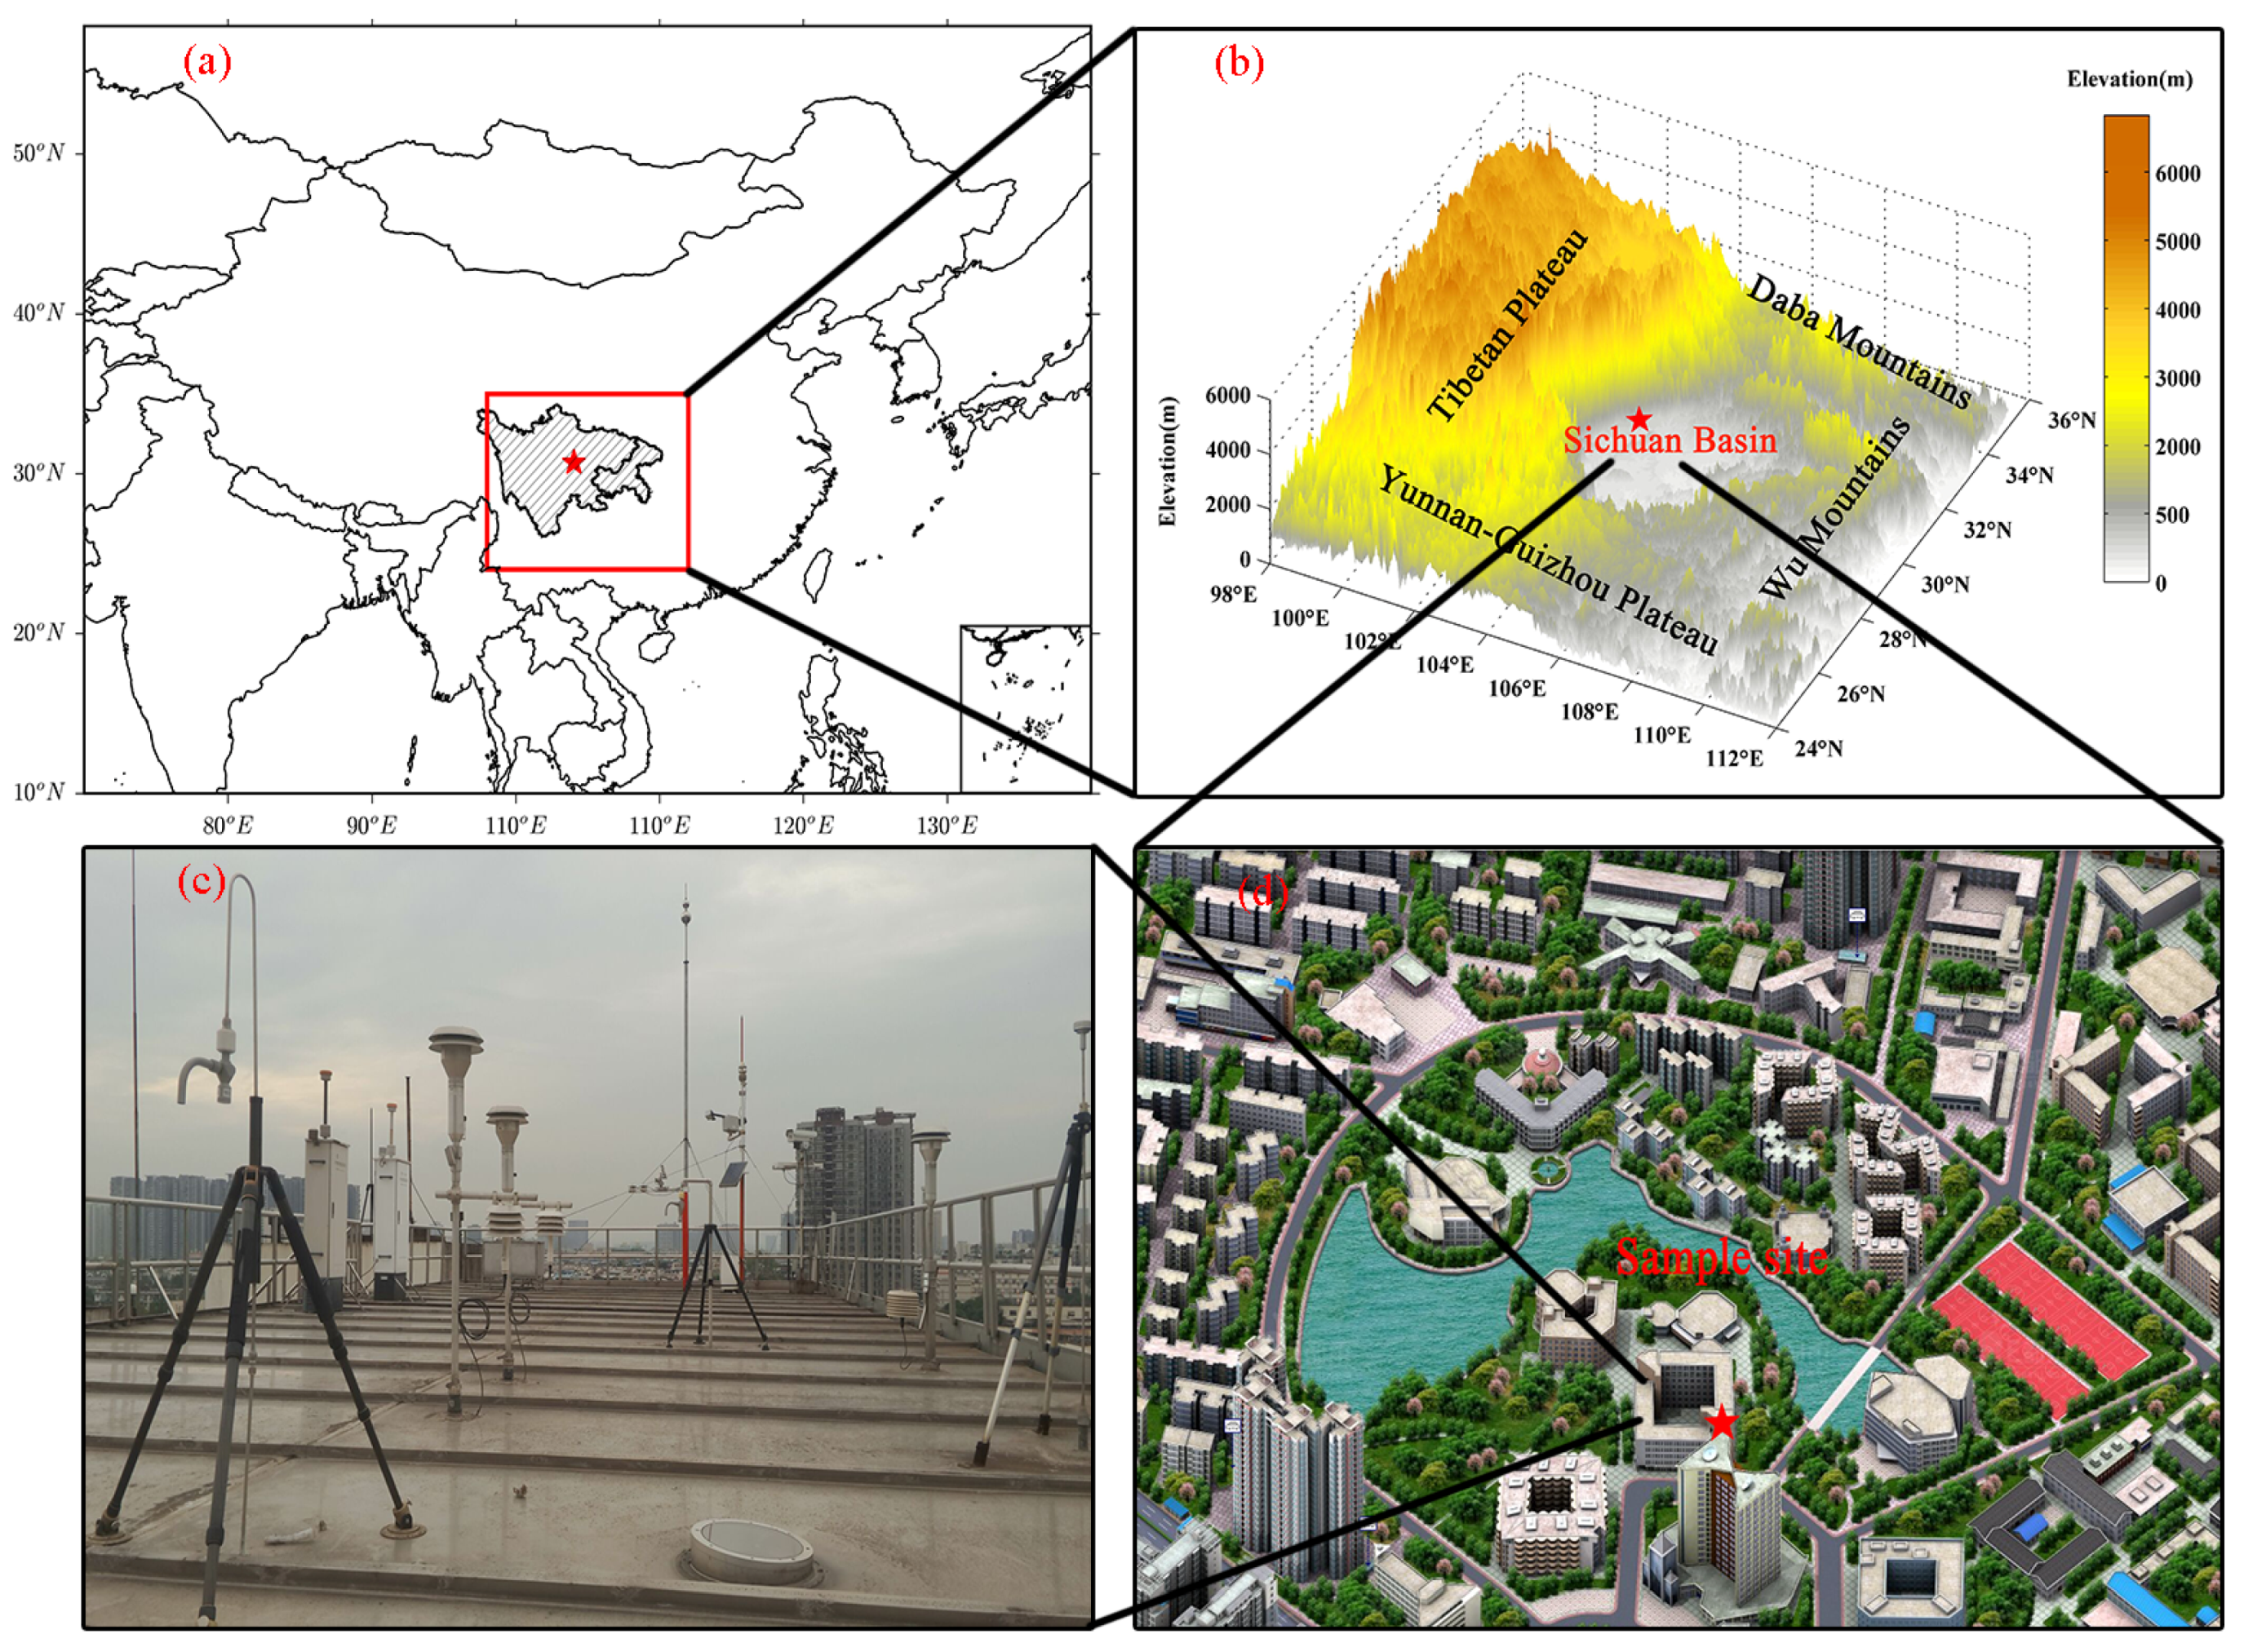
2.1. Study Area Description

The Sichuan Basin (25°~35° N, 95°~110° E) covers 260,000 km2 of lowland region in Southwestern China, which is surrounded by the Tibetan Plateau to the west, the Yunnan-Guizhou Plateau to the south, the Wu Mountains to the east, and the Daba Mountains to the north (Figure 1). The average altitude of basin is about 500 m above sea level (ASL) and is much lower than the surrounding mountains (with elevations of 1~3 km ASL). The basin is anchored by the metropolitans of Chengdu-Chongqing, which has a population of approximately 100 million. With accelerated urbanization, intensely emitted atmospheric pollutants and unfavorable diffusion conditions [35] ultimately form regional haze pollution events. The annual PM10 concentration of Sichuan Provincial Environmental Quality Bulletin showed that a period of rapidly declining concentrations from 120 μg/m3 in 2004 to 76 μg/m3 in 2008, a period where the concentrations remained stable at around 65 μg/m3 from 2009–2011, and a period of the concentrations recovery from 67 μg/m3 in 2012 to 80 μg/m3 in 2014 [36]. The ground-level PM2.5 concentration was reported publicly after 2013, and is used in this paper.
A synergistic suite of monitoring facilities with air quality was situated on a building rooftop at the Southwest Jiao-tong University (30.69° N, 104.05° E; 30 m altitude), which is located in a suburban area of Chengdu. The instruments included a Micro Pulse Lidar (MPL, wavelength at 532 nm; pulse energy at 6~8 μJ; repetition rate at 2500 Hz; Diameter at 178 mm; Enviro Technology Services, London, UK), a Sun-photometer (CIMEL CE-318, wavelength at 532 nm; Cimel Electronique S.A.S, Paris, France), a visibility sensor (FD12P), a semi continuous OC/EC analyzer (SUNSET RT-4, Sunset Laboratory Inc., New York, NY, USA), a meteorological station (FRT-X2), and an automatic air quality monitoring station, for analyzing in situ samples for PM2.5 and PM10 concentrations (Beta Attenuation Particulate Monitor (BAPM), MetOne-1020; Met One Instruments’ service, New York, NY, USA) and gases (NOX/NO/NO2, CO, SO2, O3, Hydrocarbons/Total VOC and Benzene).
The vertically worked MPL recorded a group of data every 3–4 min with a detecting range of 30 km and a resolution of 15 m. Only the AOD, extinction coefficient, and PBLH (which extracted the recorded MPL data and PM2.5 concentration from BAPM, and even the observed relative humidity) from the meteorological station were adapted for further analysis in this study.
Of all the monitored parameters, the daily PM2.5 concentrations and relative humidity were collected from the meteorological station per minute. The vertically worked MPL recorded a group of data every 3–4 min with a detecting range of 30 km and a resolution of 15 m. Only the AOD, extinction coefficient, and PBLH were extracted from the recorded data for further analysis in this study.

2.2. Data Sources

During the study, the MODIS Level 1 Radiometric and Geolocation data covering the Sichuan basin were collected through the Level-1 and Atmosphere Archive and Distribution System (LAADS). Both MODIS Terra and Aqua L1B data (MOD/MYD021KM, Collection 5) with 1 km × 1 km resolution were used to retrieve the AOD and water vapor in this study.
The Weather Research and Forecasting (WRF) model (version 3.6.1) and the California Meteorological (CALMET) model (version 6.5.0) were used to calculate the boundary height. The 1° × 1° of National Centers for Environmental Prediction Final (NCEP FNL) data were used as WRF input data and were downloaded from the Computational and Information Systems Laboratory at the National Center for Atmospheric Research. An additional tool of CALWRF was used to read the WRF model output data and create a 3D.DAT file for the WRF/CALMET.
The extraction and preprocessing of ground-level observed data were conducted according to the time of satellite passes, i.e., 10:30 a.m. for MODIS Terra and 1:30 p.m. for MODIS Aura. All the above-mentioned data were collected from 1 November 2013 to 31 October 2014.

2.3. Data Analysis and Retrieval Algorithm Development
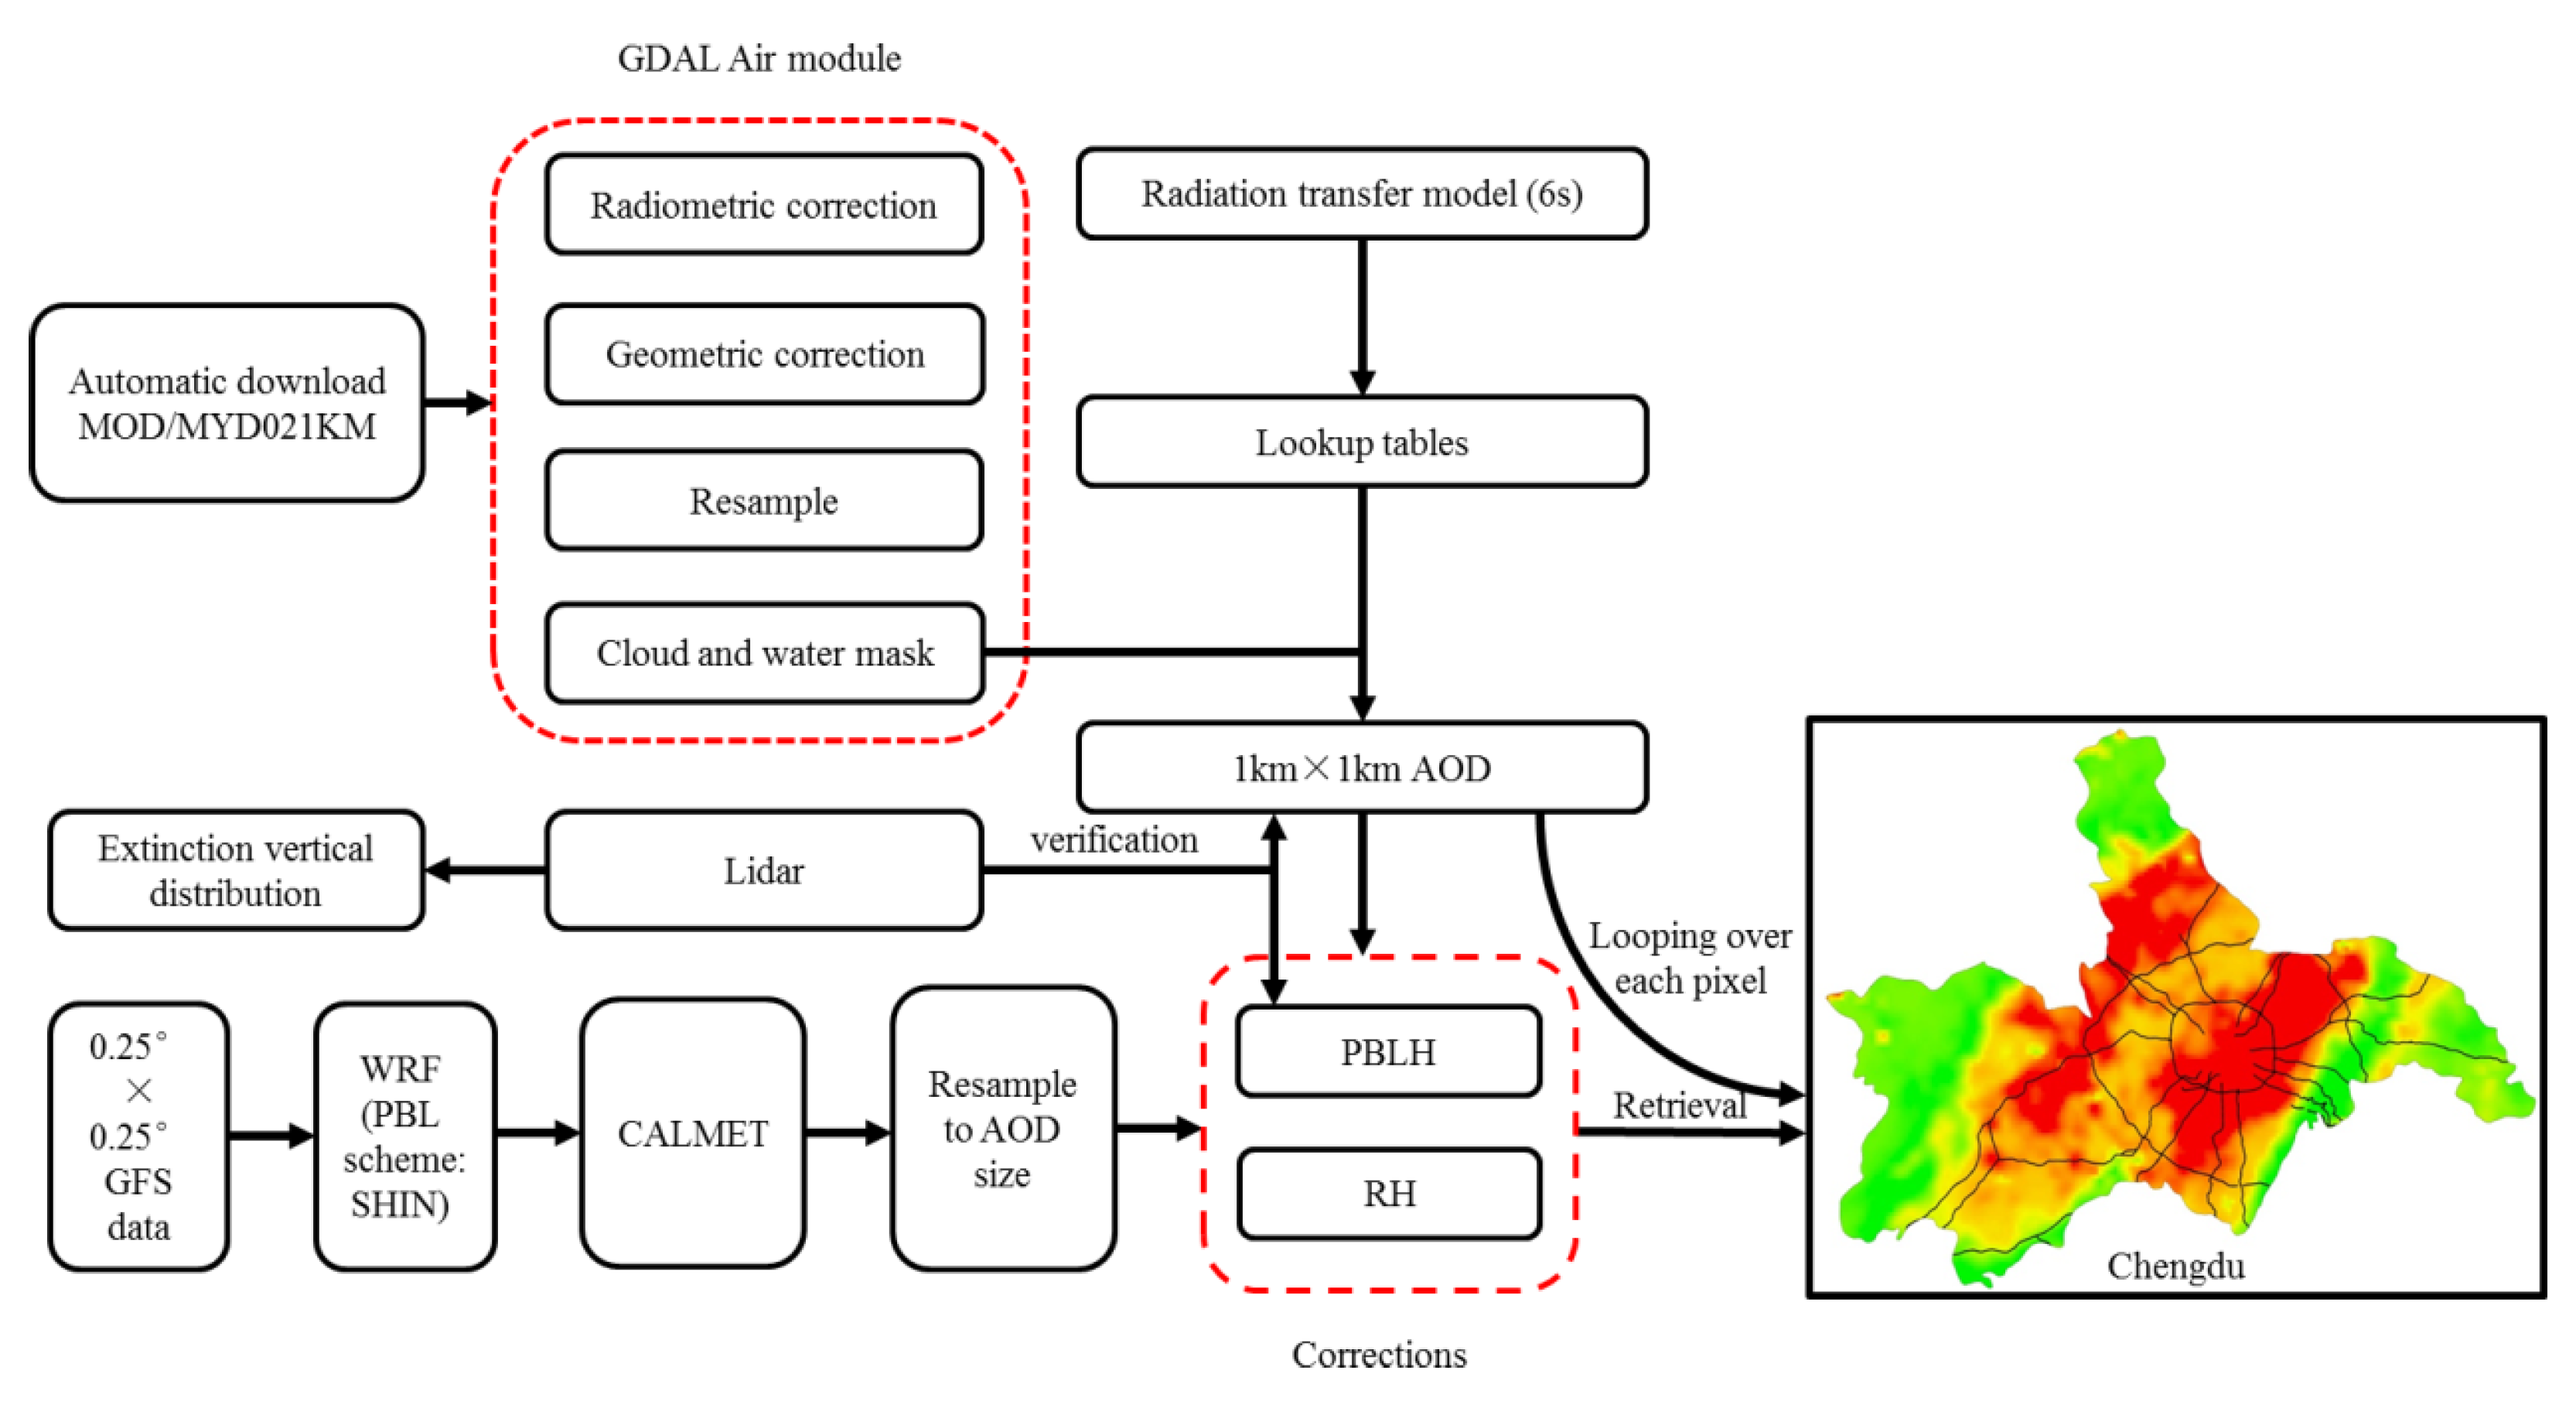
Before build the relationship between satellite AOD and ground-based measured PM2.5 concentrations, the improved dense dark vegetation (DDV) algorithm [37] with calculated lookup tables (LUTs, built from the radiation transfer model) was adapted to retrieve the aerosol optical depth over the Sichuan Basin. First, all downloaded Terra/Aqua L1B data were performed with radiometric correction, geometric correction, and cloud mask. Then, the AOD was calculated by a linear interpolation between the observed surface reflectance with the apparent reflectance in the lookup tables. The Second Simulation of the Satellite Signal in the Solar Spectrum (6S) radiation transmission model was used to calculate the previously mentioned LUTs [38]. The contents of the H2O-vapor (g/cm2) and O3 (cm·atm) are two key parameters which are required by the 6S model. However, as the column water vapor could not be directly observed by our meteorological station, it was further calculated with the MODIS data from the 17, 18, and 19 bands [39]. The acquisition of 3-hourly column ozone content was collected from the ERA-Interim reanalysis data from the European Centre for Medium-Range Weather Forecasts (ECMWF). The modified normalized difference water index (MNDWI) method was used to distinguish water bodies from the land noise [40].
In order to retrieval the near-ground particulate concentration, vertical and relative humidity corrections needed to be further conducted.
AOD (τ) is defined as the integral of aerosol extinction along an atmospheric column from the ground to the top of atmosphere [41], and τ can be calculated by:
τ = 0 β e ( z ) d z = 0 β e ( 0 ) e z H d z = H β e ( 0 )
where H is the boundary layer height which mainly uses the Lidar and/or numerical simulation computation during the vertical correction.
The blind zone and transition zone height of incomplete after pulse correction (overlap area) is approximately 200 m [42,43]. An extinction coefficient at a height of 200 to 800 m was taken as the measured value.
WRF mainly simulates the boundary layer height through the four boundary layer parameterization schemes of GBM [44], UW [45], TEMF [46], and SHIN [47]. CALMET uses the objective analysis method to adjust for kinematic effects of terrain, slope flows, and terrain blocking effects, and calculates the boundary layer height. The column extinction coefficient was obtained from the aerosol optical thickness divided by the boundary layer height.
The aerosol chemical components chiefly consist of water-soluble substances such as sulfates, nitrates, and so on. Absorbing moisture from the atmosphere, fine particles easily reach the deliquescence point, and eventually the hygroscopic properties affect the optical properties [48], and the ratio of the water-soluble substances to the particulate mass concentration was 50.7% in Chengdu [49]. However, the extinction coefficient and relative humidity from ground monitoring were used as the estimated hygroscopic growth factor; the satellite inversion of particulate matter concentration is rarely used.
By means of the extinction coefficient and relative humidity, a method for calculating the hygroscopic growth factor in this study using the following formula [50,51]:
f ( R H ) = σ e x t ( R H ) σ e x t ( R H r e f ) = ( 1 R H 1 R H r e f ) λ
where the extinction coefficient σ e x t depends on the relative humility RH. λ is the Hänel growth coefficient, which is dependent on the aerosol property. R H r e f is the average value of relative humidity <40% for dry conditions [52].
Finally, we developed the retrieval algorithm with the following three steps to enhance the ability of diagnosis and consultation for local environmental protection agencies, and further improved our retrieval algorithm to a near real-time version with on-line produced visualization products. The workflows (Figure 2) are described as follows:
(1)
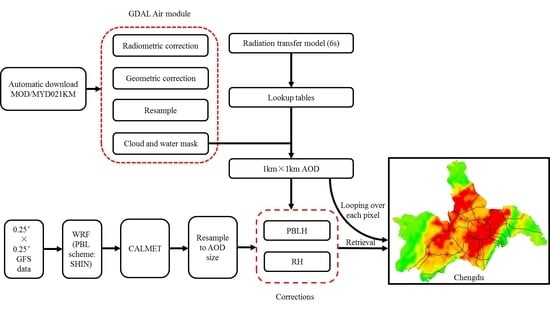
A script was used to automatically download the near real-time product from NASA. The original downloaded high-resolution MODIS product was first preprocessed via the Geospatial Data Abstraction Library (GDAL) Air module (including the radiometric and geometric corrections, resampling, and masking), then produced a high-resolution AOD product with the application of Lookup tables from the 6S radiation transmission model. At the same time, this AOD are verified by the Lidar AOD
(2)
Before conducting the retrieval of PM2.5, the regional WRF model with downscaling to 1 km resolution should be simulated with the Global Forecast System (GFS) initial forecast fields and the SHIN PBL scheme (the WRF model was set to automatically run at 6:00 a.m. of every day). The wrfout file was further used in the CALMET model, and the final output results of the gridded PBLH and RH should be resampled to the grids of the inversed high-resolution AOD product.
(3)
The PBLH from WRF_SHIN/CALMET (version information) was extracted and fitted with the vertical correction function on each pixel of the inversed AOD. The seasonal humidity correction function was also selected at the same time according to the specific date. Finally, the regional gridded PM2.5 concentrations were retrieved with vertical and humidity corrections after looping calculations over each pixel of the high-resolution AOD product.
Note that if this near real-time algorithm were to be used in other East Asian regions, we recommend the use of the humidity correction function from Song [53], which has been further verified by Tao [54].

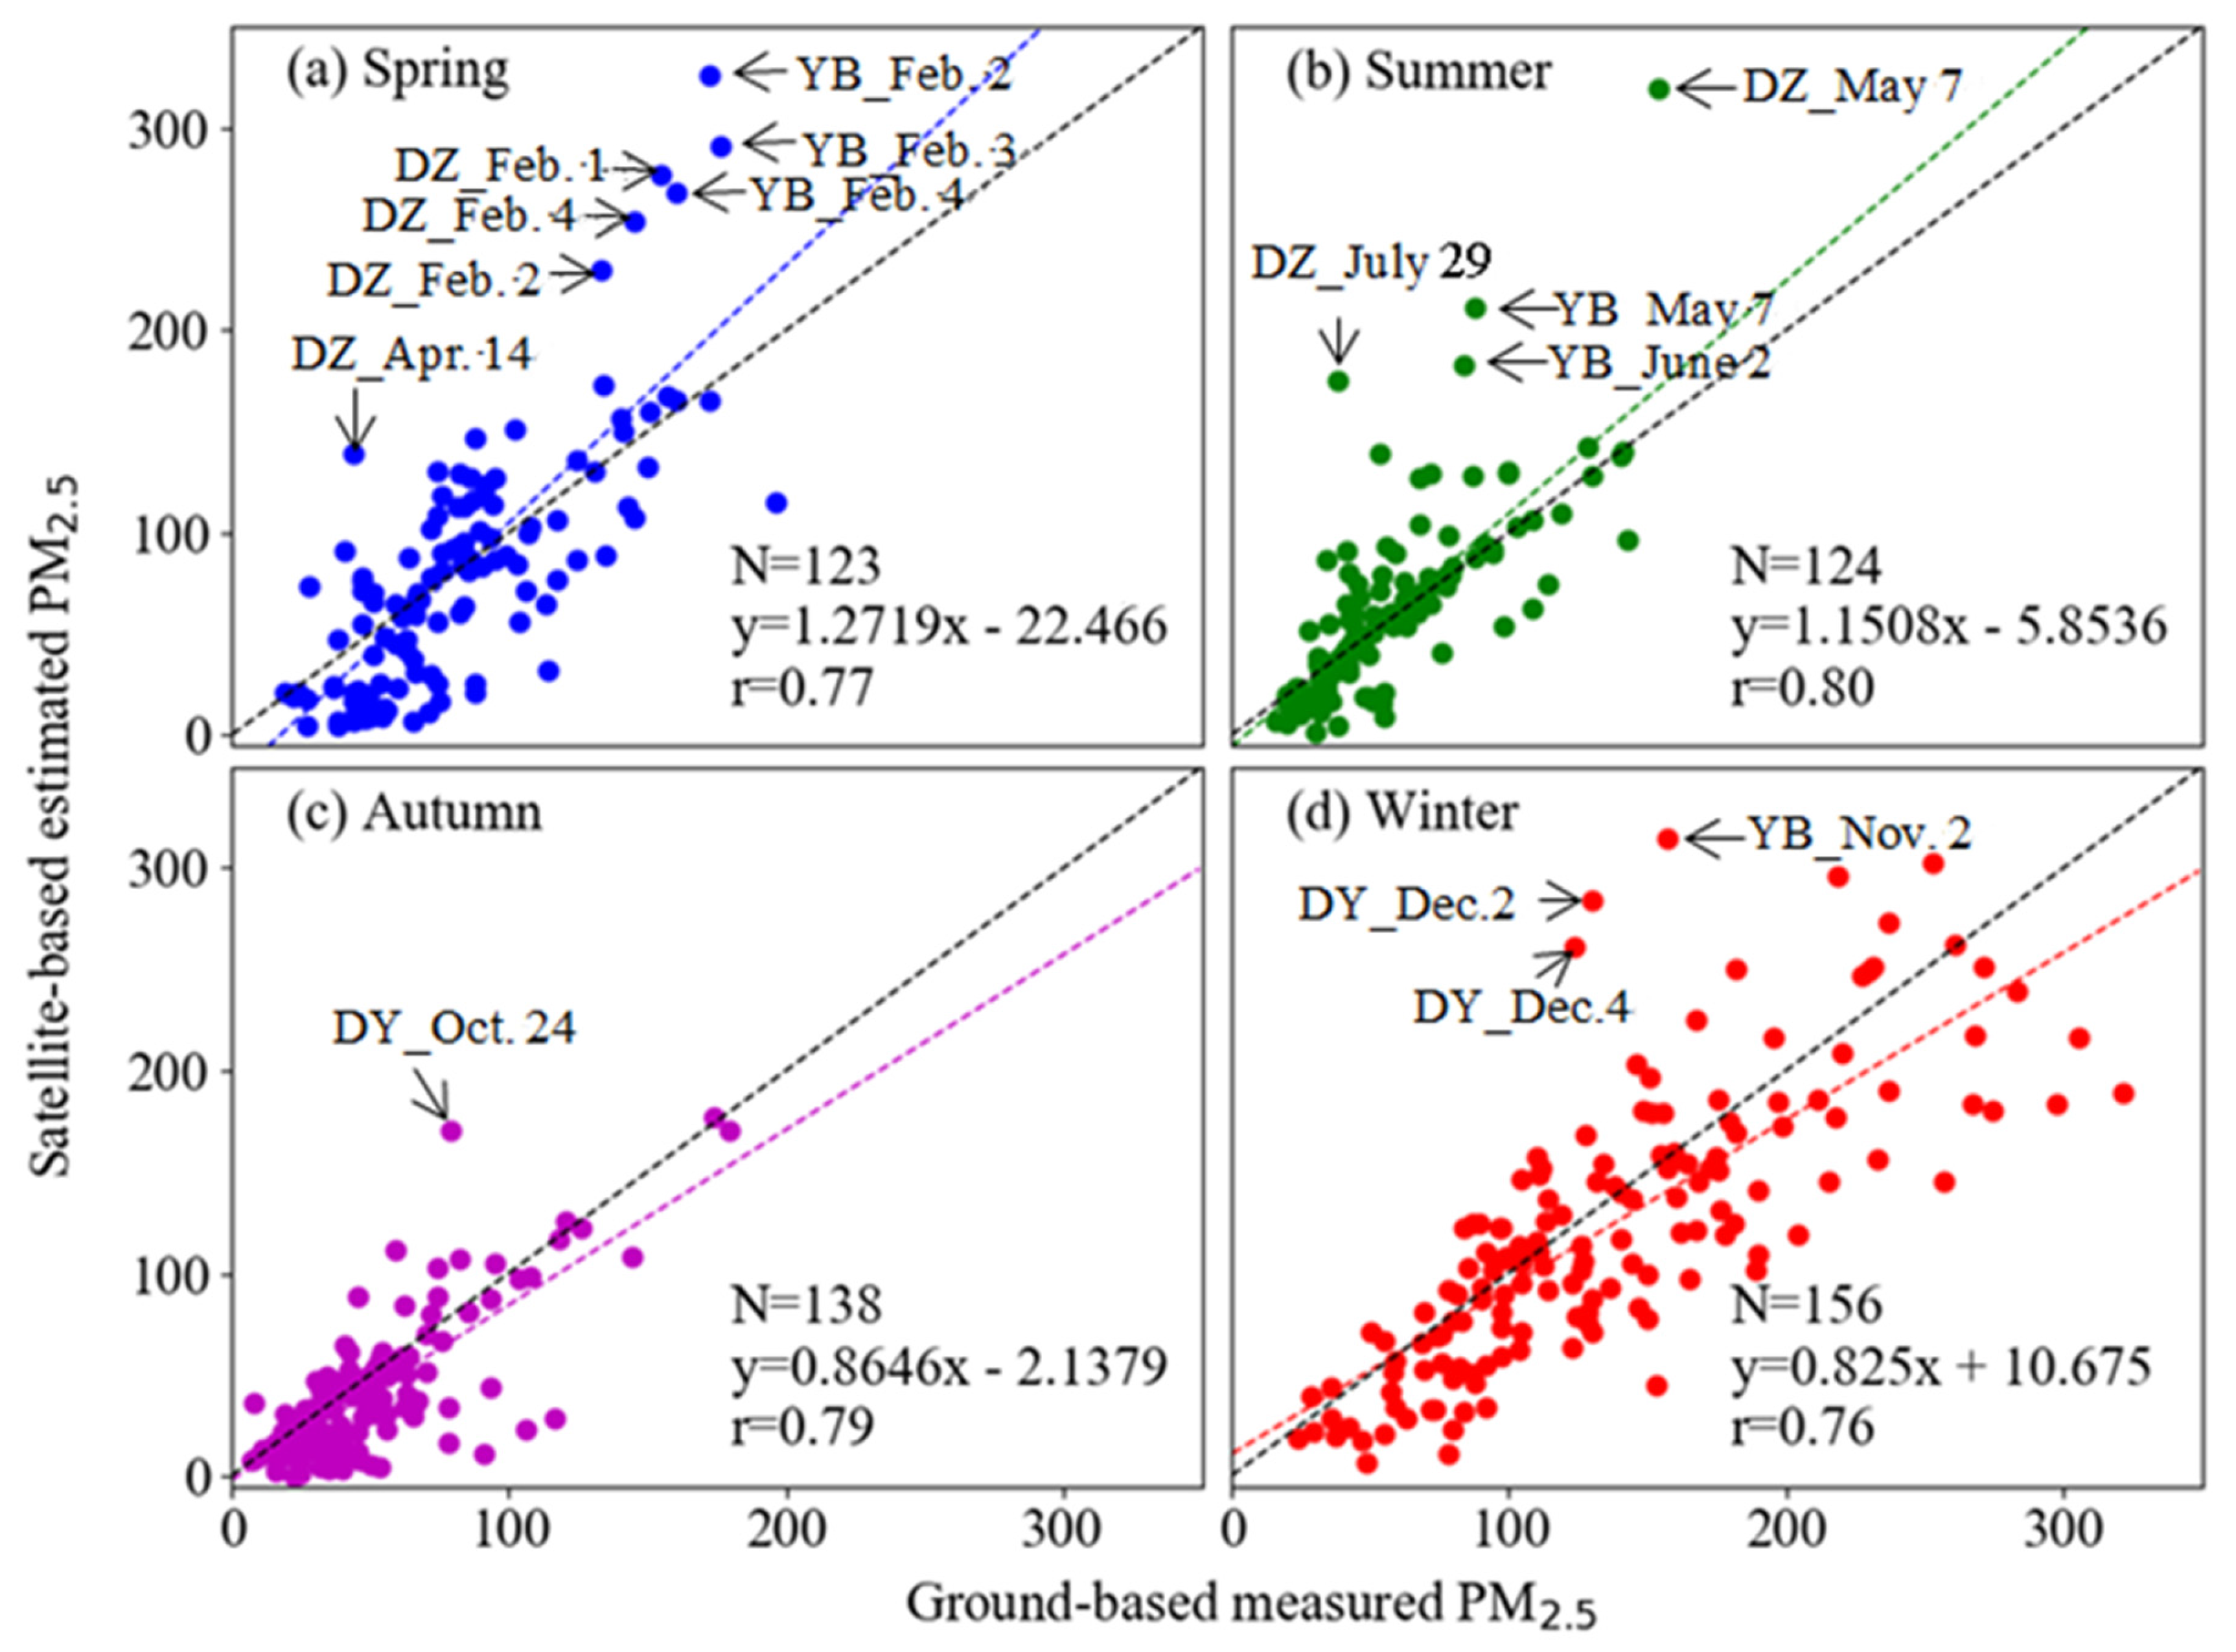
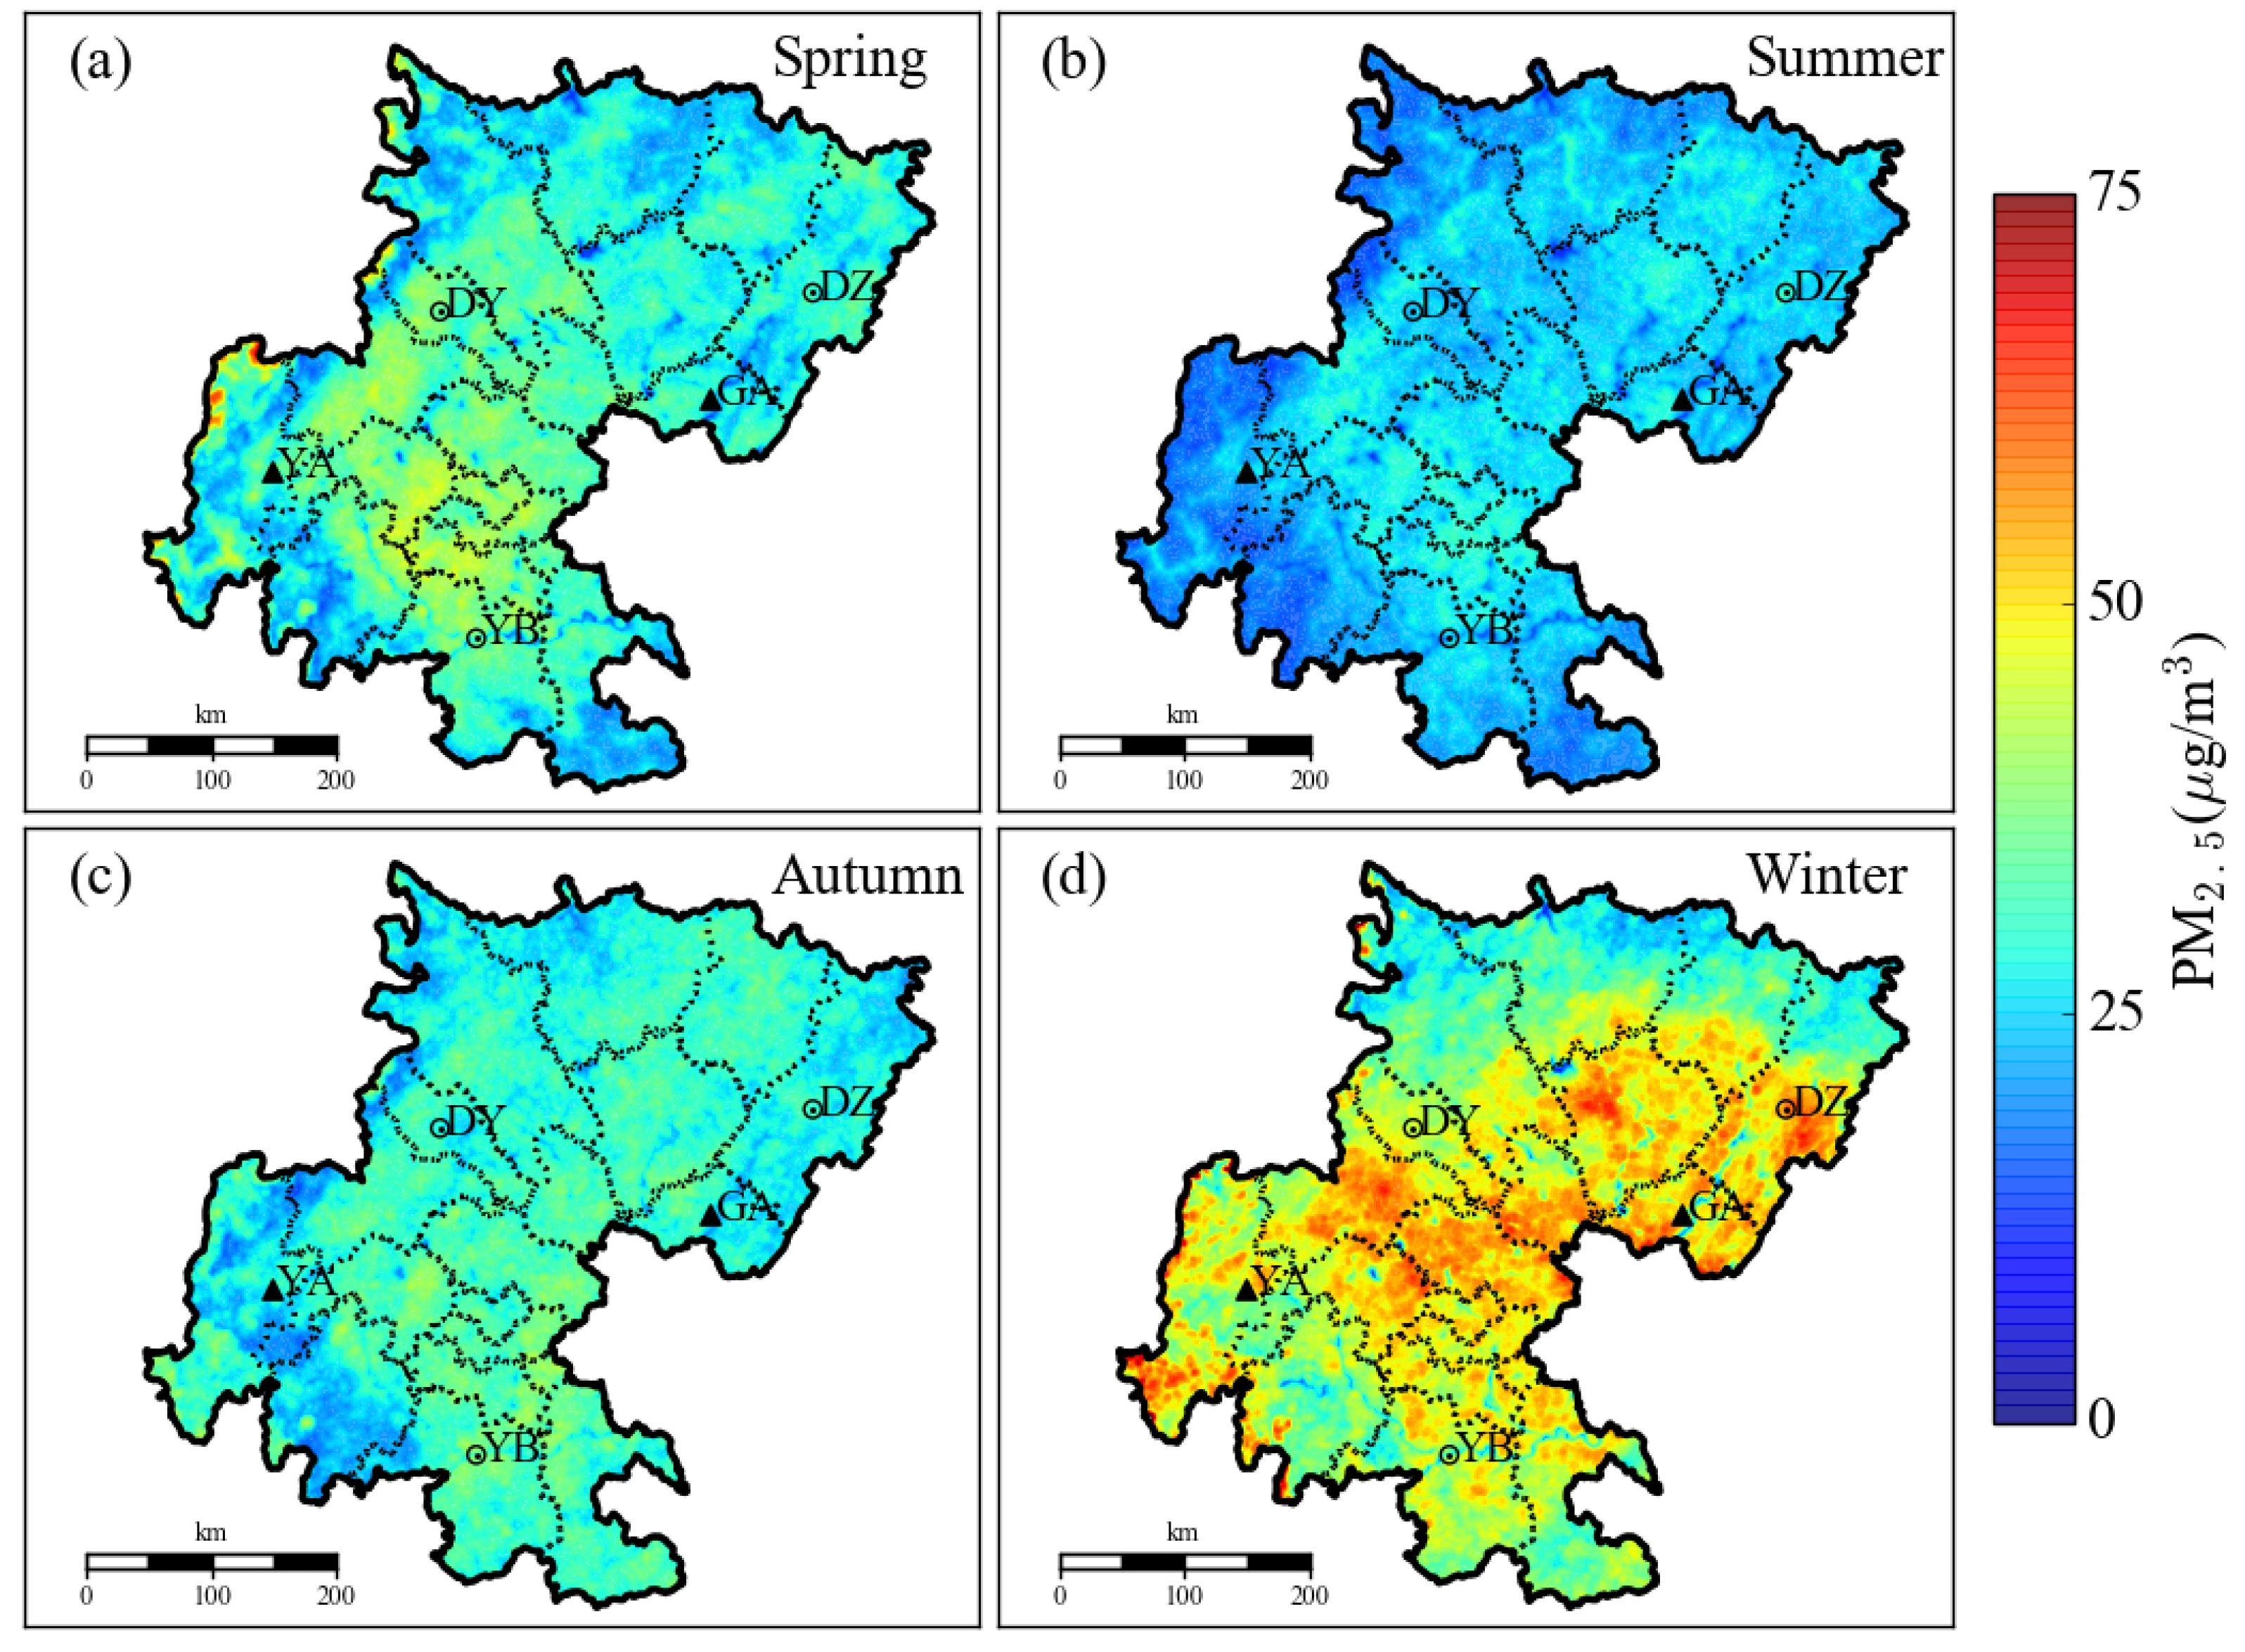
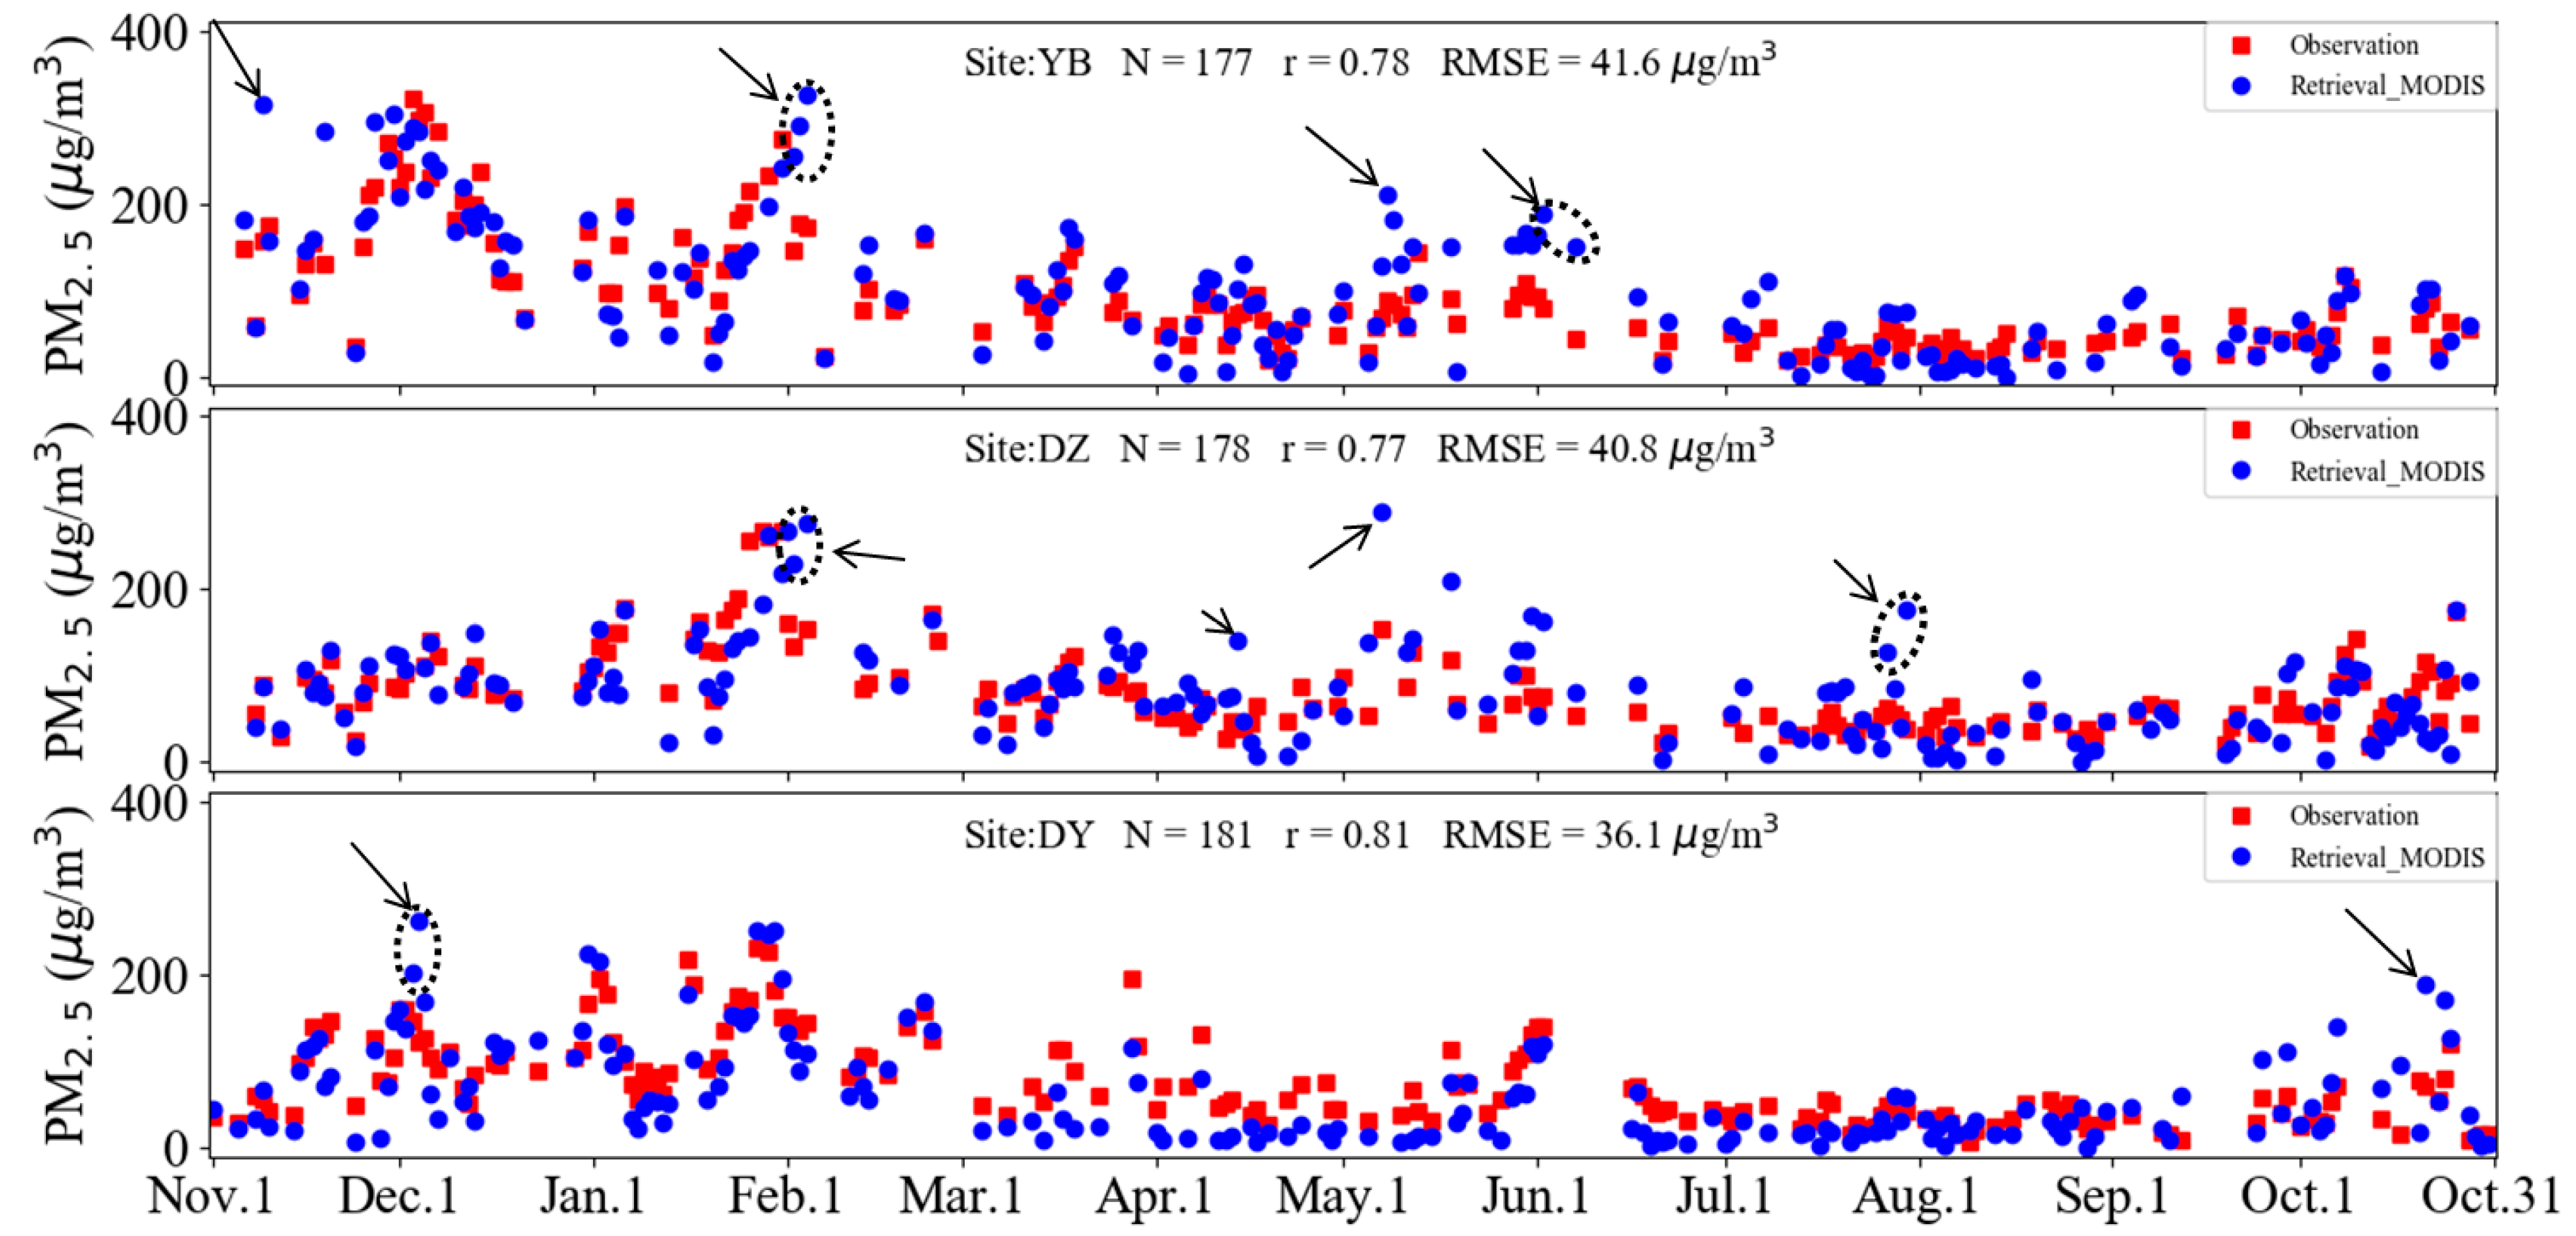
3. Results and Discussion

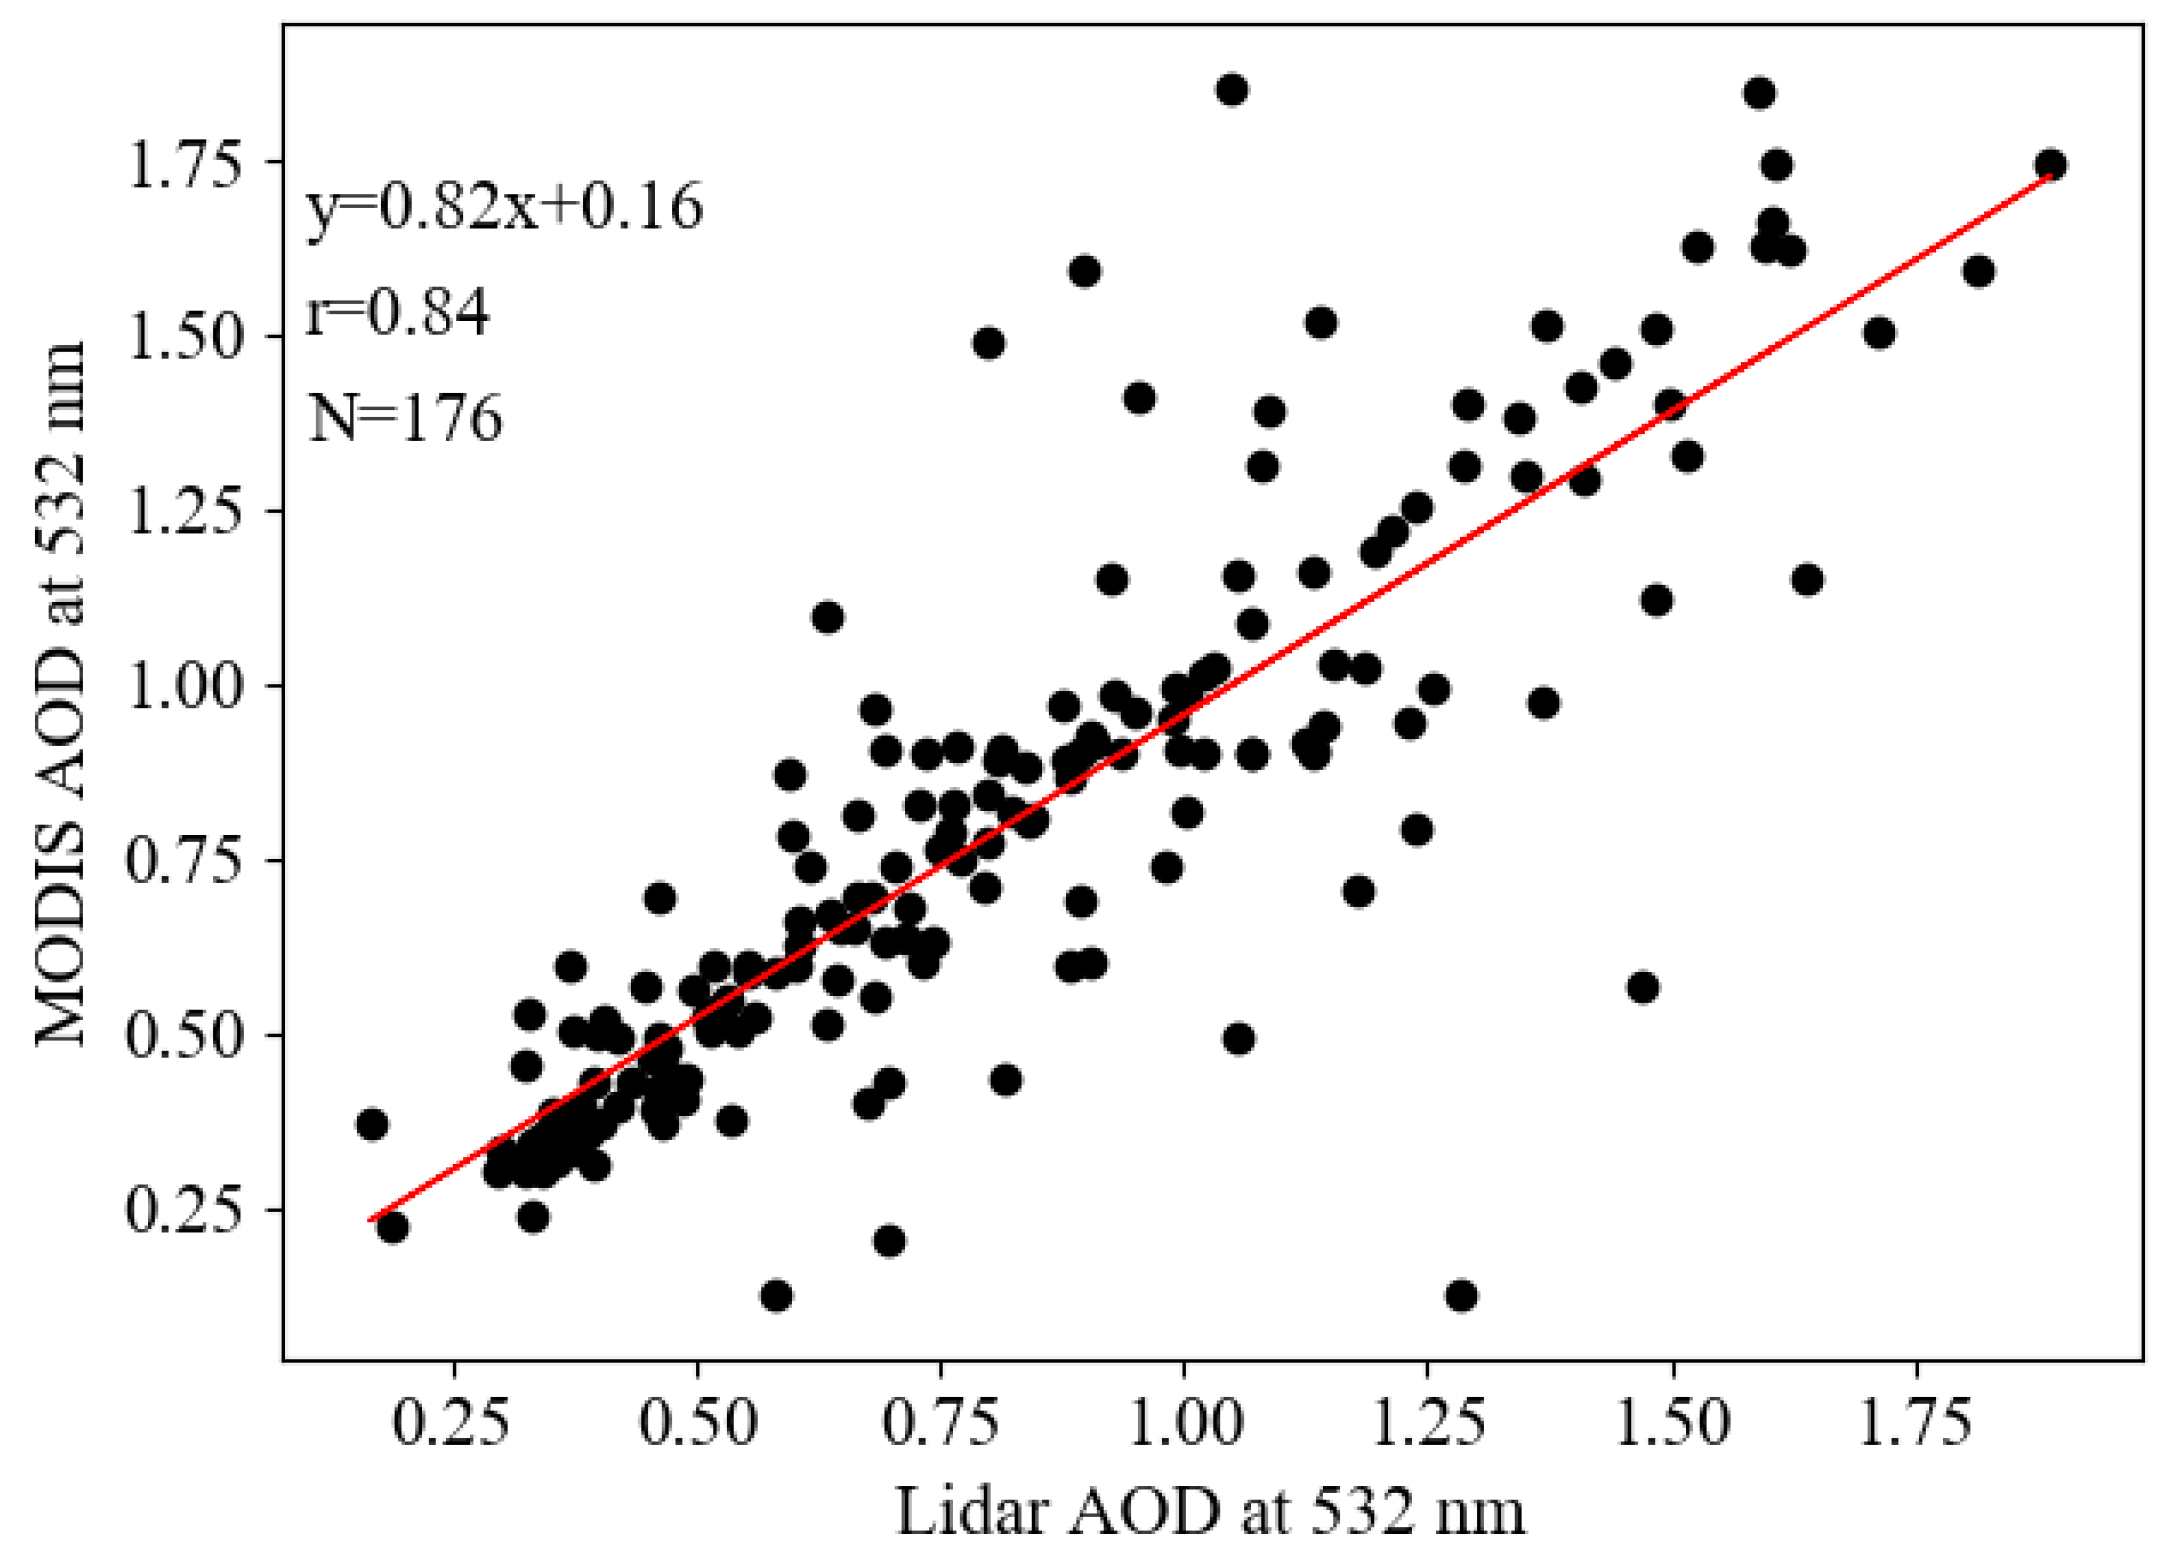
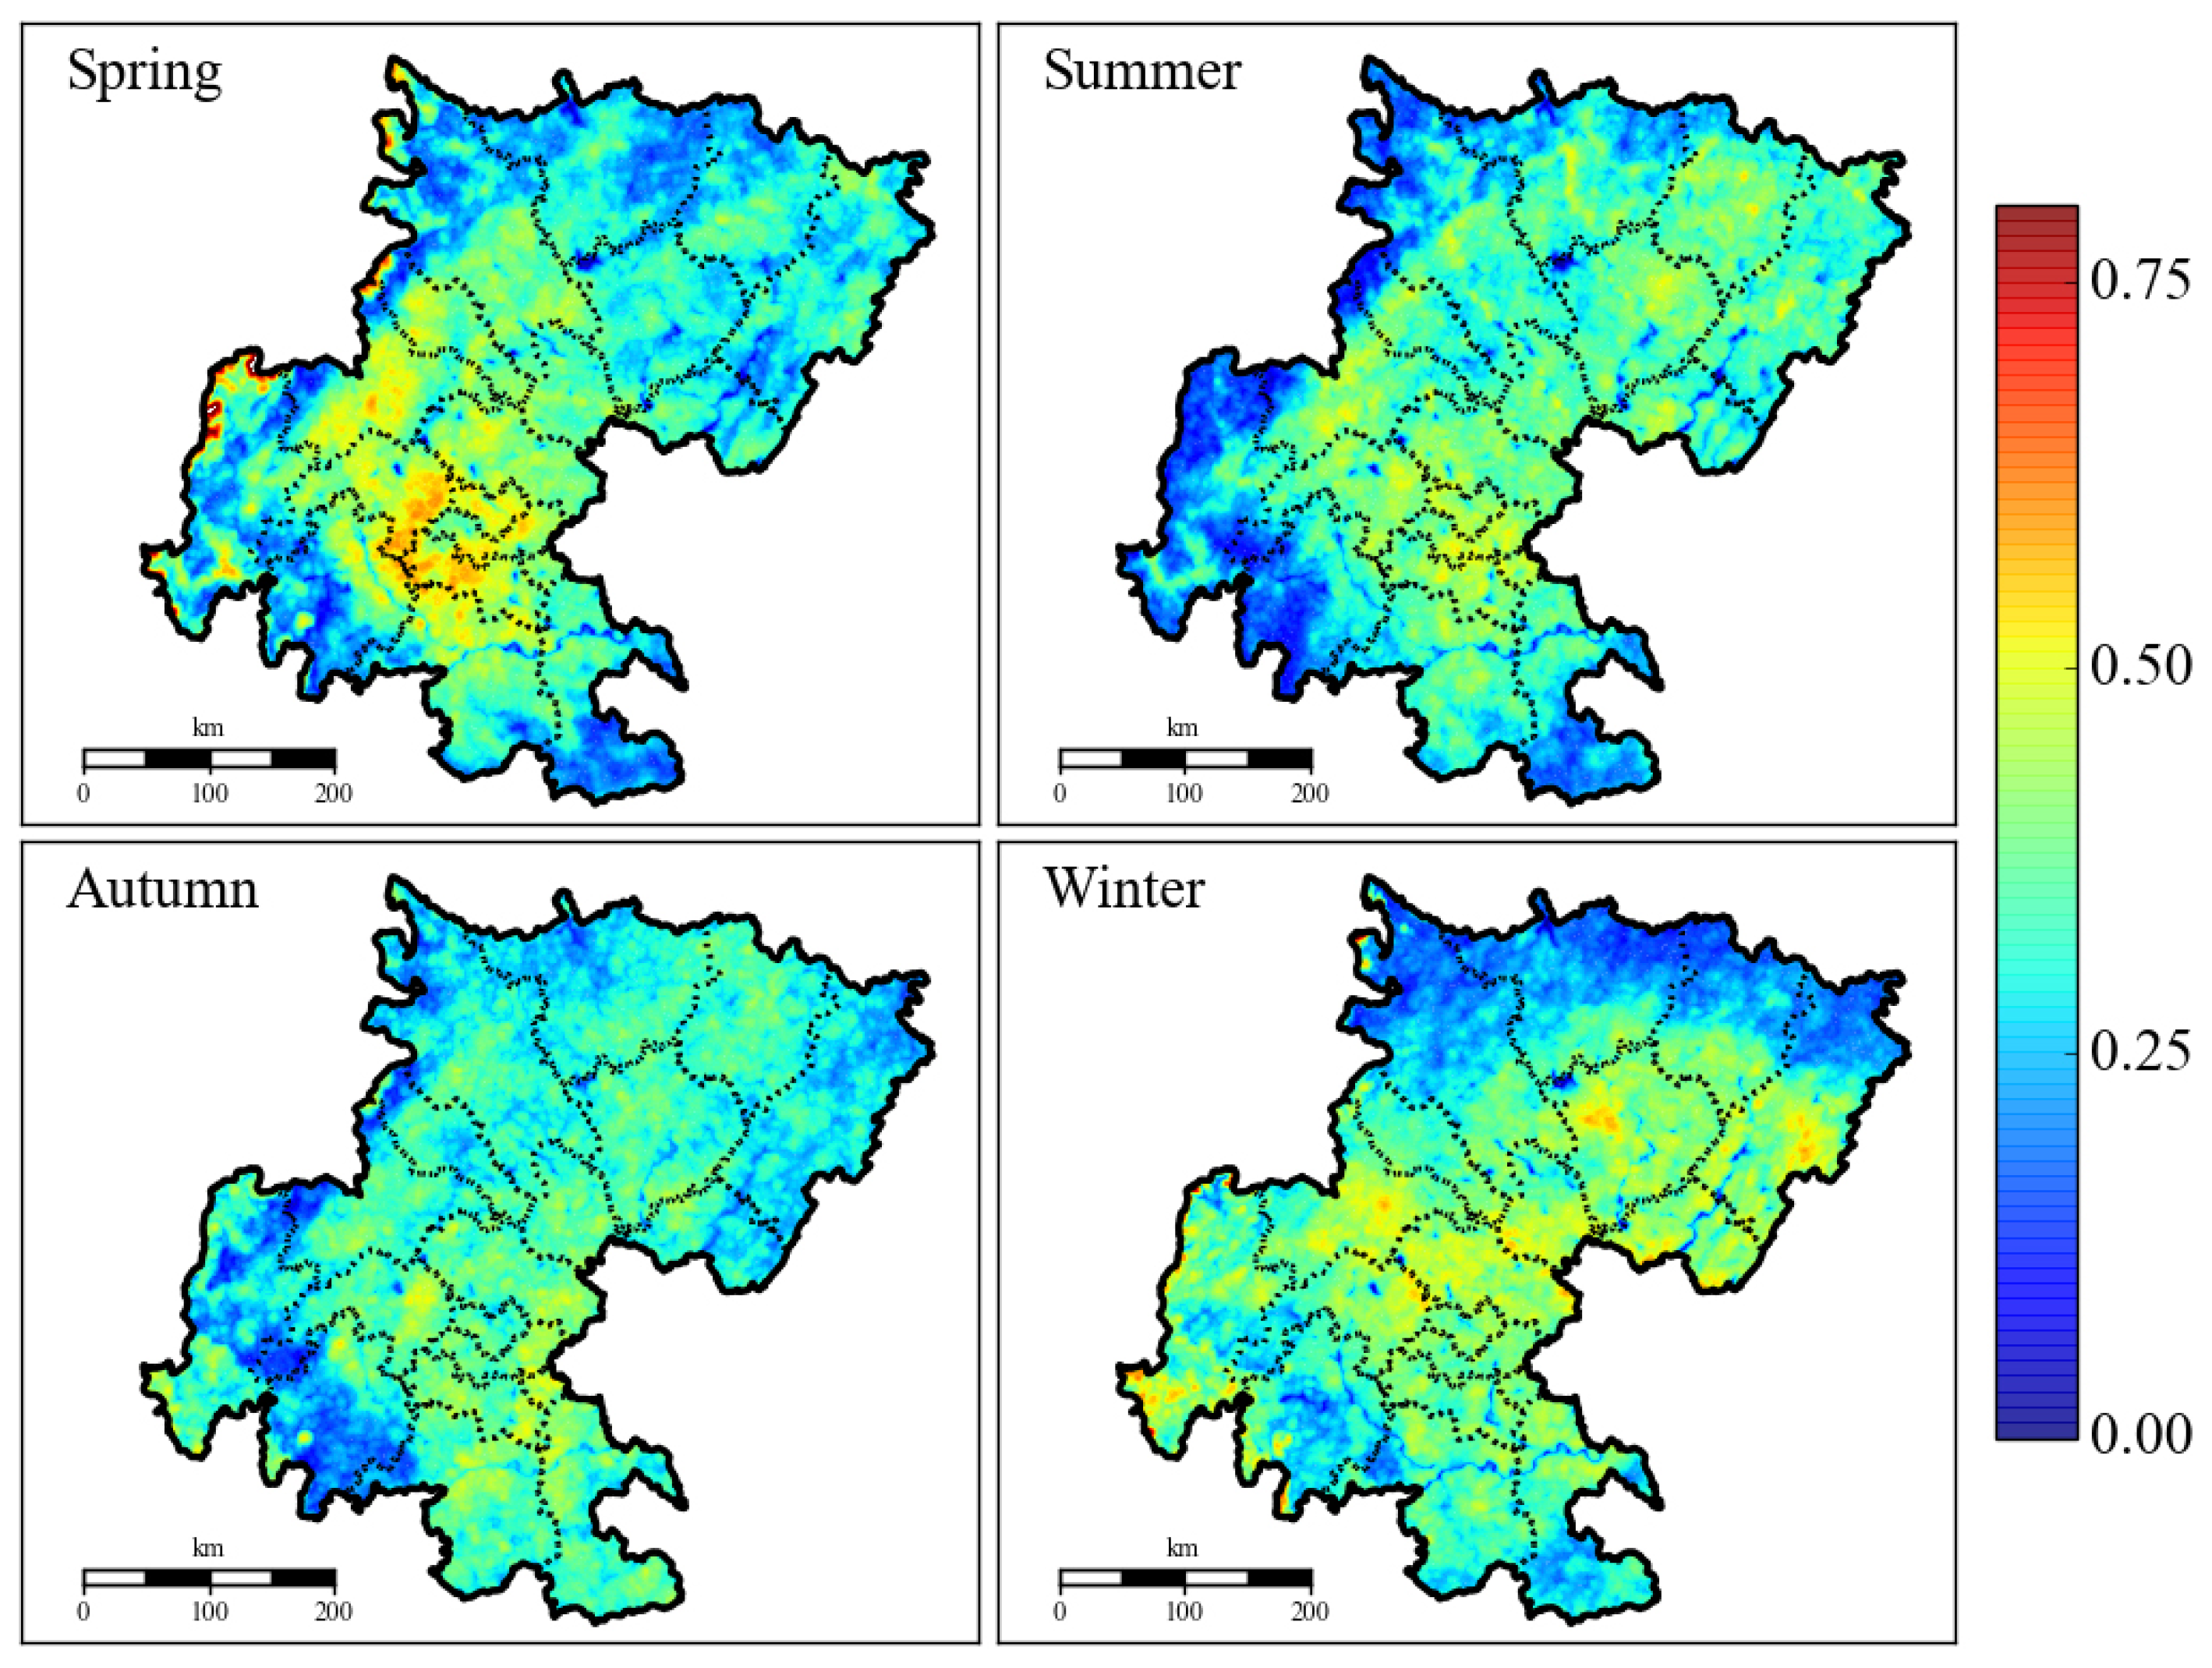
3.1. Spatial and Temporal Distribution of Retrieved AOD

The retrieved AOD distributions (1 km × 1 km) based on the DDV algorithm over the Sichuan Basin in four different seasons are explicitly illustrated in Figure 3. The retrieved results also showed that higher AOD values were distributed in the central and northeastern parts of the Sichuan Basin in winter and spring, especially for the three city groups of Chengdu-Meishan, Bazhong-Dazhou, and Zigong-Yibin-Luzhou, but had homogeneous and lower AOD distributions depicted in summer and autumn. The pattern of spatial distribution for AOD was consistent with the emission distributions of anthropogenic particulates from the Multi-resolution Emission Inventory for China (MEIC) [55], which is mainly related to the urban agglomeration of the Chengdu plain and the northeast agglomeration of industry and transportation development. The highest relative humidity and temperature were reported in July and August in the Sichuan Basin, which would enhance the formation and conversion of secondary organic aerosols (SOAs), and the AOD values presented as higher values when compared to other regions in China (e.g., Northeast China) [56,57]. Regional statistics of annual AOD over the Sichuan Basin from March 2000 to February 2010 was reported as 0.848 by MODIS Atmosphere level2 Aerosol Product with resolution 1° × 1° [56]; however, the latest study from Liu [57] showed that the annual AOD values were 0.33 for the Sichuan Basin and 0.65 for the city of Chengdu with the MODIS AOD (3 × 3 km). The revised results from high-resolution MODIS images presented as 0.29 for the Sichuan Basin and 0.57 for Chengdu, respectively.
To further verify the accuracy of the revised high-resolution AOD, the observed AOD values of ground-based scanning Lidar were collected from the super-monitoring station of Southwest Jiaotong University. As the station is located in the overland part of a suburban area, the observed Lidar AOD was dramatically varied due to the changes in meteorological factors. Thus, the ground-based Lidar data from 176 days were specifically extracted according to the satellite transit time, and the correlation between the MODIS AOD and Lidar AOD is illustrated in Figure 4. The highest correlation (r = 0.84) under the condition of 95% confidence indicated that the spatial and temporal distribution of high-resolution AOD could be applied to further retrieve the PM2.5 concentrations. A similar coefficient was also reported as 0.78 when compared to the Lidar AOD at a 1 km resolution MODIS AOD taken at the Hong Kong International Airport from January 2006 to September 2007 [58].

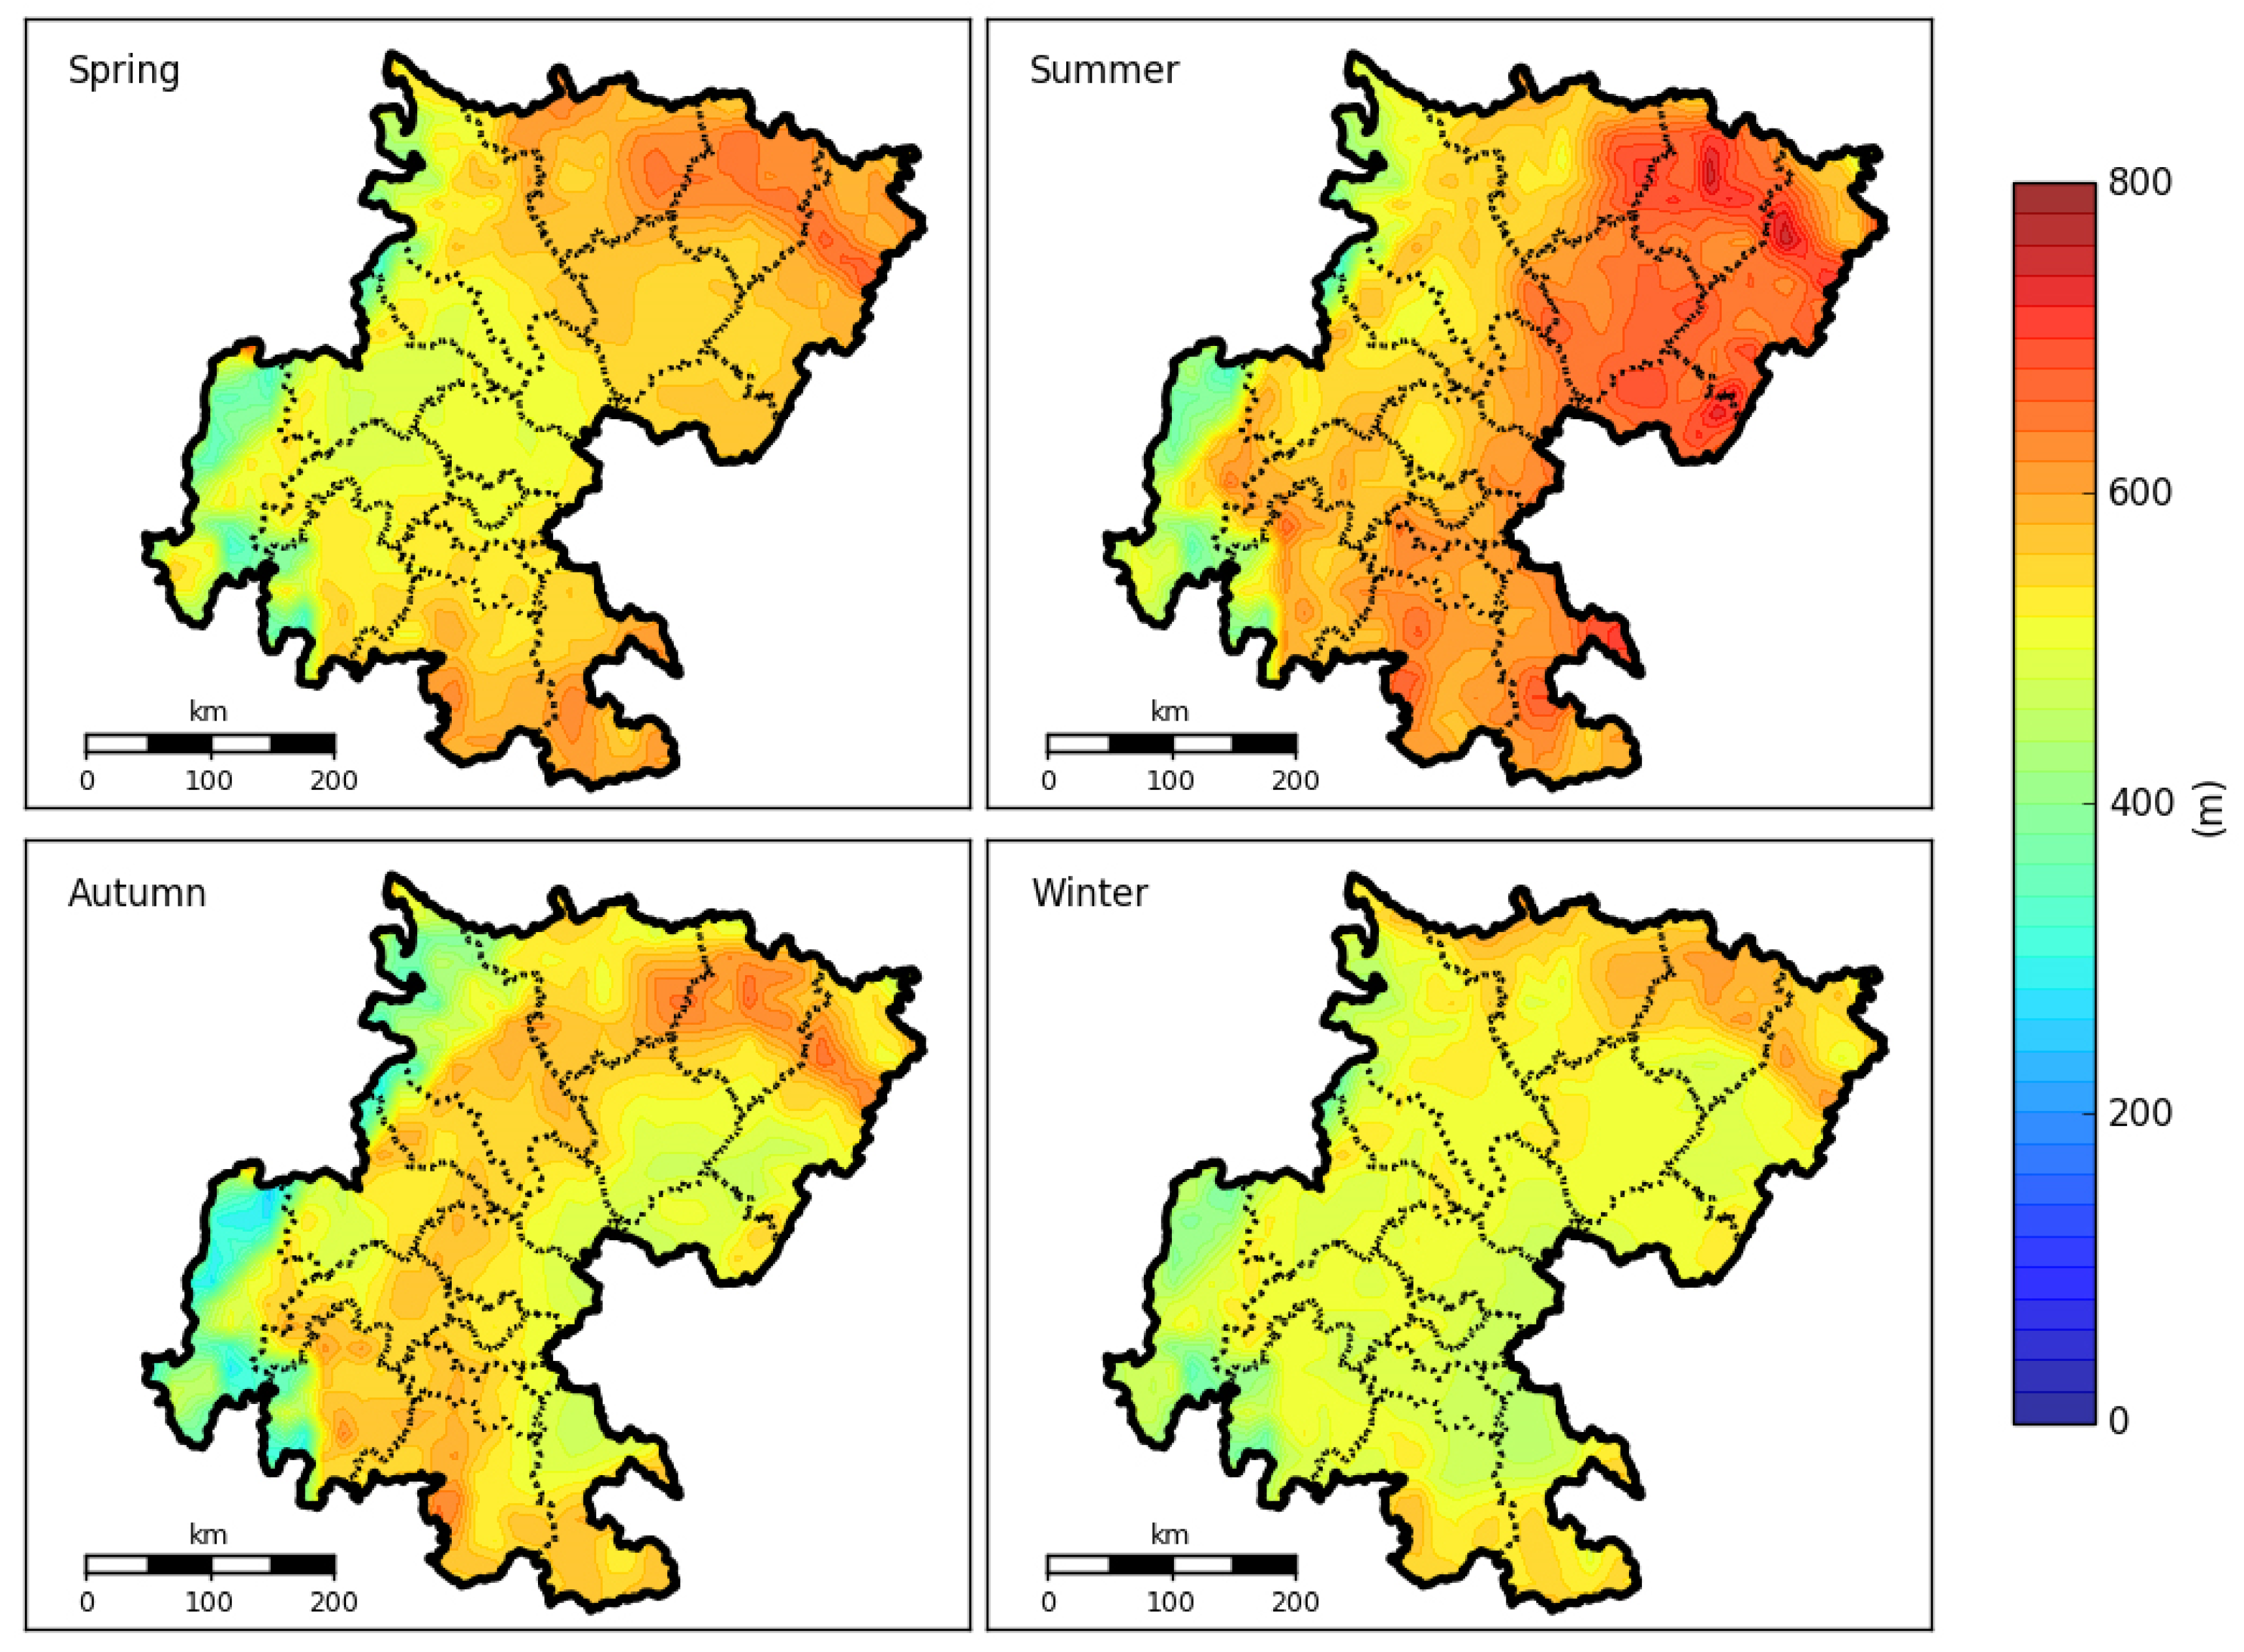
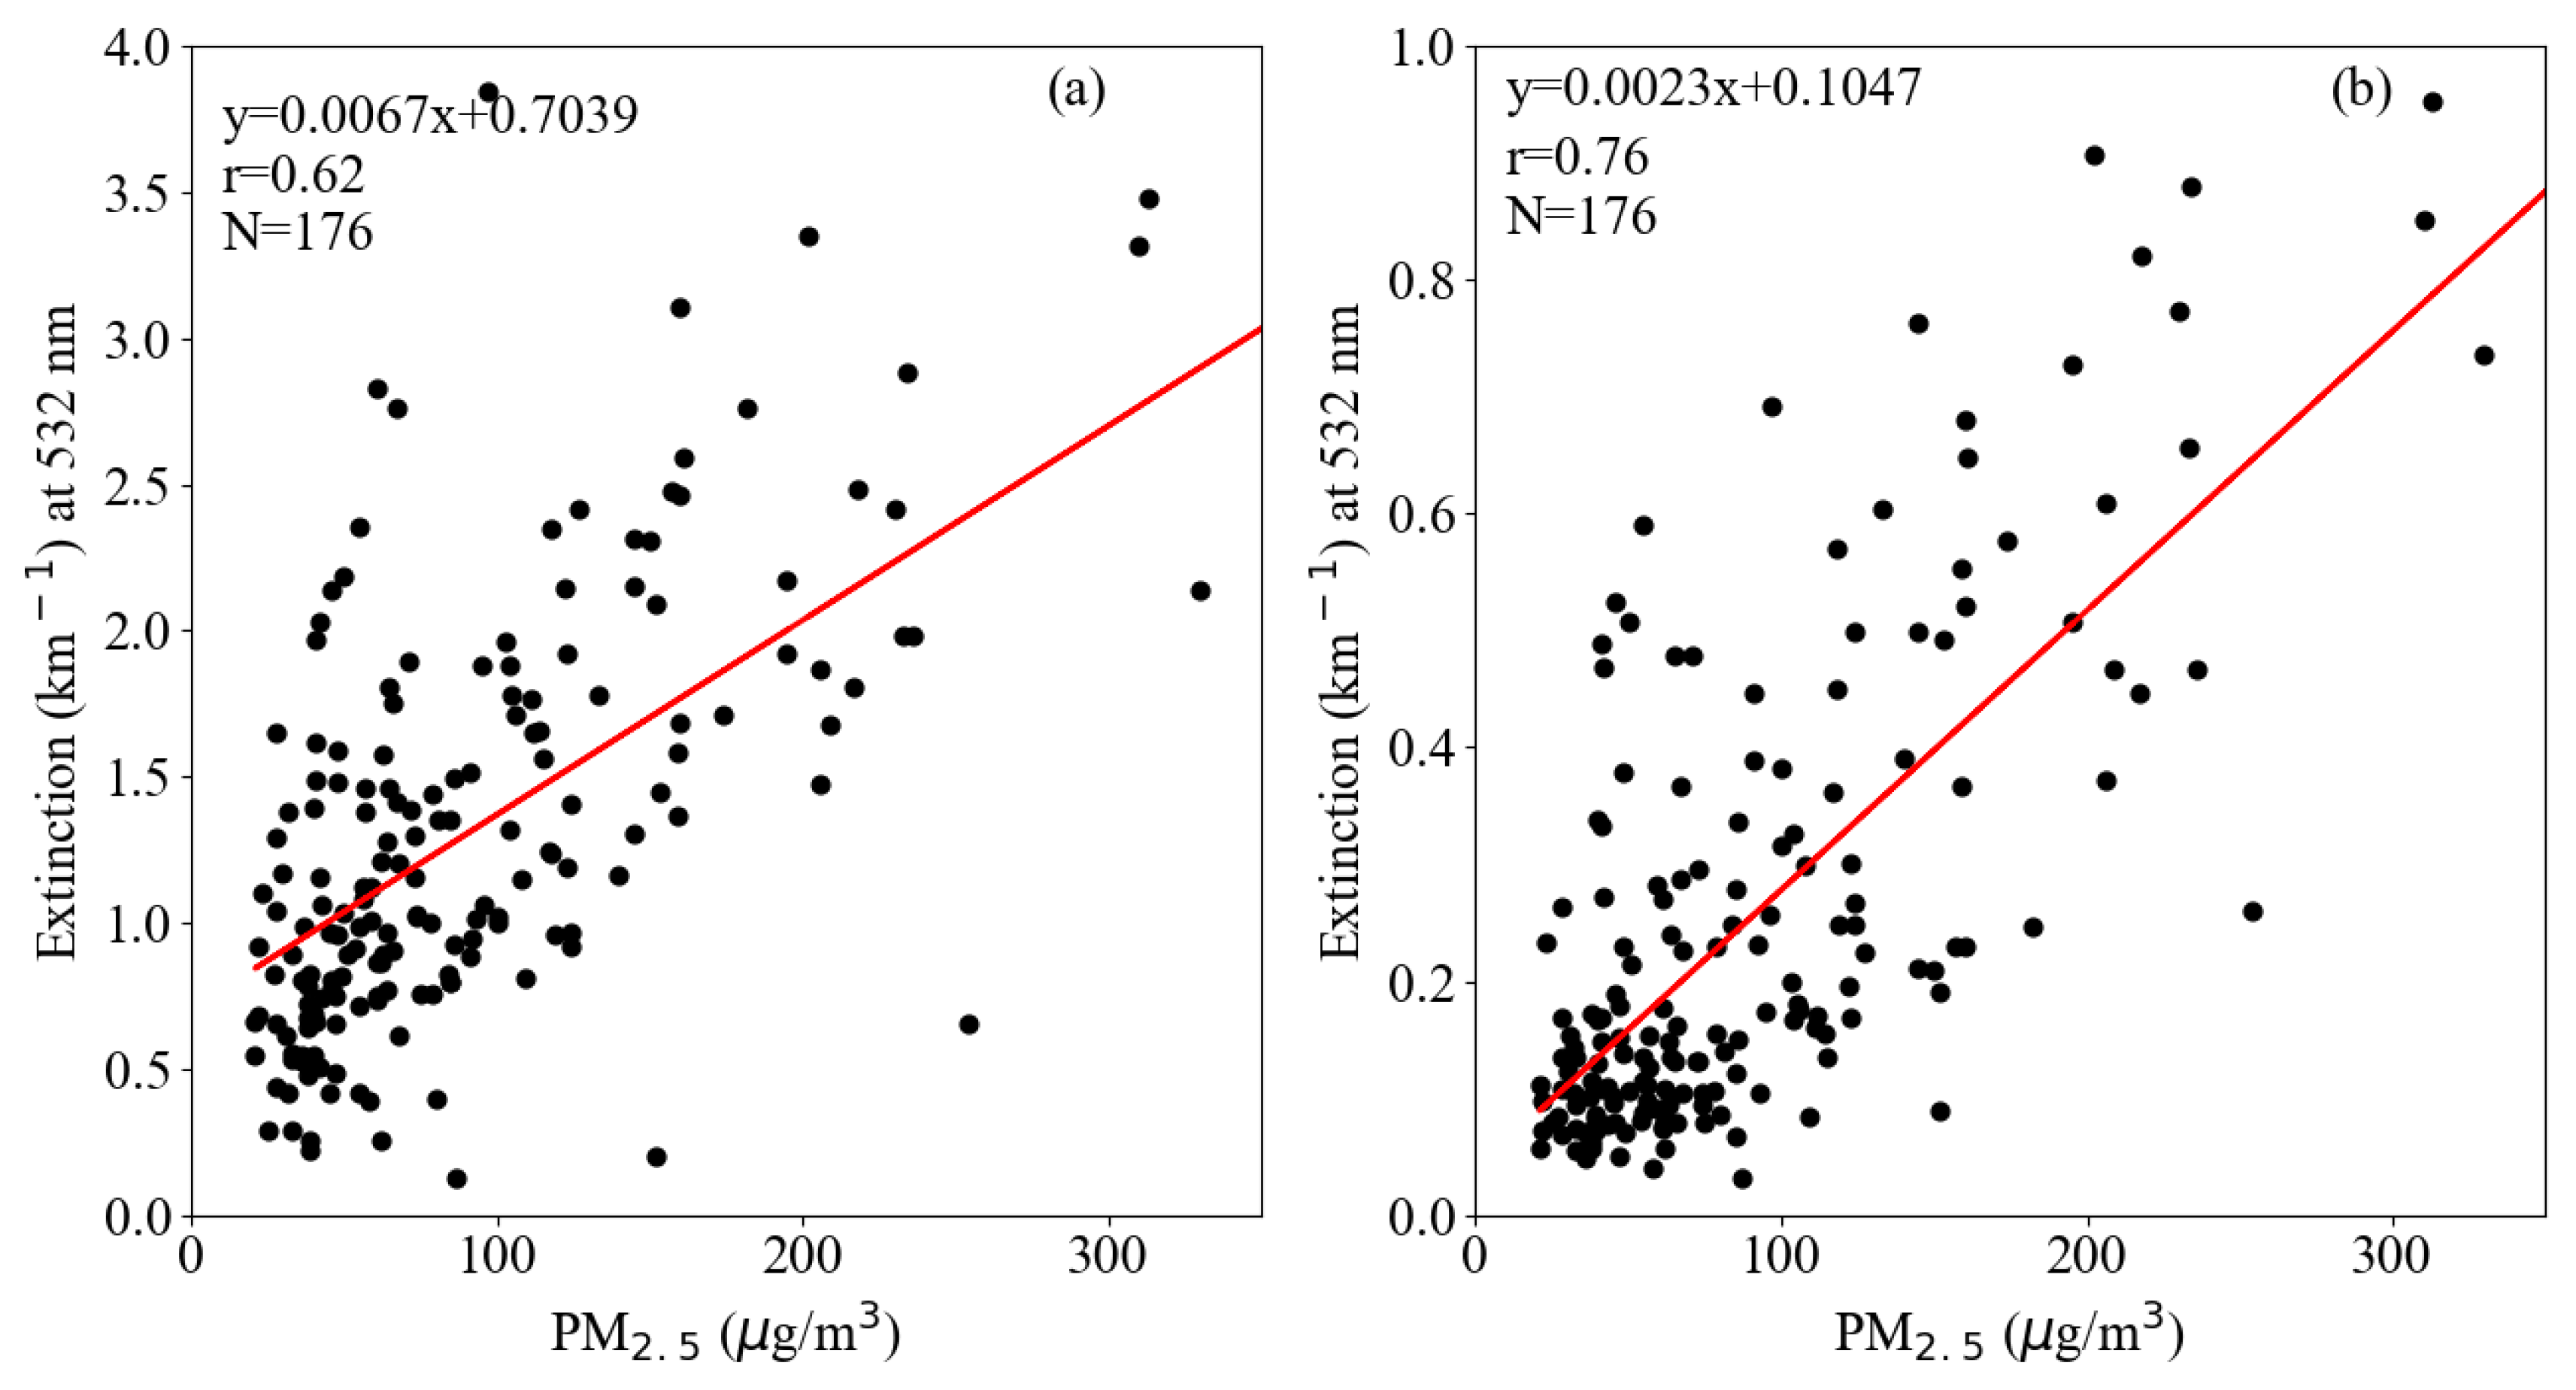
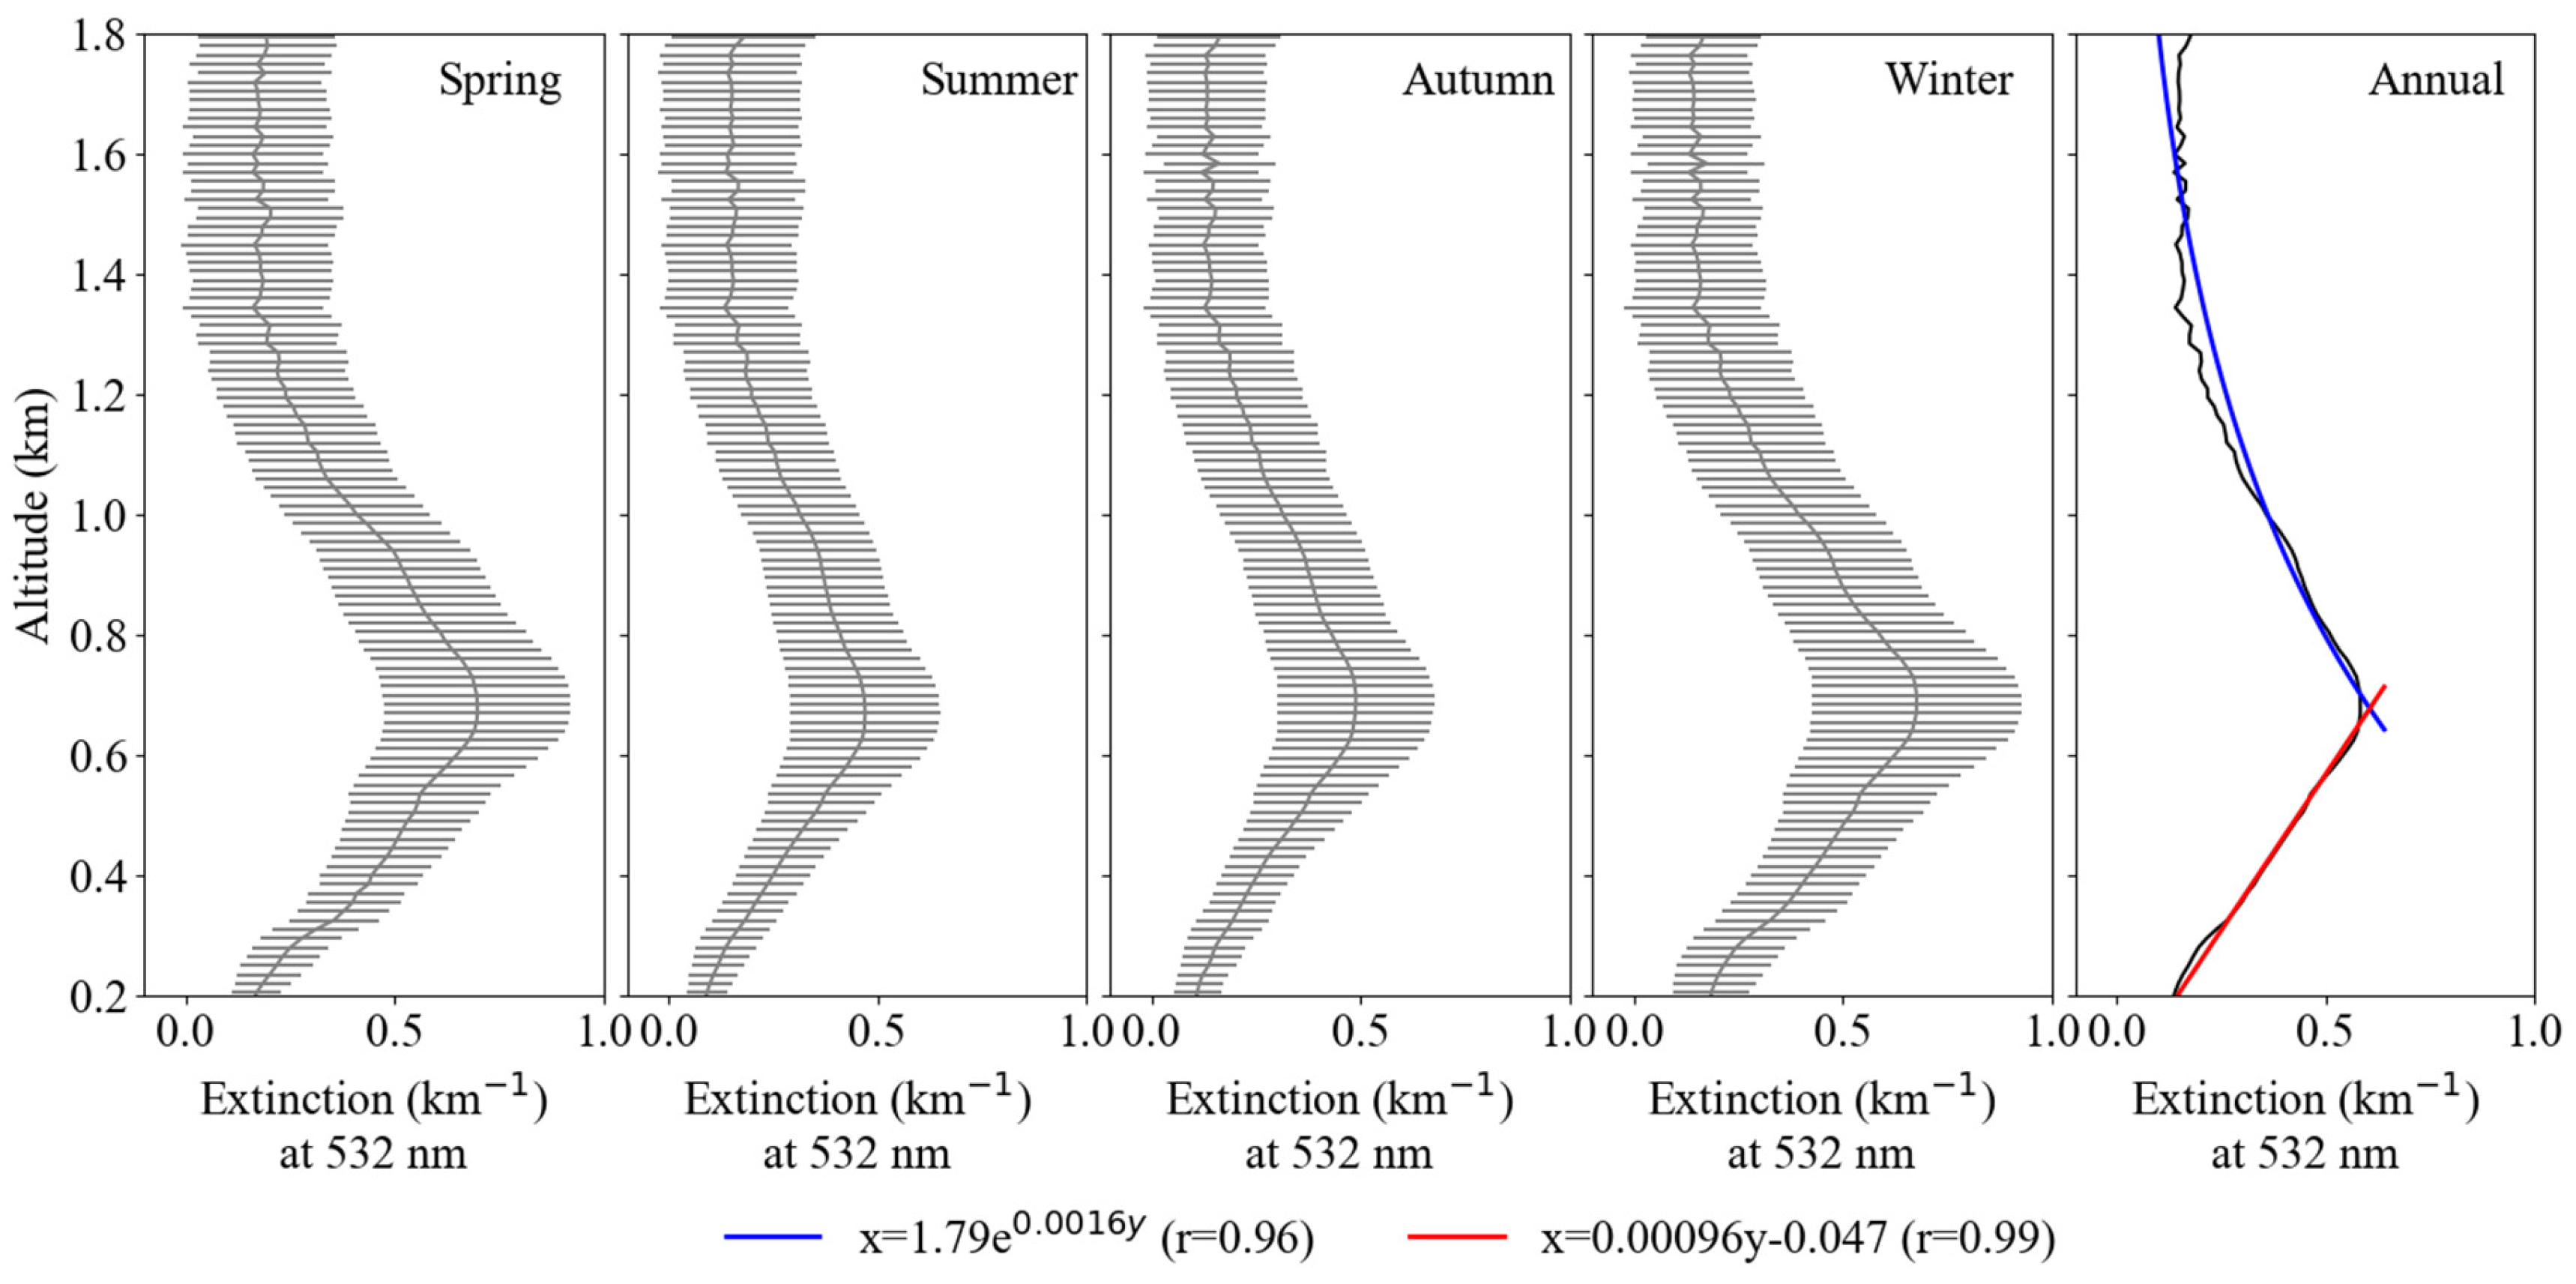
3.2. Vertical Correction of Extinction Coefficient

The vertical distribution of aerosol extinction coefficient (km−1) can be obtained from the back scattered signals received by Lidar, and the atmospheric boundary layer height can be derived using the algorithm presented by He and Mao [59]. Figure 5 shows the seasonal and annual averaged vertical profiles of the aerosol extinction coefficients retrieved from the Lidar measurements at the site of Southwest Jiao-tong University. Strong aerosol extinction was observed at the near ground surface due to the locally emitted aerosols (The horizontal black bars (Figure 5: spring, summer, autumn, winter) indicate the maximum and minimum values of the Lidar-derived aerosol extinction coefficient at 0.2~1.8 km). Then, the coefficient dramatically decreased from 0.7 to 0.02 at a height of 100 m under turbulent flow at vertical direction. The extinction coefficient gradually increased and reached the major peak of 0.58 at the height of 670 m, and then decreased exponentially to about 0.12 at a height of 1800 m. This pattern was obviously different to the observed results with monotonically decreasing trends at Lanzhou and Taiwan in China, and Gwangju in Korea [60,61], but similar to the pattern observed from regional haze events and dramatic biomass burning in the North China Plain and Singapore [62,63].
The time series variations between the monitored PM2.5 concentration from the ground site and the vertical profile of particle extinction are depicted in Figure 6. With the Lidar measurements, it was found that when the concentration of particulate matter was high, the high extinction coefficient was mainly concentrated at about 500–800 m in winter and spring. This can be explained by the shallow PBLH severely limiting the diffusion of pollutants in the vertical. However, the higher values of particle extinction frequently fluctuated between the heights of 200 m to 2000 m in summer and autumn. Moreover, it was identified that the distribution of profiles in different seasons had a similar variation trend, thus a yearly fitting was conducted to obtain the linear and exponential functions for the vertical correction in retrieval ground-level PM2.5 concentration.
The increasingly available Lidar-based aerosol extinction profiles provide insights into the boundary layer as well as the residual above it, but only very limited numbers of the instrument are located in the study regions. To obtain the spatial distribution of PBLH over the whole Sichuan Basin, we simulated the PBLH using the numerical models of WRF and WRF/CALMET, and further compared them with the data from ground-based Lidar. The simulated results for four PBLH parameterization schemes (GBM, SHIN, TEMF, UW) from WRF, along with the result from WRF/CALMET over the Sichuan Basin are illustrated in Figure 7. The results showed that the height of PBLH in winter was the lowest (346 m), followed by autumn (467 m), spring (496 m), and summer (585 m). It also clearly showed that the heights of PBLH were higher in the northeastern part of the Sichuan Basin than in the western part that adjoins to the steep edge of the Tibetan Plateau.
In Figure 8, diurnal Lidar observations were selected as the benchmark data, then compared with the extracted WRF and WRF/CALMET simulation results for the site of Southwest Jiaotong University on randomly selected dates (7 January, 21 April, 20 July, and 11 August, 2014). The height of the boundary layer observed by Lidar was in good agreement with the simulated boundary layer by the SHIN scheme than with the other three schemes in WRF. The simulation result from WRF with the SHIN scheme was input as an initial-guess field in the CALMET model to further simulate the wind field and PBLH with finer resolution. However, both the correlation and the variation tendency of WRF/CALMET were closest to the observation than that of the four WRF schemes. It is also verified that the WRF/CALMET with surface wind field diagnosis was more flexible than WRF when simulating atmospheric boundary height in complex terrain such as in basin and mountain areas [64].
The simulated vertical distribution of PBLH from WRF_SHIN/CALMAT on the satellite transit time was adapted to conduct daily vertical correction looping over each grid of the MODIS images to retrieve the PM2.5 concentrations. The NetCDF format results output from WRF_SHIN/CALMAT were converted to a GeoTIFF format and resampled to meet the MODIS grids via Python programs, which are available open-source as supplied in the appendix materials. The vertical optical thickness was corrected by the above obtained boundary layer height, and the extinction coefficient was used to fit the PM2.5 concentration. The correlation between the extinction coefficient and retrieved PM2.5 concentration for the site of Southwest Jiao-tong University are shown in Figure 10.
The results showed that the correlation coefficient r was presented as 0.62 (Figure 10a), and the reason for this poor correlation was that the extinction coefficient needed to have further humidity correction conducted.

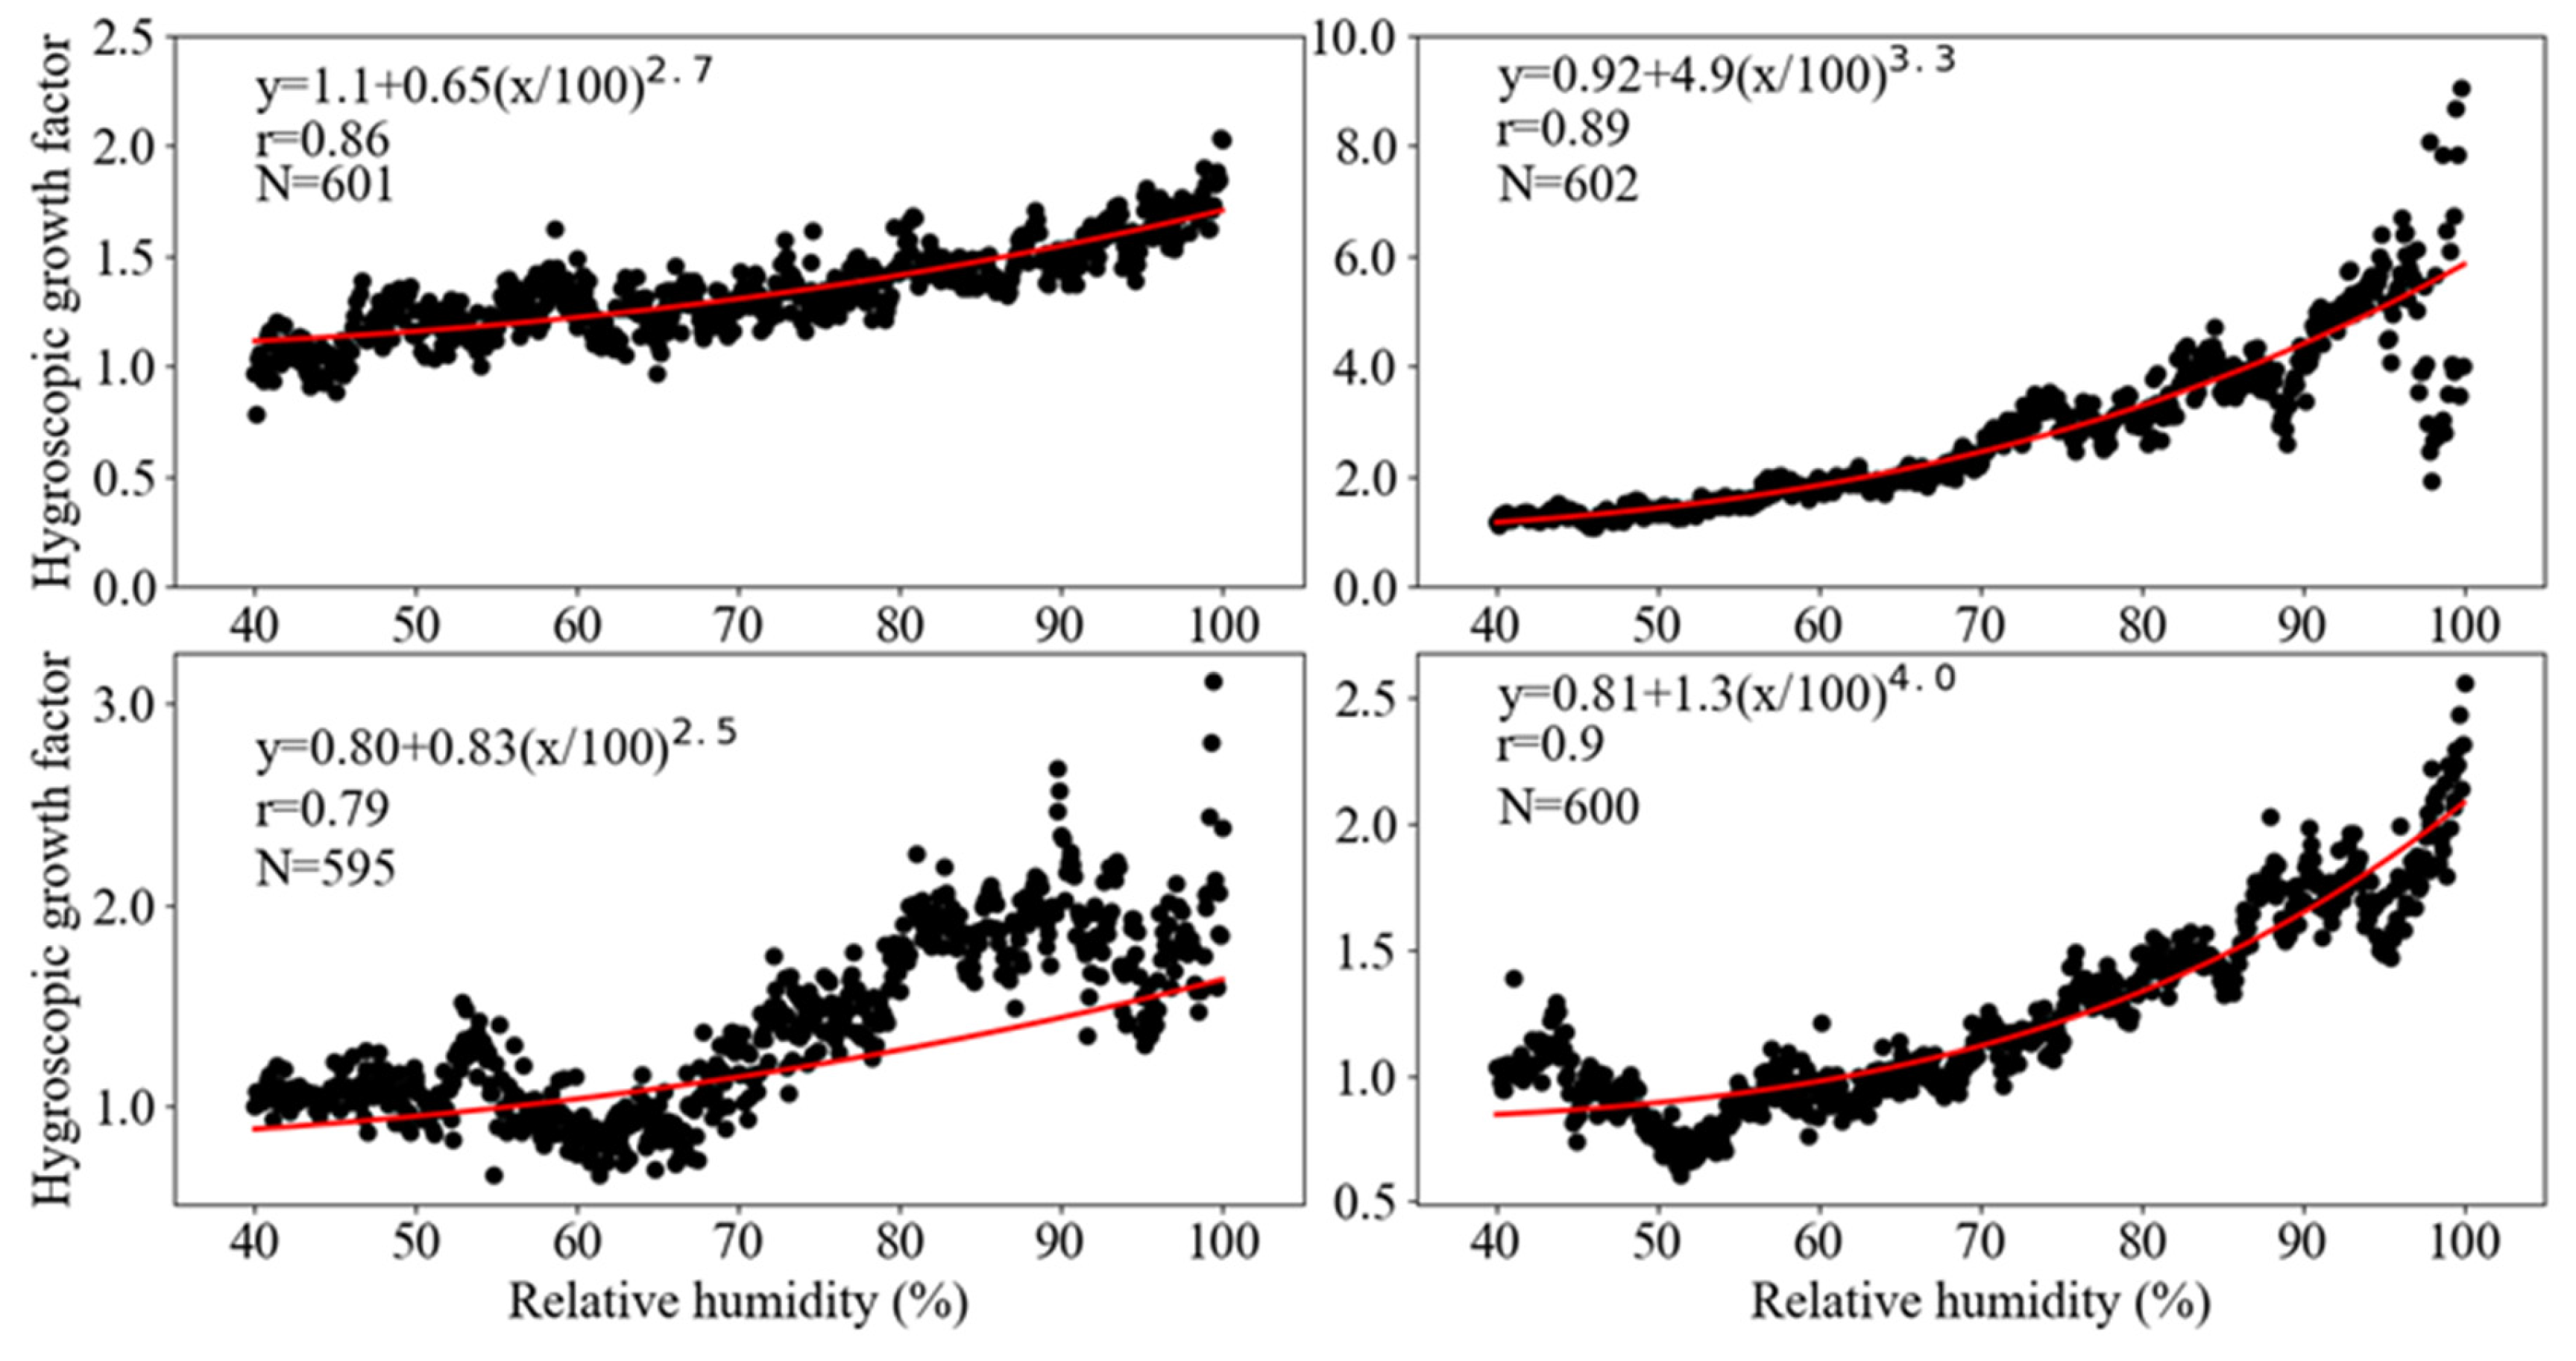
3.3. Humidity Correction of Extinction Coefficient

To improve the correlation after the inversion correction, the hygroscopic growth factors of particles were calculated with the mass extinction efficiency with Equation (2) in Section 2.3; then, an exponential method was used to fit the relationship between the measured relative humidity and hygroscopic growth factors for the extinction coefficient. The fitting results for spring, summer, autumn, and winter are compiled in Figure 9. These revealed that the average mass extinction efficiency of the particulates continuously increased with relative humidity. The increase trend was moderate when the relative humidity increased from 40–80%, whereas the growth factor increased rapidly when relative humidity was higher than 80%.
The average moisture absorption growth factor was 2.79 in summer, followed by 1.48 in the autumn, 1.23 in spring, and the minimum was 1.22 in winter. The fitting exponential functions had the highest correlation coefficient of 0.9 in winter, followed by 0.79 in summer, 0.86 in spring, and 0.79 in autumn. The fitted exponential formulas were used for humidity correction, and this led to the correlation coefficient between the extinction coefficient and the retrieved PM2.5 concentration increasing significantly from 0.62 to 0.76 (Figure 10b).
Assuming that relative humidity varies smoothly, the spatial distribution of relative humidity can be used to retrieve the temporal and spatial distribution of ground-level PM2.5 concentrations (Figure 11). First, we calculate the dry extinction coefficient based on the fitted four-season hygroscopic growth factors, and then establish the relationship between the dry extinction coefficient and the particulate matter concentration. Second, the relative humidity in the Sichuan Basin was calculated by WRF_SHIN/CALMET, and then the hygroscopic growth factor for each grid of 1 km × 1 km (matching the inversion AOD) was computed using the formula (Equation (2)) in Section 2.3. Finally, use the vertical correction extinction coefficient divided by hygroscopic growth factor is the concentration of particulate matter. It was clear that the highest retrieved PM2.5 concentrations presented at the bottom zone of the Sichuan Basin in winter, especially for the city groups of Chengdu-Meishan, Bazhong-Dazhou, and Zigong-Yibin-Luzhou (Figure 11a). Throughout the remaining cities of the Basin, the contribution to the PM2.5 emission was also larger, suggesting that the control of haze in the Sichuan Basin demands further regional joint prevention and controls. PM2.5 pollution in spring was still serious when excluding the northern city group of Bazhong-Dazhou (Figure 11b), but the air quality in most cities was generally good in summer and autumn (Figure 11c,d). The seasonal variation and distribution characteristics of fine particulates could be well identified via the retrieval of high-resolution MODIS images, which was consistent with the monitoring result that the worst air quality occurred at the bottom zone (11 cities) of the Basin in winter, and the second highest pollution occurred across the Basin excluding Ya’an (YA) and Guangan (GA) in spring [52]. The higher concentrations of PM2.5 in winter are probably related to the heavy emissions, lower PBLH and wind speed, and less precipitation for wet scavenging of atmospheric pollutants. Tao et al. [65] also showed that that the higher PM concentrations during winter in Sichuan Basin are due to the lower mixing height and low wind speeds.
To evaluate the rationality of the spatial distribution for the retrieved PM2.5 concentration, we compared the retrieved values with the ground-observed PM2.5 concentration at three other stations in the Sichuan Basin from January to October, 2014 (Figure 12). Three sites were selected by considering the discrete distribution around the basin to evaluate the retrieval accuracy, i.e., Yibin (YB), Dazhou (DZ), and Deyang (DY) (circle marked sites in Figure 11). The results indicated that the retrieved PM2.5 concentrations were slightly overestimated for severe pollution events in winter, but were slightly underestimated in spring at the site of DY. The correlation coefficients for the evaluation during a whole year were 0.78, 0.77, and 0.81 for the sites of YB, DZ, and DY, respectively. The retrieved seasonal distribution of PM2.5 concentration was closer to the observed results in DY than in YB and DY.
The annual mean MODIS retrieved PM2.5 concentration at all three sites (80.80 (mean) ± 50.68 (standard deviation) μg/m3) is approximately 2.61% lower than the ground-based measurements (82.96 (mean) ± 55.63 (standard deviation) μg/m3) with a similar variation dynamic range. A similar study by Liu [66] found that the annual average MISR retrieved PM2.5 concentration at the 17.6 km resolution over the United States is approximately 10% lower than the surface measurements reported by EPA so that using AOD data at higher resolutions is suggested to improve the retrieval accuracies. The MODIS retrieved PM2.5 concentration are generally higher than the ground-based measurements in YB (7.28%) and DZ (1.05%) which located in eastern Sichuan Basin, but lower in the western part, such as DY (6.69%). A scatterplot in Figure 13 illustrated that annual average MODIS retrieved PM2.5 concentrations have a good linear relationship with ground-based measurements (r = 0.78, linear regression slope = 0.7493). Good agreements are shown with r = 0.78 (N = 538) for PM2.5 throughout the whole year and r = 0.77, 0.80, 0.79 and 0.76 in spring, summer, autumn and winter, respectively. More dust storms and biomass burning occur in spring and winter could result in larger variations in aerosol types, which could decrease the correlation coefficient [65].
Seasonally, the difference between MODIS PM2.5 and ground-based measured PM2.5 measurements is the largest in the summer (64.94 μg/m3 versus 57.20 μg/m3, 13.54% difference) and smallest in the spring (81.36 μg/m3 versus 82.41 μg/m3, −1.27% difference). The MODIS PM2.5 concentrations are generally lower than ground-based measurements except during the summer (13.54% higher). The difference is the largest in the summer while lower in the spring, probably reasons that solar is close to zenith, a low level pollution and the land cover type for brighter, especially urban, surfaces, and even lack of retrieval capability of seasonal aerosol microphysical properties. In order to further demonstrate the effect from brighter urban surface, we also presented a similar surface reflectance (around 0.4) for two days (26 July 2014 and 29 July 2014), but with different MODIS retrieved AODs (especially in the urban area of Chengdu, Mianyang and Neijiang) in the Supplementary Materials (Figure S1).
In spring, the lower correspondence between MODIS retrieved and ground-based measured PM2.5 were mainly occurred at DZ (2 February, 3 February and 4 February) and YB (1 February, 2 February and 4 February) as arrow marked points in Figure 13a. This period is traditional Spring Festival in China with heavily burning of fireworks and crackers which would lead to a sharp increase of sulfur dioxide and particulate matter concentrations in the atmosphere. Due to the optical extinction of aerosol released from fireworks is higher the urban background aerosol which used in our retrieval algorithm, and the result of higher MODIS retrieved PM2.5 concentration. Another typical case in spring was occurred on the day of 14 April at DZ. The precipitation was observed at the site, and it caused that the usage of fitted hygroscopic growth factor (which lower than the actual atmospheric conditions) would result in higher retrieved surface PM2.5 concentration.
In summer, Sichuan Basin always affected by subtropical anticyclone [65]. Anticyclones have an impact on the structure of PBL, the difference between the simulated PBLH and the actual heights may result in higher estimated PM concentrations. Moreover, as mentioned above, the underlined brighter urban area may also cause abnormal higher MODIS AOD and its retrieved PM2.5 concentration (such as the case of DZ_July_29). Thirdly, when the relative humidity is higher than 90%, the hygroscopic growth factors are discrete and fluctuated between 1.8 and 9.8 (as shown in Figure 9). The usage of fitted average hygroscopic growth factor could result in higher retrieved PM concentrations on cloudy and rainy days (e.g., DZ_May_7, YB_May_7, YB_June_2 and YB_June_8 in Figure 13b).
While in autumn and winter, the cold air has weak effect on the Sichuan Basin, aerosol particles from heavy local industrial emissions could not diffuse well, it explains the fitted slopes are less than 1.0 in Figure 13c,d. Additionally, there are substantial water vapors suspended in the air due to the fog in the autumn and winter morning, and thus large deviations between the evaluated and ground-level measured PM2.5 concentration were obtained in cases of DY_Oct_24, YB_Nov_2, DY_Dec_2 and DY_Dec_4.
In this analysis, it is obviously that the capability of 1 km MODIS AOD to predict ground-level PM2.5 concentrations can be substantially enhanced by vertical and humidity corrections with model simulated parameters. However, the application or/and modification of other factors could also improve the retrieved results, such as the 3D effects of topography and clouds, sun elevation angle, urban brighter surface contribution, relative humidity, aerosol types and components etc. The effects of topography on the satellite-based PM estimation are related to the radiation correction and diffusion of pollutants via wind speed and PBLH. We only considered the effect of topography on PBLH in this paper. A similar study which conducted by Chudnovsky also reported that the topography are not account for in aerosol retrieval, but the correlation between AOD-retrieved and ground measured PM2.5 concentrations may decrease for larger geographic regions due to the difference of land use types [67]. The selected three cites (YB, DZ and DY) are all located on the urban area with plain topography in the Sichuan Basin. However, it hard for us to conduct further analysis on effects of topography to our retrieved results due to the lack of monitoring site located on the brim of basin.
A database of boundary layer height and humidity growth factor for the Sichuan Basin region was built for use in retrieving the high-resolution ground-level PM2.5 concentrations from the 1 km MODIS AOD products. The uncertainties were mainly produced from assumptions such as the fitted seasonal exponential function of humidity growth factor, and the GFS meteorological initial forecast fields, which are used in daily retrieval works. Moreover, during the inversion progress of aerosol optical depth, only eight fixed aerosol modes are provided in the 6S radiative transfer model, which cannot fully reflect the complex optical properties of the entire Sichuan Basin. The model simulated PBLH still has bias with comparison the actual height and this would lead to uncertainty of vertical correction. Moreover, another important uncertainty came from the usage of model simulated surface-level humidity, however, the columnar integrated humidity should be applied. Ground-based observations from a sun-photometer should be conducted to obtain more detailed optical parameters for future works. In addition, only one super-monitoring station was selected as the benchmark and three ground-based observation sites were adopted for daily product evaluation, surface observations from more sites, and longer periods would be useful to further verify the applicability of AOD-derived PM2.5.

4. Conclusions

Although 140 ground-level monitoring stations have been built across 21 cities of the Sichuan Province since 2014, they still have limited spatial resolution and coverage. Recently, multi-covariates model-based approaches have been reported to retrieve ground-level PM2.5 concentrations from high-resolution MODIS AOD products. In this study, the ground observed data from a super-monitoring station were selected as the benchmark; and we combined the WRF_SHIN/CALMET simulated PBLH data and meteorological data to account for the vertical correction and the integrated seasonal humidity effect in the retrieval of PM2.5 concentrations. An algorithm with an open-source code was developed to estimate PM2.5 concentration over the Sichuan Basin based on the near real-time obtained MODIS AOD at 1 km resolution. The correlation coefficient between the aerosol extinction coefficient and the fitted surface-level PM2.5 concentration at the benchmark station was significantly enhanced from 0.62 to 0.76 after vertical and humidity corrections during a whole year period. Further evaluation of the retrieved ground-level PM2.5 with the observed values in three cities, Yibin (YB), Dazhou (DZ), and Deyang (DY), showed generally better agreements, with the correlation coefficients of 0.78 (N = 177), 0.77 (N = 178), and 0.81 (N = 181), respectively. The results showed that the near real-time algorithm had the capacity to identify PM2.5 spatiotemporal distribution on regional and urban scales with complex basin terrain, and to provide helpful information for the diagnosis, consultation, and control of heavy haze events in environmental protection agencies.

Supplementary Materials

The following are available online at https://www.mdpi.com/2073-4433/9/2/78/s1. Figure S1: A comparison between two days (26 July 2014 and 29 July 2014) with similar surface reflectance (around 0.4), but with different MODIS retrieved AODs. The open-source codes for the retrieval algorithm can be accessed in the supplementary file.

Acknowledgments

This work was financially supported by the National Natural Science Foundation of China (NSFC) (No. 41771071 and 21407148), the National Key R&D Plan (No. 2017YFC0212304), Frontier Science Research Plan of CAS (No. QYZDB-SSW-DQC045), and the Youth Innovation Promotion Association of CAS (No. 2017275). The authors would like to thank Qingqing Tong and Xinyuan Cao for their recommendations for improving this manuscript.

Author Contributions

Chao Gao and Wenyong Wang carried out the data collection and related analysis; Chao Gao, Xuelei Zhang, and Weiwei Chen plotted the figures and wrote this manuscript; Chao Gao wrote the open-source codes; and Aijun Xiu and Danile Q. Tong gave modification suggestions for this manuscript.

Conflicts of Interest

The authors declare no conflict of interest.

References

  1. Pöschl, U. Atmospheric aerosols: Composition, transformation, climate and health effects. Angew. Chem. Int. Ed. 2005, 44, 7520–7540. [Google Scholar] [CrossRef] [PubMed]
  2. Mahowald, N.; Ward, D.S.; Kloster, S.; Flanner, M.G.; Heald, C.L.; Heavens, N.G.; Hess, P.G.; Lamarque, J.F.; Chuang, P.Y. Aerosol impacts on climate and biogeochemistry. Annu. Rev. Environ. Resour. 2011, 36, 45–74. [Google Scholar] [CrossRef]
  3. Lohmann, U.; Feichter, J. Global indirect aerosol effects: A review. Atmos. Chem. Phys. 2005, 5, 715–737. [Google Scholar] [CrossRef]
  4. Rd, P.C.; Burnett, R.T.; Thun, M.J.; Calle, E.E.; Krewski, D.; Ito, K.; Thurston, G.D. Lung cancer, cardiopulmonary mortality, and long-term exposure to fine particulate air pollution. JAMA 2002, 287, 1132–1141. [Google Scholar]
  5. Chen, L.C.; Lippmann, M. Effects of metals within ambient air particulate matter (PM) on human health. Inhal. Toxicol. 2009, 21, 1–31. [Google Scholar] [CrossRef] [PubMed]
  6. Huang, R.J.; Zhang, Y.; Bozzetti, C.; Ho, K.F.; Cao, J.J.; Han, Y.; Daellenbach, K.R.; Slowik, J.G.; Platt, S.M.; Canonaco, F.; et al. High secondary aerosol contribution to particulate pollution during haze events in China. Nature 2014, 514, 218–222. [Google Scholar] [CrossRef] [PubMed] [Green Version]
  7. Zhang, X.Y.; Wang, Y.Q.; Niu, T.; Zhang, X.C.; Gong, S.L.; Zhang, Y.M.; Sun, J.Y.; Brandt, J. Atmospheric aerosol compositions in China: Spatial/temporal variability, chemical signature, regional haze distribution and comparisons with global aerosols. Atmos. Chem. Phys. 2012, 12, 779–799. [Google Scholar] [CrossRef] [Green Version]
  8. Hoff, R.M.; Christopher, S.A. Remote sensing of particulate pollution from space: Have we reached the promised land? J. Air Waste Manag. Assoc. 2009, 59, 645–675. [Google Scholar] [CrossRef] [PubMed]
  9. Gupta, P.; Christopher, S.A.; Wang, J.; Gehrig, R.; Lee, Y.; Kumar, N. Satellite remote sensing of particulate matter and air quality assessment over global cities. Atmos. Environ. 2006, 40, 5880–5892. [Google Scholar] [CrossRef]
  10. Donkelaar, A.V.; Martin, R.V.; Brauer, M.; Boys, L.B. Global Fine Particulate Matter Concentrations from Satellite for Long-Term Exposure Assessment. Assessment 2015, 3, 4. [Google Scholar]
  11. Nicolantonio, W.D.; Cacciari, A.; Bolzacchini, E.; Ferrero, L.; Volta, M.; Pisoni, E. MODIS aerosol optical properties over North Italy for estimating surface-level PM2.5. In Proceedings of the Envisat Symposium, Montreux, Switzerland, 23–27 July 2007. [Google Scholar]
  12. Van Donkelaar, A.; Martin, R.V.; Brauer, M.; Kahn, R.; Levy, R.; Verduzco, C.; Villeneuve, P.J. Global estimates of ambient fine particulate matter concentrations from satellite-based aerosol optical depth: Development and application. Environ. Health Perspect. 2010, 118, 847–855. [Google Scholar] [CrossRef] [PubMed]
  13. Van Donkelaar, A.; Martin, R.V.; Park, R.J. Estimating ground-level PM2.5 using aerosol optical depth determined from satellite remote sensing. J. Geophys. Res. Atmos. 2006, 111, 5049–5066. [Google Scholar] [CrossRef]
  14. You, W.; Zang, Z.; Pan, X.; Zhang, L.; Chen, D. Estimating PM2.5 in Xi’an, China using aerosol optical depth: A comparison between the MODIS and MISR retrieval models. Sci. Total Environ. 2015, 505, 1156–1165. [Google Scholar] [CrossRef] [PubMed]
  15. Chudnovsky, A.A.; Kostinski, A.; Lyapustin, A.; Koutrakisa, P. Spatial scales of pollution from variable resolution satellite imaging. Environ. Pollut. 2013, 172, 131–138. [Google Scholar] [CrossRef] [PubMed]
  16. Lyapustin, A.I.; Wang, Y.; Laszlo, I.; Hilker, T.; Hall, F.G.; Sellers, P.J.; Tucker, C.J.; Korkin, S.V. Multi-angle implementation of atmospheric correction for MODIS (MAIAC): 3. Atmospheric correction. Remote Sens. Environ. 2012, 127, 385–393. [Google Scholar] [CrossRef]
  17. Van Donkelaar, A.; Martin, R.V.; Brauer, M.; Hsu, N.C.; Kahn, R.A.; Levy, R.C.; Lyapustin, A.; Winker, D.M. Global estimates of fine particulate matter using a combined geophysical-statistical method with information from satellites, models, and monitors. Environ. Sci. Technol. 2016, 50, 3762–3772. [Google Scholar] [CrossRef] [PubMed]
  18. Ma, Z.; Hu, X.; Huang, L.; Bi, J.; Liu, Y. Estimating ground-level PM2.5 in China using satellite remote sensing. Environ. Sci. Technol. 2014, 48, 7436–7444. [Google Scholar] [CrossRef] [PubMed]
  19. Lyapustin, A.; Wang, Y.; Laszlo, I.; Kahn, R.; Remer, L.; Levy, R.; Reid, J.S. Multiangle implementation of atmospheric correction (MAIAC): 2. Aerosol algorithm. J. Geophys. Res. Atmos. 2011, 16, dio:10–1029. [Google Scholar] [CrossRef]
  20. Wilson, J.D.; Sawford, B.L. Review of Lagrangian stochastic models for trajectories in the turbulent atmosphere. Bound.-Layer Meteorol. 1996, 78, 191–210. [Google Scholar] [CrossRef]
  21. Hauschildt, P.H.; Baron, E. Numerical solution of the expanding stellar atmosphere problem. J. Comput. Appl. Math. 1999, 109, 41–63. [Google Scholar] [CrossRef]
  22. Hess, M.; Koepke, P.; Schult, I. Optical properties of aerosols and clouds: The software package OPAC. Bull. Am. Meteorol. Soc. 1998, 79, 831–844. [Google Scholar] [CrossRef]
  23. Mishchenko, M.I.; Travis, L.D.; Mackowski, D.W. T-matrix computations of light scattering by nonspherical particles: A review. J. Quant. Spectrosc. Radiat. Transf. 1996, 55, 535–575. [Google Scholar] [CrossRef]
  24. Draine, B.T.; Flatau, P.J. Discrete-dipole approximation for scattering calculations. JOSAA 1994, 11, 1491–1499. [Google Scholar] [CrossRef]
  25. Koelemeijer, R.B.A.; Homan, C.D.; Matthijsen, J. Comparison of spatial and temporal variations of aerosol optical thickness and particulate matter over Europe. Atmos. Environ. 2006, 40, 5304–5315. [Google Scholar] [CrossRef]
  26. Boyouk, N.; Léon, J.F.; Delbarre, H.; Podvin, T.; Deroo, C. Impact of the mixing boundary layer on the relationship between PM2.5 and aerosol optical thickness. Atmos. Environ. 2010, 44, 271–277. [Google Scholar] [CrossRef]
  27. Wang, Z.; Chen, L.; Tao, J.; Zhang, Y.; Su, L. Satellite-based estimation of regional particulate matter (PM) in Beijing using vertical-and-RH correcting method. Remote Sens. Environ. 2010, 114, 50–63. [Google Scholar] [CrossRef]
  28. Flores, J.M.; Bar-Or, R.Z.; Bluvshtein, N.; Abo-Riziq, A.; Kostinski, A.; Borrmann, S.; Koren, I.; Koren, I.; Rudich, Y. Absorbing aerosols at high relative humidity: Linking hygroscopic growth to optical properties. Atmos. Chem. Phys. 2012, 12, 5511–5521. [Google Scholar] [CrossRef] [Green Version]
  29. Kumar, N.; Chu, A.; Foster, A. An empirical relationship between PM2.5 and aerosol optical depth in Delhi Metropolitan. Atmos. Environ. 2007, 41, 4492–4503. [Google Scholar] [CrossRef] [PubMed]
  30. Tian, J.; Chen, D. A semi-empirical model for predicting hourly ground-level fine particulate matter (PM2.5) concentration in southern Ontario from satellite remote sensing and ground-based meteorological measurements. Remote Sens. Environ. 2010, 114, 221–229. [Google Scholar] [CrossRef]
  31. Mao, L.; Qiu, Y.; Kusano, C.; Xu, L. Predicting regional space-time variation of PM2.5 with land-use regression model and MODIS data. Environ. Sci. Pollut. Res. 2012, 19, 128–138. [Google Scholar] [CrossRef] [PubMed]
  32. Gupta, P.; Christopher, S.A. Particulate matter air quality assessment using integrated surface, satellite, and meteorological products: Multiple regression approach. J. Geophys. Res. Atmos. 2009a, 114. [Google Scholar] [CrossRef]
  33. Song, W.; Jia, H.; Huang, J.; Zhang, Y. A satellite-based geographically weighted regression model for regional PM2.5 estimation over the Pearl River Delta region in China. Remote Sens. Environ. 2014, 154, 1–7. [Google Scholar] [CrossRef]
  34. Gupta, P.; Christopher, S.A. Particulate matter air quality assessment using integrated surface, satellite, and meteorological products: 2. A neural network approach. J. Geophys. Res. Atmos. 2009b, 114. [Google Scholar] [CrossRef]
  35. Chen, Y.; Xie, S. Temporal and spatial visibility trends in the Sichuan Basin, China, 1973 to 2010. Atmos. Res. 2012, 112, 25–34. [Google Scholar] [CrossRef]
  36. Environmental Quality Report of Sichuan Province in 2015. Available online: http://www.schj.gov.cn/hjgl/hjjcydc/hjzkgb/201506/P020170804637398461312.pdf (accessed on 1 May 2015). (In Chinese)
  37. Levy, R.C.; Remer, L.A.; Dubovik, O. Global aerosol optical properties and application to Moderate Resolution Imaging Spectroradiometer aerosol retrieval over land. J. Geophys. Res. Atmos. 2007, 112, 3710–3711. [Google Scholar] [CrossRef]
  38. Kotchenova, S.Y.; Vermote, E.F.; Matarrese, R.; Klemm, F.J. Validation of a vector version of the 6S radiative transfer code for atmospheric correction of satellite data. Part I: Path radiance. Appl. Opt. 2006, 45, 6762–6774. [Google Scholar] [CrossRef] [PubMed]
  39. Gao, B.C.; Kaufman, Y.J. Water vapor retrievals using Moderate Resolution Imaging Spectroradiometer (MODIS) near-infrared channels. J. Geophys. Res. Atmos. 2003, 108, 1007–1021. [Google Scholar] [CrossRef]
  40. Xu, H.Q. Modification of normalized difference water index (NDWI) to enhance open water features in remotely sensed imagery. Int. J. Remote Sens. 2006, 27, 3025–3033. [Google Scholar] [CrossRef]
  41. Liu, Y.; Sarnat, J.A.; Kilaru, V.; Jacob, D.J.; Koutrakis, P. Estimating ground-level PM2.5 in the eastern United States using satellite remote sensing. Environ. Sci. Technol. 2005, 39, 3269–3278. [Google Scholar] [CrossRef] [PubMed] [Green Version]
  42. Yang, D.; Li, C.; Lau, A.K.H.; Li, Y. Long-term measurement of daytime atmospheric mixing layer height over Hong Kong. J. Geophys. Res. Atmos. 2013, 118, 2422–2433. [Google Scholar] [CrossRef]
  43. Qin, K.; Wang, L.Y.; Wu, L.X.; Xu, J.; Rao, L.L.; Letu, H.; Shi, T.W.; Wang, R.F. A campaign for investigating aerosol optical properties during winter hazes over Shijiazhuang, China. Atmos. Res. 2017, 198, 113–122. [Google Scholar] [CrossRef]
  44. Grenier, H.; Bretherton, C.S. A moist PBL parameterization for large-scale models and its application to subtropical cloud-topped marine boundary layers. Mon. Weather Rev. 2001. [Google Scholar] [CrossRef]
  45. Bretherton, C.S.; Park, S.S. A New Moist Turbulence Parameterization in the Community Atmosphere Model. J. Clim. 2009, 22, 3422–3448. [Google Scholar] [CrossRef]
  46. Angevine, W.M.; Jiang, H.; Mauritsen, T. Performance of an Eddy Diffusivity-Mass Flux Scheme for Shallow Cumulus Boundary Layers. Mon. Weather Rev. 2010, 138, 2895–2912. [Google Scholar] [CrossRef]
  47. Shin, H.H.; Hong, S.Y. Representation of the Subgrid-Scale Turbulent Transport in Convective Boundary Layers at Gray-Zone Resolutions. Mon. Weather Rev. 2015, 143, 250–271. [Google Scholar] [CrossRef]
  48. Tang, I.N. Chemical and size effects of hygroscopic aerosols on light scattering coefficients. J. Geophys. Res. Atmos. 1996, 101, 19245–19250. [Google Scholar] [CrossRef]
  49. Wang, Q.Y.; Tao, J.; Ren, P.K.; Shen, Z.X.; Luo, L.; Tang, X.Y. Chemical composition of PM2.5 and its impact on visibility at Chengdu in 2010 winter. J. Earth Environ. 2012, 5, 1104–1108. [Google Scholar]
  50. Zieger, P.; Fierz, S.R.; Gysel, M.; Strom, J.; Henne, S.; Yttri, K.E.; Baltensperger, U.; Weingartner, E. Effects of relative humidity on aerosol light scattering in the Arctic. Atmos. Chem. Phys. 2010, 10, 3875–3890. [Google Scholar] [CrossRef] [Green Version]
  51. Titos, G.; Lyamani, H.; Cazorla, A.; Sorribas, M.; Inmaculada, F.M.; Alfred, W. Study of the relative humidity dependence of aerosol light-scattering in southern Spain. Tellus B 2014, 66, 136–140. [Google Scholar] [CrossRef]
  52. Lin, C.Q.; Li, Y.; Yuan, Z.B.; Lau, A.K.H.; Li, C.C.; Fung, J.C.H. Using satellite remote sensing data to estimate the high-resolution distribution of ground-level PM2.5. Remote Sens. Environ. 2015, 156, 117–128. [Google Scholar] [CrossRef]
  53. Song, C.H.; Park, M.E.; Lee, K.H.; Ahn, H.; Lee, J.; Kim, J.Y.; Han, K.M.; Kim, J.; Ghim, Y.S.; et al. An investigation into seasonal and regional aerosol characteristics in East Asia using model-predicted and remotely-sensed aerosol properties. Atmos. Chem. Phys. 2008, 22, 6627–6654. [Google Scholar] [CrossRef]
  54. Tao, J.H.; Wang, Z.F.; Xu, Q.; Li, L.J.; Fan, M.; Tao, M.H.; Su, L.; Chen, L.F. Particulate matter mass extinction hygroscopic growth model in Beijing. J. Remote. Sens. 2015, 1, 12–24. [Google Scholar]
  55. Ning, G.C.; Wang, S.G.; Ma, M.J.; Ni, C.J.; Shang, Z.W.; Wang, J.X.; Li, J.X. Characteristics of air pollution in different zones of Sichuan Basin, China. Sci. Total Environ. 2018, 612, 975–984. [Google Scholar] [CrossRef] [PubMed]
  56. Luo, Y.X.; Zheng, X.B.; Zhao, T.L.; Chen, J. A climatology of aerosol optical depth over China from recent 10 years of MODIS remote sensing data. Int. J. Climatol. 2014, 3, 863–870. [Google Scholar] [CrossRef]
  57. Liu, X.; Chen, Q.; Che, H.; Zhang, R.; Gui, K.; Zhang, H.; Zhao, T. Spatial distribution and temporal variation of aerosol optical depth in the Sichuan basin, China, the recent ten years. Atmos. Environ. 2016, 147, 434–445. [Google Scholar] [CrossRef]
  58. Chan, P.W. Comparison of Aerosol Optical Depth (AOD) Derived from Ground-Based Lidar and MODIS. Open Atmos. Sci. J. 2009, 3, 131–137. [Google Scholar] [CrossRef]
  59. He, Q.S.; Mao, J.T. Observation of urban mixed layer at Beijing using a micro pulse Lidar. Acta Meteorol. Sin. 2005, 3, 374–384. [Google Scholar]
  60. Woo, K.S.; Yoon, S.C.; Kim, J.Y.; Kim, S.Y. Seasonal and monthly variations of columnar aerosol optical properties over East Asia determined from multi-year MODIS, Lidar, and AERONET Sun/sky radiometer measurements. Atmos. Environ. 2007, 8, 1634–1651. [Google Scholar]
  61. Cao, X.; Wang, Z.; Tian, P.; Wang, J.; Zhang, L.; Quan, X. Statistics of aerosol extinction coefficient profiles and optical depth using Lidar measurement over Lanzhou, China since 2005-2008. J. Quant. Spectrosc. Radiat. Transf. 2013, 122, 150–154. [Google Scholar] [CrossRef]
  62. Zhao, X.J.; Zhao, P.S.; Xu, J.; Meng, W.; Pu, W.W.; Dong, F.; He, D.; Shi, Q.F. Analysis of a winter regional haze event and its formation mechanism in the North China Plain. Atmos. Chem. Phys. 2013, 11, 5685–5696. [Google Scholar] [CrossRef]
  63. Salinas, S.V.; Chew, B.N.; Jukka, M.; Campbell, J.R.; Welton, E.J.; Reid, J.S.; Yu, L.E.; Liew, S.C. Physical and optical characteristics of the October 2010 haze event over Singapore: A photometric and Lidar analysis. Atmos. Res. 2013, 122, 555–570. [Google Scholar] [CrossRef]
  64. Wang, C.H.; Hu, J.; Feng, S.L.; Jin, S.L.; Zhang, F.M.; Liu, C. Comparing different boundary layer schemes of WRF by simulation the low-level wind over complex terrain. AIMSEC 2011, 2, 6183–6188. [Google Scholar]
  65. Tao, J.; Zhang, L.; Engling, G.; Zhang, R.J.; Yang, Y.H.; Cao, J.J.; Zhu, C.S.; Wang, Q.Y.; Luo, L. Chemical composition of PM2.5 in an urban environment in Chengdu, China: Importance of springtime dust storms and biomass burning. Atmos. Res. 2013, 122, 270–283. [Google Scholar] [CrossRef]
  66. Liu, Y.; Park, R.J.; Jacob, D.J.; Li, Q.B.; Kilaru, V.; Sarnat, J.A. Mapping annual mean ground-level PM2.5 concentrations using Multiangle Imaging Spectroradiometer aerosol optical thickness over the contiguous United States. J. Geophys. Res. Atmos. 2004, 109. [Google Scholar] [CrossRef]
  67. Chudnovsky, A.A.; Tang, C.; Lyapustin, A.; Wang, Y.; Schwartz, J.; Koutrakis, P. A critical assessment of high-resolution aerosol optical depth retrievals for fine particulate matter predictions. Atmos. Chem. Phys. 2013, 13, 10907–10917. [Google Scholar] [CrossRef]
Figure 1. (a) Locations of the metropolitans of Chengdu-Chongqing; (b) Location of the Sichuan Basin and its elevation; (c,d) Location of the synergistic suite.
Atmosphere 09 00078 g001
Figure 2. Flowchart of near real-time retrieval algorithm for PM2.5 concentration over the Sichuan Basin.
Atmosphere 09 00078 g002
Figure 3. Spatial and temporal distributions of retrieved AOD from 1 km MODIS data over the Sichuan Basin.
Atmosphere 09 00078 g003
Figure 4. Correlation between the ground-based Lidar AOD and 1 km resolution MODIS AOD at the site of Southwest Jiao-tong University.
Atmosphere 09 00078 g004
Figure 5. Seasonal and yearly mean aerosol vertical extinction profiles at the site of Southwest Jiao-tong University.
Atmosphere 09 00078 g005
Figure 6. The time series variation of ground-based measured PM2.5 concentrations and vertical profiles of particle extinction over the Sichuan Basin in 2014.
Atmosphere 09 00078 g006
Figure 7. The simulated spatial distribution of planetary boundary layer height over the Sichuan Basin during 1 November 2013 to 31 October 2014.
Atmosphere 09 00078 g007
Figure 8. The evaluation of simulated diurnal variation of PBLH from four WRF PBL schemes and WRF/CALMET with the observation from ground-based Lidar.
Atmosphere 09 00078 g008
Figure 9. Correlationship between the hygroscopic growth factor and the relative humidity across four seasons over the Sichuan Basin.
Atmosphere 09 00078 g009
Figure 10. Correlation analysis between the aerosol extinction coefficient and the fitted surface-level PM2.5 concentration for the site of Southwest Jiao-tong University. (a) Results from vertical correction; and (b) Results from the vertical and humidity corrections.
Atmosphere 09 00078 g010
Figure 11. The temopal and spatial distribution of retrieved high-resolution PM2.5 concentrations across the Sichuan Basin during 1 November 2013 to 31 October 2014. (ad) spring, summer, autumn and winter, respectively.
Atmosphere 09 00078 g011
Figure 12. Time series evaluation of retrieved ground-level PM2.5 with surface measurements at the sites of Yibin, Dazhou, and Deyang during 1 November 2013 to 31 October 2014.
Atmosphere 09 00078 g012
Figure 13. Comparison of daily averaged PM2.5 retrieved from MODIS and ground-observed (site: YB, DZ and DY) in different seasons.
Atmosphere 09 00078 g013

