Article

Spatio-Temporal Pattern Estimation of PM2.5 in Beijing-Tianjin-Hebei Region Based on MODIS AOD and Meteorological Data Using the Back Propagation Neural Network

1
State Key Laboratory of Remote Sensing Science, Institute of Remote Sensing and Digital Earth, Chinese Academy of Sciences, Beijing 100101, China
2
Ecology Observing Network and Modeling Laboratory, Institute of Geographic and Nature Resources Research, Chinese Academy of Sciences, Beijing 100101, China
3
College of Geomatics, Shandong University of Science and Technology, Qingdao 266590, China
4
School of Life and Environmental Sciences, Schmid College of Science and Technology, Chapman University, Orange, CA 92866, USA
*
Author to whom correspondence should be addressed.
These authors contributed equally to this work.
Atmosphere 2018, 9(3), 105; https://doi.org/10.3390/atmos9030105
Submission received: 29 January 2018 / Revised: 7 March 2018 / Accepted: 9 March 2018 / Published: 13 March 2018
(This article belongs to the Section Aerosols)

Abstract

:
With the economic growth and increasing urbanization in the last three decades, the air quality over China has continuously degraded, which poses a great threat to human health. The concentration of fine particulate matter (PM2.5) directly affects the mortality of people living in the polluted areas where air quality is poor. The Beijing-Tianjin-Hebei (BTH) region, one of the well organized urban regions in northern China, has suffered with poor air quality and atmospheric pollution due to recent growth of the industrial sector and vehicle emissions. In the present study, we used the back propagation neural network model approach to estimate the spatial distribution of PM2.5 concentration in the BTH region for the period January 2014–December 2016, combining the satellite-derived aerosol optical depth (S-DAOD) and meteorological data. The results were validated using the ground PM2.5 data. The general method including all PM2.5 training data and 10-fold cross-method have been used for validation for PM2.5 estimation (R2 = 0.68, RMSE = 20.99 for general validation; R2 = 0.54, RMSE = 24.13 for cross-method validation). The study provides a new approach to monitoring the distribution of PM2.5 concentration. The results discussed in the present paper will be of great help to government agencies in developing and implementing environmental conservation policy.

1. Introduction

The exposure of people to fine particulate matter (PM2.5, particles with aerodynamic diameter less than 2.5 µm) is associated with cardiovascular suffering and respiratory problems [1,2,3,4]. The sources of PM2.5 are both natural and anthropogenic emissions. Although it accounts for a small proportion of the particles in Earth’s atmosphere, PM2.5 degrades the air quality and enhances atmospheric photochemical reactions [5,6]. In recent years, with intensive economic development and urbanization, the concentration of PM2.5 has increased in most cities, including Beijing, the capital of China [7]. Such increases in PM2.5 degrades air quality, posing a serious threat to human health and affecting day-to-day weather conditions. High concentrations of PM2.5 with favorable meteorological conditions (relative humidity and air temperature) are responsible for the dense fog and haze conditions.
In the wake of poor air quality in major cities such as Beijing, the Chinese government has established ground-based monitoring stations in major cities that provide data on atmospheric pollution and air quality (including the PM2.5 concentration). The routine ground monitor stations cannot provide the spatiotemporal concentration of PM2.5. For the spatial distribution of PM2.5, the satellite-derived aerosol optical depths (S-DAODs) have been used to estimate PM2.5 concentration [8,9,10,11,12]. A number of studies have employed regression models of AOD–PM2.5 to estimate the ground-level PM2.5 concentration from S-DAOD data [10,13,14,15,16,17]. However, these statistical models still have a key problem, in that statistical approaches were limited to specific regions and times [18,19,20,21]. There are actually no effective statistical models to estimate PM2.5 concentration with high precision in large regions [22,23]. In addition, earlier studies tended to obtain PM2.5 concentration by using low spatial resolution AOD products (10 km), until the 3 km Moderate Resolution Imaging Spectroradiometer (MODIS)AOD product (Collection 6) was recently released [24]. Although there could be slightly higher errors over land in the 3 km MODIS AOD product compared to the 10 km product, the 3 km MODIS AOD product has more capabilities for estimating PM2.5 concentration on finer scales.
Efforts have not been made to use any statistical model for estimating PM2.5 concentration using the 3 km MODIS AOD product in the Beijing-Tianjin-Hebei (BTH) region. As an attempt, we developed a back propagation neural-network (BPNN) model to estimate PM2.5 concentration in the BTH region by combining meteorological data and the 3 km MODIS AOD data. At the same time, the effectiveness of the BPNN model in estimating PM2.5 concentration was validated using ground data.

2. Materials and Methods
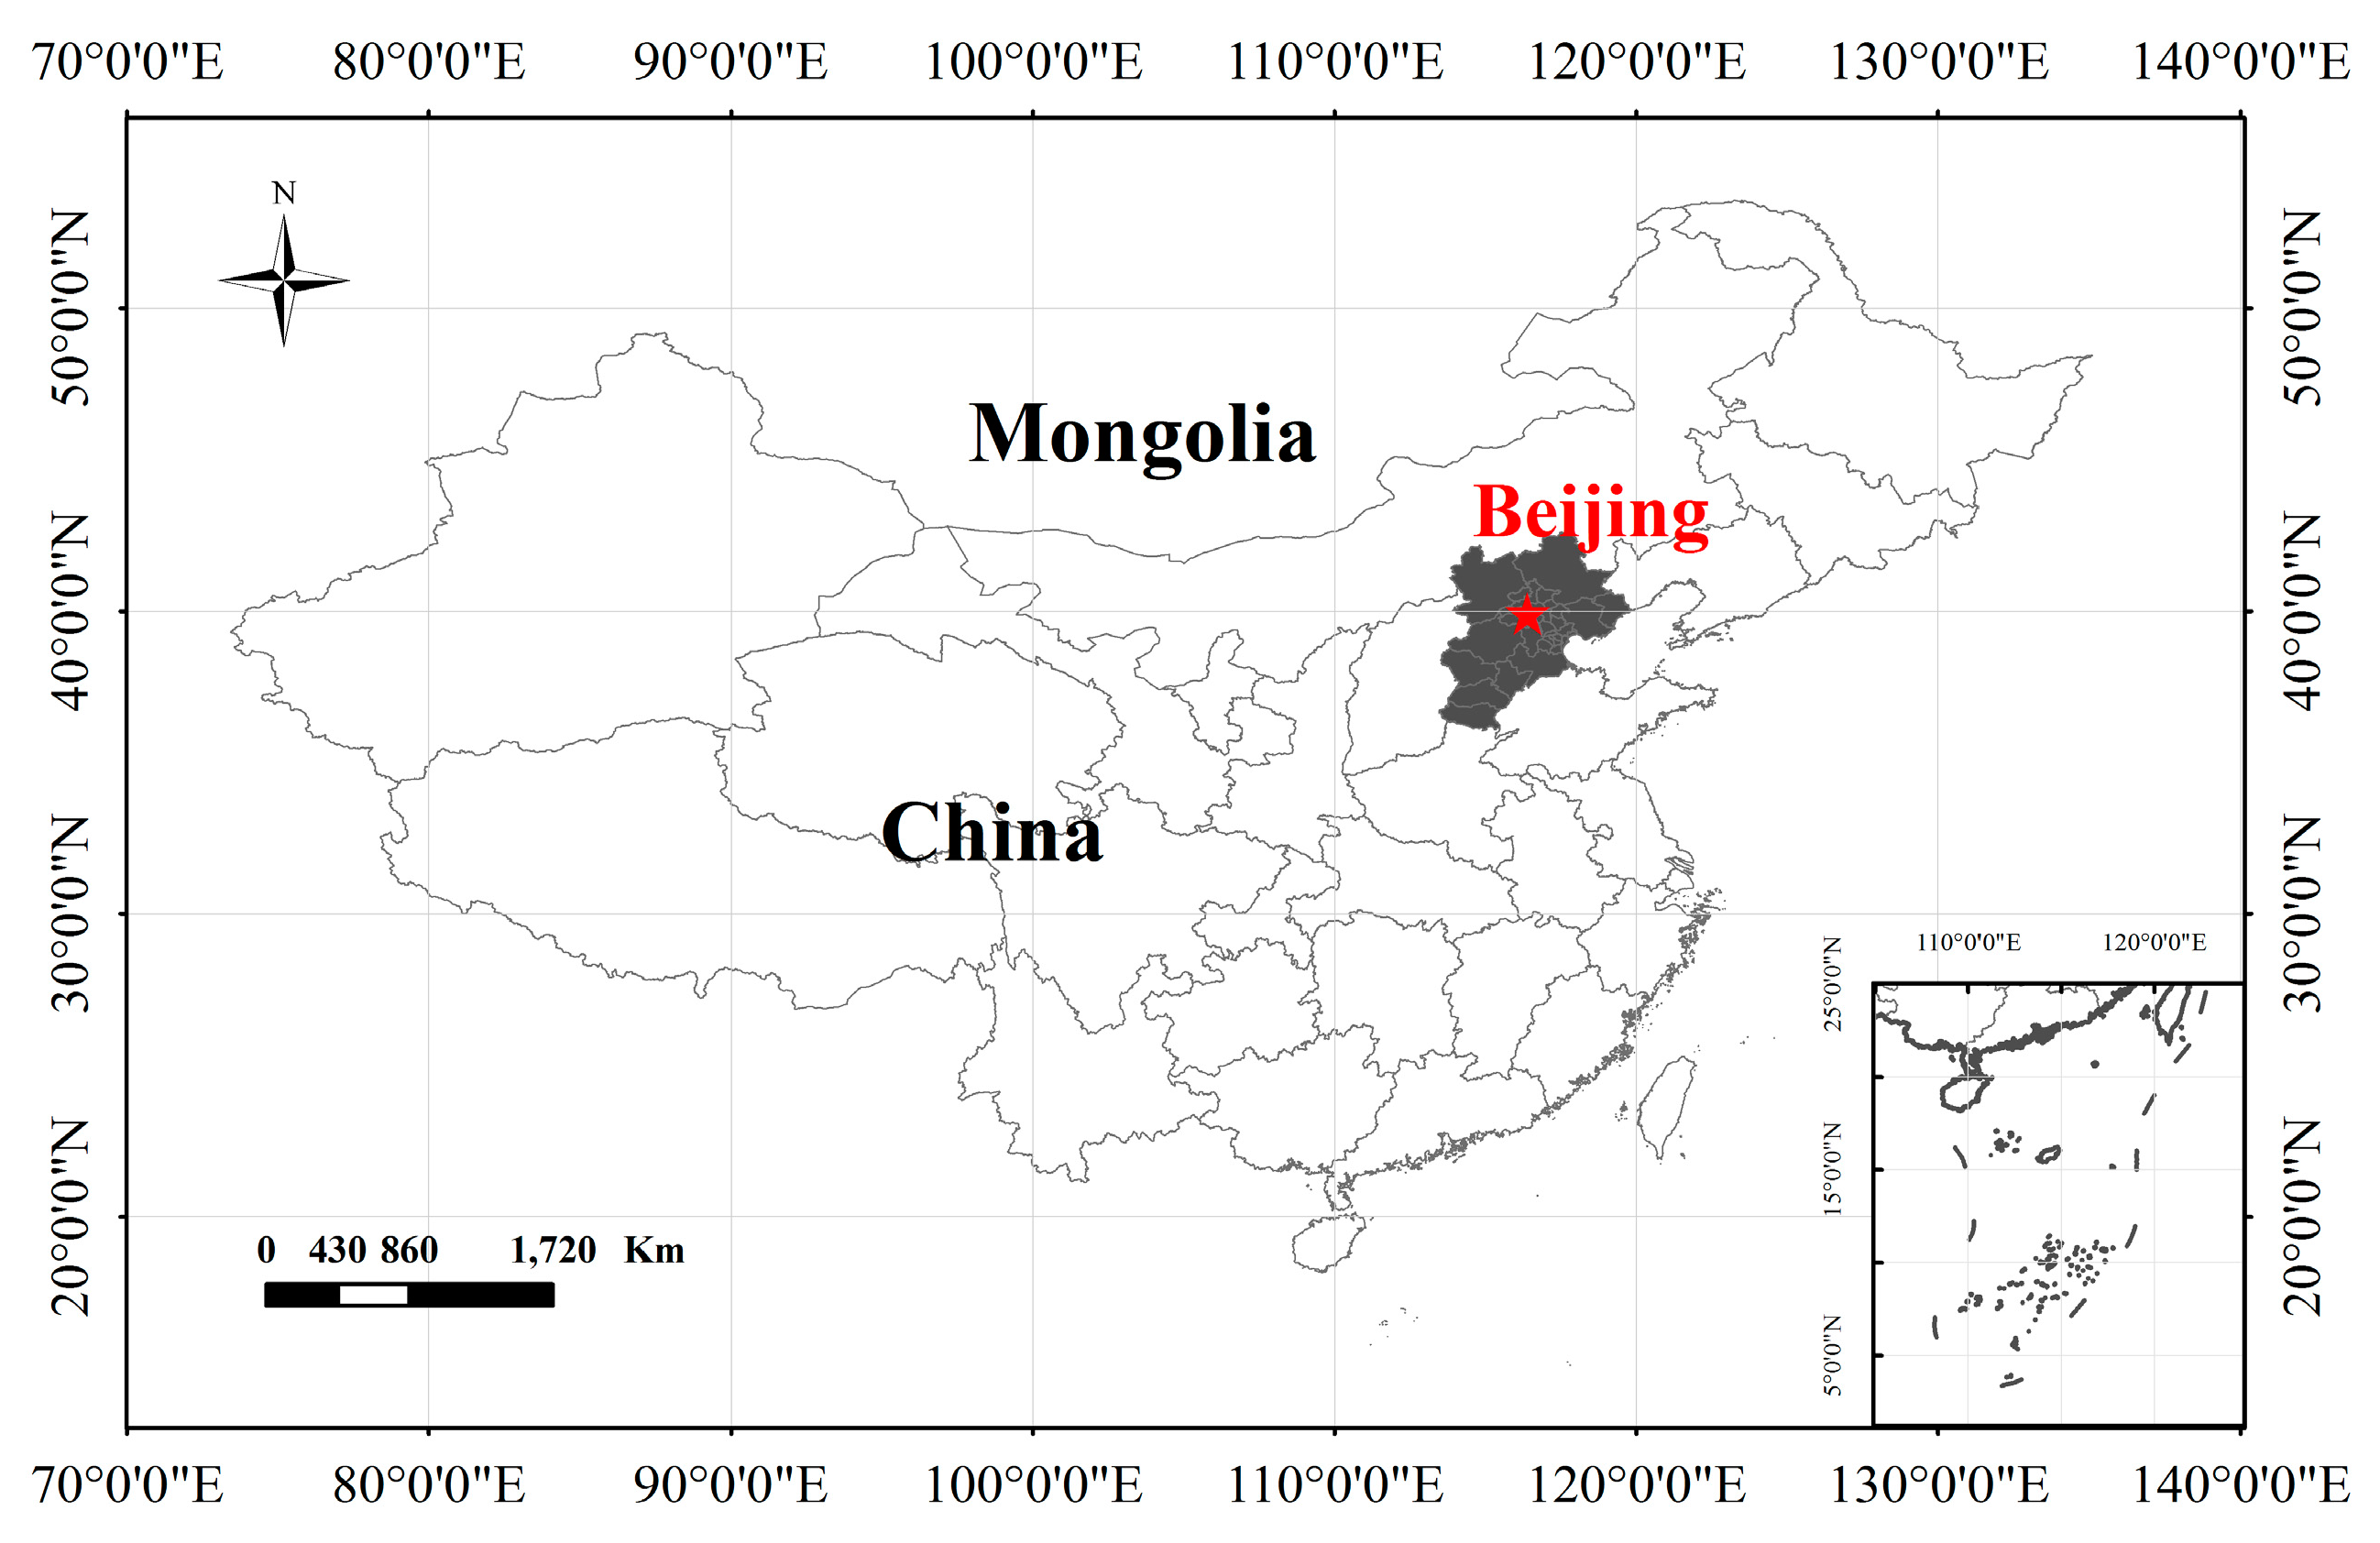
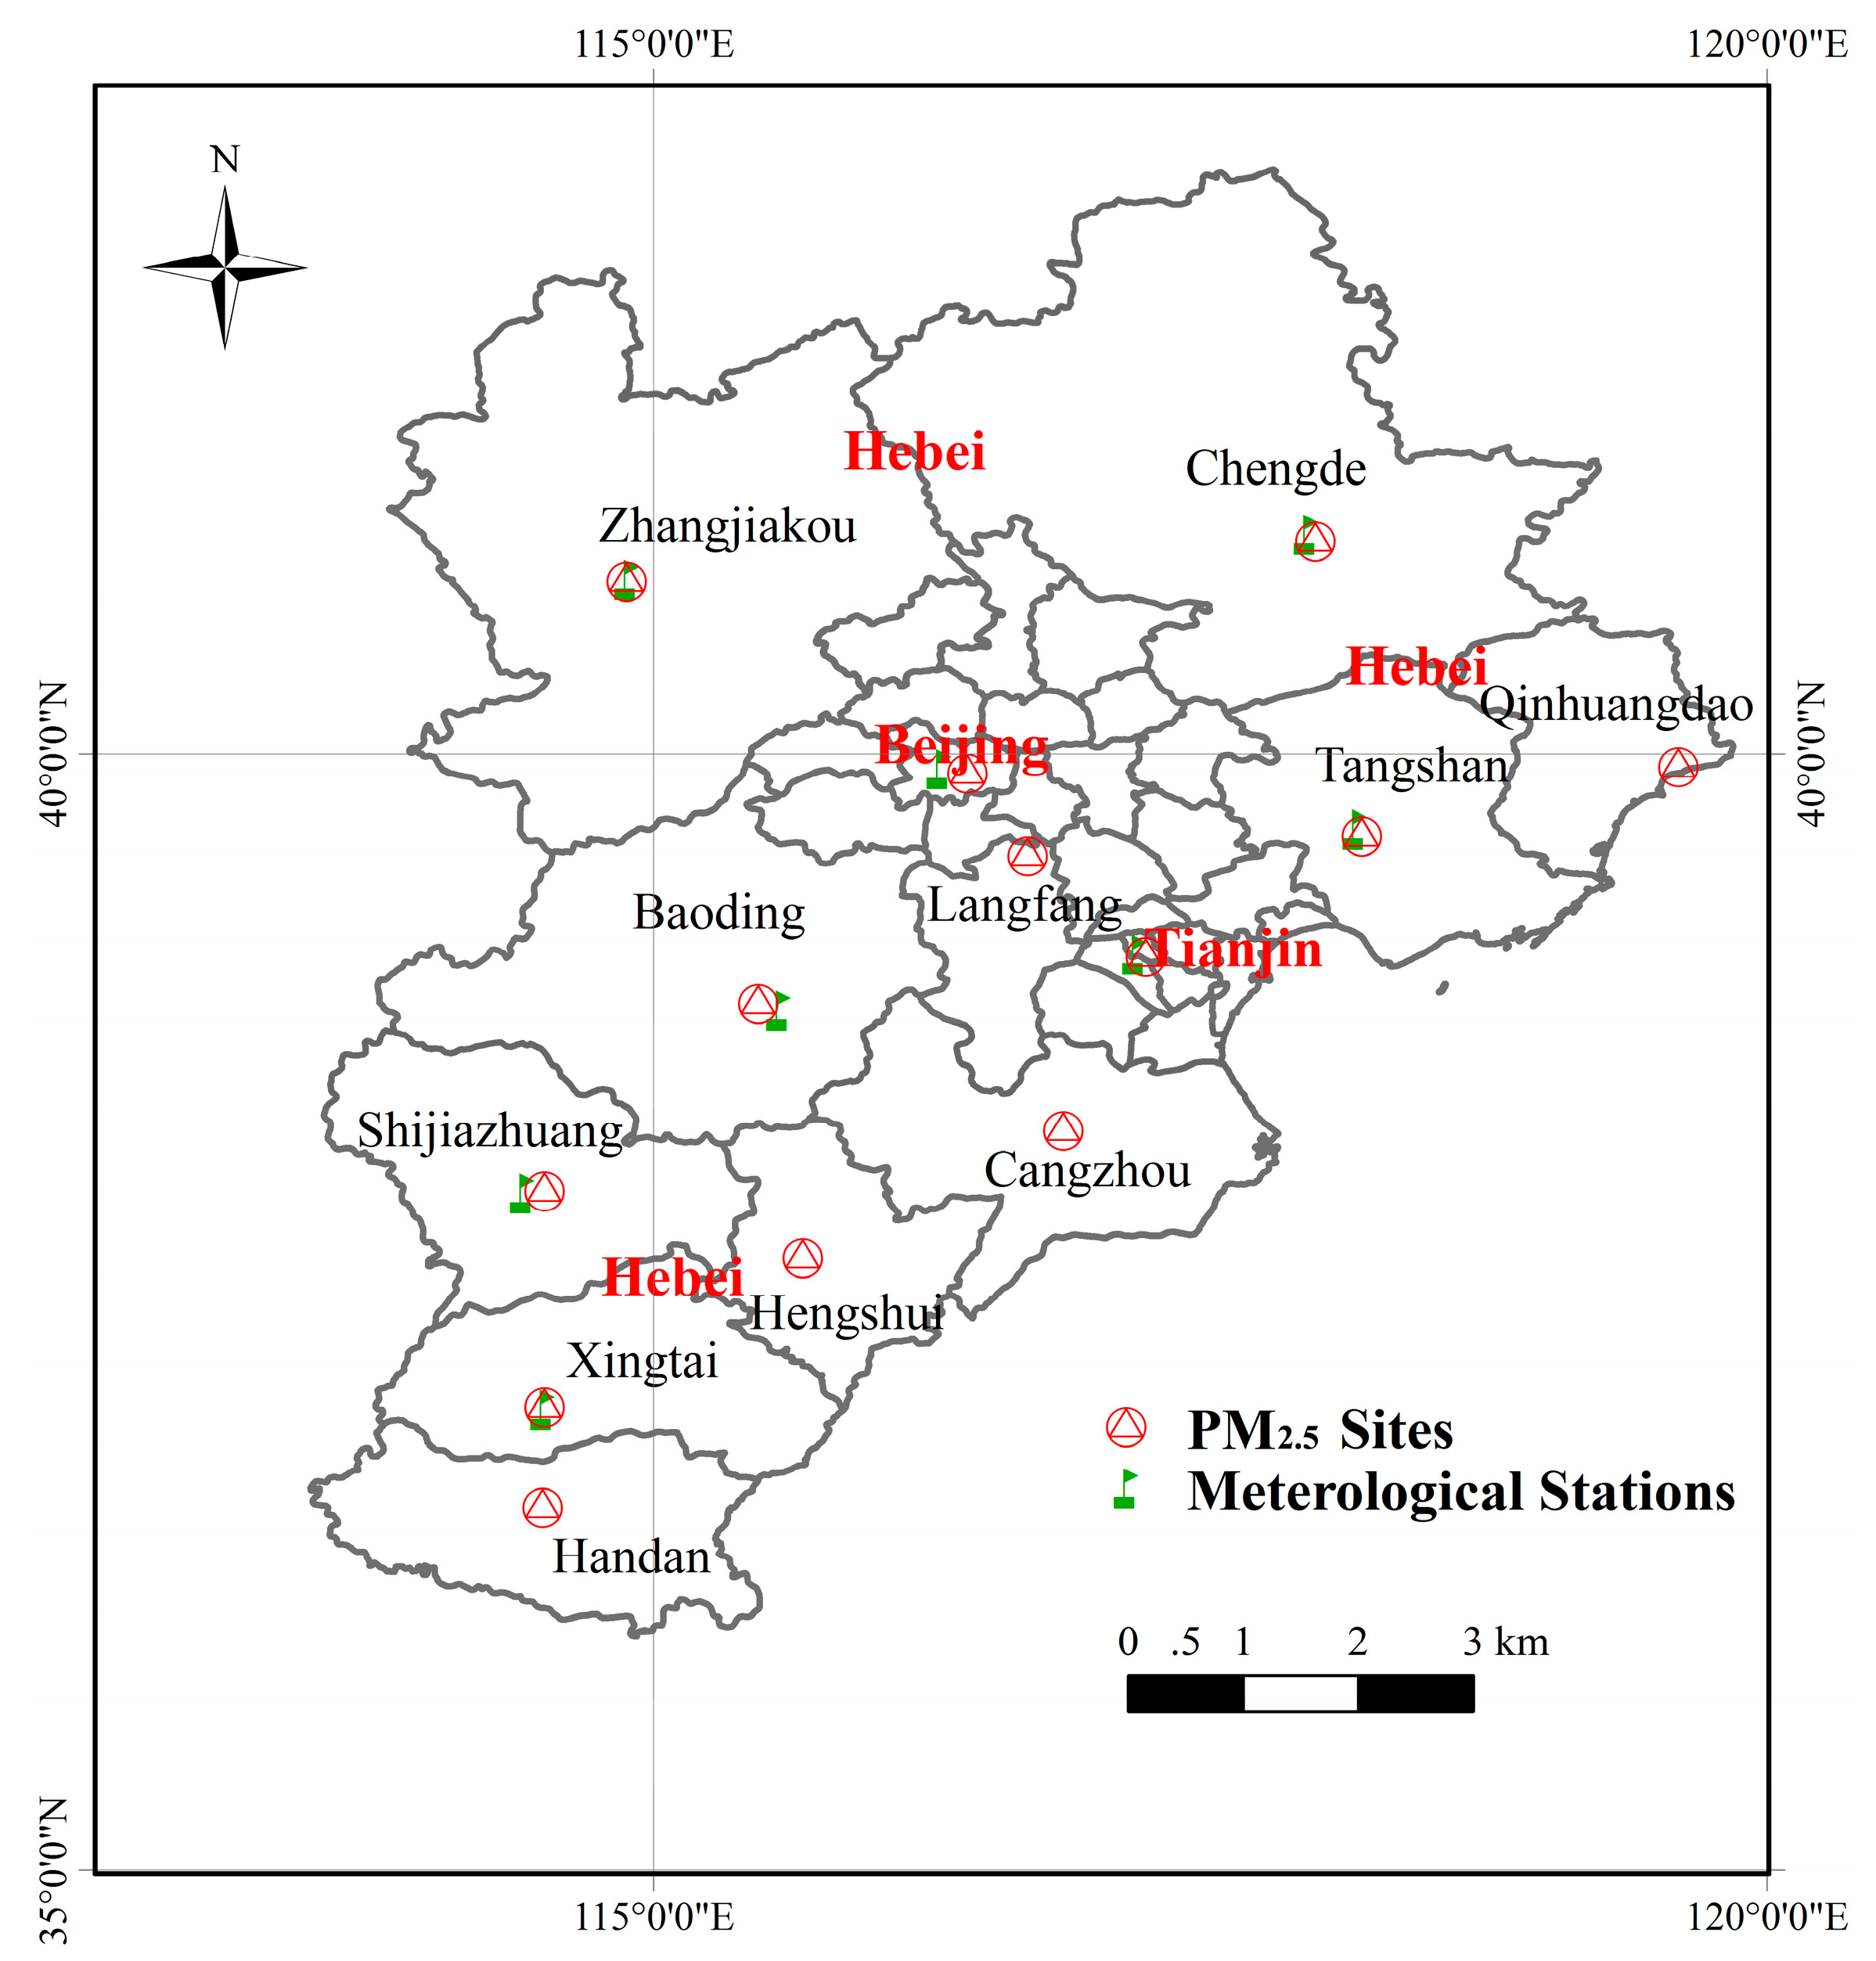
2.1. Study Area

The BTH region is the one of the largest urban economic circles (UECs) in Northern China (Figure 1), and covers an area of 218,000 km2 with total a population of 110 million (about 8% of China’s population). The region consists of two municipalities (Beijing and Tianjin) and one province (Hebei), which includes eleven prefecture-level cities (Shijiazhuang, Baoding, Langfang, Tangshan, Zhangjiakou, Chengde, Qinhuangdao, Cangzhou, Hengshui, Xingtai, and Handan) [25,26,27].
Due to various factors (including huge population, high-speed urbanization, industrial processes, transportation, coal consumption for winter heating, etc.), the BTH region suffers from serious air pollution. During the past several years, the PM2.5 concentrations in the BTH region have reached an alarming level. The annual average PM2.5 concentration in some cities of the BTH region was five times higher than the national standard (15 μg/m3) and eight times higher than the WHO guidelines (10 μg/m3) [27].

2.2. Data

The data used in the present study mainly include ground-measured PM2.5, satellite data, and meteorological data (details are given in Table 1).

2.2.1. Ground PM2.5 Measurements

The Ministry of Environmental Protection of the People’s Republic of China (MEPCN) has set up more than 900 air-quality monitoring sites in China for the purpose of monitoring air quality (PM2.5 and PM10 concentration); hourly and 24 h average (daily-mean) PM2.5 data are available through the national urban air quality real-time publishing platform [28]. Figure 1 shows the locations of 79 ground PM2.5 monitoring stations. We have used the daily-mean PM2.5 concentration data to validate the model estimate of PM2.5.

2.2.2. Meteorological Data

The meteorological parameters (precipitation, air temperature, surface wind speed, relative humidity, surface pressure, and average visibility) were used in the present study together with satellite data. The meteorological parameters (annual averages, monthly averages, and daily averages) were downloaded from the global climate data (GCD) [29] which provide historical climate data based on more than 9000 stations distributed globally since 1929. In the BTH region, daily meteorological data from eight stations have been used in the present study for the period 2014–2016. In order to generate the gridded maps of variables from these stations, the ordinary kriging method has been used to interpolate meteorological parameters [30,31,32].

2.2.3. Satellite AOD Dataset

There are two types of MODIS AOD products with 10 km and 3 km spatial resolution. The 10 km MODIS AOD product is important to study local estimate of climate and its dynamics. However, for local climate study, fine resolution data are required [33]. The MODIS collection 6 (C6) with 3 km spatial resolution were released in the year 2013 [34,35]. The latest version of AOD product (C6) [36] have been validated using AOD observations [37]. In spite of a limitation that expected errors over land, we considered the 3 km × 3 km MODIS AOD product for the period 2014–2016 compared to the 10 km MODIS AOD product. The 3 km data product provides finer information that provides effective supplements for the existing 10 km product in estimating PM2.5 [24].

2.3. Methodology

The approach used in the present study contains two modules: data pre-processing and model construction (flow chart, Figure 2). The model construction module consists of the artificial neural network (ANN) model construction and model validation.

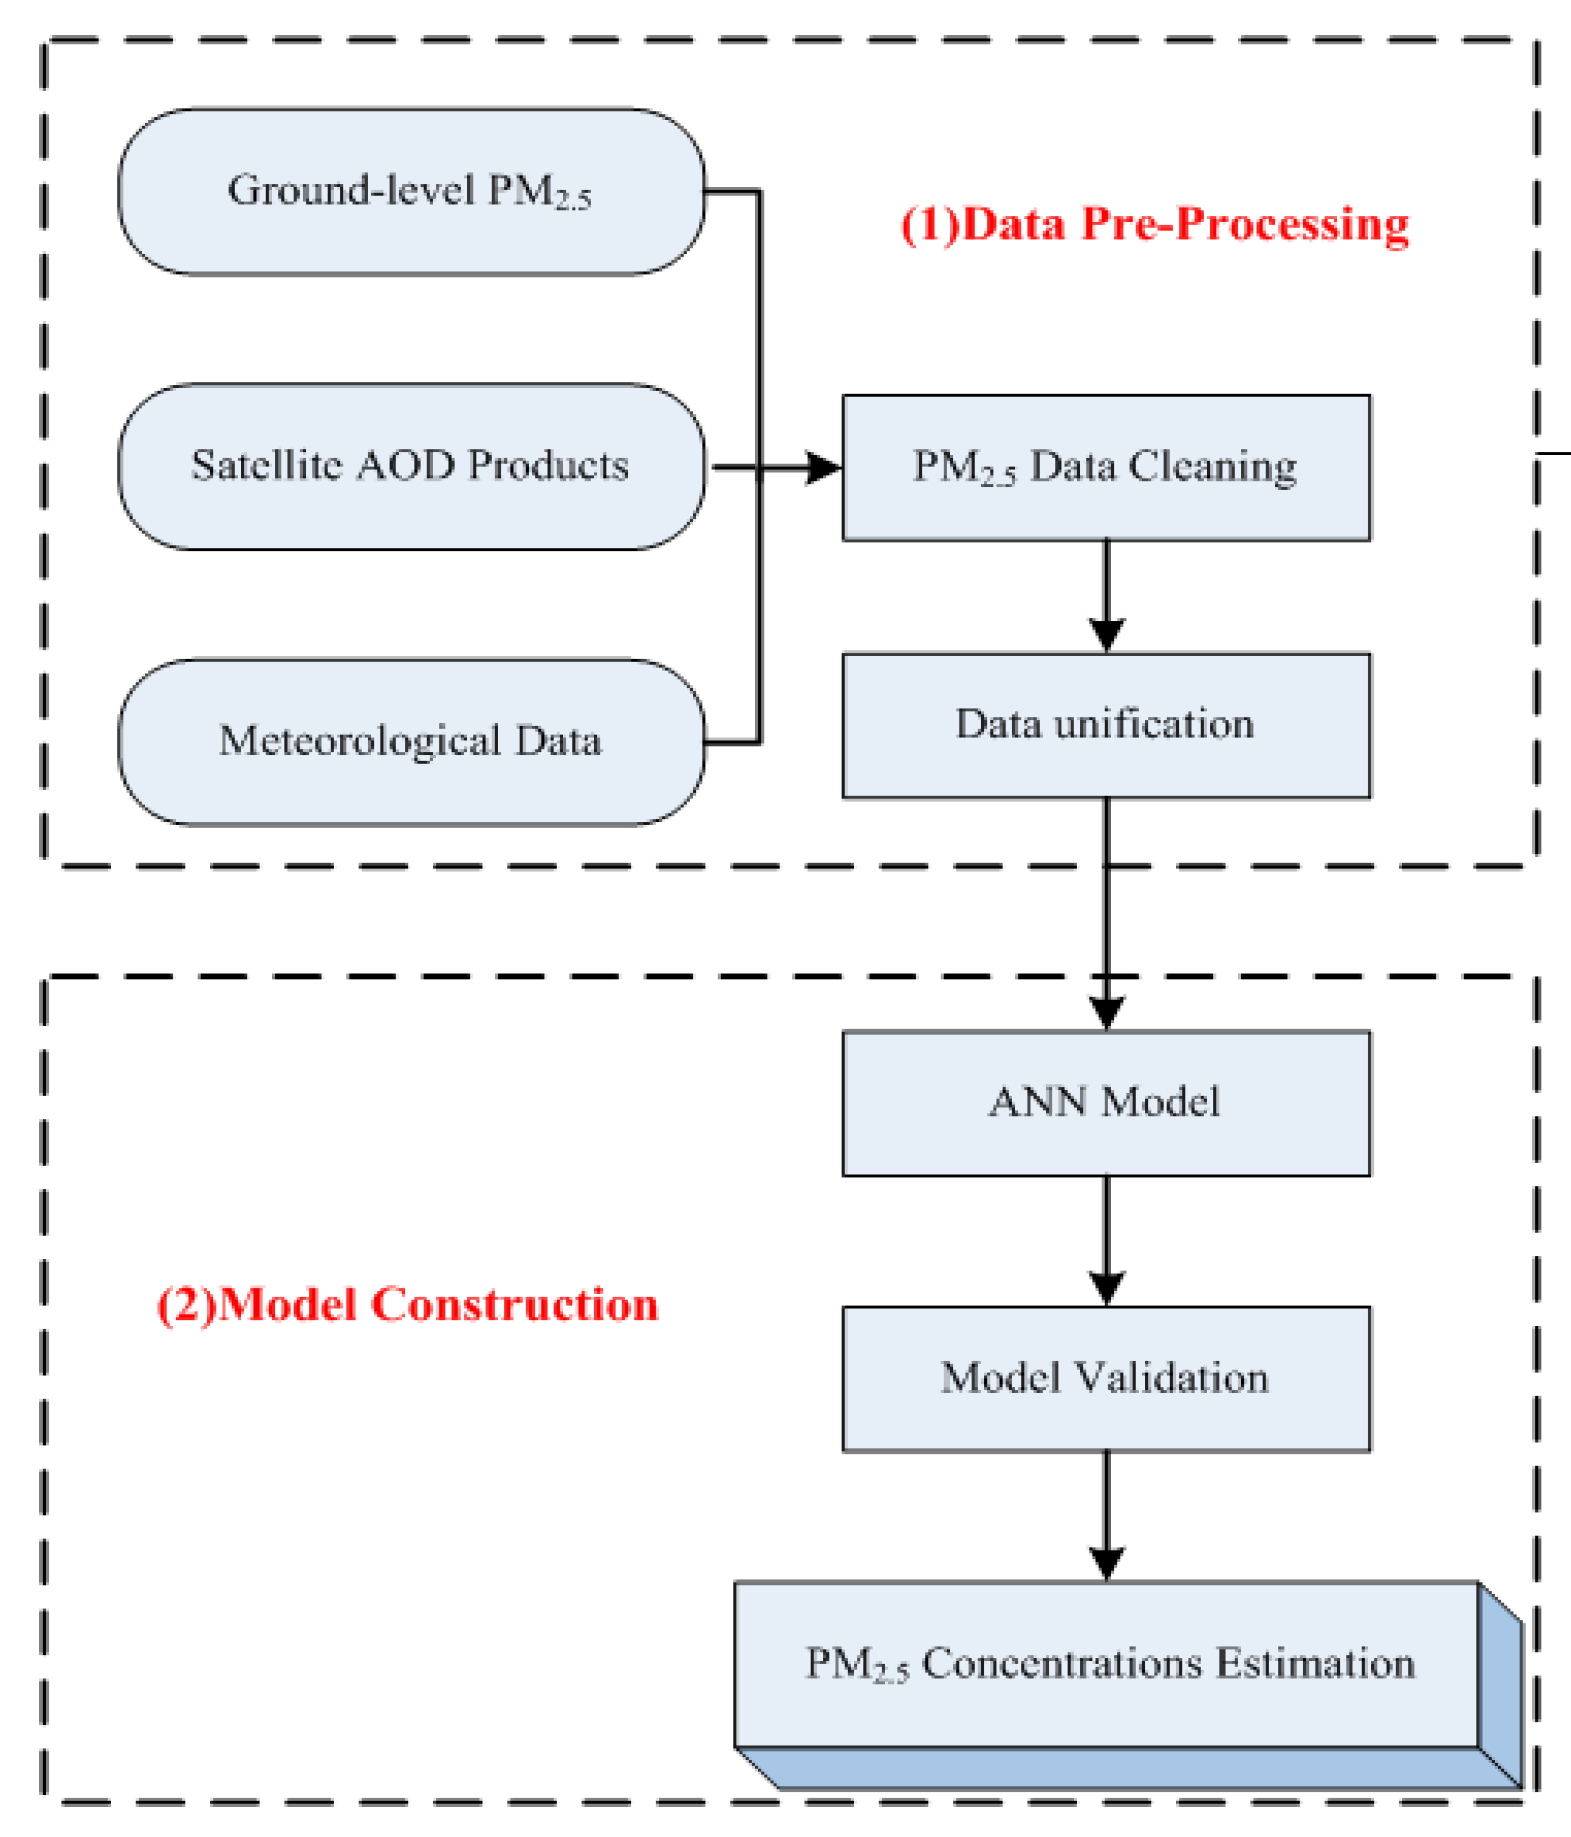
2.3.1. Data Pre-Processing
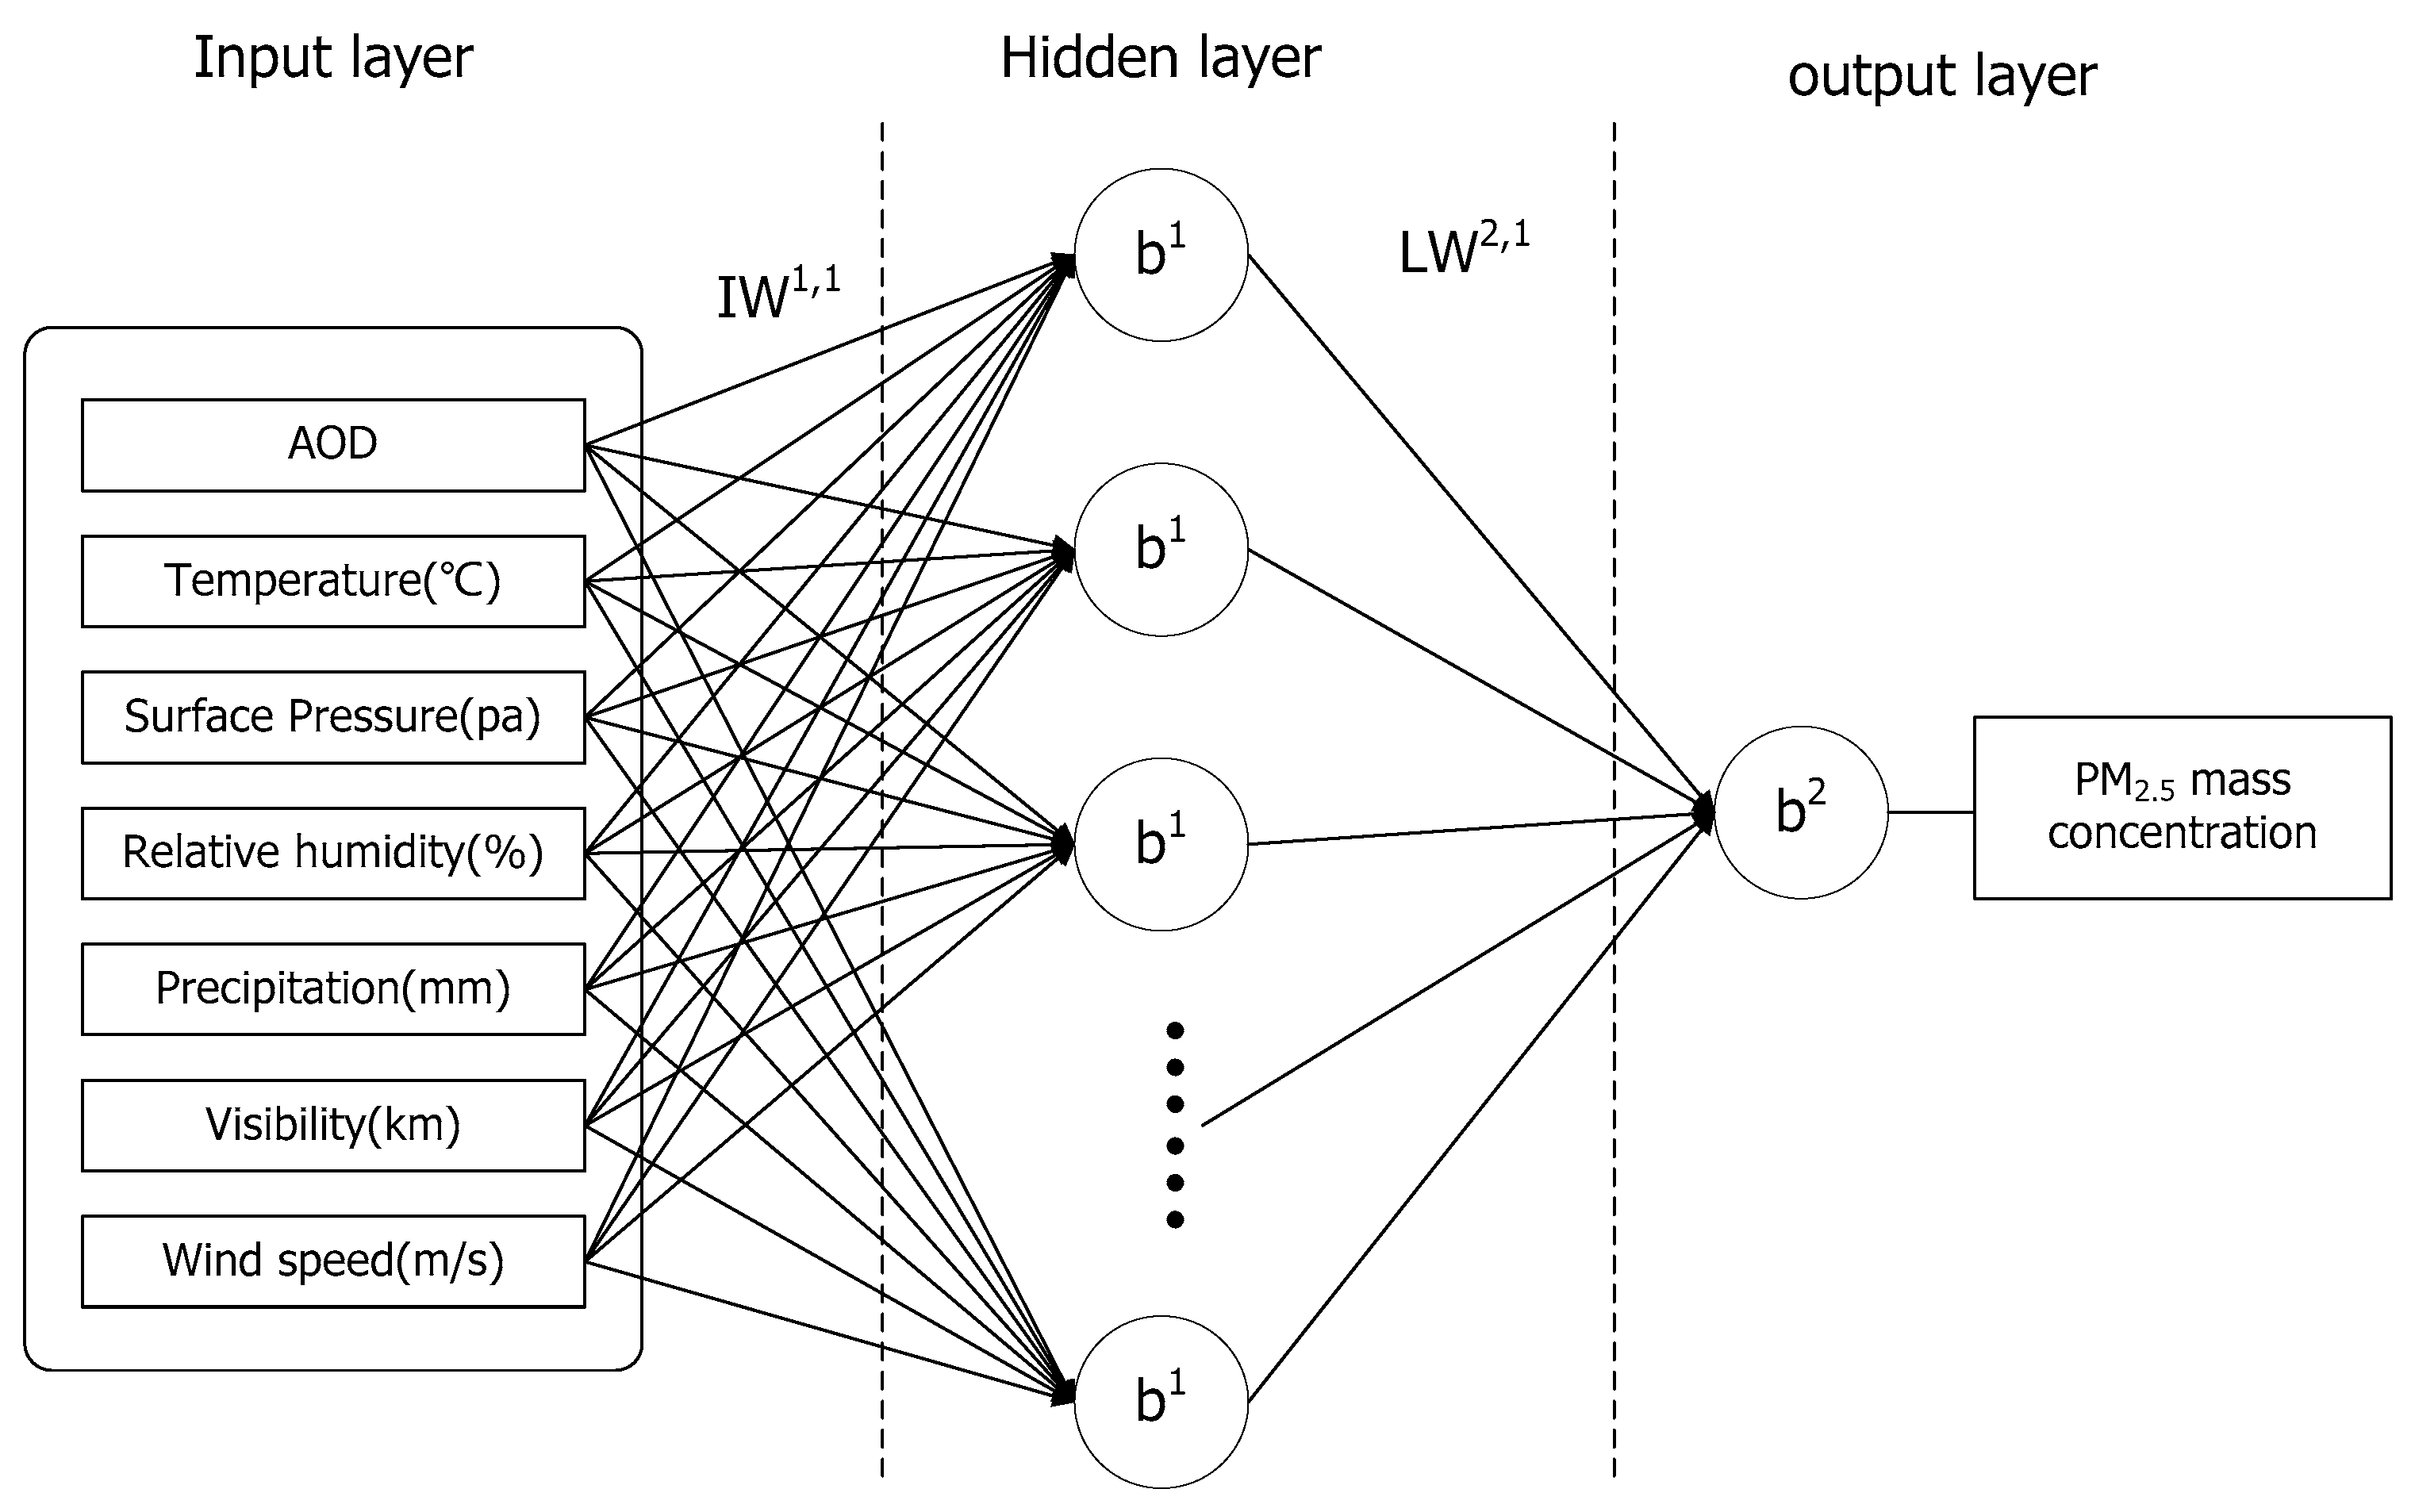
We considered the World Geodetic System 1984 geographical coordinate system. The meteorological dataset was interpolated to 3 km resolution using an ordinary kriging method to generate the daily gridded maps [30]. For the PM2.5 concentration, we considered daily-average PM2.5 concentration, meteorological parameters (precipitation, air temperature, surface wind speed, relative humidity, surface pressure, and average visibility), and AOD data collocated in time and space. Sometimes, satellite-derived AOD are missing due to coverage and cloudy conditions, so validation with ground observed PM2.5 may not be valid.

2.3.2. ANN Model

We used the artificial neural network (ANN) algorithm to model PM2.5 concentration based on the meteorological variables and satellite-derived AOD data. The ANN algorithms are black-box models of artificial intelligence [38]. There have been more than 30 different neural network models that were developed and widely used [39,40]. We used a back-propagation neural network (BPNN) algorithm to build the PM2.5 estimation model for predicting the PM2.5 concentration [41]. The estimation of the PM2.5 concentration model consists of seven neurons in the input layer, seven neurons in the hidden layer, and one neuron in the output layer. The seven parameters in the input layer include precipitation, air temperature, surface pressure, wind speed, relative humidity, average visibility, and MODIS AOD products. The neuron in the output layer is PM2.5 concentration. Figure 3 shows the schematic diagram of the ANN model used in the present study.

2.3.3. Model Evaluation

To assess the performance of the model, the ground PM2.5 measured data were used for validation. We computed correlation coefficients, mean absolute percentage prediction error (APE), and root-mean-square error (RMSE). In addition, the 10-fold cross-validation method was used and it was found that the model over-estimated PM2.5 concentrations [42]. The whole dataset was split into ten, and approximately 90% of the total dataset datasets were used for model training and only 10% of the datasets for the validation of PM2.5 concentration.

3. Results and Discussion

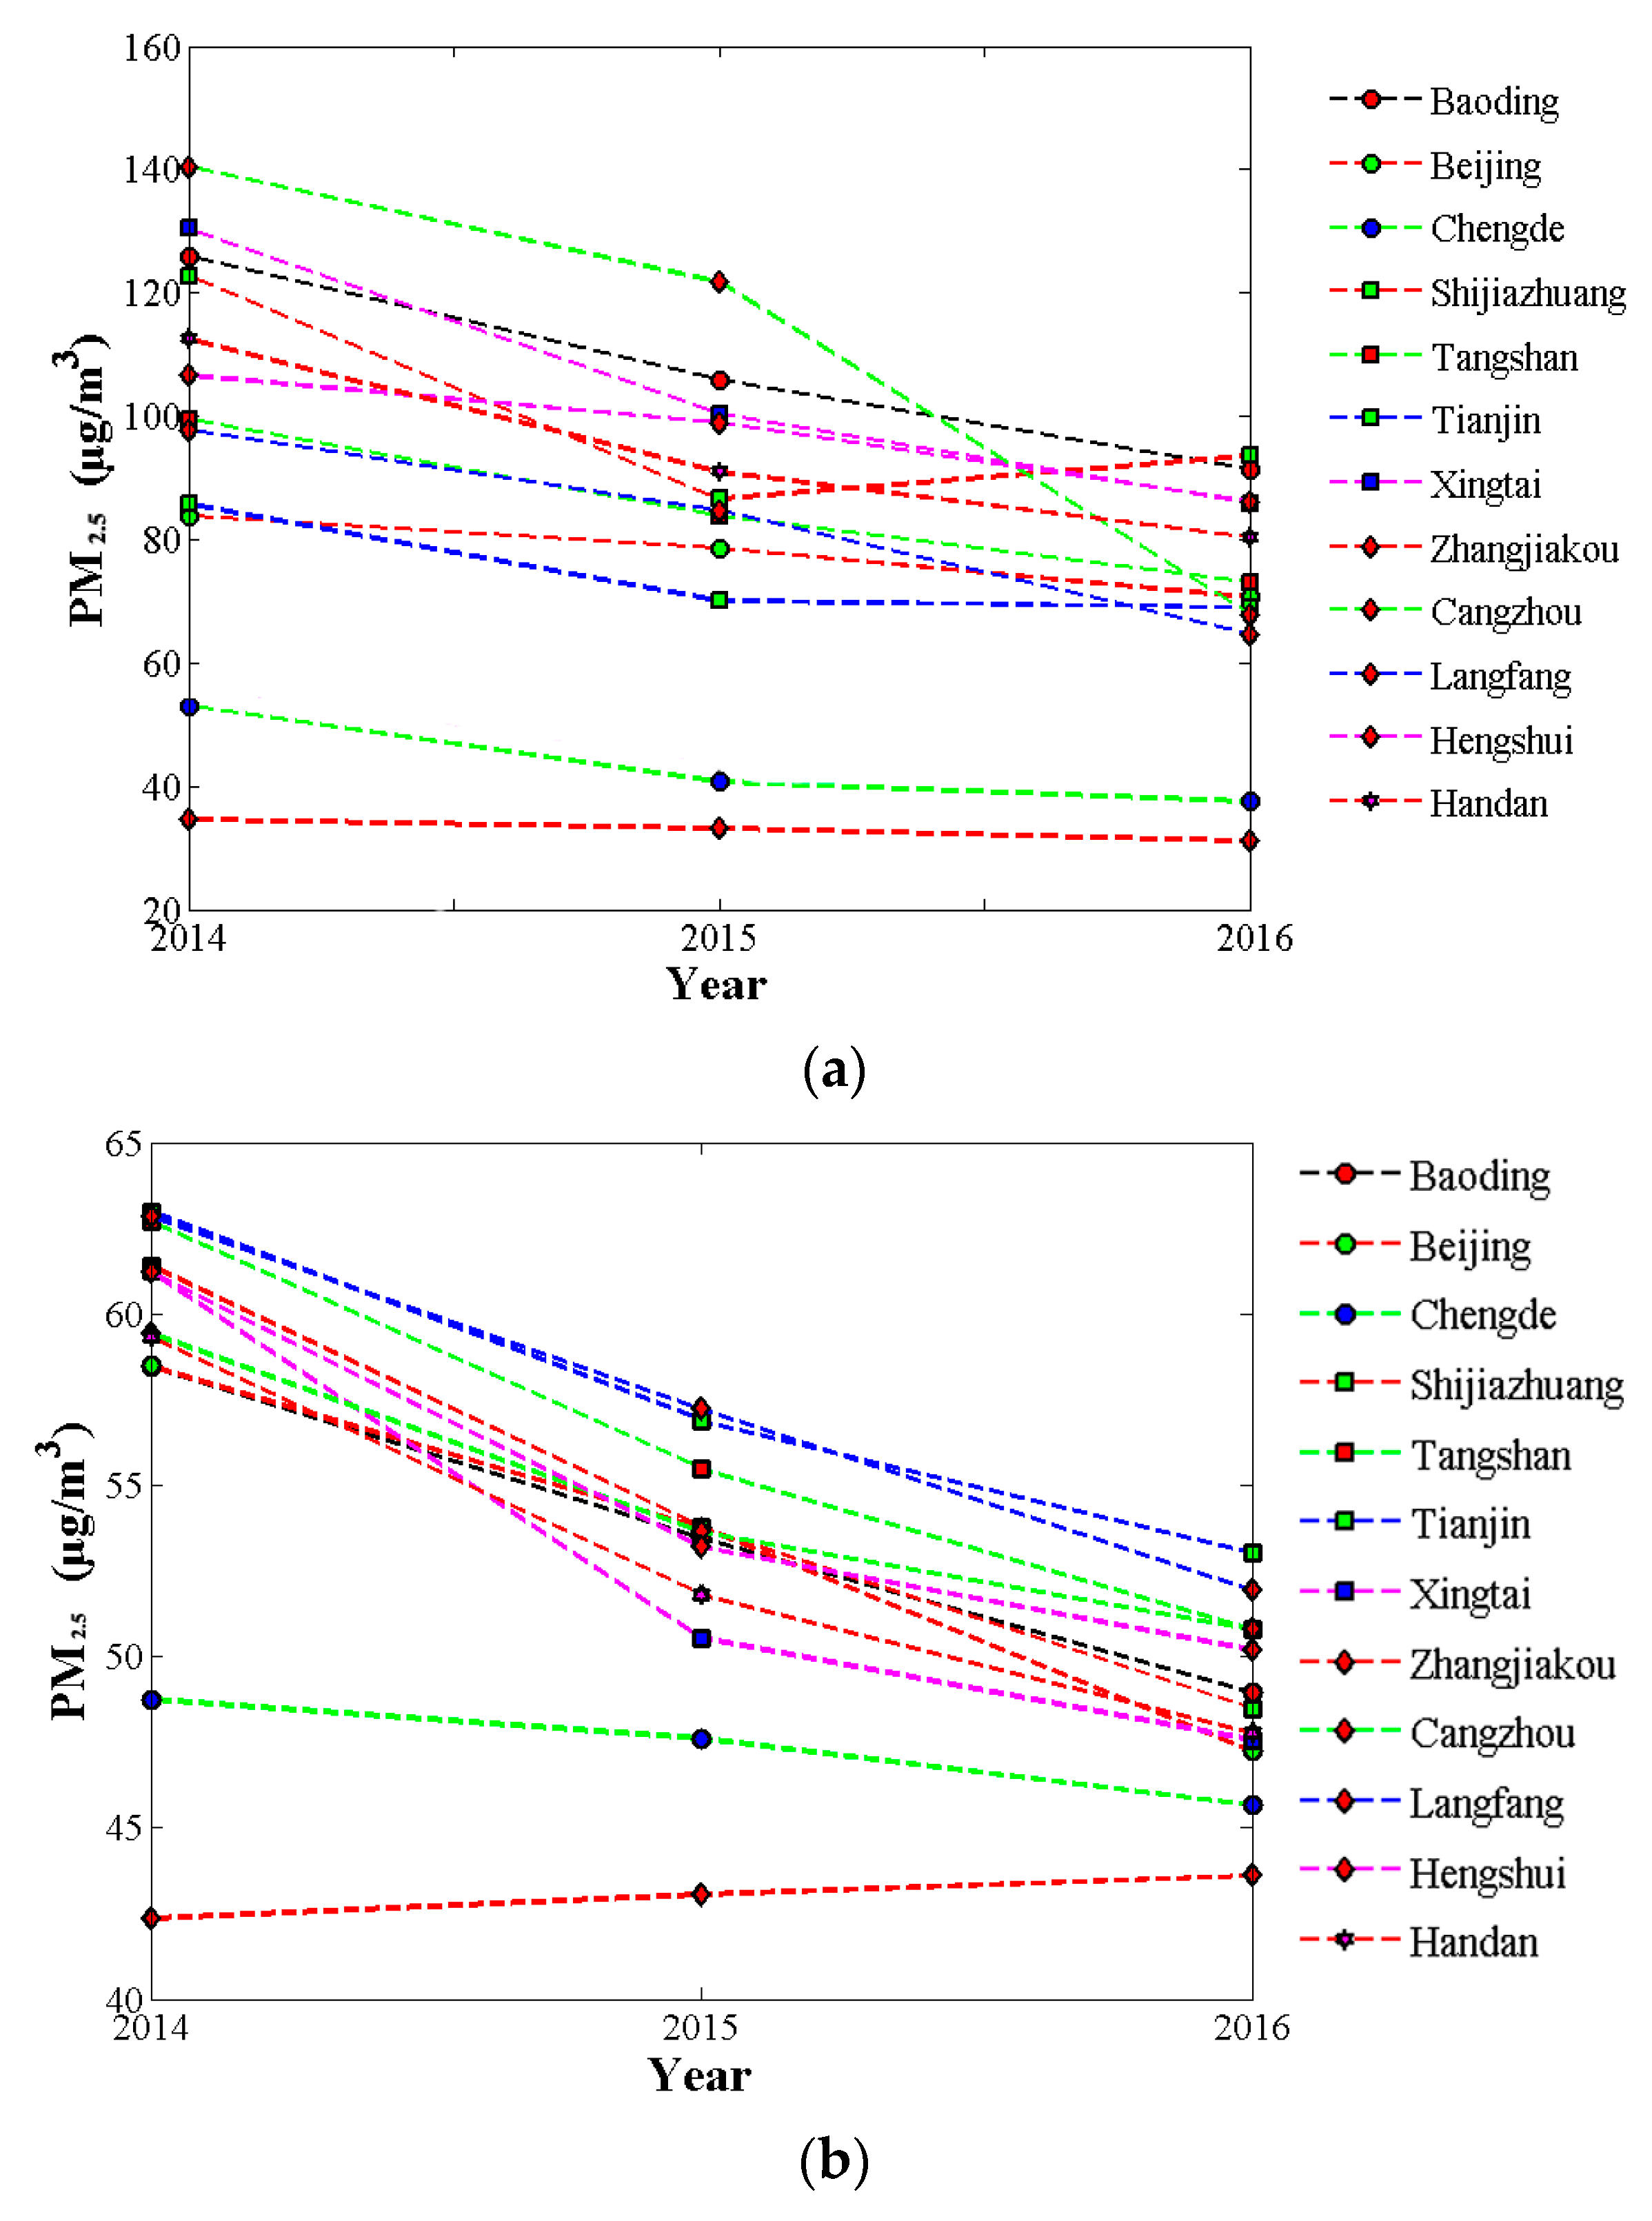
3.1. Descriptive Statistics

Table 2 shows details of PM2.5 and the model inputs. The annual mean and standard deviation of MODIS AOD were 0.64 and 0.60, respectively, in the study region. The annual mean value and the standard deviation (SD) of ground-level PM2.5 concentration, respectively, were 81.33 μ g / m 3 and 53.19 μ g / m 3 . The annual mean visibility values varied in the range 0.30–29.9 km, and surface air temperature varied in the range −10.10 °C to 38.10 °C. The annual mean precipitation was 2.52 mm, and relative humidity was 55.04%, which implies relatively dry atmospheric conditions. The wind speed varied in the range 1.50–39.60 m/s.

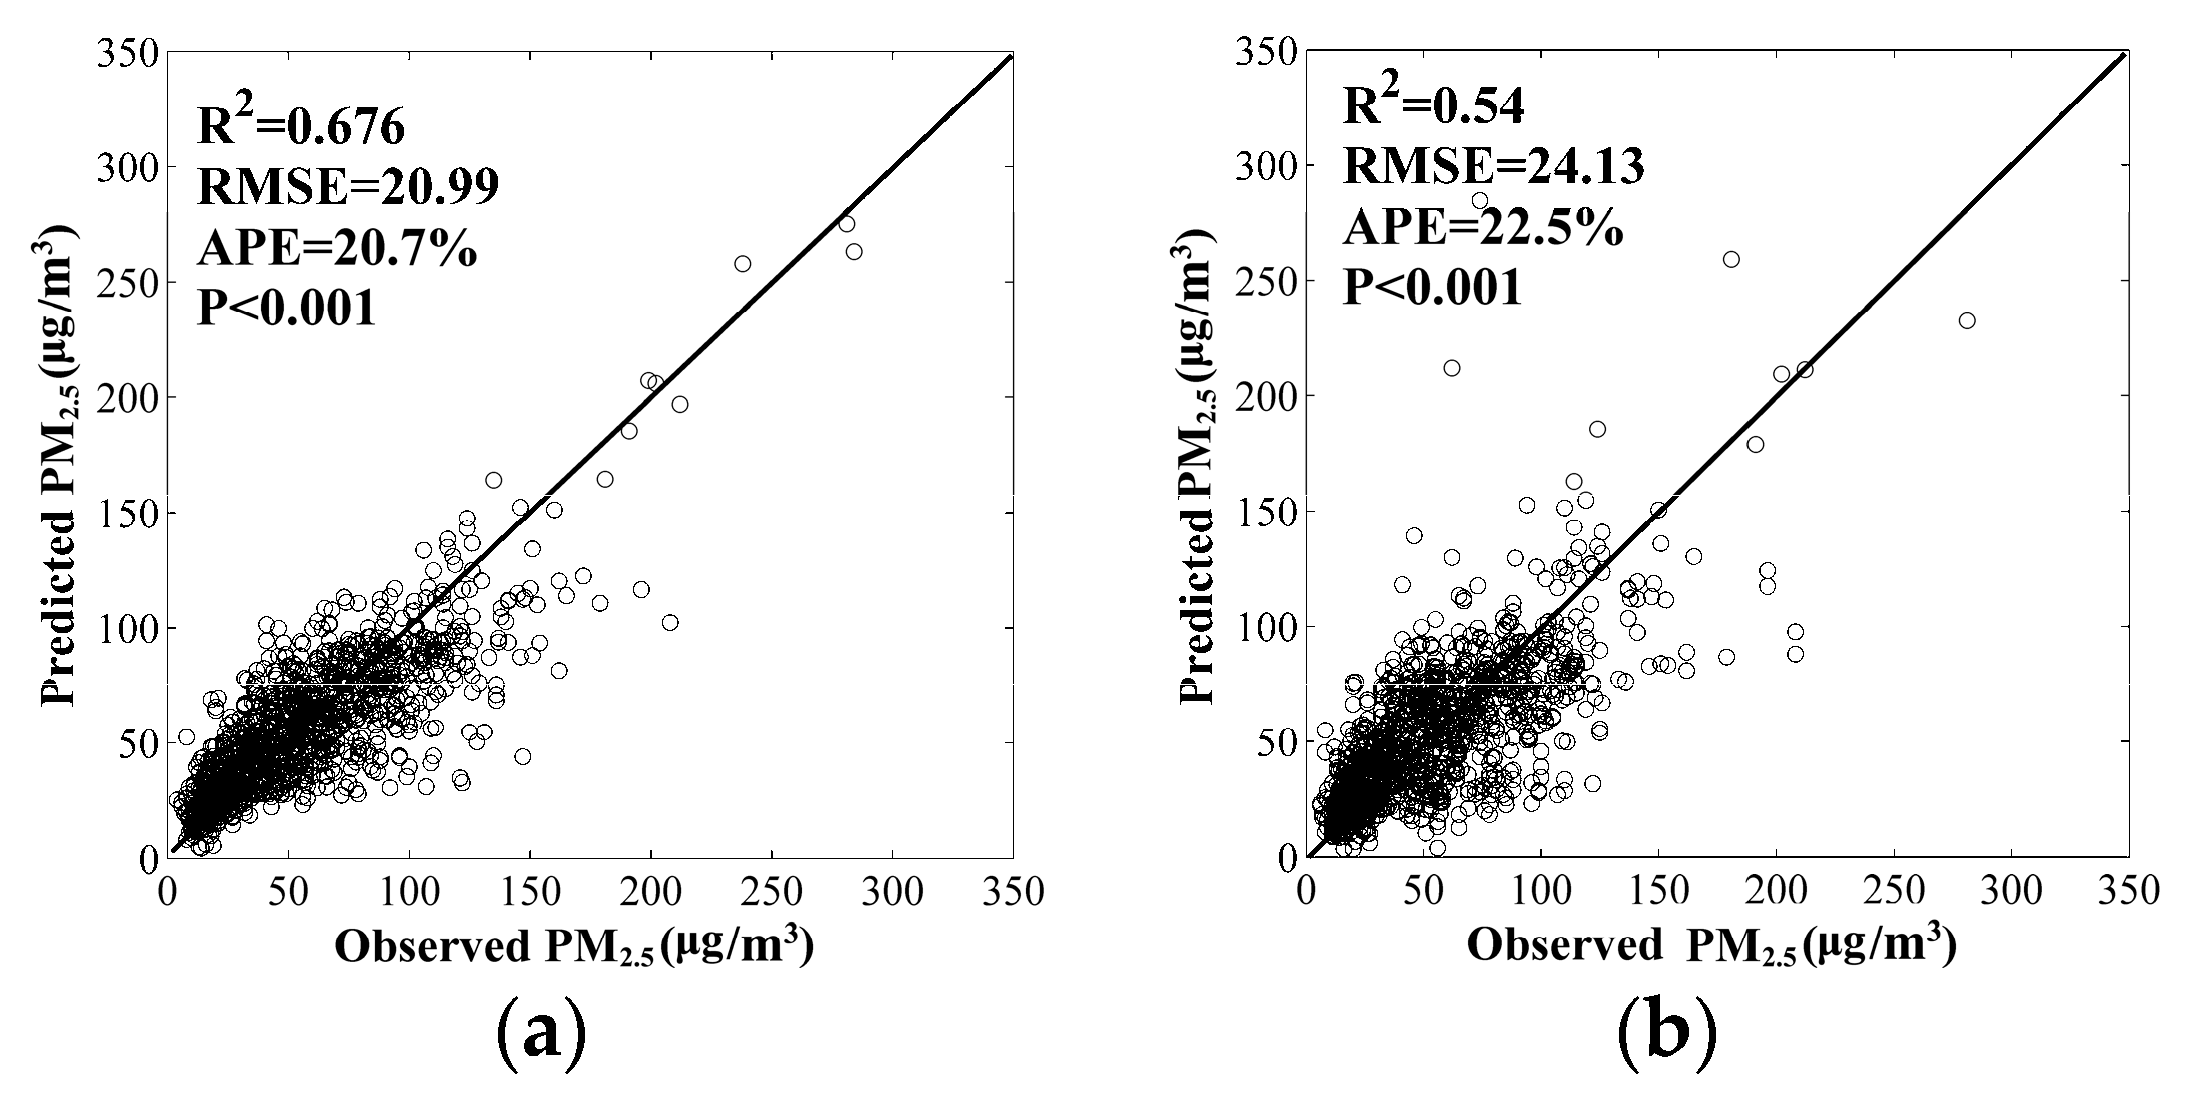
3.2. Model Validation

We used PM2.5 concentration data from 79 ground stations to build the BPNN model and validated the estimated PM2.5 values with the ground-observed data. Figure 4 shows the scatter plots between the model-derived PM2.5 predictions and the actual ground-measured PM2.5 concentration.
We considered two methods to validate the effectiveness of the PM2.5 concentration model in the present study. Figure 4a shows the validation results by comparing all the PM2.5 observations with corresponding predictions from the PM2.5 model estimation. The results show a good estimate of PM2.5 concentration (R2 = 0.68, RMSE = 20.99, APE = 20.70%). The scatter plots are distributed around the 1.0 slope of the fitting values, showing good estimate of the ground-observed data. Figure 4b shows the 10-fold cross-validation results with R2 0.54, RMSE 24.13, and APE 22.50%. The results obtained show that the PM2.5 concentration estimated from the model provide a very close estimation with the observed data. By comparing the two validation methods of the model-estimated PM2.5 concentration, the R2 of 10-fold cross-validation results decrease by approximately 0.13, and RMSE increases by approximately 3.14, which suggests that the estimated PM2.5 concentration is not substantially over-fitted. Finally, our results show that the BPNN PM2.5 concentration estimation model provides an accurate estimate because of the relative lower prediction error [22].

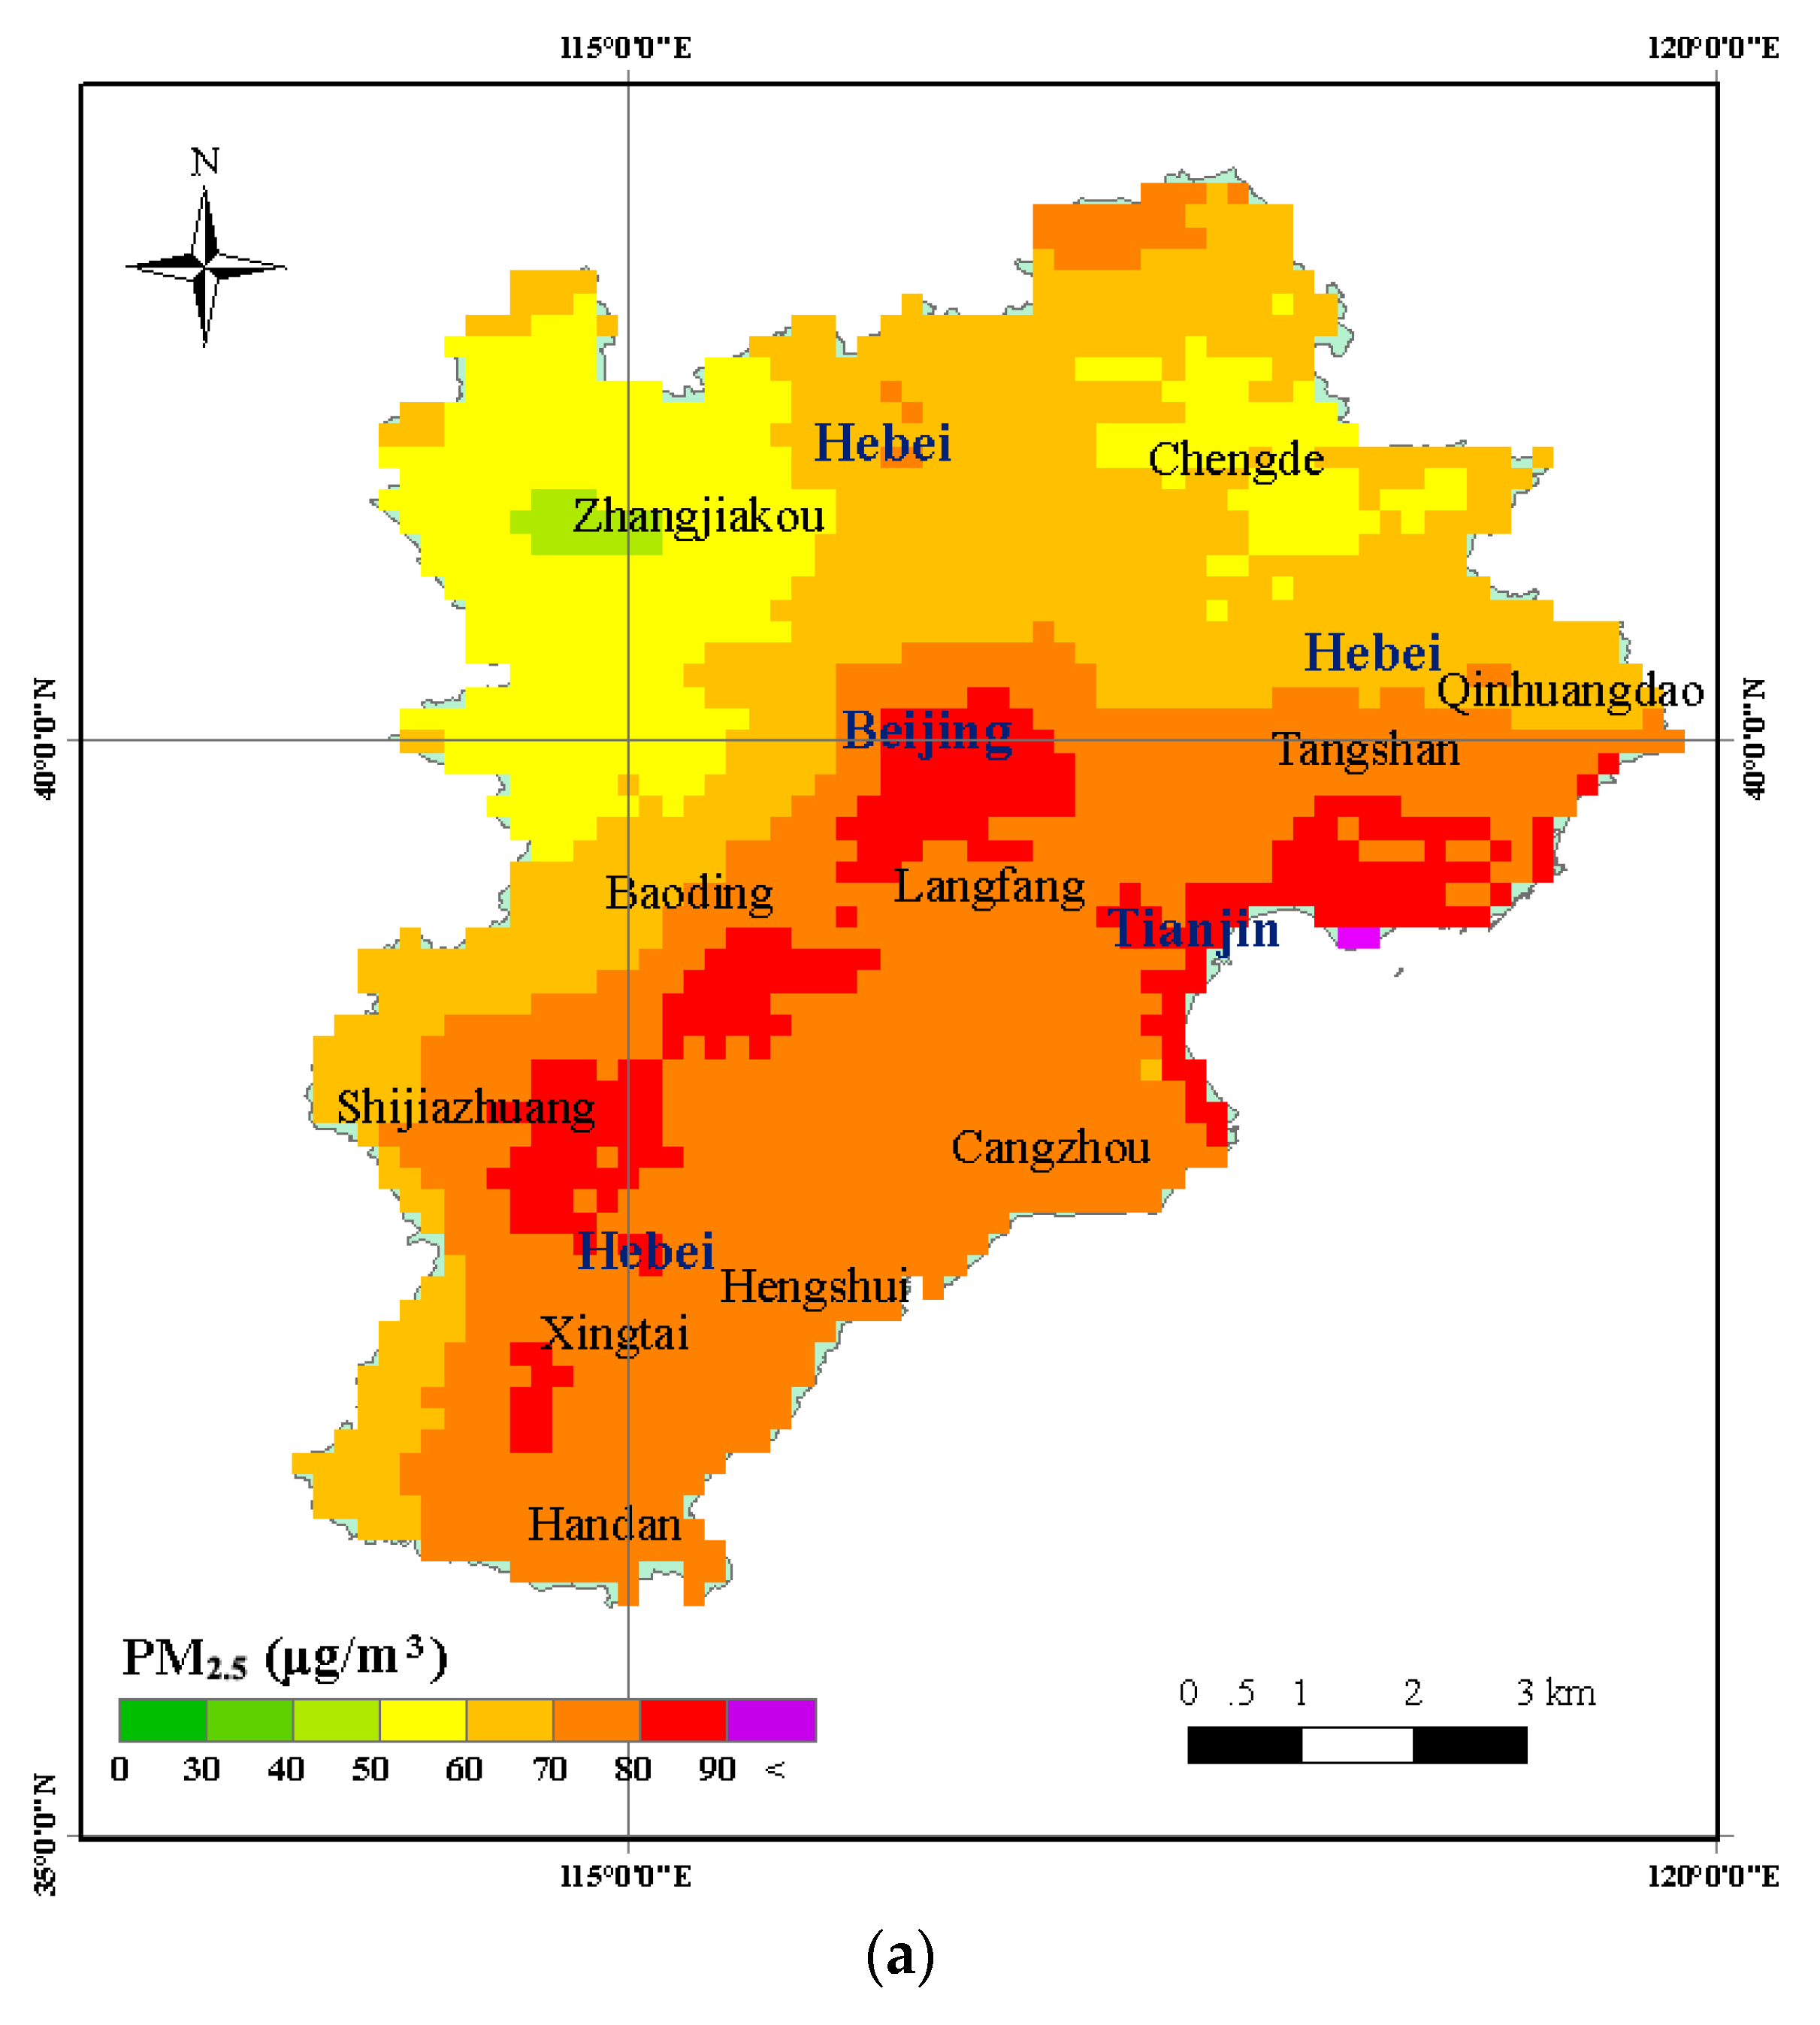
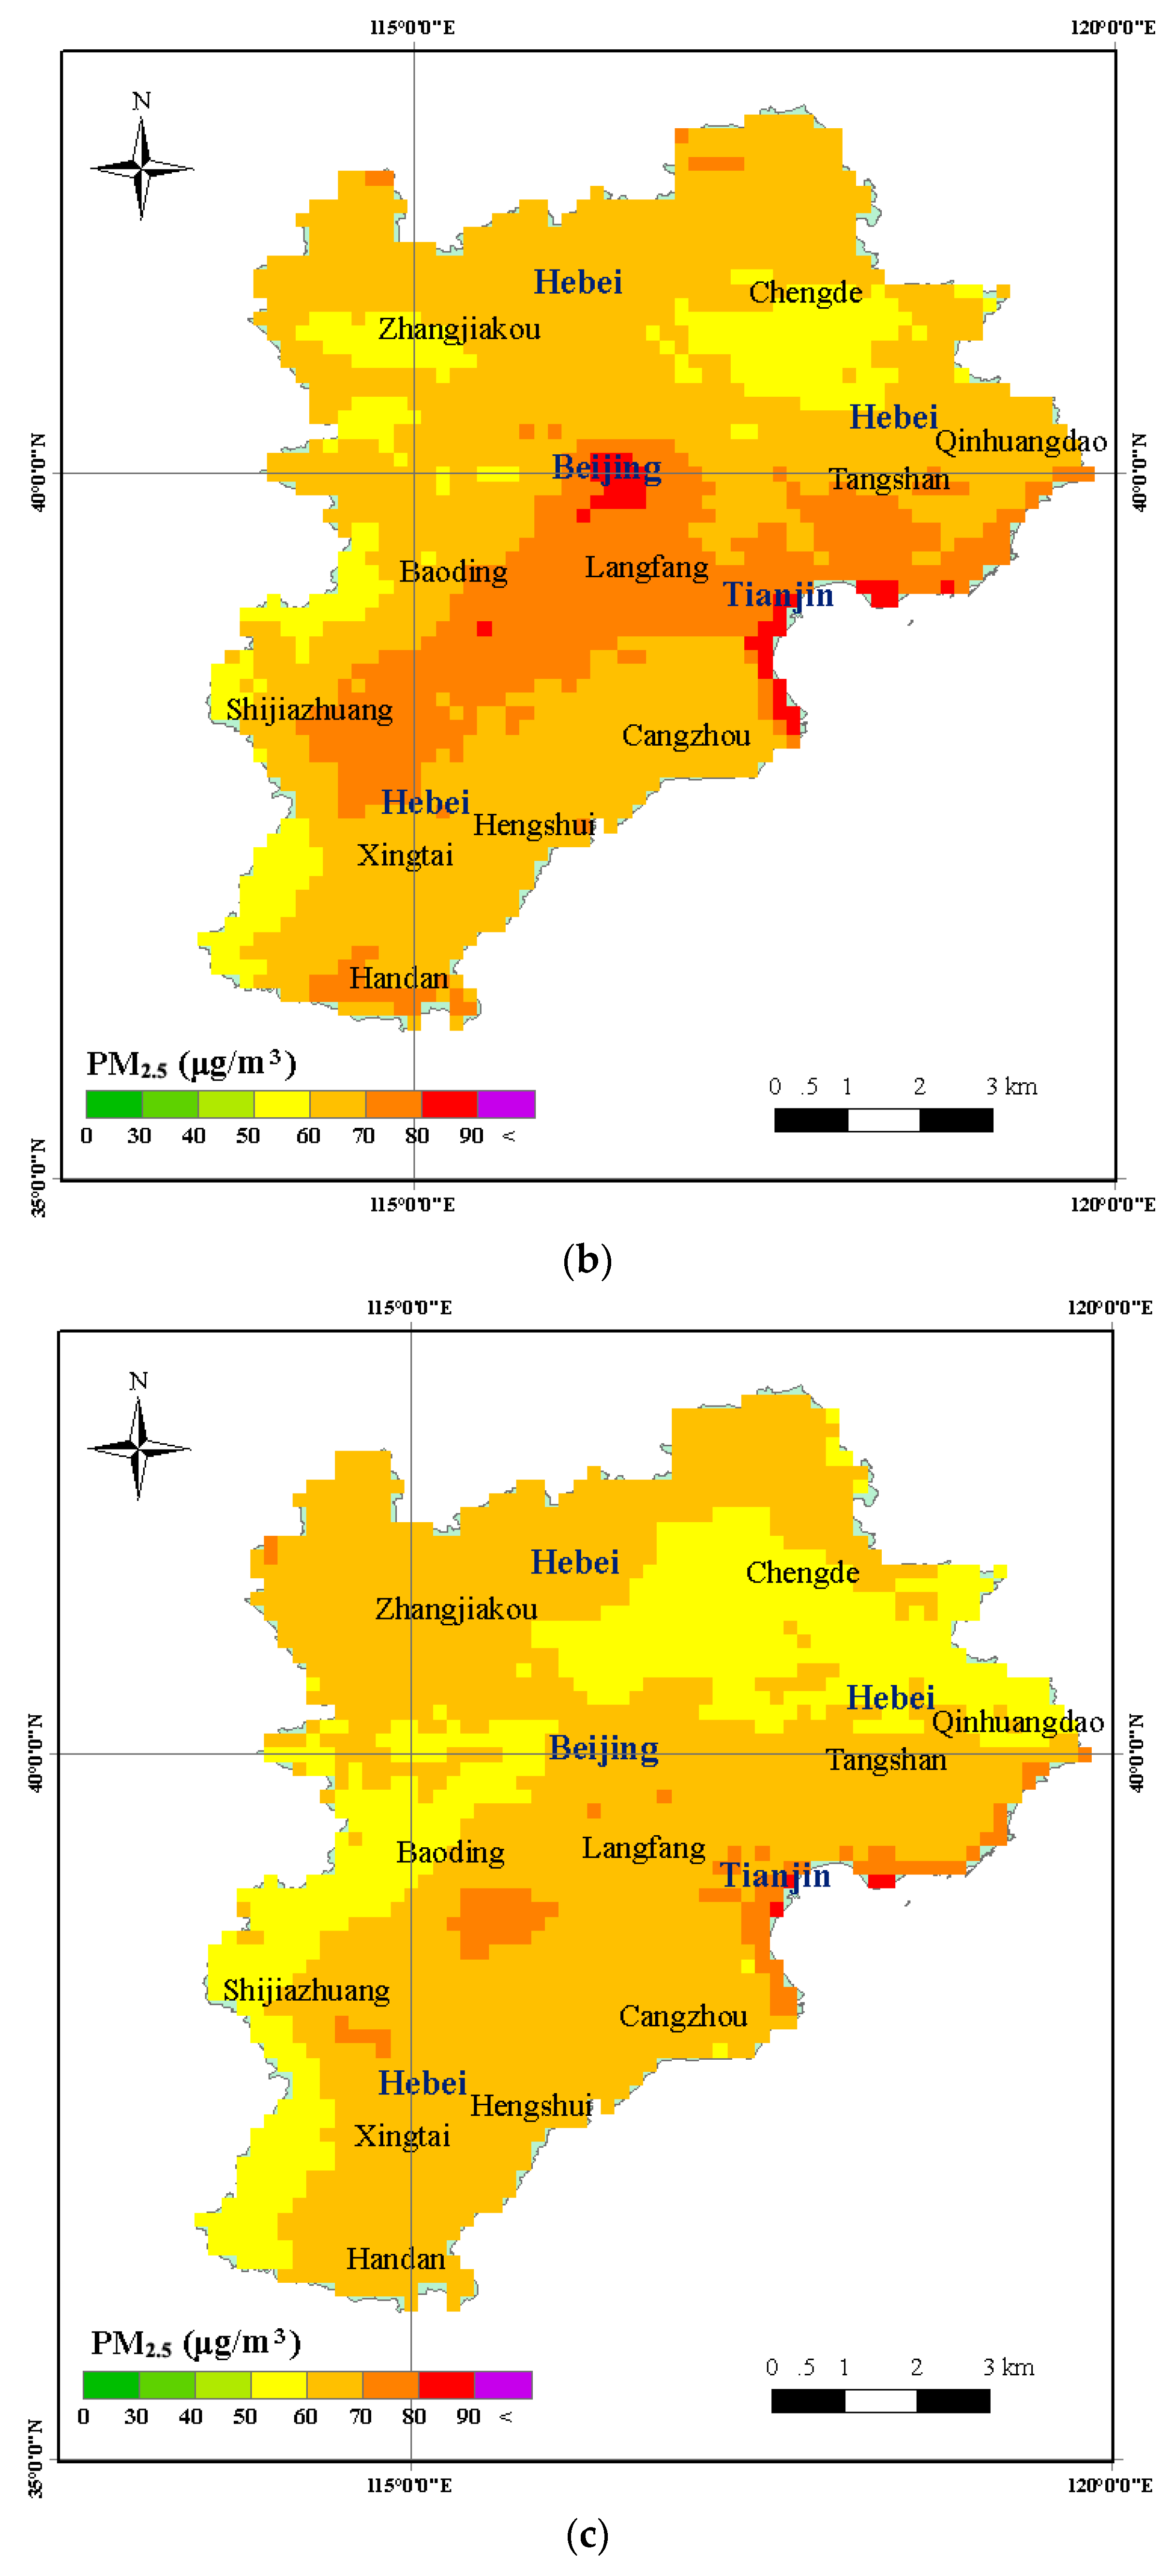
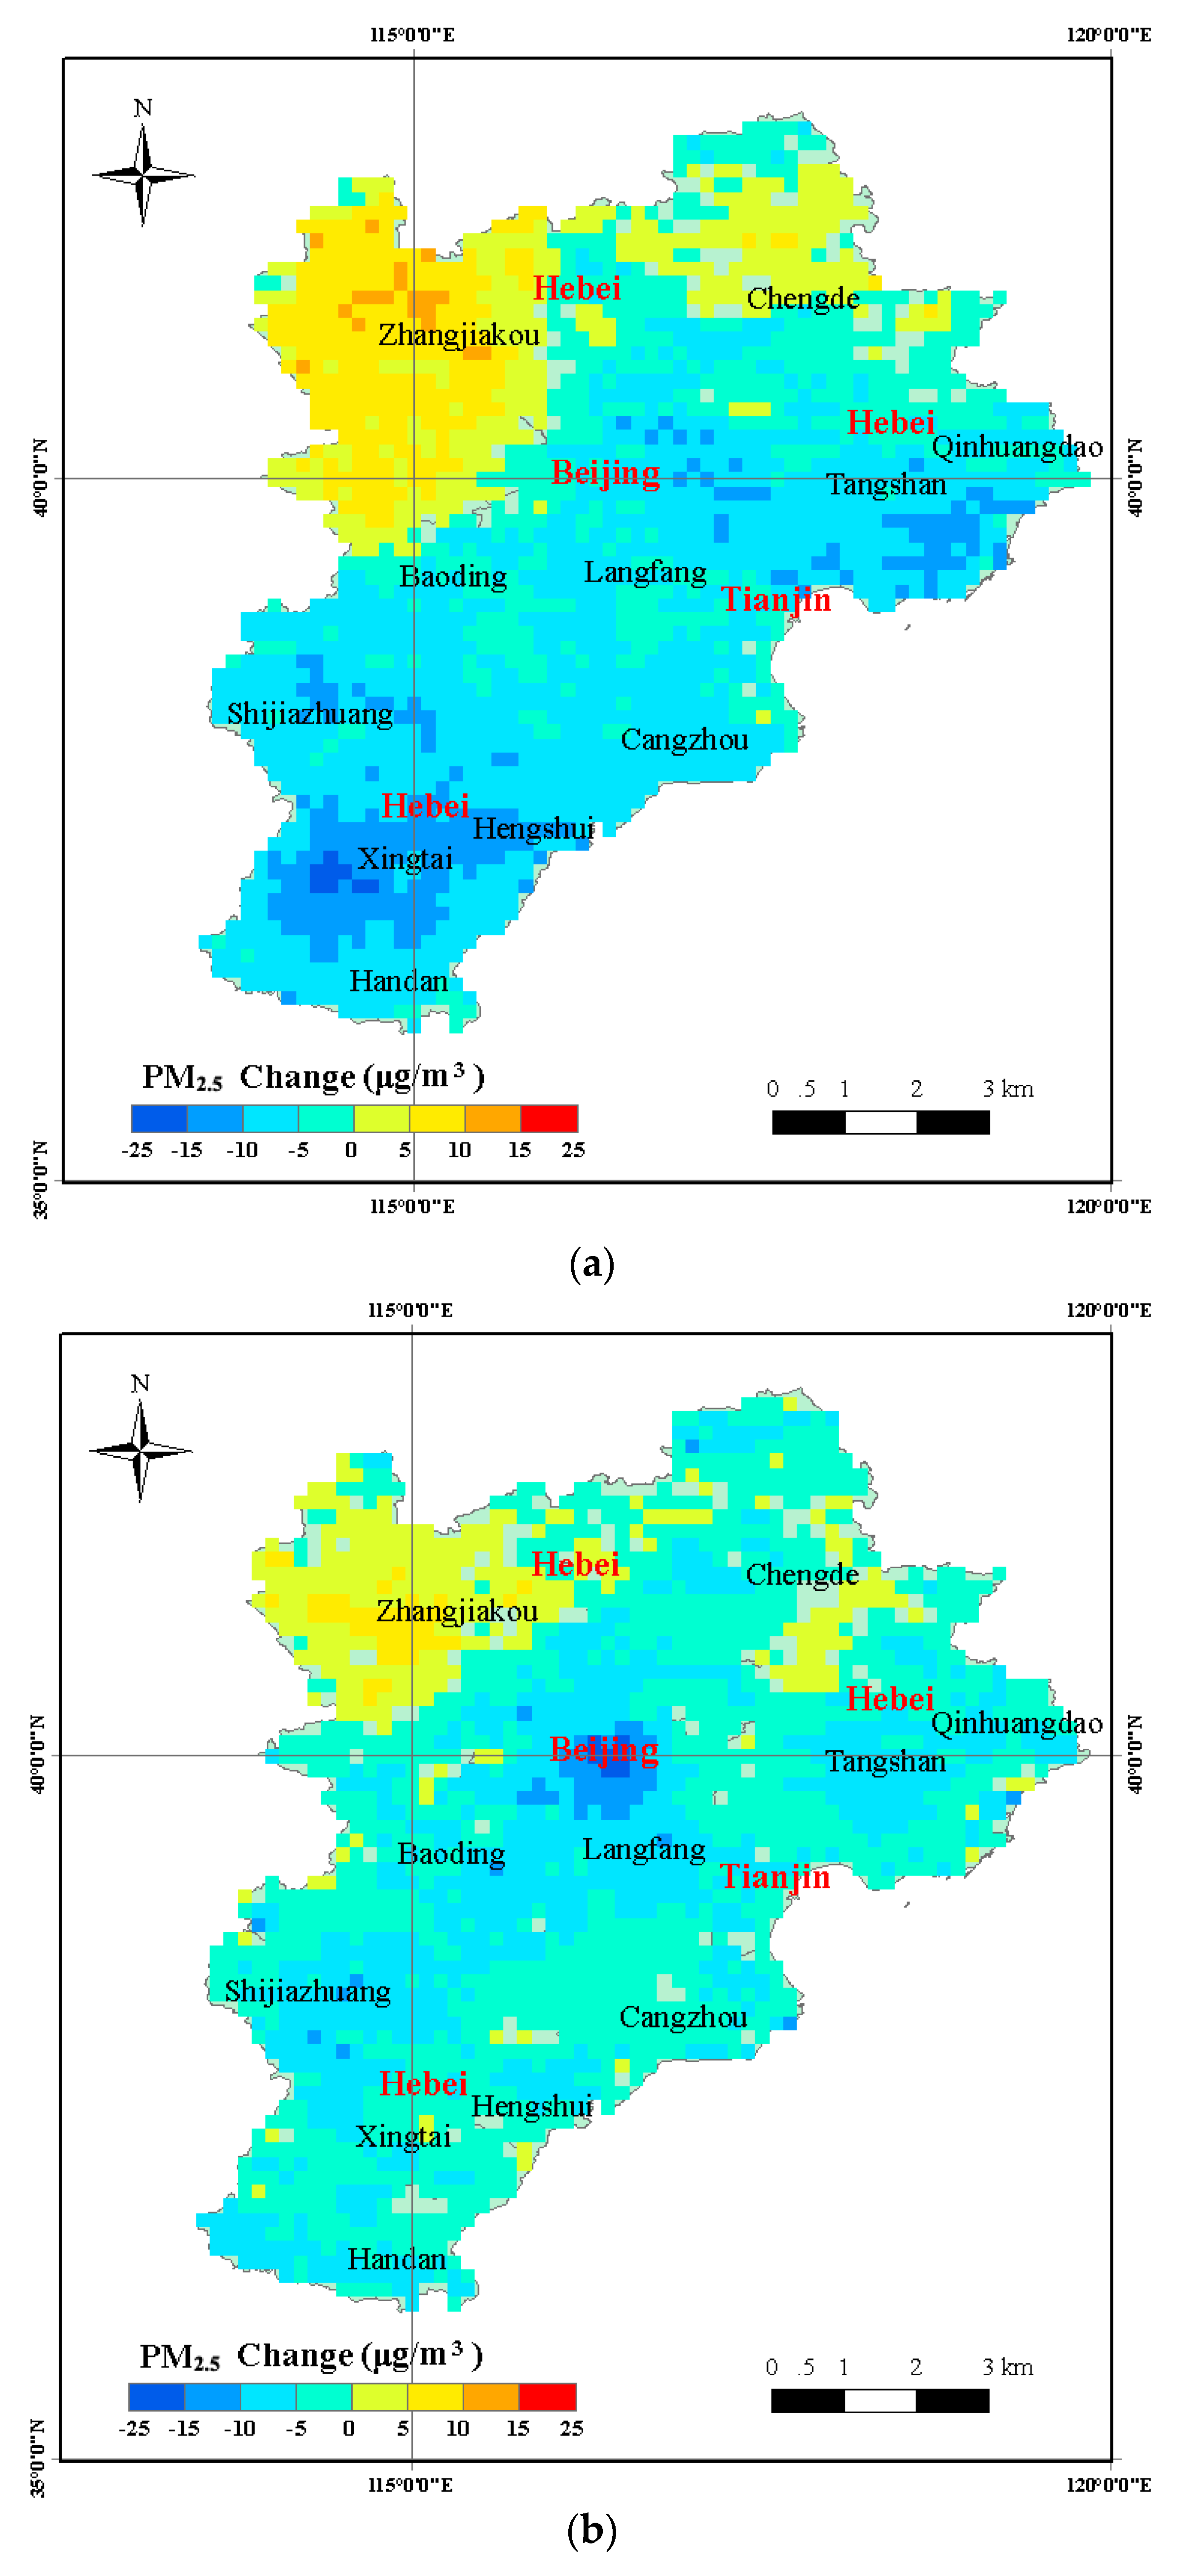
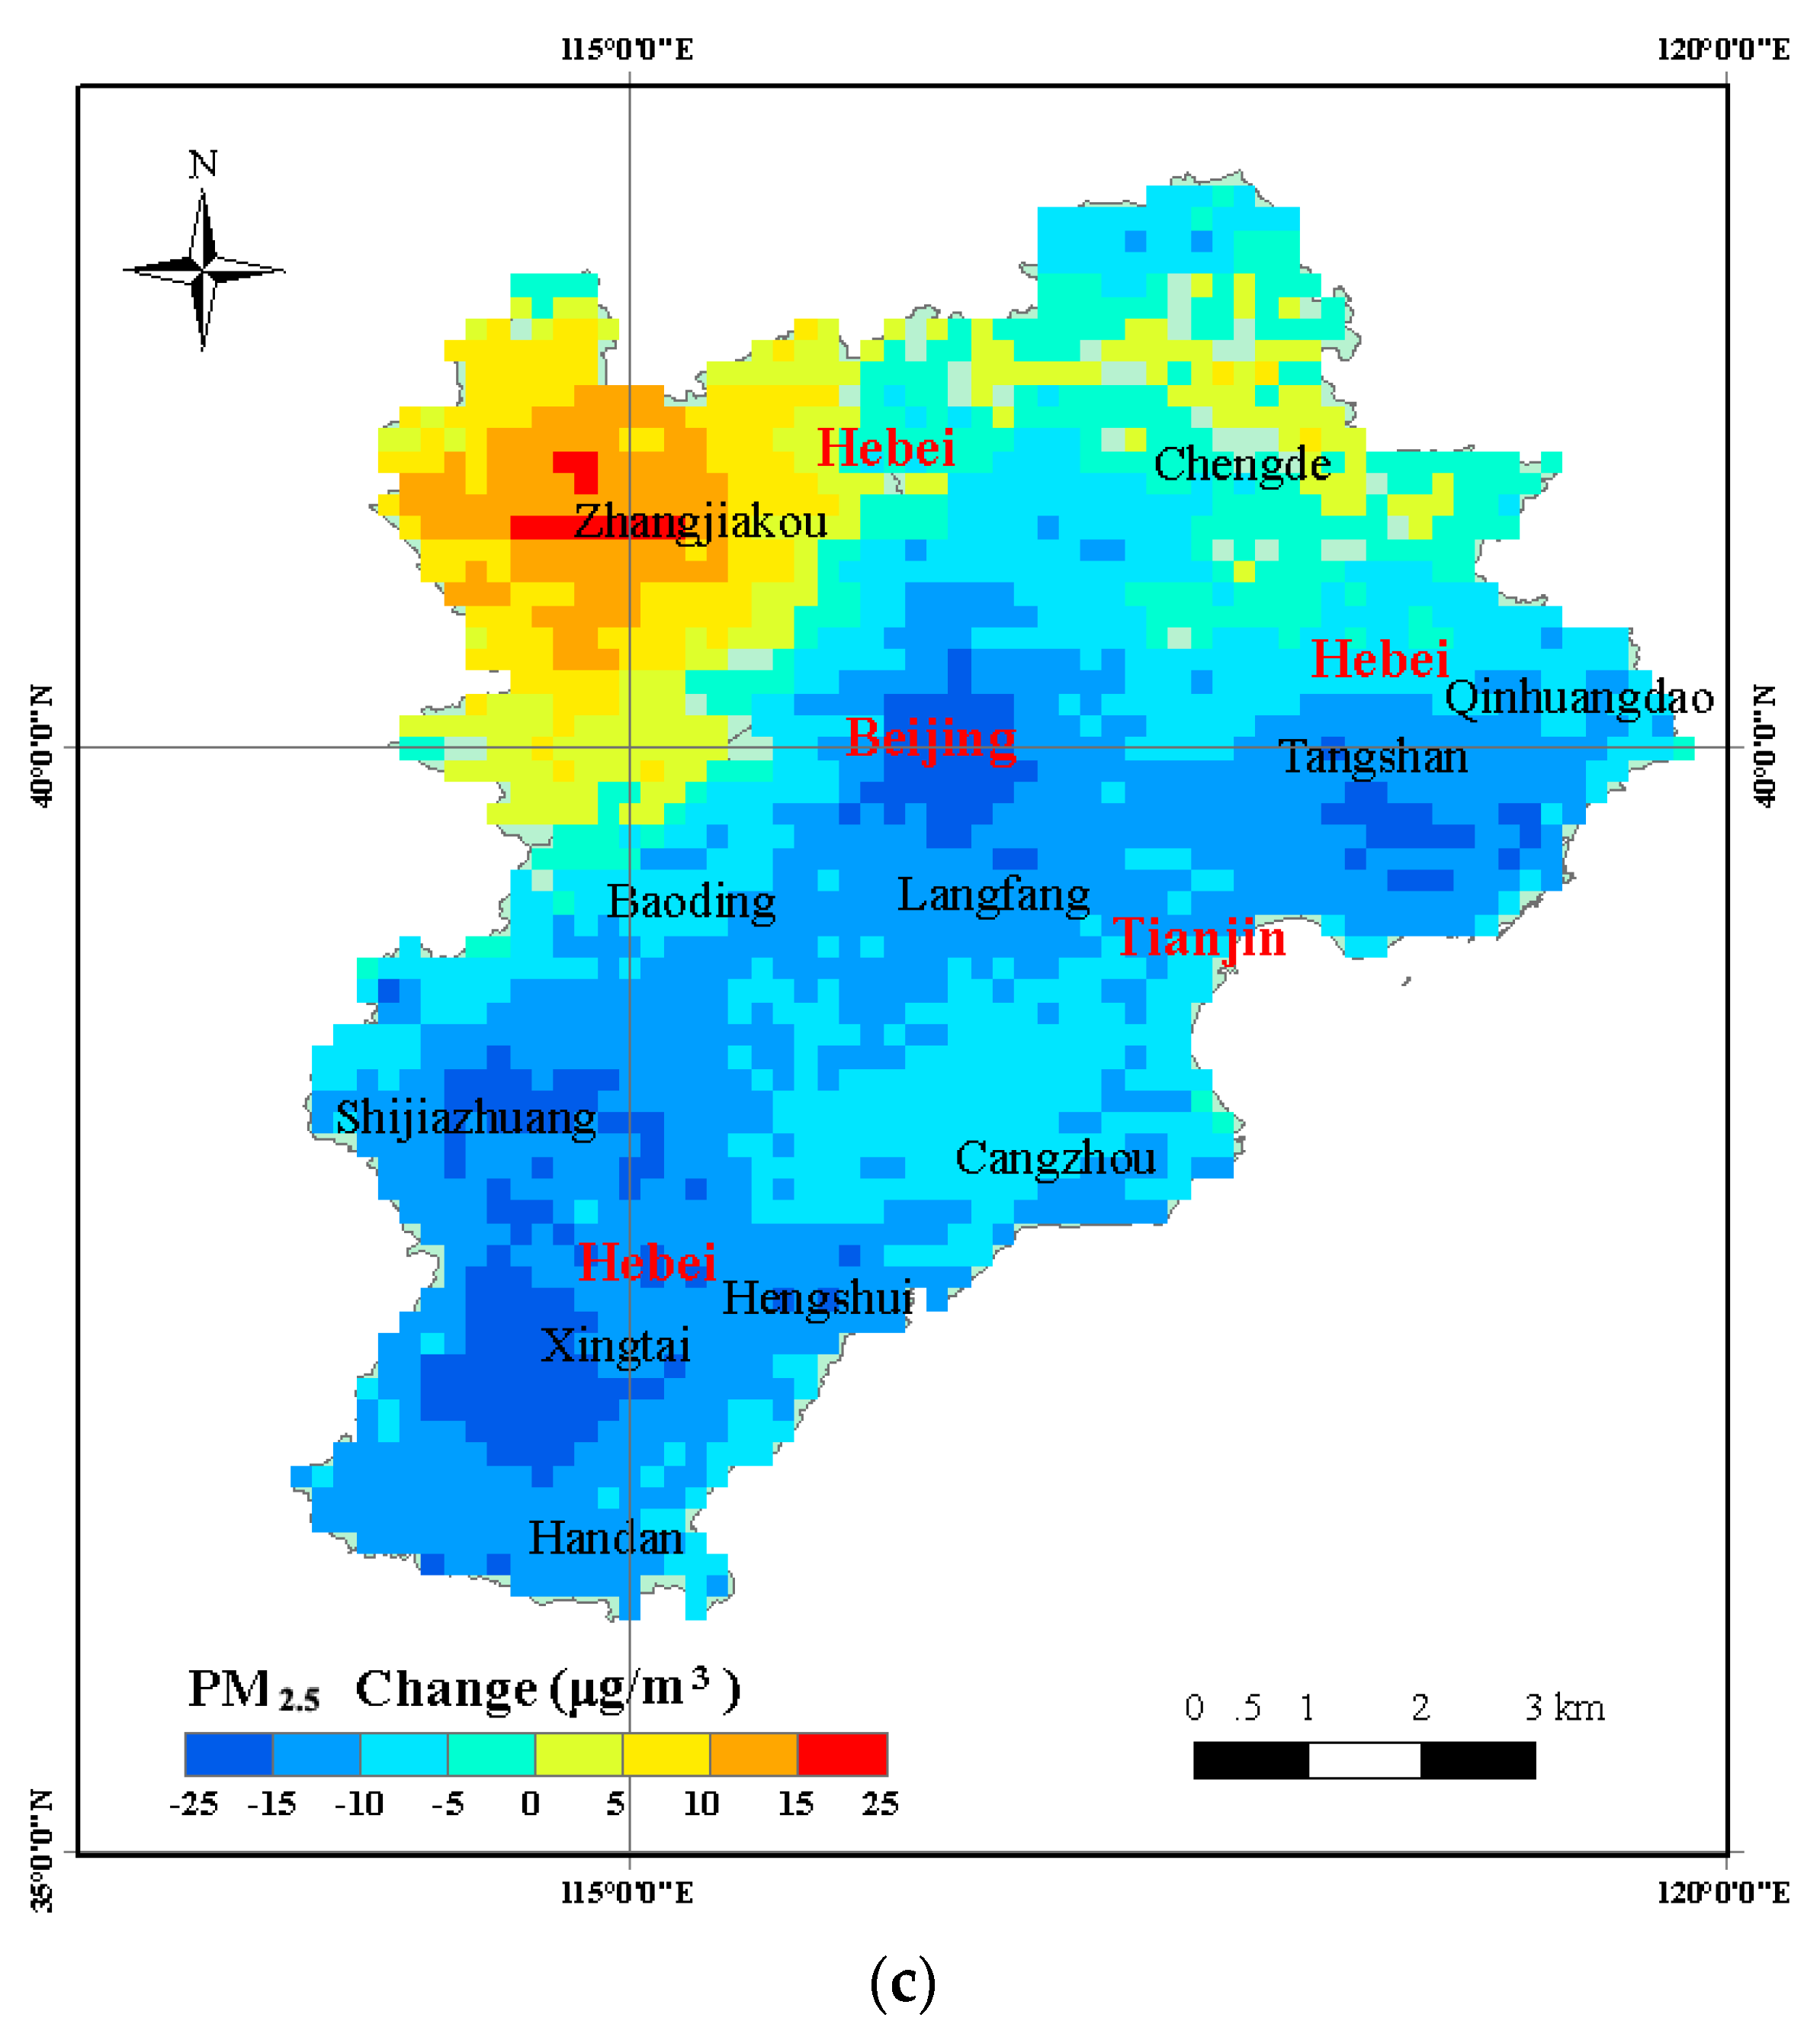
3.3. Estimation of PM2.5 Concentration

The PM2.5 estimating model input variables were gridded into the same spatial resolution with the 3 km MODIS AOD products. The spatial distributions of the daily PM2.5 concentration for the period January 2014 to December 2016 were obtained from the estimated PM2.5 model. Figure 5 shows the annual mean PM2.5 concentration in the BTH region. From the annual mean spatial distribution of PM2.5 concentration of the BTH region, we observed high concentrations of PM2.5 in central and southern BTH, especially in several cities and their surroundings (Beijing, Tianjin, Tangshan, Shijiazhuang, Baoding, Xingtai, etc.). The northern BTH region showed low PM2.5 concentration, especially in the Zhangjiakou and Chengde areas. The areal distribution of the PM2.5 concentration is controlled by the strong northerly wind in the northern parts of the BTH region during autumn and winter seasons that spreads fine particulate pollutants in the southern parts. At the same time, more population and industry cluster in central and southern parts of the BTH region, and are the main sources of pollution. In addition, the annual mean PM2.5 concentration for the years 2015 and 2016 were found to be lower compared to 2014 (Figure 5). Figure 6 shows changes in distribution of the annual mean PM2.5 concentration during 2014–2016. The results show that most of the BTH region exhibited a decrease in the annual mean PM2.5 concentration during 2015 and 2016 compared with 2014, while a small increase in concentration was observed in Zhangjiakou, Chengde, and other small areas in the BTH region.
By comparing the annual mean PM2.5 concentration of 2014 with 2016 (Figure 6c), we observed a decline in concentration in the cities having high concentration (average values greater than 10.00 μg/m3). In several major cities (Beijing, Tangshan, Shijiazhuang, and Xingtai), PM2.5 varied in the range 15.00–25.00 μg/m3. However, Zhangjiakou city and outskirts showed higher PM2.5 values (>5.00 μg/m3), and in the center of the Zhangjiakou city PM2.5 varied by up to 25.00 μg/m3. A declining trend in the annual mean PM2.5 concentration was observed from 2014 to 2016 in most areas of the BTH region. In order to further evaluate the estimation of PM2.5 concentration, we validated the change in trend of PM2.5 concentration by using the ground-observed data. Figure 7 shows the change in yearly average trend of 12 cities from the actual ground-measured data and model estimation. Similar trends between ground-measured PM2.5 and model estimation are clearly seen in Figure 7. A decreasing trend occurred in 10 cities of the BTH region, including Baoding, Beijing, Shijiazhuang, Tangshan, Tianjin, Xingtai, Cangzhou, Langfang, Hengshui, and Handan (Figure 7). A small increasing trend of PM2.5 concentration in the Zhangjiakou region was observed. The evaluation result also demonstrated the accuracy of PM2.5 concentration estimation.

4. Conclusions

In this study, we estimated the spatio-temporal distribution of PM2.5 in the BTH region using the ANN model, with the inputs of MODIS AOD and meteorological data. The PM2.5 estimation model using the BPNN approach was able to estimate PM2.5 concentration with high accuracy. The model input variables—especially the 3 km AOD product—were used to estimate the spatial distribution of PM2.5 concentration. The results provide a reasonably good estimate of PM2.5, but we still have limitations and uncertainties in the estimation.
The surface measurements of PM2.5 concentration are at the ground level, whereas the satellite AOD product accounts for pollution in the atmospheric column. The vertical profile of AOD or vertical profile of PM2.5 concentration were not considered in the model; in the future, such consideration will improve the estimation of PM2.5. In addition, the composition and concentration of PM2.5 greatly vary due to different sources (natural and anthropogenic) in different regions, and concentrations vary in space and time. For example, the natural source mainly includes sea salt, dust, volcanic eruptions, forest fires, and grassland fires, and the anthropogenic sources mainly consist of fossil fuel combustion and industrial processes. At the same time, there are many uncertain sources which also seriously affect PM2.5 concentration, and are not considered in the present study. In future studies, a more refined PM2.5 estimation model will be conducted to account for seasonal variability and also different [43,44,45].
The approach based on a BPNN model for PM2.5 concentration shows the feasibility of monitoring the PM2.5 concentration in large-scale regions. In order to further improve the estimation of PM2.5 concentration, we will make following efforts:
  • Sometimes there are gaps in the area covered by the satellites; the higher temporal resolution will reduce the gaps in AOD data. Satellite remote sensing data from Terra MODIS AOD, Landsat 8, the Visible Infrared Imaging Radiometer Suite (VIIRS) onboard Suomi National Polar-Orbiting Partnership (Suomi NPP), and Environment and Disaster Monitoring Small Satellite (HJ-1) may provide better AOD data [46,47].
  • Light detection and ranging (Lidar) data will be considered in the future to estimate the aerosol vertical profile and components, which would be helpful in understanding the vertical distribution and source of PM2.5 concentration [48]. In addition, the interpolation of meteorological data should also be studied to obtain the most accurate spatial distribution data, which can improve the estimation precision of the PM2.5 concentration distribution.
The method proposed in the present study can be extended to large areas, when the dense network of ground observing stations is expanded.
The estimate of PM2.5 over in China will be of great help in understanding the dynamics of pollutants, and will also help the government in making efforts to minimize atmospheric pollution and improve air quality, public health, and the climate—especially during the winter season.

Acknowledgments

The authors would like to thank the three anonymous reviewers for their comments/suggestions that have helped us to improve the earlier version of the manuscript. The present study is partially supported by a grant from Youth Science Fund Project (Grant No. 41701408) and by the National Natural Science Foundation (Grant No. 41601478). This work was also funded by the National Key R&D Program of China (2017YFD0600903, 2016YFC0500103).

Author Contributions

The analysis was performed by Xiliang Ni. All authors contributed with ideas, writing and discussions.

Conflicts of Interest

The authors declare no conflict of interest.

References

  1. Pope, C.A., III; Burnett, R.T.; Thun, M.J.; Calle, E.E.; Krewski, D.; Ito, K.; Thurston, G.D. Lung cancer, cardio pulmonary mortality, and long-term exposure to fine particulate air pollution. JAMA 2002, 287, 1132–1141. [Google Scholar] [CrossRef] [PubMed]
  2. Lepeule, J.; Laden, F.; Dockery, D.; Schwartz, J. Chronic exposure to fine particles and mortality: An extended follow-up of the Harvard six cities study from 1974 to 2009. Environ. Health Perspect. 2012, 120, 965–970. [Google Scholar] [CrossRef] [PubMed] [Green Version]
  3. WanMahiyuddin, W.R.; Sahani, M.; Aripin, R.; Latif, M.T.; Thach, T.Q.; Wong, C.M. Short-term effects of daily air pollution on mortality. Atmos. Environ. 2013, 65, 69–79. [Google Scholar] [CrossRef]
  4. Dominici, F.; Peng, R.D.; Bell, M.L.; Pham, L.; McDermott, A.; Zeger, S.L.; Samet, J.M. Fine particulate air pollution and hospital admission for cardiovascular and respiratory diseases. J. Am. Med. Assoc. 2006, 295, 1127–1134. [Google Scholar] [CrossRef] [PubMed]
  5. Yang, F.M.; Ma, Y.L.; He, K.B. A brief introduction to PM2.5 and related research. World Environ. 2000, 2000, 32–34. [Google Scholar]
  6. Kaufman, Y.J.; Tanré, D.; Boucher, O. A satellite view of aerosols in the climate system. Nature 2002, 419, 215–223. [Google Scholar] [CrossRef] [PubMed]
  7. Cao, J.J.; Shen, Z.X.; Chow, J.C.; Watson, J.G.; Lee, S.C.; Tie, X.X.; Ho, K.F.; Wang, G.H.; Han, Y.M. Winter and summer PM2.5 chemical compositions in fourteen Chinese cities. J. Air Waste Manag. Assoc. 2012, 62, 1214–1226. [Google Scholar] [CrossRef] [PubMed]
  8. Engel-Cox, J.A.; Hoff, R.M.; Haymet, A.D.J. Recommendations on the use of satellite remote-sensing data for urban air quality. J. Air Waste Manag. Assoc. 2004, 54, 1360–1371. [Google Scholar] [CrossRef] [PubMed]
  9. Koelemeijer, R.B.A.; Homan, C.D.; Matthijsen, J. Comparison of spatial and temporal variations of aerosol optical thickness and particulate matter in Europe. Atmos. Environ. 2006, 40, 5304–5315. [Google Scholar] [CrossRef]
  10. Yap, X.Q.; Hashim, M. A robust calibration approach for PM10 prediction from MODIS aerosol optical depth. Atmos. Chem. Phys. Discuss. 2012, 12, 31483–31505. [Google Scholar] [CrossRef]
  11. Engel-Cox, J.A.; Holloman, C.H.; Coutant, B.W.; Hoff, R.M. Qualitative and quantitative evaluation of MODIS satellite sensor data for regional and urban scale air quality. Atmos. Environ. 2004, 38, 2495–2509. [Google Scholar] [CrossRef]
  12. Engel-Cox, J.A.; Young, G.S.; Hoff, R.M. Application of satellite remote-sensing data for source analysis of fine particulate matter transport events. J. Air Waste Manag. Assoc. 2005, 55, 1389–1397. [Google Scholar] [CrossRef] [PubMed]
  13. Wang, J.; Christopher, S.A. Inter-comparison between satellite-derived aerosol optical thickness and PM2.5 mass: Implications for air quality studies. Geophys. Res. Lett. 2003, 30. [Google Scholar] [CrossRef]
  14. Chu, D.A.; Kaufman, Y.J.; Zibordi, G.; Chern, J.D.; Mao, J.; Li, C.; Holben, B.N. Global monitoring of air pollution over land from the Earth Observing System-Terra Moderate Resolution Imaging Spectroradiometer (MODIS). J. Geophys. Res. 2003, 108. [Google Scholar] [CrossRef]
  15. Liu, Y.; Jeremy, A.S.; Vasu, K.; Daniel, J.J.; Petros, K. Estimating ground-level PM2.5 in the eastern United States using satellite remote sensing. Environ. Sci. Technol. 2005, 39, 3269–3278. [Google Scholar] [CrossRef] [PubMed] [Green Version]
  16. Gupta, P.; Christopher, S.A. Particulate matter air quality assessment using integrated surface, satellite, and meteorological products: 2. A neural network approach. J. Geophys. Res. 2009, 114. [Google Scholar] [CrossRef]
  17. Liu, Y.; Paciorek, C.J.; Koutrakis, P. Estimating regional spatial and temporal variability of PM2.5 concentrations using satellite data, meteorology, and land use information. Environ. Health Perspect. 2009, 117, 886–892. [Google Scholar] [CrossRef] [PubMed] [Green Version]
  18. Hu, X.F.; Waller, L.A.; Lyapustin, A.; Wang, Y.J.; Al-Hamdan, M.Z.; Crosson, W.L.; Estes, M.G.; Estes, S.M.; Quattrochi, D.A.; Puttaswamy, S.J.; et al. Estimating ground-level PM2.5 concentrations in the Southeastern United States using MAIAC AOD retrievals and a two-stage model. Remote Sens. Environ. 2014, 140, 220–232. [Google Scholar] [CrossRef]
  19. Lin, C.; Li, Y.; Yuan, Z.; Lau, A.K.H.; Li, C.; Fung, J.C.H. Using satellite remote sensing data to estimate the high-resolution distribution of ground-level PM2.5. Remote Sens. Environ. 2015, 156, 117–128. [Google Scholar] [CrossRef]
  20. You, W.; Zang, Z.; Zhang, L.; Li, Z.; Chen, D.; Zhang, G. Estimating ground-level PM10 concentration in northwestern China using geographically weighted regression based on satellite AOD combined with CALIPSO and MODIS fire count. Remote Sens. Environ. 2015, 168, 276–285. [Google Scholar] [CrossRef]
  21. You, W.; Zang, Z.; Pan, X.; Zhang, L.; Chen, D. Estimating PM2.5 in Xi’an, China using aerosol optical depth: A comparison between the MODIS and MISR retrieval models. Sci. Total Environ. 2015, 505, 1156–1165. [Google Scholar] [CrossRef] [PubMed]
  22. Ma, Z.; Hu, X.; Huang, L.; Bi, J.; Liu, Y. Estimating Ground-Level PM2.5 in China Using Satellite Remote Sensing. Environ. Sci. Technol. 2014, 48, 7436–7444. [Google Scholar] [CrossRef] [PubMed]
  23. Song, W.; Jia, H.; Huang, J.; Zhang, Y. A satellite-based geographically weighted regression model for Regional PM2.5 estimation over the Pearl River Delta region in China. Remote Sens. Environ. 2014, 154, 1–7. [Google Scholar] [CrossRef]
  24. Remer, L.A.; Mattoo, S.; Levy, R.C.; Munchak, L. MODIS 3 km aerosol product: Algorithm and global perspective. Atmos. Meas. Tech. 2013, 6, 1829–1844. [Google Scholar] [CrossRef]
  25. National Bureau of Statistics of China (NBSC). China Statistical Year Book; China Statistics Press: Beijing, China, 2015. (In Chinese) [Google Scholar]
  26. Xing, Y.; Song, H.; Yu, M.; Wang, C.; Zhou, Y.; Liu, G.; Du, L. The Characteristics of Greenhouse Gas Emissions from Heavy-Duty Trucks in the Beijing-Tianjin-Hebei (BTH) Region in China. Atmosphere 2016, 7, 121. [Google Scholar] [CrossRef]
  27. Li, Y.; Wang, J.; Chen, C.; Chen, Y.; Li, J. Estimating PM2.5 in the Beijing-Tianjin-Hebei Region Using MODIS AOD Products from 2014 to 2015. In Proceedings of the XXIII International Society for Photogrammetry and Remote Sensing Congress, Prague, Czech Republic, 12–19 July 2016; Volume XLI-B2, pp. 721–727. [Google Scholar] [CrossRef]
  28. The National Urban Air Quality Real-Time Publishing Platform. Available online: http://113.108.142.147:20035/emcpublish/ (accessed on 20 July 2017).
  29. Global Climate Data. Available online: https://en.tutiempo.net/climate/ (accessed on 20 July 2017).
  30. Olea, R.A. Geostatistics for Engineers and Earth Scientists; Springer: New York, NY, USA, 1999. [Google Scholar]
  31. Ni, X.; Park, T.; Choi, S.; Shi, Y.; Cao, C.; Wang, X.; Lefsky, M.A.; Simard, M.; Myneni, R.B. Allometric scaling and resource limitations model of tree heights: Part 3. Model optimization and testing over continental China. Remote Sens. 2014, 6, 3533–3553. [Google Scholar] [CrossRef]
  32. Ni, X.; Zhou, Y.; Cao, C.; Wang, X.; Shi, Y.; Park, T.; Choi, S.; Myneni, R.B. Mapping Forest Canopy Height over Continental China Using Multi-Source Remote Sensing Data. Remote Sens. 2015, 7, 8436–8452. [Google Scholar] [CrossRef]
  33. Leigh, M.; Robert, L.; Shana, M.; Lorraine, R. MODIS Atmosphere Team Webinar Series #5: Overview of the 3 km Aerosol Product in Collection 6. 2014. Available online: https://modis-images.gsfc.nasa.gov/Webinar2014/MODISAtmWebinar3SayerDB.pdf (accessed on 20 July 2017).
  34. Levy, R.C.; Mattoo, S.; Munchak, L.; Remer, L.A.; Sayer, A.M.; Hsu, N.C. The collection 6 MODIS aerosol products over land and ocean. Atmos. Meas. Tech. 2013, 11, 2989–3034. [Google Scholar] [CrossRef]
  35. Hsu, N.; Jeong, M.J.; Bettenhausen, C.; Sayer, A.; Hansell, R.; Seftor, C.S.; Huang, J.; Tsay, S.-C. Enhanced Deep Blue aerosol retrieval algorithm: The second generation. J. Geophys. Res. Atmos. 2013, 118, 9296–9315. [Google Scholar] [CrossRef]
  36. The MODIS Level 2 Aerosol Products (Collection 6) Referrer to the LAADS Website. Available online: http://ladsweb.nascom.nasa.gov/data/search.html (accessed on 20 July 2017).
  37. Ma, Z.W.; Hu, X.F.; Sayer, A.M.; Levy, R.; Zhang, Q.; Xue, Y.G.; Bi, J.; Lei, H.; Liu, Y. Satellite-based spatiotemporal trends in PM2.5 concentrations: China, 2004–2013. Environ. Health Perspect. 2015, 124, 184. [Google Scholar] [CrossRef] [PubMed]
  38. McCulloch, W.S.; Pitts, W.H. A logical calculus of the ideas immanent in neural nets. Bull. Math. Biophys. 1943, 5, 115–133. [Google Scholar] [CrossRef]
  39. Samardak, A.; Nogaret, A.; Janson, N.B.; Balanov, A.G.; Farrer, I.; Ritchie, D.A. Noise-Controlled Signal Transmission in a Multithread Semiconductor Neuron. Phys. Rev. Lett. 2009, 102, 226802. [Google Scholar] [CrossRef] [PubMed]
  40. Maier, H.R.; Dandy, G.C. Neural networks for the prediction and forecasting of water resources variables: A review of modelling issues and applications. Environ. Model. Softw. 2000, 15, 101–124. [Google Scholar] [CrossRef]
  41. Wang, L.X.; Mendel, J.M. Back-propagation fuzzy systems as nonlinear dynamic system identifiers. In Proceedings of the IEEE 1992 International Conference on Fuzzy Systems, San Diego, CA, USA, 8–12 March 1992; pp. 1409–1418. [Google Scholar]
  42. Rodriguez, J.D.; Perez, A.; Lozano, J.A. Sensitivity analysis of k-fold cross validation in prediction error estimation. IEEE Trans. Pattern Anal. Mach. Intell. 2010, 32, 569–575. [Google Scholar] [CrossRef] [PubMed]
  43. Emili, E.; Popp, C.; Petitta, M.; Riffler, M.; Wunderle, S.; Zebisch, M. PM10 remote sensing from geostationary SEVIRI and polar-orbiting MODIS sensors over the complex terrain of the European Alpine region. Remote Sens. Environ. 2010, 114, 2485–2499. [Google Scholar] [CrossRef]
  44. Wang, J.; Li, X.; Zhang, W.; Jiang, N.; Zhang, R.; Tang, X. Secondary PM2.5 in Zhengzhou, China: Chemical Species Based on Three Years of Observations. Aerosol Air Qual. Res. 2016, 16, 91–104. [Google Scholar] [CrossRef]
  45. Chen, Y.; Han, W.; Chen, S.; Tong, L. Estimating ground-level PM2.5 concentration using Landsat 8 in Chengdu, China. In Proceedings of the SPIE Asia-Pacific Remote Sensing, Beijing, China, 13–16 October 2014; Volume 9259, p. 925917. [Google Scholar] [CrossRef]
  46. Zhao, X.; Shi, H.; Yu, H.; Yang, P. Inversion of Nighttime PM2.5 Mass Concentration in Beijing Based on the VIIRS Day-Night Band. Atmosphere 2016, 7, 136. [Google Scholar] [CrossRef]
  47. Zhengqiang, L.; Yuhuan, Z.; Ying, Z.; Weizhen, H.; Yan, M.; Cheng, C. Remote sensing of atmospheric PM2.5 from high spatial resolution image of Chinese environmental satellite HJ-1/CCD data. In IOP Conference Series: Earth and Environmental Science; IOP Publishing: Bristol, UK, 2014; Volume 17, p. 012023. [Google Scholar] [CrossRef]
  48. Xiang, Y.; Zhang, T.; Zhao, X.S.; Liu, J.; Dong, Y.S.; Fan, G.; Liu, Y. Retrieval of PM2.5 Concentration from Lidar Data. In Light, Energy and the Environment 2015; OSA Technical Digest; Paper EM3A.6; Optical Society of America: Washington, DC, USA, 2015. [Google Scholar]
Figure 1. Study area. PM2.5: particulate matter with aerodynamic diameter less than 2.5 µm.
Atmosphere 09 00105 g001aAtmosphere 09 00105 g001b
Figure 2. Flow chart showing approach for the estimation of the PM2.5. ANN: artificial neural network.
Atmosphere 09 00105 g002
Figure 3. Topological structure of the back propagation neural-network (BPNN) model. IW is the weight matrix of the input layer to the hidden layer; LW is the weight matrix between the hidden layer and the output layer; b is the threshold vector. 1 means the first hidden layer; 2 is the output layer.
Atmosphere 09 00105 g003
Figure 4. Comparison of model-derived satellite PM2.5 with the ground measurements over 79 sites during 2014–2016. (a) The comparison results between all the observed PM2.5 data and the corresponding predictions derived from the PM2.5 estimation model trained using all surface measured PM2.5 data; and (b) 10-fold cross-validation results.
Atmosphere 09 00105 g004
Figure 5. The spatial distribution of the annual mean PM2.5 concentration in the Beijing-Tianjin-Hebei (BTH) region. (a) Annual mean PM2.5 concentration in 2014; (b) Annual mean PM2.5 concentration in 2015; (c) Annual mean PM2.5 concentration in 2016.
Atmosphere 09 00105 g005aAtmosphere 09 00105 g005b
Figure 6. Changes in the annual mean PM2.5 concentration from 2014 to 2016 in the BTH region. (a) Difference in spatial concentration of PM2.5 in the BTH region during 2014 and 2015; (b) Difference in spatial concentration of PM2.5 in the BTH region during 2015 and 2016; (c) Difference in spatial concentration of PM2.5 in the BTH region during 2014 and 2016.
Atmosphere 09 00105 g006aAtmosphere 09 00105 g006b
Figure 7. Changes trends in the annual mean PM2.5 concentration from 2014 to 2016 in the BTH region. (a) The change trends of PM2.5 concentration from the actual ground-measured data; (b) The change trends of PM2.5 concentrations estimation.
Atmosphere 09 00105 g007
Table 1. Data sets used in this study. AOD: aerosol optical depth.
Data TypeDataAcquired TimeSpatial ResolutionSource
Ground-level PM2.5PM2.5 ( μ g / m 3 )2014.1–2016.12N/ATianqihoubao
Satellite DataAqua MODIS AOD products2014.1–2016.123 km × 3 kmNational Aeronautics and Space Administration (NASA), MODIS Team
Meteorological DataTemperature (°C)2014.1–2016.12 Global climate data
Surface Pressure (pa)
Relative humidity (%)
Precipitation (mm)
Visibility (km)
Wind speed (m/s)
Table 2. The details of PM2.5 measurements and the model input parameters.
ParametersMeanSDMinMax
PM2.5 ( μ g / m 3 )81.3353.193.00739.00
MODIS AOD0.640.600.034.49
Temperature (°C)17.9411.50−10.1038.10
Surface Pressure (pa)1017.2510.71994.601054.40
Relative Humidity (%)55.0420.3510.00100.00
Precipitation (mm)2.5211.860.00311.60
Visibility (km)15.248.780.3029.90
Wind Speed (m/s)9.534.031.5039.60

