Short-Term Changes in Weather and Space Weather Conditions and Emergency Ambulance Calls for Elevated Arterial Blood Pressure

1
Department of Environmental Sciences, Vytautas Magnus University, Donelaicio St. 58, Kaunas LT-44248, Lithuania
2
Department of Disaster Medicine, Lithuanian University of Health Sciences, Eiveniu Str. 4, Kaunas LT-50028, Lithuania
*
Author to whom correspondence should be addressed.
Atmosphere 2018, 9(3), 114; https://doi.org/10.3390/atmos9030114
Submission received: 13 February 2018
/
Revised: 15 March 2018
/
Accepted: 18 March 2018
/
Published: 20 March 2018
(This article belongs to the Section Biometeorology)
Abstract
:Circadian rhythm influences the physiology of the cardiovascular system, inducing diurnal variation of blood pressure. We investigated the association between daily emergency ambulance calls (EACs) for elevated arterial blood pressure during the time intervals of 8:00–13:59, 14:00–21:59, and 22:00–7:59 and weekly fluctuations of air temperature (T), barometric pressure, relative humidity, wind speed, geomagnetic activity (GMA), and high-speed solar wind (HSSW). We used the Poisson regression to explore the association between the risk of EACs and weather variables, adjusting for seasonality and exposure to CO, PM10, and ozone. An increase of 10 °C when T > 1 °C on the day of the call was associated with a decrease in the risk of EACs during the time periods of 14:00–21:59 (RR (rate ratio) = 0.78; p < 0.001) and 22:00–7:59 (RR = 0.88; p = 0.35). During the time period of 8:00–13:59, the risk of EACs was positively associated with T above 1 °C with a lag of 5–7 days (RR = 1.18; p = 0.03). An elevated risk was associated during 8:00–13:59 with active-stormy GMA (RR = 1.22; p = 0.003); during 14:00–21:59 with very low GMA (RR = 1.07; p = 0.008) and HSSW (RR = 1.17; p = 0.014); and during 22:00–7:59 with HSSW occurring after active-stormy days (RR = 1.32; p = 0.019). The associations of environmental variables with the exacerbation of essential hypertension may be analyzed depending on the time of the event.
1. Introduction
Numerous scientific studies have indicated the influence of weather on human health, especially on the cardiovascular system. Air temperature is the main meteorological factor whose effect on the human cardiovascular system has been proven undisputedly [1]. A negative effect of cold air on the human body has been stated: acute exposure to cold increased plasma cholesterol level, plasma fibrinogen, blood pressure, and red and white blood cell counts [2,3,4]. Another weather variable that has been associated with the human cardiovascular system is barometric pressure (BP). BP in the biosynoptic analysis seems to be the most objective meteorological factor having the same influence on us—indoors and outdoors. The decrease in BP reduces blood oxygenation and pulse rate [5], is associated with a higher blood pressure [6,7], and associated with a higher risk of adverse cardiovascular events [8,9]. We failed to find any experiment-based studies in the effect of relative humidity or wind speed on human physiological indices. However, thermal indices combining air temperature, relative humidity, and wind speed have been used [10].
Arterial hypertension (AH) is one of the main risk factors of cardiovascular diseases and unfavorable prognosis [11]. AH is the result of various environmental, genetic, and behavioral (or lifestyle) factors as well as the expression of those factors in the human body. Over the last five years, many studies have been published on the effects of environmental factors on blood pressure [12]. An increase in blood pressure has been associated with cold [13,14], seasonal variations [3,15], short- and long-term exposure to fine particulate matter [16,17], traffic noise [18], and increased geomagnetic activity [19,20].
Blood pressure rises sharply in response to the increased activation of the sympathetic nervous system [21]. In most individuals, blood pressure presents a morning increase, a small postprandial valley, and a deeper descent during nocturnal rest [22]. In the early morning, the heart rate, plasma cortisol levels, vascular tone, blood viscosity, and platelet aggregation increased, while vagal activity decreased [23]. Data from epidemiological studies have shown that pathological states are also influenced by circadian fluctuations [24]. Activation of the sympathetic nervous system and secretion of catecholamine increased in response to cold temperatures [25]. This could result in an increase in blood pressure through an increased heart rate and peripheral vascular resistance [26,27]. Several studies report a negative correlation between heart rate variability (HRV) and the level of geomagnetic activity [28,29]. The reduction in HRV could be related to the response of the autonomic nervous system to changes in geomagnetic activity, which can be either sympathetic or parasympathetic in particular individuals [30]. Measurements of arterial blood pressure and heart rate showed an increased activity of the parasympathetic nervous system in zero magnetic fields [31]. Based on the above results, it can be summarized that the mechanisms that could explain the association between blood pressure and the abovementioned environmental variables are associated with an increase in the activation of the sympathetic nervous system. Thus, the reaction to environmental triggers such as weather patterns and geomagnetic activity may vary during different periods of the day.
In Kaunas city’s emergency ambulance service, about 38.4% of the emergency ambulance calls (EACs) for cardiovascular diseases were because of elevated arterial blood pressure (EABP) (ICD-10 codes I10–I15). According to the multivariate model in our previous work [32], the risk of EACs was negatively correlated with air temperature and barometric pressure with a lag of 2 days, and the negative impact of a higher wind speed was dependent on the air temperature. We hypothesized that (1) the variations in the mean daily weather variable during the period of the week affect the risk of EACs; and (2) weather and space weather variables, especially air temperature and geomagnetic activity, might have different impacts on the risk of EACs during different periods of the day.
The aim of the study was to detect the complex association between the daily EACs for EABP occurring in the morning until the early afternoon (8:00–13:59), in the afternoon until the evening (14:00–21:59), and at night until the early morning (22:00–7:59); and short-term environmental conditions: air temperature (T), barometric pressure (BP), relative humidity (RH), wind speed (WS), day length, geomagnetic activity (GMA), and high-speed solar wind (HSSW).
2. Methods
The study was conducted in Kaunas city, Lithuania, with a population of 306,000 inhabitants. The study was conducted from 1 January 2009 to 30 June 2011. The patients had essential hypertension and were administered antihypertensive medications by their family physicians. They were able to monitor their blood pressure and to evaluate the efficiency of the treatment at home. Such patients usually fill out their arterial blood pressure monitoring diary, where they indicate their arterial blood pressure. Ambulance calls were received from patients who, in the background of their usual antihypertensive pharmacological treatment, suddenly experienced a rise in arterial blood pressure by more than 20 mmHg and additional clinical symptoms such as chest pain, headache, dizziness, or other unusual symptoms. We selected patients whose clinical situation was evaluated by the ambulance crew as an exacerbation of essential hypertension accompanied by a substantial elevation of arterial blood pressure (code I.10–I.15). We analyzed the associations between the daily environmental conditions and the daily number of emergency ambulance calls for EABP during the periods of 8:00–13:59 (in the morning until before noon), 14:00–21:59 (in the afternoon until the evening), and 22:00–7:59 (at night until the early morning).
The Kaunas meteorological station provided daily records of minimal, maximal, and mean daily air temperature (T, °C), wind speed (WS, kt), and barometric pressure (BP, hPA) for the studied period (http://www.geodata.us/weather/). The mean daily relative humidity (RH, %) was obtained from the Kaunas international airport (EYKA) weather station. Daily Ap indexes were used as a measure of the level of geomagnetic activity. A day of HSSW was defined as a day with the mean value of solar wind speed of ≥600 km/s. Data on daily solar wind speed and Ap data were downloaded from the National Oceanic and Atmospheric Administration database (ftp://ftp.ngdc.noaa.gov/STP/SOLAR_DATA/).
As confounders, we used the daily concentrations of PM10, the highest eight-hour moving average of CO concentration, and the mean daily concentrations of ozone, as obtained from the municipal air quality monitoring system in the Dainava station. In this station, the concentrations of the pollutants were measured automatically on an hourly basis.
Statistical Analysis
The daily number of EACs for EABP is presented as the mean value (standard error). The association between environmental variables and the daily number of EACs for EABP was evaluated by applying the Poisson regression, adjusting for years, the month of the year, day length, and the day of the week. In the analysis, we used the weather variables with a lag of 0–7 days. The terms of the weather variables were defined analogous to in our previous work [33]. We analyzed the impact of colder air TC,t = max(−1 − Tt, 0) and warmer air TW,t = max(Tt − 1, 0), where Tt is the air temperature on the day of the call. The thresholds for the cold effect and warm effect, respectively, TC = −1 °C and TW = 1 °C, were defined according to the graphical analysis of the associations between the mean daily air temperature and EACs for EABP in the previous work [32]. The terms of BP, WS, and RH were two-piece linear functions with thresholds equal to the median: BPL,t = max(1006 − BPt, 0), BPH,t = max(BPt − 1006, 0), WSL,t = min(WSt − 6.1, 0), WSH,t = max(WSt − 6.1, 0), RHL,t = min(RHt − 82, 0), and RHH,t = max(RHt − 82, 0); where BPt, WSt, and RHt are the barometric pressure, wind speed, and relative humidity, respectively, on the day of the call. To detect the impact of the air temperature, we included the variables TC,t−j and TW,t−j into the multivariate model for each of j = 0, 1, ..., 7 one by one, adjusting for years, the month of the year, the day of the week, and day length. To detect the impact of the weekly variations in other weather variables on the risk of EACs, we added them in the multivariate model one by one, and the unconstrained distributed time-lag threshold model was used. Based on the estimates of regression coefficients in each lag and on the results of the created distributed lag models (DLMs), we created new variables as moving averages or daily changes of weather parameters that were statistically significantly associated with EACs. The optimal delay was selected using the Akaike information criterion. We checked the autocorrelations of the residuals using partial autocorrelation functions for the created model.
The space weather variable was used as the categorical predictor. We assessed the impacts of low GMA of Ap < 4 (4 being the median of the Ap indices during the studied period) as well as active-stormy GMA (Ap ≥ 16); HSSW in conjunction with days of active-stormy GMA; and HSSW occurring after days of active-stormy GMA and 2 days after an active-stormy GMA level. We presented adjusted rate ratios (RRs) in the multivariate Poisson regression model created by including the selected environmental variables. The RRs are presented with a 95% confidence interval (CI) and p-value. The analysis was performed separately for the number of calls during the whole day, in the morning until before noon, in the afternoon until the evening, and at night until early in the morning. To detect significant differences in the impact of environmental variables during the different periods of the day, we tested the hypothesis about the difference between two regression coefficients. We used the statistic [34], where b1 and b2 are regression coefficients detected during different time periods and SE is the standard error. For a sensitivity analysis, we evaluated the association between EACs for EABP and environmental variables separately for older (>65 years) and younger patients. Statistical analysis was performed using SPSS 19 software.
3. Results
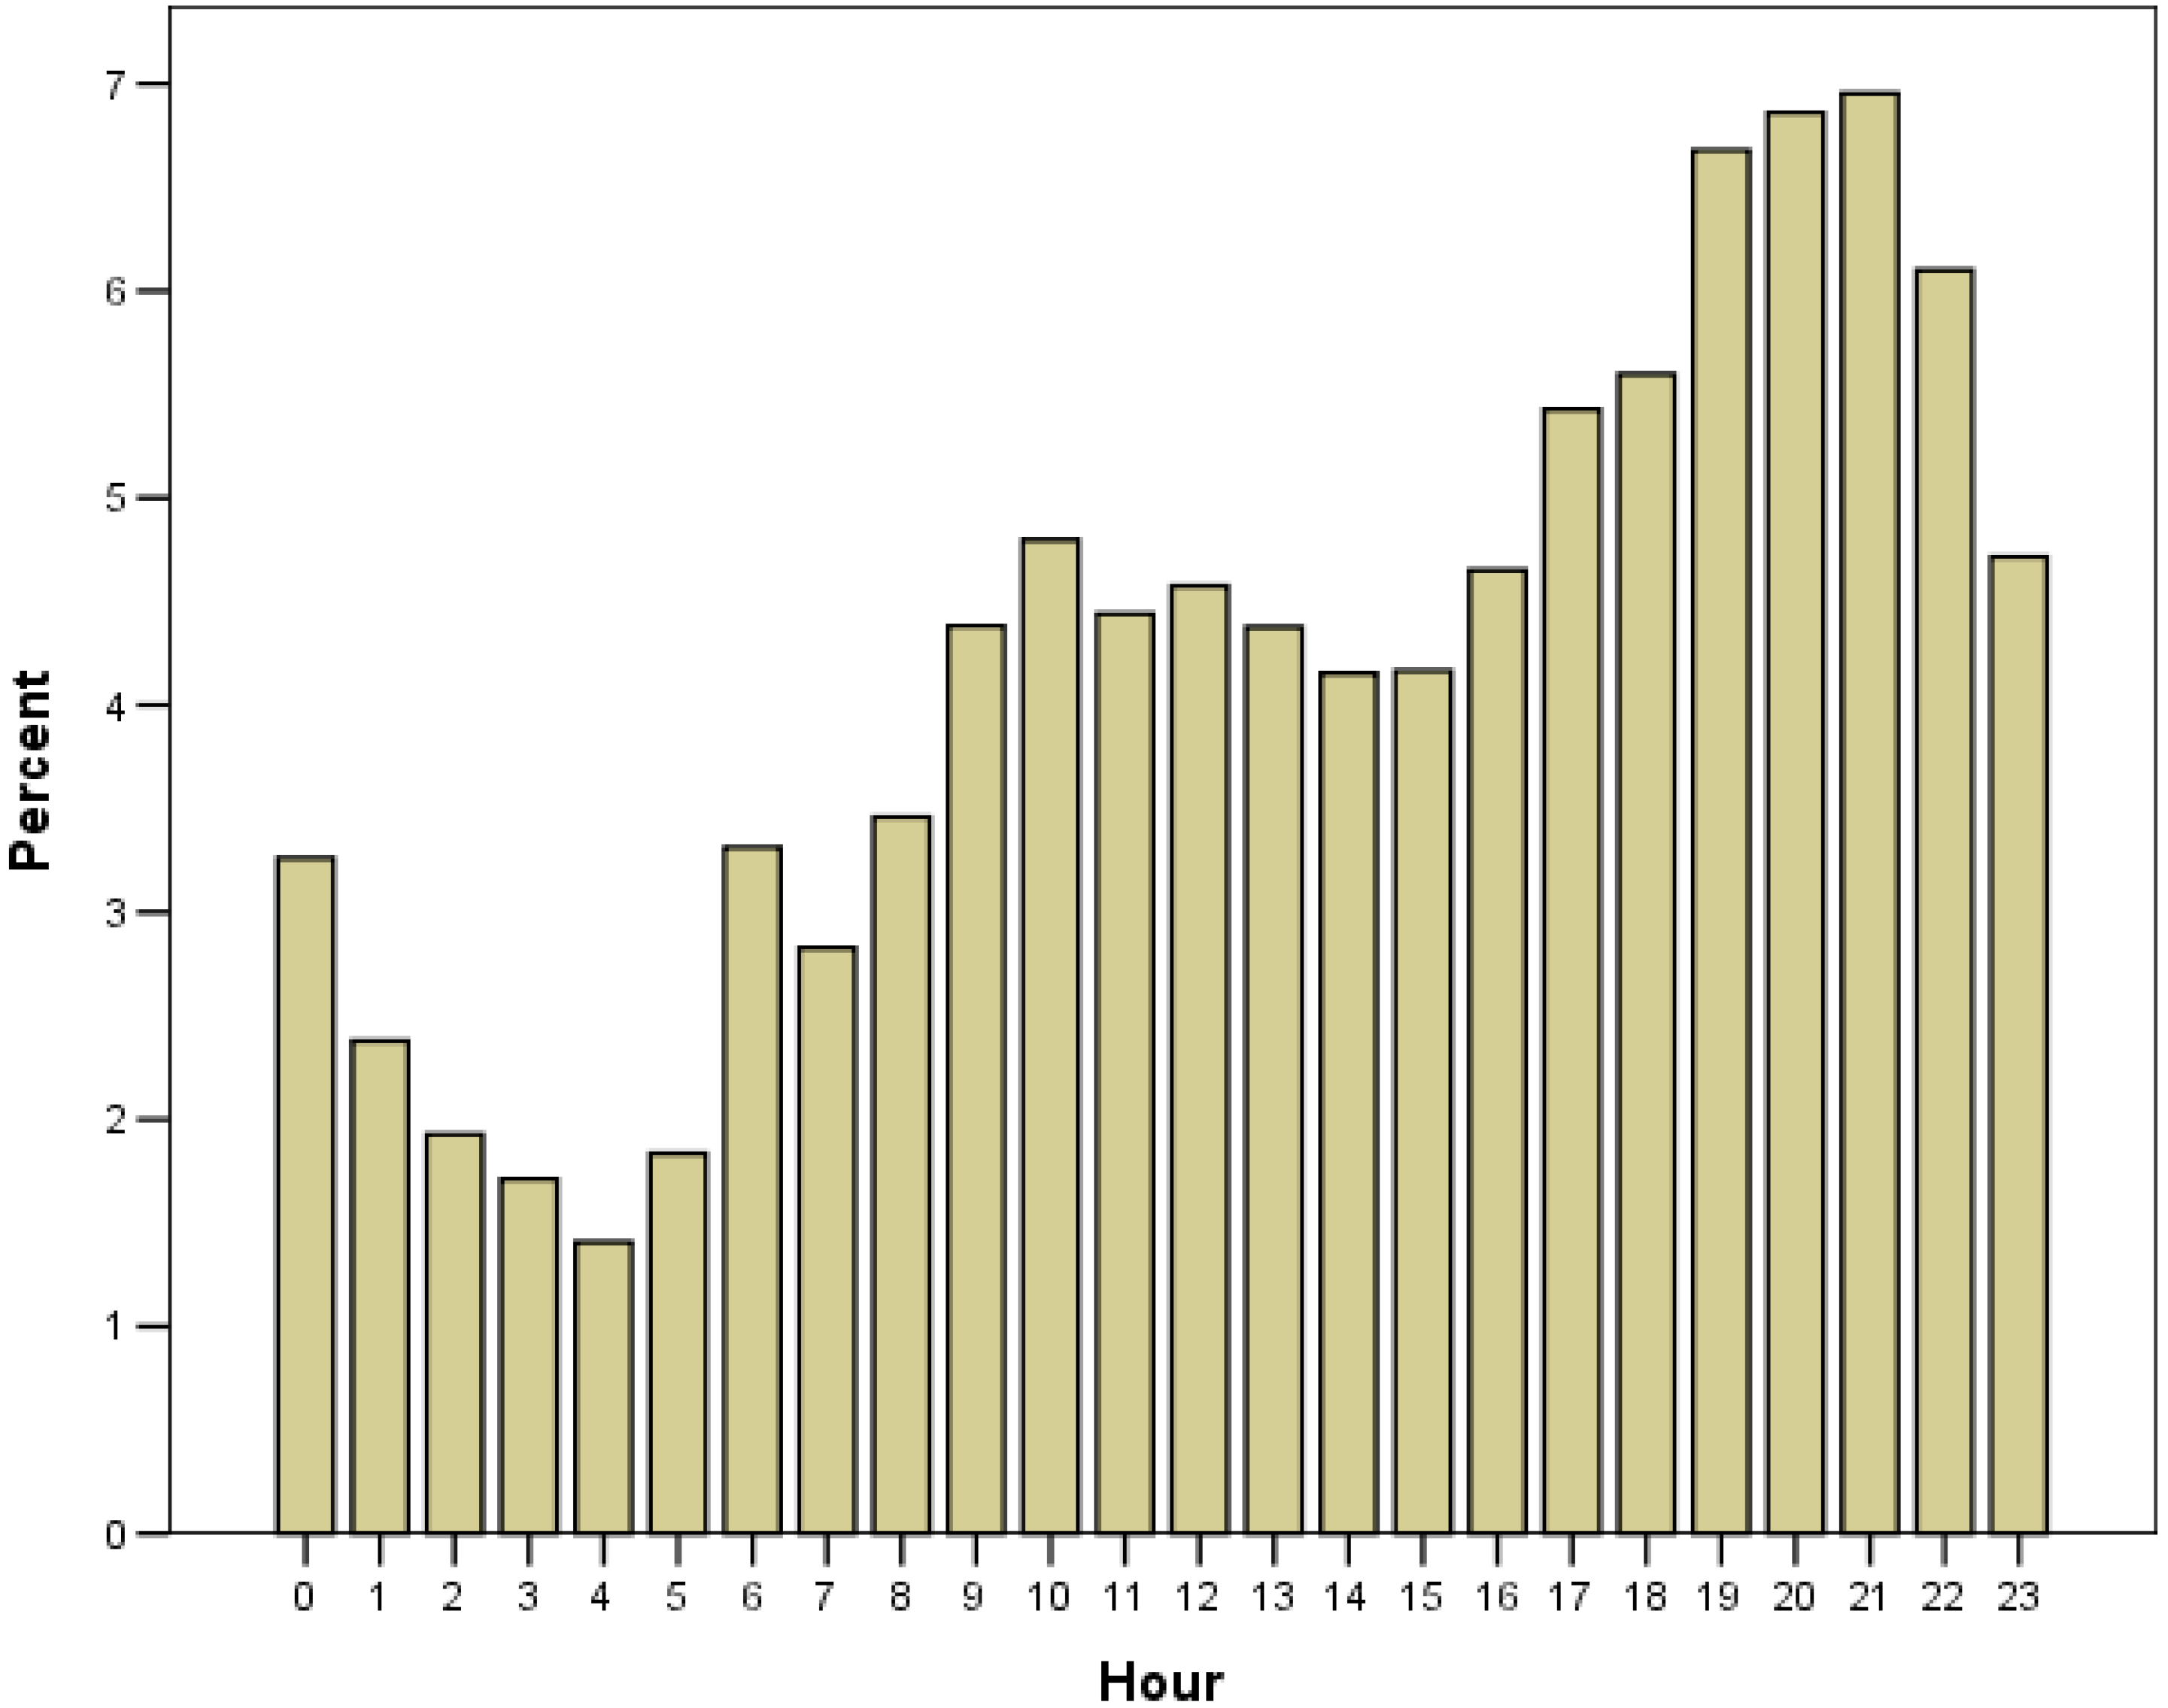
There were 17,114 emergency calls for EABP during the 911 days of the study: 26% of the calls were received in the morning until before noon, 44.5% in the afternoon until the evening, and 29.5% at night until early in the morning; this distribution was similar for older and younger patients. In our study, two peaks in the hourly variation of EACs for EABP were observed (Figure 1): the first one at about 10:00–12:00, and the second one at about 18:00–20:00. In total, 78.4% of the patients were females, and 60.2% of the patients were older than 65 years. The descriptive characteristics of the daily number of EACs for EABP and the environmental variables are presented in Table 1.
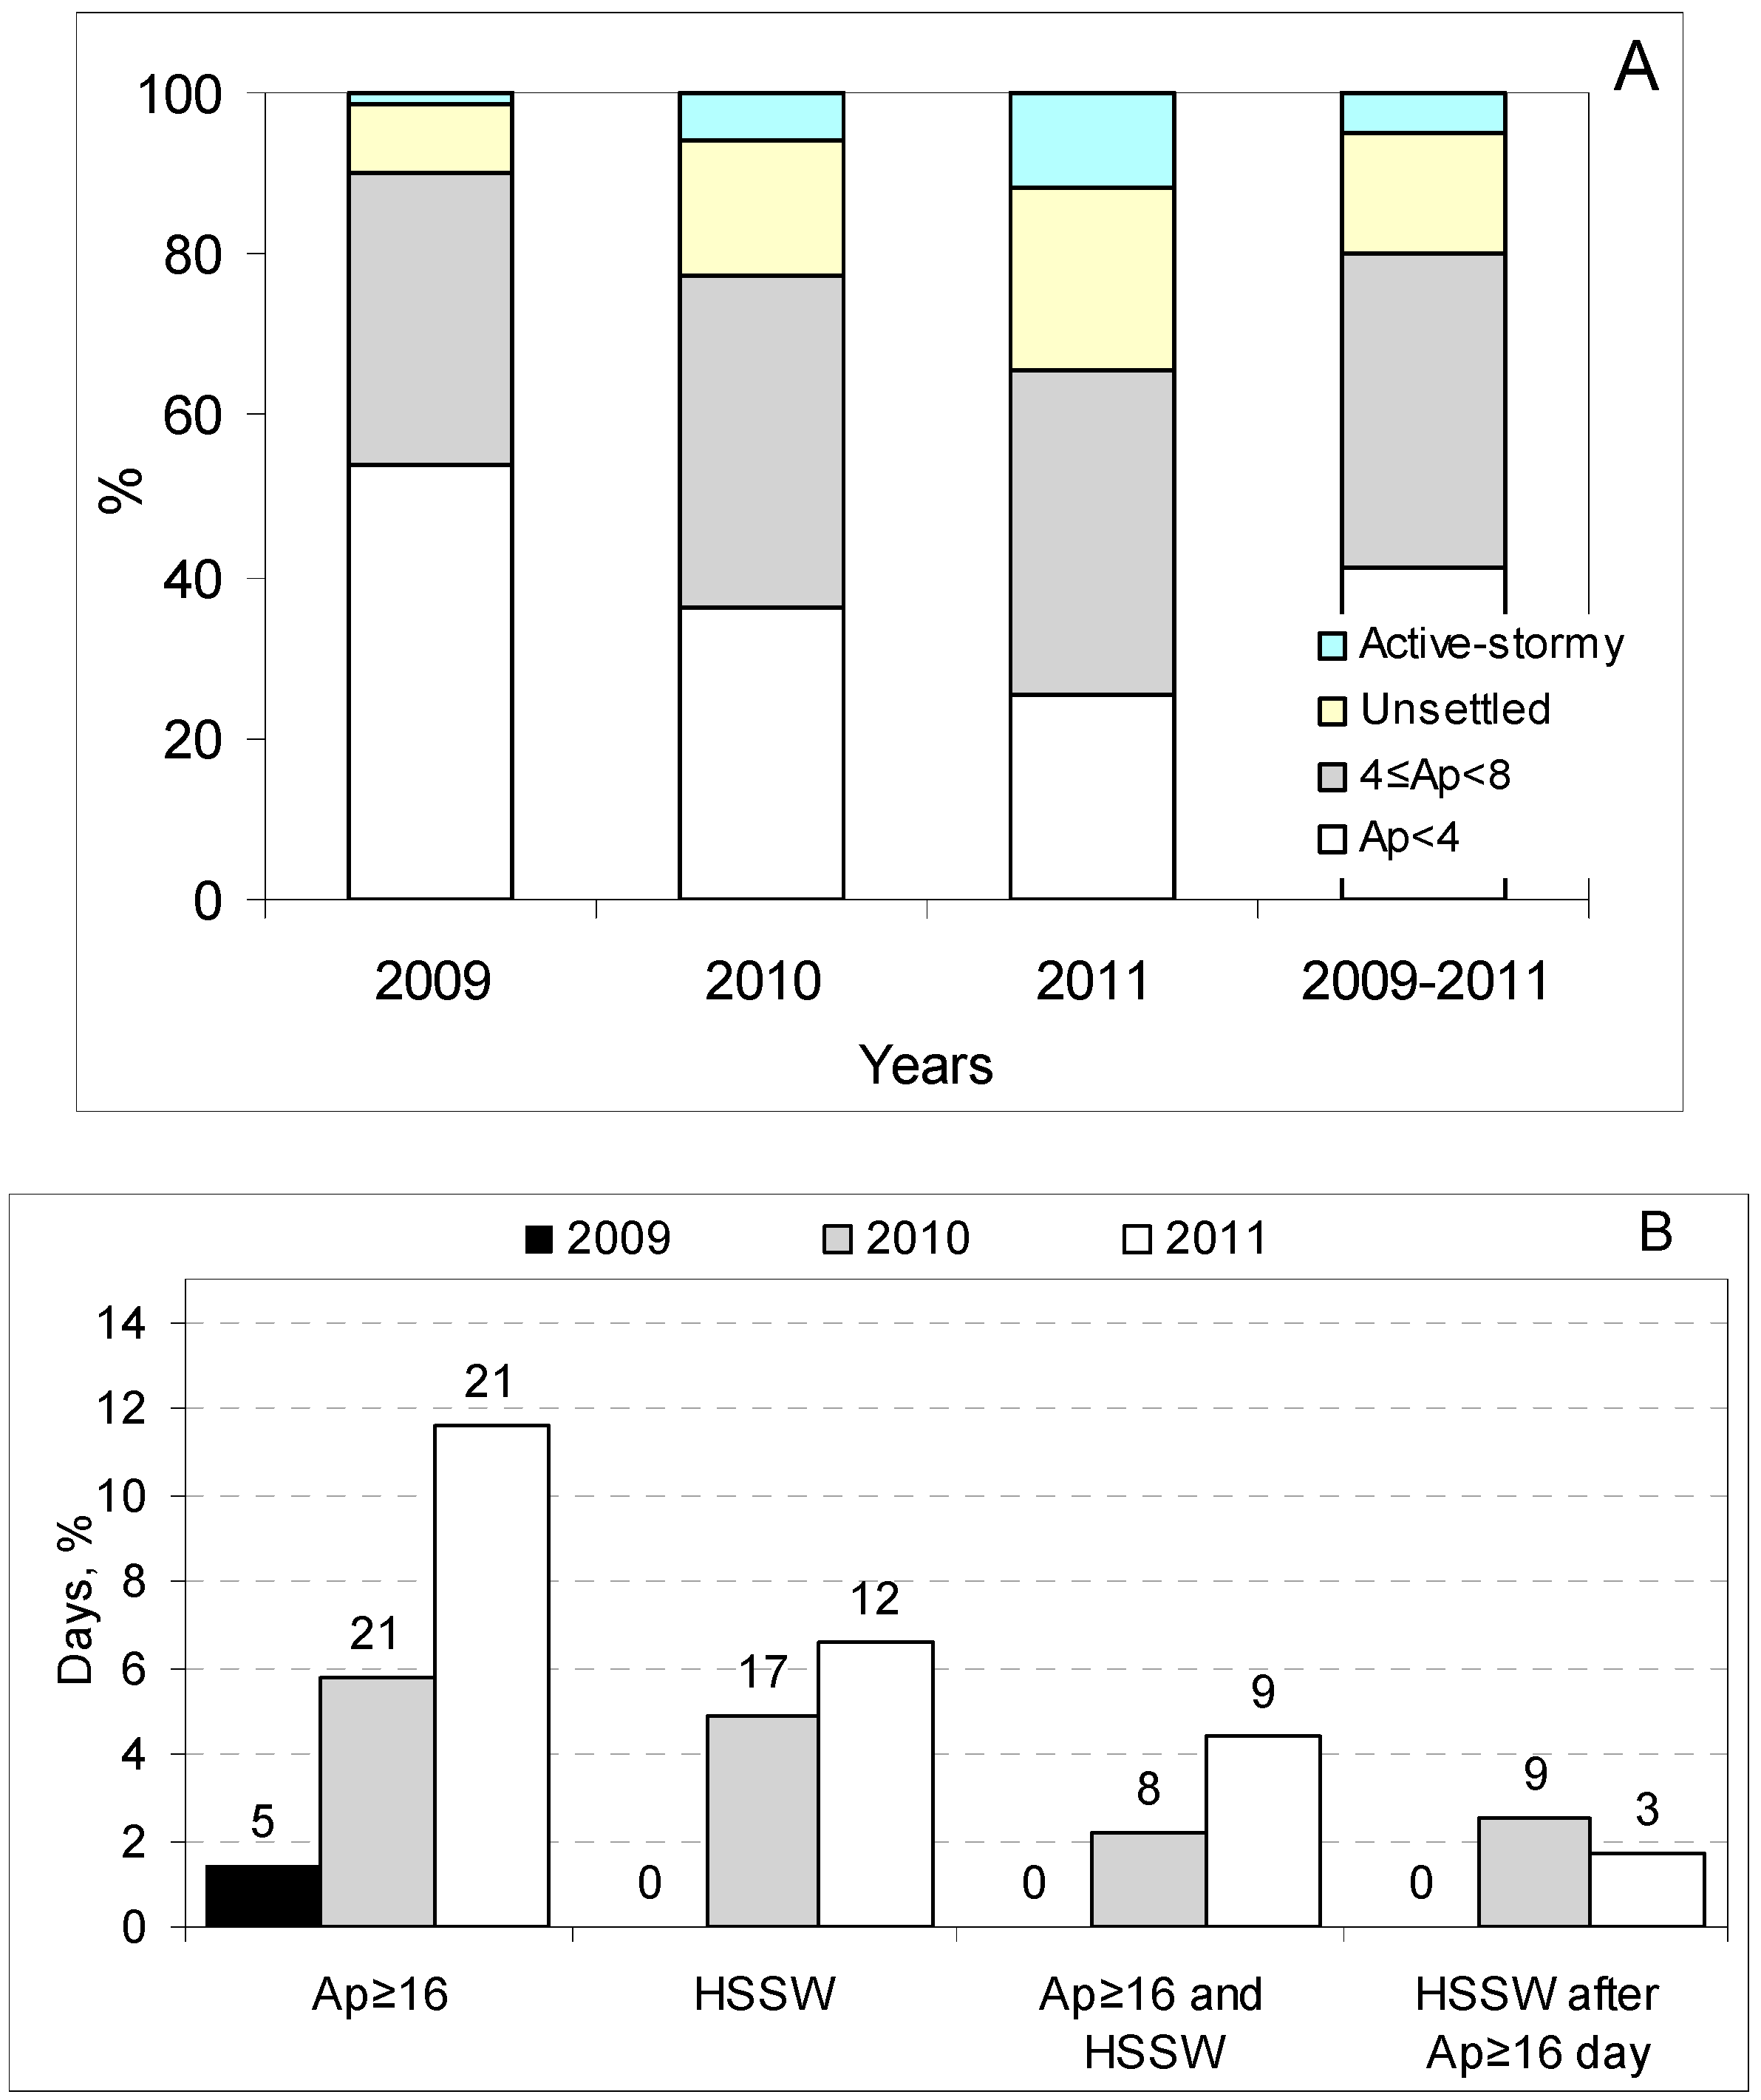
During the studied period, low GMA (Ap < 4) was detected on 375 (41.2%) days, and 48 (5.2%) days were evaluated as days with active-stormy GMA. Of these, 31 days were days without HSSW, and 17 were days with HSSW. In total, HSSW was detected on 29 (3.3%) days, of which 12 were days following an active-stormy GMA level. In addition, 34 days were marked as occurring two days after an active-stormy GMA level. As the studied period coincided with the years of the rise of the 24th solar cycle, a statistically significant increase in the rate of Ap ≥ 16 and days with HSSW was detected in the annual fluctuation (Figure 2).
During the period of May–August, there were statistically significantly fewer ambulance calls during the whole day and during the three periods of the day as compared to the period of September–April. The length of the day was negatively associated with the risk of EACs, except for the period of 8:00–13:59 (Table 2). During the period of 8:00–13:59, there were significantly more calls on weekdays not coincident with holidays as compared to on the weekend or holidays (Table 2). Adjusting for the month, the day of the week, and the length of the day, a significant impact of higher T (T > 1 °C) was observed with a lag of 0–3 days; the negative association with T above 1 °C was weaker with increasing lag (Table 2). The results of the testing of the hypothesis about the difference between two regression coefficients showed that a negative association between the risk of EACs and T above 1 °C with a lag of 0–1 days was significantly stronger during the period of 14:00–21:59, as compared to 8:00–13:59 (Table 2). We did not find any significant associations between the risk of EACs and T below −1 °C.
The stronger association was found to be between the risk of EACs and TW (T > 1 °C), during the whole day, between TW with a lag of 0–1 days and a decrease in daily TW during the period of 3–5 days before the call, in the morning until before noon with TW with a lag of 5–7 days, in the afternoon until the evening with TW with a lag of 0–1 days, and at night until the early morning with TW on the day of the call (Table 2).
Adjusting for day length, the month of the year, the day of the week, and statistically significant air temperature variables, WS on the sixth day before the call was positively associated with the risk of EACs during the whole day and in the afternoon until the evening. In addition, a positive association between WS below the median was detected during the whole day (with a lag of 0–4 days), in the morning until before noon (with a lag of 4–6 days), and in the afternoon until the evening (with a lag of 0–4 days). A protective impact of WS below the median with a lag of 7 days during the whole day and in the morning until before noon was seen (Figure 3).
During the whole day, a negative impact of lower BP was detected both below (lag = 0–2 days) and above (lag = 4 days) the median (Figure 3). In the morning until before noon, the impact of BP was similar. In the afternoon until the evening, a significant increase in the risk of EACs was associated with a lower BP below the median with a lag of 6 days, and at night until the early morning with a lower BP above the median with a lag of 3 days (Figure 3). A negative association between the risk of EACs and RH above the median on the previous day was seen during the whole day. In the morning until before noon, a higher risk was associated with changes in daily RH; and at night until the early morning, with a higher RH below the median on the previous day and a lower RH above the median with a lag of 4 days (Figure 3).
The multivariate models created by using previously determined statistically significant weather variables are presented in Table 3. These models included only weather variables with p < 0.2 in the multivariate model. The inclusion of air pollution and space weather variables into the regression model did not change the significance of weather variables, and changes in RRs were minimal (Table 3).
The impact of space weather was different depending on the time of the call. In the morning until before noon, the elevated risk was associated with active-stormy GMA; in the afternoon until the evening, with very low GMA and HSSW; and at night until the early morning, only with HSSW occurring after active-stormy days (Table 4). The inclusion of weather variables into the model increased the impact of space weather variables.
The weather and space weather conditions had different impacts for younger and older patients (Table 5). In the morning until before noon, the negative impact of low BP with a lag of 0–2 days was observed only in the elderly; in younger subjects, an increased risk was associated with a daily change in low BP. In the afternoon, the younger patients were more sensitive to a change in RH; in the elderly patients, the impact of the variables of RH was insignificant. A significant impact of colder air was detected only in the elderly patients in the afternoon until the evening.
4. Discussion
This study is a continuation of our previous work [32], wherein the impact of T, WS, BP, RH, and space weather variables with a lag of 0–2 days on the risk of EACs for EABP was analyzed only during the whole day depending on air temperature categories (study period: 2009–2010). In this work, we evaluated the nonlinear impact of the same weather variables by using piecewise linear spline functions; new weather variables were created based on the unconstrained distributed lag model for a lag of 0–7 days, and the analysis was performed for calls depending on the time of day. In addition, the space weather variable we used was not binary, but categorized in six categories; and the daily exposure to PM10, CO, and ozone were used as covariates.
In our study, a negative association was found between air temperatures on the warmer days (T above 1 °C) with a lag of 0–1 days and daily EACs for EABP. According to the findings of other authors, an increased outdoor air temperature was associated with decreased blood pressure [13,14,27,35]. In a large study [36], a negative impact of decreased T was detected in systolic and diastolic blood pressure, platelet count, and lipoprotein concentration level. A negative association between same-day apparent temperature and emergency room visits for AH was detected [37]. A decrease in hypertension-related hospitalizations was associated with warmer air [38] and was detected at high temperatures [39].
In our study, a greater risk of EACs was associated with a lower BP or with daily changes in BP. Many of the authors also stated a negative effect of lower BP and BP reduction on blood pressure. A negative effect of low BP on blood pressure levels was also reported in hypertensive patients who did not respond to treatment [6]. A significant inverse relationship between atmospheric pressure and blood pressure during the spring days, and only for systolic blood pressure, during winter nights, was observed in Poland [7].
In addition, in our study, the risk of daily EACs for EABP was positively associated with a decrease in daily T above 1 °C between the third and the fourth-to-seventh days, and wind speed with a lag of 6 days; and negatively with BP with a lag of 4 days above the median. These weather patterns may be associated with the transition from anticyclonic to cyclonic days. According to Morabito et al. [40], an increase in blood pressure followed a sudden day-to-day change of the weather pattern from anticyclonic to cyclonic days.
Another main finding in our study was that the impact of weather variables was not identical for different times of the day. The greatest effect of the weather pattern was observed in the morning until before noon. The elevated risk of EACs for EABP in the morning until before noon was associated with an increase in mean daily change in RH above 82% and a lower BP with a lag of 0–2 days below the median, i.e., with possible cyclonic conditions. During the whole day or other periods of the day, this complex of weather conditions was not significantly associated with an increased risk in EACs. Other authors observed a worse variation in blood pressure in association with cyclonic conditions [40,41]: cyclonic weather was found to be associated with changes in adequate circadian blood pressure variations, as well as with an inadequate nocturnal lowering of systolic and diastolic blood pressures [41]. The fact that the possible cyclonic condition had a negative impact on EACs only during the first half of the day may be explained by the diurnal elevation in blood pressure in the morning until before noon.
Similarly to other authors, who analyzed the associations between daily air temperature and blood pressure or exacerbations of arterial hypertension, we did not detect any positive associations between air temperature above 1 °C and EACs in the afternoon until the evening or at night until the early morning. However, a higher T above 1 °C at five to seven days before the call was associated with an increase in the risk of EACs in the morning until before noon.
In our study, in the morning until before noon, the impact of T above 1 °C with a lag of 0–2 days was nonsignificant after adjustment for seasonal differences. In the studies on the links between weather and blood pressure, a higher personal-level environmental temperature index during nighttime and early morning hours was associated with an increased blood pressure during the ensuing days [42]. In an Italian study, nighttime systolic pressure was positively related to temperature, and hot weather was associated with an increase in systolic pressure at night in treated elderly hypertensive subjects [43]. Because at night people are less exposed to outdoor temperature, nighttime blood pressure is possibly less sensitive to the outdoor air temperature. This may explain the absence of a negative association between T and the risk of EACs for EABP in the morning until before noon. In the afternoon, a warmer air temperature decreased the risk of EACs. It is likely that in the afternoon or several hours before, people were more exposed to the air temperature.
An increased risk of EACs for EABP was associated not only with instantaneous (a -lag of 0–2 days) weather conditions, but also with changes in weather conditions four to seven days prior to the call; especially in the morning until before noon. According to [44], the morning blood pressure surge was associated with hypertensive heart disease, inflammatory disease, diabetes, and arterial disease; patients with these diseases may be more sensitive to changes in weather conditions. Thus, change in weather conditions may worsen overall human health.
According to the research of the authors working in the field of the association between space weather and human health, an increased GMA—especially geomagnetic storms (GS)—is associated with an intensification of the sympathetic nervous system [20,45,46]. In addition, after GS, the heart rate variability parameters that are associated with the regulation of the parasympathetic nervous system were significantly lower as compared to those observed on days without GS. According to our results, in the morning until before noon, when the sympathetic activity was elevated, the risk of EACs for EABP was increased during days of active-stormy GMA, and no impact was observed on days of very low GMA. In the afternoon, when the activity of the parasympathetic nervous system increased, a significantly increased risk of EACs for EABP was associated with days of very low GMA. The fact that both extremely high and extremely low values of geomagnetic activity seem to have adverse health effects has been detected by other authors as well [30,47,48].
In our study, changes in air temperature had a stronger impact on elderly patients. For the elderly, the impact of T, WS, and BP on the day of the call and on the previous day was stronger at night. The impact of very low GMA in the afternoon was more pronounced in younger individuals. For the elderly, the negative impact was detected during days of stronger active-stormy GMA (active-stormy GMA together with HSSW); in younger patients, this effect was observed later, on days of HSSW occurring after active-stormy days. Elderly patients were likely more sensitive to these space weather events. According to the data for 2005, active GMA, geomagnetic storms, and a higher solar flare index during hospital admission for acute coronary syndromes had a stronger negative impact on survival in patients aged >70 years [49]. Mendoza and Sandoval [50] found that myocardial infarction rates on days of Forbush decrease and severe storms were higher for individuals aged ≥65 years. Variations in human physiological parameters as well as blood pressure, heart rate, and heart rate variability were observed after increased GMA [51,52,53]. This can explain the increase in the daily number of EACs after the period of active-stormy GMA.
It should be noted that nonlinear associations between weather variables and the risk of EACs for EABP were detected: an increased risk was associated with changes in T, WS, BP, and RH only below or above the median. The nonlinear associations between weather variables and the daily EACs were evaluated in [32] by analyzing their impact in four air temperature categories.
Limitations. Our study is limited in that we had no data on personal risk factors; e.g., alcohol use or smoking, stress, or comorbidities. In addition to that, we did not have any data on other environmental factors that might elevate arterial blood pressure; i.e., long-term air pollution and noise levels in residence, the climatic conditions within people’s homes (indoor air temperature and air quality), and time spent indoors. In this study, we did not evaluate the effectiveness of pharmacological treatment. All these factors may be confounding factors.
5. Conclusions
1. A negative association between the risk of EACs and T above 1 °C with a lag of 0–1 days was significantly stronger during the period of 14:00–21:59 as compared to that of 8:00–13:59.
2. An increase of 10 °C when T > 1 °C on the day of the call was associated with a decrease in the risk of EACs during the time periods of 14:00–21:59 (RR = 0.78, p < 0.001) and 22:00–7:59 (RR = 0.88, p = 0.35). During the time period of 8:00–13:59, the risk of EACs was positively associated with T above 1 °C with a lag of 5–7 days (RR = 1.18, p = 0.03).
3. A decrease in 10 °C where daily T above 1 °C between the third and the fourth to seventh days was associated with a 10% increase in the risk of daily EACs for EABP; a negative impact of lower BP below the median with a lag of 0–2 days was detected.
4. An elevated risk of EACs was associated during 8:00–13:59 with active-stormy GMA (RR = 1.22, p = 0.003); during 14:00–21:59 with very low GMA (RR = 1.07, p = 0.008) and HSSW (RR = 1.17, p = 0.014); and during 22:00–7:59 with HSSW occurring after active-stormy days (RR = 1.32, p = 0.019).
The associations of environmental variables with the exacerbation of essential hypertension may be analyzed depending on the time of the event. A stronger impact of weather patterns was observed during the time period of 8:00–13:59.
Acknowledgments
We acknowledge the contribution of Kaunas city ambulances involved in the registration of cardiovascular emergency admissions and the formation of the computer database.
Authors Contributions
J.V. conceived the idea, performed statistical analyses, interpreted the results, and was the lead writer. P.D. was responsible for the medical data and read and approved the final manuscript. A.B. assisted with the writing of the manuscript and revised the manuscript. All authors read and approved the final version of the manuscript.
Conflicts of Interest
The authors declare no conflict of interest.
References
- Casas, A.L.F.; Santos, G.M.D.; Chiocheti, N.B.; de Andrade, M. Effects of Temperature Variation on the Human Cardiovascular System: A Systematic Review. In Climate Change and Health. Climate Change Management; Leal Filho, W., Azeiteiro, U., Alves, F., Eds.; Springer: Cham, Switzerland, 2016. [Google Scholar]
- Elwood, P.C.; Beswick, A.; O’Brien, J.R.; Renaud, S.; Fifield, R.; Limb, E.S.; Bainton, D. Temperature and risk factors for ischaemic heart disease in the Caerphilly prospective study. Br. Heart 1993, 70, 520–523. [Google Scholar] [CrossRef]
- Woodhouse, P.R.; Khaw, K.T.; Plummer, M. Seasonal variation of blood pressure and its relationship to ambient temperature in an elderly population. J. Hypertens. 1993, 11, 1267–1274. [Google Scholar] [CrossRef] [PubMed]
- Woodhouse, P.R.; Khaw, K.T.; Plummer, M.; Foley, A.; Meade, T.W. Seasonal variations of plasma fibrinogen and factorVII activity in the elderly: Winter infections and death from cardiovascular disease. Lancet 1994, 343, 435–439. [Google Scholar] [CrossRef]
- Dockery, D.W.; Pope, C.A., 3rd; Kanner, R.E.; Villegas, M.G.; Schwartz, J. Daily changes in oxygen saturation and pulse rate associated with particulate air pollution and barometric pressure. Res. Rep. Health Eff. Inst. 1999, 83, 1–19. [Google Scholar]
- Weinbacher, M.; Martina, B.; Bart, T.; Drewe, J.; Gasser, P.; Gyr, K. Blood pressure and atmospheric pressure. Ann. N. Y. Acad. Sci. 1996, 738, 335–336. [Google Scholar] [CrossRef]
- Kamiński, M.; Cieślik-Guerra, U.I.; Kotas, R.; Mazur, P.; Marańda, W.; Piotrowicz, M.; Sakowicz, B.; Napieralski, A.; Trzos, E.; Uznańska-Loch, B.; et al. Evaluation of the impact of atmospheric pressure in different seasons on blood pressure in patients with arterial hypertension. Int. J. Occup. Med. Environ. Health 2016, 29, 783–792. [Google Scholar] [CrossRef] [PubMed]
- Larcan, A.; Lambert, H.; Stoltz, J.F.; Laprevote-Heuilly, M.C.; Kempf, J.B.; Lambert, J. Climatological parameters and acute vascular, neurological and cardiac accidents. Rev. Epidemiol. Sante Publique 1982, 30, 343–354. [Google Scholar] [PubMed]
- Hori, A.; Hashizume, M.; Tsuda, Y.; Tsukahara, T.; Nomiyama, T. Effects of weather variability and air pollutants on emergency admissions for cardiovascular and cerebrovascular diseases. Int. J. Environ. Health Res. 2012, 22, 416–430. [Google Scholar] [CrossRef] [PubMed]
- Blazejczyk, K.; Epstein, Y.; Jendritzky, G.; Staiger, H.; Tinz, B. Comparison of UTCI to selected thermal indices. Int. J. Biometeorol. 2012, 56, 515–535. [Google Scholar] [CrossRef] [PubMed]
- Mancia, G.; Fagard, R.; Narkiewicz, K.; Redán, J.; Zanchetti, A.; Böhm, M.; Christiaens, T.; Cifkova, R.; De Backer, G.; Dominiczak, A.; et al. 2013 ESH/ESC Guidelines for the management of arterial hypertension: The Task Force for the management of arterial hypertension of the European Society of Hypertension (ESH) and of the European Society of Cardiology (ESC). Eur. Heart. J. 2013, 34, 2159–2219. [Google Scholar] [PubMed]
- Brook, R.D.; Weder, A.B.; Rajagopalan, S. The effects of environmental factors on blood pressure in clinical practice and research. J. Clin. Hypertens. 2011, 13, 836–842. [Google Scholar] [CrossRef] [PubMed]
- Halonen, J.I.; Zanobetti, A.; Sparrow, D.; Vokonas, P.S.; Schwartz, J. Relationship between outdoor temperature and blood pressure. Occup. Environ. Med. 2011, 68, 296–301. [Google Scholar] [CrossRef] [PubMed]
- Barnett, A.G.; Sans, S.; Salomaa, V.; Kuulasmaa, K.; Dobson, A.J. The effect of temperature on systolic blood pressure. Blood Press. Monit. 2007, 12, 195–203. [Google Scholar] [CrossRef] [PubMed]
- Modesti, P.A.; Morabito, M.; Massetti, L.; Rapi, S.; Orlandini, S.; Mancia, G.; Gensini, G.F.; Parati, G. Seasonal blood pressure changes: An independent relationship with temperature and daylight hours. Hypertension 2013, 61, 908–914. [Google Scholar] [CrossRef] [PubMed]
- Brook, R.D.; Rajagopalan, S. Particulate matter air pollution and blood pressure. J. Am. Soc. Hypertens. 2009, 3, 332–350. [Google Scholar] [CrossRef] [PubMed]
- Fuks, K.; Mebus, S.; Hertel, S.; Viehmann, A.; Nonnemacher, M.; Dragano, N.; Möhlenkamp, S.; Jakobs, H.; Kessler, C.; Erbel, R.; et al. Long-term urban particulate air pollution, traffic noise and arterial blood pressure. Environ. Health Perspect. 2011, 119, 1706–1711. [Google Scholar] [CrossRef] [PubMed]
- Barregard, L.; Bonde, E.; Ohrstrom, E. Risk of hypertension from exposure to road traffic noise in a population-based sample. Occup. Environ. Med. 2009, 66, 410–415. [Google Scholar] [CrossRef] [PubMed]
- Ghione, S.; Mezzasalma, L.; Del Seppia, C.; Papi, F. Do geomagnetic disturbances of solar origin affect arterial blood pressure? J. Hum. Hypertens. 1998, 12, 749–754. [Google Scholar] [CrossRef] [PubMed]
- Dimitrova, S.; Stoilova, I. Planetary geomagnetic indices, human physiology and subjective complaints. J. Balkan Geophys. Soc. 2003, 6, 37–45. [Google Scholar]
- Furlan, R.; Guzzetti, S.; Crivellaro, W.; Dassi, S.; Tinelli, M.; Baselli, G.; Cerutti, S.; Lombardi, F.; Pagani, M.; Malliani, A. Continuous 24-hour assessment of the neural regulation of systemic arterial pressure and RR variabilities in ambulant subjects. Circ. J. 1990, 81, 537–547. [Google Scholar] [CrossRef]
- Hermida, R.C.; Ayala, D.E.; Portaluppi, F. Circadian variation of blood pressure: The basis for the chronotherapy of hypertension. Adv. Drug. Deliv. Rev. 2007, 59, 904–922. [Google Scholar] [CrossRef] [PubMed]
- White, W.B. Importance of blood pressure control over a 24-hour period. J. Manag. Care. Spec. Pharm. 2007, 13, 34–39. [Google Scholar] [CrossRef] [PubMed]
- Suárez-Barrientos, A.; López-Romero, P.; Vivas, D.; Castro-Ferreira, F.; Núñez-Gil, I.; Franco, E.; Ruiz-Mateos, B.; García-Rubira, J.C.; Fernández-Ortiz, A.; Macaya, C.; et al. Circadian variations of infarct size in acute myocardial infarction. Heart 2011, 97, 970–976. [Google Scholar] [CrossRef] [PubMed]
- Charach, G.; Shochat, M.; Argov, O.; Weintraub, M.; Charach, L. Seasonal changes in blood pressure: Cardiac and cerebrovascular morbidity and mortality. World J. Hypertens. 2013, 3, 1–8. [Google Scholar] [CrossRef]
- Hanna, J.M. Climate, altitude, and blood pressure. Hum. Biol. 1999, 71, 553–582. [Google Scholar] [PubMed]
- Alperovitch, A.; Lacombe, J.M.; Hanon, O.; Dartigues, J.F.; Ritchie, K.; Ducimetière, P.; Tzourio, C. Relationship between blood pressure and outdoor temperature in a large sample of elderly individuals: The Three-City study. Arch. Intern. Med. 2009, 169, 75–80. [Google Scholar] [CrossRef] [PubMed]
- Watanabe, Y.; Cornélissen, G.; Halberg, F.; Otsuka, K.; Ohkawa, S.I. Associations by signatures and coherences between the human circulation and helio- and geomagnetic activity. Biomed. Pharmacother. 2001, 55, 76–83. [Google Scholar] [CrossRef]
- Cornelissen, G.; Halberg, F.; Breus, T.; Syutkina, E.V.; Baevsky, R.; Weydahl, A.; Watanabe, Y.; Otsuka, K.; Siegelova, J.; Fiser, B.; et al. Non-photic solar associations of heart rate variability and myocardial infarction. J. Atmos. Sol. Terr. Phys. 2002, 64, 707–720. [Google Scholar] [CrossRef]
- Palmer, S.J.; Rycroft, M.J.; Cermack, M. Solar and geomagnetic activity, extremely low frequency magnetic and electric fields and human health at the Earth’s surface. Surv. Geophys. 2006, 27, 557–595. [Google Scholar] [CrossRef]
- Gurfinkel, Y.I.; Atkov, O.Y.; Vasin, A.L.; Breus, T.K.; Sasonko, M.L.; Pishchalnikov, R.Y. Effect of zero magnetic field on cardiovascular system and microcirculation. Life Sci. Space Res. 2016, 8, 1–7. [Google Scholar] [CrossRef] [PubMed]
- Vencloviene, J.; Babarskiene, R.M.; Dobozinskas, P.; Sakalyte, G.; Lopatiene, K.; Mikelionis, N. Effects of weather and heliophysical conditions on emergency ambulance calls for elevated arterial blood pressure. Int. J. Environ. Res. Public Health 2015, 12, 2622–2638. [Google Scholar] [CrossRef] [PubMed]
- Vencloviene, J.; Babarskiene, R.M.; Dobozinskas, P.; Dedele, A.; Lopatiene, K.; Ragaisyte, N. The short-term associations of weather and air pollution with emergency ambulance calls for paroxysmal atrial fibrillation. Environ. Sci. Pollut. Res. Int. 2017, 24, 15031–15043. [Google Scholar] [CrossRef] [PubMed]
- Paternoster, R.; Brame, R.; Mazerolle, P.; Piquero, A. Using the correct statistical test for the equality of regression coefficients. Criminology 1998, 36, 859–866. [Google Scholar] [CrossRef]
- Madsen, C.; Nafstad, P. Associations between environmental exposure and blood pressure among participants in the Oslo Health Study (HUBRO). Eur. J. Epidemiol. 2006, 21, 485–491. [Google Scholar] [CrossRef] [PubMed]
- Hong, Y.C.; Kim, H.; Oh, S.Y.; Lim, Y.H.; Kim, S.Y.; Yoon, H.J.; Park, M. Association of cold ambient temperature and cardiovascular markers. Sci. Total Environ. 2012, 1, 435–436. [Google Scholar] [CrossRef] [PubMed]
- Basu, R.; Pearson, D.; Malig, B.; Broadwin, R.; Green, R. The effect of high ambient temperature on emergency room visits. Epidemiology 2012, 23, 813–820. [Google Scholar] [CrossRef] [PubMed]
- Bai, L.; Li, Q.; Wang, J.; Lavigne, E.; Gasparrini, A.; Copes, R.; Yagouti, A.; Burnett, R.T.; Goldberg, M.S.; Villeneuve, P.J.; et al. Hospitalizations from hypertensive diseases, diabetes, and arrhythmia in relation to low and high temperatures: Population-based study. Sci. Rep. 2016, 26, 30283. [Google Scholar] [CrossRef] [PubMed]
- Lin, S.; Luo, M.; Walker, R.J.; Liu, X.; Hwang, S.A.; Chinery, R. Extreme high temperatures and hospital admissions for respiratory and cardiovascular diseases. Epidemiology 2009, 20, 738–746. [Google Scholar] [CrossRef] [PubMed]
- Morabito, M.; Crisci, A.; Orlandini, S.; Maracchi, G.; Gensini, G.F.; Modesti, P.A. A synoptic approach to weather conditions discloses a relationship with ambulatory blood pressure in hypertensives. Am. J. Hypertens. 2008, 21, 748–752. [Google Scholar] [CrossRef] [PubMed]
- Kulakov, I.V.; Nasonova, E.V. The specific features of circadian blood pressure variations in patients with hypertensive disease in different types of weather. Klin. Med. 2004, 82, 24–27. [Google Scholar]
- Brook, R.D.; Shin, H.H.; Bard, R.L.; Burnett, R.T.; Vette, A.; Croghan, C.; Williams, R. Can personal exposures to higher nighttime and early-morning temperatures increase blood pressure? J. Clin. Hypertens. 2011, 13, 881–888. [Google Scholar] [CrossRef] [PubMed] [Green Version]
- Modesti, P.A.; Morabito, M.; Bertolozzi, I.; Massetti, L.; Panci, G.; Lumachi, C.; Giglio, A.; Bilo, G.; Caldara, G.; Lonati, L.; et al. Weather-related changes in 24-hour blood pressure profile. Effects of age and implications for hypertension management. Hypertension 2006, 47, 155–161. [Google Scholar] [CrossRef] [PubMed]
- Kario, K. Morning surge in blood pressure and cardiovascular risk: Evidence and perspectives. Hypertension 2010, 56, 765–773. [Google Scholar] [CrossRef] [PubMed]
- Gurfinkel, Y.I.; Lyubimov, V.V.; Oraevskii, V.N.; Parfenova, L.M.; Yurev, A.S. Effect of geomagnetic disturbances on the capillary blood flow in patients with coronary heart disease. Biophysics 1995, 40, 793–799. [Google Scholar]
- Breus, T.K.; Baevskii, R.M.; Chernikova, A.G. Effects of geomagnetic disturbances on humans functional state in space flight. J. Biomed. Sci. Eng. 2012, 5, 341–355. [Google Scholar] [CrossRef]
- Stoupel, E.; Kusniec, J.; Mazur, A.; Abramson, E.; Israelevich, P.; Strasberg, B. Timing of life threatening arrhythmias detected by implantable cardioverter-defibrillators in relation to changes in cosmophysical factors. Cardiol. J. 2008, 15, 437–440. [Google Scholar] [PubMed]
- Vencloviene, J.; Babarskiene, R.M.; Slapikas, R.; Sakalyte, G. The association between phenomena on the Sun, geomagnetic activity, meteorological variables, and cardiovascular characteristic of patients with myocardial infarction. Int. J. Biometeorol. 2013, 57, 797–804. [Google Scholar] [CrossRef] [PubMed]
- Vencloviene, J.; Babarskiene, R.M.; Milvidaite, I.; Kubilius, R.; Stasionyte, J. The effect of silar-geomagnetic during and after admission on survival in patients with acute coronary syndromes. Int. J. Biometerol. 2014, 58, 1295–1303. [Google Scholar] [CrossRef] [PubMed]
- Mendoza, B.; Diaz-Sandoval, R. Effects of Solar activity on myocardial infarction death in low geomagnetic latitude regions. Nat. Hazards 2004, 32, 35–36. [Google Scholar] [CrossRef]
- Papailiou, M.; Mavromichalaki, H.; Kudela, K.; Stetiarova, J.; Dimitrova, S. Effect of geomagnetic disturbances on physiological parameters: An investigation on aviators. Adv. Space Res. 2011, 48, 1545–1550. [Google Scholar] [CrossRef]
- Dimitrova, S.; Angelov, I.; Petrova, E. Solar and geomagnetic activity effects on heart rate variability. Nat. Hazards 2013, 69, 25–37. [Google Scholar] [CrossRef]
- Galata, E.; Ioannidou, S.; Papailiou, M.; Mavromichalaki, H.; Paravolidakis, K.; Kouremeti, M.; Rentifis, L.; Simantirakis, E.; Trachanas, K. Impact of space weather on human heart rate during the years 2011–2013. Astrophys. Space Sci. 2017, 362, 138. [Google Scholar] [CrossRef]
Figure 1.
Hour-to-hour circadian variation of emergency ambulance calls for elevated arterial blood pressure.
Figure 1.
Hour-to-hour circadian variation of emergency ambulance calls for elevated arterial blood pressure.

Figure 2.
The distribution of the daily geomagnetic activity level (A) and the days of high-speed solar wind (HSSW) (B) during the studied period.
Figure 2.
The distribution of the daily geomagnetic activity level (A) and the days of high-speed solar wind (HSSW) (B) during the studied period.

Figure 3.
The results of the unconstrained distributed time-lag threshold model for wind speed (WS), barometric pressure (BP), and relative humidity (RH); adjusted for day length, years, the month of the year, the day of the week, and air temperature variables for: the whole day TW (TW = max(T − 1, 0)) with a lag of 0–1 days and a decrease in daily TW during the period of 3–5 days before the call; in the morning until before noon, with TW with lags of 0–1 and 5–7 days, respectively; in the afternoon until the evening, with TW with a lag of 0–1 days; and at night until the early morning, with TW on the day of the call.
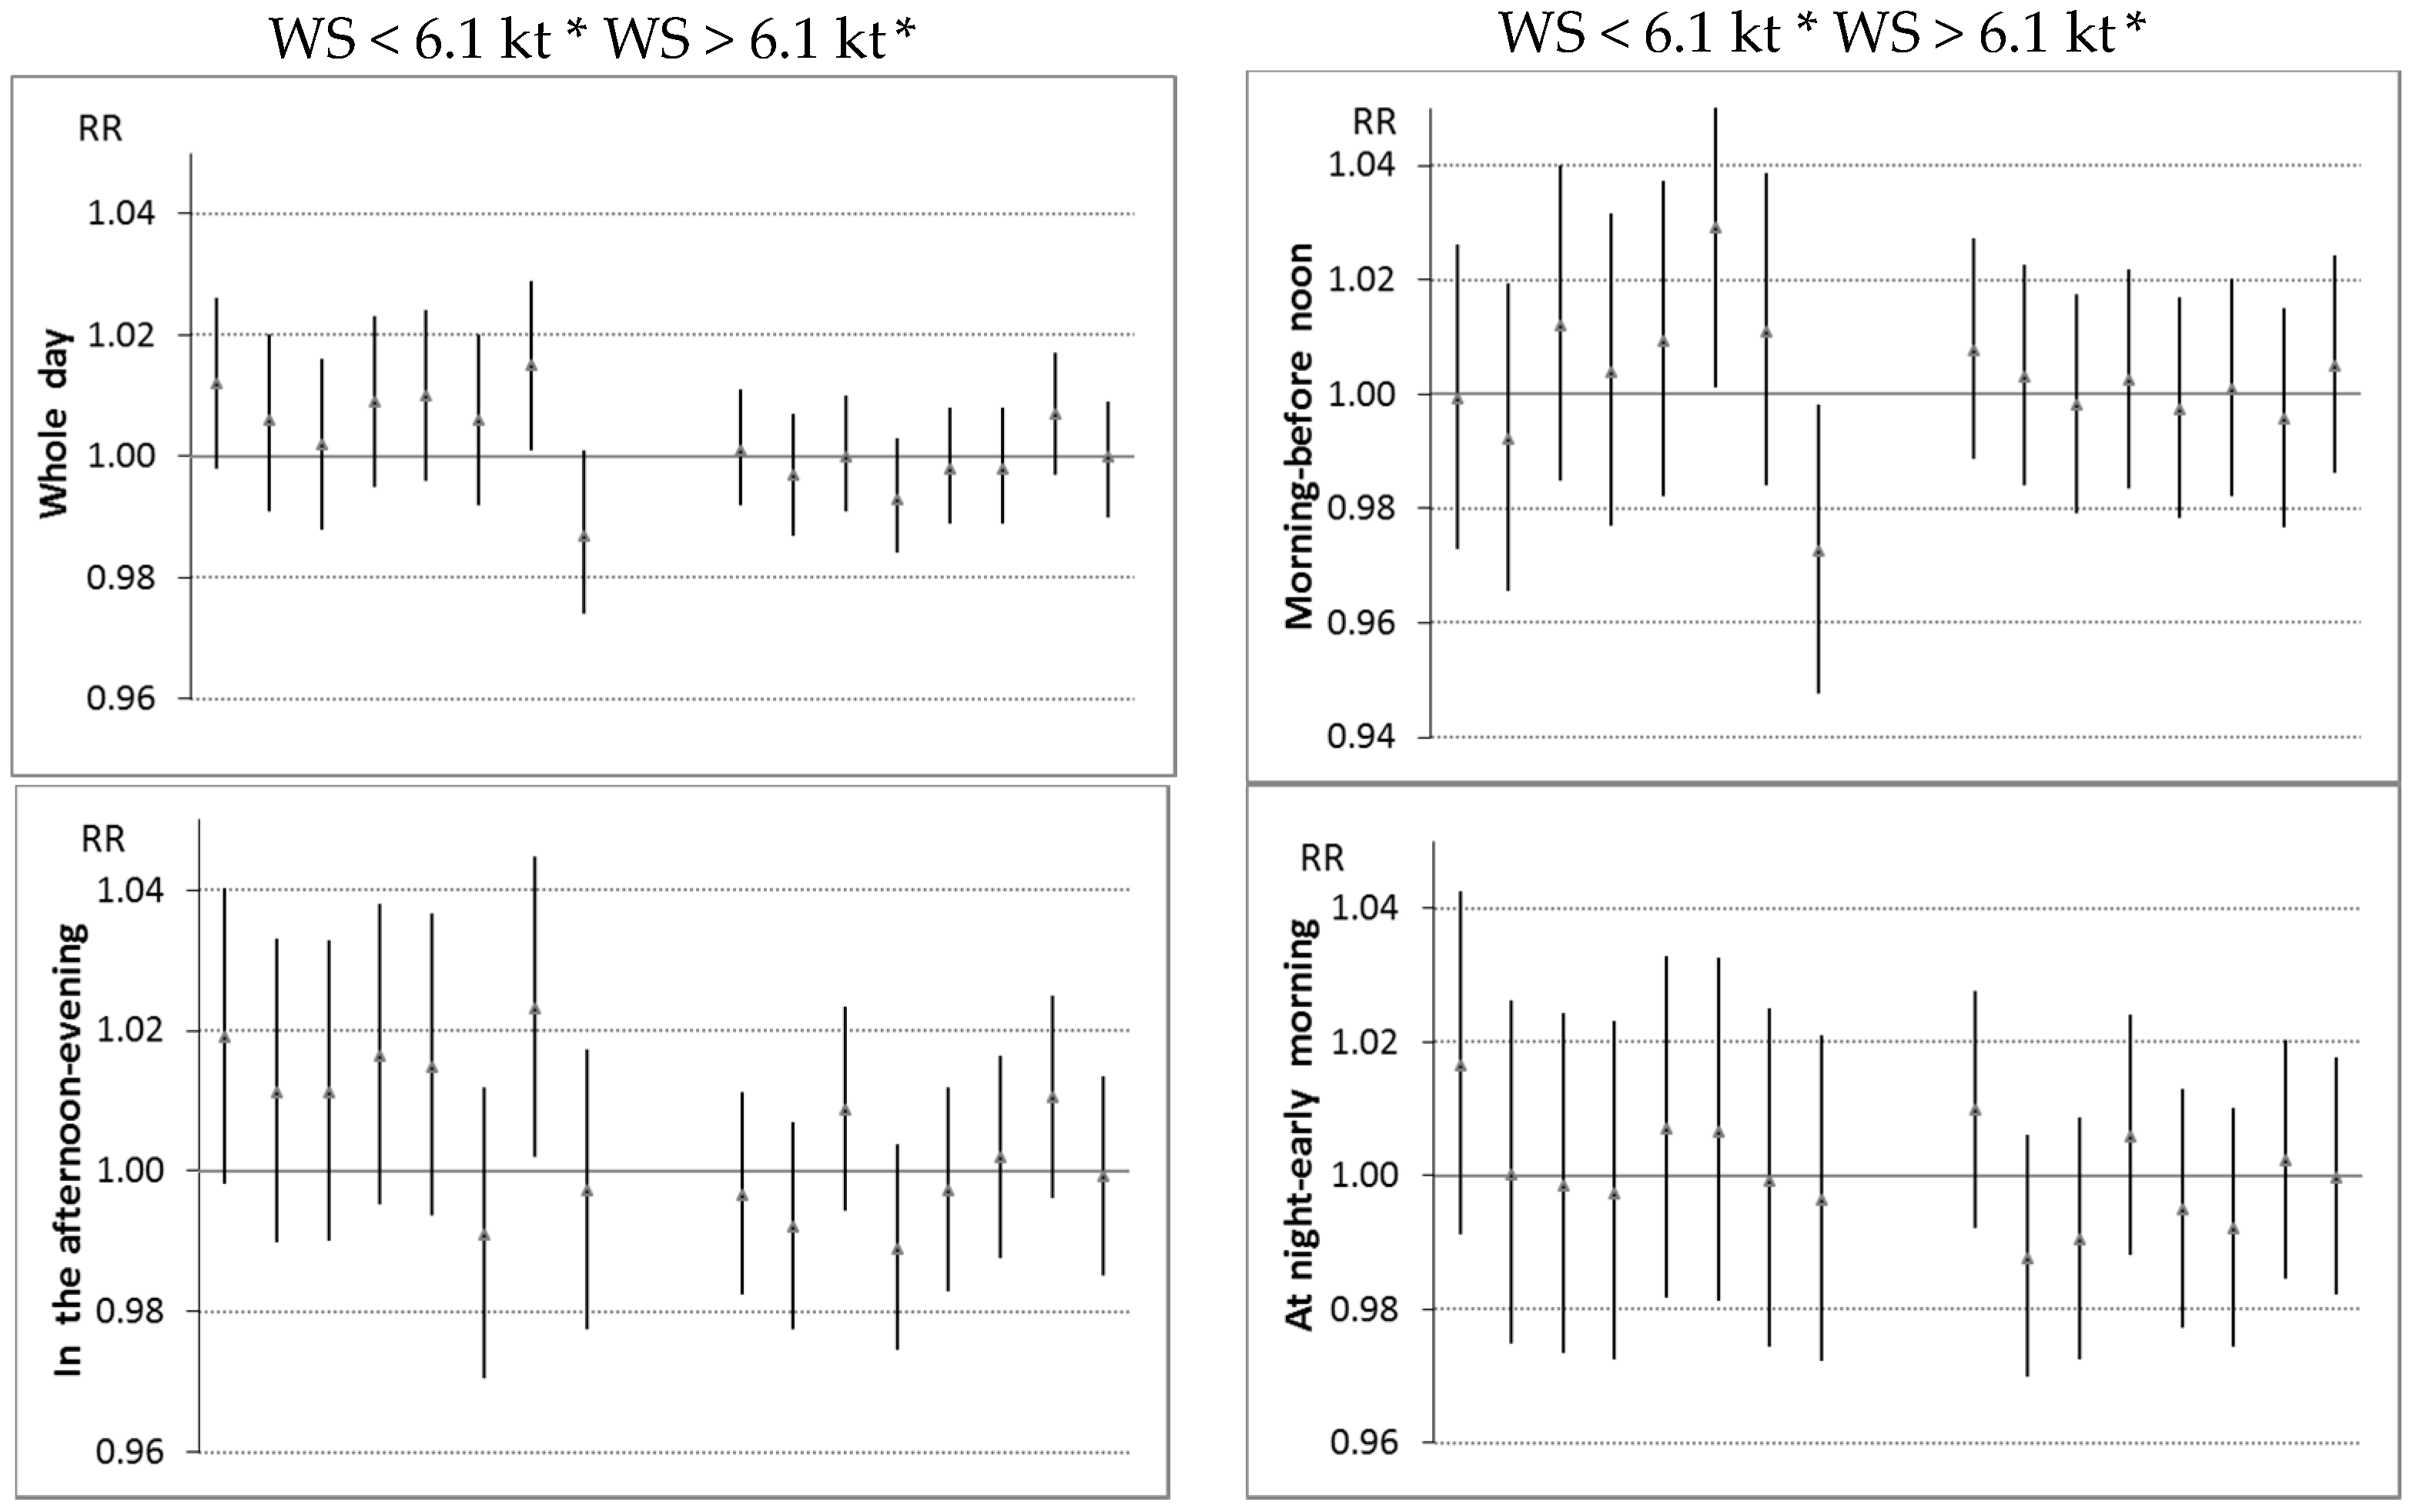
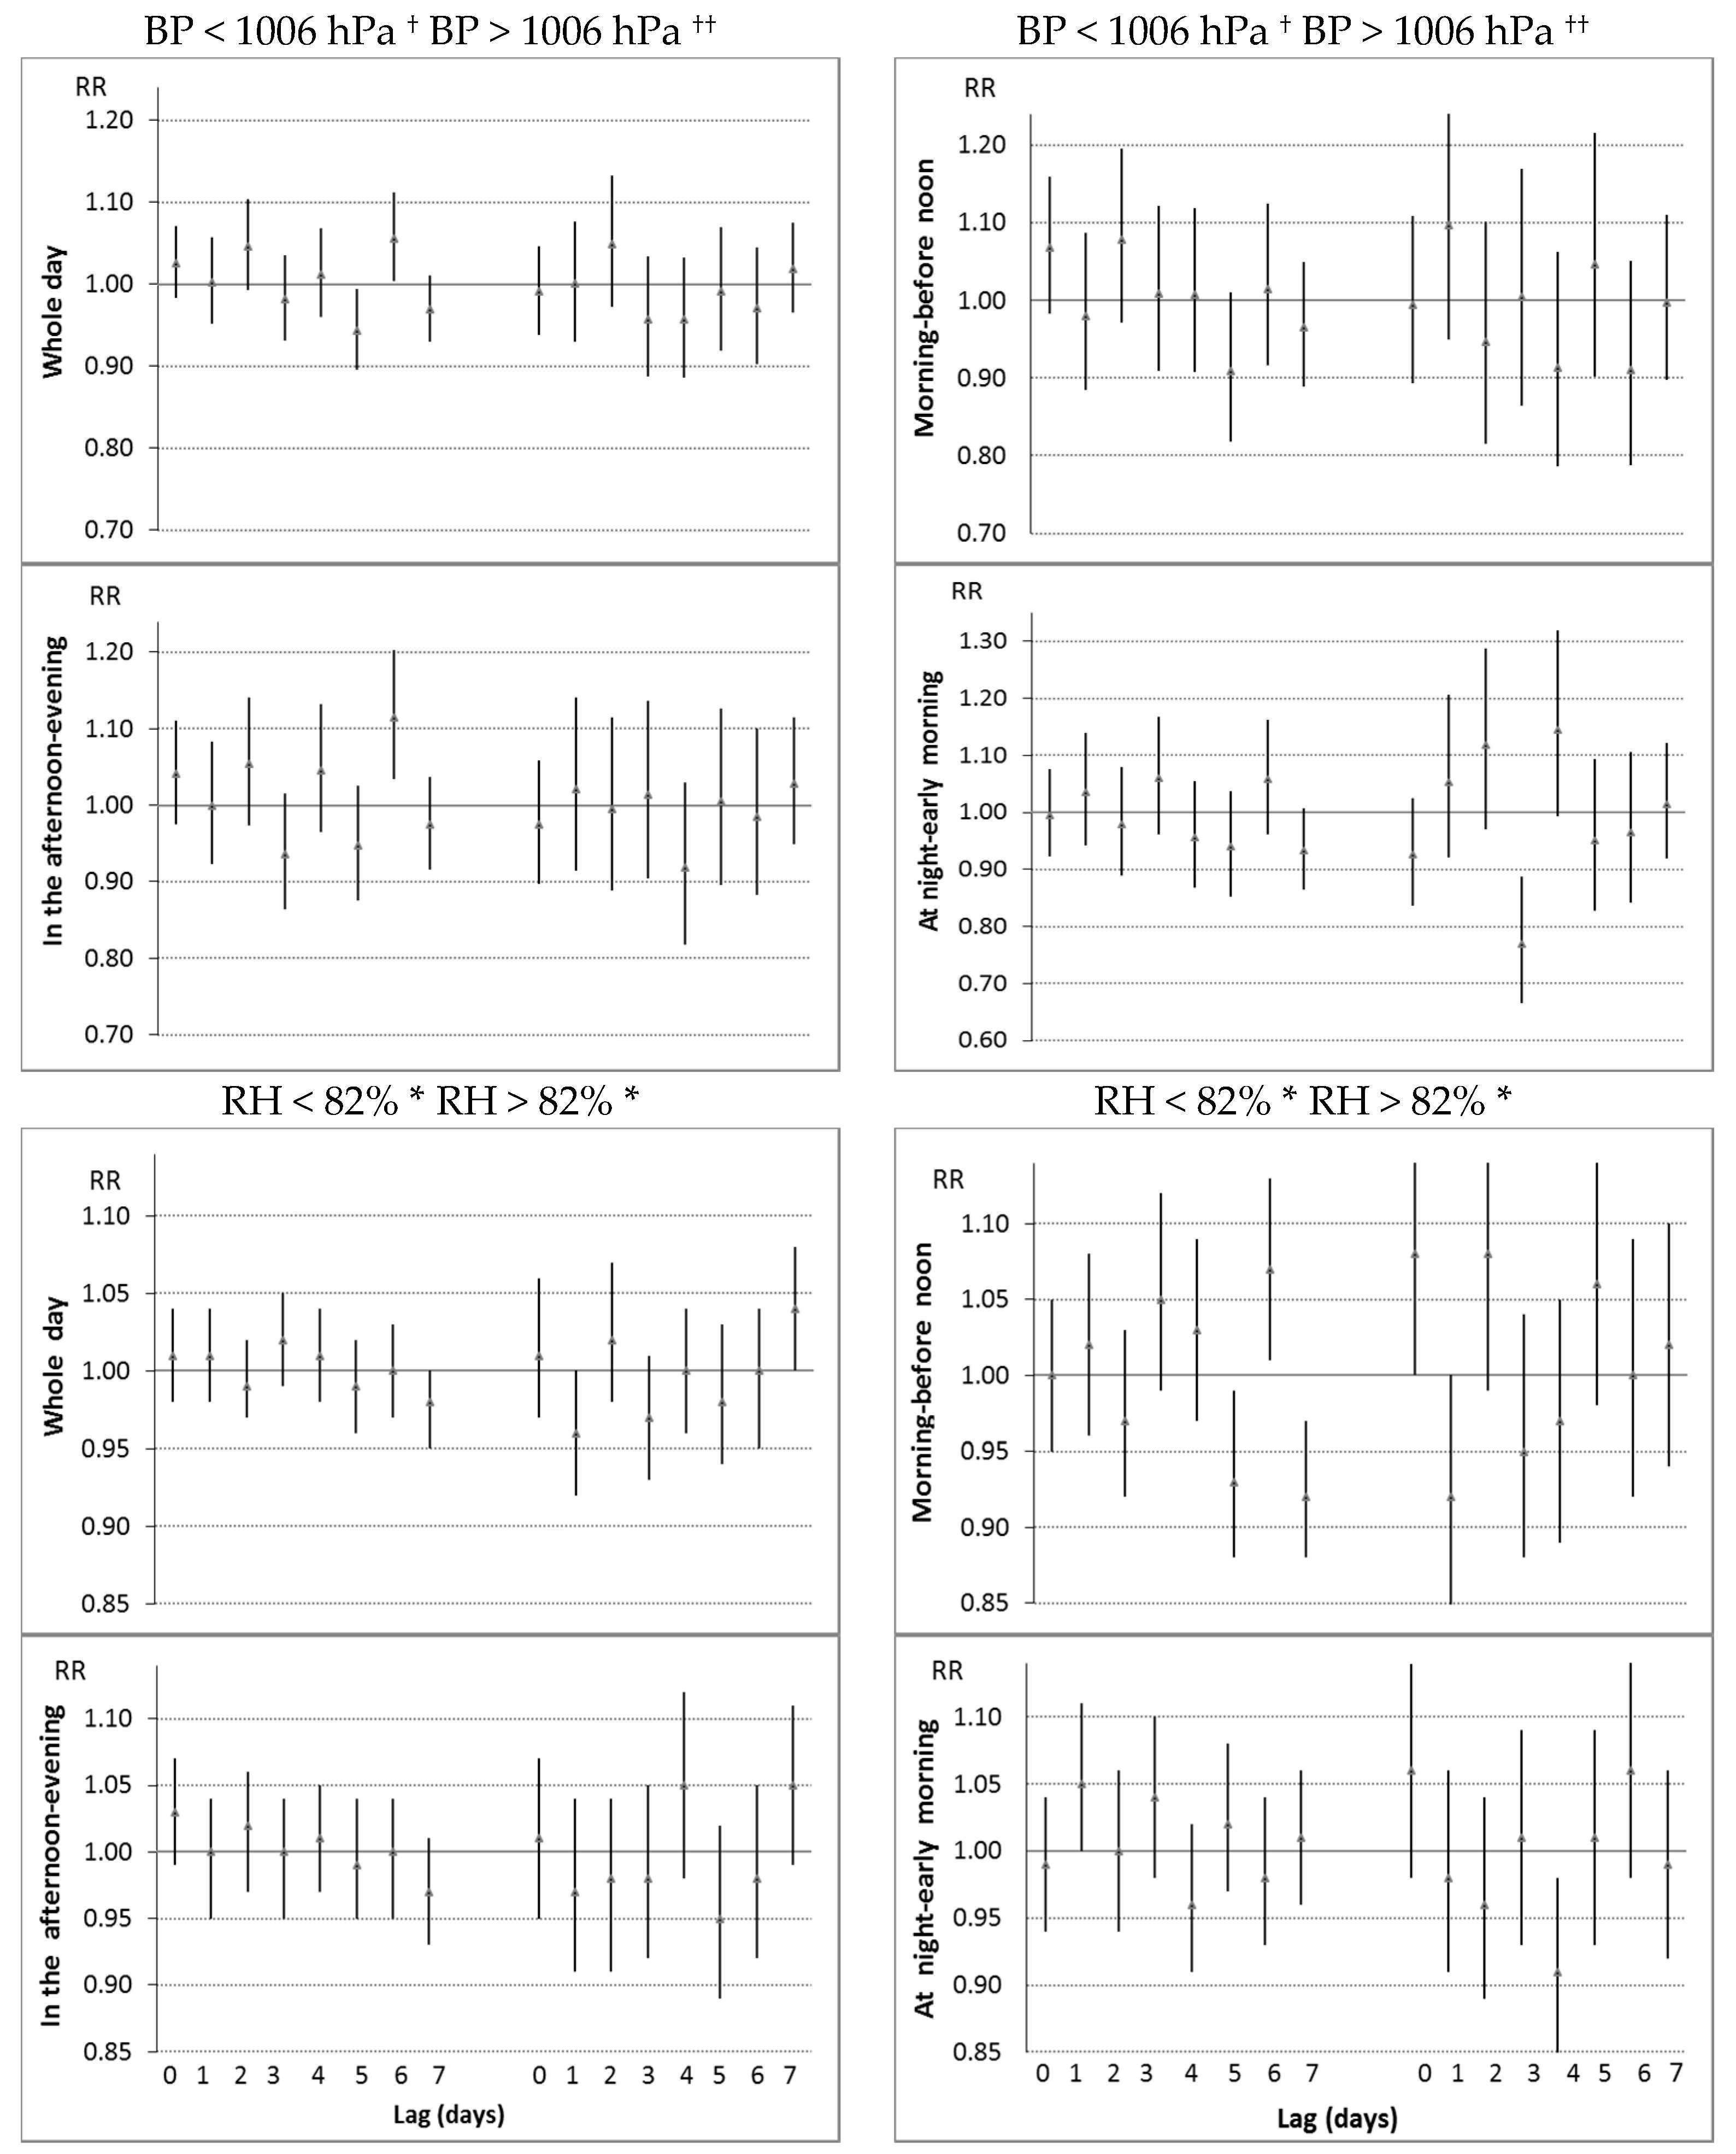
* Rate ratio (RR) per increase in 1 kt for WS and 10% for RH; † RR per decrease in 10hPa; †† RR per increase in 10 hPa.

Table 1.
The descriptive characteristics of the daily number of emergency ambulance calls for elevated arterial blood pressure and environmental variables.
Table 1.
The descriptive characteristics of the daily number of emergency ambulance calls for elevated arterial blood pressure and environmental variables.
| Variable | Range | Mean (SD) | Percentiles | ||
|---|---|---|---|---|---|
| 25 | 50 | 75 | |||
| Daily number of calls | |||||
| Daily | 5–41 | 18.8 (5.4) | 15 | 18 | 22 |
| 8:00–13:59 | 0–14 | 4.9 (2.4) | 3 | 5 | 6 |
| 14:00–21:59 | 1–19 | 8.4 (3.2) | 6 | 8 | 11 |
| 22:00–7:59 | 0–15 | 5.5 (2.6) | 4 | 5 | 7 |
| Age, years | 17–104 | 67 (15) | 58 | 70 | 78 |
| Environmental variables | |||||
| Air temperature (°C) | −21.8–27.2 | 6.5 (9.7) | −0.1 | 6.8 | 14.5 |
| Wind speed (kt) | 0.5–17.2 | 6.3 (2.8) | 4.2 | 6.1 | 8.0 |
| Barometric pressure (hPA) | 977–1032 | 1005 (9) | 1000 | 1006 | 1011 |
| Relative humidity (%) | 28–100 | 80 (13) | 72 | 82 | 90 |
| Day length (hour) | 7.2–17.3 | 12.4 (3.4) | 9.2 | 12.5 | 15.7 |
| Ap indices | 0–55 | 5.5 (5.5) | 2 | 4 | 6 |
SD: standard deviation.
Table 2.
Associations between day length, the day of the week, and air temperature above 1 °C and emergency calls for elevated arterial blood pressure (EABP) in rate ratio (RR) per increase of 10 °C for air temperature and 1 h for day length; adjusting for the month and years.
Table 2.
Associations between day length, the day of the week, and air temperature above 1 °C and emergency calls for elevated arterial blood pressure (EABP) in rate ratio (RR) per increase of 10 °C for air temperature and 1 h for day length; adjusting for the month and years.
| Variable | Lag | Whole Day | 8:00–13:59 | 14:00–21:59 | 22:00–7:59 |
|---|---|---|---|---|---|
| RR (95% CI) | RR (95% CI) | RR (95% CI) | RR (95% CI) | ||
| Day length | 0.93 (0.90–0.95) ** | 0.98 (0.93–1.04) ♦ | 0.92 (0.88–0.96) ** | 0.89 (0.85–0.94) ** | |
| Weekdays not coincident with holidays | 1.04 (1.01–1.08) | 1.11 (1.04–1.19) **,†,♦ | 1.01 (0.96–1.06) | 0.99 (0.94–1.06) | |
| RRs additionally adjusted for day length and the day of the week | |||||
| TW | 0 | 0.83 (0.78–0.88) ** | 0.91 (0.81–1.03) † | 0.77 (0.70–0.85) ** | 0.84 (0.75–0.94) * |
| TW | 1 | 0.83 (0.78–0.89) ** | 0.90 (0.80–1.02) | 0.79 (0.72–0.87) ** | 0.90 (0.80–1.01) |
| TW | 2 | 0.89 (0.83–0.95) ** | 0.96 (0.85–1.09) | 0.81 (0.74–0.90) ** | 0.95 (0.84–1.07) |
| TW | 3 | 0.90 (0.85–0.96) * | 0.94 (0.83–1.07) | 0.82 (0.75–0.91) * | 1.03 (0.92–1.17) |
| TW | 4 | 0.98 (0.92–1.04) | 0.99 (0.88–1.12) | 0.91 (0.83–1.00) | 1.03 (0.92–1.16) |
| TW | 5 | 1.03 (0.97–1.10) | 1.11 (0.98–1.26) | 0.96 (0.88–1.06) | 0.97 (0.86–1.09) |
| TW | 6 | 1.04 (0.98–1.11) | 1.13 (1.01–1.28) | 0.99 (0.90–1.09) | 0.98 (0.87–1.10) |
| TW | 7 | 1.05 (0.99–1.12) | 1.16 (1.03–1.30) | 1.06 (0.97–1.16) | 0.96 (0.86–1.08) |
| TW | 0–1 | 0.81 (0.76–0.87) ** | 0.89 (0.78–1.02) † | 0.76 (0.68–0.84) ** | 0.85 (0.75–0.96) * |
| TW | 5–7 | 1.05 (0.98–1.13) | 1.18 (1.03–1.35) | 1.00 (0.90–1.12) | 0.96 (0.84–1.10) |
* p < 0.01; ** p < 0.001; † a significant difference in regression coefficients during the time periods of 8:00–13:59 and 14:00–21:59; ♦ a significant difference in regression coefficients during the time periods of 8:00–13:59 and 22:00–7:59; TW = max(T − 1, 0) reflecting the impact of warmth; T: air temperature.
Table 3.
Multivariate associations between weather variables and emergency calls for elevated arterial blood pressure, in rate ratio (RR) per increase of standard unit *; adjusting for day length, month, years, and the day of the week.
Table 3.
Multivariate associations between weather variables and emergency calls for elevated arterial blood pressure, in rate ratio (RR) per increase of standard unit *; adjusting for day length, month, years, and the day of the week.
| Variable | Lag | RR (95% CI) | p | RR † (95% CI) | p † |
|---|---|---|---|---|---|
| Whole day | |||||
| TW | 0–1 | 0.83 (0.78–0.89) | <0.001 | 0.85 (0.79–0.92) | <0.001 |
| Δ of TWt between lags of 4–7 and 3 days | 1.10 (1.02–1.18) | 0.014 | 1.10 (1.02–1.19) | 0.014 | |
| WS | 6 | 1.01 (1.00–1.01) | 0.005 | 1.01 (1.01–1.02) | <0.001 |
| BPL (low BP) | 0–2 | 1.06 (1.02–1.09) | 0.002 | 1.07 (1.03–1.11) | <0.001 |
| BPH (high BP) | 4 | 0.96 (0.93–0.99) | 0.017 | 0.95 (0.92–0.99) | 0.012 |
| In the morning until before noon | |||||
| TW | 0–1 | 0.90 (0.79–1.03) | 0.136 | 0.91 (0.79–1.04 | 0.170 |
| TW | 5–7 | 1.20 (1.04–1.38) | 0.014 | 1.18 (1.02–1.37) | 0.030 |
| WS below 6.1 kt | 4–6 | 1.04 (1.01–1.08) | 0.019 | 1.05 (1.02–1.09) | 0.007 |
| BPL (low BP) | 0–2 | 1.09 (1.02–1.16) | 0.009 | 1.09 (1.02–1.16) | 0.014 |
| BPH (high BP) | 4–6 | 0.93 (0.86–1.02) | 0.109 | 0.91 (0.83–0.99) | 0.035 |
| BPL (low BP) | 5 | 0.92 (0.86–0.98) | 0.007 | 0.91 (0.85–0.97) | 0.005 |
| ΔRH of RH above 82% | 0 | 1.08 (1.02–1.15) | 0.015 | 1.09 (1.02–1.16) | 0.012 |
| ΔRH of RH below 82% | 3–4 | 1.05 (1.01–1.09) | 0.010 | 1.05 (1.01–1.13) | 0.009 |
| ΔRH of RH below 82% | 6 | 1.08 (1.03–1.13) | 0.001 | 1.08 (1.03–1.13) | 0.001 |
| In the afternoon until evening | |||||
| TW | 0 | 0.79 (0.71–0.87) | <0.001 | 0.78 (0.70–0.85) | <0.001 |
| WS | 6 | 1.01 (1.00–1.02) | 0.023 | 1.01 (1.00–1.02) | 0.017 |
| WS below 6.1 kt | 0–4 | 1.05 (1.02–1.08) | 0.001 | 1.07 (1.03–0.10) | <0.001 |
| BPL (low BP) | 6 | 1.05 (1.01–1.10) | 0.025 | 1.06 (1.01–1.11) | 0.015 |
| At night until early morning | |||||
| TW | 0 | 0.86 (0.77–0.97) | 0.014 | 0.88 (0.77–0.99) | 0.035 |
| BPH (high BP) | 3 | 0.90 (0.85–0.96) | 0.001 | 0.91 (0.85–0.97) | 0.004 |
| RH below 82% | 1 | 1.04 (1.00–1.08) | 0.077 | 1.04 (0.99–1.09) | 0.130 |
| RH above 82% | 4 | 0.88 (0.83–0.95) | <0.001 | 0.90 (0.83–0.97) | 0.003 |
T = air temperature; BP = barometric pressure; WS = wind speed; RH = relative humidity; * standard unit: 10 °C for T, 10 hPa for variables of BP, 1 kt for WS, and 10% for RH; † air pollution and space weather variables additionally included in the model; TW = max(T − 1, 0) reflecting the impact of warmth; BPL = max(1006 − BP, 0); BPH = max(BP − 1006, 0); Δ = daily change.
Table 4.
Rate ratios with 95% confidence interval (CI) of emergency calls for EABP associated with space weather conditions; adjusting for day length, month, years, and the day of the week (p > 0.5 not presented).
Table 4.
Rate ratios with 95% confidence interval (CI) of emergency calls for EABP associated with space weather conditions; adjusting for day length, month, years, and the day of the week (p > 0.5 not presented).
| Variable | n | Mean | RR (p) | RR †† (p) | RR ††† (95% CI) | p |
|---|---|---|---|---|---|---|
| Whole day | ||||||
| Reference days † | 442 | 18.5 | 1 | 1 | ||
| Ap < 4 | 375 | 18.9 | 1.03 (0.116) | 1.04 (0.037) | 1.04 (1.00–1.08) | 0.034 |
| Ap ≥ 16 without HSSW | 31 | 18.8 | 1.04 (0.373) | 1.03 (0.528) | 1.02 (0.94–1.12) | |
| Ap ≥ 16 with HSSW | 17 | 21.6 | 1.19 (0.001) | 1.20 (0.001) | 1.17 (1.05–1.30) | 0.006 |
| HSSW occurring after active-stormy days | 12 | 19.9 | 1.23 (0.002) | 1.14 (0.050) | 1.14 (1.00–1.31) | 0.051 |
| 2 days after active-stormy GMA level | 34 | 20.1 | 1.09 (0.039) | 1.09 (0.044) | 1.09 (1.00–1.18) | 0.041 |
| In the morning until before noon | ||||||
| Reference days † | 4.9 | 1 | 1 | |||
| Ap < 4 | 4.8 | 0.98 (0.623) | 1.00 (0.886) | 1.00 (0.93–1.07) | ||
| Ap ≥ 16 without HSSW | 5.6 | 1.17 (0.046) | 1.19 (0.033) | 1.20 (1.02–1.41) | 0.025 | |
| Ap ≥ 16 with HSSW | 6.1 | 1.28 (0.018) | 1.28 (0.014) | 1.24 (1.01–1.53) | 0.043 | |
| HSSW occurring after active-stormy days | 4.8 | 1.07 (0.606) | 1.02 (0.862) | 1.01 (0.77–1.33) | ||
| 2 days after active-stormy GMA level | 5.5 | 1.13 (0.128) | 1.15 (0.078) | 1.15 (0.98–1.34) | 0.078 | |
| Ap ≥ 16 | 1.22 (1.07–1.40) | 0.003 | ||||
| In the afternoon until evening | ||||||
| Reference days † | 8.1 | 1 | 1 | |||
| Ap < 4 | 8.5 | 1.06 (0.015) | 1.07 (0.007) | 1.07 (1.02–1.13) | 0.009 | |
| Ap ≥ 16 without HSSW | 8.1 | 1.01 (0.930) | 0.97 (0.601) | 0.97 (0.85–1.10) | ||
| Ap ≥ 16 with HSSW | 9.5 | 1.16 (0.068) | 1.15 (0.097) | 1.12 (0.95–1.33) | ||
| HSSW occurring after active-stormy days | 9.3 | 1.32 (0.006) | 1.21 (0.061) | 1.24 (1.01–1.51) | 0.036 | |
| 2 days after active-stormy GMA level | 8.7 | 1.07 (0.300) | 1.06 (0.376) | 1.06 (0.94–1.20) | ||
| HSSW | 1.14 (1.01–1.31) | 0.045 | ||||
| At night until early morning | ||||||
| Reference days † | 5.6 | 1 | 1 | |||
| Ap < 4 | 5.5 | 0.98 (0.416) | 0.99 (0.840) | 0.98 (0.92–1.05) | ||
| Ap ≥ 16 without HSSW | 5.2 | 0.96 (0.633) | 0.96 (0.622) | 0.95 (0.81–1.12) | ||
| Ap ≥ 16 with HSSW | 5.7 | 1.06 (0.576) | 1.03 (0.781) | 1.03 (0.84–1.27) | ||
| HSSW occurring after active-stormy days | 6.8 | 1.44 (0.002) | 1.32 (0.019) | 1.33 (1.06–1.68) | 0.016 | |
| 2 days after active-stormy GMA level | 5.0 | 0.91 (0.240) | 0.90 (0.177) | 0.89 (0.76–1.05) |
† Days with 16 > Ap ≥ 4 without HSSW days; †† additionally adjusted for day length and weather variables presented in Table 3 for the respective time of the day; ††† additionally adjusted for air pollutants.
Table 5.
Associations between environmental variables and emergency calls for EABP for patients aged >65 years and for younger patients, in rate ratios of space weather categories and per increase of standard unit * in weather variables; adjusting for day length, month, years, and the day of the week.
| Age ≤ 65 Years | Age > 65 Years | ||||||
|---|---|---|---|---|---|---|---|
| Variable | Lag | RR | p | Variable | Lag | RR | p |
| Whole day | |||||||
| TW | 0–1 | 0.88 | 0.025 | TW | 0–1 | 0.87 | 0.014 |
| WS | 6 | 1.02 | <0.001 | T | 0–4 | 0.88 | 0.001 |
| BPL | 2 | 1.08 | 0.003 | TW | 5–7 | 1.15 | 0.004 |
| ΔBPL | 0 | 1.11 | 0.001 | WS below 6.1 kt | 0–4 | 1.03 | 0.019 |
| ΔBPL | 5 | 0.95 | 0.085 | BPL | 0–2 | 1.05 | 0.034 |
| RH below 82% | 0 | 1.04 | 0.035 | BPH | 4 | 0.92 | 0.001 |
| Ap < 4 | 1.04 | 0.125 | 1.04 | 0.118 | |||
| Ap ≥ 16 without HSSW | 1.06 | 0.97 | |||||
| Ap ≥ 16 with HSSW | 1.00 | 1.27 | <0.001 | ||||
| HSSW occurring after Ap ≥ 16 days | 1.34 | 0.004 | 1.03 | ||||
| 2 days after Ap ≥ 16 | 1.11 | 0.122 | 1.08 | 0.159 | |||
| In the morning until before noon | |||||||
| ΔT | 1 | 0.78 | 0.014 | ΔTW | 3–4 | 0.79 | 0.004 |
| ΔWS of WS below 6.1 kt | 6 | 1.05 | 0.007 | WS below 6.1 kt | 4–6 | 1.05 | 0.021 |
| ΔBPL | 0 | 1.19 | 0.004 | BPL | 0–2 | 1.12 | 0.006 |
| ΔBPL | 3–4 | 1.16 | 0.001 | ΔRH of RH below 82% | 3–4 | 1.07 | 0.004 |
| BPH | 6 | 0.88 | 0.022 | ΔRH of RH above 82% | 2 | 1.11 | 0.015 |
| ΔRH | 0 | 1.08 | 0.003 | ΔRH of RH below 82% | 6 | 1.09 | 0.003 |
| ΔRH of RH > 82% | 4 | 0.90 | 0.042 | ||||
| Ap < 4 | 1.03 | 0.97 | |||||
| Ap ≥ 16 without HSSW | 1.25 | 0.074 | 1.10 | ||||
| Ap ≥ 16 with HSSW | 1.18 | 1.32 | 0.032 | ||||
| HSSW occurring after Ap ≥ 16 days | 1.44 | 0.053 | 0.74 | 0.146 | |||
| 2 days after Ap ≥ 16 | 1.04 | 1.19 | 0.072 | ||||
| In the afternoon until evening | |||||||
| TW | 0–1 | 0.78 | 0.014 | TW | 0–1 | 0.77 | 0.001 |
| WS | 6 | 1.02 | <0.001 | TC | 1 | 1.15 | 0.013 |
| BPL | 0 | 1.07 | 0.045 | WS below 6.1 kt | 0–4 | 1.07 | 0.001 |
| RH below 82% | 0 | 1.07 | 0.023 | BPL | 6 | 1.08 | 0.009 |
| RH above 82% | 1 | 0.90 | 0.017 | ||||
| ΔRH of RH above 82% | 4 | 1.11 | 0.011 | ||||
| Ap < 4 | 1.10 | 0.022 | 1.04 | 0.218 | |||
| Ap ≥ 16 without HSSW | 1.01 | 0.90 | 0.219 | ||||
| Ap ≥ 16 with HSSW | 0.92 | 1.28 | 0.012 | ||||
| HSSW occurring after Ap ≥ 16 days | 1.28 | 0.122 | 1.19 | 0.182 | |||
| 2 days after Ap ≥ 16 | 1.15 | 0.150 | 0.97 | ||||
| At night until early morning | |||||||
| TW | 7 | 0.70 | 0.006 | TW | 0 | 0.77 | 0.001 |
| T | 7 | 1.17 | 0.037 | ||||
| −ΔWS of WS above 6.1 kt | 4 | 1.03 | 0.008 | WS below 6.1 kt | 0 | 1.03 | 0.029 |
| BP | 2 | 0.94 | 0.014 | ΔBPH | 1 | 1.16 | 0.011 |
| RH | 0 | 1.06 | 0.016 | ΔRH of RH below 82% | 4 | 1.08 | 0.008 |
| RH | 6 | 1.08 | 0.002 | RH above 82% | 4 | 0.90 | 0.022 |
| RH above 82% | 4 | 0.90 | 0.047 | ||||
| Ap < 4 | 0.98 | 1.00 | |||||
| Ap ≥ 16 without HSSW | 0.98 | 0.78 | 0.032 | ||||
| Ap ≥ 16 with HSSW | 0.91 | 1.04 | |||||
| HSSW occurring after Ap ≥ 16 days | 1.35 | 0.107 | 1.32 | 0.075 | |||
| 2 days after Ap ≥ 16 | 0.87 | 0.289 | 0.90 | 0.315 | |||
* standard unit: 10 °C for variables of T, 10 hPa for variables of BP, 1 kt for variables of WS, and 10% for variables of RH; T = air temperature; WS = wind speed; BP = barometric pressure; RH = relative humidity; TC = max(−1 − T, 0) reflecting the impact of cold; TW = max(T − 1, 0) reflecting the impact of warmth; BPL = max(1006 − BP, 0); BPL = max(BP − 1006, 0); Δ = daily change.
© 2018 by the authors. Licensee MDPI, Basel, Switzerland. This article is an open access article distributed under the terms and conditions of the Creative Commons Attribution (CC BY) license (http://creativecommons.org/licenses/by/4.0/).
Share and Cite
MDPI and ACS Style
Vencloviene, J.; Braziene, A.; Dobozinskas, P. Short-Term Changes in Weather and Space Weather Conditions and Emergency Ambulance Calls for Elevated Arterial Blood Pressure. Atmosphere 2018, 9, 114. https://doi.org/10.3390/atmos9030114
AMA Style
Vencloviene J, Braziene A, Dobozinskas P. Short-Term Changes in Weather and Space Weather Conditions and Emergency Ambulance Calls for Elevated Arterial Blood Pressure. Atmosphere. 2018; 9(3):114. https://doi.org/10.3390/atmos9030114
Chicago/Turabian StyleVencloviene, Jone, Agne Braziene, and Paulius Dobozinskas. 2018. "Short-Term Changes in Weather and Space Weather Conditions and Emergency Ambulance Calls for Elevated Arterial Blood Pressure" Atmosphere 9, no. 3: 114. https://doi.org/10.3390/atmos9030114
Note that from the first issue of 2016, this journal uses article numbers instead of page numbers. See further details here.